Abstract
This study investigates a dynamic switching method for signal relay protocols in Cooperative Pattern Division Multiple Access (Co-PDMA) networks. The proposed approach aims to fully utilize the advantages of signal relays in fading-prone environment while simultaneously reducing the network outage probability and improving the throughput and energy efficiency. To demonstrate the necessity of implementing the dynamic switching method for signal relay protocols, Co-PDMA networks with Decode-and-Forward (DF) or Amplify-and-Forward (AF) protocols are explored over Nakagami-m fading. Based on the analysis of these two scenarios, the overall outage probability, throughput, and energy efficiency of the Co-PDMA network with a dynamic DF/AF protocol are determined. The results demonstrate that the proposed method selects the optimal signal relay protocol for forwarding user data in a simple and efficient manner across varying transmit signal-to-noise ratios, quality of service, and signal relay locations. Compared with fixed signal relay protocols, the proposed method is more conducive to achieving green communication in Co-PDMA networks, as it enhances communication reliability and the total volume of data transmitted.
1. Introduction
With the proliferation of (Internet of Things) IoT devices and wireless data demand, wireless communication networks have higher requirements for spectrum efficiency, energy efficiency and system capacity, especially sixth-generation (6G) wireless communication networks. Non-Orthogonal Multiple Access (NOMA) is a key candidate technology for Next-Generation Multiple Access (NGMA) that can significantly enhance spectral and energy efficiency while ensuring user fairness and supporting massive device connectivity [1]. Additionally, cooperative communication formed by deploying signal relays in wireless communication networks is an effective means of improving coverage and reliability [2,3]. This is because cooperative communication enhances signal quality from the source transmitter to the destination receiver via signal relays under various fading conditions. Furthermore, cooperative communication technology is a fundamental technology in the Space–Air–Ground Integrated Network (SAGIN) of 6G, as from the perspective of cooperative communication, SAGIN can be viewed as a two-hop signal relay network with space–air and air–ground cooperative links [4].
According to the different signal processing methods used before forwarding to the destination receiver, the commonly used signal relay protocols mainly include the Decode-and-Forward (DF) and Amplify-and-Forward (AF) protocols [5]. Research on cooperative networks primarily focuses on resource optimization and performance analysis. In terms of resource optimization in cooperative networks, refs. [6,7,8,9,10] optimized the average system capacity, user reception signal-to-noise ratio (SNR), transmission power, achievable rate, NOMA fairness, and power allocation. In performance analysis of cooperative networks, commonly used metrics include outage probability, ergodic rate, and bit error rate, among others. The corresponding mathematical expressions are derived and validated through Monte Carlo simulations. For instance, the authors of [11,12] derived the outage probability, throughput, and diversity order for uplink/downlink Cooperative Pattern Division Multiple Access (Co-PDMA) networks with an AF protocol under Rayleigh fading channels. Moreover, an optimal antenna selection and switching scheme at signal relay was proposed in [13], which evaluated the outage probability and ergodic rate for cooperative NOMA networks with the AF protocol. Owing to the high spectral efficiency of Multi-Input Multi-Output NOMA (MIMO-NOMA), the authors of [14] applied AF signal relay to MIMO-NOMA networks and characterized the network performance based on the user rate and outage probability. Unlike the half-duplex AF signal relay used in the aforementioned studies, the authors of [15] deployed the full-duplex AF signal relays in cooperative NOMA networks to reduce the outage probability and improve the average received signal-to-interference-plus-noise ratio (SINR), while also focusing on analyzing the impact of channel parameters and self-interference on the performance of such networks.
Although the signal relay with the AF protocol relays the received signal directly to the receiver after amplification, which has the advantages of simple processing and low delay, it is susceptible to noise, which does not necessarily lead to good performance when the channel state is poor. In contrast, the signal relay with the DF protocol eliminates noise at the signal relay. In Rayleigh fading channels, the outage probability and throughput of Co-PDMA networks with the DF protocol were provided by the authors in [16,17]. Additionally, ref. [18] considered the application of a full-duplex DF signal relay in Co-PDMA networks to reduce the signal relay processing delay. They evaluated the network outage performance under Rayleigh fading channels. Considering that in practical scenarios, Channel State Information (CSI) and successive interference cancellation may be imperfect, the impact of channel estimation error and SIC error on the symbol error rate of cooperative NOMA with the DF protocol was studied in [19]. However, when the DF protocol incorrectly decodes the signal or fails to receive the signal, it cannot complete the cooperative transmission task, not only failing to fully utilize the signal relay but also consuming unnecessary energy.
Networks that jointly consider signal relays with AF and DF protocols to fully leverage the advantages of both were proposed in [20,21,22,23]. These networks consider the decoding performance of signal relays with the DF protocol; that is, if the signal relay successfully decodes the signal, the DF protocol is applied for cooperative communication. Conversely, the AF protocol is selected to assist with communication. For example, ref. [20] considered a capacity threshold to measure the decoding performance of signal relays with the DF protocol, while [21,22,23] adopted an SNR threshold. These studies analyzed the outage probability, throughput, and ergodic rate of the network.
However, despite the detailed computer simulation results provided by the authors in [20], the corresponding mathematical expressions for the metrics are not derived. Additionally, the analysis in [21,22,23] is conducted on Rayleigh fading channels. However, Rayleigh fading channels cannot accurately capture the channel characteristics in complex environments, such as urban or indoor settings; thus, a more precise model, such as the Nakagami-m fading model, must be considered. Finally, as one of the NOMA schemes, PDMA employs a sparse irregular Pattern Matrix (PM) to support overloaded users, and user data are sparsely mapped onto a set of resources based on the assigned pattern [24,25]. However, the studies on Co-PDMA networks in [11,12] and [16,17,18] only focus on fixed relay signal protocols, failing to fully leverage the advantages of both AF and DF protocols, and the channel model used is the Rayleigh model, which may not accurately reflect the performance of Co-PDMA networks.
Based on the above discussion, this paper explores dynamic switching methods for signal relay protocols in Co-PDMA networks to fully leverage the advantages of signal relay in fading-resistant environments, thereby achieving the goal of improving network performance. This approach enables Co-PDMA networks to flexibly select the optimal protocol for user communication based on the pre-assessed network performance under various protocols to optimize the overall performance of the network. Additionally, to more accurately reflect the network performance in complex environments, we analyze the overall outage probability, throughput, and energy efficiency over Nakagami-m fading channels and investigate the impact of the transmit SNR, quality of service, and signal relay locations on these metrics. The main contributions of this paper are summarized as follows.
- Closed-form expressions for the outage probability, throughput, and energy efficiency of downlink Co-PDMA networks with DF or AF protocols over Nakagami-m fading channels are provided. Notably, the Nakagami-m model encompasses the Rayleigh model when the fading parameter equals 1, making our derived results valid for the Rayleigh model as well.
- A dynamic switching method for signal relay protocols is proposed to reduce the overall outage probability, improve the throughput, and enhance energy efficiency. Our method does not require determining the optimal switching threshold between the DF and AF protocols. Furthermore, mathematical expressions for these metrics are provided for the Co-PDMA network with a dynamic DF/AF protocol.
- Monte Carlo simulations validate our theoretical analysis results. The results demonstrate that the proposed method can simply and flexibly select the optimal protocol for forwarding user data in all scenarios. Compared with the Co-PDMA network with a fixed protocol, the considered network achieves a reduction in the overall outage probability and improvements in throughput and energy efficiency. We also study the influence of the transmit SNR, quality of service and signal relay locations on network performance.
The rest of this paper is organized as follows. In Section 2, we introduce the PDMA concept and the Co-PDMA network model with a dynamic DF/AF protocol. Section 3 describes the dynamic signal relay protocol switching method for Co-PDMA networks and derives closed-form expressions for the overall outage probability, energy efficiency, and throughput of the considered network. Section 4 presents simulation analysis. Finally, Section 5 summarizes the paper, and discusses potential directions for future work.
2. System Model
2.1. Introduction to PDMA
As one of the NOMA schemes, PDMA utilizes the PDMA pattern as scheduling resources, which can map transmitted data onto either a resource block (RB) or resource elements (REs). An RB can consist of time resources, frequency resources, spatial resources, or any combination thereof. Therefore, the data of users is multiplexed onto the same RB with different PDMA patterns, thereby achieving non-orthogonal transmission. The PDMA patterns of users over REs constitutes a PDMA PM, denoted as
where represents the PDMA pattern assigned to user , and determines whether the data of user is mapped onto the -th RE. To mitigate error propagation in the successive interference cancellation (SIC) receiver, PDMA patterns with identical diversity orders should be avoided whenever possible. Additionally, the inner product between PDMA patterns with the same diversity order is small. The PDMA PM not only reflects the mapping of user data, but also embodies the overload factor. In PDMA networks, the overload factor is defined as the ratio of the number of columns to the number of rows in the PDMA PM , i.e., , which indicates that REs are used to carry data from users.
2.2. Network Description
A Co-PDMA network with a dynamic DF/AF protocol is considered, which aims to reduce the overall outage probability of the network and improve the throughput and energy efficiency of the network under short-delay conditions. As shown in Figure 1, the edge users are divided into groups, and a signal relay with a dynamic DF/AF protocol is deployed within the downlink communication range of the base station to facilitate communication between the base station and users. Grouping of cell-edge users can be achieved through signal reception power or channel similarity. It is important to emphasize that the investigation of algorithms for grouping cell-edge users falls outside the focus of this study and will be explored as a potential area for future investigation.
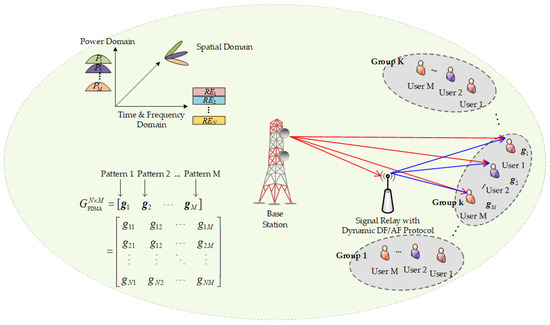
Figure 1.
Network model.
The signal relay with the dynamic DF/AF protocol operates in half-duplex mode and can dynamically alternate between DF and AF protocols to enhance communication reliability, throughput and energy efficiency. Compared to full duplex, the inherent limitation of half-duplex operation (one-way transmission) determines that delay and synchronization issues are difficult to completely eliminate, but their impact on network performance can be mitigated through optimized design, such as shortening switching time, enhancing synchronization protocols, dynamically adjusting modulation and demodulation, pre-allocating time slots and so on. It should be noted that the focus of this article is on system performance evaluation based on optimizing latency and synchronization. The specific details regarding which protocol the signal relay selects to assist communication will be elaborated on in subsequent sections. Furthermore, the variables used in this section are shown in Table 1.

Table 1.
Table of variables used in Section 2.2.
Channel model: To simplify the analysis process, let’s take one of these groups as an example. We assume that the perfect CSI of all channels is available at the base station to study the maximum performance. The channels from the base station to user , the base station to the signal relay, and the signal relay to user are denoted as , , and , respectively, where and represent the -th user and the -th RE, respectively. These channels are subject to independent Nakagami- distributions. Compared with the Rayleigh channel model used in [11,12] and [16,17,18] for analyzing the performance of Co-PDMA networks, the adopted Nakagami- channel model can more accurately characterize different fading environments, thereby providing a more precise representation of the performance of the considered network. Thus, we have , where , and with the fading severity parameter and the average power . The probability density function (PDF) and cumulative distribution function (CDF) of the channel power gain are expressed as
and
respectively, where the functions and correspond to the Gamma function and the lower incomplete Gamma function, respectively [26].
Signal model: The modulation symbol for user is denoted as with . At the transmitter of the base station, is mapped onto REs, generating the PDMA modulation vector . By superimposing multiple PDMA modulation vectors, the transmit signal vector at the base station can be obtained and given by
The complete communication procedure is segmented into two time slots. During the initial time slot, the base station concurrently transmits to both the users and the signal relay. During the subsequent time slot, the signal relay forwards the data to the users. Furthermore, users adopt the selection combining technique for signal reception, whereas a SIC method is applied to extract the intended signals.
During the initial time slot, the signal received by user on the -th RE can be represented as
It is assumed that the channels on each resource element are fully correlated (this scenario is considered in this paper). Consequently, the signal received by user from the base station can be expressed as
where represents the modulated symbol vector of users, is the PDMA equivalent channel response matrix of users multiplexed on REs with , and is the Additive White Gaussian Noise vector. Meanwhile, the received signal at the signal relay can be given by
where with .
During the subsequent time slot, it is assumed that the PDMA patterns and power allocation factors for the users remain unchanged, and the transmit power of the signal relay is also . When the signal relay forwards user data using the DF protocol, the received signal at user is represented as
where with . When the AF protocol is adopted at the signal relay, the received signal at user is represented as
where denotes the amplification coefficient with variable gain [13,14] and .
SIC-based Detection: We assume that and , with the corresponding channel quality sequentially improving. It is necessary that to ensure fairness among users. This means that user 1 decodes without performing the SIC process, whereas other user signals are considered to be interference. User successfully decodes and eliminates the signals of the previous users, and then decodes . Therefore, the SINR for decoding at user , and the SINR for decoding at the signal relay, are respectively written as [11,17]
and
where , , , and represent the -th columns of , , , and , respectively. Additionally, represents the SINR of decoding the symbol at user , i.e., .
3. Performance Evaluation
In this section, three key performance indicators—outage probability, system throughput, and energy efficiency—are employed to evaluate the performance of the considered network. To this end, we first analyze the outage probability of non-Co-PDMA networks, Co-PDMA networks with the DF protocol, and Co-PDMA network with the AF protocols. Then, we derive the overall outage probability, throughput, and energy efficiency for Co-PDMA networks with the dynamic DF/AF protocol, where the throughput and energy efficiency of Co-PDMA networks with the fixed protocol are also given. Although Monte Carlo simulation is a robust tool for theoretical validation, deriving mathematical expressions for performance metrics provides unique benefits. Specifically, these expressions furnish analytical understanding by explicitly showing the impact of fundamental parameters (e.g., power allocation, target data rates, channel gains, transmit SNR) on the metrics. Additionally, mathematical expressions, notably closed-form solutions, facilitate efficient computation of performance for given scenarios via direct parameter substitution, dramatically reducing evaluation time. For convenience, Table 2 lists the variables used in this section.
Table 2.
Variables used in Section 3.
3.1. Outage Analysis
The outage probability directly characterizes the likelihood of successful user communication, reflecting the network’s reliability in the presence of channel fading, noise, and multi-user interference; a higher outage probability signifies a poorer user experience. For any given , the outage probability for each user can be determined through computational simulations. However, for the case where user data is mapped onto resource elements, as far as we know, precise analytical formulations for the outage probabilities of certain users remain unattainable. For instance, for the PDMA PM with row weight of 4 and overload factor of 200%, i.e.,
a precise analytical formulation for the outage probability of user 1 cannot be provided. Similarly, for the PDMA PM with row weight of 4 and overload factor of 150%, i.e.,
a precise analytical formulation for the outage probabilities of user 1, user 2, and user 3 cannot be provided. Although the PDMA PM with a higher row weight and a higher overloading factor can achieve better performance, the increased row weight leads to higher complexity in the PDMA PM, and the higher overload factor also escalates the complexity of the receiver algorithm [25]. Considering the trade-off between performance and complexity, the PDMA PM with a row weight of 2 and an overload factor of 150% is the most representative matrix, offering the minimal unequal diversity degree. Thus, taking as a case study, closed-form solutions for the outage probabilities of users within the PDMA network are developed over Nakagami- fading channels. Notably, for large-scale networks with changing Nakagami- parameters, based on channel quality, terminals can be divided into several PDMA user groups, with each group containing three users. Each user is assigned a different PDMA pattern through the matrix based on resource allocation fairness. Furthermore, Lemma 1 and Lemma 2 are introduced to facilitate the derivation of outage probability.
Lemma 1.
Let be a random variable with and CDF . For constants , , and , where , the probability can be given by
Proof of Lemma 1.
See Appendix A. □
Note that the probability of real roots in this quadratic equation differs from existing studies, such as [27,28]. This is because the coefficients in this quadratic equation are all constants, rather than being independent and identically distributed uniform random variables as typically considered.
Lemma 2.
Let be a random variable with and CDF . For constants , , , and , where , the probability can be derived as
Proof of Lemma 2.
Lemma 2 can be obtained using a proof similar to that of Lemma 1. □
3.1.1. Communication Without Signal Relay
Due to the use of SIC at the receiver, an outage event for user will not occur only when the data of the previous users is successfully decoded. Therefore, the outage probability for user in the non-Co-PDMA network can be expressed as
where is obtained from (10).
Next, in Theorem 1, we derive the closed-form expression for the outage probability of users in the non-Co-PDMA network.
Theorem 1.
The closed-form expression for the outage probability of users in the non-Co-PDMA network can be respectively represented as
Proof of Theorem 1.
See Appendix B. □
3.1.2. Cooperative Communication with DF or AF Protocol
In the Co-PDMA network with the DF protocol, the outage events for a user can be categorized into two scenarios: (1) Both the signal relay and the user fail to decode the data transmitted from the base station. (2) The signal relay successfully decodes the data from the base station, but the user fails to decode the data transmitted from both the base station and the signal relay. Therefore, the outage probability for user in the Co-PDMA network with the DF protocol can be expressed as
Here, the probability of successfully decoding user data at the signal relay with the DF protocol can be given by
and the probability of successfully decoding from the signal relay with DF protocol at user can be written as
Moreover, , , and are calculated from (18), (13), and (11), respectively.
In the Co-PDMA network with the AF protocol, an outage event occurs for user if the user fails to decode the data from both the base station and the signal relay. Therefore, the outage probability for user in the Co-PDMA network with the AF protocol can be given by
where the probability of successfully decoding from the signal relay with AF protocol at user can be written as
and is obtained from (12).
Next, in Theorems 2 and 3, we summarize the closed-form expressions for the outage probability of users in Co-PDMA networks with DF or AF protocols.
Theorem 2.
The closed-form expression for the outage probability of users in the Co-PDMA network with the DF protocol can be given by
Proof of Theorem 2.
See Appendix C. □
Theorem 3.
The closed-form expression for the outage probability of users in the Co-PDMA network with the AF protocol can be derived as
Proof of Theorem 3.
See Appendix D. □
3.2. Dynamic Switching Method for Signal Relay Protocols
The signal relay with DF or AF protocols analyzed above has its own advantages in different scenarios. The analysis results in the next section will more clearly highlight the respective advantages of the two protocols. Therefore, it is necessary to implement a dynamic switching method for signal relay protocols to optimize network performance. Figure 2 illustrates the dynamic switching method between DF and AF protocols at the signal relay.
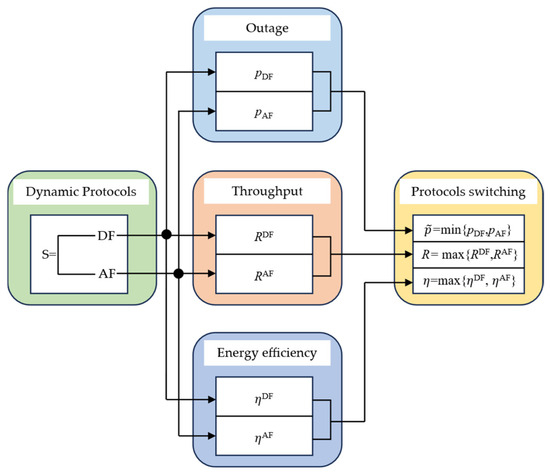
Figure 2.
Dynamic switching method for signal relay protocols.
We employ a method that dynamically switches signal relay protocols based on the real-time evaluation of network performance metrics, such as the overall outage probability, throughput, and energy efficiency. Specifically, as shown in Figure 2, both signal relay protocols are submitted to their respective analytical functions (i.e., performance expressions). Based on the pre-evaluated performance, the protocol that yields the best network performance is selected, and the chosen protocol is applied at the signal relay to process the received signal and forward the user data. Compared with hard SNR threshold methods, this approach does not require determining an optimal SNR threshold, offering flexibility and simplicity [21,22,23]. This is because SNR threshold methods, if the threshold is set low/high, may not be able to select the protocol that maximizes network performance, necessitating the determination of an optimal SNR threshold to switch to the best protocol. It can be expected that both methods achieve the same performance when the optimal threshold is determined.
Next, based on the analysis results in Section 3.1 and the dynamic switching method for signal relay protocols, we provide closed-form expressions for the overall outage probability, throughput, and energy efficiency of the Co-PDMA network with the dynamic DF/AF protocol.
Overall outage probability: As shown in Figure 2, the proposed method reduces the overall outage probability of the Co-PDMA network. This is influenced by the overall outage performance of the Co-PDMA network with the protocol. Thus, the overall outage probability of the Co-PDMA network with the dynamic DF/AF protocol can be formulated as
where the overall outage probability of the Co-PDMA network with protocol is defined as
where and are obtained by Theorem 2 and Theorem 3, respectively. Equation (34) shows that the proposed method improves the overall communication reliability of the Co-PDMA network.
Throughput: This measures the total amount of data successfully transmitted by the network per unit time and serves as a core metric for assessing spectral efficiency; higher throughput typically indicates superior overall network performance. It depends on the outage probability at the target data rate. As shown in Figure 2, the throughput of the Co-PDMA network with the dynamic DF/AF protocol can be formulated as
where the throughput of the Co-PDMA network with protocol can be expressed as
We observe from (36) that the proposed method maximizes the throughput of the Co-PDMA network.
Energy efficiency: This quantifies the network’s energy utilization efficiency; high energy efficiency is critical for enabling green communications, ensuring network sustainability, and optimizing cost-effectiveness. It is calculated as the throughput divided by the total power consumption. In the considered network, the throughput is given by (36), whereas the total power consumption includes static power consumption, dynamic power consumption (Transmission power of the base station and signal relay), and power amplifier efficiency. Therefore, the energy efficiency of the Co-PDMA network with the dynamic DF/AF protocol can be calculated as
where the energy efficiency of the Co-PDMA network with protocol can be expressed as
and the total power consumption can be expressed as [29]
Equation (38) shows that the proposed approach favours a signal relay protocol that makes energy efficiency more adequate.
4. Simulation Results
In this section, the efficacy of the dynamic switching method for signal relay protocols in the downlink Co-PDMA network is confirmed through Monte Carlo simulation. Without loss of generality, a non-Co-PDMA network, a Co-PDMA network utilizing the DF protocol, and a Co-PDMA network employing the AF protocol are compared as benchmarks against a Co-PDMA network that implements the dynamic DF/AF protocol. The numerical results of the outage probability, throughput and energy efficiency are presented. In the simulation, the network we considered consisted of a base station, signal relay, and three users. Similar to [30], we fix the positions of the base station, signal relay, and three users, and a graphical presentation of the considered simulation network is shown in Figure 3. We consider a simplified network model where the base station is located at the origin of a two-dimensional coordinate system, with the signal relay, user 1, user 2, and user 3 positioned at +320 m, +600 m, +550 m, and +400 m along the x-axis, respectively. Accordingly, based on these coordinates, we can calculate the distances from the base station to each user, from the base station to the signal relay, and from the signal relay to each user. Unless otherwise specified, the simulation parameters are detailed in Table 3.
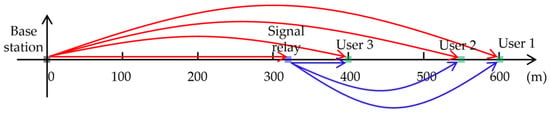
Figure 3.
The graphical presentation of the considered simulation network.
Table 3.
Simulation parameters.
4.1. Outage Performance
Figure 4 illustrates the outage probability of users versus the transmit SNR in the Co-PDMA network with DF or AF protocols. The outage probability curves of users in the three networks are plotted based on Theorem 1, Theorem 2, and Theorem 3, respectively. “Non-Co-PDMA” refers to a PDMA system without signal relay cooperation, “Co-PDMA with DF protocol” refers to a PDMA system using the DF protocol, and “Co-PDMA with AF protocol” refers to a PDMA system using the AF protocol. The figure shows that the obtained numerical results match perfectly with the Monte Carlo simulation results, thereby validating the accuracy of the theoretical analysis. One observation is that the outage performance of users in Co-PDMA networks is superior to that in the non-Co-PDMA network. This is because users in Co-PDMA networks can receive signals from multiple independent paths, and the presence of signal relays reduces the impact of fading on the transmitted signal, thereby enhancing the received signal strength at the users. Another observation is that, at low transmit SNR, the outage performance of users in the Co-PDMA network with the AF protocol is worse than that in the Co-PDMA network with the DF protocol, while at high transmit SNR, the opposite is true. This observation motivates the proposal of a dynamic switching method for signal relay protocols to optimize the performance of Co-PDMA networks, thereby fully leveraging the advantages of cooperative techniques in complex fading environments. Moreover, owing to the impact of path loss, a higher transmit SNR is required to achieve a lower outage probability.
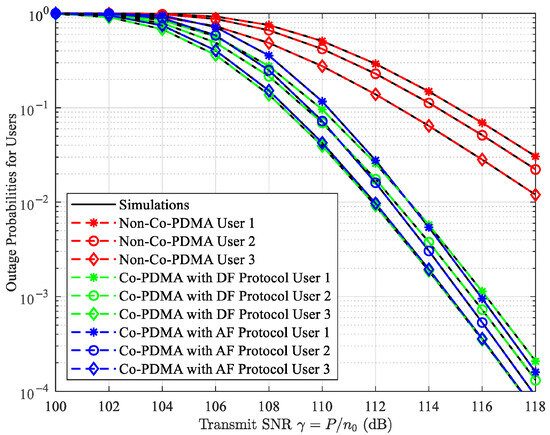
Figure 4.
Outage probability vs. transmit SNR.
As illustrated in Figure 4, neither the DF nor the AF protocol can guarantee the optimal outage performance of the Co-PDMA network across different transmit SNRs. Therefore, the dynamic switching method for signal relay protocols is proposed to optimize the overall reliability of Co-PDMA networks based on actual conditions. Prior to forwarding the superimposed signal, the base station pre-evaluates the network performance and selects the optimal protocol to relay the superimposed signal to the users. Figure 5 plots the overall outage probability of Co-PDMA networks versus the transmit SNR at different target data rates. The simulation results show that the overall outage performance of the Co-PDMA network with DF or AF protocol is significantly affected by the transmit SNR and quality of service. These two protocols have their own advantages in some cases. In contrast, the Co-PDMA network with the dynamic DF/AF protocol achieves optimal outage performance across all transmit SNR and quality of service conditions. This demonstrates the effectiveness of the proposed method.
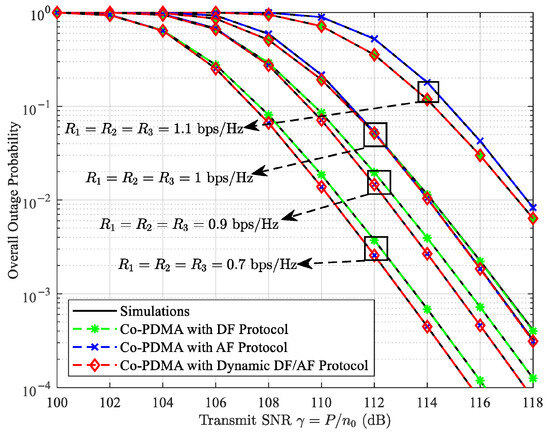
Figure 5.
Overall outage probability of Co-PDMA networks vs. transmit SNR.
Figure 6 presents the overall outage probability of Co-PDMA networks versus the signal relay locations. By adjusting the value of , the position of the signal relay can be altered, and the distance between the signal relay and users will also change as varies. It can be observed that the overall outage probability of Co-PDMA networks initially decreases and then increases as increases. This indicates the existence of a solution that minimizes the overall outage probability of the Co-PDMA network for given parameters. Additionally, it can be demonstrated that signal relays with the DF protocol are more suitable for deployment closer to the base station, whereas signal relays with AF the protocol are better suited for deployment at locations farther from the base station. This highlights the advantage of the dynamic switching method for signal relay protocols, as the Co-PDMA network with the dynamic DF/AF protocol consistently achieves optimal outage performance compared to the Co-PDMA networks with the fixed signal relay protocol.
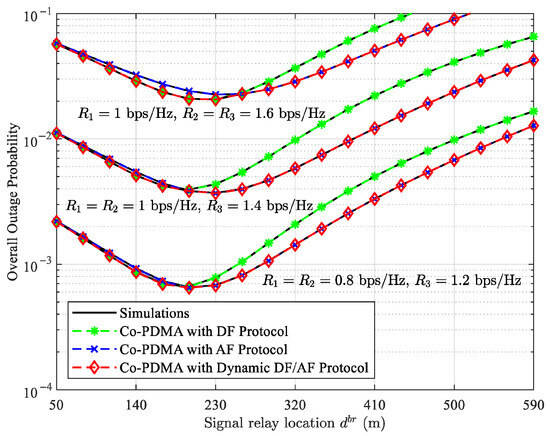
Figure 6.
Overall outage probability of Co-PDMA vs. signal relay location with dB.
Unlike some previous works, our results in Figure 4, Figure 5 and Figure 6 demonstrate that the AF protocol generally outperforms the DF protocol due to fundamental operational limitations, a phenomenon also observed in [21,22,31]. As shown in Figure 4, within the approximately 100–112 dB transmit SNR range, the DF protocol eliminates noise more effectively than the AF protocol, resulting in better outage performance. However, within the approximately 112–118 dB transmit SNR range, the AF protocol demonstrates superior outage performance despite its inability to eliminate noise. This advantage stems from its larger amplification factor and its ability to bypass potential decoding-induced outages at the signal relay. Figure 5 illustrates that for a target data rate of 1.1 bps/Hz, the signal relay adopts the DF protocol to ensure quality of service by eliminating noise. For the settings with target data rates 0.7 bps/Hz and 0.9 bps/Hz, the AF protocol is selected to amplify the received signal to maintaining quality of service. As depicted in Figure 6, deploying the signal relay near the base station ensures robust decoding performance for the DF protocol, which enhances outage performance. However, as the signal relay moves away from the base station, the decoding performance of the DF protocol deteriorates, leading to degraded outage performance. In this case, amplifying the signal from the base station instead of decoding it can enhance the received signal power at the users while voiding error propagation.
4.2. Throughput Performance
Figure 7 shows the throughput of Co-PDMA networks versus the target data rate. The throughput curve of Co-PDMA networks is drawn according to (36). The figure demonstrates that the Co-PDMA network with the dynamic DF/AF protocol can select the protocol with the highest throughput between DF and AF protocols. For example, (1) when the transmit SNR and target data rate are set to 100 dB and 0.5 bps/Hz, respectively, the signal relay with the dynamic DF/AF protocol selects the AF protocol to optimize throughput. (2) When the transmit SNR and target data rate are set to 105 dB and 1.0 bps/Hz, respectively, the signal relay with the dynamic DF/AF protocol selects the DF protocol. We also observed that as the target data rate increases, the throughput of Co-PDMA networks initially increases and then decreases. This indicates that an appropriate quality of service requirement can enhance the throughput of Co-PDMA networks.
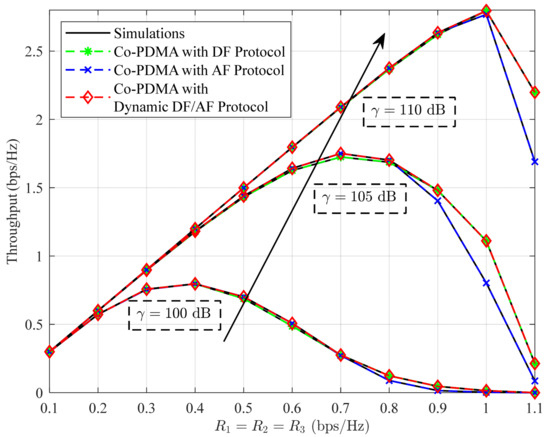
Figure 7.
Throughput of Co-PDMA vs. target data rates, where the black arrow represents the change of the transmit SNR.
For the low-rate wireless personal area network (LR-WPAN) defined by the IEEE Std 802.15.4-2006 [32], Figure 8 plots the throughput of the Co-PDMA networks versus the transmit SNR and signal relay locations. Here, the bandwidth MHz, frequency MHz, path loss exponent , path loss at the reference distance of 1 m dB, noise power dBm, data rates kbps, target data rates bps/Hz, transmit power dBm, and transmit SNR dB, and the remaining parameters settings are shown in Table 3. We first note that the throughput of Co-PDMA networks has an upper limit constrained by the sum of the target data rate because the outage probability of users in Co-PDMA networks approaches zero in the high-SNR region. Furthermore, this figure shows that the throughput of Co-PDMA networks is affected by the location of the signal relay in addition to the transmit SNR and the target data rate. Therefore, the effect of signal relay location on throughput should be considered to avoid wasting the transmit SNR when deploying signal relays in a Co-PDMA network. This is because as the signal relay moves away from the base station, the throughput shows a tendency to increase and then decrease. Lastly, compared to Co-PDMA networks with the fixed signal relay protocol, the Co-PDMA network with the dynamic DF/AF protocol can optimize throughput under any transmit SNR and signal relay location conditions.
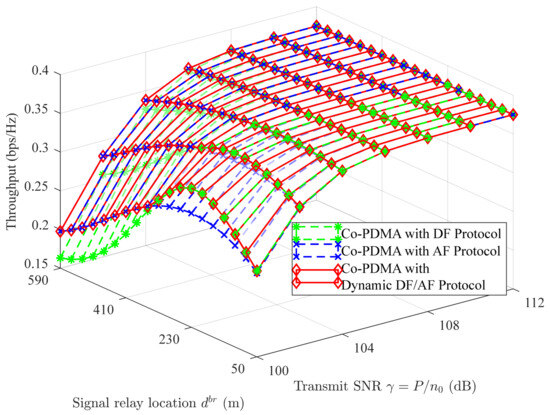
Figure 8.
Throughput of Co-PDMA vs. transmit SNR and signal relay location.
4.3. Energy Efficiency Performance
Figure 9 presents the energy efficiency of Co-PDMA networks versus the transmit SNR and signal relay location. The parameter settings are listed in Table 3. It is obvious that when the transmit SNR and signal relay location are changed, the trend of energy efficiency is similar to that of throughput in Figure 8, i.e., the energy efficiency first increases and then decreases with an increase in the transmit SNR, and first improves and then decreases as the signal relay moves away from the base station. This figure also shows that the dynamic DF/AF protocol helps achieve green communication because it can dynamically transform and switch between DF and AF protocols to achieve higher throughput.
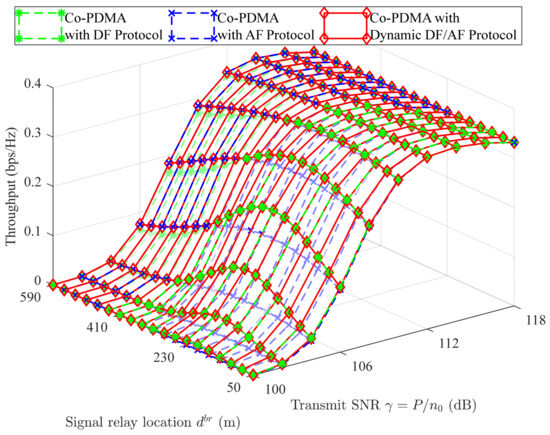
Figure 9.
Energy efficiency of Co-PDMA vs. SNR and signal relay location.
5. Conclusions
Upon analyzing the performance of Co-PDMA networks using DF and AF protocols, we observe that both protocols exhibit their respective advantages under different transmit SNR, quality of service, and signal relay location conditions. Consequently, we propose a dynamic switching method for signal relay protocols designed to consistently select the optimal protocol for forwarding user data under different conditions, thereby optimizing the overall outage probability, throughput, and energy efficiency of the Co-PDMA network. Additionally, Monte Carlo simulations confirm the theoretical results presented in closed form, and all simulations are implemented in MATLAB software version R2023b. Furthermore, numerical analysis shows that the proposed method indeed enhances the performance of Co-PDMA networks. Meanwhile, we also find that the proposed method requires optimization of key parameters such as the transmit SNR, target data rate, and signal relay position, in practical applications to achieve reliable and green communication in Co-PDMA networks. Based on this work, in the future we will explore the optimization of these parameters in conjunction with techniques such as multiple-input multiple-output, reconfigurable intelligent surface, and simultaneous wireless information and power transfer. The work of verifying performance in hardware will also be carried out in subsequent research.
Author Contributions
Conceptualization, W.T., Q.R. and L.W.; methodology, W.T. and Q.R.; validation, Q.R.; investigation, Q.R., L.W. and Z.W.; writing—original draft preparation, Q.R.; writing—review and editing, W.T. and L.W.; supervision, W.T. and Z.W. All authors have read and agreed to the published version of the manuscript.
Funding
This work was funded by Science Research Project of Hebei Education Department [QN2023180].
Data Availability Statement
The author declares that all the data provided in the article text.
Acknowledgments
We would like to express our heartfelt gratitude to North China University of Science and Technology for providing the essential laboratory support that made this research possible.
Conflicts of Interest
The authors declare that they have no known competing financial interests or personal relationships that could have appeared to influence the work reported in this paper.
Appendix A
depends on the positive and negative cases of . So, two scenarios need to be discussed.
When , the solution set for is . This solution set needs to be intersected with :
If and , then the solution set is . In this case, we have
If and , then the solution set is . In this case, we have
If and , then the solution set is . In this case, .
Therefore, the derivation results at can be uniformly expressed as
Similarly, when , , and , we have
We also have
when , , , and when , , . These three outcomes can be expressed uniformly as
By combining the discussions for the cases where and , the proof of Lemma 1 is thereby completed.
Appendix B
In the case of no signal relay cooperative communication, according to (10), the SINR of the decoded signal at user can be calculated as
and
where .
Let . According to (18), the outage probability of user 1 can be expressed as
where can be obtained from (A8). With the help of Lemma 1, the result of (A11) can be derived. According to (18), the outage probabilities of user 2 and user 2 can be expressed as
and
respectively, where and are obtained from (A8); and are obtained from (A9); is obtained from (A10). The result of (A12) and (A13) can be derived with the help of Lemma 1. The proof is completed.
Appendix C
According to (13), there are
and
According to (23), the probability that the signal relay cooperative communication with the DF protocol successfully decodes the data of user 1, user 2 and user 3 is expressed as
where , , and are from (A14), (A15), and (A16), respectively. By using Lemma 2, the mathematical expressions for the above probabilities can be obtained.
According to (11), the SINR for successfully decoding the data at user when receiving the signal transmitted by the signal relay can be calculated as
and
where . Therefore, according to (24), the probabilities of successfully decoding data , , and at user 1, user 2, and user 3, respectively, when receiving the data transmitted by the signal relay, are represented as
and
where , , and are obtained from (A18); and are obtained from (A19); is obtained from (A20). By using the same proof method as in Theorem 1, the mathematical expressions for these three probabilities can be obtained (the detailed proof process is omitted). Finally, Theorem 2 is concluded by bringing (A17) and (A21)–(A23) into (22). The proof is completed.
Appendix D
According to (12), the SINR for successfully decoding the data at user when receiving the signal transmitted by the signal relay can be calculated as
and
where .
To calculate the outage probability of the user, the cumulative distribution function of needs to be determined first. can be expressed as
which can be derived as
by utilizing Equation (8.350.1) and Equation (8.356.3) from [26]. Using two consecutive binomial expansions and with the help of Equation (3.471.9) from [26], (A28) is deduced to be (33).
According to (25) and (26), the outage probabilities for user 1, user 2, and user 3 are expressed as
and
respectively, where , , and are obtained from (A24); and are obtained from (A25); is obtained from (A26). By employing the same proof method as in Theorem 1, , , and are derived. The proof is completed.
References
- Liu, Y.; Zhang, S.; Mu, X.; Ding, Z.; Schober, R.; Al-Dhahir, N.; Hossain, E.; Shen, X. Evolution of NOMA Toward Next Generation Multiple Access (NGMA) for 6G. IEEE J. Sel. Areas Commun. 2022, 40, 1037–1071. [Google Scholar] [CrossRef]
- Do, T.N.; da Costa, D.B.; Duong, T.Q.; An, B. Improving the Performance of Cell-Edge Users in NOMA Systems Using Cooperative Relaying. IEEE Trans. Commun. 2018, 66, 1883–1901. [Google Scholar] [CrossRef]
- Zeng, M.; Hao, W.; Dobre, O.A.; Ding, Z. Cooperative NOMA: State of the Art, Key Techniques, and Open Challenges. IEEE Netw. 2020, 34, 205–211. [Google Scholar] [CrossRef]
- Zhou, J.; Dang, S.; Shihada, B.; Alouini, M.-S. On the Outage Performance of Space-Air-Ground Integrated Networks in the 3D Poisson Field. IEEE Trans. Veh. Technol. 2024, 73, 4401–4406. [Google Scholar] [CrossRef]
- Asshad, M.; Khan, S.A.; Kavak, A.; Küçük, K.; Msongaleli, D.L. Cooperative communications using relay nodes for next-generation wireless networks with optimal selection techniques: A review. IEEJ Trans. Electr. Electron. Eng. 2019, 14, 658–669. [Google Scholar] [CrossRef]
- Gao, Z.; Wang, H.; Chen, Y.; Fan, L.; Zhao, R. Maximizing Long-Term Average System Communication Capacity of SWIPT-Enabled AF Relay System via Lyapunov Optimization. IEEE Internet Things J. 2024, 11, 4679–4692. [Google Scholar] [CrossRef]
- Jin, Q.; Fan, L.; Lei, X.; Zhao, J. Nallanathan, Covert Communication of Multi-Antenna AF Relaying Networks. IEEE Trans. Commun. 2025. early access. [Google Scholar] [CrossRef]
- Aka, B.E.; New, W.K.; Leow, C.Y.; Wong, K.-K.; Shin, H. Power Minimization for Half-Duplex Relay in Fluid Antenna System. IEEE Wirel. Commun. Lett. 2025, 14, 1698–1702. [Google Scholar] [CrossRef]
- Zhang, S.; Ma, Q.; Cheng, H.; Song, R. Achievable Rate Optimization of RIS-Assisted Multi-Antenna FD DF Relay Cooperation System with SWIPT Technology. IEEE Trans. Netw. Sci. Eng. 2025, 12, 2243–2253. [Google Scholar] [CrossRef]
- Abbasi, O.; Yanikomeroglu, H. Transmission Scheme, Detection and Power Allocation for Uplink User Cooperation with NOMA and RSMA. IEEE Trans. Wirel. Commun. 2023, 22, 471–485. [Google Scholar] [CrossRef]
- Zhang, X.; Kang, S.; Fu, X.; Tang, W. Performance analysis of cooperative PDMA with AF relaying over Rayleigh fading channels. IET Commun. 2020, 14, 2166–2175. [Google Scholar] [CrossRef]
- Zhang, X.; Kang, S.; Fu, X. Pattern division multiple access featuring amplify-and-forward relaying in an uplink network. IEEE Access 2020, 8, 85656–85663. [Google Scholar] [CrossRef]
- Wang, X.; Li, E.; Yang, G.; Xu, L. Performance analysis of 5G Downlink Cooperative NOMA network with multi-antenna relay. Phys. Commun. 2022, 52, 101586. [Google Scholar] [CrossRef]
- Rao, C.; Ding, Z.; Cumanan, K.; Dai, X. A GSVD-Based Precoding Scheme for MIMO-NOMA Relay Transmission. IEEE Internet Things J. 2024, 11, 10266–10278. [Google Scholar] [CrossRef]
- Alvi, S.H.; Arif, M.; Navaie, K. Efficiency of NOMA-Assisted FD-AF Vehicle-to-Vehicle Relaying Over Nakagami-m Fading Channels. IEEE Access 2025, 13, 82834–82846. [Google Scholar] [CrossRef]
- Tang, W.; Kang, S.; Ren, B. Performance Analysis of Cooperative Pattern Division Multiple Access (Co-PDMA) in Uplink Network. IEEE Access 2017, 5, 3860–3868. [Google Scholar] [CrossRef]
- Tang, W.; Kang, S.; Fu, X.; Yue, X.; Zhang, X. On the Performance of PDMA With Decode-and-Forward Relaying in Downlink Network. IEEE Access 2018, 6, 20113–20124. [Google Scholar] [CrossRef]
- Mei, J.; Zeng, J.; Su, X.; Shao, S. Outage Performance Analysis of Cooperative PDMA with the Full-Duplex Relay. In Proceedings of the 2019 IEEE Wireless Communications and Networking Conference (WCNC), Marrakesh, Morocco, 15–19 April 2019; pp. 1–6. [Google Scholar]
- Soni, S.; Makkar, R.; Rawal, D.; Sharma, N. Performance of Selective DF-Based Multiple Relayed NOMA System with Imperfect CSI and SIC Errors. IEEE Trans. Green Commun. Netw. 2024, 8, 79–89. [Google Scholar] [CrossRef]
- Feng, Y.; Yan, S.; Yang, Z.; Yang, N.; Zhu, W.-P. TAS-Based Incremental Hybrid Decode-Amplify-Forward Relaying for Physical Layer Security Enhancement. IEEE Trans. Commun. 2017, 65, 3876–3891. [Google Scholar] [CrossRef]
- Pal, S.; Jindal, P. Secrecy performance analysis of hybrid AF-DF relaying under multi hop environment. Wirel. Pers. Commun. 2020, 111, 1741–1760. [Google Scholar] [CrossRef]
- Salem, A.; Musavian, L. NOMA in Cooperative Communication Systems with Energy-Harvesting Nodes and Wireless Secure Transmission. IEEE Trans. Wirel. Commun. 2021, 20, 1023–1037. [Google Scholar] [CrossRef]
- Ramesh, R.; Gurugopinath, S. Hybrid Decode- and Amplify-and-Forward Protocol for NOMA-Enabled Power Line Communication. In Proceedings of the 2023 National Conference on Communications (NCC), Guwahati, India, 23–26 February 2023; pp. 1–5. [Google Scholar]
- Chen, S.; Ren, B.; Gao, Q.; Kang, S.; Sun, S.; Niu, K. Pattern Division Multiple Access—A Novel Nonorthogonal Multiple Access for Fifth-Generation Radio Networks. IEEE Trans. Veh. Technol 2017, 66, 3185–3196. [Google Scholar] [CrossRef]
- Dai, X.; Zhang, Z.; Bai, B.; Chen, S.; Sun, S. Pattern Division Multiple Access: A New Multiple Access Technology for 5G. IEEE Wirel. Commun. 2018, 25, 54–60. [Google Scholar] [CrossRef]
- Gradshteyn, I.S.; Ryzhik, I.M. (Eds.) Table of Integrals, Series, and Products, 8th ed.; Academic Press: Cambridge, MA, USA, 2014. [Google Scholar]
- Haldar, S.; Chakraborty, S. On the probability of real roots in a quadratic equation with coefficients as i.i.d U(-θ,θ) variates. J. Appl. Math. Comput. 2021, 5, 48–55. [Google Scholar] [CrossRef]
- Haldar, S.; Chakraborty, S.; Chaudhary, M. On the probability of real roots of a quadratic equation when the coefficients are iid uniform (α, β) variates. J. Indian Soc. Probab. Stat. 2023, 24, 135–149. [Google Scholar] [CrossRef]
- Huang, C.; Zappone, A.; Alexandropoulos, G.C.; Debbah, M.; Yuen, C. Reconfigurable Intelligent Surfaces for Energy Efficiency in Wireless Communication. IEEE Trans. Wirel. Commun. 2019, 18, 4157–4170. [Google Scholar] [CrossRef]
- Nguyen, H.T.; Hau, N.-T.; Toan, N.V.; Ty, V.T.; Duy, T.T. Fountain coding based two-way relaying cognitive radio networks employing reconfigurable intelligent surface and energy harvesting. Telecom 2025, 6, 1. [Google Scholar] [CrossRef]
- Jee, A.; Agrawal, K.; Prakriya, S. A Coordinated Direct AF/DF Relay-Aided NOMA Framework for Low Outage. IEEE Trans. Commun. 2022, 70, 1559–1579. [Google Scholar] [CrossRef]
- IEEE Std 802.15.4-2006 (Revision of IEEE Std 802.15.4-2003); IEEE Standard for Information Technology—Local and Metropolitan Area Networks—Specific Requirements—Part 15.4: Wireless Medium Access Control (MAC) and Physical Layer (PHY) Specifications for Low Rate Wireless Personal Area Networks (WPANs). IEEE Standards: Piscataway, NJ, USA, 2006; pp. 1–320. [CrossRef]
Disclaimer/Publisher’s Note: The statements, opinions and data contained in all publications are solely those of the individual author(s) and contributor(s) and not of MDPI and/or the editor(s). MDPI and/or the editor(s) disclaim responsibility for any injury to people or property resulting from any ideas, methods, instructions or products referred to in the content. |
© 2025 by the authors. Licensee MDPI, Basel, Switzerland. This article is an open access article distributed under the terms and conditions of the Creative Commons Attribution (CC BY) license (https://creativecommons.org/licenses/by/4.0/).