Article

Spatio-Temporal Distribution of Visibility over Nigeria Using Kernel Density Estimation Techniques for Fog-Induced Attenuation

by
Yusuf Babatunde Lawal
1,*,
Pius Adewale Owolawi
1,
Chunling Tu
1,
Joseph Sunday Ojo
2,
Olakunle Lawrence Ojo
3 and
Mobolaji Aduramo Sodunke
4
1
Department of Computer Systems Engineering, Tshwane University of Technology, Pretoria 0152, South Africa
2
Department of Physics, Federal University of Technology, Akure 0152, Nigeria
3
Mathematical and Physical Sciences Department, Afe Babalola University, Ado-Ekiti 360102, Nigeria
4
Department of Science Laboratory Technology (Physics with Electronics Unit), Moshood Abiola Polytechnic, Abeokuta 110104, Nigeria
*
Author to whom correspondence should be addressed.
Telecom 2025, 6(3), 62; https://doi.org/10.3390/telecom6030062
Submission received: 29 May 2025 / Revised: 18 July 2025 / Accepted: 20 August 2025 / Published: 1 September 2025

Abstract

The continuous demand for uninterrupted super-fast wireless communication services can only be fulfilled by transmitting electromagnetic waves at high frequencies. This study investigates the impacts of atmospheric visibility on Free Space Optical (FSO) Communication links operating at three Near-Infrared (NIR) frequencies, 353 THz (850 nm), 273 THz (1100 nm), and 194 THz (1550 nm), in some selected business-hub cities (Ikeja, Calabar, Abuja and Kano) in Nigeria. Fifteen years (2009–2023) of visibility data retrieved from the archive of the National Oceanic and Atmospheric Administration (NOAA) were utilized to investigate the impacts of seasonal visibility on fog-induced specific attenuation. Kernel density estimation (KDE) was used to estimate and categorize seasonal visibility as low-visibility (LV) and high-visibility (HV) during wet and dry seasons. The triangular kernel provides the best estimation across all the stations with lowest Integrated Square Errors (ISEs). Similar seasonal trends were observed for the computed fog-induced specific attenuations at the selected wavelengths. Specific attenuation shows double peaks noticed in LV dry and LV wet seasons. Maximum specific attenuations of about 0.27 dB/km, 0.22 dB/km, 0.23 dB/km, and 0.27 were observed at 850 nm in Ikeja, Calabar, Abuja, and Kano, respectively, during the LV dry season. The variability of visibility and its effects on specific attenuation is moderate in Abuja compared to other stations. The results will find applications in the design and implementation of the FSO communication link for optimum performance in tropical regions.

1. Introduction

Visibility is a critical parameter in atmospheric sciences, representing the maximum distance at which an object or light source can be distinctly perceived by the human eye under prevailing meteorological conditions [1,2]. In countries like Nigeria, characterized by diverse climatic and geographical features, fog-induced reductions in visibility pose substantial risks to aviation, ground transportation, and telecommunication systems. These visibility impairments extend beyond operational disruptions, contributing to economic losses, increased accident rates, and diminished efficiency across several sectors [3]. Fog formation is governed by multiple meteorological and environmental factors, including temperature, relative humidity, wind patterns, and topography. In Nigeria, the interaction between the humid tropical monsoon climate of the south and the arid Sahelian conditions in the north creates unique spatio-temporal fog patterns. These patterns are further modulated by seasonal transitions, especially during the Harmattan period, when dry, dust-laden winds from the Sahara Desert significantly reduce visibility in the central and northern regions of the country [4,5]. Conventional fog monitoring typically relies on specialized instruments such as visibility sensors and transmissometers, which offer high-accuracy, real-time data. However, these instruments are often expensive to acquire and maintain, difficult to deploy over large spatial scales, and lack portability due to their size and power requirements [6]. These limitations are particularly challenging in developing regions like Nigeria, where infrastructural and financial constraints hinder widespread implementation. Consequently, alternative methods for visibility estimation are necessary. Emerging alternatives include satellite observations, remote sensing technologies, and statistical approaches such as kernel density estimation (KDE) [7,8]. Numerous studies have investigated the impacts of fog on visibility and signal attenuation. For instance, Studies conducted by Kaur [9] in Delhi which utilized seven years visibility data observed that fog conditions can lead to significant reduction in the effective range of FSO link. Similarly, Nadeem et al. [10] developed an empirical attenuation model using visibility data, revealing significant signal loss (up to 0.68 dB/km) in fog-prone Sahelian environments. Other studies have reported that fog-induced attenuation often follows a normal mixture distribution, which is vital for accurate statistical modeling [11]. Furthermore, local microclimatic variations can lead to non-uniform fog distributions along transmission paths, complicating efforts to predict visibility-related signal loss [12]. Kernel density estimation, a non-parametric spatial analysis technique, has emerged as a powerful tool for assessing complex environmental datasets. Unlike traditional gridded averages or histograms, KDE preserves spatial variability and uncovers localized patterns that may be overlooked using conventional methods [13]. KDE has been successfully applied in various meteorological and environmental applications, including rainfall pattern analysis, pollutant dispersion, and thermal mapping [14]. Despite growing recognition of the hazards associated with fog in Nigeria, there remains a paucity of research focused on its spatio-temporal variability and its direct impact on critical infrastructure. Most existing studies emphasize general atmospheric parameters, such as rainfall and temperature trends, while neglecting the detailed assessment of fog density and its influence on visibility attenuation. Additionally, the relationship between fog density and signal degradation remains insufficiently explored, leaving significant gaps in our understanding of its implications for aviation safety and telecommunication reliability [3,15]. By applying KDE to visibility datasets, this study aims to generate high-resolution spatial maps that highlight the regions most susceptible to fog-induced attenuation. This spatial information will support informed decision-making by stakeholders in aviation, road transport, and telecommunications. Specifically, this study estimates seasonal visibility patterns across four major Nigerian cities and evaluates the effect of visibility loss on fog-induced attenuation at three selected frequency bands.

2. Methodology

2.1. Climatology of the Research Locations

This study focuses on four distinct locations in Nigeria, Ikeja, Calabar, Abuja, and Kano, strategically selected to represent major geoclimatic zones across the country’s tropical equatorial climate. As presented in Table 1, these sites correspond to Nigeria’s major climatological regions defined by Olaniran and Sumner [16], namely, the Coastal zone, the Guinea savannah, the midland zone (Derived savannah), and the Sahel savannah. The Sahelian zone lies in the far north, bordering the Sahara Desert, while the midland savannah spans the central belt and includes Abuja, the nation’s capital. The Coastal zone, covering the southernmost areas, is influenced by maritime conditions due to proximity to the Atlantic Ocean [16,17]. Due to data unavailability, no site from the Guinea savannah zone was included in the present analysis. Two stations—Ikeja and Calabar—were selected within the Coastal zone to examine the maritime influence of the Gulf of Guinea. Nigeria generally experiences two major climatic seasons annually: the wet season (April/May to October/November) and the dry season (November to March), although onset and cessation periods vary slightly with location [18,19,20]. The dry season is dominated by the Harmattan, a dry and dust-laden wind originating from the Sahara Desert, which significantly influences visibility and atmospheric clarity, particularly in the northern and central regions [21]. Conversely, the wet season results from the northward movement of moist air masses from the Atlantic Ocean, bringing rainfall across much of the country. These two different air movements—the dry Tropical Continental (cT) and the wet Tropical Maritime (mT)—are divided by the Inter-Tropical Discontinuity (ITD), a low-pressure area that changes position and marks the change in season. The duration and intensity of seasonal conditions vary by zone, with the Coastal zone typically experiencing a longer rainy season than the Sahelian region, which has a shorter and more intense wet period.
Table 1 provides details about the study stations, such as the geoclimatic classification, latitude in degrees east, longitude in degrees north, station elevation in meters, annual rainfall in millimeters and typical ambient temperature range in degrees Celsius.
The visibility data used for the research was retrieved from the NOAA archive of the National Centers for Environmental Information [25]. The average monthly values of the visibility for an average year were computed to reveal the seasonal variation in visibility on a monthly basis. Although there are two prevailing seasons in Nigeria, the monthly mean visibilities were classified into four sub-seasons based on the variability of the dataset. The four sub-seasons are presented in Table 2. Data retrieval, extraction, and analysis were carried out using version 3.13.0 of the python programming language.

2.2. Kernel Density Estimation (KDE) Techniques for Estimation of Seasonal Visibility

KDE techniques are used for analyzing non-parametric data for decision-making and to gain insight into data distribution [26]. The non-parametric estimation techniques are fully flexible techniques, as the true nature of the distribution of the statistic can be identified and compared with the estimates [27]. The data structure does not follow any prescriptive form since the probability density function (PDF) is obtained from a data sample. The characteristics concerning the data structure can be disclosed easily since it does not impose on the pattern of distribution. A set of smooth curves known as kernels, with each curve representing a data point in the dataset, helps improve the estimation accuracy. The kernel function f(v) of a variable v is expressed in Equation (1).
f v = 1 m n = 1 m K v X n h
where m is the sample size, h is the width commonly called bandwidth, and Xn is the nth observation of the data. The kernel density estimate is obtained by integrating all these curves into the densities of each data point. The monthly average visibilities for all the stations were simulated by using the four kernels described below. The bandwidth is decided by providing a compromise between the oscillation of the data and the curvature to detect the best window width, commonly referred to as the optimum bandwidth. This is achieved through the application of various types of kernel function provided in Equations (2), (6), (8) and (10), with their corresponding optimal bandwidths in Equations (3), (5), (7) and (9), respectively. A low value of optimized bandwidth indicates a better density estimation, which is an indication of a smoother and better density estimation.

2.2.1. Gaussian Kernel

The Gaussian kernel provides certain values which have proven to be smooth density estimates for a given set of data. They are most beneficial when the applied data are normally distributed. The Gaussian non-parametric kernel density estimate is given as [28]
f v = 1 2 π e x p v 2 2
The optimal bandwidth h is expressed as
h = 1.06 × σ m 5
where σ is the standard deviation of the data, m is the sample size of the variable v.
Although the Gaussian kernel is primarily utilized for several applications because of its fine smoothing ability, its limitation is that it over smoothes the peak and sharp edges due to the features of its support type, which is infinite.

2.2.2. Epanechnikov Kernel

The Epanechnikov kernel is a parabolic function introduced by Epanechnikov in 1969 [29]. It possesses good performance in terms of bias–variance tradeoff due to its fixed bandwidth and minimization of mean integrated square error (MISE), hence it is widely adopted. The kernel function is expressed in Equation (4) [29].
f ( v ) = 3 4 ( 1 v 2 ) ,   f o r   | v | 1
The optimal bandwidth is expressed is given as
h = 2.34 × σ m 5

2.2.3. Triangular Kernel

This is a finite kernel that has a simple basic structure which works between the extremes of continuity and local flexibility. It is a piecewise linear kernel function with a triangular shape, known for its simplicity and interpretability. Although it is easier to apply and faster than the Gaussian kernel, it is not as continuous as the Gaussian kernel and it compromises near-boundary values. The triangular kernel density function f(v) and the optimal bandwidth h are presented in Equations (6) and (7), respectively [30].
f ( v ) = 1 | v | ,   f o r   | v | 1
h = 1.06 × σ m 5
It is the quickest and least complex kernel density estimation strategy commonly used for handling large datasets. However, it has low smoothing capabilities, but it is very effective in simple applications, as it considers only nearby data points. It is used for real-time, high-speed data feed applications. The rectangular density function and the optimum width are presented in Equations (8) and (9), respectively [31].
f ( v ) = 1 2 ,   f o r   | v | 1
h = 2.34 × σ m 5
To establish the estimated probability density functions described above, the kernel functions were applied to the seasonal visibility dataset. The kernel with least error was determined for each station by calculating the Integrated Squared Errors (ISEs) numerically using Equation (10), and then comparing the various results from all kernels.
I S E = n = 1 m [ f x n f x n ] 2 x
where f ( x n ) is the true density function, f x n is the kernel density estimate, and x is the spacing between data grid points. The ISE is a measure of the error between the estimated density function of a given dataset and the actual estimated density function of the dataset using kernel density estimation. For the four stations, seasonal visibilities were also estimated with the help of the four kernel models described above. The kernel with the lowest ISE value provides the best kernel that describes the sharpest median value of a dataset. The kernel with the smoothest fit for training the estimation on the dataset is determined by the optimum bandwidth. Therefore, the epoch with the lowest optimum bandwidth was deemed to enhance the estimation smoothness of the kernel.

2.3. Estimation of Fog-Induced Attenuation

Attenuation caused by fog depends on several factors, such as location, particle size distribution, liquid water content, and average particle diameter. The particle concentration and size distribution can vary significantly from one location to another, making the prediction of fog-induced attenuation on optical signals primarily reliant on empirical models based on experimental observations.
The empirical model, specifically the Kruse model, is judged to be the most reliable model for calculating fog-induced attenuation [32,33,34]. It uses visibility data to characterize the density of fog and subsequently estimate the attenuation due to fog, as presented in Table 3 and Equation (11), respectively. The NIR wavelengths (850 nm, 1100, and 1550 nm) were selected for the FSO communication link due to their low atmospheric attenuation and compatibility with optical devices like lasers and photo detectors [35,36,37].
The Kruse model relates the atmospheric specific attenuation to the meteorological visibility of the atmosphere and the optical wavelength, λ according to Equation (11).
α = 3.912 V ( k m ) λ 550   n m q
where α is the specific attenuation in dB/km, V is the visibility of the atmosphere in kilometers, λ is the wavelength in nanometers, 550 nm is the reference wavelength for the maximum spectrum of the solar band, and q is a parameter related to the particle size distribution of the atmosphere. The value of the index q in the Kruse model depends on visibility, according to the conditions in Equation (12).
q = 1.6   i f   V > 50   km 1.3   i f   6   km < V < 50   km 0.585 V 1 / 3   i f   0   km < V < 6   km

3. Results and Discussion

3.1. Validation of Visibility Data Retrieved from NOAA

The hourly visibility data retrieved from the NOAA site was validated with the visibility data measured by the Nigerian Meteorological (NiMet) Agency in 2012. Only visibility data for Ikeja station was available at NiMet, hence the data validation was based on a single station. The Nimet visibility data were measured using a radiosonde at two synoptic hours, which were 9:00 and 15:00 h daily, with some missing data for the available year. Consequently, the corresponding hours of the NOAA visibility data for Ikeja station were extracted and compared with the NiMet data for the same station. The time series plot of the visibility data from the two sources are presented in Figure 1.
It could be established as evidence in Figure 1 that the values of the visibility overlap at most of the data points. The co-efficient of correlation between the two datasets was found to be 0.897, which indicates a high level of reliability. The high correlation coefficient between the two datasets at this location is a strong indication of the reliability of NOAA visibility data under similar climatic conditions. Moreover, similar studies have reported consistent agreement between satellite-derived or model-based visibility data and ground observations, especially when the atmospheric conditions are not highly variable [39,40,41,42]. The minor variationscould be attributed to missing data, especially in the Nimet dataset, as observed during data preprocessing. The missing data are usually due to a lack of measurement caused by equipment failure and other administrative reasons. NOAA data are more consistent because the data is measured by the weather observatory stations situated within the airports of the study locations. The obersation, measurement, and storage of atmospheric parameters such as visibility, temperature, humidity, wind speed, wind direction, etc., is part of the airports’ ethical standards for flight operation. The locations of the two meteorological stations could also be responsible for the slight variation in the measurements. The crow-fly distance between NiMet and Muritala Muhammed Airport (MMA) and the stations is approximately 5 km [43].

3.2. Monthly and Seasonal Variation in Visibility Across the Selected Stations

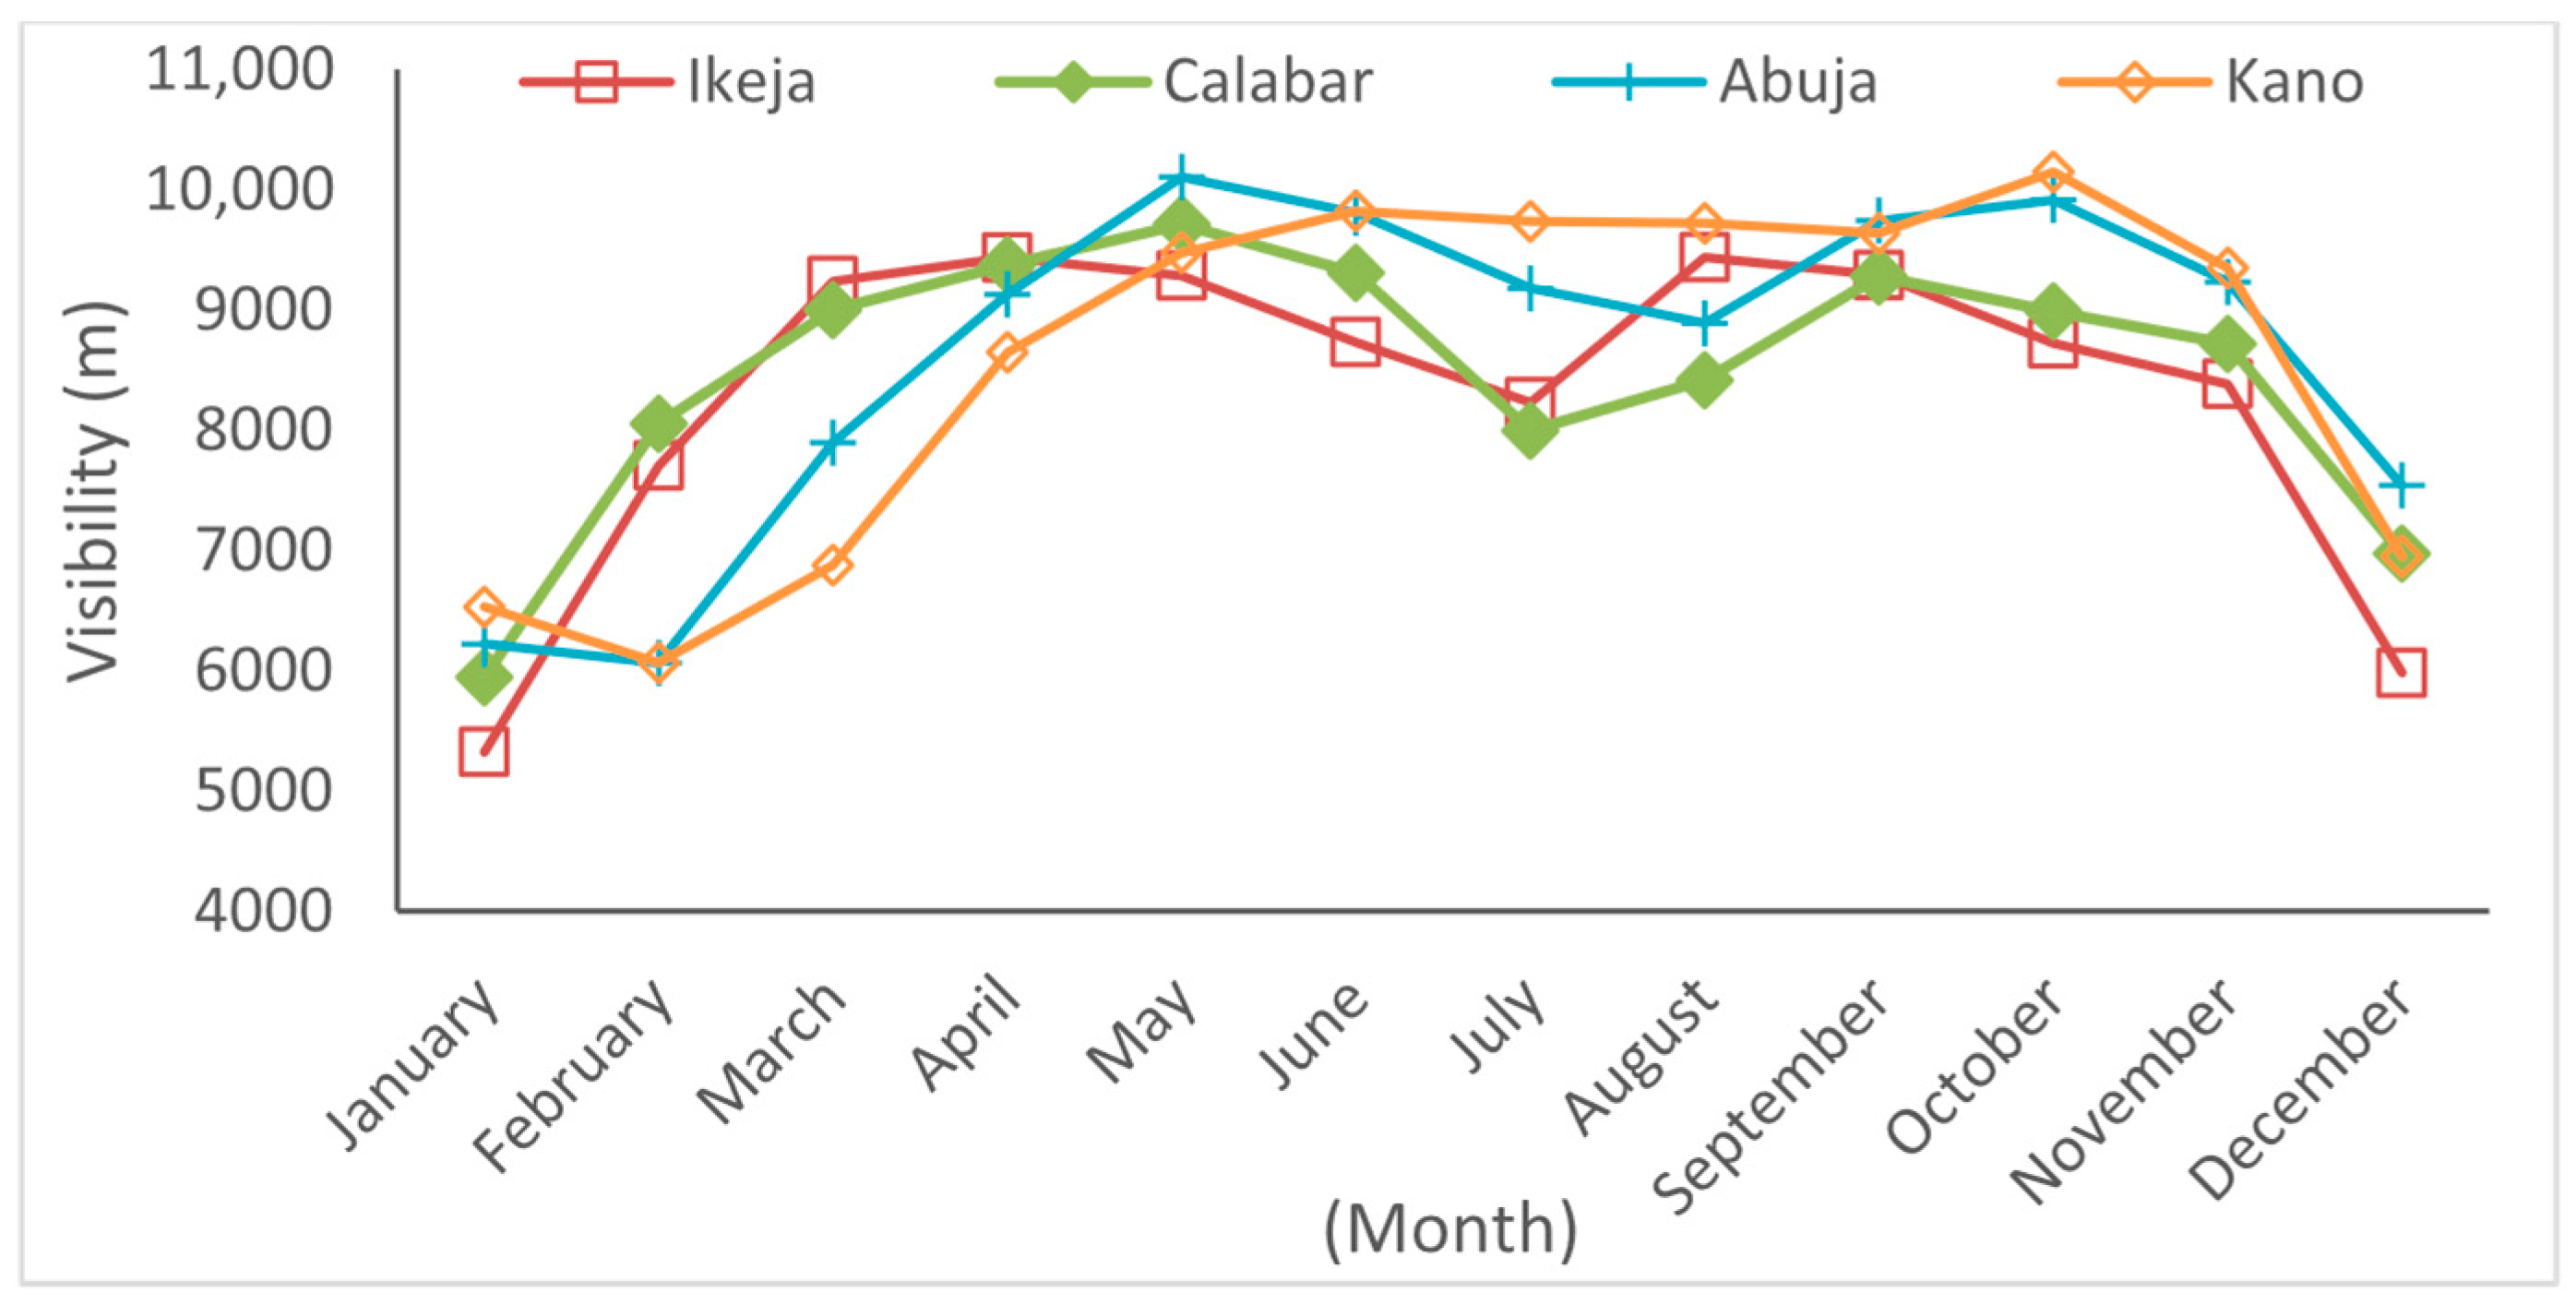
The monthly means of the daily visibility across the selected stations for the studied years were computed and are presented in Figure 2. The plot illustrates the clear impact of seasonal weather patterns on atmospheric visibility across different regions in Nigeria. A critical observation of the monthly trend revealed that the curves depict double-peak patterns in all the stations. A similar trend was reported by Akpootu et al. [44], who conducted their study on Ikeja alone. The first peak occurs between May and April, while the second peak reigns between September and October. This clearly indicates that both the wet (April–October) and dry (November–March) seasons experience low and high visibilities. Consequently, the calendar months were divided into four categories, namely, low-visibility (LV) wet season, high-visibility (HV) wet season, low-visibility (LV) dry season, and high-visibility (HV) dry season, as presented in Table 2.
The low-visibility (LV) wet season reigns between June and August, when visibility is heavily impaired by high humidity and cloud formation in the atmosphere, especially in the coastal stations. It can be observed in Figure 2 that the coastal stations have the lowest visibility during this period.
Specifically, Calabar and Ikeja possess minimum wet season visibility of about 7.99 and 8.23 km, respectively, in July. The gradual increase recorded in August could be attributed to the famous deluge of rainfall called the August break [45,46,47,48]. The reduction in visibility is apparently negligible in the savannah stations due to the low frequency of cloud formation in these regions during this period. Kano, which belongs to the Sahel savannah, had a maximum visibility of 9.82 km in June.
The high-visibility (HV) wet season occurs between September and November as a result of the gradual end of the wet season. Kano maintained the highest visibility, of about 10.15 km, in the high-visibility (HV) wet season and throughout the average year in all the study locations. Ikeja and Calabar possess the lowest visibilities of about 8.72 and 8.9 km in October due to the extended rainy season, attributed to the Coastal zone.
The third season is the low-visibility dry season observed between December and February, when all stations experienced all-time low values throughout the year. The onset of the Harmattan in the coastal stations is responsible for the reduction in visibility to an all-time low of about 5.98 and 5.94 km in Ikeja and Calabar. However, visibility increased to maximums of about 7.7 and 8.05 km in Ikeja and Calabar as the Harmattan disappeared in February. Although an absence of rainfall is expected in the savannah during the LV dry season, the gradual formation of a dust-laden atmosphere attributed to the onset of the dry season is expected to affect visibility. Visibility drops further in January because of the intense Harmattan commonly observed in most stations. The Harmattan is driven by the northeast trade winds that blow from the Sahara Desert towards the Gulf of Guinea. These winds transport dry and dusty air across the Sahel region and into southern West Africa, including Nigeria [8,23]. The poor visibility often disrupts road, air, and sea transportation. Flight delays and cancelations are common due to the dense dust haze. FSO communication signals are heavily attenuated since they rely on visibility.
The last season is the high-visibility dry season period, when visibility rises steadily from March to May as the Harmattan varnishes completely. Visibility attains peak values in most stations between April and May due to the absence or rarity of rainy events. The atmosphere experiences clear-air conditions during this period. The occasional rainfall helps to reduce the dust levels as the precipitation clears particles from the atmosphere. A maximum visibility of about 10.1 km was recorded for Abuja, while a minimum value of 9.45 km was observed in Ikeja in the month of May.
Conclusively, the visibility values across all the study locations lie within the “very light mist” classification as shown in Table 3. Ikeja experienced the most significant seasonal change, with a distinct dip around the middle of the year. Calabar also experienced high seasonal changes, but these were less extreme compared to Ikeja. Although Kano possesses the least variability between May and November, Abuja has the fewest overall seasonal changes.

3.3. Annual Trend of Visibility Across the Study Locations

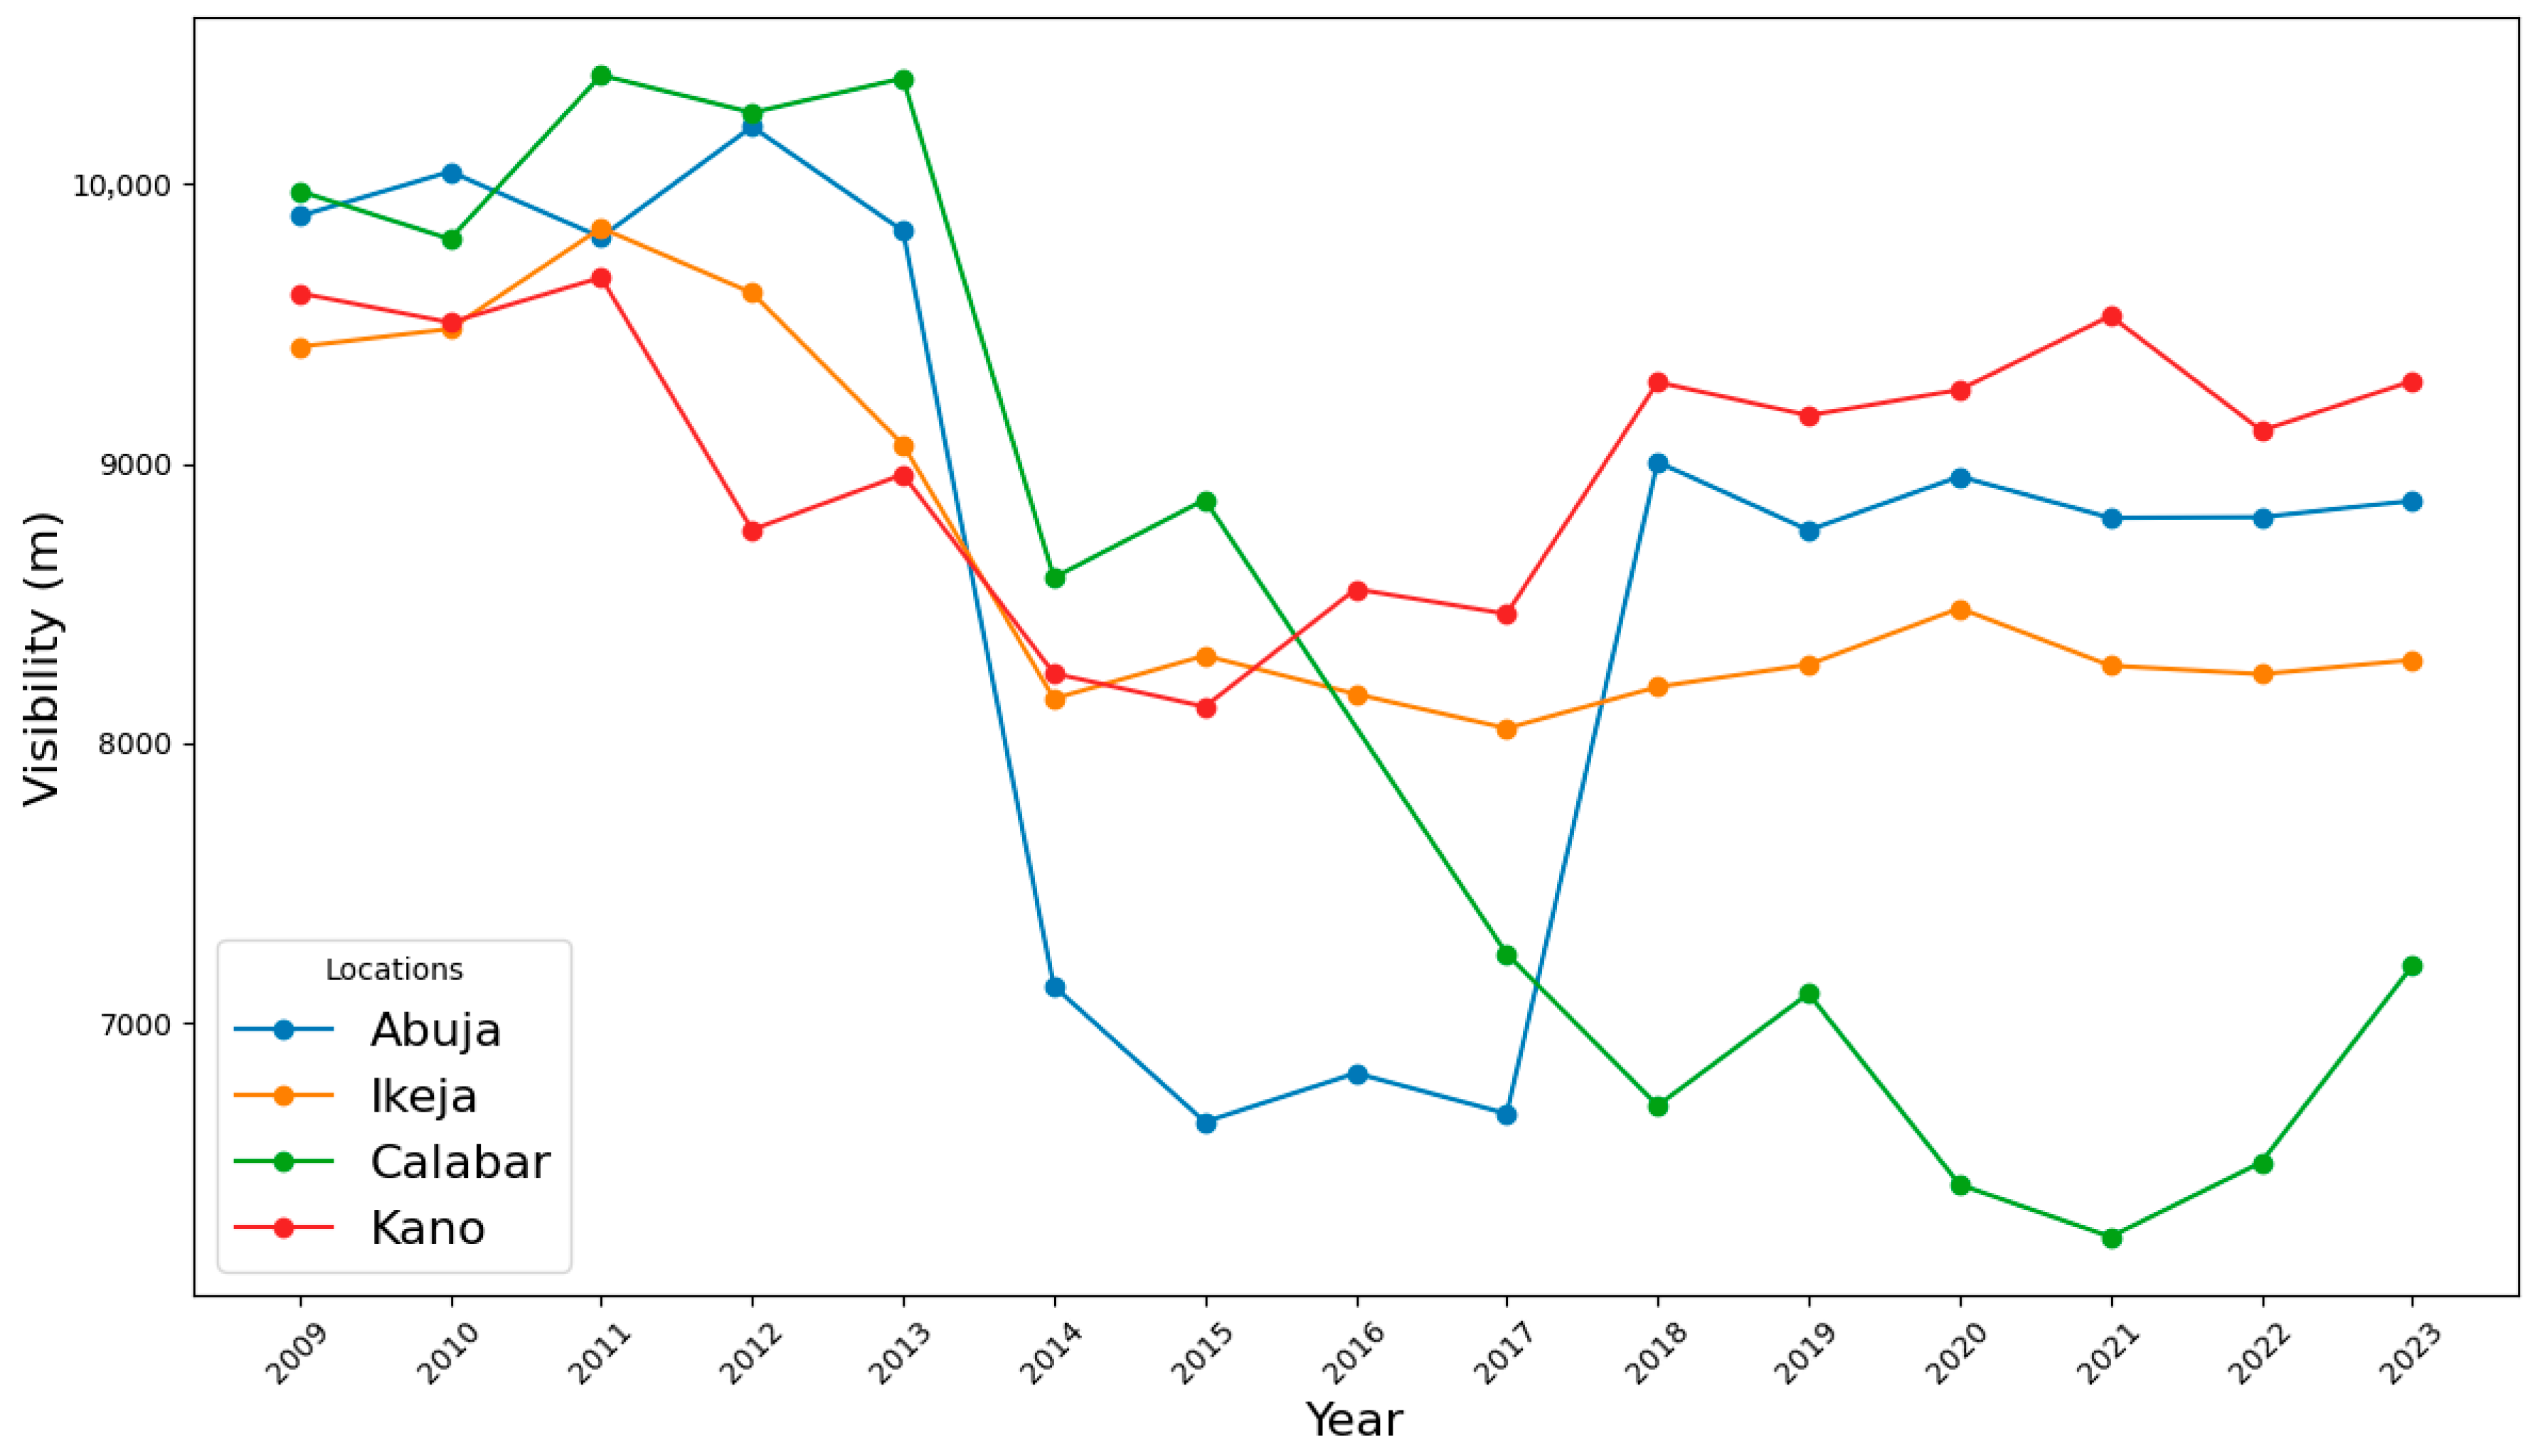
The trends in atmospheric visibility over the years of study were investigated across the four stations. The yearly averages of the visibility values were computed and are presented in Figure 3. Generally, visibility has decreased over the studied years due to meteorological and aerosol-related factors [22]. Specifically, a sharp decline was observed in the mid-2010s (2014–2016) across all stations. This could be a consequence of Saharan dust outbreaks and other factors, such as vehicular emissions, biomass burning, and industrial activities, which have been proven to have reduced the aerosol index and visibility substantially in many parts of Nigeria in the mid-2010s [3,5,49].
It was observed that annual visibility in Ikeja, the capital of Lagos State, was stable at a mean value of about 9.5 km between 2009 and 2012, followed by a gradual decline from 2013 to 2014. The visibility stabilizes at about 8.3 km from 2014 to 2023. The continuous decrease in visibility over the study years could be attributed to the rapid urban development, industrial engines, and vehicular emissions of the densely populated Lagos [22]. These air pollution sources contribute significantly to visibility degradation [50]. Calabar possessed a higher average yearly visibility of about 10 km between 2009 and 2015. The value dropped to a minimum of about 6.2 km in 2021, followed by a slight recovery until 2023. The significant change in the atmospheric conditions is linked to the increase in anthropogenic activities or shifting rainfall patterns affecting particulate washout in this area [51]. A similar trend was observed in Abuja, but with a more pronounced decrease in the mid 2010s when compared to other stations. The average visibility lay at around 10 km until 2013, when visibility dropped drastically to about 7.3 km, and maintained a fairly stable level of 6.7 km until 2017. A higher value of approximately 8.8 km was attained between 2016 and 2023. The rapid increment in visibility which began in 2017 was caused by the annihilation of El-Nino, which had suppressed rainfall in the past, the return of La-Nina conditions in 2017, which likely contributed to better monsoonal activity, especially in the Central region of Nigeria (Abuja), and the relatively lower transboundary Saharan dust transported to Abuja [5,8,52,53]. Visibility in Kano also dropped from about 9.4 km in 2009 to 8.2 km in 2014, as observed in other stations. However, the city experienced low annual variability with an average value of 9.3 km between 2017 and 2023. This suggests more stable atmospheric conditions were likely influenced by a drier climate, consistent Harmattan, low humidity, with less seasonal fog or moisture compared to the coastal cities (Ikeja and Calabar). Consequently, Kano experienced the highest visibility of about 9.3 km after the decrease in the mid 2010s [49]. The comparatively low atmospheric visibility in Ikeja and Calabar may be controlled through air quality management and regulatory policies to mitigate potential risks in critical sectors such as health, telecommunication, and transportation.

3.4. Application of KDE Techniques for the Estimation of Spatio-Temporal Distribution of Visibility

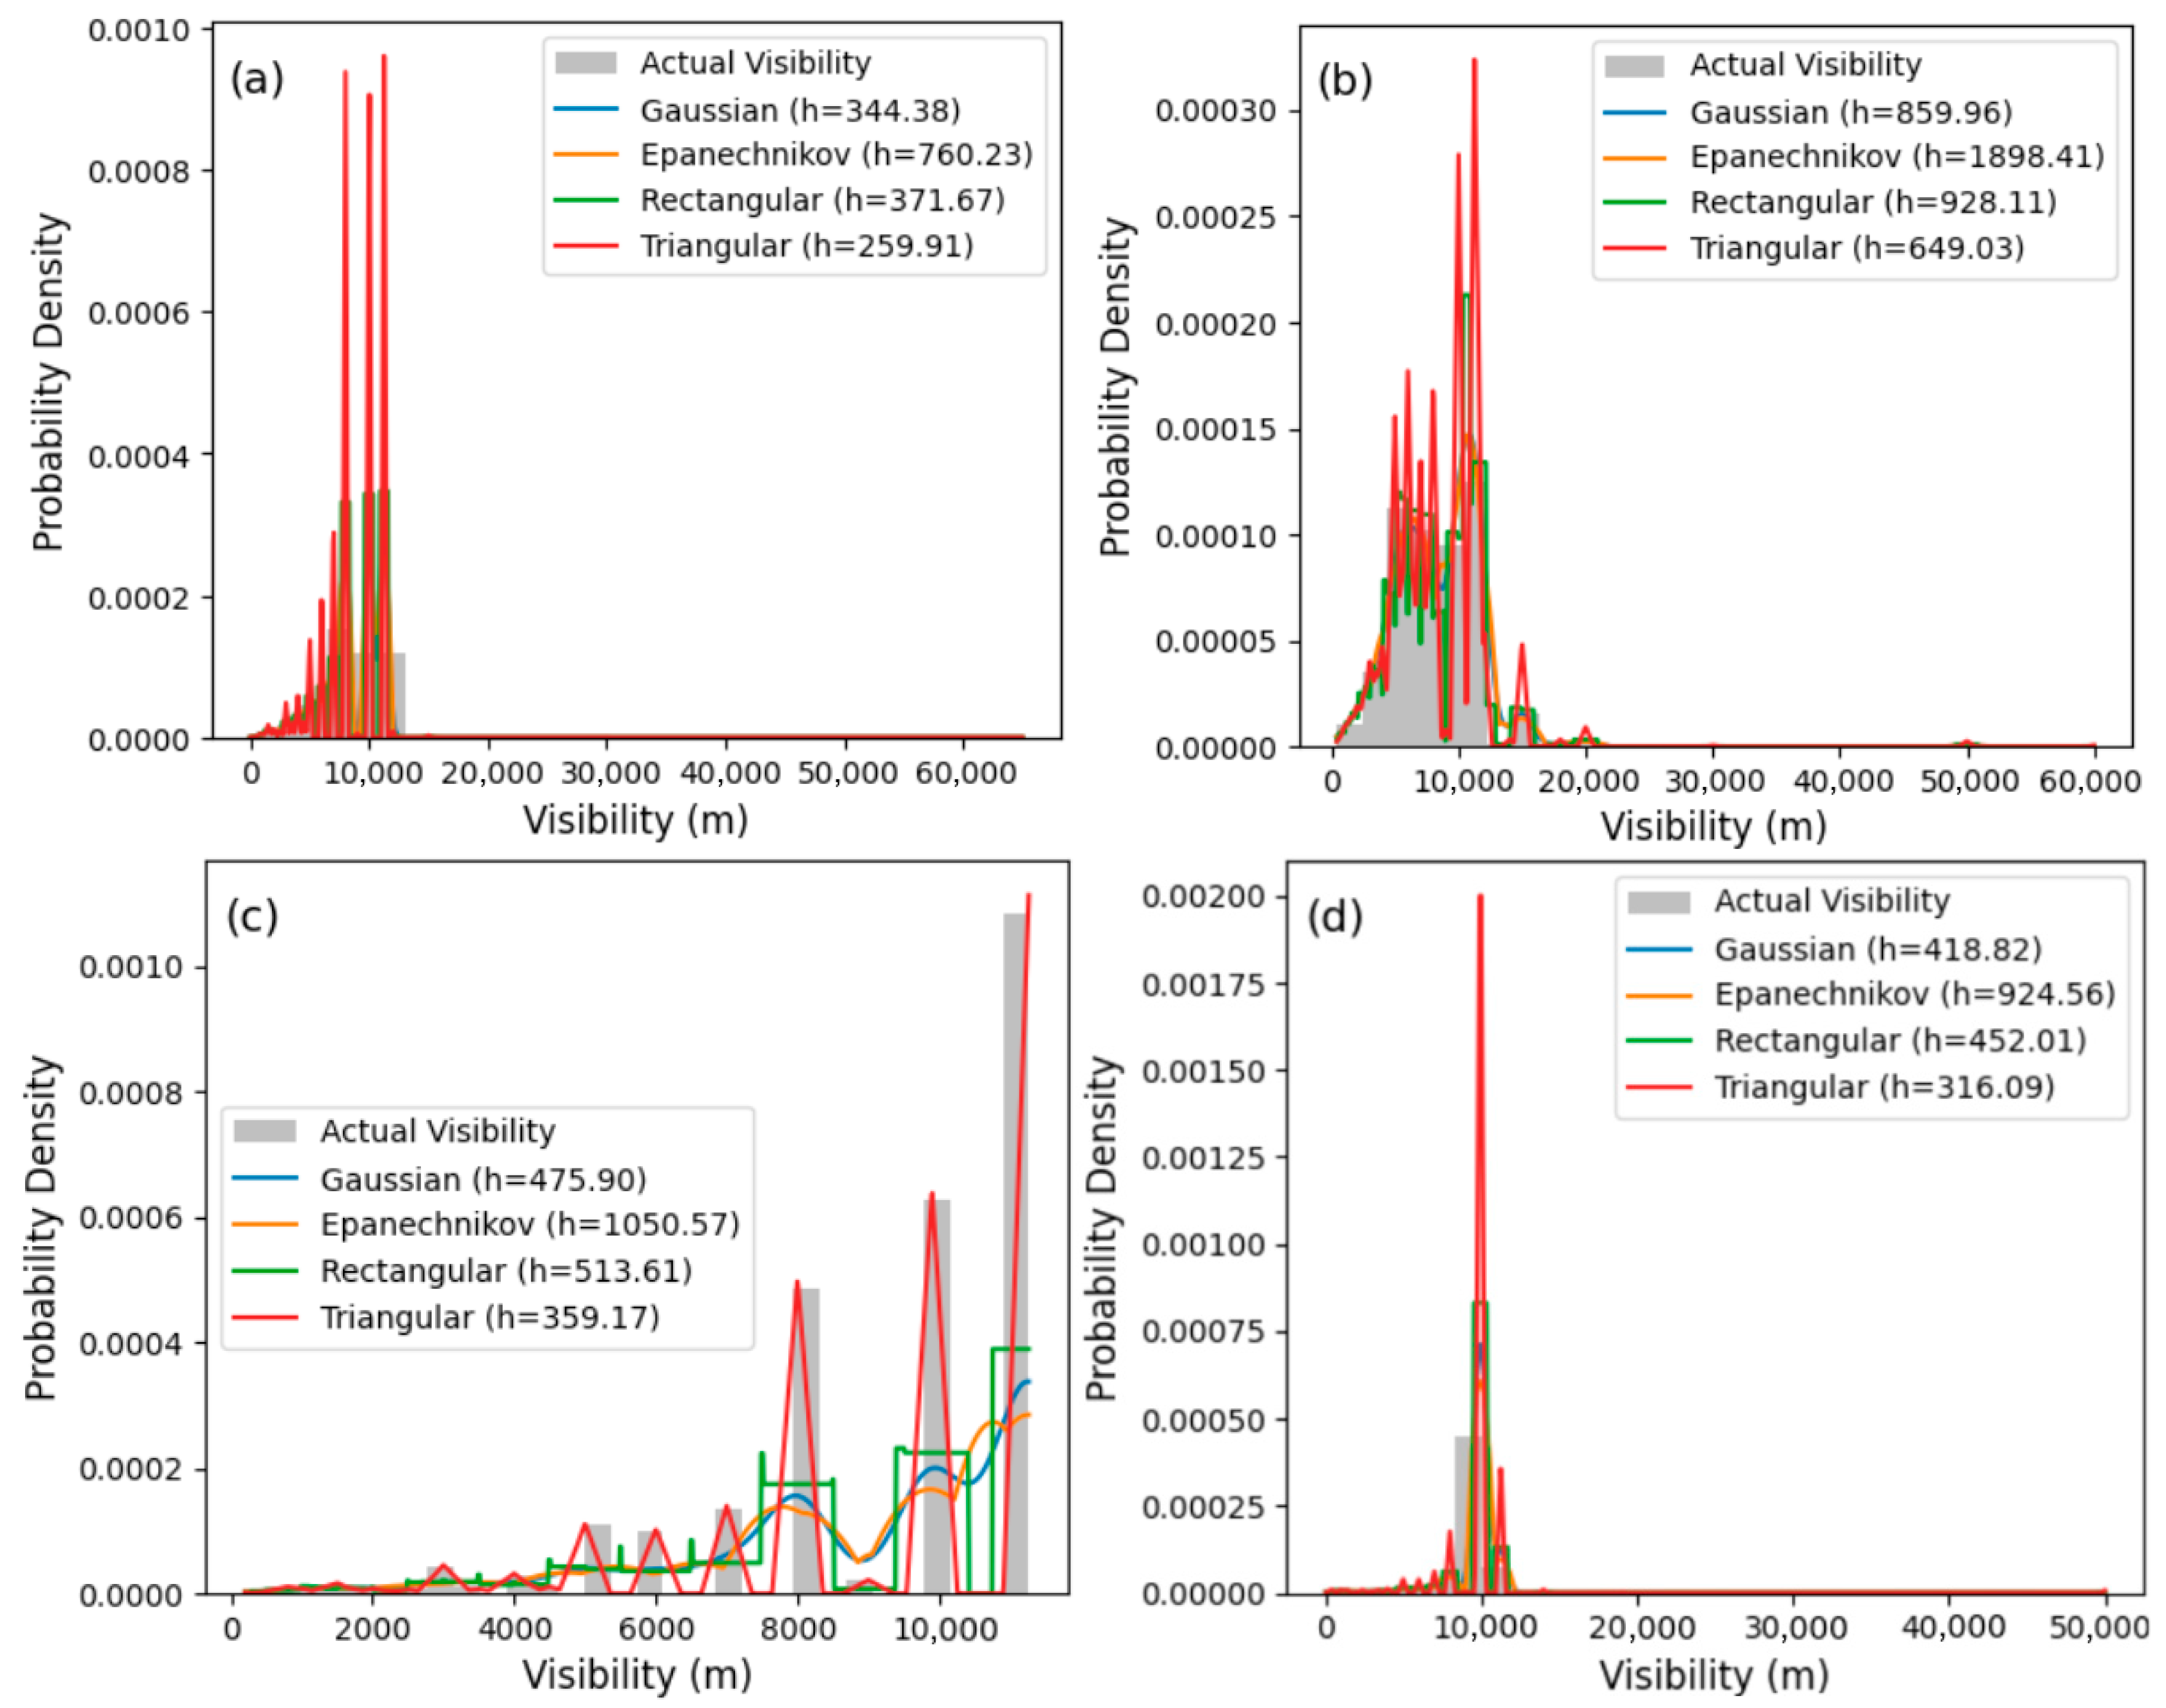
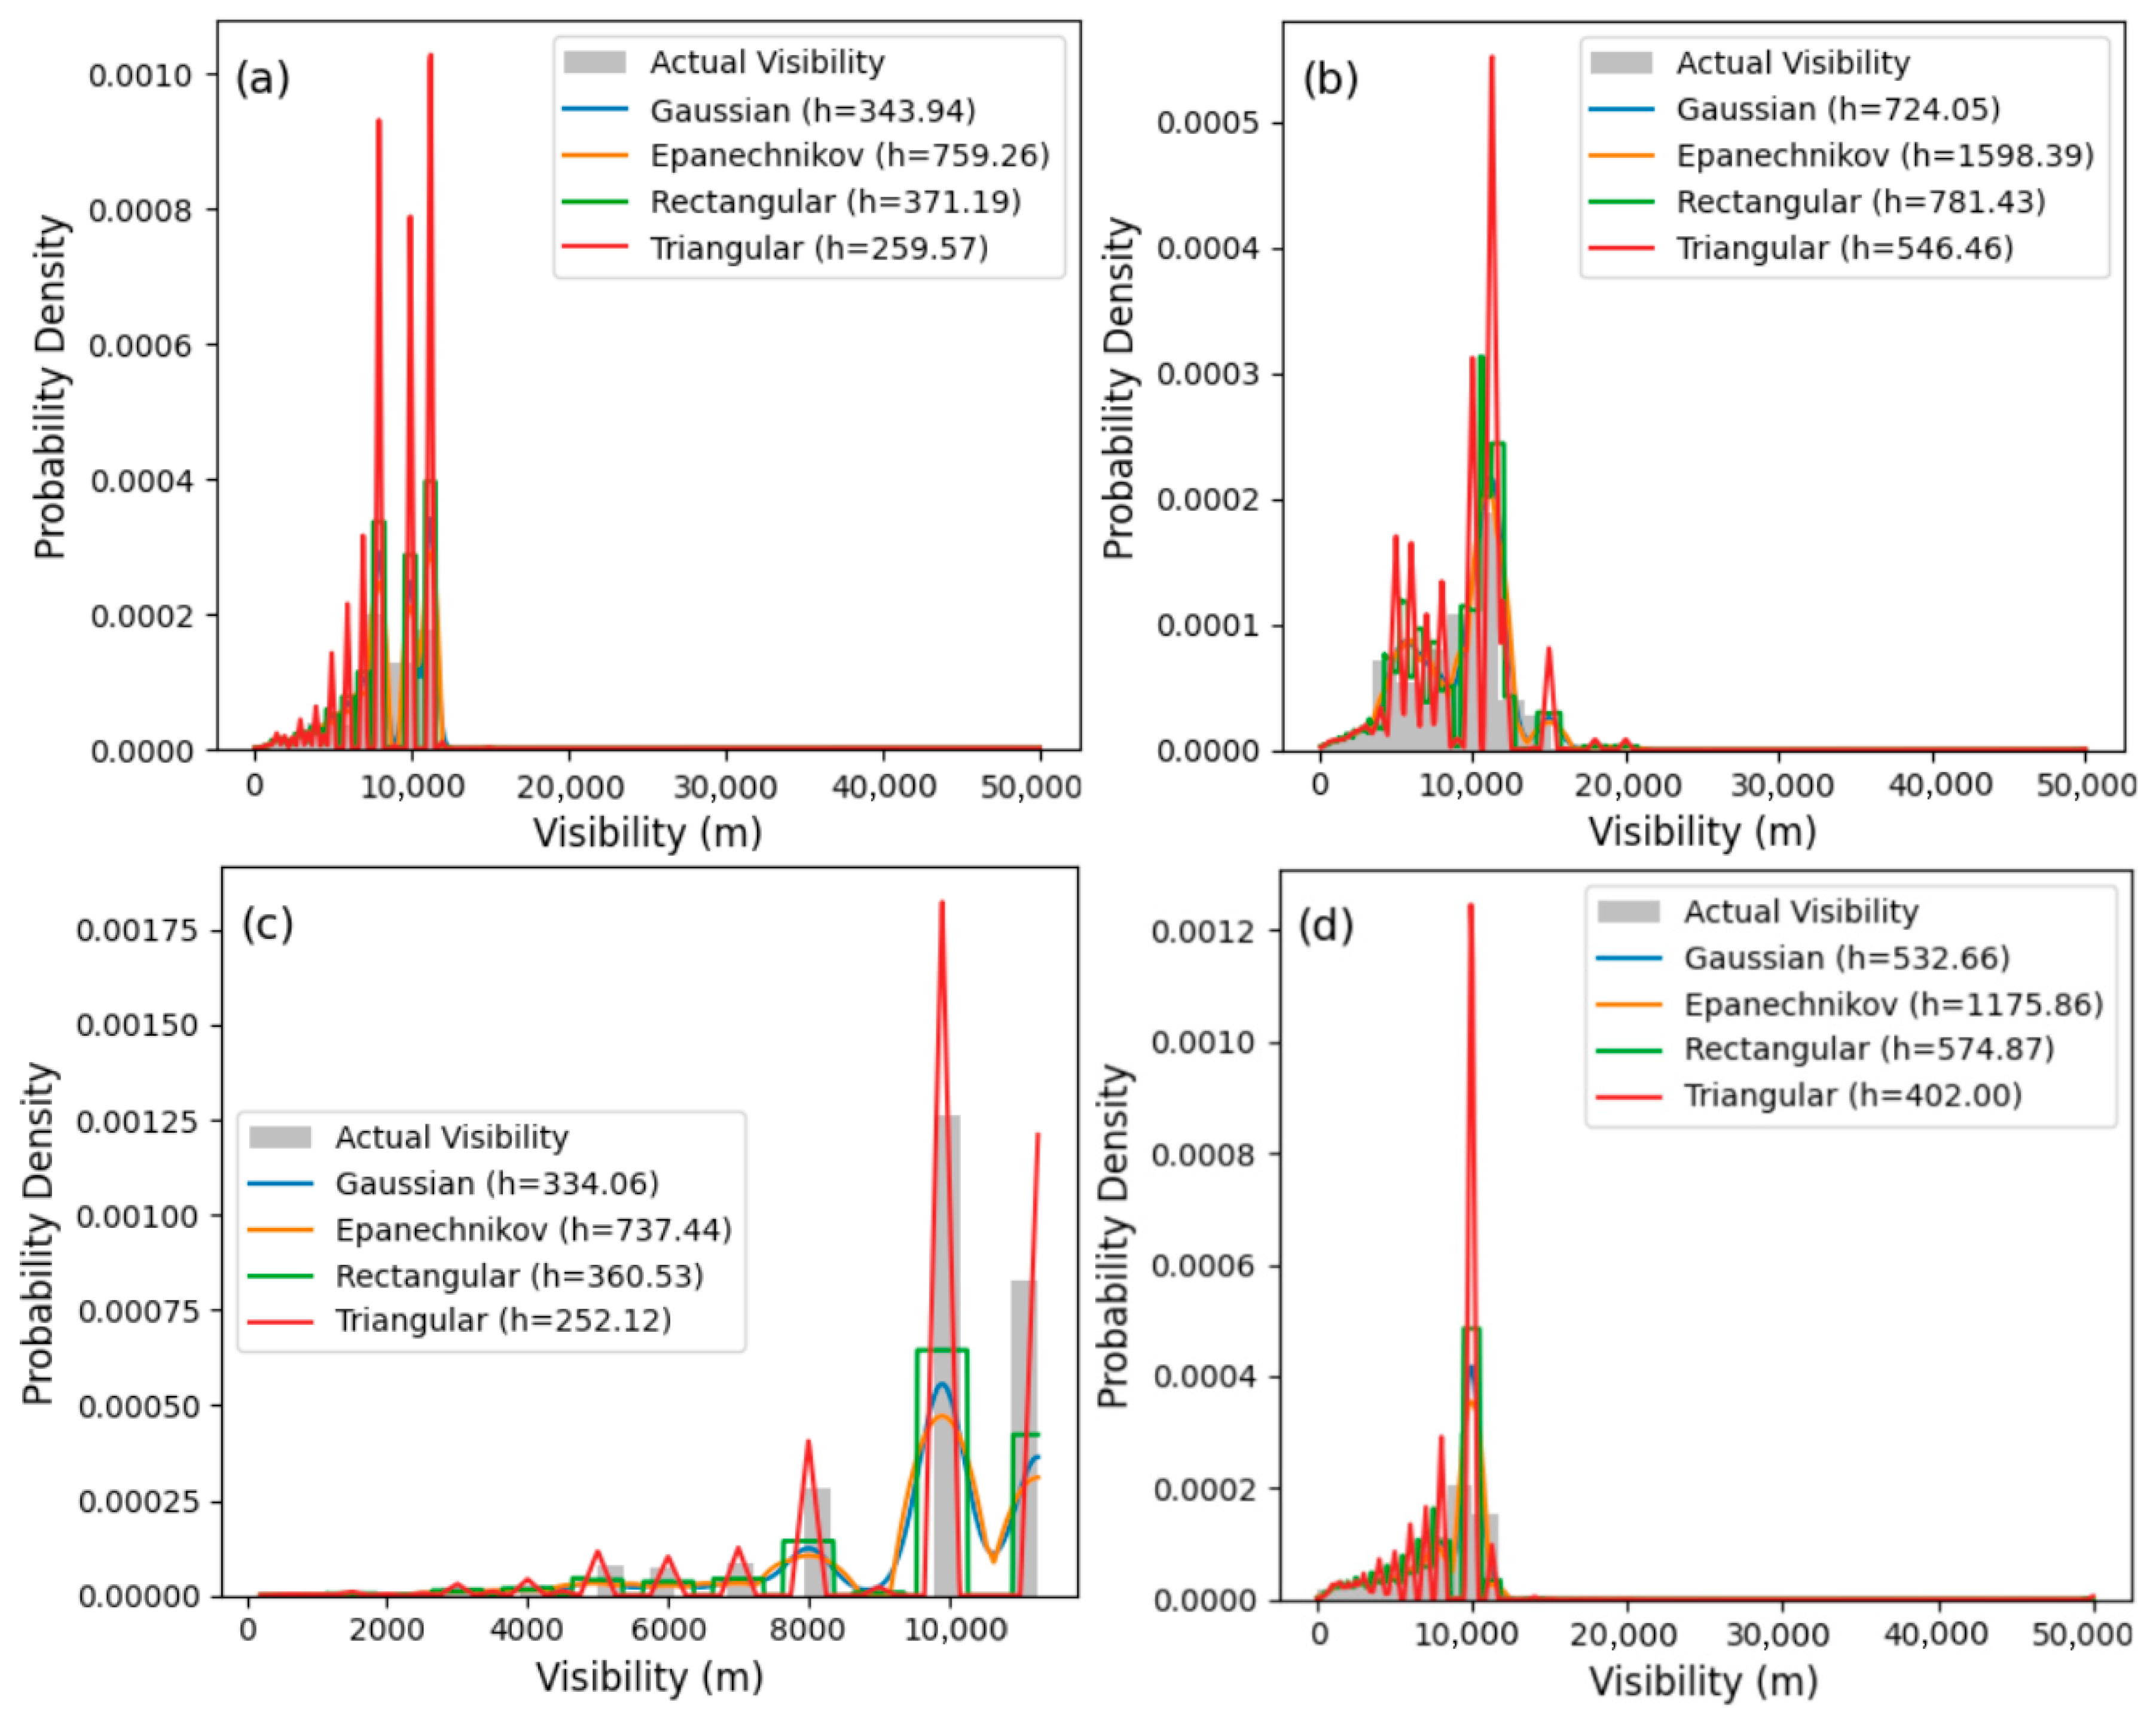
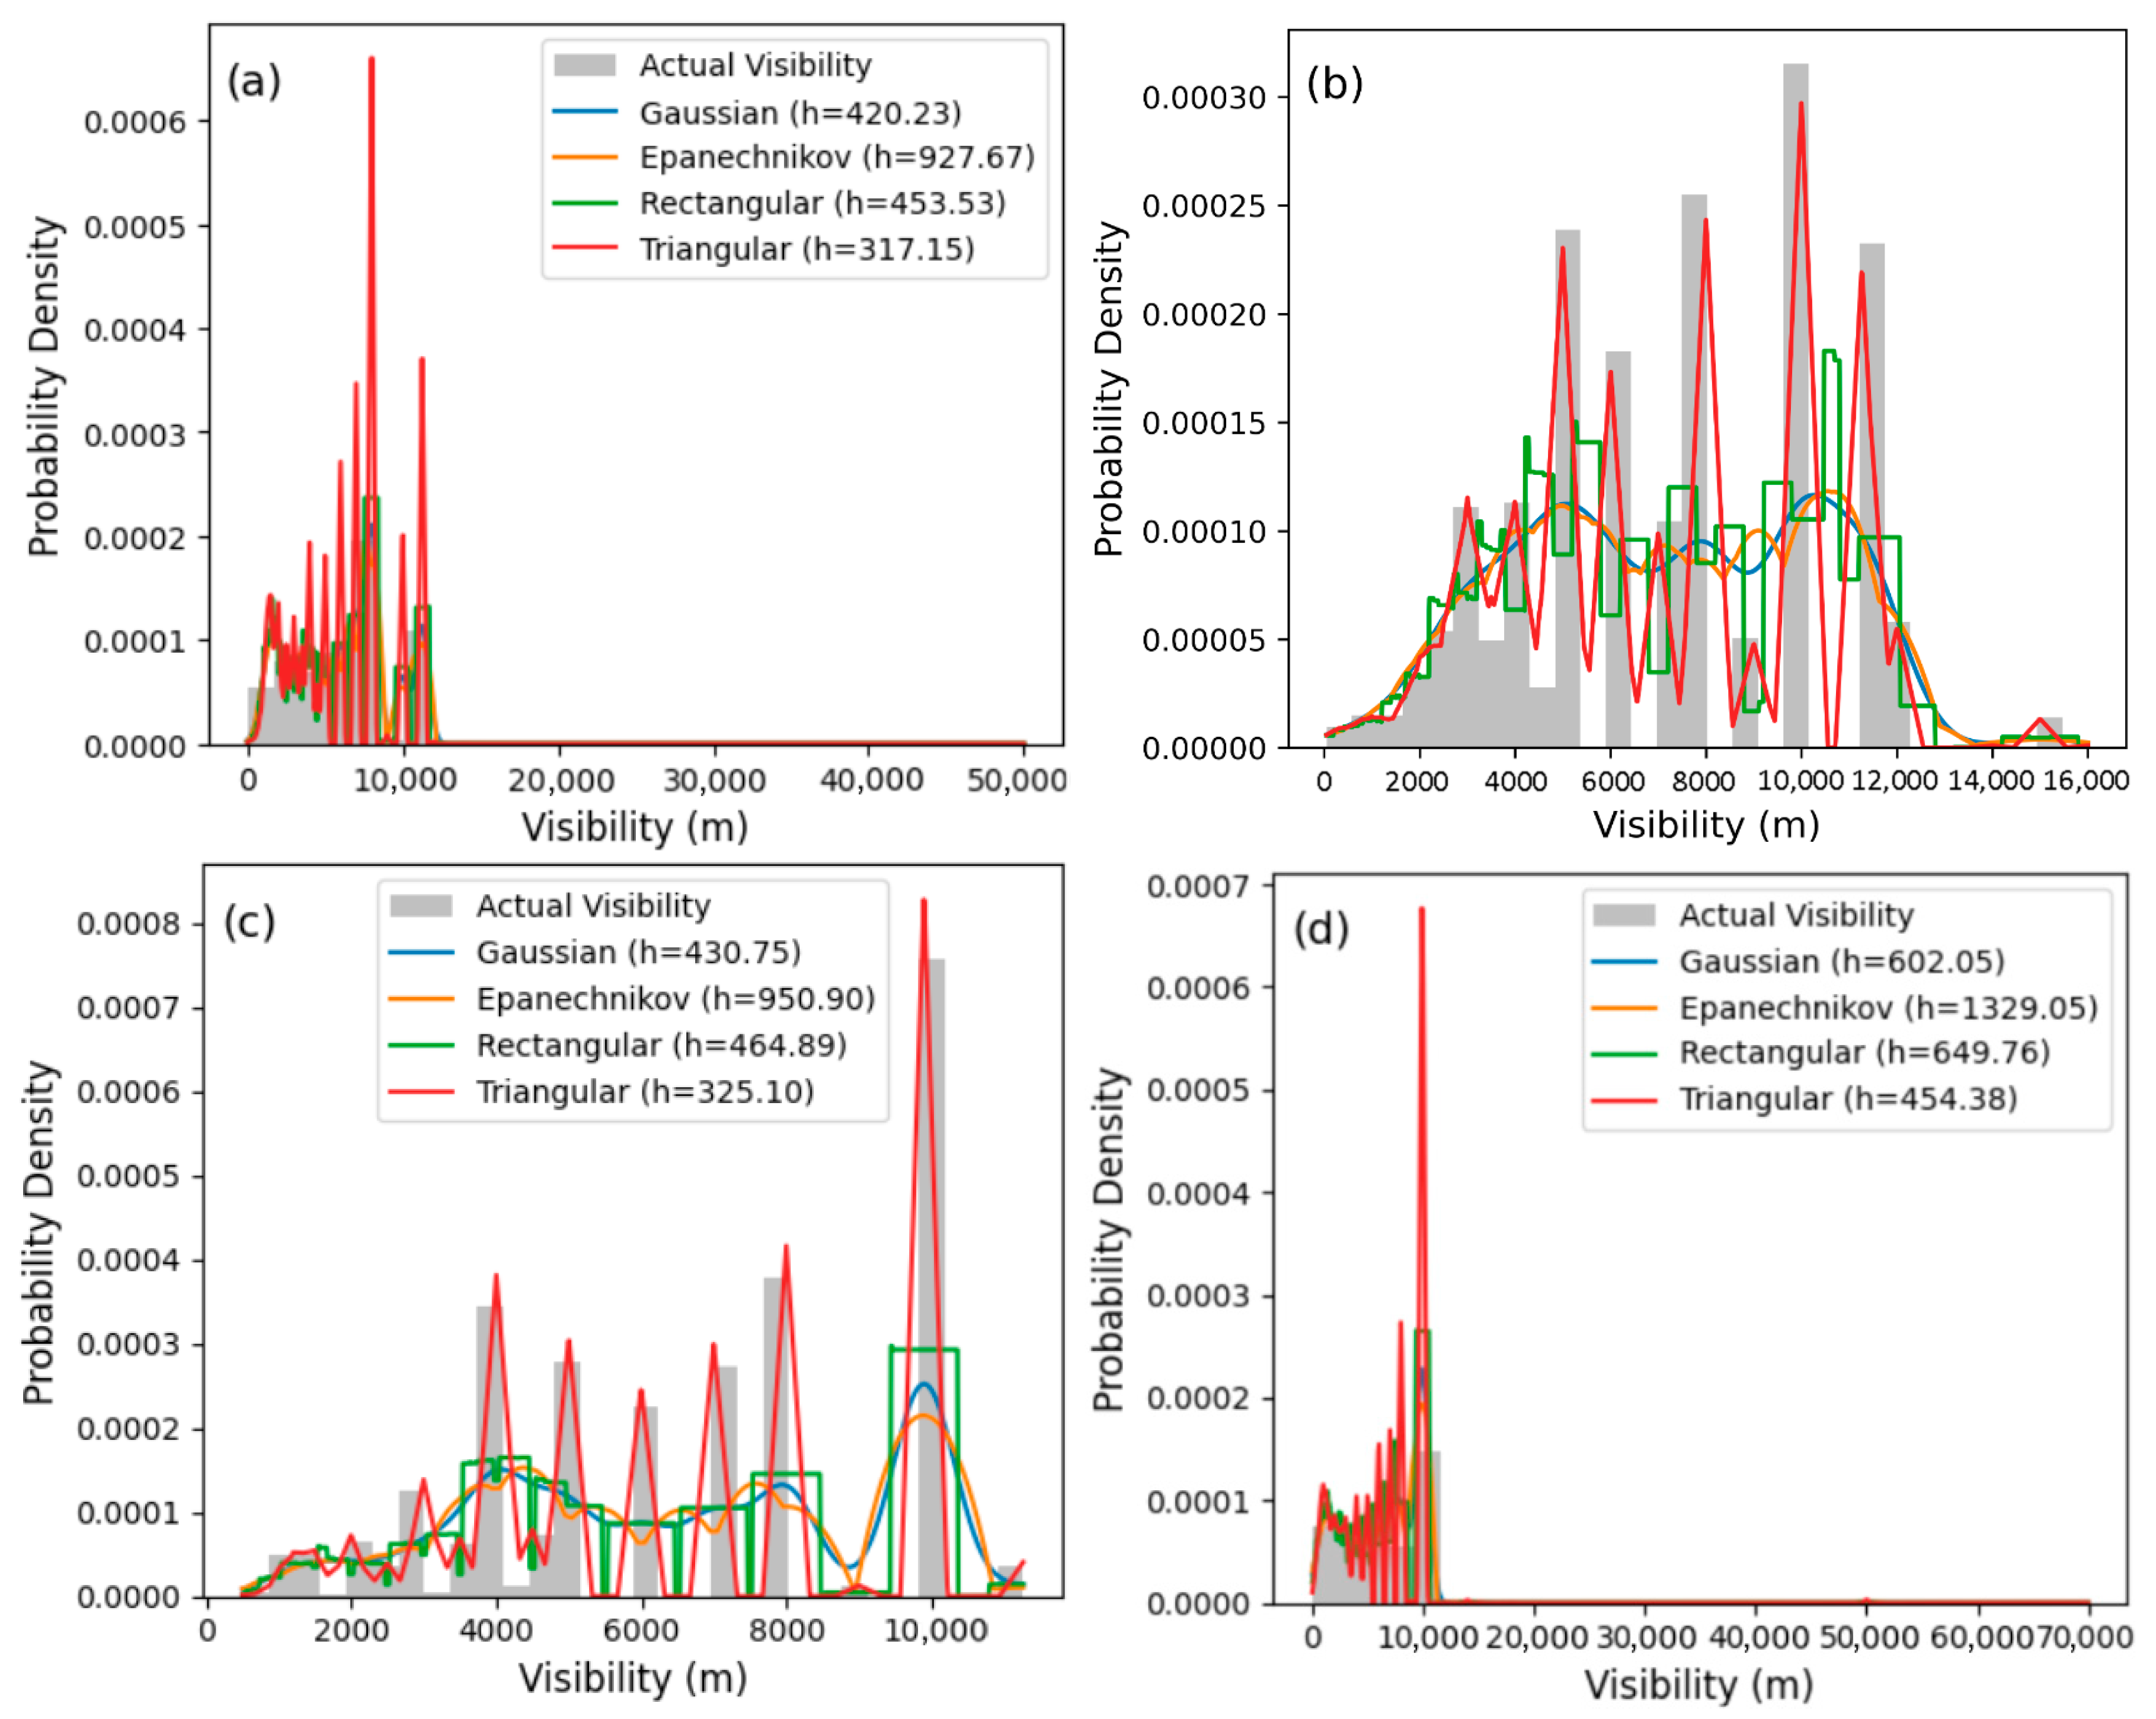
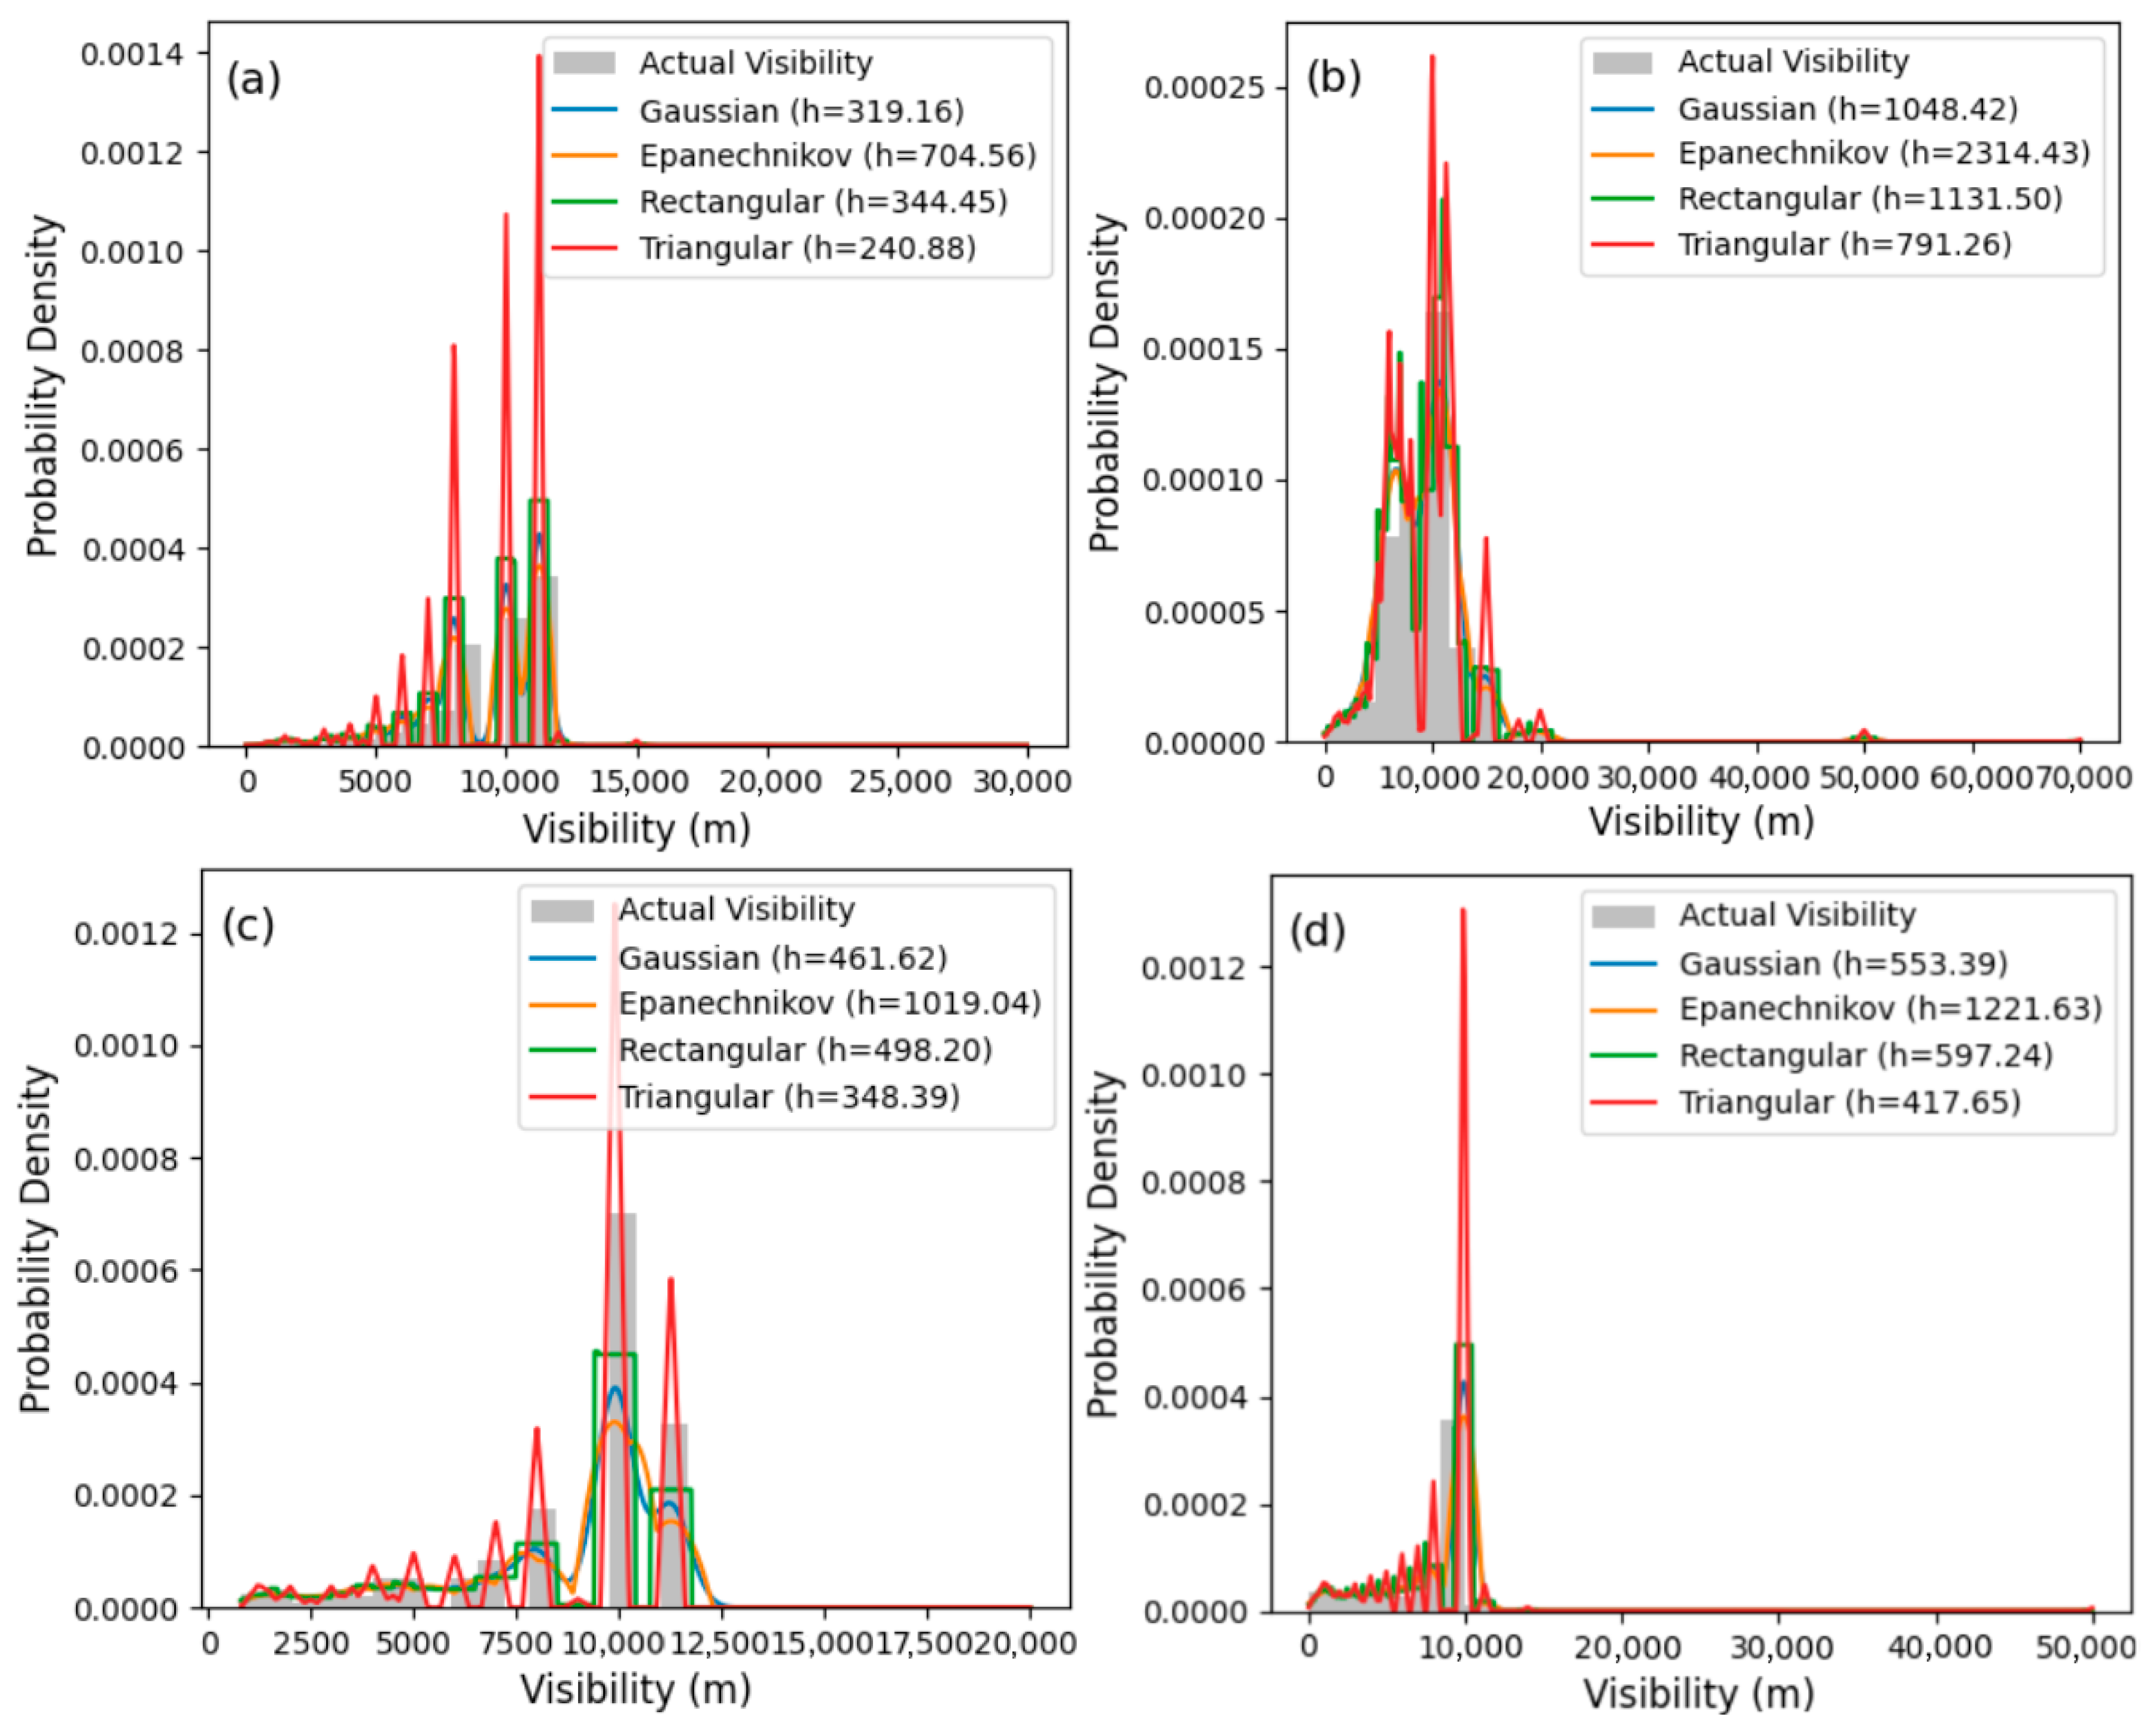
The Gaussian, Epanechnikov, rectangular, and triangular kernels of KDE were deployed for the estimation of seasonal median visibility for each of the four-season classifications in Table 2 across all the stations. The probability density functions for the four stations in the LV wet, HV dry, LV wet and HV dry seasons are shown in Figure 4, Figure 5, Figure 6 and Figure 7, respectively. The actual seasonal visibility data is compared with the estimations obtained using different the Gaussian, Epanechnikov, rectangular, and triangular kernels.
Although each kernel has its unique optimum bandwidth, as shown in Table 4, the estimated visibilities are approximately equal but have significantly different ISEs, which were verified by the Friedman test. The triangular kernel has the sharpest fitting due to its low values of ISE among other kernels throughout the four seasons in all the stations, as depicted in Table 4. Moreover, the triangular kernel provides the best and most preferred estimation because it possesses the lowest optimum bandwidth among other kernels. This is clearly evidenced by the triangular kernel trend lines and legends in Figure 4, Figure 5, Figure 6 and Figure 7. The low values of the ISEs for all the kernels indicate that the KDE methods provide good estimation of the seasonal visibility relative to the actual seasonal visibility values.
Figure 4a–c display the probability density functions (PDFs) of visibility during the low-visibility (LV) wet season period for Ikeja, Calabar, Abuja, and Kano, respectively. This implies that the mean atmospheric visibility for all the study stations could be classified as very light mist. Visibility is concentrated below 10 km, with a significant spike around 6–8 km in Ikeja. Although the Gaussian and Epanechnikov kernels provide a sharp fit at the edges in approximating the actual visibility distribution, the triangular kernel has the smoothest fit. Similar occurrences were observed in other stations, but visibility has a broader variability in Calabar, with peaks between 6 and 15 km. Variability is more evenly distributed in Abuja, with a lower range of 4 to 10 km, as depicted in Figure 4c. Figure 4d shows that Kano has the lowest range of 4 to 8 km, with sharp peaks likely due to significant atmospheric dust or particulate matter during the LV wet season.
Figure 5a–d present the PDFs of the four locations in the HV wet season. In Ikeja, visibility is concentrated below 15 km, with sharp peaks around 6–10 km. This reflects improved atmospheric conditions as a result of temporary rain downpour (August break) during the HV wet season compared to the LV period in the wet season. The visibility in Calabar is clearer, with higher variability between 10 and 20 km indicating clearer atmospheric conditions due to consistent rainfall and proximity to the Atlantic Ocean. The consistent rainfall implies that the presence of cloud formation only lasts for a very short period. In Abuja, visibility is distributed between 6 and km, with a significant concentration around 8–10 km as depicted in Figure 5c. This reflects moderate wet season conditions, where rainfall reduces dust particles in the atmosphere. Visibility is concentrated below 10 km, with sharp peaks around 7 km in Kano. The relatively lower visibility in Kano compared to other locations is likely due to the combination of lingering dust and moderate wet season rainfall in Sahel savannah [54]. The triangular kernel aligns closely with the actual visibility data with sharp peaks. The Gaussian and Epanechnikov kernels provide smoother approximations while the rectangular kernel has the lowest performance across all stations in the HV wet season.
The PDFs for the four kernels in the four stations during the LV dry season are presented in Figure 6a–d. Visibility in Ikeja is primarily concentrated below 10 km, with peaks around 5–7 km. This reflects the influence of the Harmattan, where dust particles transported by the hot wind from the Sahara significantly reduce visibility. In Calabar, visibility is distributed more evenly, with a broader range spanning 2 to 15 km, as depicted in Figure 6b. The coastal stations moderate the impact of the Harmattan due to higher humidity and less dust deposition during the LV dry season. This is corroborated by the work of Balarabe et al. [49], who reported that coastal areas experience less-severe visibility reduction during the Harmattan season compared to inland regions. Visibility shows considerable variation, with notable peaks between 4 and 10 km. Figure 6c shows that a significant drop in visibility below 5 km is evident, reflecting the inland influence of the Harmattan. Visibility is heavily concentrated below 10 km, with a strong peak around 5 km in Kano. This reflects intense Harmattan effects in northern Nigeria (Shahel) during the dry season. The lower visibility levels in Kano compared to other locations are attributed to its proximity to the Sahara Desert, where dust storms are more frequent [21,49]. The LV dry season corresponds to Harmattan conditions, marked by dry northeast trade winds carrying dust and reducing visibility. Coastal locations (Ikeja and Calabar) experience less severe reductions in visibility compared to inland (Abuja) and northern (Kano) regions. The triangular kernel captures sharp peaks effectively in almost all the stations with concentrated distributions. The Gaussian kernel provides a smooth fit across the stations, effectively capturing central trends. The Epanechnikov kernel performs well in capturing broader and less concentrated distributions, especially in Calabar and Abuja. The rectangular kernel is less accurate, with abrupt transitions that deviate from actual data patterns.
The performance of the kernels during the HV dry season is displayed in Figure 7a–d. Visibility is concentrated around 7–10 km, with a peak at approximately 8 km in Ikeja. Visibility spans a broader range, primarily concentrated between 10 and 20 km, with a peak near 12 km in Calabar as depicted in Figure 7b. The proximity of these stations to the coast and maritime air likely contributes to its higher visibility levels during the dry season. The relatively lower values observed in Ikeja may be attributed to smoke emissions from combustion engines and other industrial activities in the densely populated city. In Abuja, visibility peaks around 10 km, with significant variability between 7 and 12 km. The improved visibility during the HV dry season is a result of reduced humidity and moderate dust levels compared to the LV dry season. Visibility in Kano is consistently below 10 km, with a peak near 8 km. Despite being in the HV dry season, Kano’s visibility was limited compared to southern coastal regions due to its proximity to dust sources in the Sahara Desert. The triangular kernel aligns closely with the actual data, capturing the sharp peaks effectively. The Gaussian and Epanechnikov kernels provide smoother but slightly less accurate approximations for sharp peaks. The rectangular kernel is less accurate, especially in the savannah stations.

3.5. Variation in Fog-Induced Specific Attenuation with Visibility at Different Wavelengths

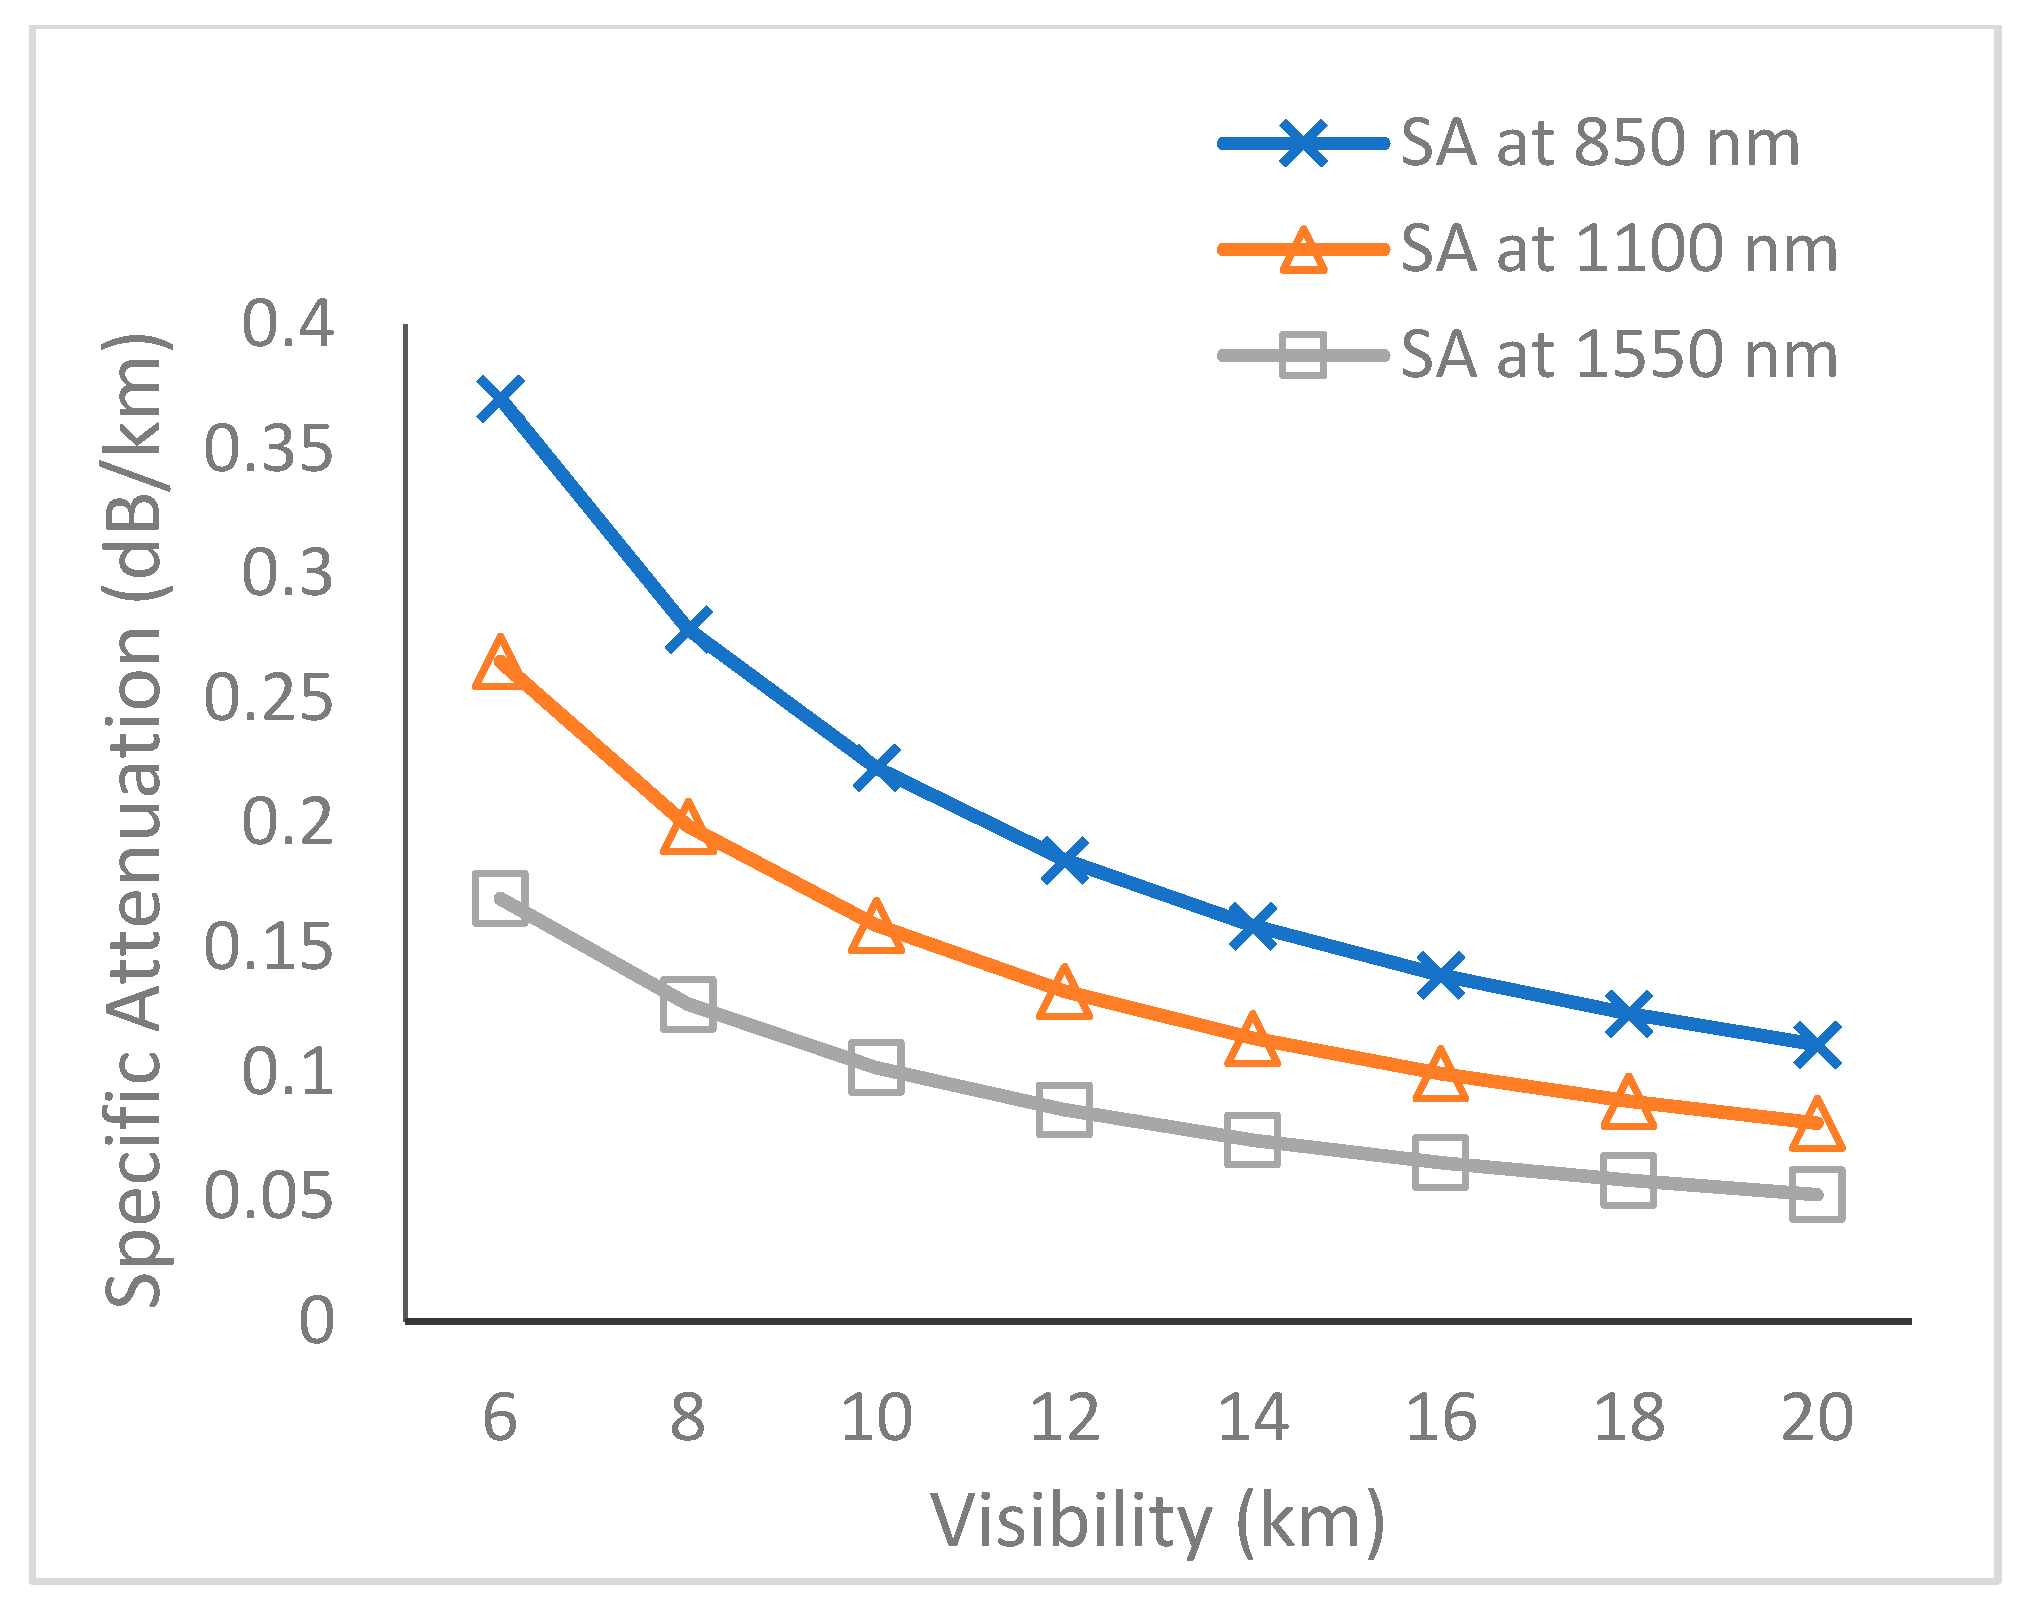
The variation in the computed fog-induced specific attenuations with visibility at 850 nm, 1100 nm, and 1550 nm are presented in Figure 8. It can be observed that specific attenuation decreases with increasing visibility at all wavelengths. This is because lower visibility is usually caused by a higher concentration of fog or cloud in the atmosphere, which results in higher scattering and absorption of the optical signals, hence higher specific attenuation.
The 850 nm wavelength curve, which is the shortest wavelength, exhibits the highest specific attenuation at all visibility levels because electromagnetic waves of shorter wavelengths are more susceptible to scattering effects, particularly Mie scattering, which dominates in foggy conditions [33]. The 1100 nm wavelength curve shows a lower attenuation compared to 850 nm because its wavelength is longer, hence the attenuation values lie between 850 nm and 1550 nm at all visibility levels. The lowest specific attenuation is observed at 1550 nm because longer wavelengths are less affected by scattering, making them more robust for optical communication during foggy conditions. At a low visibility of about 6 km, specific attenuation at 850 nm, 1100 nm, and 1550 nm is 0.4 dB/km, 0.25, and 0.15 dB/km, respectively. At a moderate visibility of about 10 km, which is the approximate prevailing annual mean visibility at all the study stations, the specific attenuations at 850 nm, 1100 nm, and 1550 nm are 0.22 dB/km, 0.16 dB/km, and 0.10 dB/km, respectively. At a high visibility of about 20 km, the specific attenuation at 850 nm, 1100 nm, and 1550 nm is 0.05 dB/km, 0.03, and 0.01 dB/km, respectively. This is a rare, severe condition that usually lasts for a short period, and it can result in total signal outage in optical communication.

3.6. Estimation of Seasonal Fog-Induced Specific Attenuation for FSO Communication

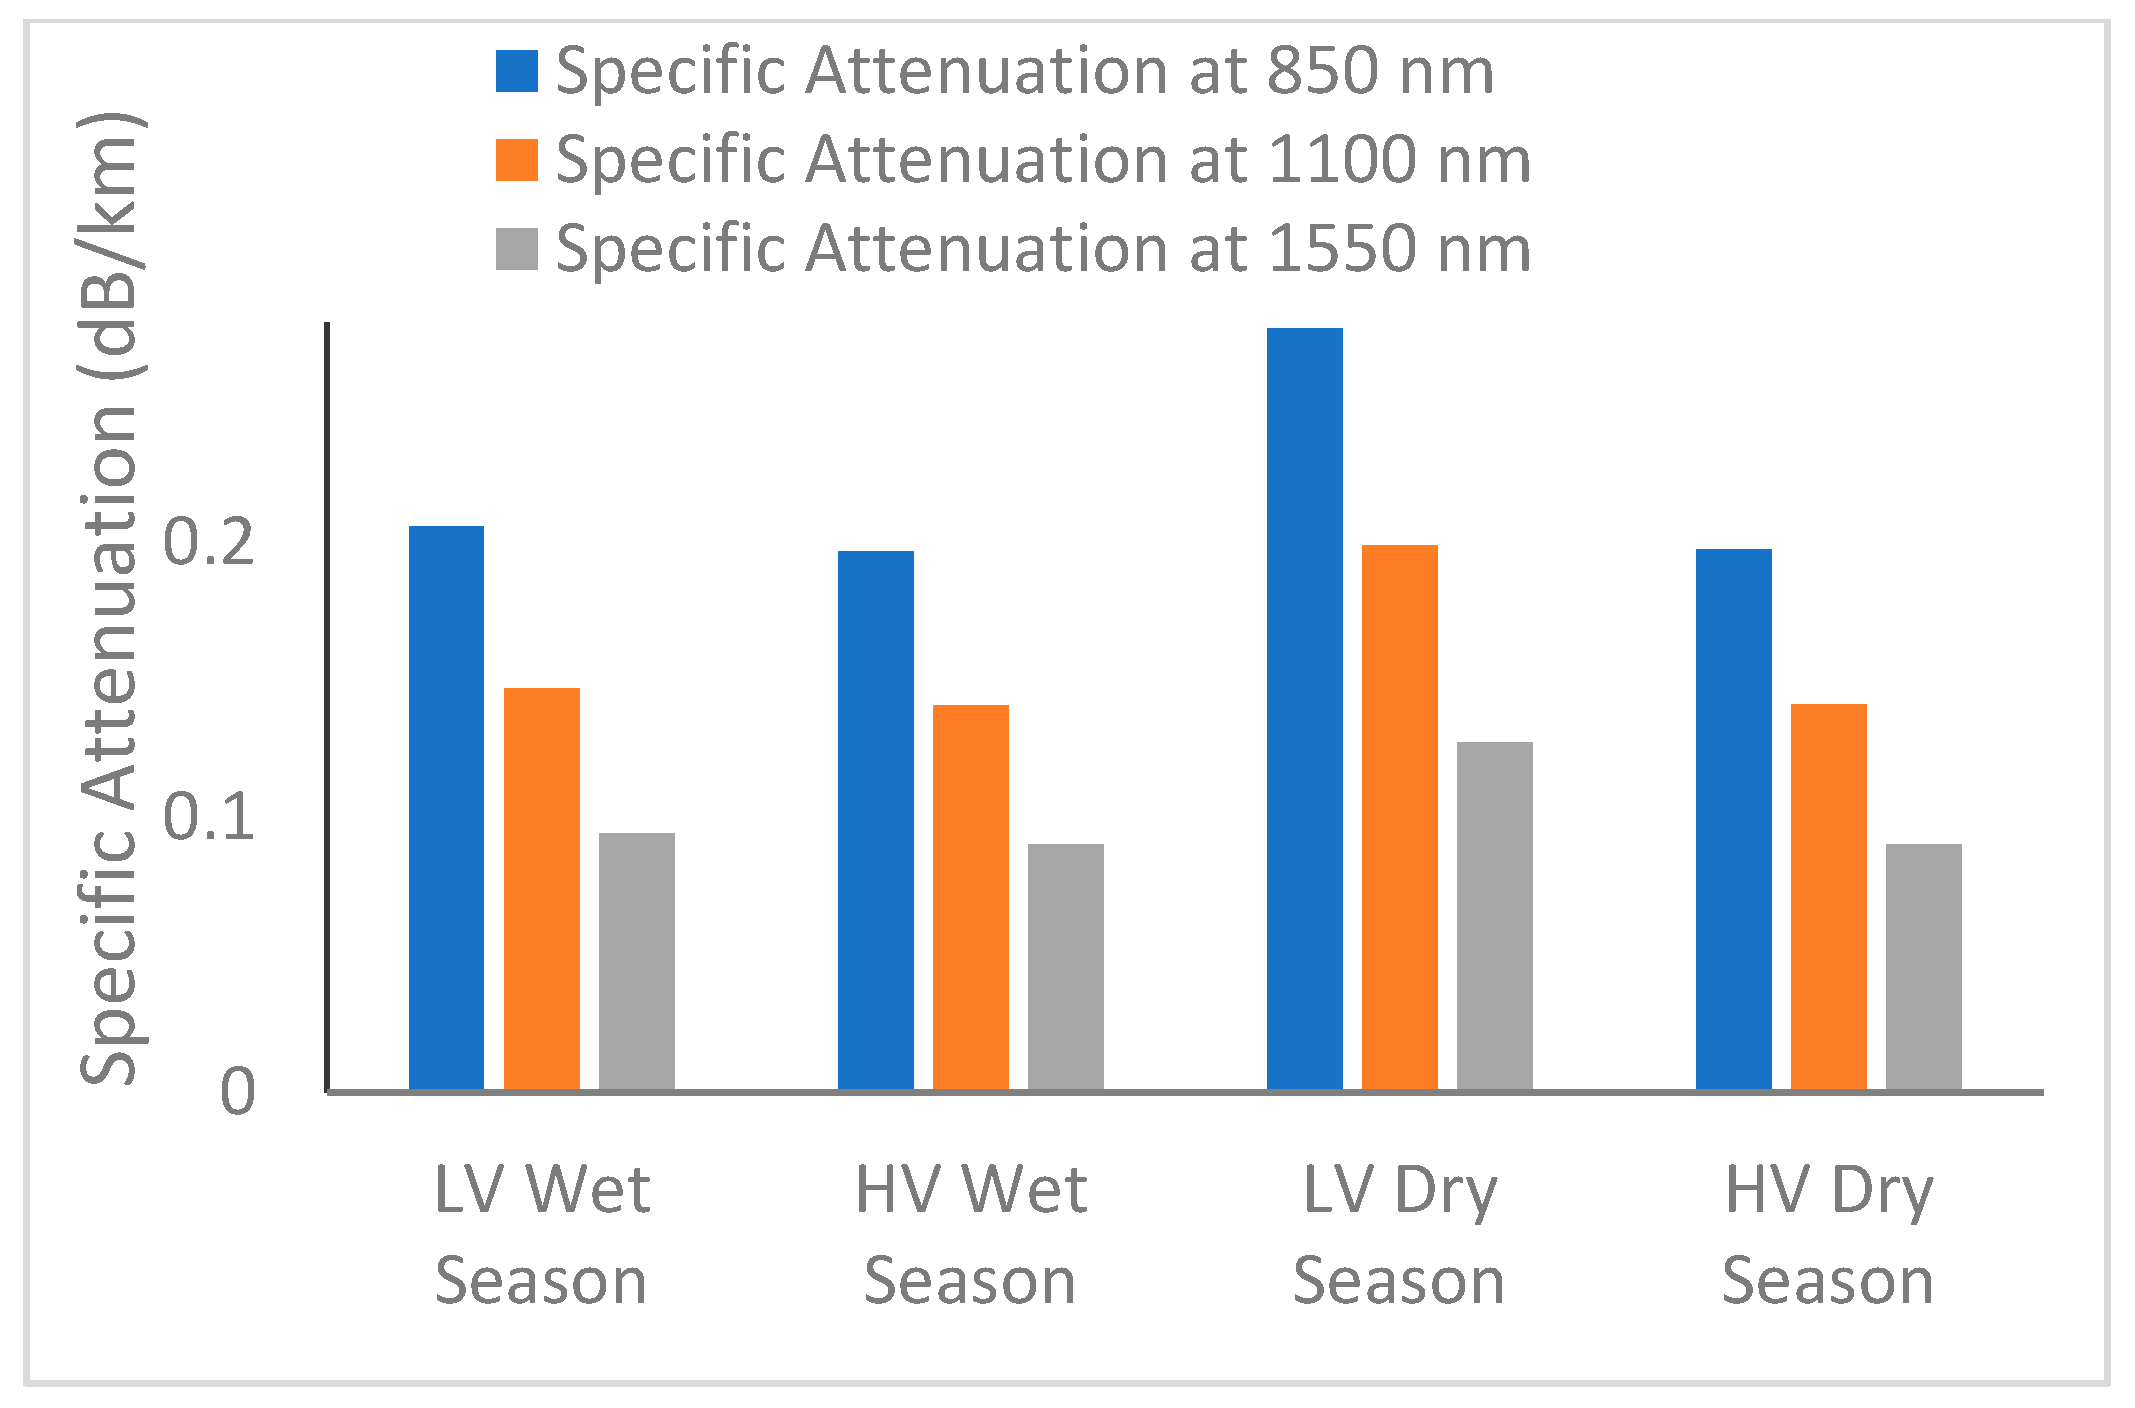
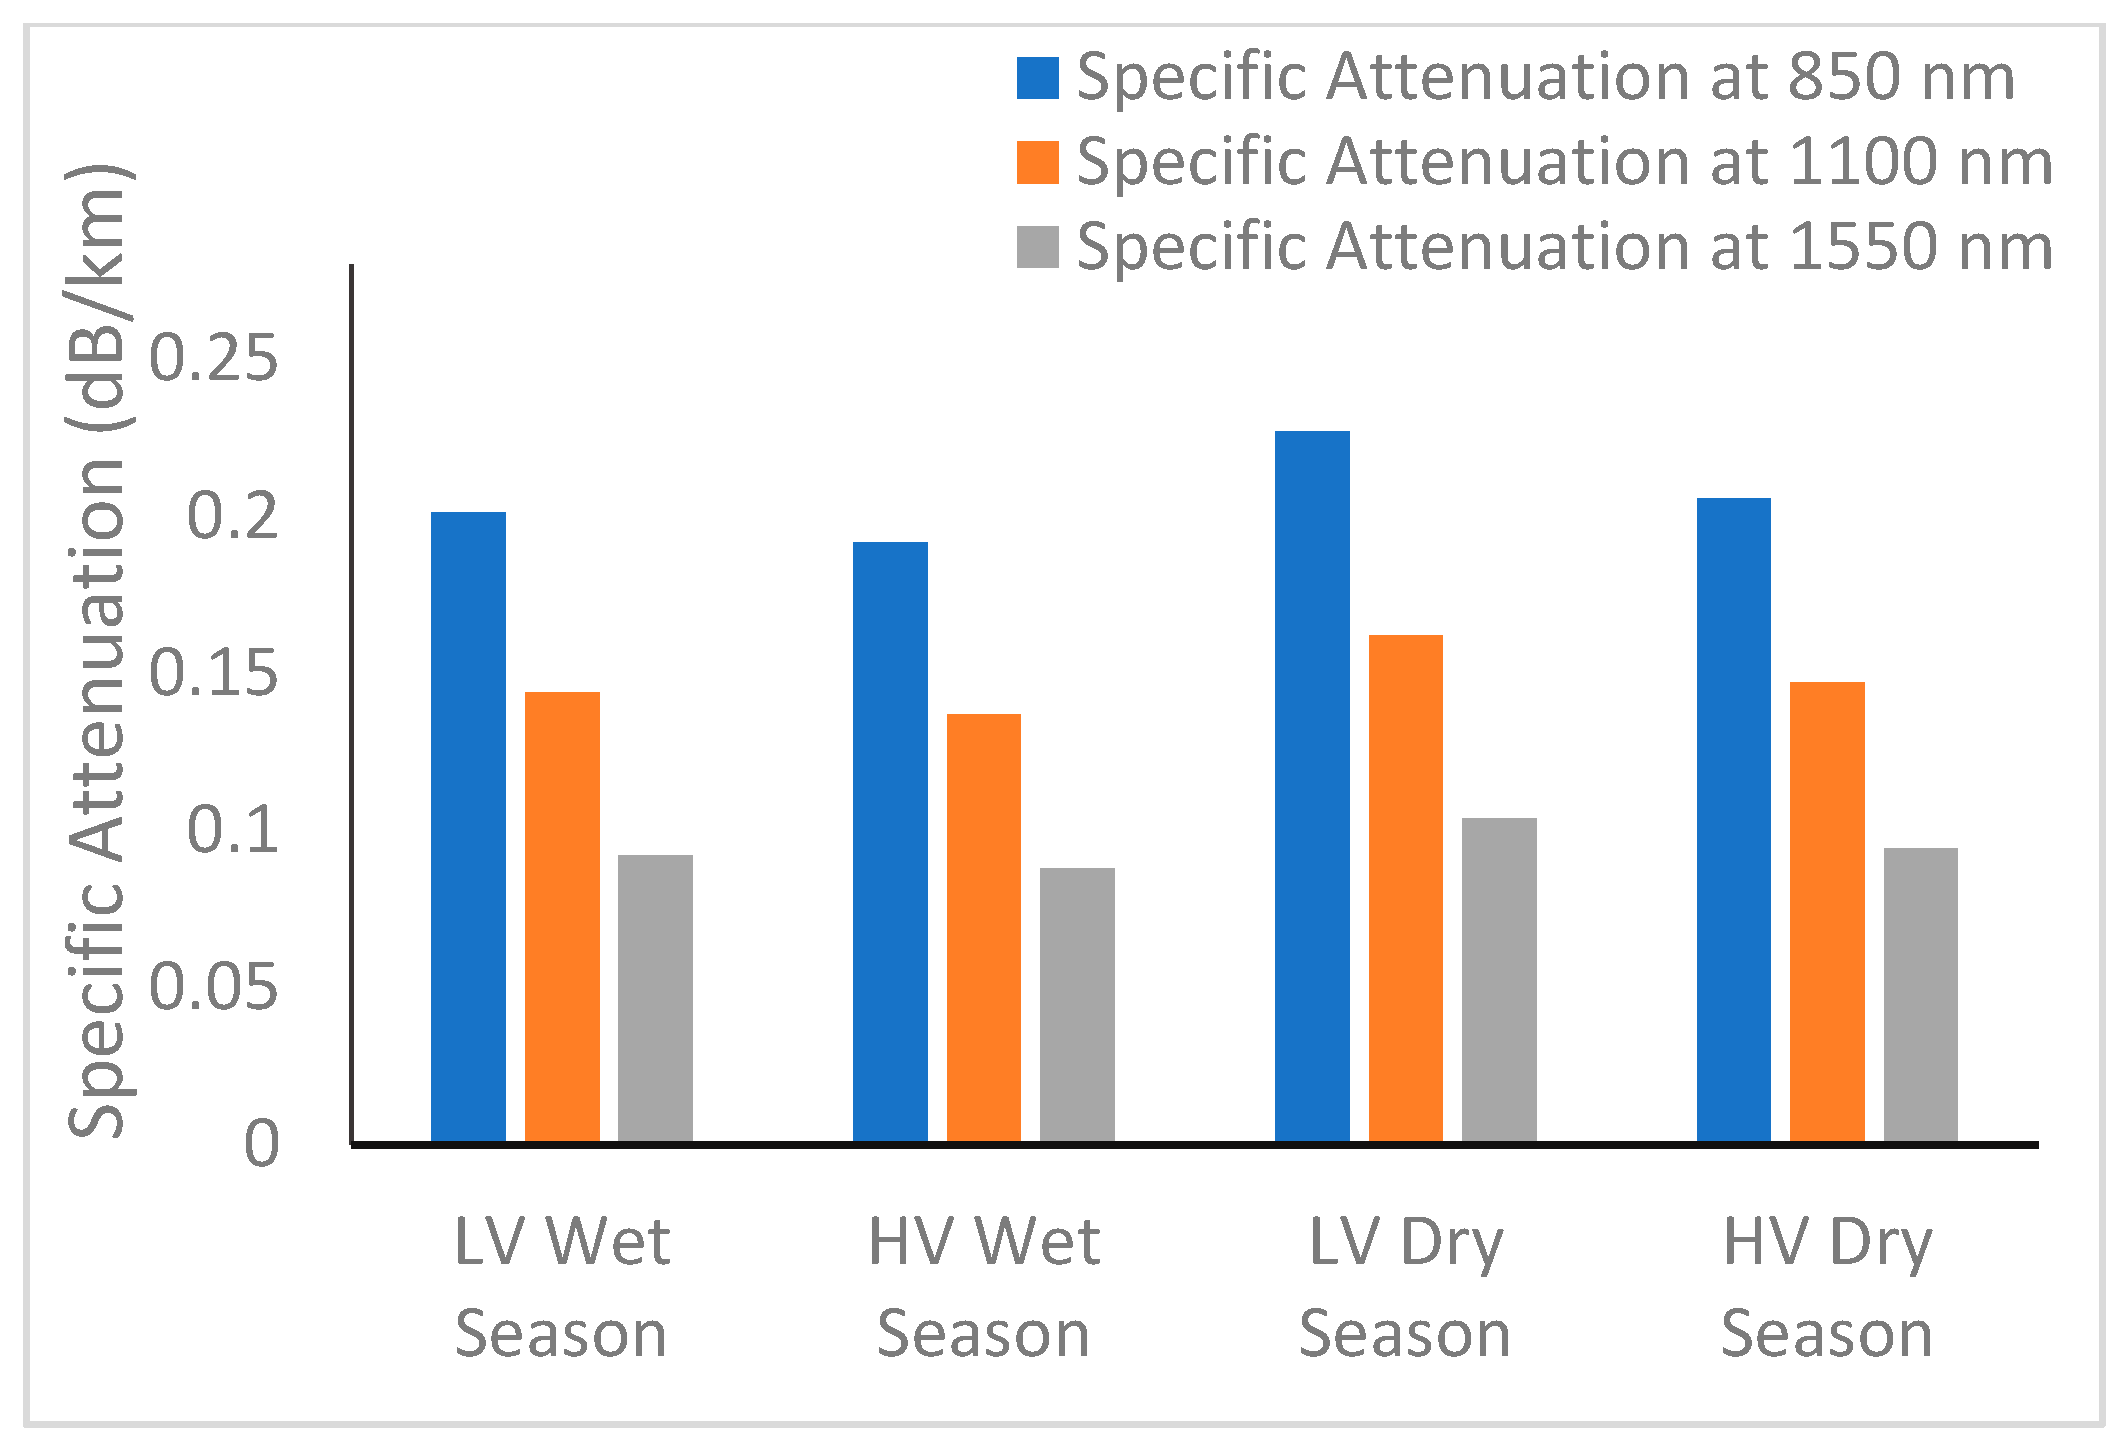
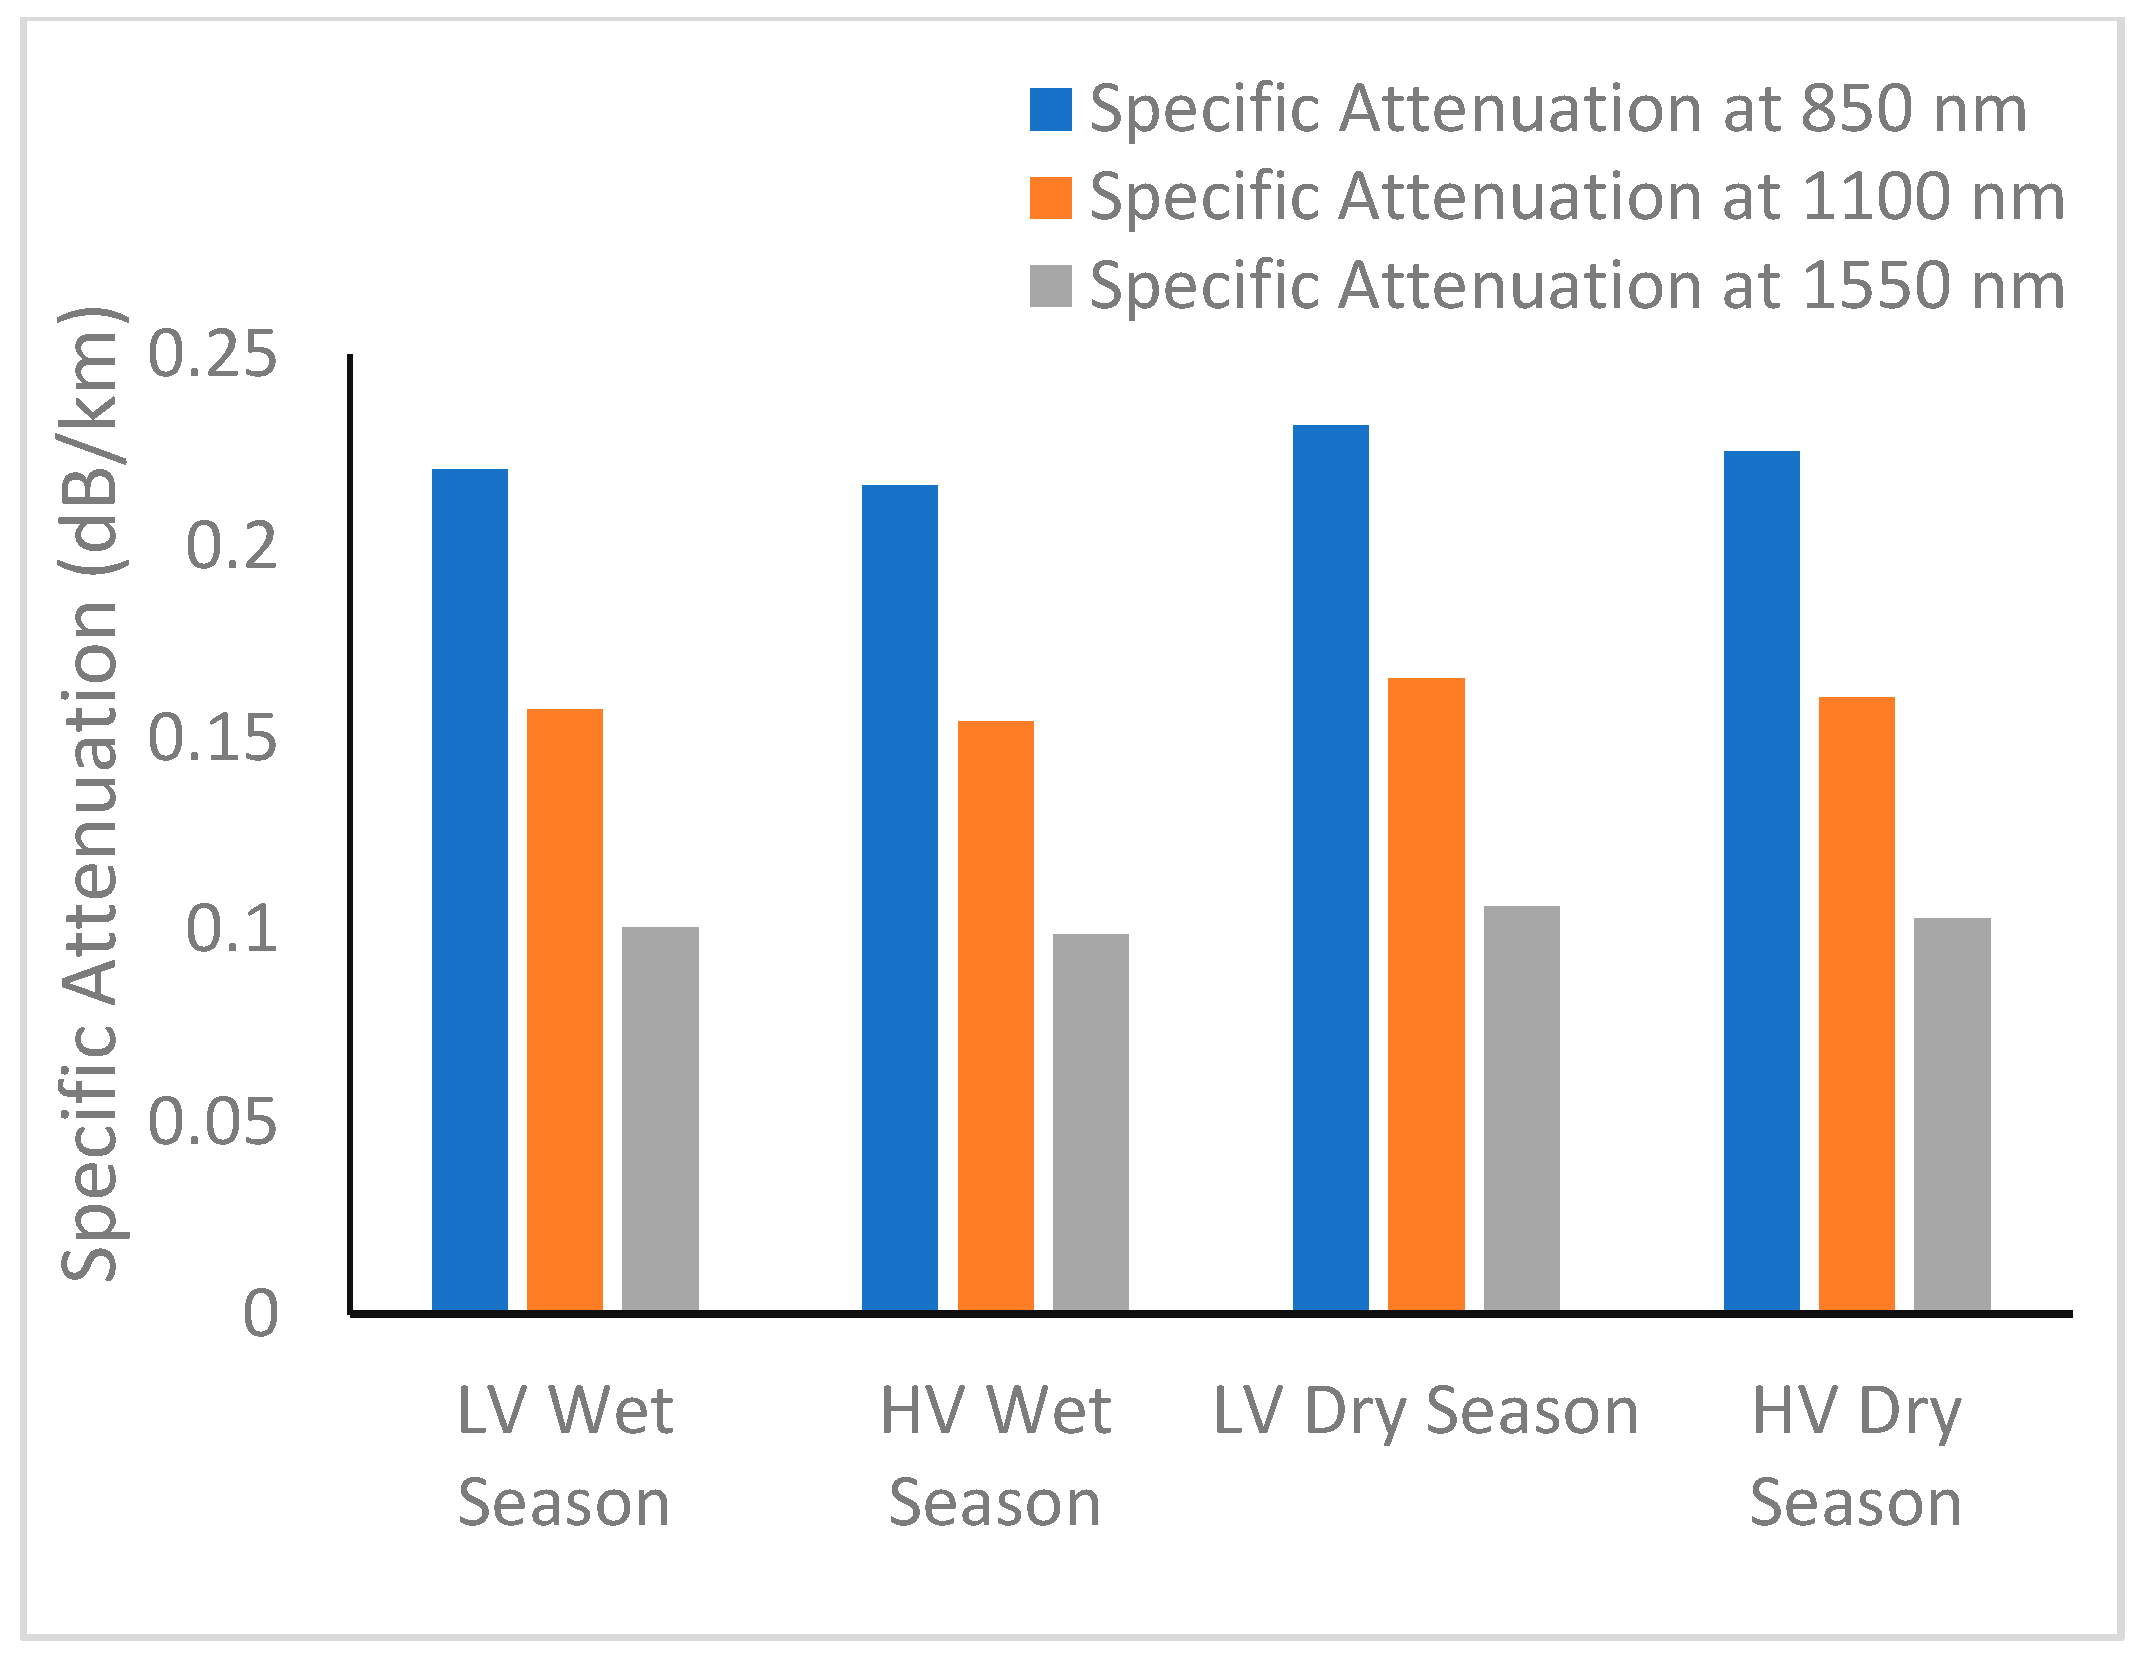
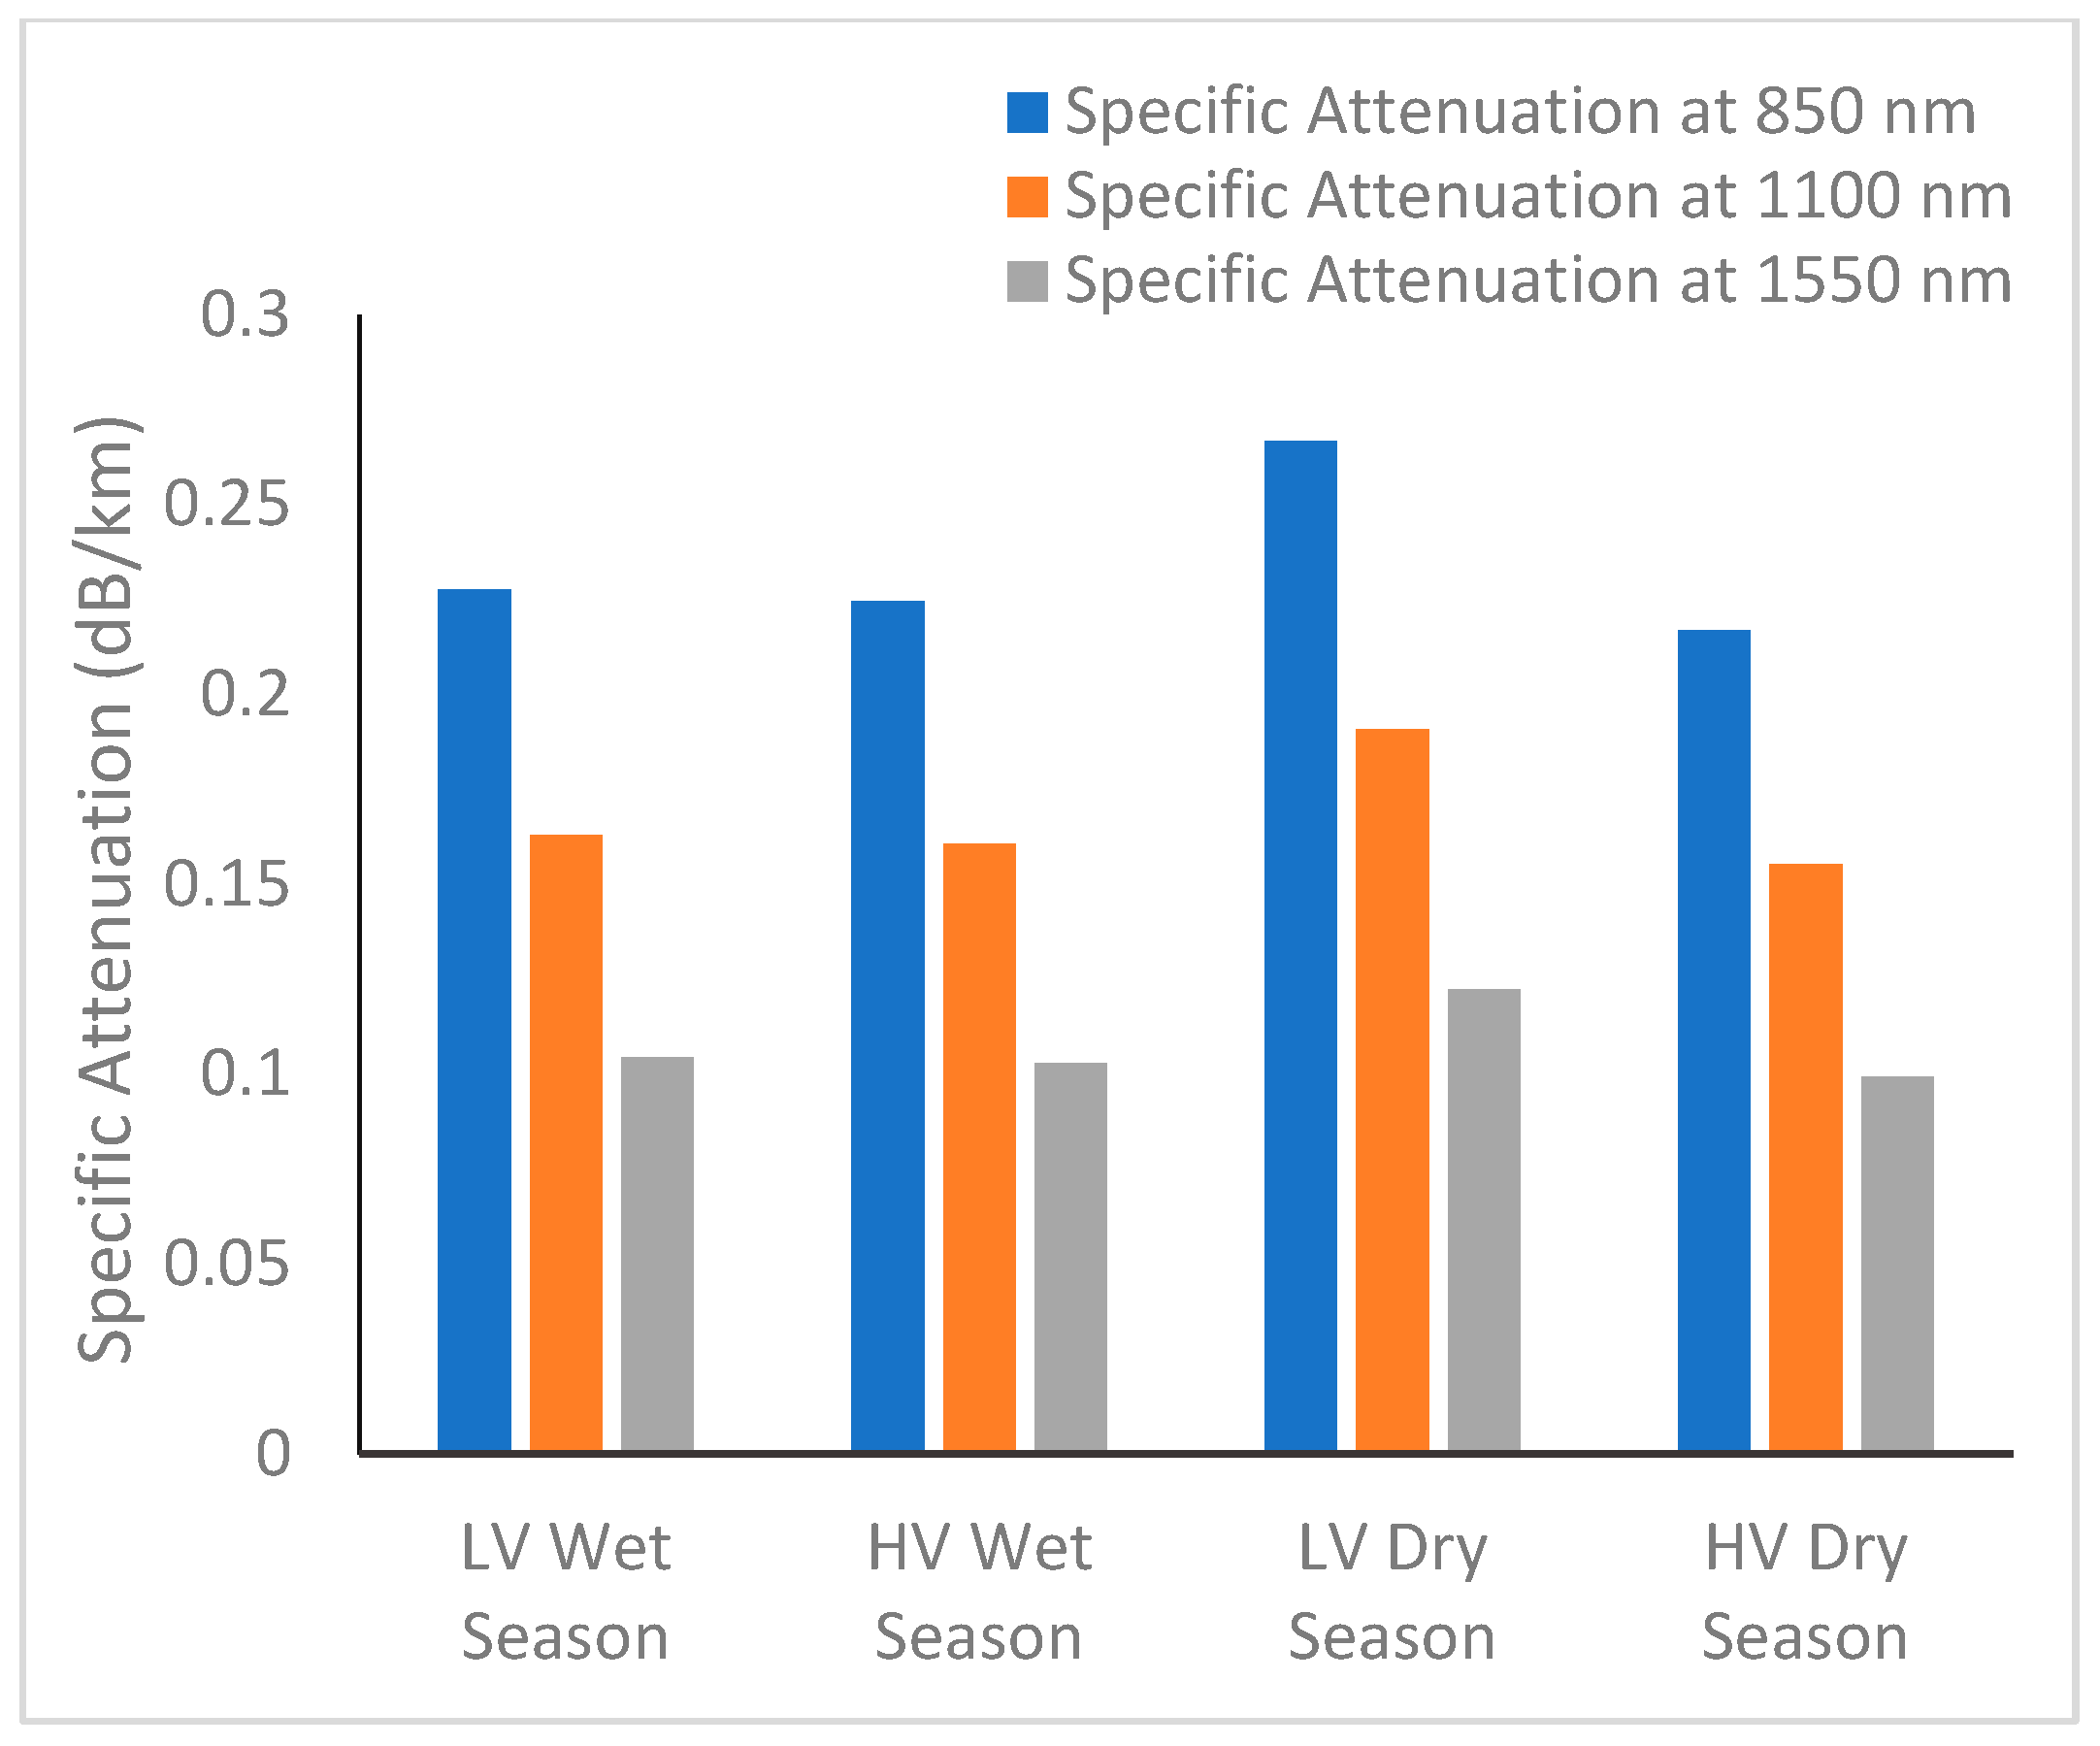
The seasonal fog-induced specific attenuation for free-space optical (FSO) communication at the three wavelengths (850 nm, 1100 nm, and 1550 nm) across the four Nigerian cities, Ikeja, Calabar, Abuja, and Kano, are presented in Figure 9, Figure 10, Figure 11 and Figure 12, respectively. Generally, the LV dry season witnesses the highest specific attenuation across all wavelengths due to high concentration of dust-laden wind, and particulate matter in the atmosphere. Attenuation is slightly lower in the LV wet season due to the presence of rainfall and humidity. Specific attenuations further reduced in the HV wet season compared to the LV wet season, but were moderately affected by cloud. The lowest specific attenuation prevails in the savannah stations during the HV dry season but occurs during the HV wet season in the coastal stations, indicating different favorable seasons for FSO communication.
Specifically, Ikeja possesses the highest attenuation of about 0.27 dB, 0.19 dB, and 0.13 dB, witnessed during the LV dry season at 850 nm, 1100 nm, and 1550 nm, respectively. These values decreased slightly in the HV dry season compared to the LV dry season, reflecting the influence of improved visibility, after which it increased in the LV wet season, though moderated by humidity and cloud formation, but remained the lowest at 1550 nm. The lowest attenuation dominates in the HV wet season across all wavelengths, with values of about 0.20 dB/km for 850 nm, 0.14 dB for 1100 dB/km, and 0.09 dB/km for 1550 nm. This is obviously due to the rare occasions of rainy events, the absence of the Harmattan, and dust-laden wind.
Similar seasonal trends were observed in Calabar because it also belongs to the coastal tropical zone. The highest specific attenuations of 0.22 dB/km, 0.16 dB/km, and 0.10 dB/km were recorded in the LV dry season, while lowest specific attenuations of 0.19 dB/km, 0.14 dB/km, and 0.08 dB/km were recorded in the HV wet season at 850 nm, 1100 nm, and 1550 nm, respectively.
The seasonal trend is different in Abuja, which is a midland savannah region. The specific attenuations are comparatively higher than those observed in the coastal stations, reflecting the inland effects of fog and reduced visibility. Maximum attenuation of about 0.23 dB/km, 0.17 dB/km, and 0.11 dB/km occurred in the LV dry season at 850 nm, 1100 nm, and 1550 nm, respectively. This is due to the combined effects of fog, haze, and dust from the surrounding terrain during the LV dry season [55]. A minimum attenuation of about 0.21 dB/km was recorded for 850 nm, 0.15 dB/km for 1100 nm, and 0.09 dB/km for 1550 nm in the HV wet season. This implies that the HV wet season is the most favorable season for FSO communication in Abuja.
The seasonal variation in specific attenuation in Kano follows the same trend as Abuja, most likely because the two stations are situated in the savannah region. Kano witnessed the highest attenuations among all stations and seasons in the LV dry season with values of 0.27 dB/km, 0.19 dB, and 0.12 dB/km at 850 nm, 1100 nm, and 1550 nm, respectively. The proximity of this station to the Sahara Desert increases the contribution of dust storms and particulate matter to fog-induced specific attenuation. Significant improvement in visibility reduced the specific attenuation in the HV dry season to a minimum of about 0.21 dB/km for 850 nm, 0.16 for 1100 dB/km, and 0.10 dB/km for 1550 dB/km. This implies FSO links propagating at any frequency in Kano suffer the most severe fog-induced attenuation among all the study stations.
The improvement of FSO communication systems under fog-induced attenuation conditions is highly necessary so that multimedia activities like satellite internet access, satellite television broadcasting, satellite radio broadcasting, and satellite-based video conferencing are not impaired in smart cities where uninterrupted high-speed wideband internet services are essential. Transmission optimization techniques such as adaptive frequency switching could be incorporated into FSO communication systems to optimize the Quality of Service (QoS), especially during the LV wet and dry seasons. The performance of smart infrastructure that utilizes technologies such as the NB-IoT, proposed by Ghoumid et al. [56] for seamless communication, can be enhanced by relying on efficient FSO communication links.

4. Conclusions

The seasonal variation in visibility was studied using four KDE techniques. The triangular kernel outperformed others, with very low ISE and the best optimum bandwidth in almost all the study locations. The visibility data was utilized to compute four-season fog-induced specific attenuations in the study locations. The results indicate that specific attenuation exhibits double peaks, occurring in both the LV dry and LV wet seasons due to low visibility. Conversely, low specific attenuations prevail during the HV dry and HV wet seasons, where improved visibility conditions enhance signal transmission. The major contributing factors to intense specific attenuation in the LV dry season are dust, haze, and particulate matter, particularly in the northern regions. High humidity, water vapor content, cloud cover, and vehicle emissions enhance specific attenuation in the LV wet season. Specific attenuation attained the highest value at the Sahel savannah (Kano) in the LV dry season, reaching about 0.27 dB/km at 850 nm, due to the influence of the Sahara Desert. The midland savannah station (Abuja) experiences moderate attenuation because visibility is temperate in the inland and central regions compared to the northern and coastal regions of Nigeria. The estimated specific attenuations are recommended for the design, implementation, and optimization of FSO communication links, ensuring robust and efficient localized optical transmission under varying atmospheric conditions in the selected regions. It is recommended that future work concentrates on improving attenuation models through the use of present meteorological data, machine learning predictions, and dynamic FSO system adaptations for reducing signal degradation when visibility deteriorates.

Author Contributions

Conceptualization, Y.B.L.; methodology, P.A.O.; software, P.A.O.; validation, M.A.S.; formal analysis, Y.B.L. and M.A.S.; investigation, Y.B.L. and O.L.O.; resources, C.T.; data curation, Y.B.L.; writing—original draft preparation, Y.B.L.; writing—review and editing, P.A.O., J.S.O. and O.L.O.; visualization, O.L.O.; supervision, C.T. and J.S.O.; project administration, C.T.; funding acquisition, Y.B.L., P.A.O. and C.T. All authors have read and agreed to the published version of the manuscript.

Funding

This research received no external funding.

Data Availability Statement

The NOAA visibility data used for this work is available at https://www.ncei.noaa.gov/access/search/data-search/global-hourly?pageNum=1 (accessed on 19 December 2024). The NiMet visibility data and Python code used for the analysis cannot be made publicly available due to NiMet’s data policy and the need to protect the authors’ intellectual property. However, the data and code can be obtained upon request from the author at lawalyb@tut.ac.za.

Acknowledgments

The authors would like to express their gratitude to the National Oceanic and Atmospheric Administration (NOAA) and the Nigerian Meteorological (NiMet) Agency for providing the data used in this research.

Conflicts of Interest

The authors declare no conflicts of interest.

References

  1. Viezee, W.; Lewis, R. Probing the Atmospheric Boundary Layer. Am. Meteorol. Soc. 1986, 44, 739. [Google Scholar] [CrossRef]
  2. González-Jorge, H.; Díaz-Vilariño, L.; Lorenzo, H.; Arias, P. Evaluation of driver visibility from mobile lidar data and weather conditions. ISPRS Int. Arch. Photogramm. Remote Sens. Spat. Inf. Sci. 2016, 577, 577–582. [Google Scholar] [CrossRef]
  3. Akanni, C.O.; Hassan, A.M.; Osuji, T. Empirical analysis of extreme weather conditions and aviation safety in Nigeria. Ethiop. J. Environ. Stud. Manag. 2016, 9, 680–690. [Google Scholar] [CrossRef]
  4. Balarabe, M.A.; Tan, F.; Abdullah, K.; Nawawi, M.N. Temporal-spatial variability of seasonal aerosol index and visibility—A case study of Nigeria. In Proceedings of the 2015 International Conference on Space Science and Communication (IconSpace), Langkawi, Malaysia, 10–12 August 2015; pp. 459–464. [Google Scholar] [CrossRef]
  5. Danlami, D.; Gwari, M.; Suleiman, S.A.; Bara, A. Temporal and spatial variations of ground surface visibility during Harmattan season in North-Eastern Nigeria. Ceylon J. Sci. 2018, 47, 337. [Google Scholar] [CrossRef]
  6. Koračin, D.; Dorman, C. (Eds.) Marine Fog: Challenges and Advancements in Observations, Modeling, and Forecasting; Early and Recent Observational Techniques for Fog; Springer: Berlin/Heidelberg, Germany, 2017; pp. 23–45. [Google Scholar] [CrossRef]
  7. David, N.; Alpert, P.; Messer, H. Novel method for fog monitoring using cellular networks infrastructures. Atmos. Meas. Tech. Discuss. 2012, 5, 5725–5752. [Google Scholar] [CrossRef]
  8. Nicholson, S.E. The West African Sahel: A review of recent studies on the rainfall regime and its interannual variability. ISRN Meteorol. 2013, 2013, 453521. [Google Scholar] [CrossRef]
  9. Kaur, S. Performance analysis of FSO link under the effect of fog in Delhi region, India. J. Opt. Commun. 2020, 44, s1385–s1393. [Google Scholar] [CrossRef]
  10. Nadeem, F.; Javornik, T.; Leitgeb, E.; Kvicera, V.; Kandus, G. Continental fog attenuation empirical relationship from measured visibility data. Radioengineering 2010, 19, 596–600. Available online: https://www.radioeng.cz/fulltexts/2010/10_04_596_600.pdf (accessed on 20 February 2025).
  11. Muhammad, S.K.; Muhammad, A.; Muhammad, S.A.; Abid, A.M.; Jawad, S.; Rahim, D. Statistical modeling of optical attenuation measurements in continental fog conditions. Opt. Eng. 2017, 56, 036113. [Google Scholar] [CrossRef]
  12. Verdugo, E.; Luini, L.; Riva, C.; Galzerano, G.; Resteghini, L.; da Silva Mello, L.; Nebuloni, R. Near-IR and Mid-IR wave propagation through patchy fog. In Free-Space Laser Communications XXXVI; SPIE: Bellingham, WA, USA, 2024; Volume 128771J. [Google Scholar] [CrossRef]
  13. Thurstain-Goodwin, M.; Unwin, D.J. Defining and delineating the central areas of towns for statistical monitoring using continuous surface representations. Trans. GIS 2000, 4, 305–317. [Google Scholar] [CrossRef]
  14. Lin, Y.; Chu, H.; Wu, C.; Chang, T.; Chen, C. Hotspot analysis of spatial environmental pollutants using kernel density estimation and geostatistical techniques. Int. J. Environ. Res. Public Health 2010, 8, 75–88. [Google Scholar] [CrossRef]
  15. Ojo, J.S.; Olaitan, J.A.; Ojo, O.L. Characterization and spatial distributions of atmospheric visibility, relative humidity, and temperature for application to optical propagation links over Nigeria. J. Opt. 2024, 53, 416–427. [Google Scholar] [CrossRef]
  16. Olaniran, O.J.; Sumner, G.N. A study of climatic variability in Nigeria based on the onset, retreat, and length of the rainy season. Int. J. Climatol. 1988, 9, 253–269. [Google Scholar] [CrossRef]
  17. Adeyemi, B.; Joerg, S. Analysis of water vapor over Nigeria using radiosonde and satellite data. J. Appl. Meteorol. Climatol. 2012, 51, 1855–1866. [Google Scholar] [CrossRef]
  18. Olaniran, O.J. The onset of the rainy season in Nigeria. Weather 1983, 38, 57–62. [Google Scholar]
  19. Adejuwon, J.O. Impact of climate variability and climate change on crop yield in Nigeria. Afr. J. Environ. Assess. Manag. 2004, 8, 1–13. [Google Scholar]
  20. Ogungbenro, S.B.; Morakinyo, T.E. Rainfall distribution and change detection across climatic zones in Nigeria. Weather Clim. Extrem. 2014, 5, 1–6. [Google Scholar] [CrossRef]
  21. Bergametti, G.; Rajot, J.; Marticorena, B.; Féron, A.; Gaimoz, C.; Chatenet, B.; Coulibaly, M.; Koné, I.; Maman, A.; Zakou, A. Rain, wind, and dust connections in the Sahel. J. Geophys. Res. Atmos. 2022, 127, e2021JD035802. [Google Scholar] [CrossRef]
  22. Weli, V.E.; Ohanuna, C.; Nwagbara, M.O. Atmospheric visibility and meteorological characteristics of the upper troposphere over selected cities in Nigeria. J. Climatol. Weather. Forecast. 2021, 9, 287. Available online: https://www.researchgate.net/publication/352541474_Journal_of_Climatology_Weather_Forecasting (accessed on 19 August 2025).
  23. Nigeria Climate Data, Nigeria Climate Information. Available online: https://en.climate-data.org/africa/nigeria-153/ (accessed on 19 August 2025).
  24. Altitude Maps, Find Your Altitude. Available online: https://www.altitude-maps.com/ (accessed on 24 January 2025).
  25. National Oceanic and Atmospheric Administration (NOAA). Atmospheric Visibility Dataset. Available online: https://www.ncei.noaa.gov/access/search/dataset-search?text=visibility (accessed on 19 December 2024).
  26. Cruz, M.G.; Hernández, E.A.; Uddameri, V. Climatic influences on agricultural drought risks using semiparametric kernel density estimation. Water 2020, 12, 2813. [Google Scholar] [CrossRef]
  27. Lawal, Y.B.; Owolawi, P.A.; Tu, C.; Van Wyk, E.; Ojo, J.S. The kernel density estimation technique for spatio-temporal distribution and mapping of rain heights over South Africa: The effects on rain-induced attenuation. Atmosphere 2024, 15, 1354. [Google Scholar] [CrossRef]
  28. Silverman, B.W. Density Estimation for Statistics and Data Analysis; Chapman & Hall: Boca Raton, FL, USA, 1986. [Google Scholar] [CrossRef]
  29. Epanechnikov, V.A. Non-parametric estimation of a multivariate probability density. Theory Probab. Its Appl. 1969, 14, 153–158. [Google Scholar] [CrossRef]
  30. Scott, D.W. Multivariate Density Estimation: Theory, Practice, and Visualization; Wiley: Hoboken, NJ, USA, 1992. [Google Scholar] [CrossRef]
  31. Wand, M.P.; Jones, M.C. Kernel Smoothing; Chapman & Hall: Boca Raton, FL, USA, 1995. [Google Scholar] [CrossRef]
  32. Kim, I.I.; McArthur, B.; Korevaar, E. Comparison of laser beam propagation at 785 nm and 1550 nm in fog and haze for optical wireless communications. In Proceedings SPIE 4214, Optical Wireless Communications III; Spie: Bellingham, WA, USA, 2001; Volume 26. [Google Scholar] [CrossRef]
  33. Al Naboulsi, M.; Sizun, H.; Fornel, F. Fog attenuation prediction for optical and infrared waves. Opt. Eng. 2004, 43, 319–329. [Google Scholar] [CrossRef]
  34. Sharma, A.; Kaur, S. Performance evaluation and fog attenuation modelling of FSO link for hilly regions of India. Opt. Quantum Electron. 2021, 53, 697. [Google Scholar] [CrossRef]
  35. Fischer, K.W.; Witiw, M.R.; Baars, J.A.; Oke, T.R. Atmospheric laser communication: New challenges for applied meteorology. Bull. Am. Meteorol. Soc. 2004, 85, 725–732. [Google Scholar] [CrossRef]
  36. Elamassie, M.; Uysal, M. Unified atmospheric attenuation models for visible and infrared wavelengths. J. Opt. Soc. Am. A 2024, 41, 2099–2111. [Google Scholar] [CrossRef] [PubMed]
  37. Guo, L.; Zeng, J.; Hao, S.; Fu, Y.; Ma, W.; Liu, Z. Transmission characteristics of free-space optical communication system with infrared working wavelength under complex channels. Opt. Eng. 2024, 63, 128103. [Google Scholar] [CrossRef]
  38. Cho, H.-J.; Kim, K.-S. Development of hazardous road fog index and its application. J. East. Asia Soc. Transp. Stud. 2005, 6, 3357–3371. [Google Scholar] [CrossRef]
  39. Singh, A.; Dey, S. Influence of aerosol composition on visibility in megacity Delhi. Atmos. Environ. 2012, 62, 367–373. [Google Scholar] [CrossRef]
  40. Shahzad, M.I.; Nichol, J.E.; Wang, J.; Campbell, J.R.; Chan, P.W. Estimating surface visibility at Hong Kong from ground-based LIDAR, sun photometer, and operational MODIS products. J. Air Waste Manag. Assoc. 2013, 63, 1098–1110. [Google Scholar] [CrossRef]
  41. Komeilian, H.; Bateni, S.M.; Xu, T.; Nielson, J. Estimating atmospheric visibility using synergy of MODIS data and ground-based observations. Proc. Int. Assoc. Hydrol. Sci. 2015, 368, 46–50. [Google Scholar] [CrossRef]
  42. Werkmeister, A.; Lockhoff, M.; Schrempf, M.; Tohsing, K.; Liley, B.; Seckmeyer, G. Comparing satellite- to ground-based automated and manual cloud coverage observations—A case study. Atmos. Meas. Tech. 2015, 8, 2001–2013. [Google Scholar] [CrossRef]
  43. Distances From, Flight Distance Calculator. Available online: https://www.distancesfrom.com/Flight-Distance.aspx (accessed on 24 January 2025).
  44. Akpootu, D.O.; Iliyasu, M.I.; Mustapha, W.; Aruna, S.; Yusuf, S.O. The influence of meteorological parameters on atmospheric visibility over Ikeja, Nigeria. Arch. Curr. Res. Int. 2017, 9, 1–12. [Google Scholar] [CrossRef]
  45. Balogun, E.E. Seasonal and spatial variations in thunderstorm activity over Nigeria. J. Radio Meteorol. 1981, 36, 192–197. [Google Scholar] [CrossRef]
  46. Ibe, O.; Nymphas, E.F. Temperature variations and their effects on rainfall in Nigeria. In Global Warming: Engineering Solutions; Springer: Boston, MA, USA, 2009; pp. 565–578. [Google Scholar] [CrossRef]
  47. Falodun, S.E.; Lawal, Y.B. Investigation of non-standard refraction in a coastal area of Nigeria using radiosonde data. FUTA J. Res. Sci. 2015, 11, 358–368. Available online: https://journals.futa.edu.ng/home/paperd/1245/69/9 (accessed on 23 February 2025).
  48. Ihimekpen, N.I.; Ilaboya, I.R. Non-parametric Mann-Kendall test statistics for rainfall trend analysis in some selected states within the coastal region of Nigeria. J. Civ. Constr. Environ. Eng. 2018, 3, 17–28. [Google Scholar] [CrossRef]
  49. Balarabe, M.; Abdullah, K.; Nawawi, M. Long-term trend and seasonal variability of horizontal visibility in Nigerian troposphere. Atmosphere 2015, 6, 1462–1486. [Google Scholar] [CrossRef]
  50. Du, H.; Li, J.; Chen, X.; Yang, W.; Wang, Z.; Wang, Z. Quantifying the source contributions to poor atmospheric visibility in winter over the Central Plains Economic Region in China. Atmosphere 2022, 13, 2075. [Google Scholar] [CrossRef]
  51. Nwokocha, C.; Okujagu, C.; Enyinna, P. Meteorological variables that affect visibility degradation and their seasonal trends in the Niger Delta region of Nigeria. J. Geogr. Environ. Earth Sci. Int. 2019, 19, 1–10. [Google Scholar] [CrossRef]
  52. Diasso, U.H.; Abiodun, B.J. Drought modes in West Africa and how well CORDEX RCMs simulate them. Theor. Appl. Climatol. 2017, 128, 223–240. [Google Scholar] [CrossRef]
  53. Ndehedehe, C.E.; Agutu, N.O.; Ferreira, V.G.; Getirana, A. Evolutionary drought patterns over the Sahel and their teleconnections with low frequency climate oscillations. Atmos. Res. 2020, 233, 104700. [Google Scholar] [CrossRef]
  54. Salami, A.A.; Olanrewaju, R.M.; Bakare, K.O.; Babatunde, O.R. Spatial distribution of rainfall in Nigeria. Arab. J. Geosci. 2025, 18, 29. [Google Scholar] [CrossRef]
  55. Ochei, M.C.; Adenola, E. Variability of Harmattan dust haze over northern Nigeria. J. Pollut. 2018, 1, 107. Available online: https://www.hilarispublisher.com/open-access/variability-of-harmattan-dust-haze-over-northern-nigeria.pdf (accessed on 3 March 2025).
  56. Ghoumid, M.; Ahmed, M.M.; Lbath, M. Optimization analysis of average message delivery time for healthcare monitoring using a developed NB-IoT technology in a smart city. Internet Things 2024, 27, 101290. [Google Scholar] [CrossRef]
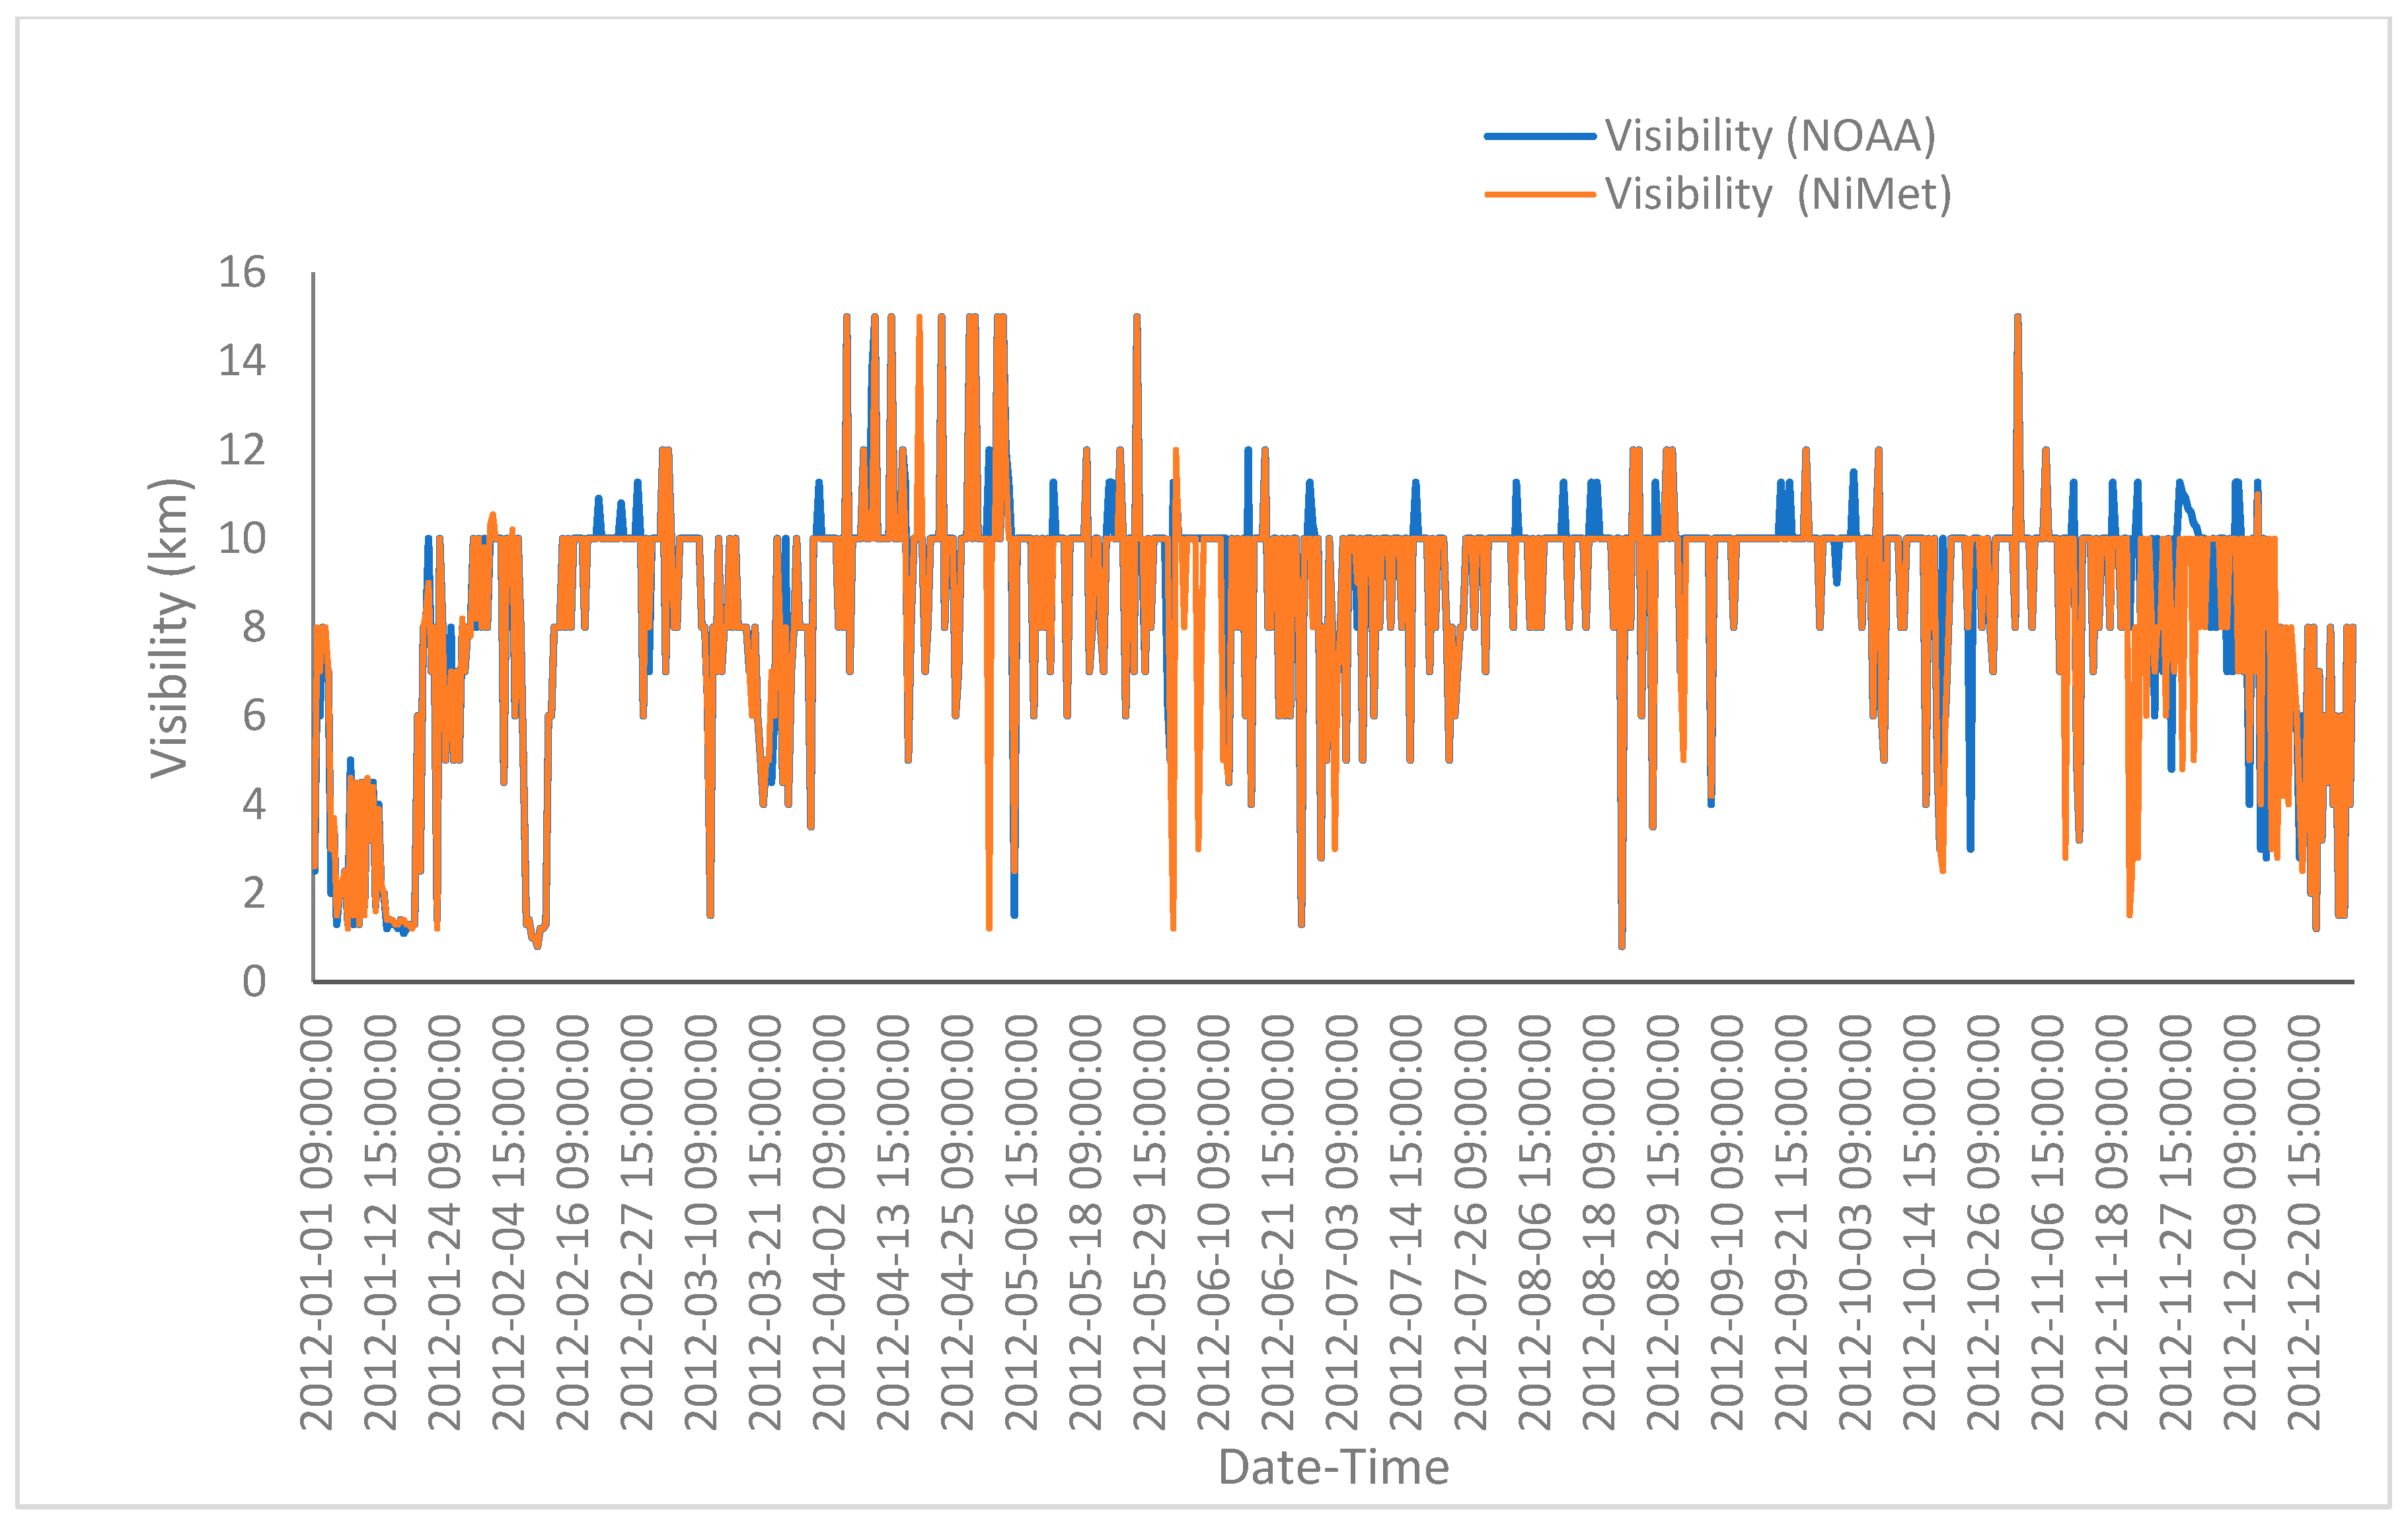
Figure 1. Comparison of the time series plots of Ikejavisibility data retrived from NiMet and NOAA.
Telecom 06 00062 g001
Figure 2. Variation in the atmospheric visibility monthly means across the study locations.
Telecom 06 00062 g002
Figure 3. Temporal variation in the annual mean trend of visibility across the study locations.
Telecom 06 00062 g003
Figure 4. Probability density functions of visibility during the low-visibility wet season period for (a) Ikeja, (b) Calabar, (c) Abuja, and (d) Kano.
Telecom 06 00062 g004
Figure 5. Probability density functions of visibility during the HV wet season for (a) Ikeja, (b) Calabar, (c) Abuja, and (d) Kano.
Telecom 06 00062 g005
Figure 6. Probability density functions of visibility during the LV dry season for (a) Ikeja, (b) Calabar, (c) Abuja, and (d) Kano.
Telecom 06 00062 g006
Figure 7. Probability density functions of visibility during the HV dry season for (a) Ikeja, (b) Calabar, (c) Abuja, and (d) Kano.
Telecom 06 00062 g007
Figure 8. Variation in specific attenuation with visibility at 850 nm, 1100 nm, and 1550 nm.
Telecom 06 00062 g008
Figure 9. Comparison of the four-season specific attenuation in Ikeja.
Telecom 06 00062 g009
Figure 10. Comparison of the four-season specific attenuation in Calabar.
Telecom 06 00062 g010
Figure 11. Comparison of the four-season specific attenuation in Abuja.
Telecom 06 00062 g011
Figure 12. Comparison of the four-season specific attenuation in Kano.
Telecom 06 00062 g012
Table 1. The study locations and their characteristics [22,23,24].
StationGeoclimatic ZoneLat (°E)Lon (°N)Elevation (m)Annual Rainfall (mm)Temperature Range (°C)
IkejaTropical Coastal6.60183.351351500–200022–33
CalabarTropical Coastal4.9758.34132>300023–31
AbujaMidland Savannah9.0567.4988401200–150019–37
KanoSahel Savannah12.0028.5919469600–100018–41
Table 2. Seasonal classification of visibility.
Sub-SeasonMonthsRemarks
1Low-Visibility Wet SeasonJun–AugCaused by high humidity, water vapor content, and cloud cover
2High-Visibility Wet SeasonSep–Nov
3Low-Visibility Dry SeasonDec–FebCaused by Harmattan, dust, and particulate matter
4High-Visibility Dry SeasonMar–May
Table 3. International Visibility Code for different types of weather conditions [38].
Weather ConditionVisibility (m)
Dense fog<40
Thick fog40–200
Moderate fog200–770
Light fog770–1000
Mist1000–2000
Haze2000–4000
Poor Visibility4000–10,000
Good Visibility10,000–40,000
Excellent Visibility>40,000
Table 4. Comparison of the performances of the four kernels.
StationSeasonGaussianEpanechnikovRectangularTriangular
hVis (m)ISE (E-5)hVis (m)ISE (E-5)hVis (m)ISE (E-5)hVis (m)ISE (E-5)
Ikeja LV Wet344.3710,8001.4371.6610,8001.6760.2210,8000.9259.910,8000.4
HV Wet343.9311,2881.7371.1911,2882.3759.2511,2881.5259.5711,2881
LV Dry420.2280080.9453.5280081.1927.6780080.8317.1580080.3
HV Dry319.1611,2611.1344.4511,2611.3704.5611,2610.8240.8711,2610.2
CalabarLV Wet859.9611,0580.71898.4111,0580.9928.1111,0580.4649.0311,0580.6
HV Wet724.0611,6000.81598.3911,6001.2781.4311,6000.7546.4611,6000.3
LV Dry738.6198000.41630.5398000.8797.1598000.9557.4598001.3
HV Dry1048.410,0202.22314.4210,0200.71131.4810,0201.1791.2610,0200.6
Abuja LV Wet475.8811,2520.71050.5711,2520.9513.6111,2520.5359.1711,2520.4
HV Wet 334.0699021.7737.4499022.4360.5399021.4252.1299020.8
LV Dry430.7598501.2950.998501.5464.8898500.9325.2298500.4
HV Dry461.6298901.11019.0498901.7498.1898901348.498900.5
Kano LV Wet418.8298501.7924.5698502.145298501.4316.198500.7
HV Wet532.6599001.41175.8699001.8574.8699001.140299000.9
LV Dry602.0598002.11329.0598002.5649.7698001.8454.3898001.3
HV Dry553.3898991.91221.6398992.4597.2498991.5417.6798991.1
Disclaimer/Publisher’s Note: The statements, opinions and data contained in all publications are solely those of the individual author(s) and contributor(s) and not of MDPI and/or the editor(s). MDPI and/or the editor(s) disclaim responsibility for any injury to people or property resulting from any ideas, methods, instructions or products referred to in the content.