Article

Analysis of Student Academic Performance Using Human-in-the-Loop Cyber-Physical Systems

1
Centre for Informatics and Systems of the University of Coimbra, University of Coimbra, 3030-290 Coimbra, Portugal
2
Departamento de Electrónica, Telecomunicaciones y Redes de Información, Escuela Politécnica Nacional, Quito 170517, Ecuador
3
Polytechnic Institute of Coimbra, ISCAC, 3040-316 Coimbra, Portugal
4
Escola Superior Politécnica do Uíge, Uíge 77, Angola
*
Author to whom correspondence should be addressed.
Telecom 2020, 1(1), 18-31; https://doi.org/10.3390/telecom1010003
Submission received: 26 February 2020 / Revised: 23 March 2020 / Accepted: 24 March 2020 / Published: 27 March 2020

Abstract

:
Is it possible to analyze student academic performance using Human-in-the-Loop Cyber-Physical Systems (HiLCPS) and offering personalized learning methodologies? Taking advantage of the Internet of Things (IoT) and mobile phone sensors, this article presents a system that can be used to adapt pedagogical methodologies and to improve academic performance. Thus, in this domain, the present work shows a system capable of analyzing student behavior and the correlation with their academic performance. Our system is composed of an IoT application named ISABELA and a set of open-source technologies provided by the FIWARE Project. The analysis of student performance was done through the collection of data, during 30 days, from a group of Ecuadorian university students at “Escuela Politécnica Nacional” in Quito, Ecuador. Data gathering was carried out during the first period of classes using the students’ smartphones. In this analysis, we found a significant correlation between the students’ lifestyle and their academic performance according to certain parameters, such as the time spent on the university campus, the students’ sociability, and physical activity, etc.

1. Introduction

The development stage of a country is directly related to the level of education of its habitants and how this contributes to its socioeconomic and technological progress. Therefore, one of the main objectives that should concern governments is the availability of high-quality educational institutions, something directly related to students achieving a high academic performance. Within this context, UNESCO presents goal 4.3 as follows [1]: “By 2030, ensure equal access for all women and men to affordable and quality technical, vocational and tertiary education, including university”, emphasizing the need to achieve a high quality of education and technical assistance to their member states.
In fact, technology can help in processes related to the improvement of education quality. As a result, the interest in data mining techniques has increased in the educational field and has led to the creation of a new research area called Educational Data Mining (EDM). The objective of this area is the analysis of educational data, through which the data are turned into useful information, allowing researchers to identify possible solutions to different challenges that arise in the educational field [2].
In addition, we can take advantage of technological advances such as the Internet of Things (IoT) by using them in the process of improving students’ academic performance. This can be achieved by developing and deploying student-centric applications based on those technologies.
In the last years, mobile human-centric applications have been considered as a good tool to gather patterns of student behavior [3,4,5]. Some studies have focused on obtaining information about student behavior by using a mobile phone, such as the StudentLife study [6], that was developed by researchers at Dartmouth College. This system allows information to be collected in order to analyze the impact of a student’s daily workload on their life and on their academic performance. The data were obtained from the GPS, accelerometer, microphone, light sensor, and Bluetooth and WiFi signals. The authors determined that student behavior is dependent on the period of the academic year (i.e., the behavior at the beginning differs from the behavior at the end of the school period). To obtain the students’ location, the GPS was used outdoors, and WiFi signals were used indoors. This work was complemented with a new study presented in [7], where, based on the information already collected in [6], they obtained patterns of behavior related to students’ activity and sociability. Later on, these patterns were correlated with the Grade Point Average (GPA) of the students. On the basis of the results obtained, the authors proposed a prediction model for the students’ academic performance.
However, these studies do not offer an IoT platform that includes feedback to each student to encourage them to modify their behavior. This is one of the aspects where the present work differs, because we propose a mechanism to close the loop, making the human being an active part of the process.
On the other hand, the work SmartGPA [8], based on data collected with StudentLife, offers methods to automatically infer study and social behaviors. Additionally, they propose a simple model to predict the cumulative GPA, opening up a new way to improve academic performance. In this approach, some studies are related to prediction techniques of student performance, which use the historical data of students as demographic information [9,10], i.e., socioeconomic and academic data [11], extracted from university database.
The attributes for the prediction of academic performance were academic and social integration, emotional skills [12], average of grades, evaluations, final exam grades, class attendance, task delivery, and participation rate [13]. In the same direction, [2] identifies the following factors associated with the students’ performance: availability of computer equipment and Internet facilities at home, gender, attendance, and marks. In the same way, [14] offers a review of data mining techniques employed to infer the students’ academic performance and to improve the effectiveness and efficiency of their performance. They used diverse attributes, such as Cumulative Grade Point Average (CGPA), internal evaluation related (tests, attendance, laboratory works, and quizzes), demographic aspects (gender, ages, family, and disabilities), and external evaluation related (final grade of a particular subject). According to this work, the most used external attributes are extracurricular activities, school background, and social network interaction. These works use different classifiers such as decision tree (J-48), random tree, neuronal networks, native Bayes, Nearest Neighbor (K-NN), and Support Vector Machine (SVM).
On the basis of the literature related to academic performance prediction, we obtained a good idea about the attributes that could be used in our work as the GPA and CGPA. However, in all the works analyzed we identified the lack of a feedback mechanism, i.e., the authors do not propose any mechanism to actively influence the human to change behaviors, thus closing the loop.
In this article, we present a new approach to collect data using a mobile phone as a sensing system as well as information from social networks. This allows us to infer the student behavior using a student-centric mobile application with the goal of obtaining the correlation between the student behavior and their academic performance.
To analyze the correlation between the student behavior and the academic performance, we collected, in a continuous way over 30 days, sensing data from 30 Ecuadorian students at “Escuela Politécnica Nacional” of Quito, Ecuador. This was done during the first period of classes, using our application on their Android mobile phones.
In addition to the work presented in this paper, two additional papers have been published, namely, “A Human-in-the-Loop Cyber-Physical Approach for Students Performance Assessment” [15] and “ISABELA – A Socially-Aware Human-in-the-Loop Advisor System” [16]. While the first paper presents implementation details of the physical system and different trial results from the ones presented in both this paper and the second, the second presents a more detailed exploration of the online social network data, as well as the implementation of three different machine learning mechanisms for sleep detection, sleep quality, and sociability detection. In addition, the previous papers used only a mid-term exam as the validation of student’s performance. In contrast, in this paper, we present a more in-depth study of the student’s performance by leveraging the student’s historical academic data.
The structure of the paper is as follows: In Section 2, we describe the applications that were developed (the Android app and the backend application) and used to collect the data. Then, the methodology followed is detailed in Section 3. Section 4 presents the results obtained and discusses them. Finally, the conclusions and future work are presented in Section 5.

2. ISABELA Platform

As part of the project SOCIALITE [17] we developed a case study named IoT Student Advisor & BEst Lifestyle Analyser (ISABELA). This case study aimed at deploying a system that allows for the monitoring of variables related to the students’ lifestyle and the environment in which they are working and studying. Subsequently, the data obtained are correlated with their academic performance.
For this purpose, the ISABELA platform was implemented based on the Human-in-the-Loop Cyber-Physical Systems (HiLCPS) concept [18], where a HiLCPS is defined as a Cyber-Physical System that considers the human being as an integral part of the system to close the loop.
The ISABELA platform consists of a set of modules that interact with each other. These modules correspond to a data acquisition system, a fog network using a mobile phone, and the cloud system, as depicted in the Figure 1. The data processing is performed part on the mobile phone and part in the cloud.

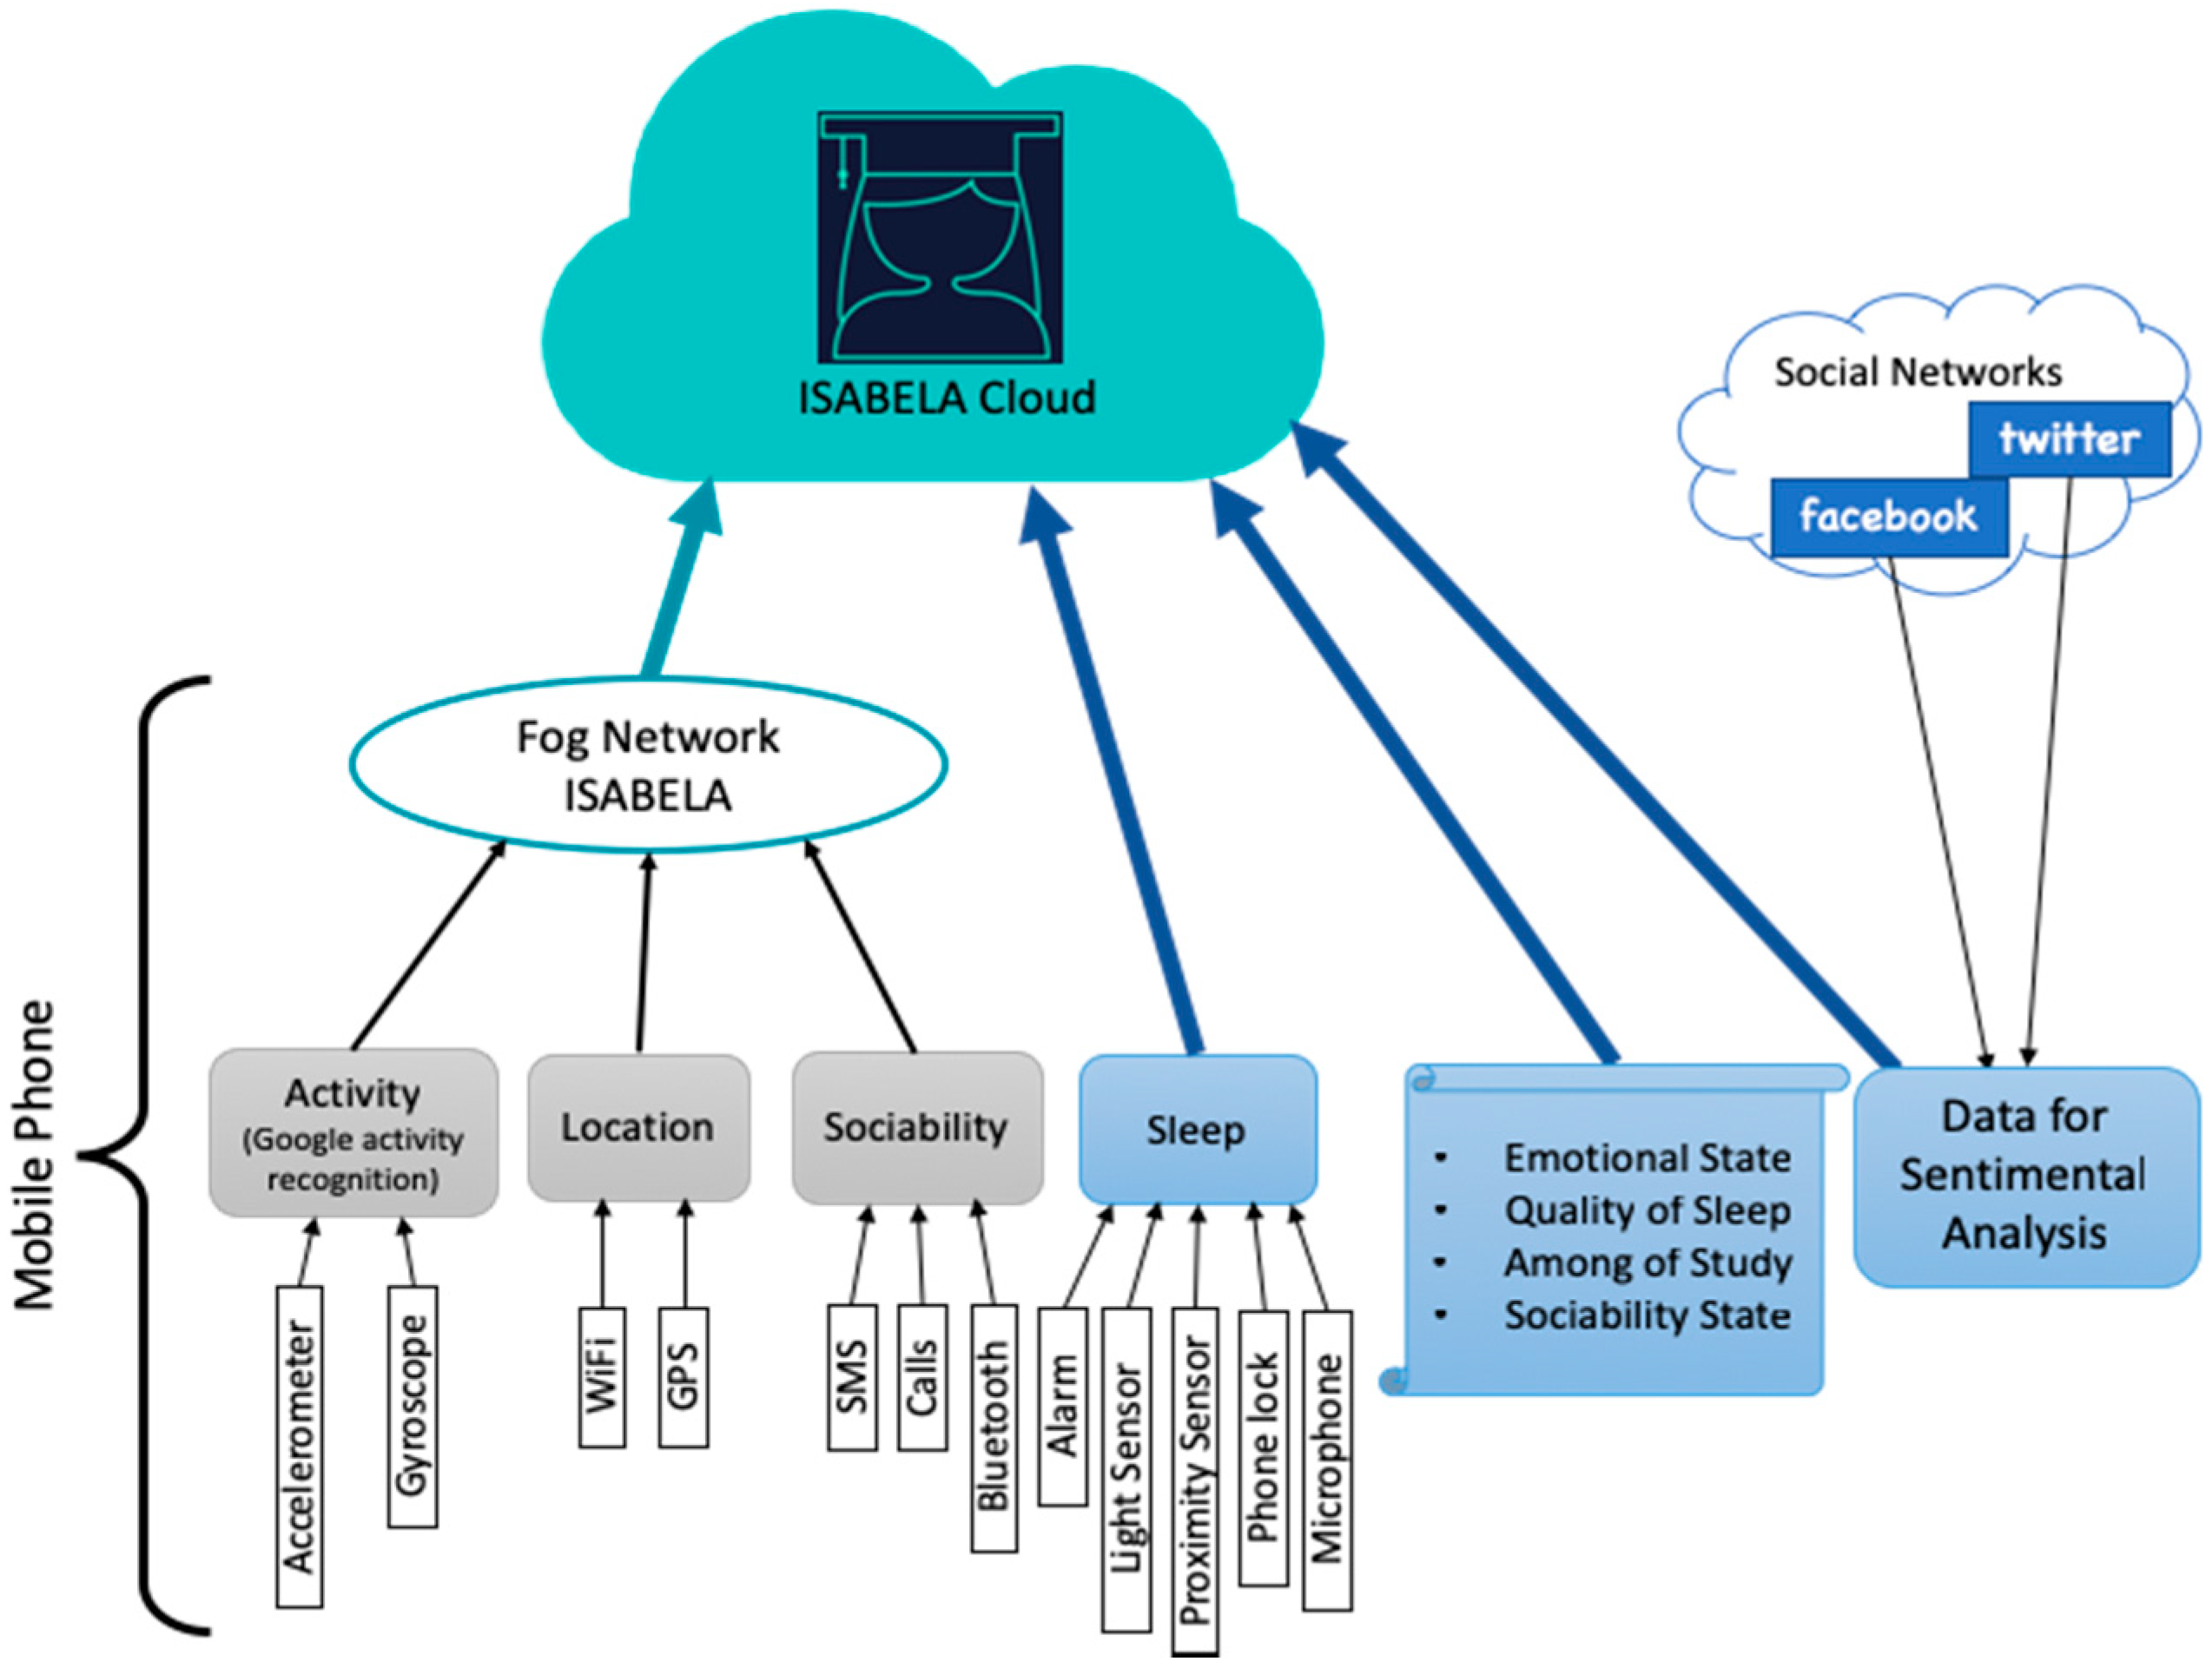
2.1. Data Acquisition System

In order to achieve and infer the students’ behavior, we collected data related to their physical activity, location, sleep, emotions, and sociability. Data acquisition was carried on using three different types of sources:
(i)
Mobile phone sensors: We obtained the physical activity of students from the accelerometer and the gyroscope, and the location by using information from WiFi scans and GPS. For the sleep state, we employed the light and the proximity sensors, the alarm information, the phone lock, and the microphone. Finally, for sociability, (a) we used information on the number of SMSs sent and received, calls made, received, and lost; (b) the duration of these calls, the number of different destinations of the calls/SMSs were also collected; and (c) proximity of other devices, via Bluetooth, was also obtained;
(ii)
Questionnaire: The students entered daily information about their sociability state, quality of sleep, amount of study, and emotional state via a questionnaire integrated into the application;
(iii)
Social networks: To infer their emotional status, we used what they post on Facebook and Twitter, including reactions and the number of retweets.

2.2. Processing in the Mobile Phone

Part of the data processing was done on the mobile phone by three modules:
(i)
Physical activity: We used the Google activity recognition Application Program Interface ( API) to infer the student activity that can be classified in one of the following five states: Exercise, walking, still, in a vehicle, and unknown;
(ii)
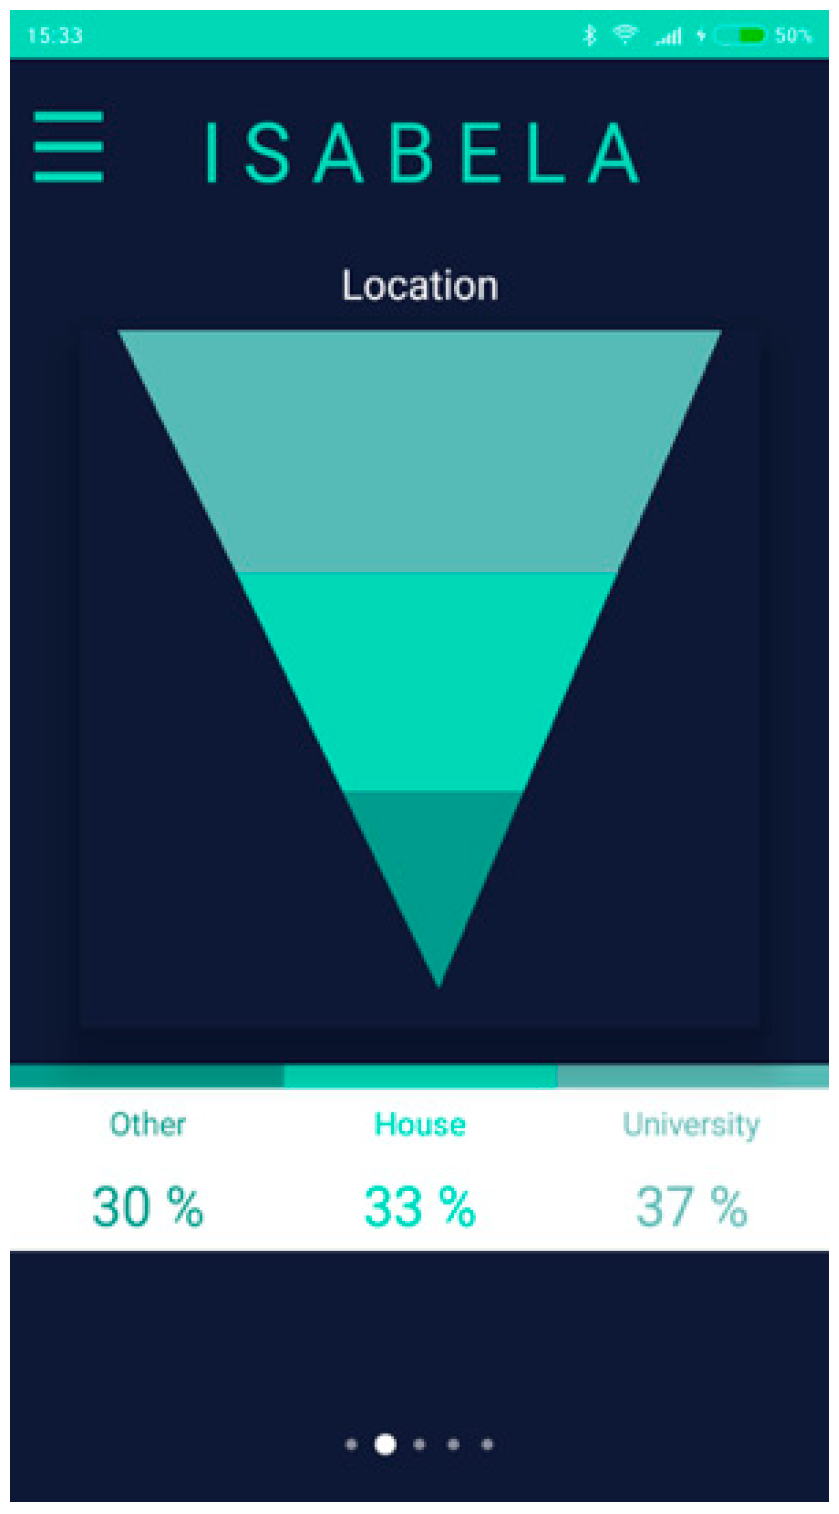
Location: We defined three locations: University, home, and other. To locate the student in indoor environments, we mostly relied on the collection of the Service Set Identifier ( SSID) of the available WiFi networks (in this way, it was easy to know if the student was at home or in the university because we can obtain in advance the SSID of the respective networks). If the GPS was active on the mobile phone, we also used this information. For the case of processing the GPS information, if the mobile phone was inside a radius of 200 meters around the Faculty of Electric and Electronic Engineering, the location was assigned the label “university”;
(iii)
Sociability: This classification was inferred based on the statistics of SMSs received and sent, as well as calls made and received.

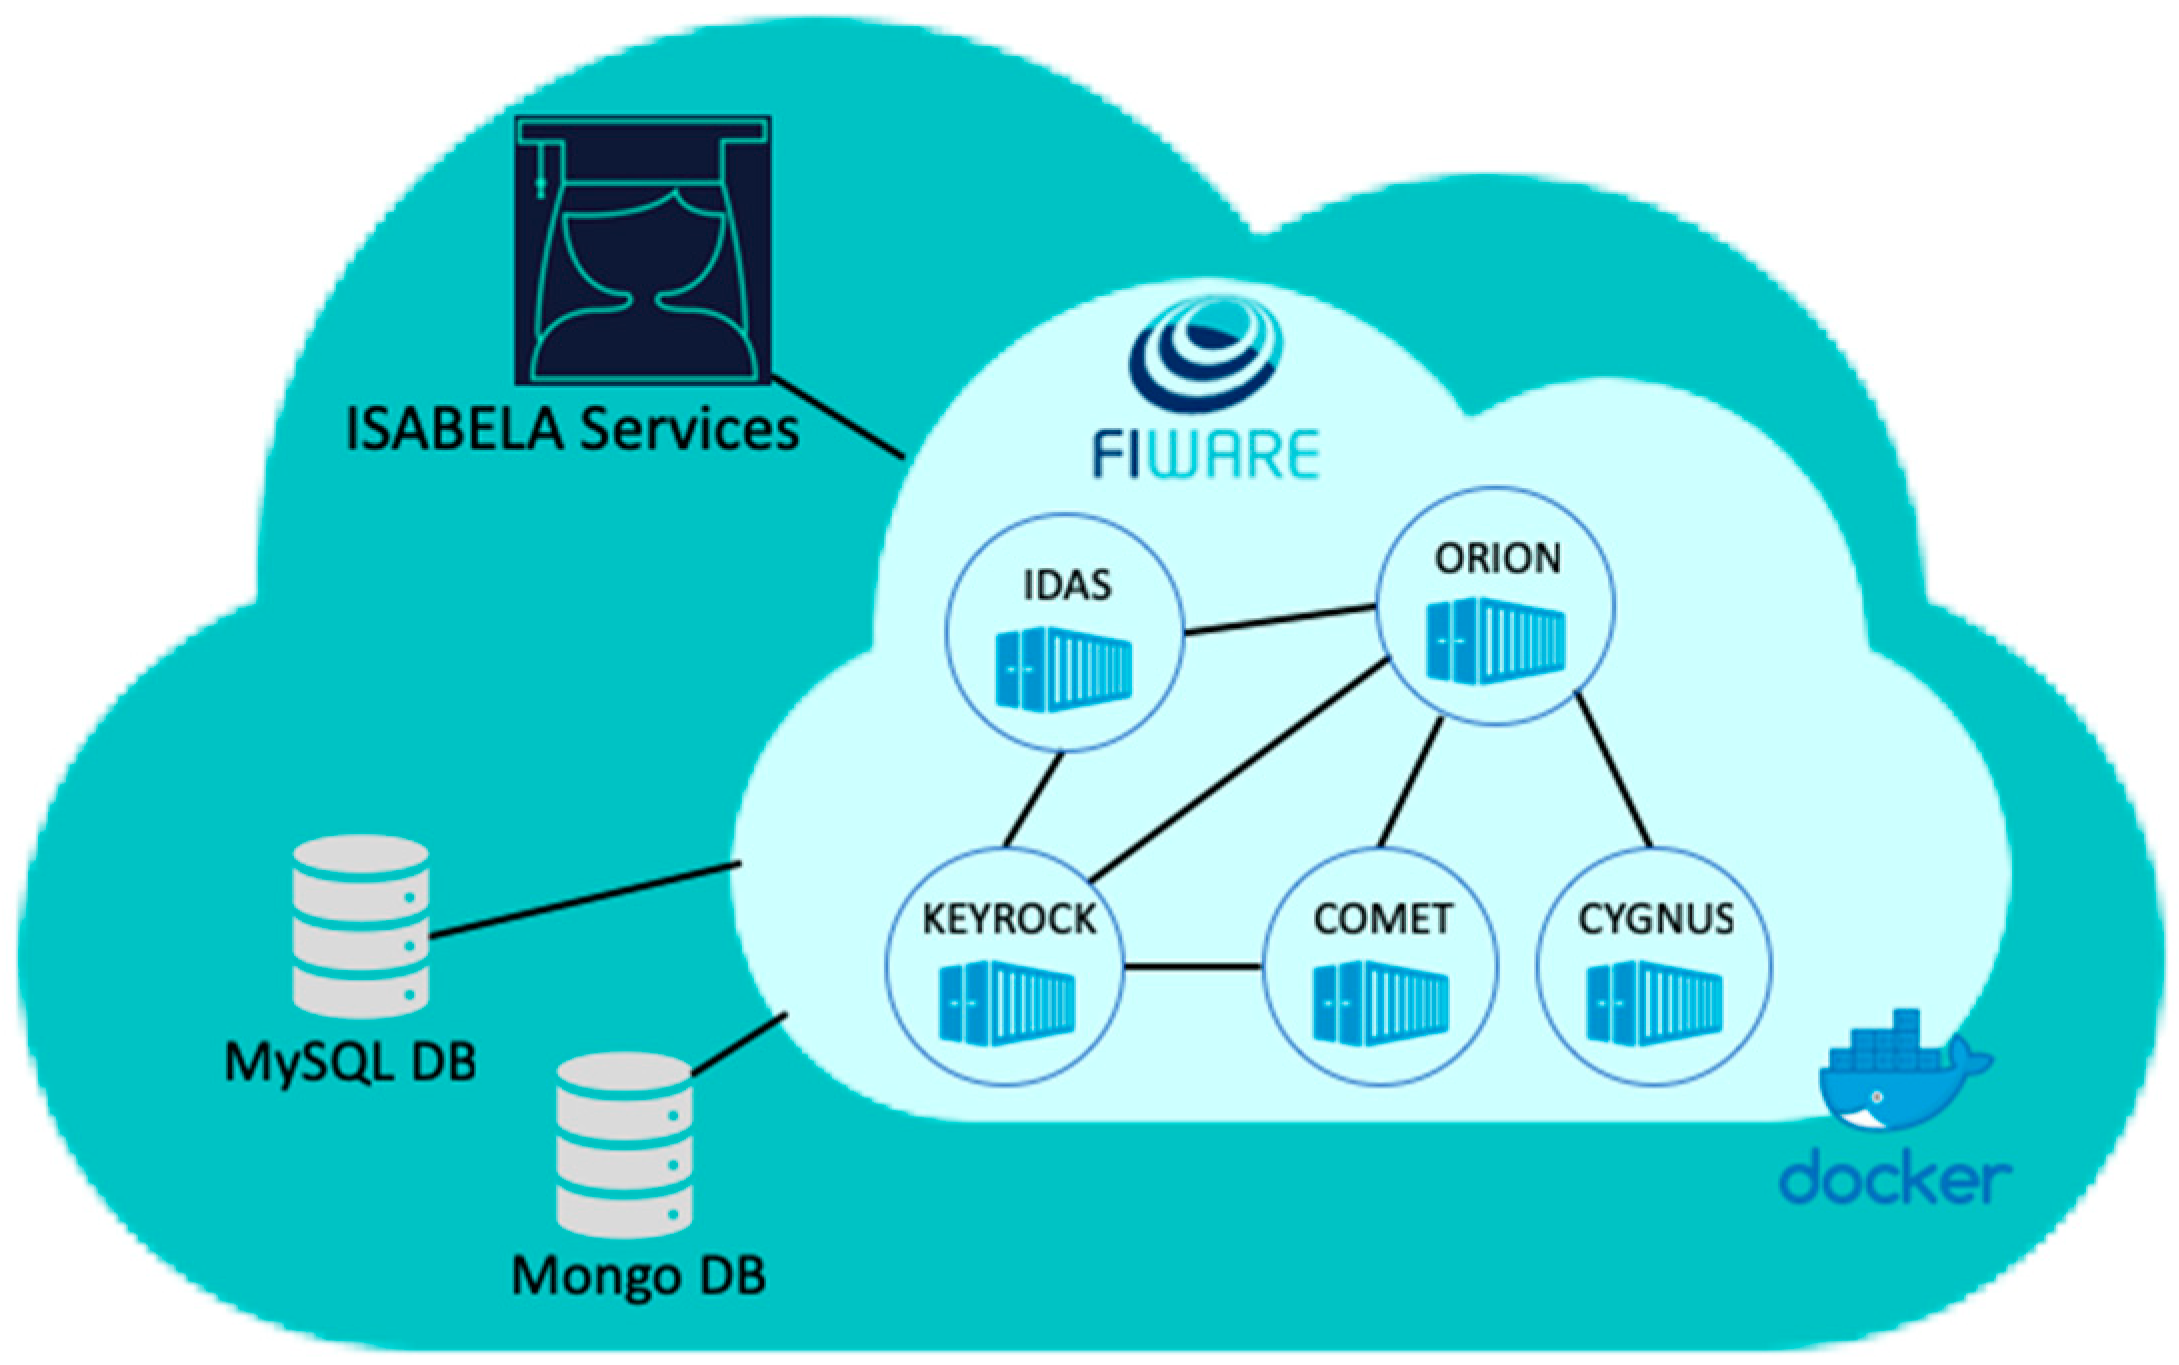
2.3. Processing in the Cloud

The cloud of ISABELA is implemented using the FIWARE platform [19], which is a modular framework developed to offer a standard applicable to IoT platforms in Europe. FIWARE provides several Generic Enablers (GE), which implement different functions that are required in an IoT platform. Our implementation of the FIWARE uses five of those GEs, namely, the ORION, the CYGNUS, the STH COMET, the Intelligence Data Advanced Solution (IDAS), and the KEYROCK. The ORION allows for the management of the entire lifecycle of context information, using a NGSIv2 REST API. Furthermore, the ORION can also manage subscriptions for context information and allows for advanced filtering of the data in those subscriptions. The Short-Term-History or STH-Comet is another GE that provides a RESTFUL API offering historic-queries capabilities, and aggregation methods. Thus, each time the ISABELA application needs to access historic data, the Comet GE will connect to the MongoDB to retrieve the data. The connection of IoT devices with entities from the real world is achieved by connecting the ORION with the IDAS. An attribute of an entity represented in ORION can be associated to a specific sensor of an IoT device. Consequently, several entities can be associated with a set of sensors, and at the same time, the same sensor can be associated with several entities. The CYGNUS manages and enables communication between the different modules. Moreover, the KEYROCK serves as an authentication module for the system and manages the identity of the users to ensure data privacy and security. Figure 2 depicts the GEs used into the ISABELA cloud.
The functionalities corresponding to sleep recognition and sentimental state recognition were performed in the Cloud of ISABELA. Because FIWARE could not provide these functionalities natively, we extended its capabilities by implementing a server with Spring Boot [20]. The server has a subscription for content in the ORION, and each time the specific entity type is updated, a notification is sent to the server with the content of the entity to be processed. The server, according to the entity type, initiates one of two modules: the sleep detection module or the sentiment analysis module. After the modules process the information, the result is sent to FIWARE for safeguarding.
The implementation of the modules was carried out as follows:
(i)
Sleep Recognition: It was made using an implementation of the random forest algorithm, which was implemented in java based on the analysis realized with the WEKA framework;
(ii)
Sentimental State Recognition: It was implemented using a module called sentimental analysis, which processes the textual data collected from social networks, such as Facebook and Twitter, to infer the sentiment of students using polarities.
The results of both modules are not presented in the present article, as they are already detailed in [16]. Further implementation details of the system are also explored in the aforementioned article.
As part of the HiL (Human-in-the-Loop) model, ISABELA closed the loop with feedback sent to the student through a chatbot, i.e., the system sent some recommendations based on the data collected.

3. Methodology

This section describes the methodology used for data collection. This process was carried out at a university in Ecuador with a group of students and is detailed as follows.

3.1. Study Participants

The work carried on was an exploratory study that was applied to undergraduate students in Quito, Ecuador. These students were enrolled in the Electric and Electronic Faculty of Escuela Politécnica Nacional, which is located within the first three positions of the ranking of Ecuadorian universities.
The students who participated in the study numbered 30 (76.67% males and 23.33% females) with an average age of 25 years, with an average of 26.63 h of classes per week, and an average grade of 7.18 points out of 10. Data from two students who did not complete the study were removed before further analysis.

3.2. Measures

The ISABELA study had three stages: orientation, data collection, and test finalization.
During the orientation phase, the students accepted the terms of consent for the use of their data, collected anonymously, and gave the necessary permission. In addition, they were given a tutorial on the installation and use of the ISABELA application; a major concern was to ensure they understood the importance of answering and submitting the questionnaire daily. This questionnaire was part of the ISABELLA application and easily accessible in the main menu. All the students enrolled in the study had a mobile phone with the Android operating system on which the application was installed.
The collection stage lasted 30 days between May 14 and June 12, within the first academic period of the semester (April–August 2018). The test days included the evaluation period of the first bimester.
It should be noted that the data stored through the ISABELA application comes from two types of sources: mobile phone sensors and the questionnaire answered daily by each student.
The data collected through the sensors available on the mobile phone were (Figure 3):
  • Location: university, house, and other;
  • Physical activity: exercise, still, walking, in vehicle, and unknown;
  • Sociability: number of SMSs sent and received; number of calls made, received, and lost; duration of the calls; number of different destinations for calls and SMSs.
The data obtained through the questionnaire were measured with a scale between 0 and 4 as follows:
  • Sociability state: (4) very high, (3) high, (2) medium, (1) low, and (0) very low;
  • Sleep quality: (4) very good, (3) good, (2) normal, (1) bad, and (0) very bad;
  • Amount of study: (4) a lot, (3) fairly, (2) moderate, (1) little, and (0) nothing.
Sensor data were collected and stored automatically, while the explicit participation of the students was necessary to obtain the data from the questionnaires. The average number of times the information of questionnaires was sent during the testing period was approximately 19 times per student. In case the student did not have an Internet connection, the data were stored on the mobile phone, and when there was a connection, either via WiFi or cellular network, data were sent to the ISABELA platform. During the data collection period, a web-based monitoring solution based on freeboard.io was used to observe the information received in real time.
To ensure the students’ privacy, all the data sent to the ISABELA cloud was saved with a student ID obtained by applying a secure hash function to the real student ID. This way it was not possible to associate the data saved on the cloud with any student.
After analyzing the collected data, we sent the information to the student through the chatbot; this involved the system sending some recommendations related to the time spent in the university, as well as changes to their activity in cases where the student had been inactive for a long period of time (Figure 4).

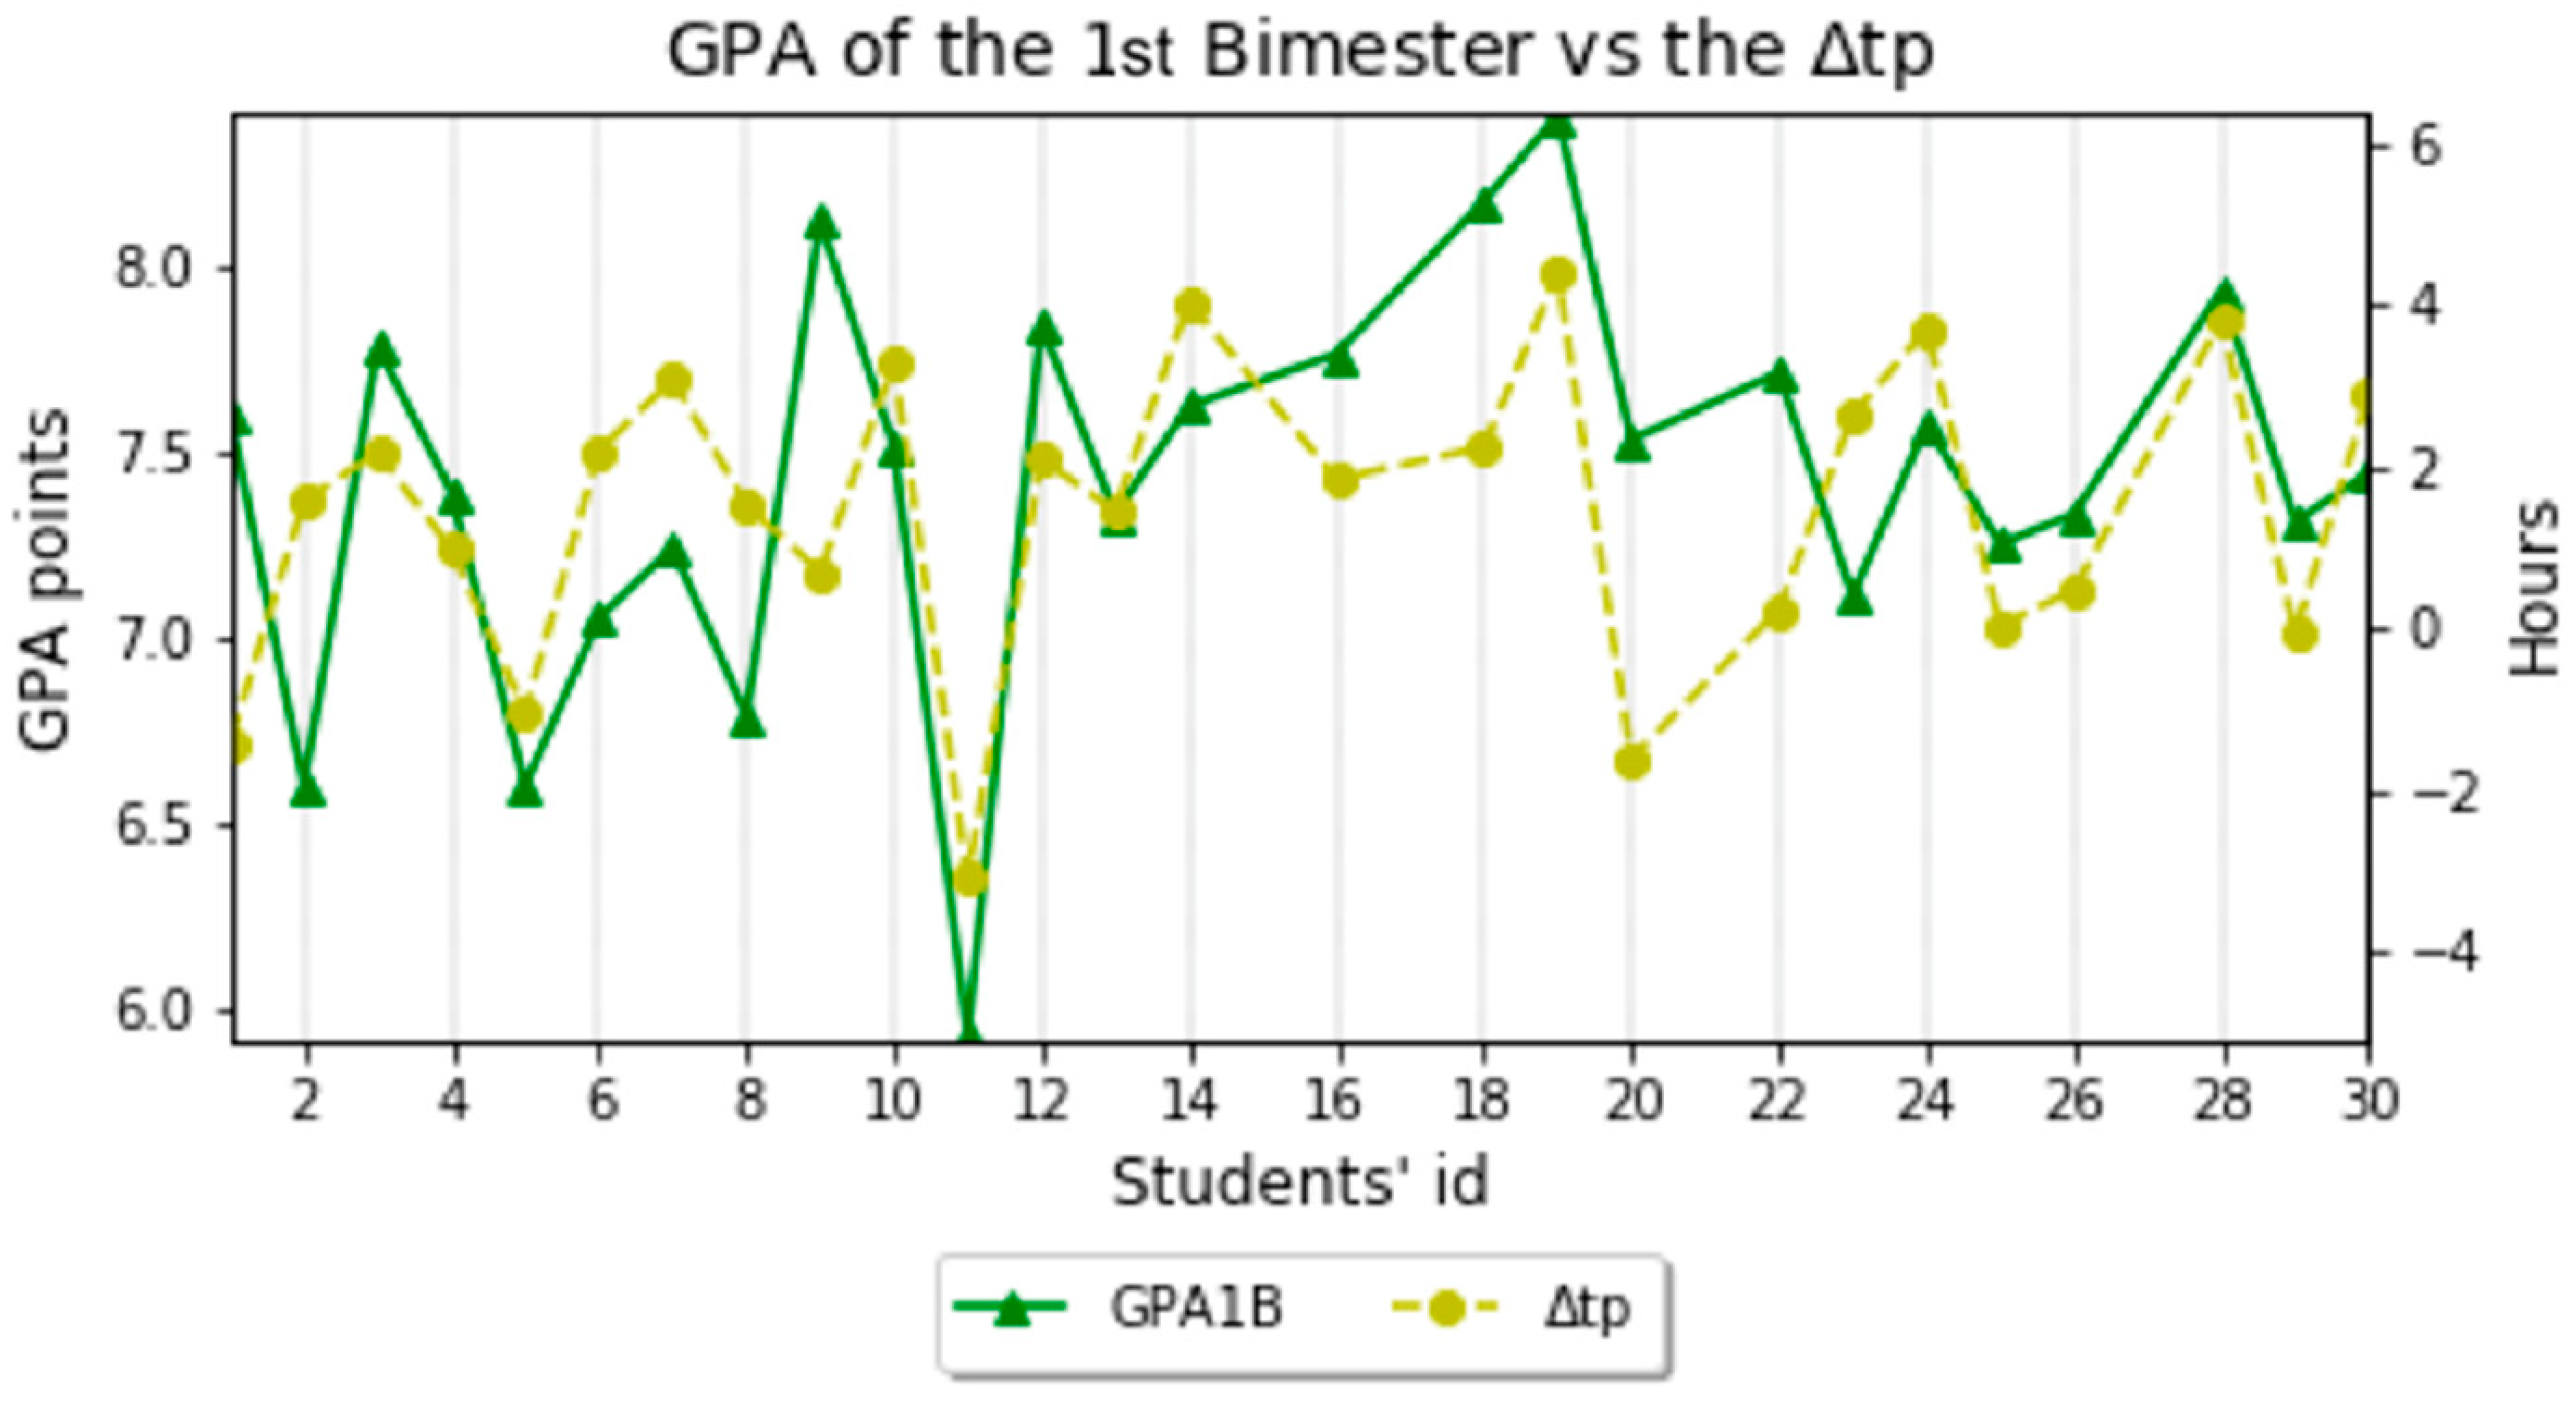
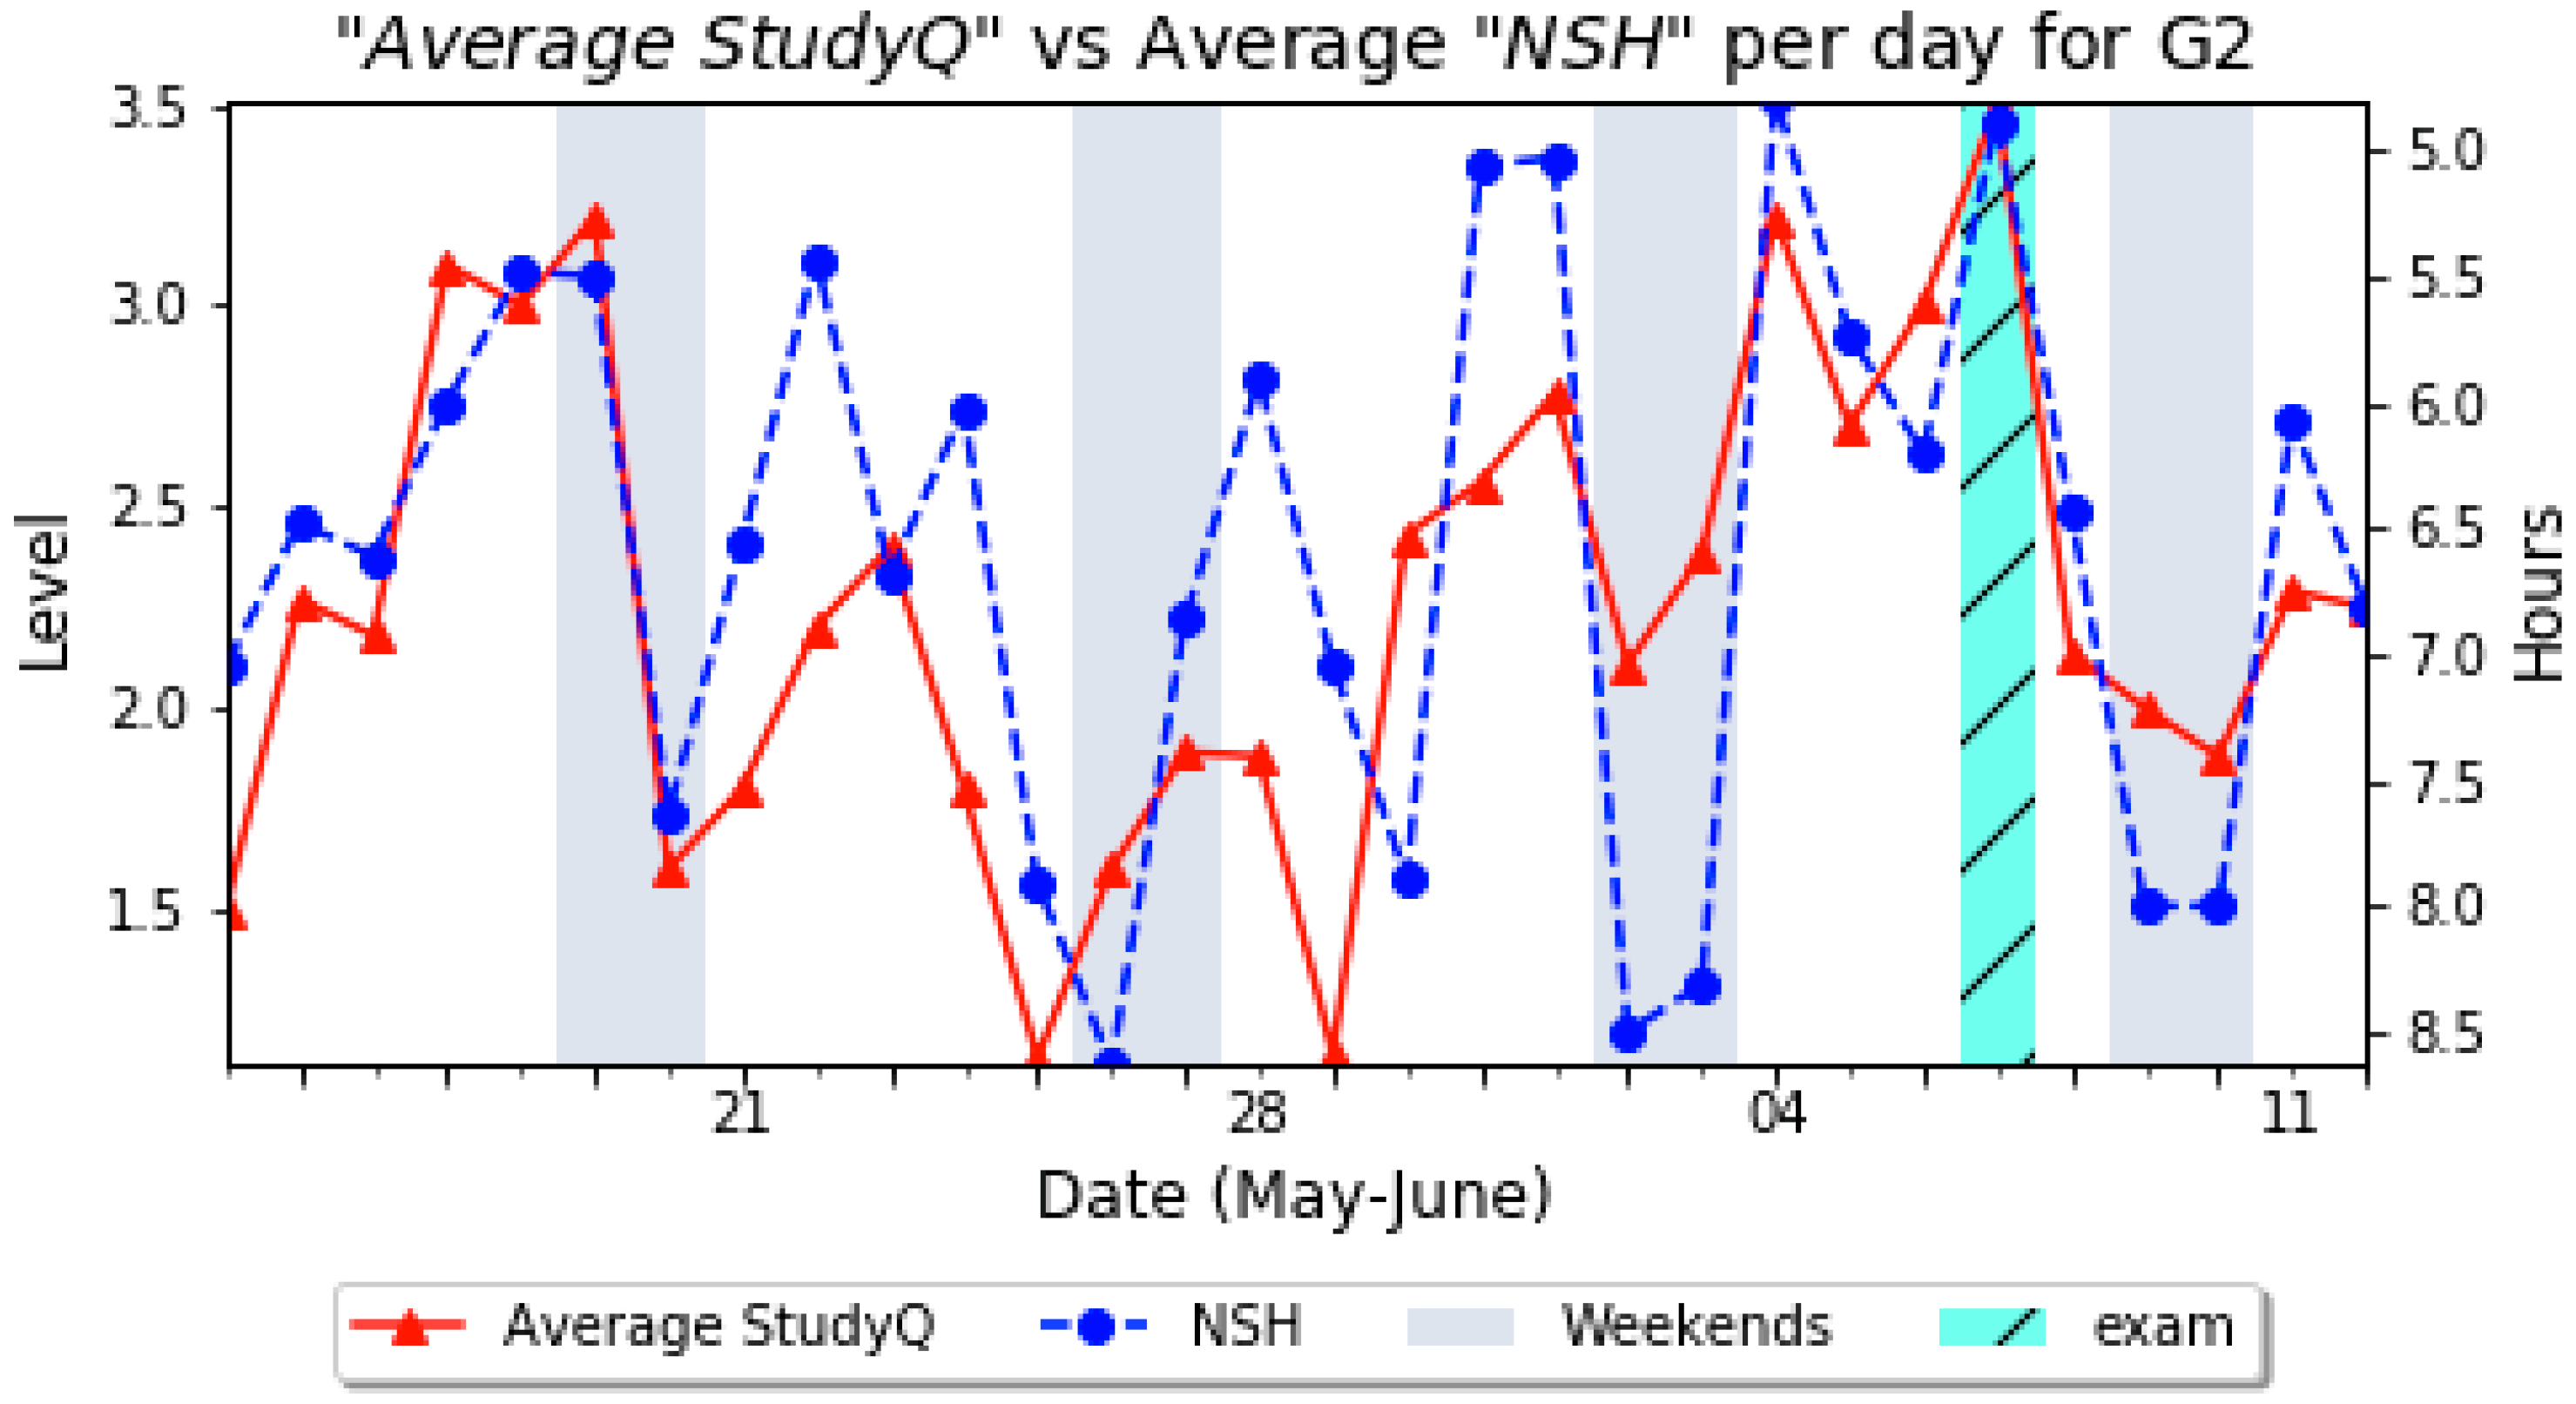
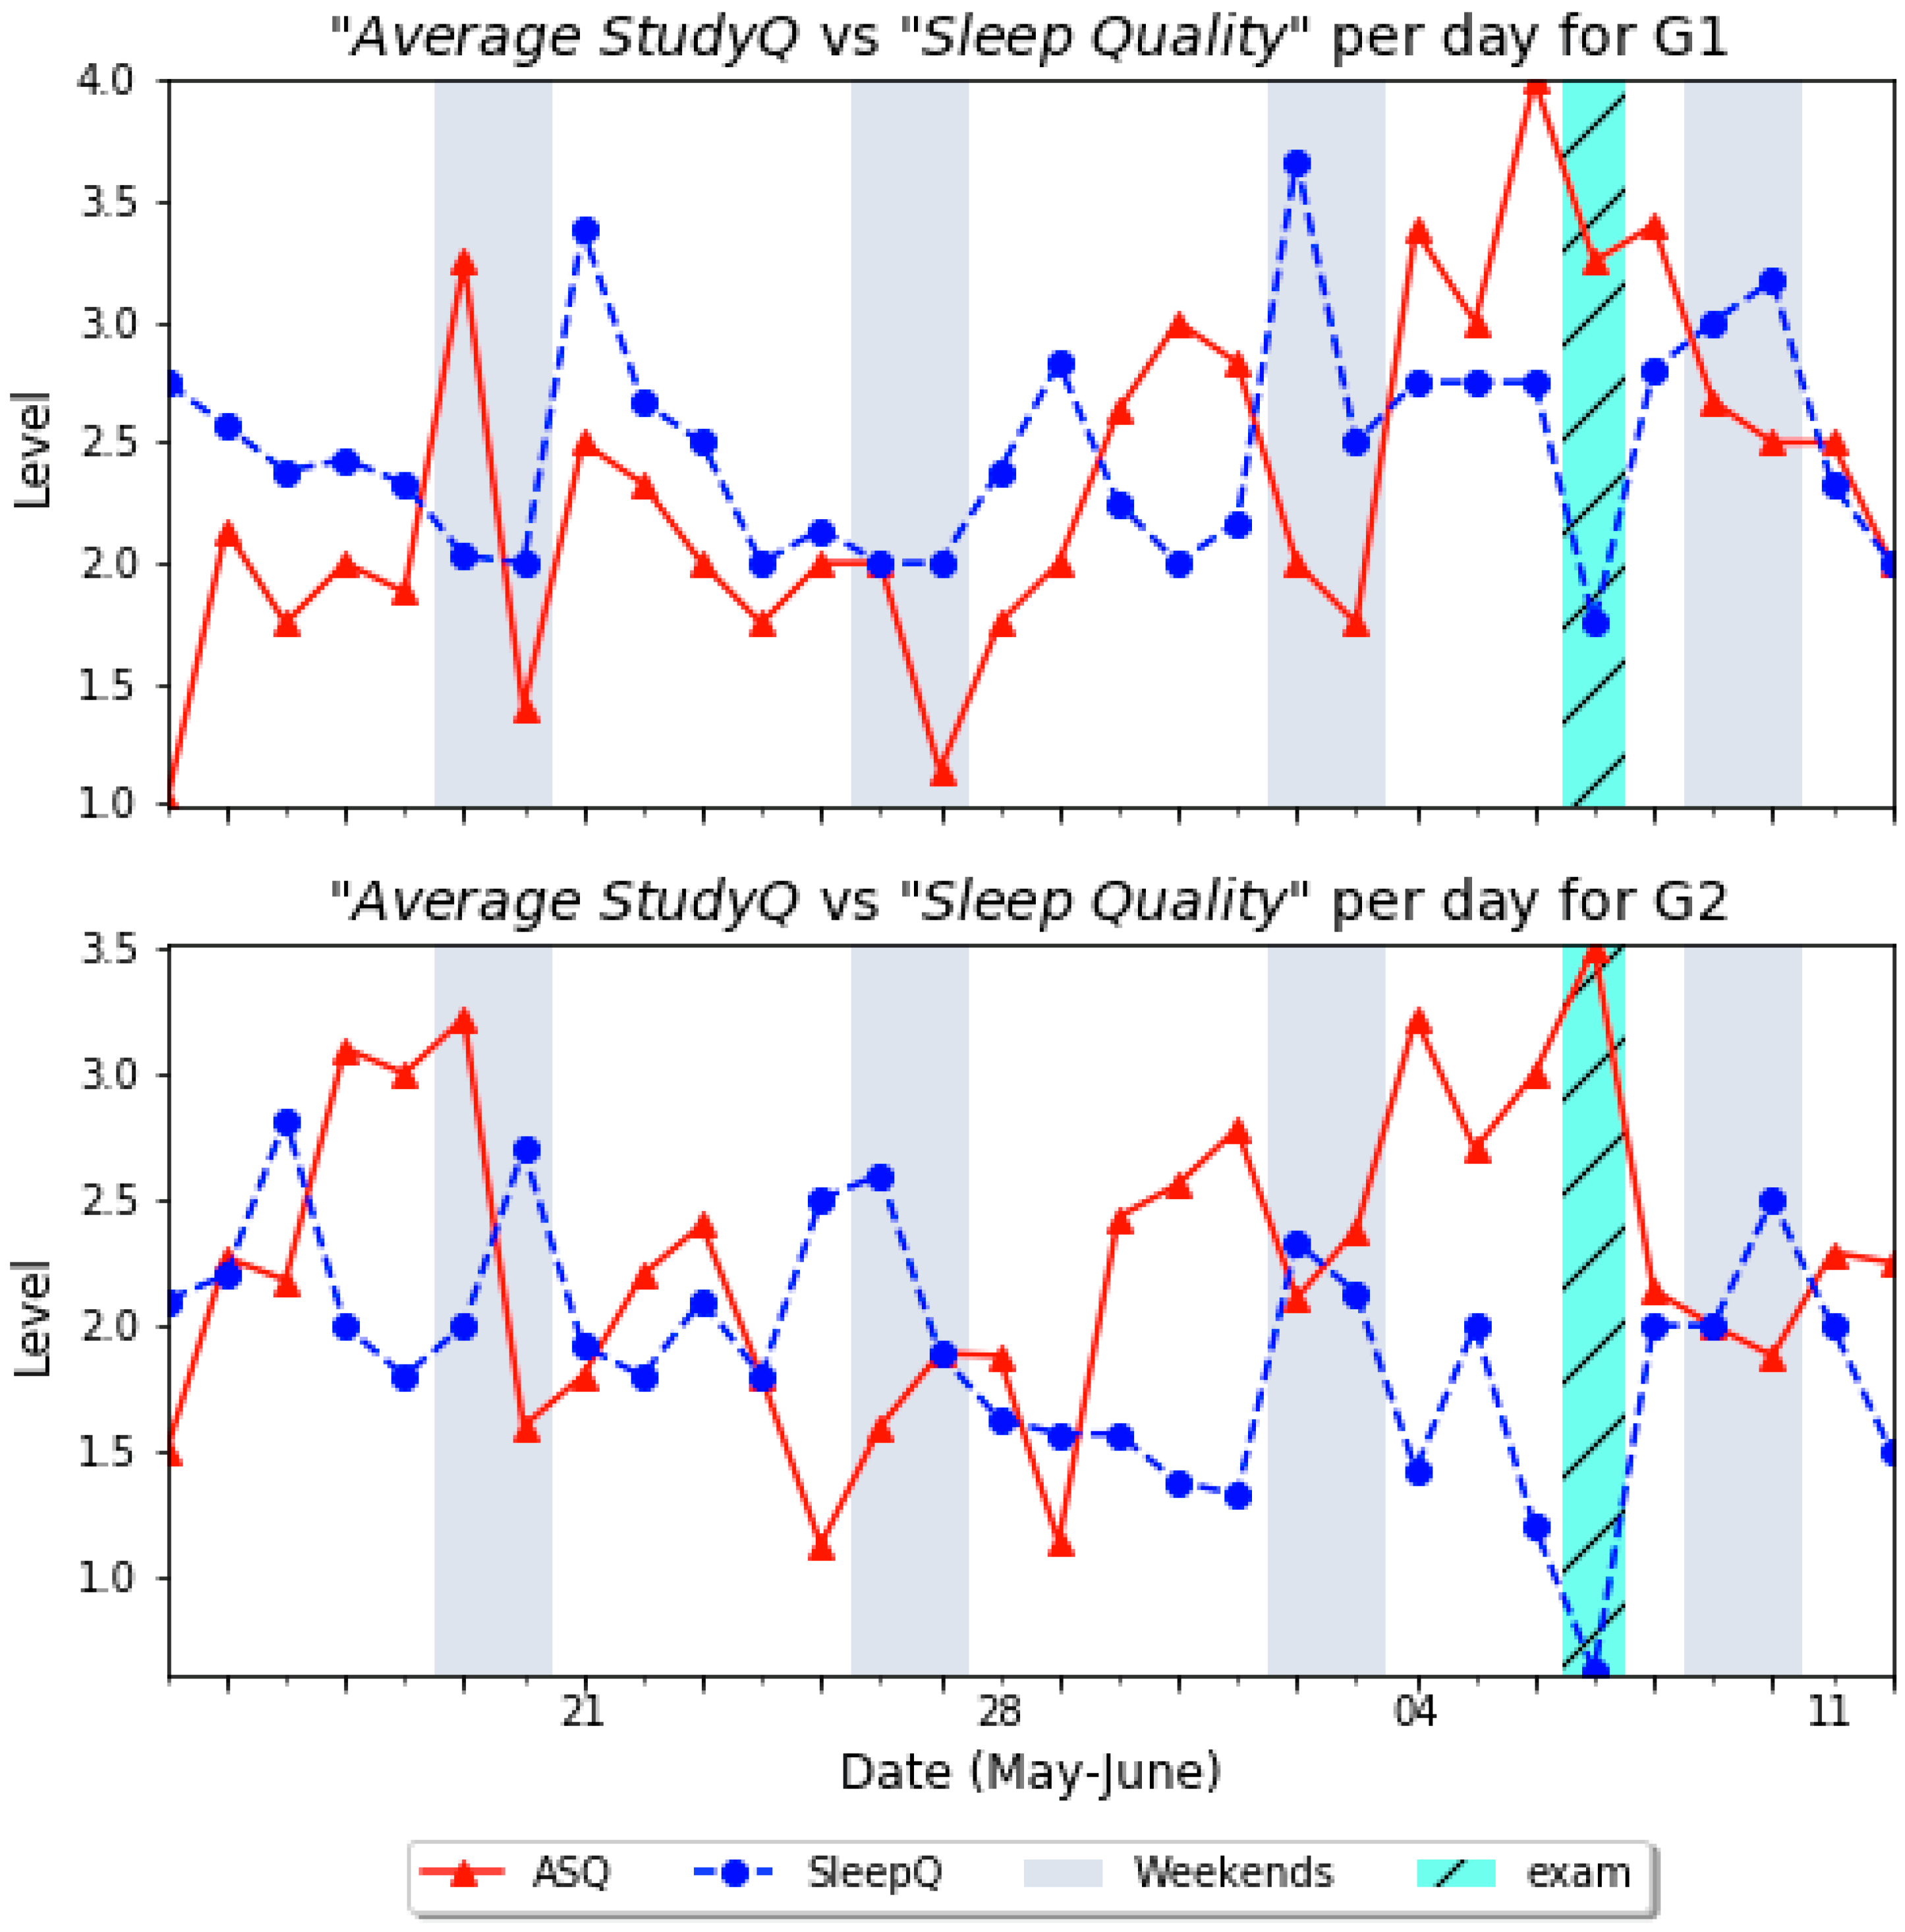
4. Results and Discussion

Before the analysis of the results, it was necessary to purify the data of each student, and to eliminate the raw data of two students who did not finish the study. In addition, from the data collected from 28 students, there were data from two students that we discarded; this was due to the fact that these data represented very few samples and did not allow us to obtain valid information. Therefore, the data really analyzed were from 26 students.
The attributes obtained with their descriptions are presented in Table 1. Using the students’ location data, we calculated the period that the student remained at the university, obtaining two attributes: average time the student stays at university (ATU) and the average time interval (ΔtP). The second attribute can take positive and negative values: a positive value of ΔtP indicates that the student stayed more time than the number of hours registered in their class schedule; while a negative value indicates that a student stayed a shorter time than the number of hours registered in their class schedule.
With the activity recognition obtained via the Google API, we calculated the attribute %Still. Additionally, as mentioned above, with the statistics of SMSs and incoming and outgoing calls, we obtained the average sociability percentage (%S).
On the other hand, with data collected from questionnaires filled in by students, we calculated some attributes, such as the average percentage of physical activity (%AAQ), the percentage of sociability state (%SSQ), the number of sleep hours (NSH), and the Sleep Quality (SQ).
With regard to academic performance, because the tests were conducted in the first bimester of classes, only the grades of subjects that each student frequented in the first bimester were considered. With this information, we obtained the following attributes: Grade Point Average of 1st bimester (GPA1B) and Grade obtained in the 1st bimester in a specific subject (GPx1B).
The CGPA and API values were obtained from the students’ academic records—these values are in a scale from 0 to 40 points.
After obtaining the attributes, we proceeded to analyze them and calculate their correlation. For this purpose, the Pearson’s Correlation Coefficient (R) was calculated, which is independent of the variables’ scale of measurement. Table 2 presents these correlation values, where those with a significance p less than 0.1 were placed in highlighted text. We can see that there is a significant correlation between the attributes ΔtP and ATU with GPA1B. This reflects that students who remain at university for a time equal or greater than the time registered according their schedules, obtain a better result in their academic performance. This correlation can be better observed in Figure 5, where the attributes GPA1B and ΔtP of each student are depicted. We can see a higher percentage of student attendance helps to improve academic performance.
Regarding the other attributes measured with the ISABELA application, we found a strong correlation with the students’ performance. However, the grades point average obtained in the first bimester (GPA1B) have a significant correlation with the historical academic values of CGPA (R = 0.576) and API (R = 0.563). The historic academic values can be used as good attributes in the prediction of students’ academic performance.
On the other hand, we can distinguish strong relationships between certain attributes collected by the application through sensors and the daily questionnaire, as we can see, for example, in the correlation (R = 0.627) with number of Bluetooth devices (ND) near to student and the percentage of sociability calculated (%S). In the case of evaluating the number of sleep hours (NSH) against the amount of study (StudyQ), we can see that these have a negative relation (R = −0.371). While, the StudyQ is correlated positively with the percentage of sociability (%S) (R = 0.513).
In addition, there is a positive relation (R = 0.588) between the Sleep Quality (SQ) and the physical activity reported in the questionnaire (%AAQ). As such, we can conclude that when the students sleep better, they feel more energetic and tend to do more physical activity. The average percentage of sociability state obtained from the questionnaire (%SSQ) is also correlated with the sleeping quality (R = 0.565).
Additionally, we performed an analysis dividing the dataset into two groups based on the grade obtained in the first bimester in the subject where this study was applied GPx1B (value out of 10 points): the first group (G1) was made up of students that obtained 6 points or less, and the second group (G2) was made up of the students that obtained 6.1 or more. Where G1 had eight students and G2 had 18 students. In this case, the average values of the variables for each day and for each group were calculated.
In the case of evaluating the number of sleep hours against the amount of study, we found that these variables have a negative relation for both groups (RG1 = −0.578; RG2 = −0.642). This correlation can be better seen in Figure 6, where the number of hours slept has an inverted y-axis, and we can see that both curves align almost perfectly. Additionally, the groups have different patterns of sleep. Students from G2 start to sleep less 4 days before the exam, which corresponds to the same date in which they increase their study levels; while students from G1 drastically decrease their sleep duration the day before the exam. For both groups, it is also visible that students sleep more at the weekends.
As Figure 7 shows, the amount of study also negatively influences the sleeping quality, as happens with the number of sleeping hours. This was already expected since the sleep quality and the amount of sleeping hours are strongly related. It is also worth noting that the levels of sleep quality for students in G2 are lower than the ones from students in G1, especially in the week of the exam and the one before, which correspond to the weeks in which the study levels increase for G2.

5. Conclusions and Future Direction

This work presents a study on the use of ISABELA, a specifically developed student-centric application, which analyzes student behavior and its relationship with their academic performance. This sensing system is a nonintrusive platform to obtain data, as it passively captures the data without requiring any input from the user. We have shown that there is a significant correlation between the GPA and the time spent at university. Despite this study being exploratory, the results led us to conclude that a higher percentage of attendance at classes in the Ecuadorian educational scheme can help students to improve their academic performance.
In addition, we obtained strong correlations between the sensing data and the information collected with the questionnaire, which shows that there is a harmony between them and opens the way, in the future, to reduce the amount of questions in the questionnaire.
The academic performance of students could be influenced by other factors such as sleep quality, physical activity, study time, amongst others. For this reason, we will continue our study to obtain more information and demonstrate these influences.
There are other factors that could also affect the academic performance such as lighting and noise levels in the classroom, and technologies used in classes, etc. As a direction for future study, we hope to use IoT technology to obtain information about the environment where the students are studying, focusing on future communication trends related to IoT services and applications.
An IoT box has been implemented to collect this information and to determine how these new values can help to improve the academic performance. It will be interesting to analyze the European reality in this area and compare it with the Latin America one. Nowadays, we are using ISABELA to study the reality in several educational institutions in Portugal.

Author Contributions

All authors contributed to the conceptualization and discussed the paper; S.S. wrote the original draft, developed and performed tests and data analytic; P.H. contributed in the tests; J.M.F., D.R. and N.A. participated in the implementation and tests, A.R., J.S.S. and F.B. supervised this work, review and editing. All authors have read and agreed to the published version of the manuscript.

Funding

This research The work presented in this paper was partially carried out in the scope of the SOCIALITE Project (PTDC/EEI-SCR/2072/2014) and the MOBIWISE Project (P2020 SAICTPAC/0011/2015), both co-financed by COMPETE 2020, Portugal 2020 - Operational Program for Competitiveness and Internationalization (POCI), European Union’s ERDF (European Regional Development Fund) and the Portuguese Foundation for Science and Technology (FCT). Partial support was also given by Escuela Politécnica Nacional of Ecuador, and SENESCYT - Secretaría Nacional de Educación Superior, Ciencia, Tecnología e Innovación of Ecuador.

Conflicts of Interest

The authors declare no conflict of interest.

References

  1. UNESCO. Incheon declaration and framework for action for the implementation of Sustainable Development Goal 4; UNESCO Digital Library: Icheon, Korea, 2015. [Google Scholar]
  2. Kaur, P.; Singh, M.; Josan, G.S. Classification and Prediction Based Data Mining Algorithms to Predict Slow Learners in Education Sector. Procedia Comput. Sci. 2015, 57, 500–508. [Google Scholar] [CrossRef] [Green Version]
  3. Konsolakis, K.; Hermens, H.; Villalonga, C.; Vollenbroek-Hutten, M.; Banos, O. Human Behaviour Analysis through Smartphones. Proceedings 2018, 2, 1243. [Google Scholar] [CrossRef] [Green Version]
  4. Harari, G.M.; Müller, S.R.; Aung, M.S.; Rentfrow, P.J. Smartphone sensing methods for studying behavior in everyday life. Curr. Opin. Behav. Sci. 2017, 18, 83–90. [Google Scholar] [CrossRef]
  5. Wang, W.; Harari, G.M.; Wang, R.; Müller, S.R.; Mirjafari, S.; Masaba, K.; Campbell, A.T. Sensing Behavioral Change over Time: Using Within-Person Variability Features from Mobile Sensing to Predict Personality Traits. Proc. ACM Interact. Mob. Wearable Ubiquitous Technol. 2018, 2, 141. [Google Scholar] [CrossRef]
  6. Wang, R.; Chen, F.; Chen, Z.; Li, T.; Harari, G.; Tignor, S.; Zhou, X.; Ben-Zeev, D.; Campbell, A.T. StudentLife: Assessing mental health, academic performance and behavioral trends of college students using smartphones. In Proceedings of the 2014 ACM Conference on Ubiquitous Computing, UbiComp’14, Seattle, WA, USA, 13–17 September 2014. [Google Scholar]
  7. Harari, G.M.; Gosling, S.D.; Wang, R.; Chen, F.; Chen, Z.; Campbell, A.T. Patterns of behavior change in students over an academic term: A preliminary study of activity and sociability behaviors using smartphone sensing methods. Comput. Hum. Behav. 2017, 67, 129–138. [Google Scholar] [CrossRef]
  8. Wang, R.; Harari, G.; Hao, P.; Zhou, X.; Campbell, A.T. SmartGPA: How smartphones can assess and predict academic performance of college students. In Proceedings of the 2015 ACM International Joint Conference on Pervasive and Ubiquitous Computing, Osaka, Japan, 7–11 September 2015. [Google Scholar]
  9. Rubiano, S.M.M.; Garcia, J.A.D. Analysis of Data Mining Techniques for Constructing a Predictive Model for Academic Performance. IEEE Lat. Am. Trans. 2016, 14, 2783–2788. [Google Scholar] [CrossRef]
  10. Pandey, M.; Taruna, S. Towards the integration of multiple classifier pertaining to the Student’s performance prediction. Perspect. Sci. 2016, 8, 364. [Google Scholar] [CrossRef] [Green Version]
  11. Heredia, D.; Amaya, Y.; Barrientos, E.; Heredia-Vizcaino, D. Student Dropout Predictive Model Using Data Mining Techniques. IEEE Lat. Am. Trans. 2015, 13, 3127–3134. [Google Scholar] [CrossRef]
  12. Mishra, T.; Kumar, D.; Gupta, S.; Mishra, T.; Kumar, D.; Gupta, S. Mining Students’ Data for Prediction Performance. In Proceedings of the 2014 Fourth International Conference on Advanced Computing & Communication Technologies, Rohtak, India, 8–9 February 2014. [Google Scholar]
  13. Mueen, A.A.; Zafar, B.; Manzoor, U. Modeling and Predicting Students’ Academic Performance Using Data Mining Techniques. Int. J. Mod. Educ. Comput. Sci. 2016, 8, 36–42. [Google Scholar] [CrossRef]
  14. Shahiri, A.M.; Husain, W.; Rashid, N.A. A Review on Predicting Student’s Performance Using Data Mining Techniques. Procedia Comput. Sci. 2015, 72, 414–422. [Google Scholar] [CrossRef] [Green Version]
  15. Fernandes, J.; Raposo, D.; Sinche, S.; Armando, N.; Silva, J.S.; Rodrigues, A.; Macedo, L.; Oliveira, H.G.; Boavida, F. A Human-in-the-Loop Cyber-Physical Approach for Students’ Performance Assessment. In Proceedings of the Fourth International Workshop on Social Sensing—SocialSense’19, Montreal, QC, Canada, 15 April 2019. [Google Scholar]
  16. Fernandes, J.; Raposo, D.; Armando, N.; Sinche, S.; SáSilva, J.; Rodrigues, A.; Pereira, V.; Oliveira, H.G.; Macedo, L.; Boavida, F. ISABELA—A Socially-Aware Human-in-the-Loop Advisor System. Online Soc. Netw. Media 2020, 16, 100060. [Google Scholar] [CrossRef]
  17. CISUC Members. SOCIALITE - Social-Oriented Internet of Things Architecture, Solutions and Environment. Available online: https://www.cisuc.uc.pt/projects/show/215 (accessed on 25 March 2020).
  18. Nunes, D.; Silva, J.S.; Boavida, F. A Practical Introduction to Human-in-the-Loop Cyber-Physical Systems, 1st ed.; Wiley-IEEE Press: Hoboken, NJ, USA, 2018; 320p. [Google Scholar]
  19. Fazio, M.; Celesti, A.; Marquez, F.G.; Glikson, A.; Villari, M. Exploiting the FIWARE cloud platform to develop a remote patient monitoring system. In Proceedings of the IEEE Symposium on Computers and Communications, Larnaca, Cyprus, 6–9 July 2016. [Google Scholar]
  20. Spring Community. Spring Boot 2.2.5. Available online: https://spring.io/projects/spring-boot (accessed on 25 March 2020).
Figure 1. ISABELA architecture for data acquisition and processing.
Telecom 01 00003 g001
Figure 2. ISABELA cloud.
Telecom 01 00003 g002
Figure 3. ISABELA application interface of Localization.
Telecom 01 00003 g003
Figure 4. Chatbot used to send messages to students.
Telecom 01 00003 g004
Figure 5. Grade Point Average of 1st bimester (GPA1B) and ΔtP by student.
Telecom 01 00003 g005
Figure 6. StudyQ and the Number of sleep hours (NSH) per day of G2.
Telecom 01 00003 g006
Figure 7. StudyQ and Sleep Quality (SQ) reported.
Telecom 01 00003 g007
Table 1. Description of attributes analyzed.
Data SourceAttributeDescription
SensingΔtPAverage time interval (difference between number of hours according to class schedule and the time spent in the university). It is measured with ISABELA application.
ATUAverage time the student stays at the university (h).
%StillAverage percentage that the student stays without physical activity (still-state).
%SAverage percentage of sociability calculated with SMSs and calls statistics.
NDAverage number of Bluetooth devices near the student.
%AloneAverage percentage of time that a student does not have Bluetooth devices nearby.
Questionnaire%AAQAverage percentage of physical activity reported in the questionnaire.
%SSQAverage percentage of sociability state obtained from the questionnaire.
SQAverage of the Sleep Quality reported by the student in the questionnaire.
NSHAverage number of sleep hours obtained from the questionnaire.
StudyQAverage of the dedication to study reported by the student in the questionnaire.
Academic DatabaseGPx1BGrade obtained in the first bimester in the subject where this study was applied (value out of 10 points).
GPxFinal grade obtained in the subject where this study was applied (value out of 40 points).
GPA1BGrade Point Average in the first bimester (value out of 10 points).
GPAFinal grade point average (value out of 40 points).
CGPACumulative grade point average, the academic record of the student in his academic life (value out of 40 points).
APIAcademic performance index based on the cumulative GPA and the number of subjects failed (value out of 40 points).
NCCredit numbers registered by student in this school year.
Table 2. Correlations between attributes obtained.
RGPA1BGx1BGPAGPxCGPAAPIΔtpATU%Still%AAQ%SSQ%SSQNHSND%AloneNCStudyQ
Δtp0.5080.0270.3860.0150.1120.1481
ATU0.434−0.0330.2980.0640.1410.2200.9061
%Still0.2030.2080.1040.0570.0750.262−0.200−0.0941
%AAQ0.0580.0690.039−0.059−0.267−0.2490.0550.0760.1061
%SSQ−0.0040.000−0.093−0.257−0.327−0.193−0.066−0.0400.4790.7001
%S0.2440.2590.1010.076−0.0890.1300.0730.2320.3550.4380.4381
SQ−0.0050.0030.037−0.240−0.217−0.0780.1130.1060.0350.5650.5650.2521
NHS−0.023−0.013−0.0420.173−0.035−0.0970.035−0.009−0.275−0.292−0.2920.094−0.1271
ND0.1600.1720.049−0.066−0.136−0.1070.4240.507−0.0210.2770.2770.6270.438−0.0461
%Alone−0.072−0.0790.081−0.131−0.0610.082−0.053−0.2020.2620.1470.147−0.177−0.103−0.018−0.4841
NC0.0600.0740.0040.0250.1930.2360.0140.3900.0590.1510.0190.3770.005−0.0970.324−0.5041
Study0.3500.3510.1600.0480.0470.0990.2490.4540.2080.5100.4270.5130.093−0.3710.397−0.3830.6281

