1. Introduction
Shale oil reservoirs are characterized by low matrix permeability, complex pore structures, and strong dependence on hydraulic fractures. Production is commonly dominated by fracture-connected flow during the early stage, whereas long-term productivity increasingly depends on slow matrix-to-fracture fluid transfer and is accompanied by rapid pressure depletion [
1,
2]. Cyclic gas injection has therefore been investigated as a means of replenishing reservoir energy and mobilizing oil that cannot be effectively recovered through primary depletion [
3].
Among the available injection gases, CO
2 is particularly attractive because of its high solubility in crude oil and its potential for simultaneous enhanced oil recovery and geological storage. Dissolved CO
2 can swell the oil phase and reduce its viscosity, while compositional exchange between CO
2-rich and oil-rich phases can mobilize light and intermediate hydrocarbons [
4,
5]. The magnitude of these effects depends strongly on pressure, temperature, crude oil composition, and the saturation or miscibility state of the fluid [
6]. Reservoir-specific PVT characterization is therefore essential for distinguishing viscosity reduction caused primarily by CO
2 dissolution from that associated with compositional redistribution.
CO
2 transport in shale reservoirs differs substantially from that in conventional flooding systems. Injected CO
2 first occupies hydraulic and natural fractures and subsequently enters the low-permeability matrix through pressure-driven flow and molecular diffusion [
7]. Consequently, the effective CO
2–oil contact volume and recovery response depend on injection pressure, soaking time, matrix permeability, reservoir heterogeneity, and fracture geometry [
8,
9]. Laboratory equilibration times obtained in a closed and continuously stirred PVT cell therefore characterize fluid-property stabilization within a confined volume and cannot be directly interpreted as field-scale soaking times.
In addition to viscosity and density changes, CO
2 injection can redistribute hydrocarbons between fluid phases. Laboratory and core-scale studies have shown that CO
2 preferentially mobilizes light and intermediate fractions, potentially leaving the contacted residual oil relatively enriched in heavier components while producing a lighter hydrocarbon stream [
10,
11]. This distinction is important because residual-oil composition and produced-oil composition describe different fluid populations and should not be interpreted as contradictory observations. CO
2–crude oil systems may also exhibit complex liquid–liquid–vapor behavior, particularly when compositional changes destabilize the heavy fraction [
12]. CO
2-induced asphaltene precipitation may affect phase behavior, formation damage, and flow assurance, but its identification requires dedicated onset pressure, SARA, or solid-phase measurements and an appropriate thermodynamic model [
13]. These phenomena were not directly quantified in the present study and are therefore considered when defining the scope and limitations of the phase-behavior interpretation. Direct pore-scale and coreflood studies have shown that CO
2-induced asphaltene deposition can plug pore throats and reduce permeability [
14,
15]. In the present work, no SARA analysis, asphaltene onset test, or deposited solid mass balance was available, and the compositional model did not include a solid-asphaltene phase. Incorporating precipitation and deposition would therefore require unconstrained parameters and could imply a level of predictive capability unsupported by the available data. Accordingly, these effects were excluded from both the experimental interpretation and field-scale simulation; where CO
2 destabilizes asphaltenes, the predicted conductivity and incremental recovery may be higher than those attainable in the reservoir.
Previous studies have generally investigated shale oil production decline, laboratory CO
2–oil interactions, hydrocarbon compositional changes, or reservoir-scale optimization separately [
16,
17,
18]. As a result, the connection among depletion-induced oil deterioration, CO
2-induced live-oil property changes, phase-specific compositional redistribution, and field-scale production response remains insufficiently established. This limitation is particularly relevant to deeply buried lacustrine shale oil reservoirs under high-temperature and high-pressure conditions.
The Mabei shale oil reservoir in the Junggar Basin provides a representative case for investigating these coupled processes. In this study, produced-oil samples collected from the same well at two development stages were used to characterize depletion-induced changes in dead-oil viscosity and whole-hydrocarbon composition. Recombined live oil was then investigated at reservoir temperature and pressure using high-pressure PVT measurements, viscosity and density tests, and whole-hydrocarbon gas chromatography. Finally, a history-matched compositional reservoir model was used to evaluate pressure maintenance, spatial viscosity evolution, regional residual-oil composition, produced-oil composition, and production response under different added CO2/oil molar ratios. The objectives were to (1) quantify depletion-induced changes in produced-oil properties; (2) determine the effects of the added CO2/oil molar ratio and contact time on live-oil viscosity, density, and oil-phase composition; and (3) establish a consistent laboratory-to-field interpretation of CO2-induced compositional redistribution.
2. Experimental Materials and Methods
2.1. Materials
The experimental fluids consisted of dehydrated and degassed crude oil, recombination gas, and CO2 with a purity of 99.9%. The crude oil sample used for live-oil recombination was collected from the lower sweet-spot interval of the Fengcheng Formation in Well M at a true vertical depth of 4666.0–4691.6 m. After standing for 3 d, the upper oil phase was separated, dehydrated, and degassed. Recombination gas was prepared according to the measured formation-gas composition of the target interval.
Recombined live oil was prepared by charging the dehydrated and degassed crude oil and the prepared recombination gas into the reservoir fluid recombination apparatus at a target gas–oil ratio of 65 m
3/m
3. The system was heated to 106.75 °C, pressurized to 65.07 MPa, and continuously stirred until the pressure and fluid properties stabilized. The measured saturation pressure of the recombined live oil was 47.8 MPa at 106.75 °C. Because the experimental pressure was higher than the saturation pressure, the initial recombined oil was undersaturated and contained no free hydrocarbon gas phase before CO
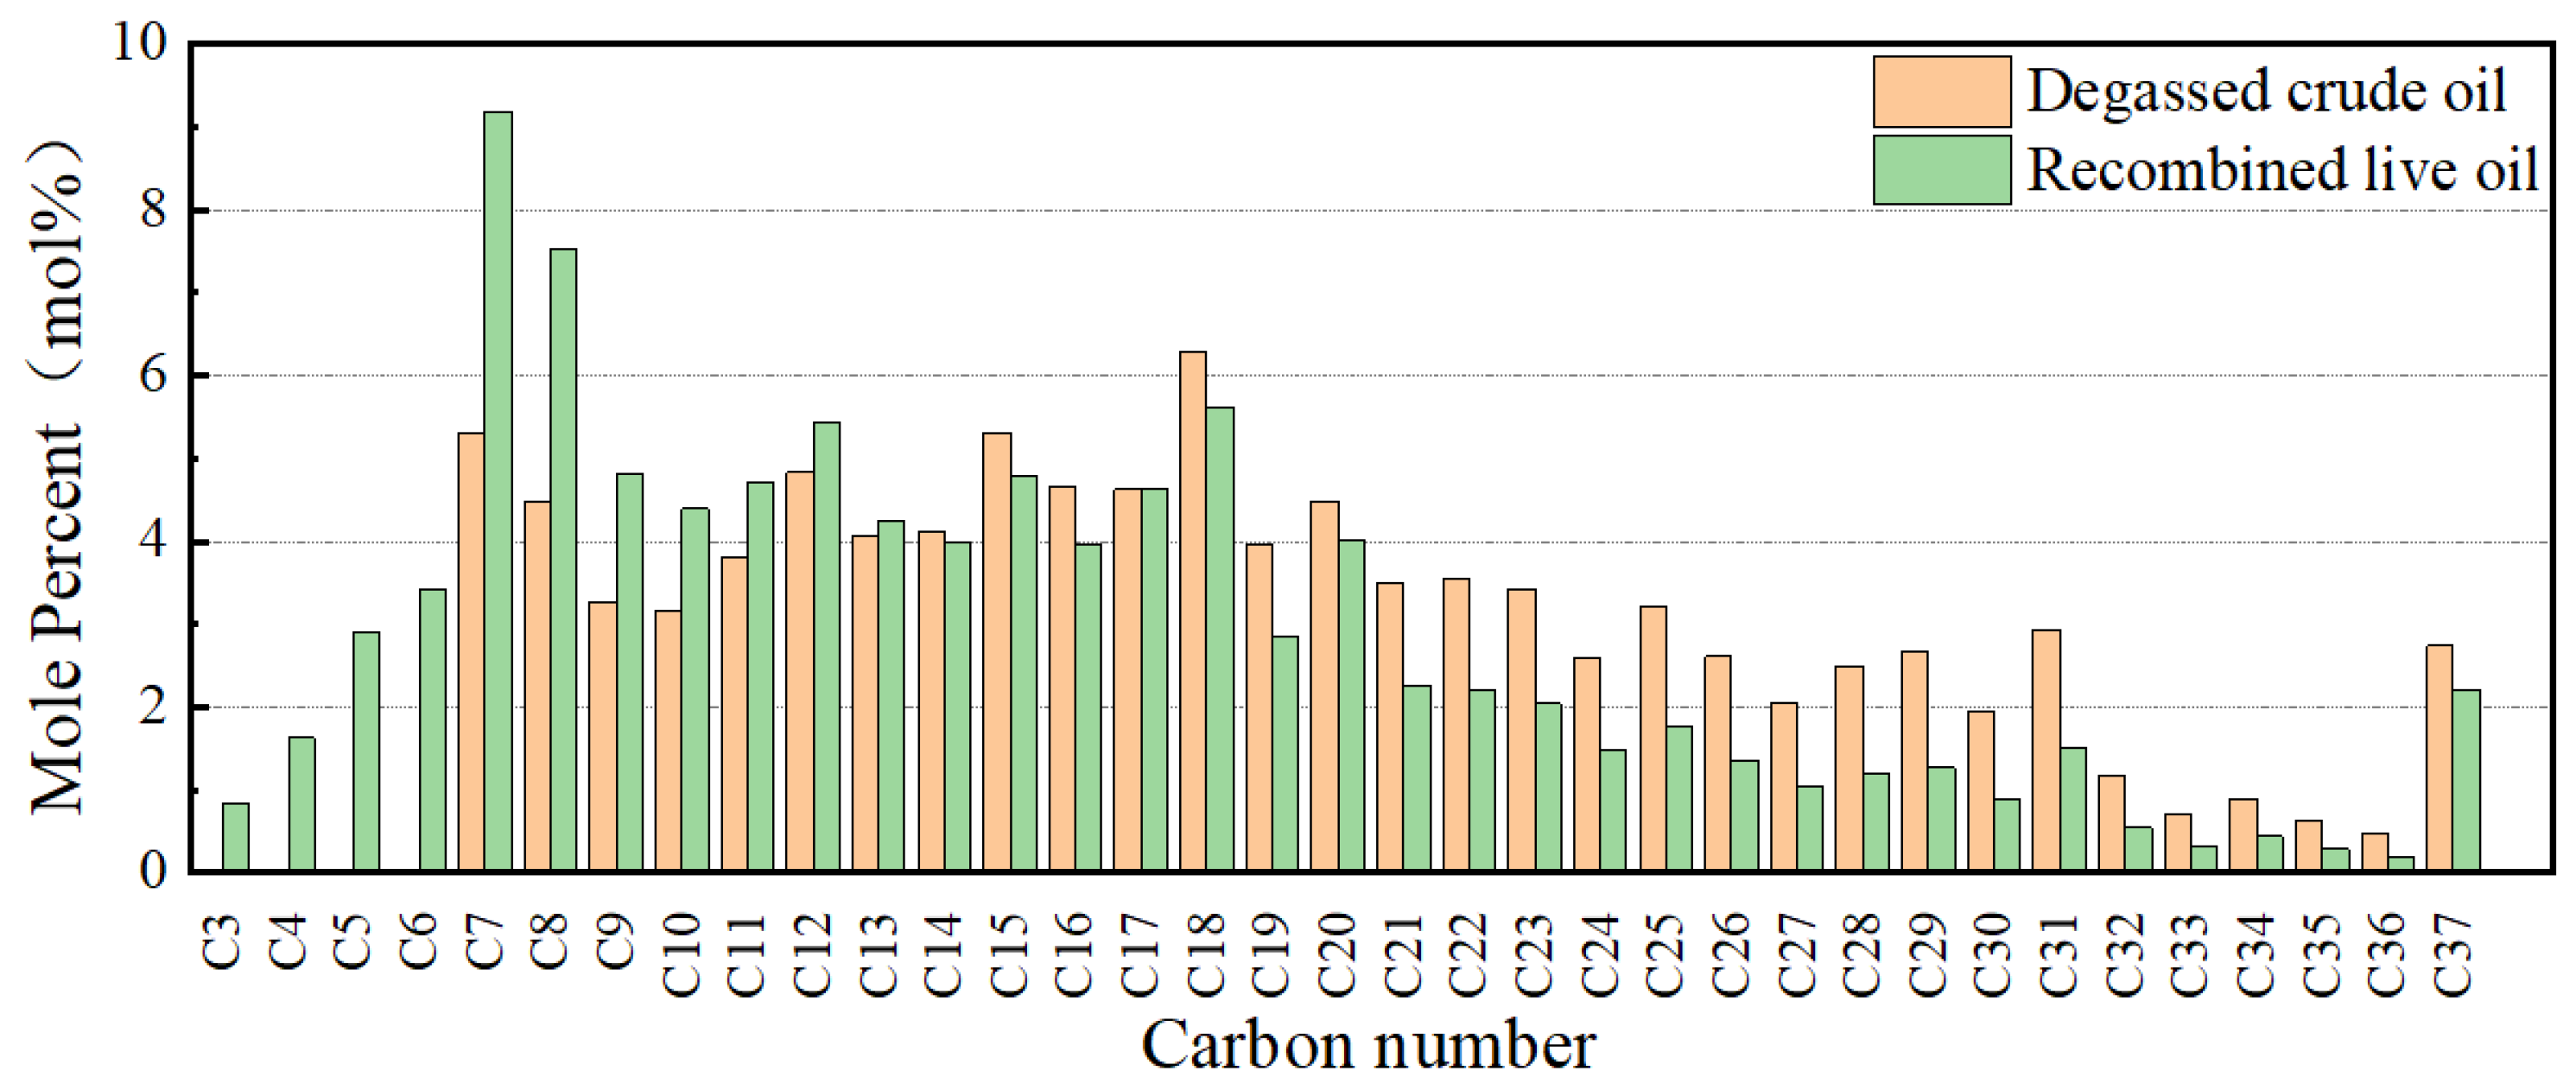
2 addition. The principal PVT properties are summarized in
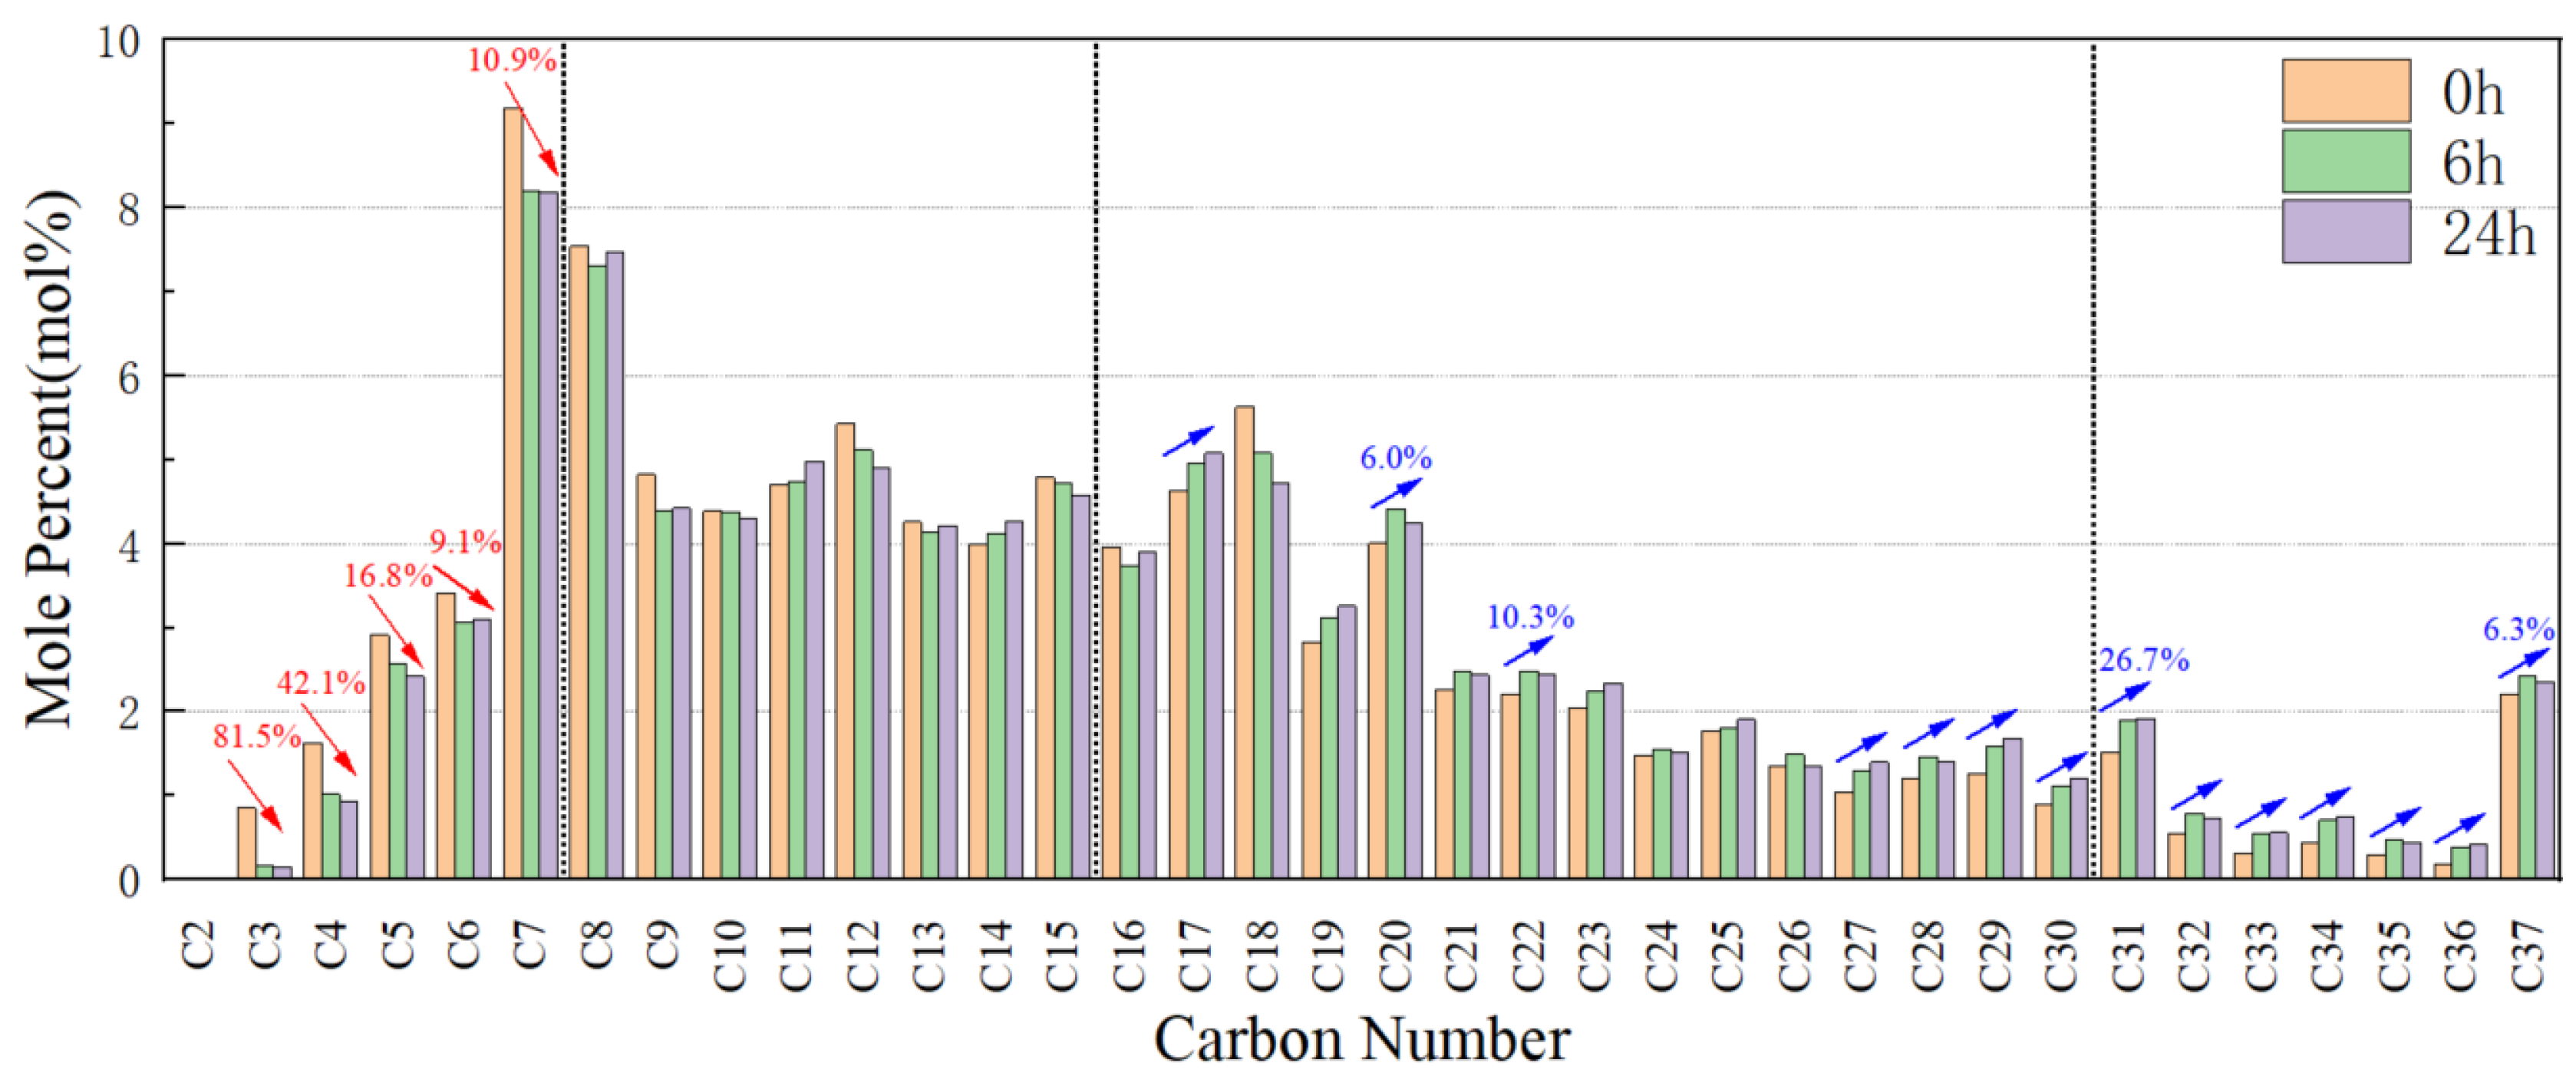
Table 1. The whole-hydrocarbon compositions of crude oil under different states are shown in
Figure 1.
Two produced-oil samples were collected from Well M to characterize depletion-related property evolution: an early-stage sample from October 2023 and a later-stage sample from October 2025. Both samples were dehydrated and degassed using the same procedure before viscosity and whole-hydrocarbon analyses. These samples were used only for the comparison of surface dead-oil properties and were not assumed to directly represent live-oil viscosity under reservoir conditions.
2.2. Instrument
High-pressure phase behavior and live-oil preparation were conducted using a PVT CELL 240/1500FV analyzer (Sanchez Technologies, Frépillon, France). Viscosity was measured using an RBV 1000 high-temperature and high-pressure falling-ball viscometer (Vinci Technologies, Nanterre, France), and whole-hydrocarbon composition was analyzed using an Agilent 7890 gas chromatograph (Agilent Technologies Co., Ltd., Beijing, China). CO
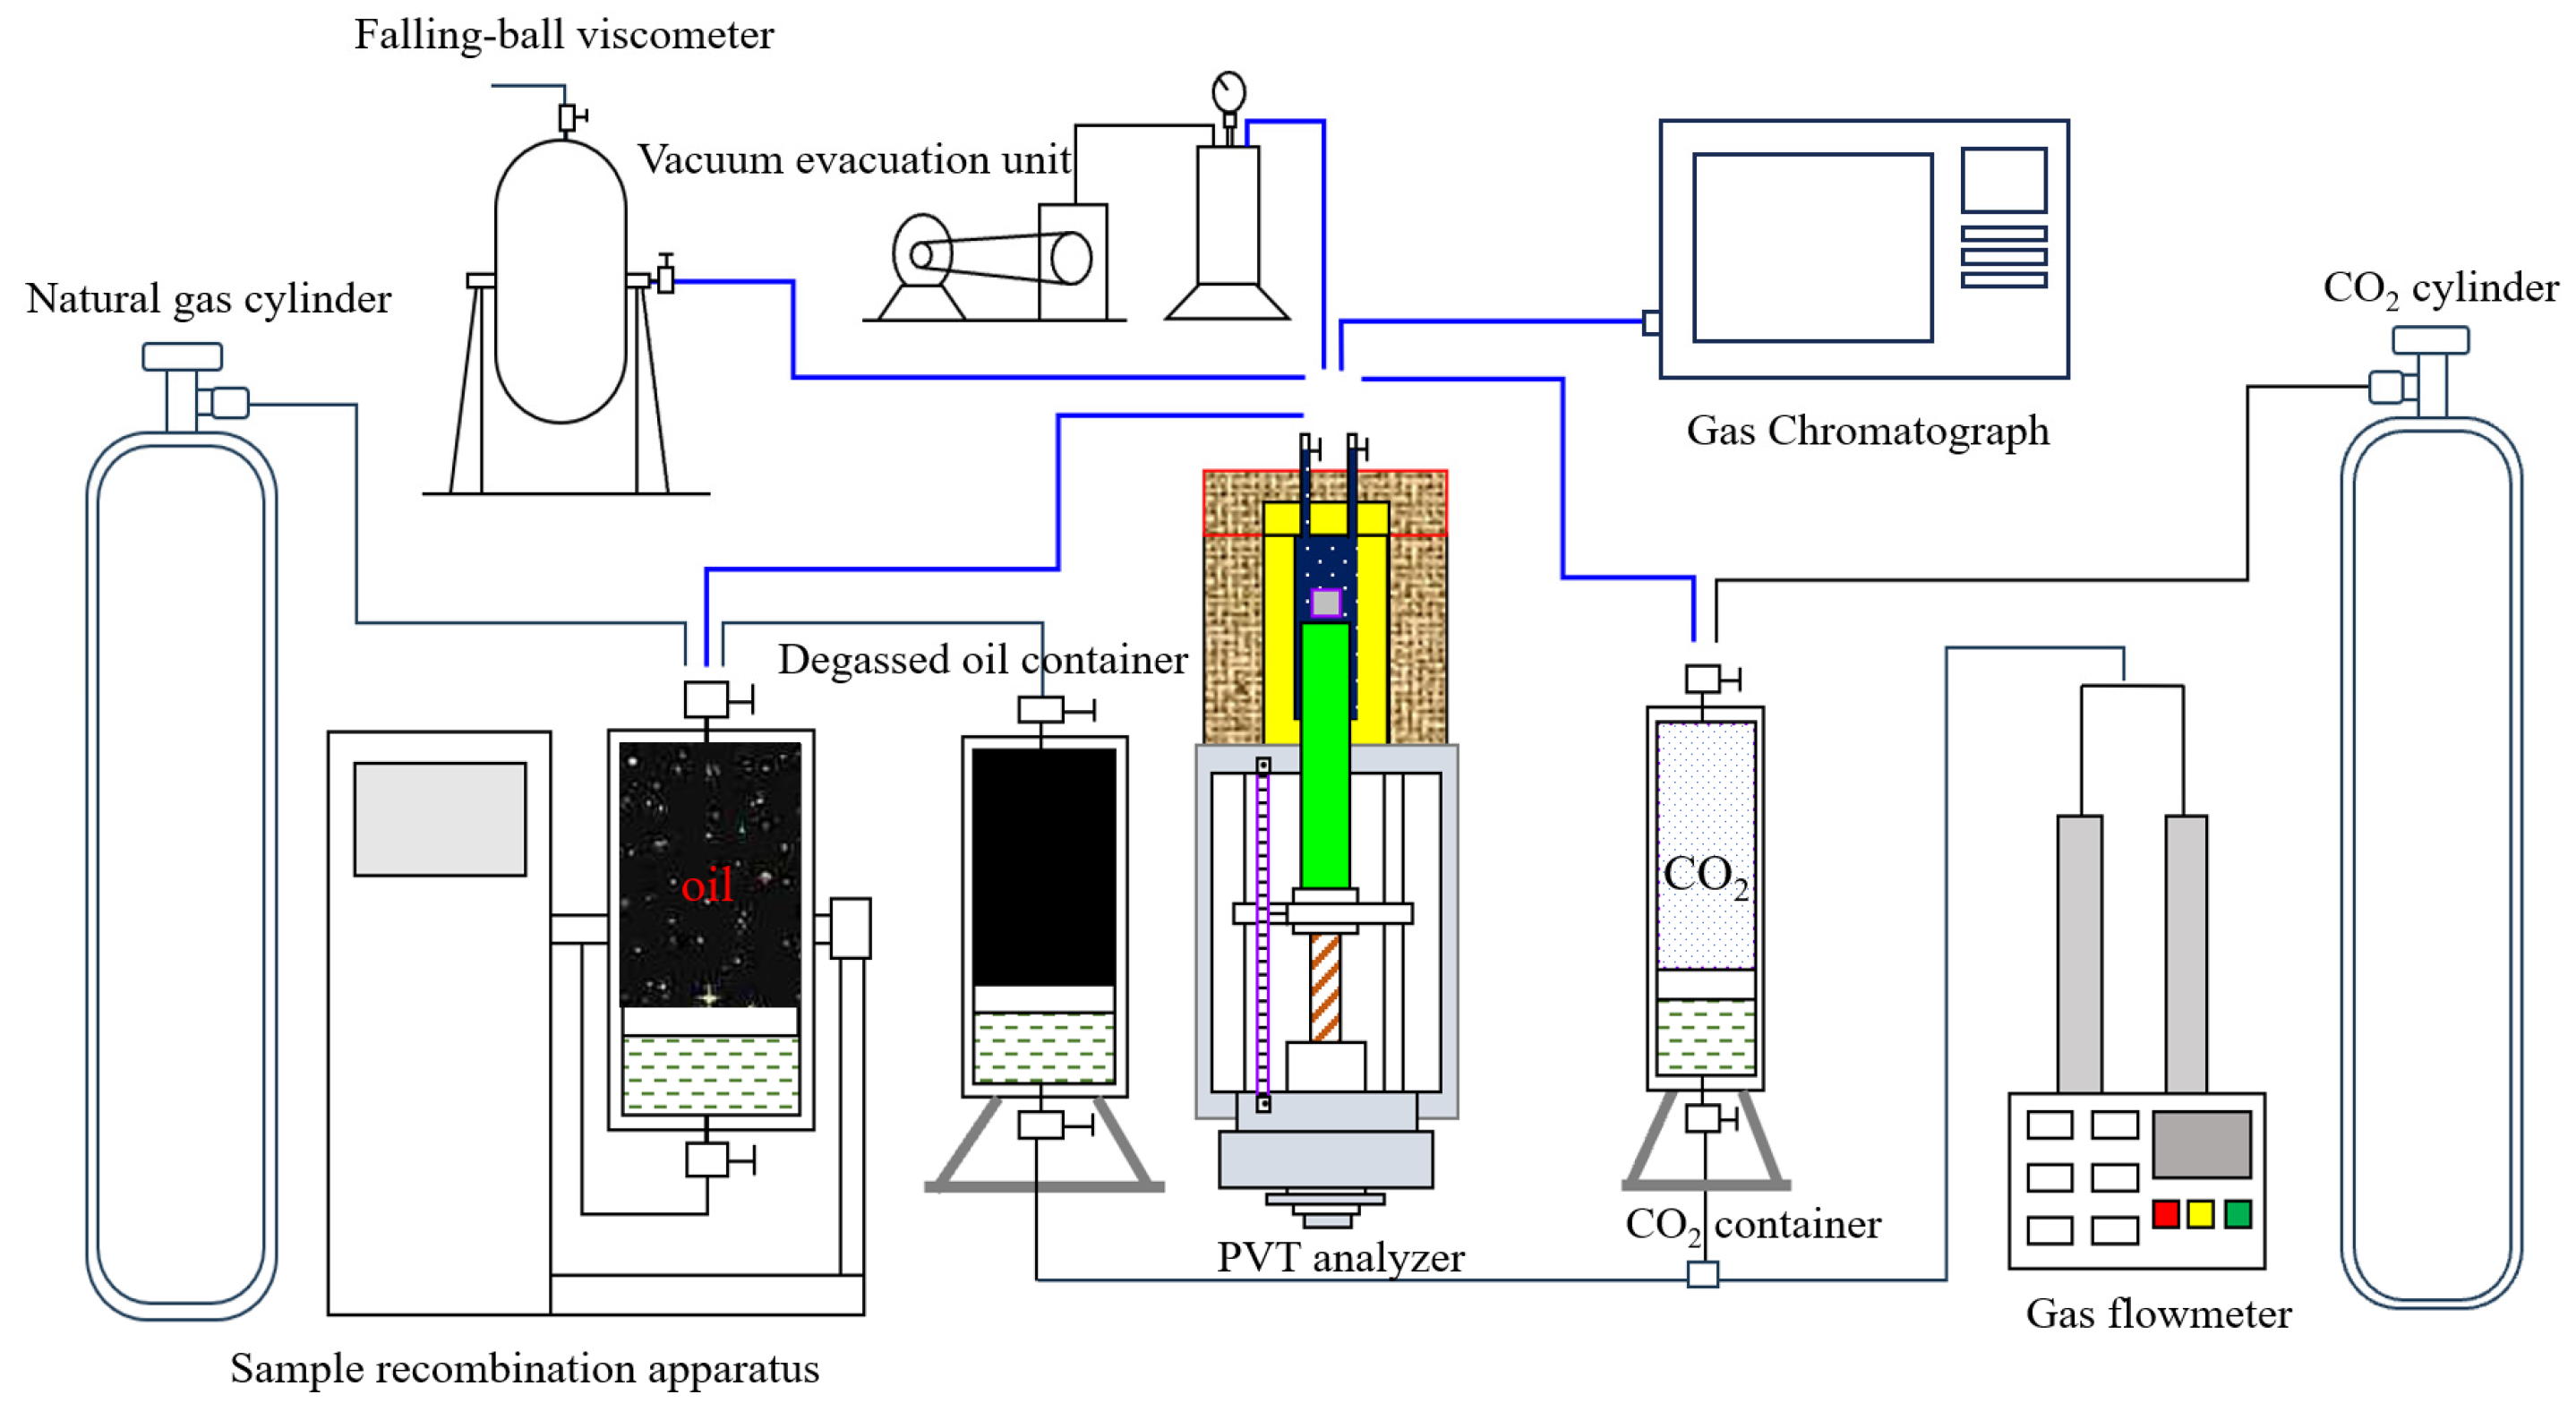
2 was quantified in a calibrated intermediate vessel at 5 MPa and subsequently displaced into the PVT cell using an ISCO metering pump (Teledyne ISCO, Lincoln, NE, USA). The experimental setup is shown in
Figure 2.
2.3. Experimental Protocol and Procedures
Two groups of experiments were conducted. First, the viscosities of the October 2023 and October 2025 dehydrated and degassed produced-oil samples were measured at 50, 80, and 100 °C under atmospheric pressure to characterize depletion-related dead-oil property evolution. Second, high-pressure CO
2–oil experiments were performed using independently prepared recombined live-oil samples at 106.75 °C and 65.07 MPa to evaluate the effects of the added CO
2/oil molar ratio and contact time. The experimental matrices are summarized in
Table 2 and
Table 3.
The reported added CO
2/oil molar ratio (%) is defined as the molar ratio of added CO
2 to the initial recombined oil:
where
is the amount of injected CO
2, and
is the estimated mole amount of the initial recombined oil. The average molecular weight of the oil was estimated as 198.6 g/mol from the measured whole-hydrocarbon composition. With an oil density of 0.832 g/cm
3, 100 mL oil corresponded to approximately 0.419 mol. The CO
2 amounts required for the designed ratio of 0, 10, 20, 40, 60, and 80 mol CO
2 per 100 mol oil were then calculated accordingly.
For each added CO2/oil molar ratio, a fresh 100 mL recombined live-oil sample was charged into the evacuated PVT cell. The sample was heated to 106.75 °C and maintained for 10 h, after which the pressure was adjusted to 65.07 MPa. The initial live-oil viscosity and density were measured before CO2 injection. The calculated amount of CO2 was then injected using the metering pump, and the cell was continuously stirred to promote mass transfer. Independent oil samples were used for all added CO2/oil molar ratios to avoid cumulative compositional changes caused by sequential CO2 addition.
For the added CO2/oil molar ratio experiments, the fluid was maintained under continuous stirring for 6 h before measurement. Additional tests at the highest added CO2/oil molar ratio were conducted for 12 and 24 h to evaluate the effect of contact time. The 0% reference denotes the original recombined live oil before CO2 addition. After the prescribed contact period, the system was considered to have approached laboratory-scale quasi-equilibrium when temperature and pressure remained within ±0.5 °C and ±0.1 MPa and consecutive viscosity measurements differed by less than 5%. Viscosity and density were measured for the equilibrated oil-rich phase. Samples withdrawn for chromatography likewise represented the oil-rich residual phase rather than the total CO2–oil mixture. Each viscosity measurement was repeated three times using the same equilibrated sample, and the arithmetic mean was reported. The error bars in the corresponding viscosity plots represent one standard deviation. The relative standard deviation was below 5% for all viscosity measurements.
2.4. Laboratory-to-Field Scaling and Numerical Simulation
A field-scale compositional reservoir model was constructed based on the geological, fluid, well, and hydraulic-fracture characteristics of Well M. The model dimensions were 1600 m × 300 m × 40 m and comprised 107,800 grid blocks. Local grid refinement was applied around the horizontal well and hydraulic fractures to improve the representation of fracture-controlled flow and CO2–oil contact.
The 1400 m horizontal well was intersected by six transverse hydraulic fractures. The main reservoir, grid, fracture, and operating parameters are summarized in
Table 4. The initial reservoir pressure and temperature were set to 65.07 MPa and 106.75 °C, respectively. CO
2 huff-n-puff consisted of 90 days of injection and 20 days of soaking, followed by 15 years of production. Five cases with added CO
2/oil molar ratios of 0, 10, 15, 20, and 25% were simulated.
The compositional fluid model was developed using CMG WinProp. Based on the whole-hydrocarbon composition, the reservoir fluid was represented by nine pseudo-components: CO2, N2, C1, C2–C3, C4–C6, C7–C13, C14–C21, C22–C36, and C37+. The Peng–Robinson equation of state was used to describe the phase behavior of the recombined live oil and CO2–oil mixtures. No solid asphaltene phase, deposition kinetics, pore-blocking function, or permeability reduction module was activated. This modeling choice was made because the available measurements constrain fluid-phase PVT behavior and hydrocarbon composition, but not asphaltene onset, transport, deposition, or formation damage parameters.
The fluid model was constrained by the measured saturation pressure, solution gas–oil ratio, oil formation volume factor, viscosity, and density. CO
2 swelling calculations were then conducted for mixtures corresponding to added CO
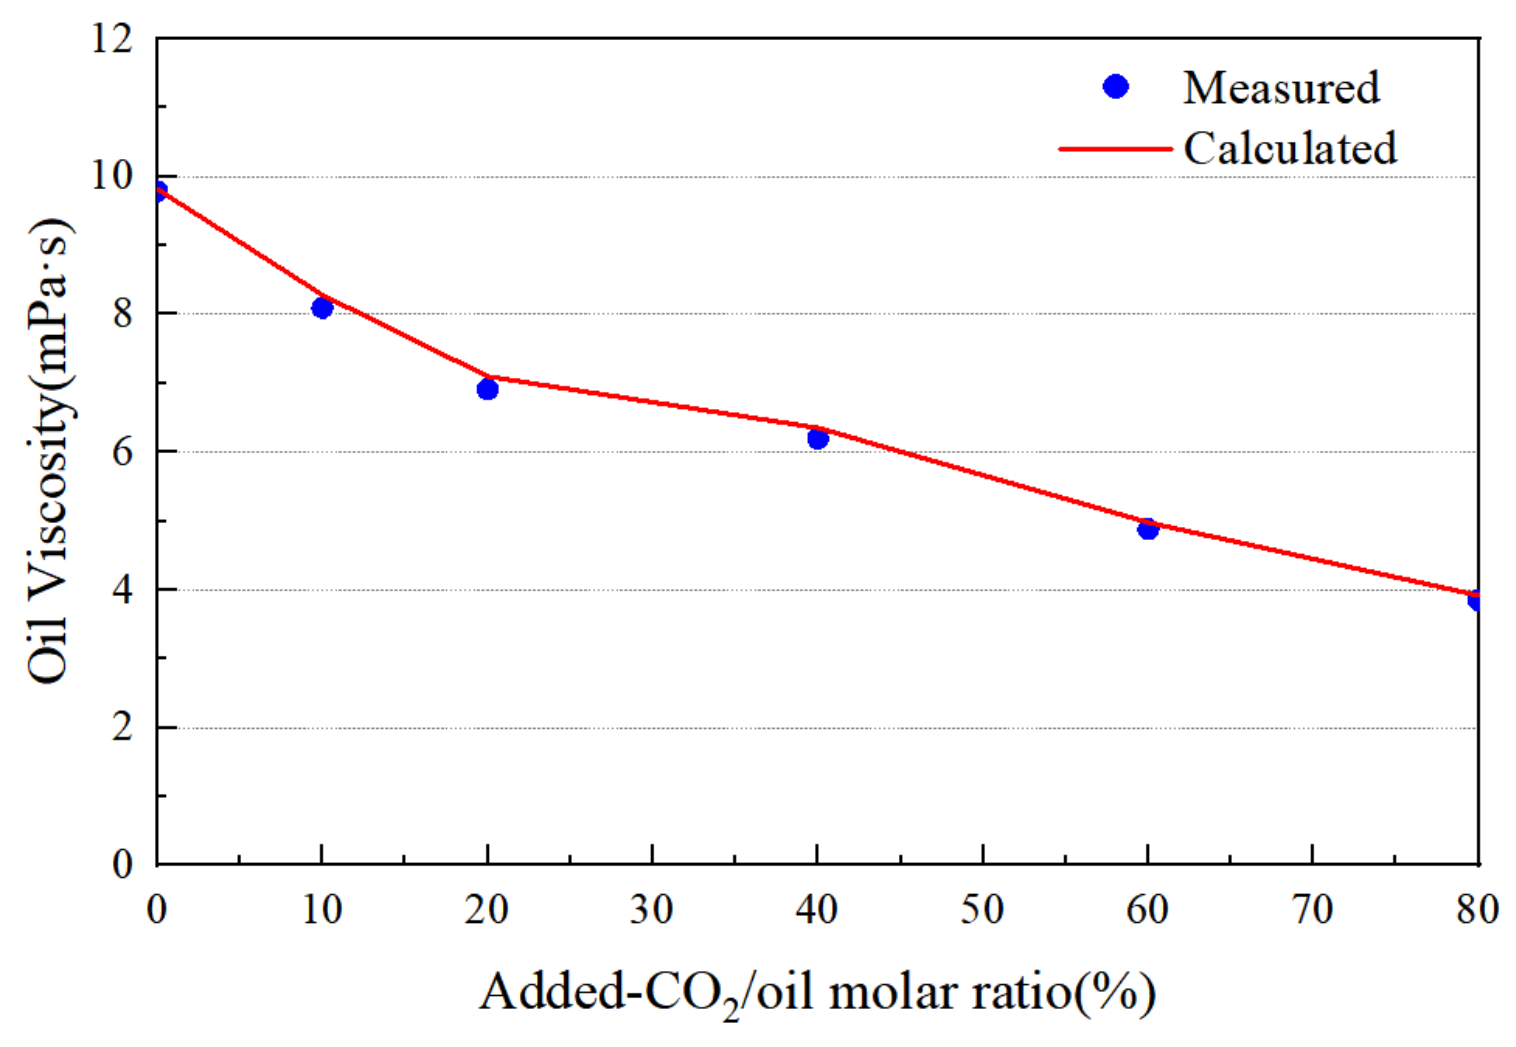
2/oil molar ratios of 0–80% at 106.75 °C and 65.07 MPa. As shown in
Figure 3, the calculated oil viscosity agreed well with the measured values under different added CO
2/oil molar ratios. Similarly,
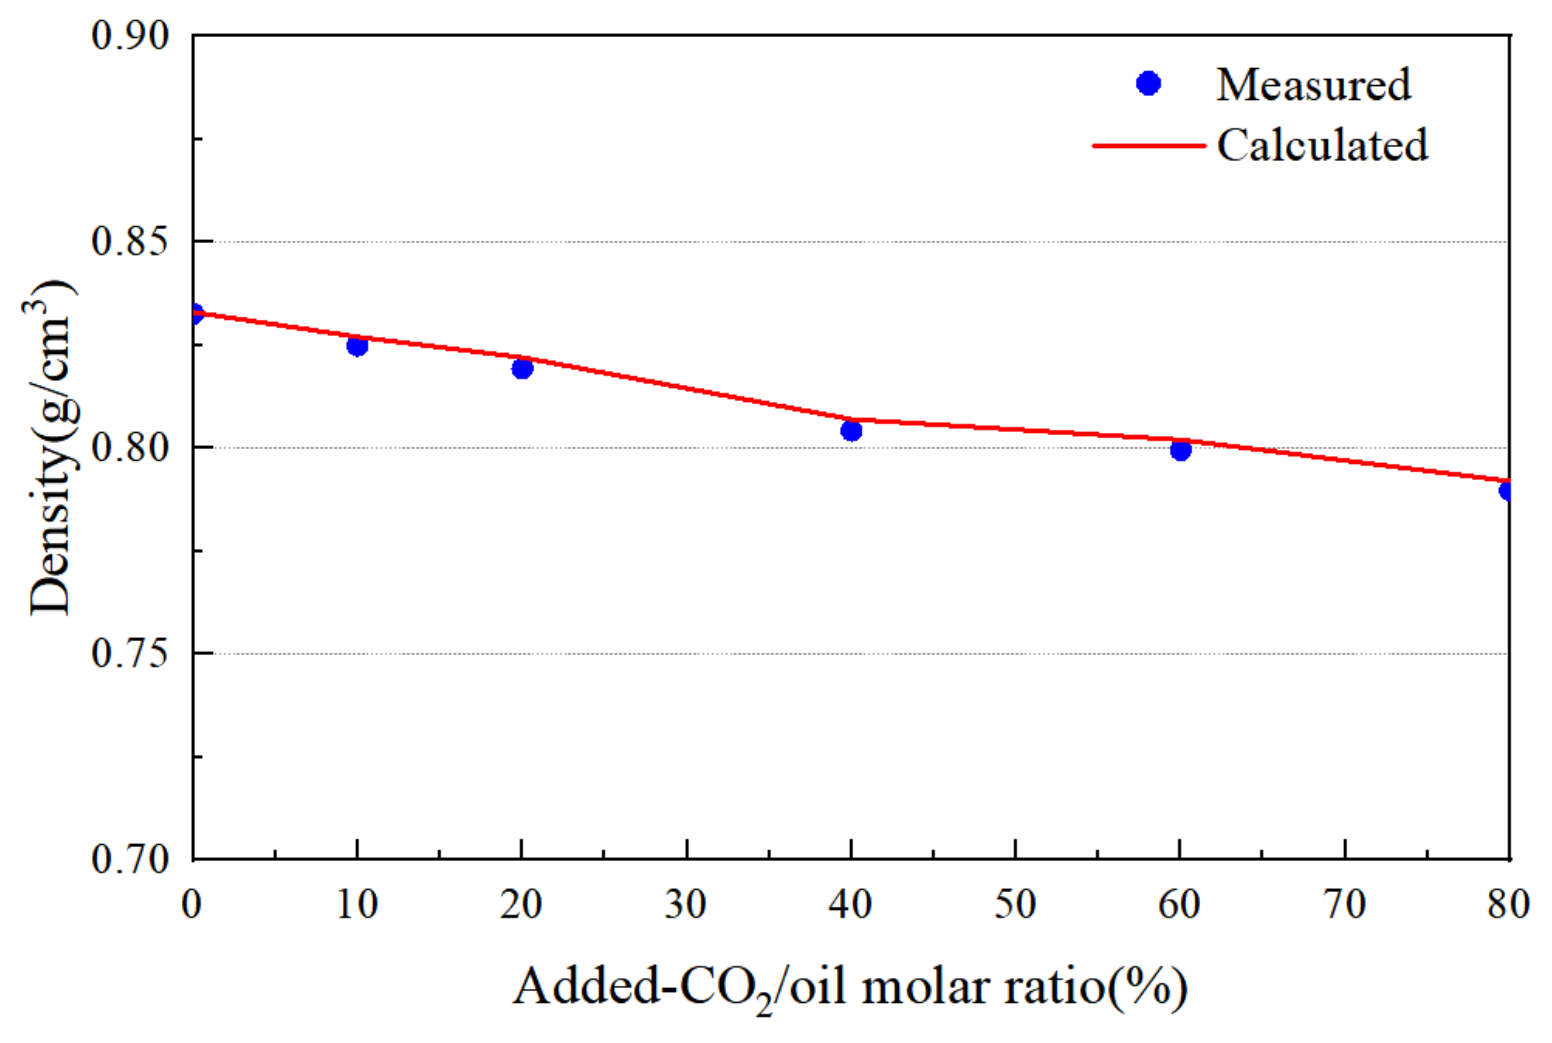
Figure 4 shows that the calculated oil density also reproduced the measured trend satisfactorily. These results indicate that the fluid model adequately represented the CO
2-induced viscosity reduction and density change under reservoir conditions.
Before CO
2 prediction, the base model without CO
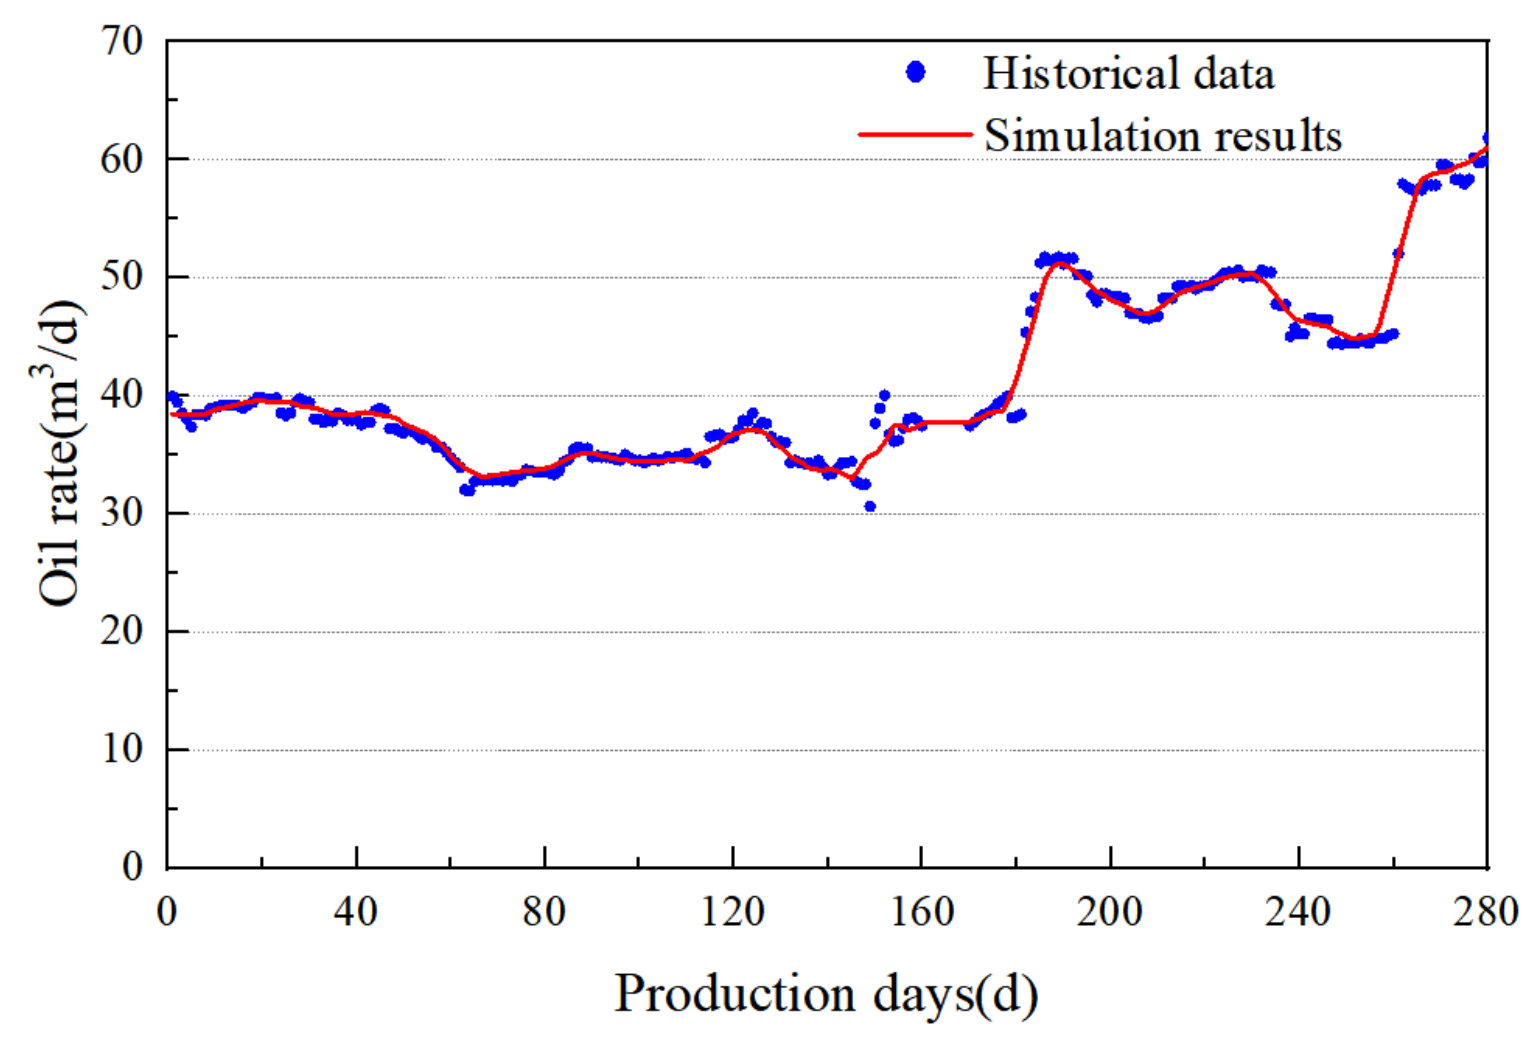
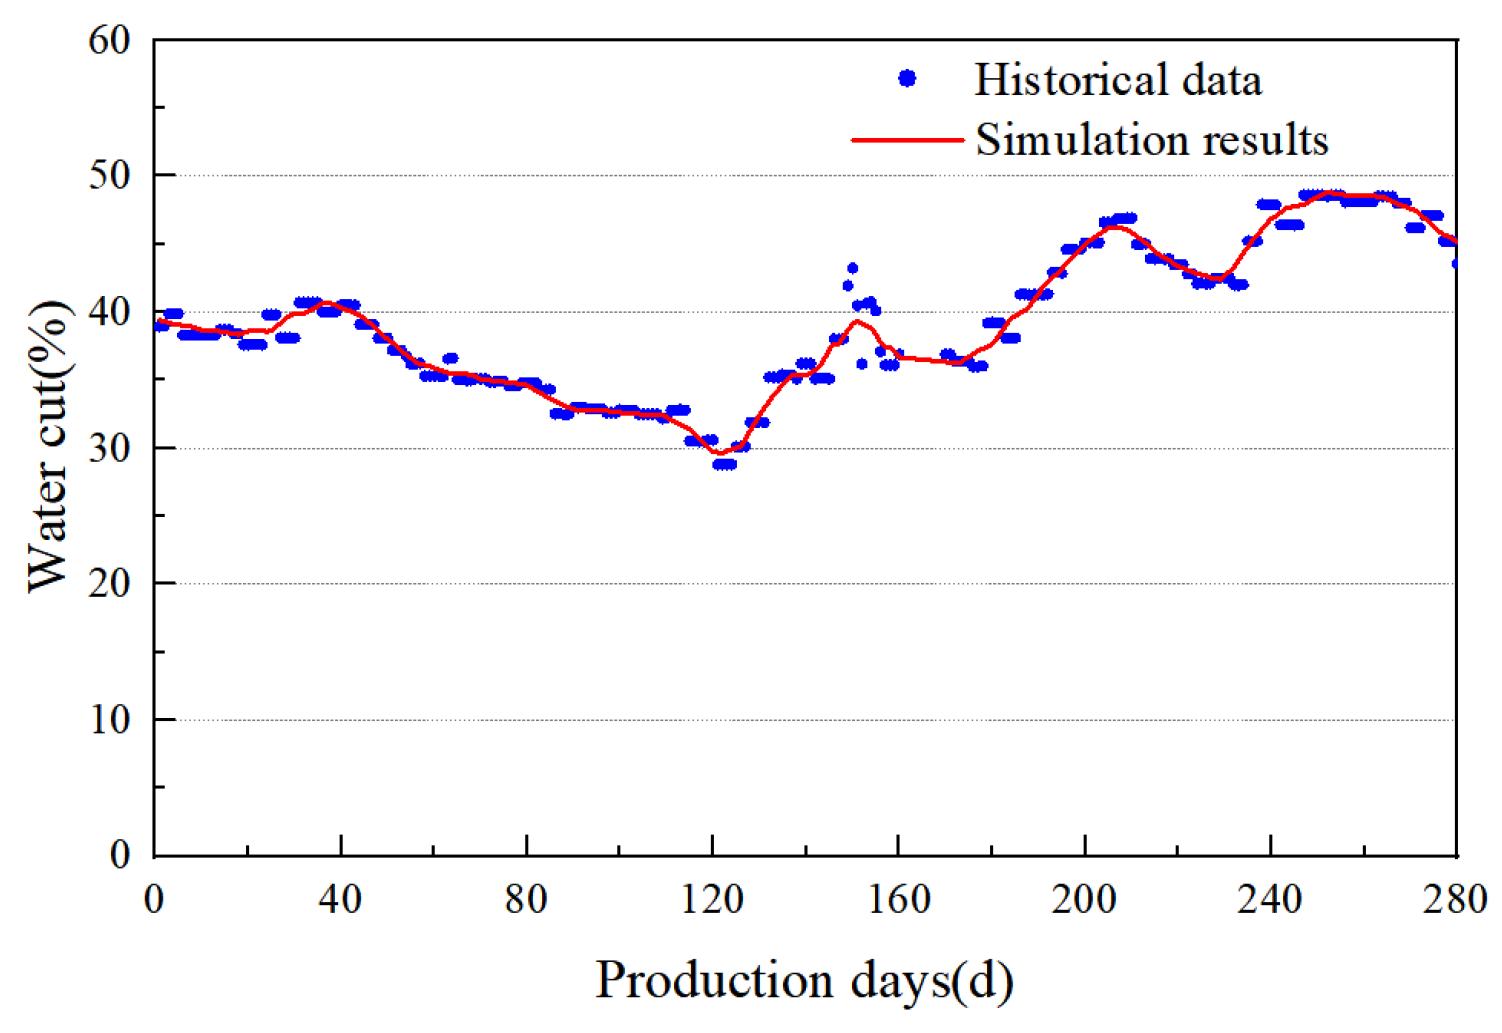
2 injection was calibrated against the first 280 days of production history. The measured bottom-hole flowing-pressure schedule was imposed as the production constraint, while daily oil rate and water cut were used as the history-matching targets. As shown in
Figure 5, the simulated oil rate reproduced the main variations and overall magnitude of the historical production data.
Figure 6 shows that the simulated water cut also captured the general trend of the field data. The pressure, saturation, and component distributions at the end of the history-matching period were subsequently used as the common initial state for all CO
2 huff-n-puff prediction cases.
3. Results and Discussion
3.1. Evolution of Crude Oil Mobility During Depletion Development
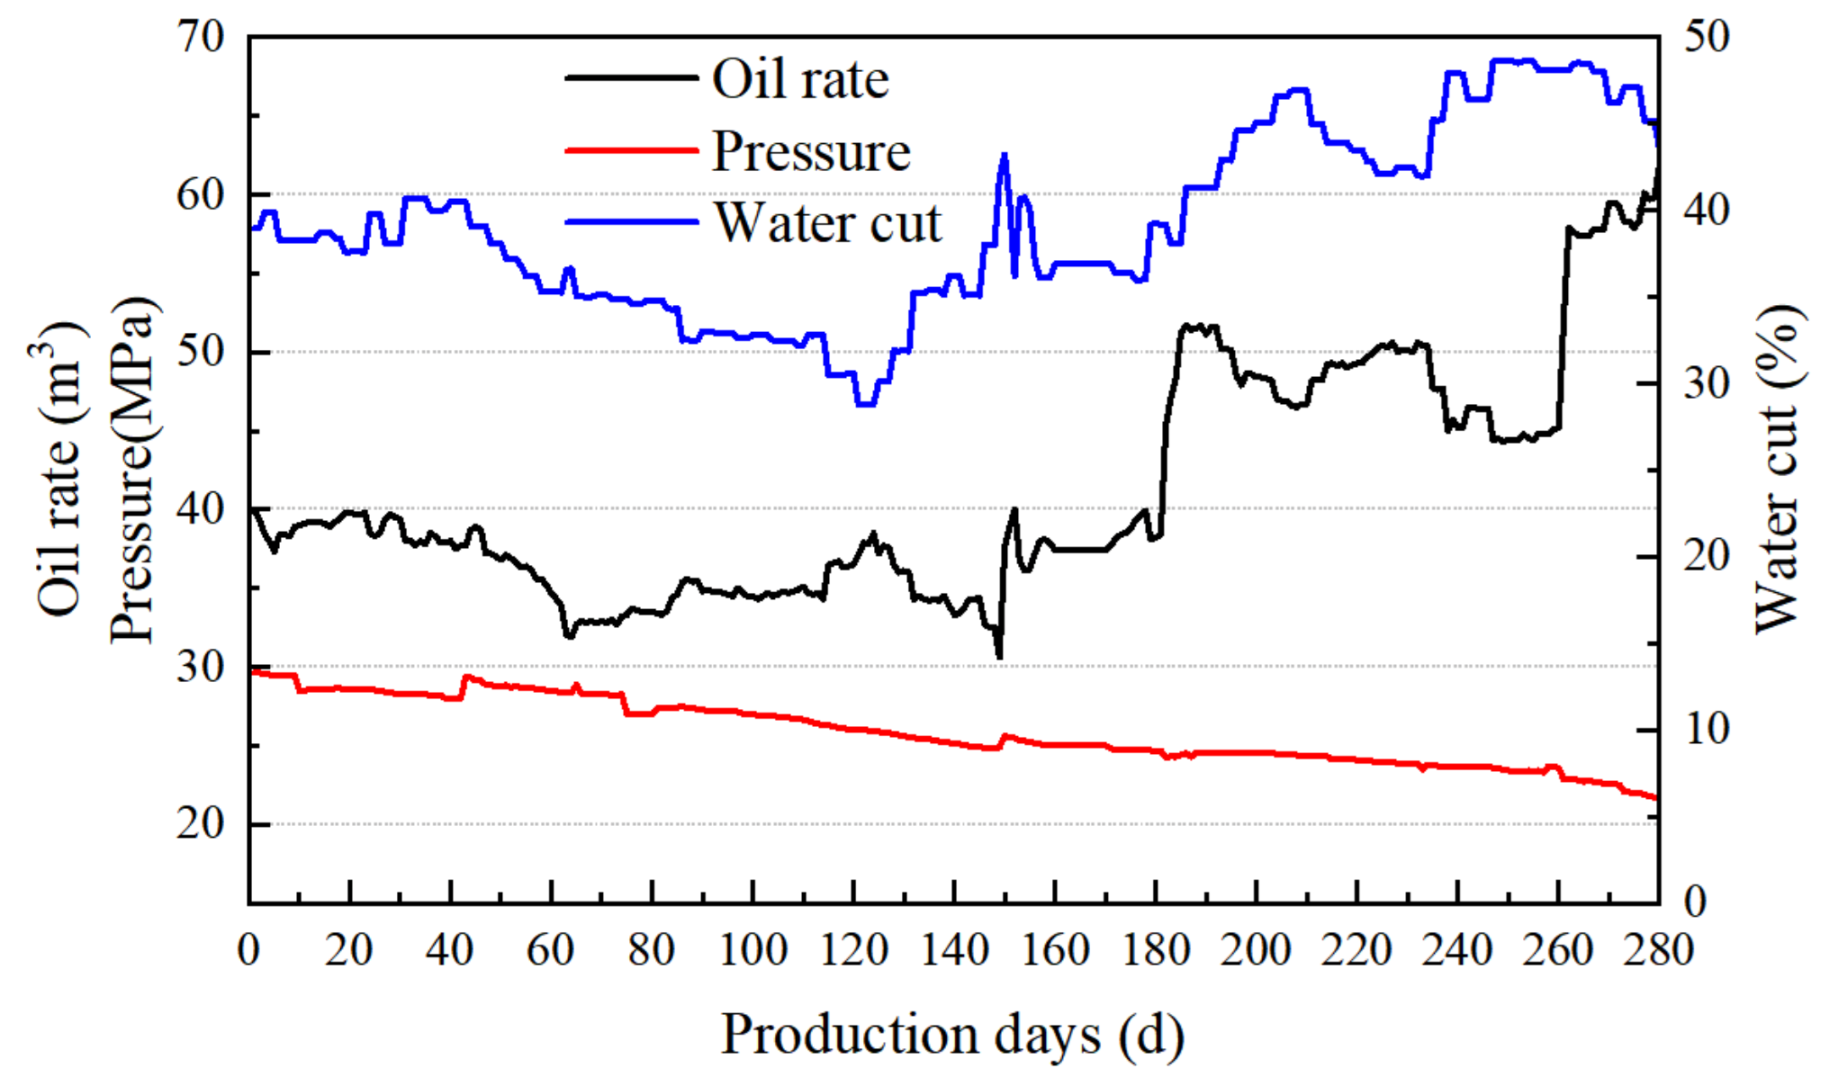
During the 280 d history period, bottom-hole pressure declined from approximately 30 to 22 MPa, while oil rate generally remained between 30 and 60 m
3/d and water cut increased from approximately 30% to nearly 50% (
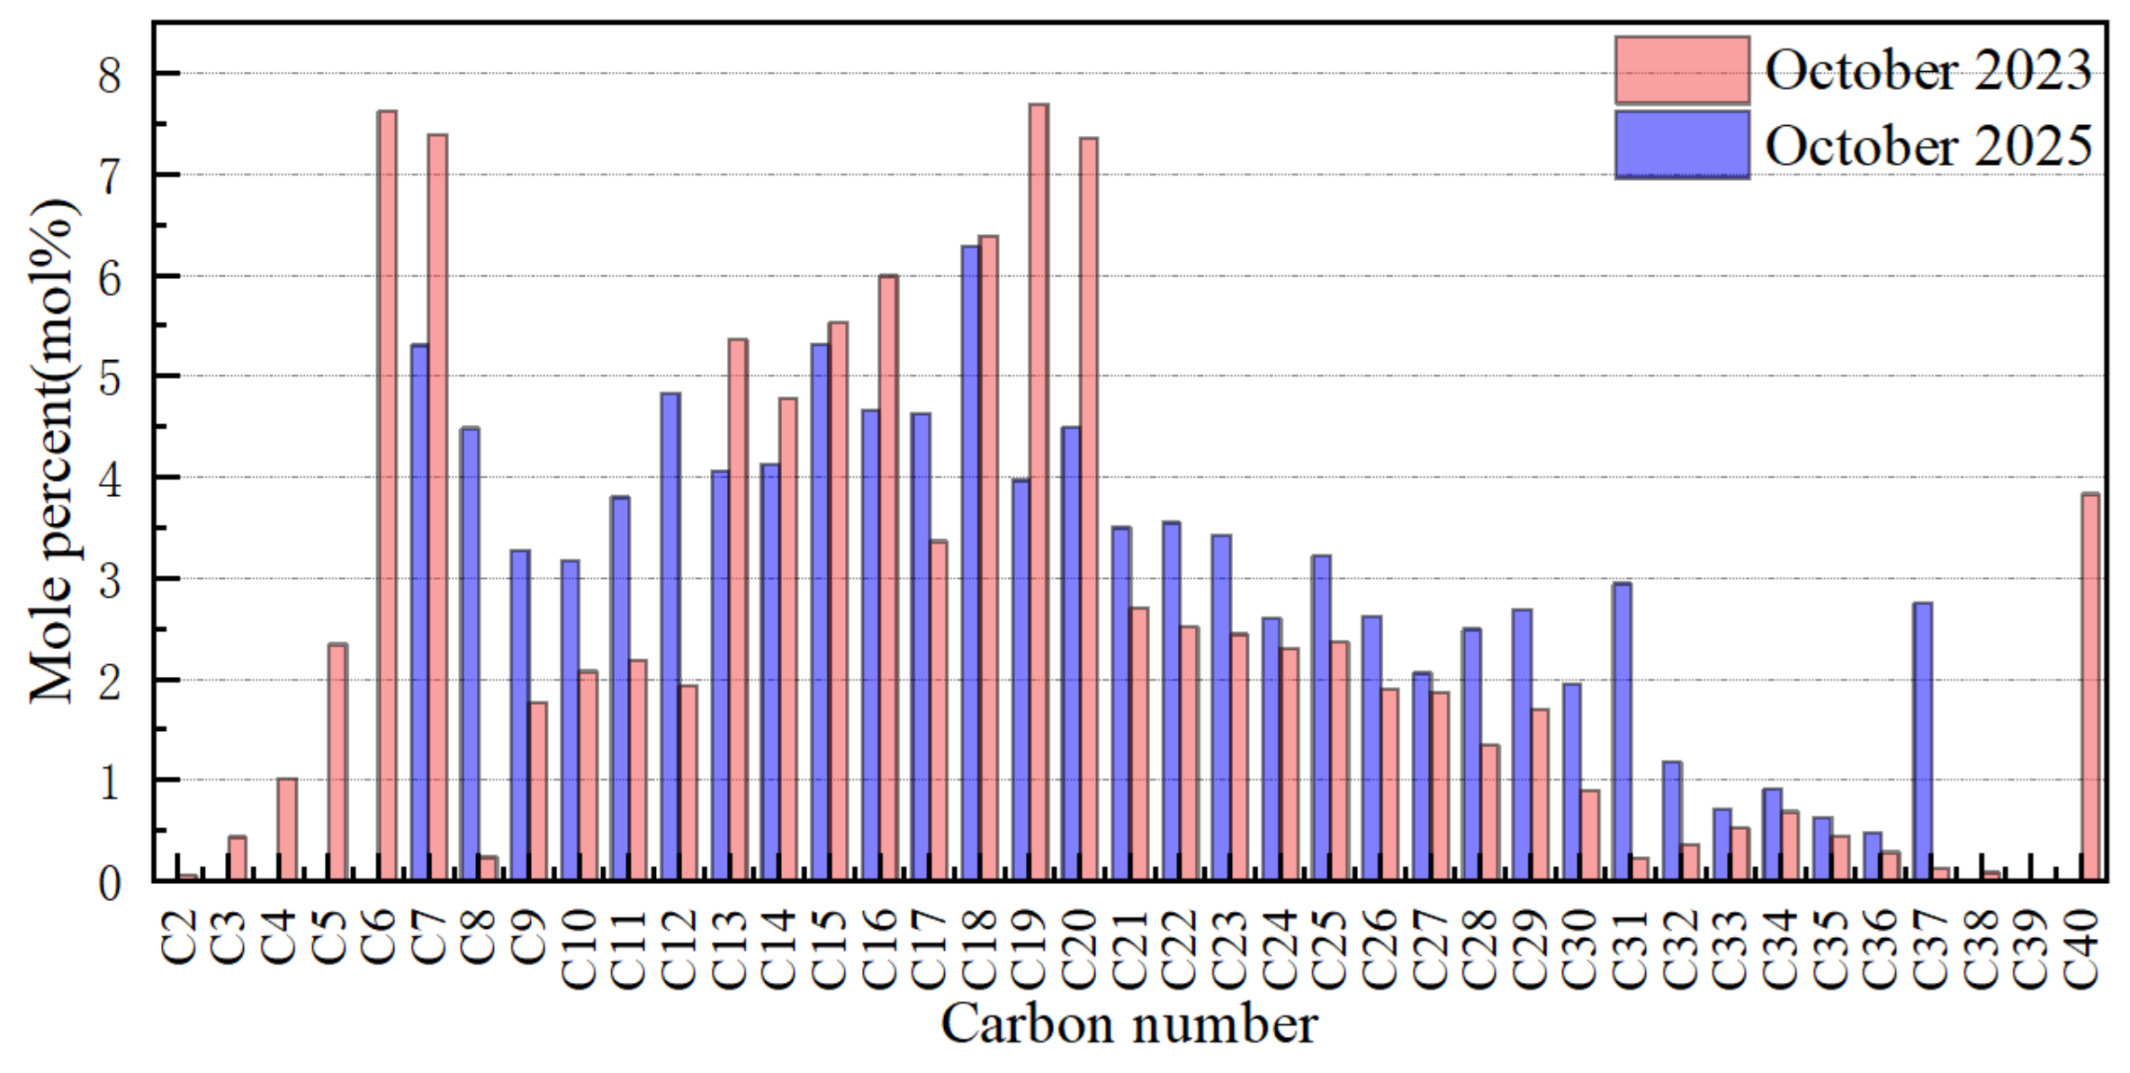
Figure 7). Although the well maintained appreciable early-stage production, time-lapse fluid analyses revealed progressive compositional deterioration. As shown in
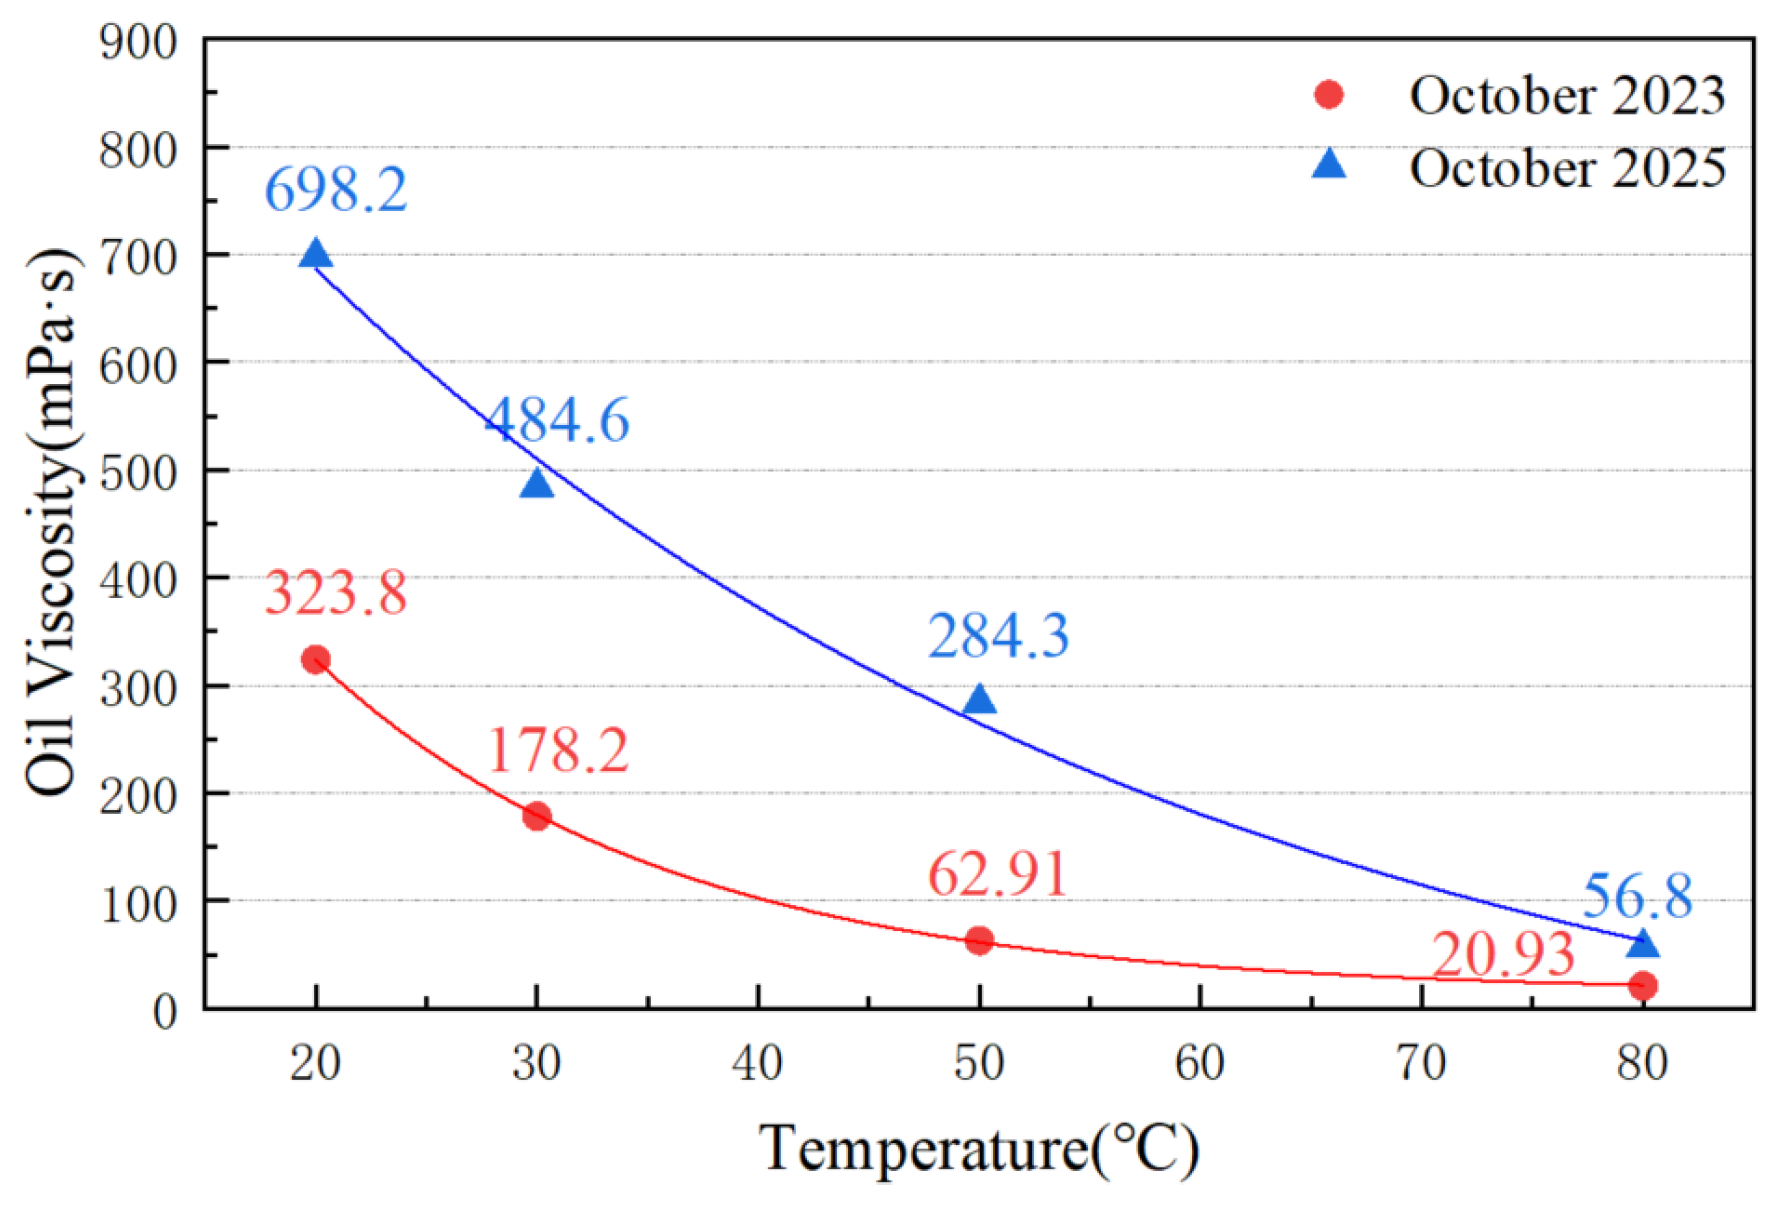
Figure 8, the dead-oil viscosity at 80 °C increased from 20.93 mPa·s in October 2023 to 56.8 mPa·s in October 2025. As shown in
Figure 9, the C3–C13 fraction decreased by 10.2%, while the heavy fraction increased by 46.8%, and both
and
decreased. These trends indicate preferential production of light and intermediate hydrocarbons during depletion.
Because both samples were dehydrated and degassed using the same procedure, the dead-oil measurements provide a consistent indicator of compositional evolution. They do not directly represent in situ viscosity or an equivalent loss of reservoir mobility, which is also controlled by dissolved gas, pressure, relative permeability, saturation, and fracture–matrix connectivity.
3.2. Viscosity and Density Evolution After CO2 Addition
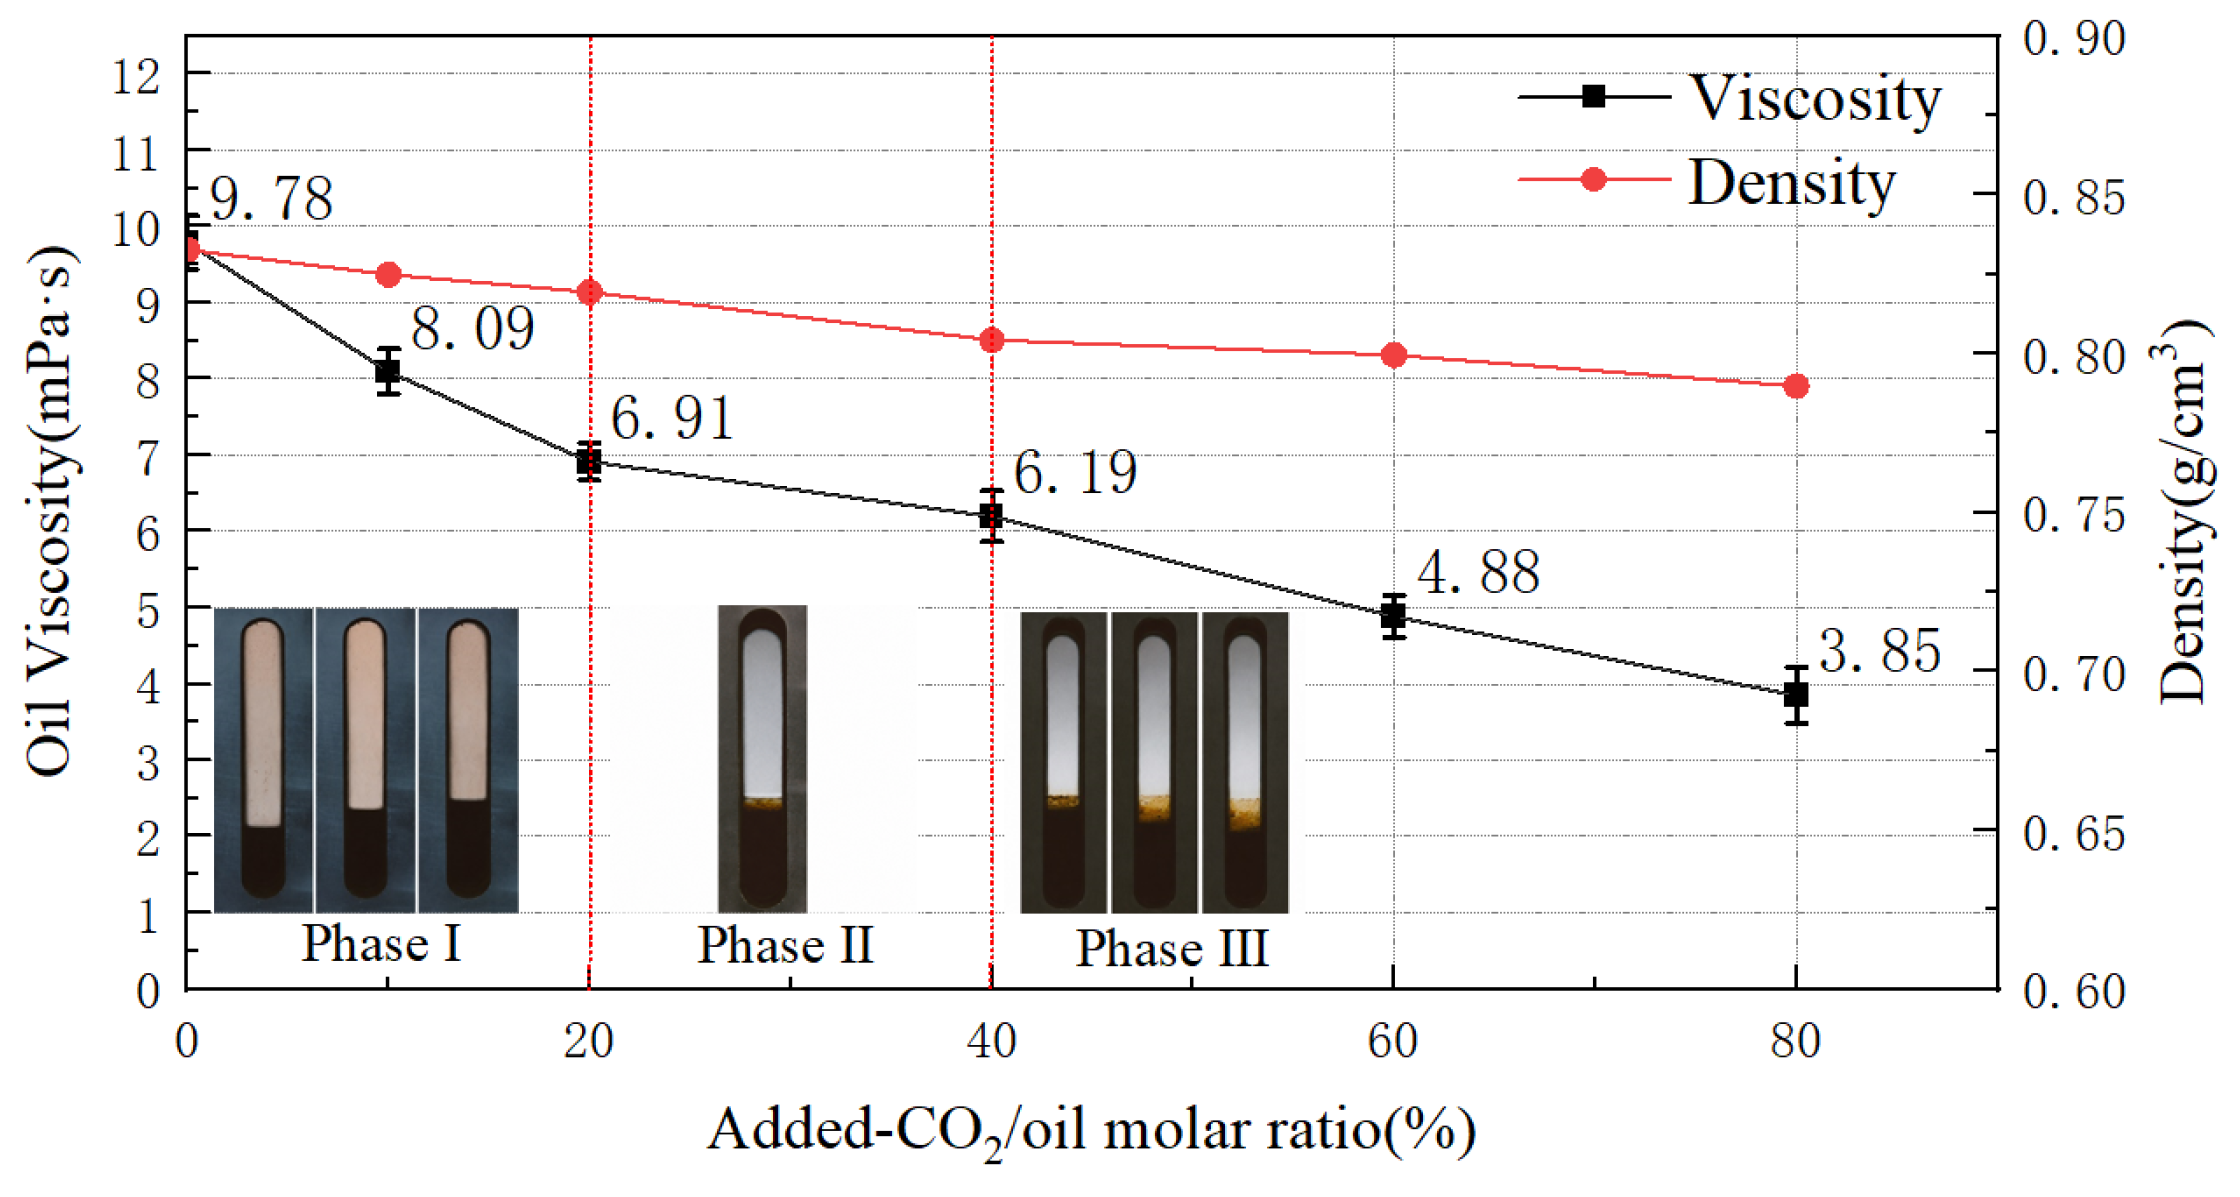
Figure 10 shows the changes in live-oil viscosity and density with increasing added CO
2/oil molar ratio at 106.75 °C and 65.07 MPa. The initial recombined live oil had a saturation pressure of 47.8 MPa and was therefore undersaturated before CO
2 addition. As the added CO
2/oil molar ratio increased from 0 to 80%, viscosity decreased from 9.7841 to 3.8470 mPa·s, corresponding to a reduction of 60.7%, while density decreased from 0.8326 to 0.7897 g/cm
3. The relative standard deviation of the replicate viscosity measurements remained below 5%.
The viscosity response can be divided empirically into three regions. Between 0 and 20%, the sharp decrease was mainly associated with CO2 dissolution into the initially undersaturated oil, resulting in swelling, dilution, and weaker intermolecular interactions. Between 20 and 40%, the marginal viscosity reduction became smaller, indicating a gradual decline in the effectiveness of additional CO2 dissolution. Between 40 and 80%, viscosity continued to decrease, but the response likely reflected the combined effects of further dissolution, dilution, and compositional redistribution. Because the experiments did not independently quantify dissolved CO2 and transferred hydrocarbons in each phase, the individual contributions of these mechanisms cannot be separated quantitatively.
No distinct macroscopic phase boundary was observed through the PVT cell window under the tested conditions, and the fluid appeared visually homogeneous at the observation scale. This observation supports the use of an oil-rich measurement phase but does not exclude microscopic phase splitting or CO2-rich domains. The phase interpretation is therefore limited to macroscopic visual observation and the measured bulk properties.
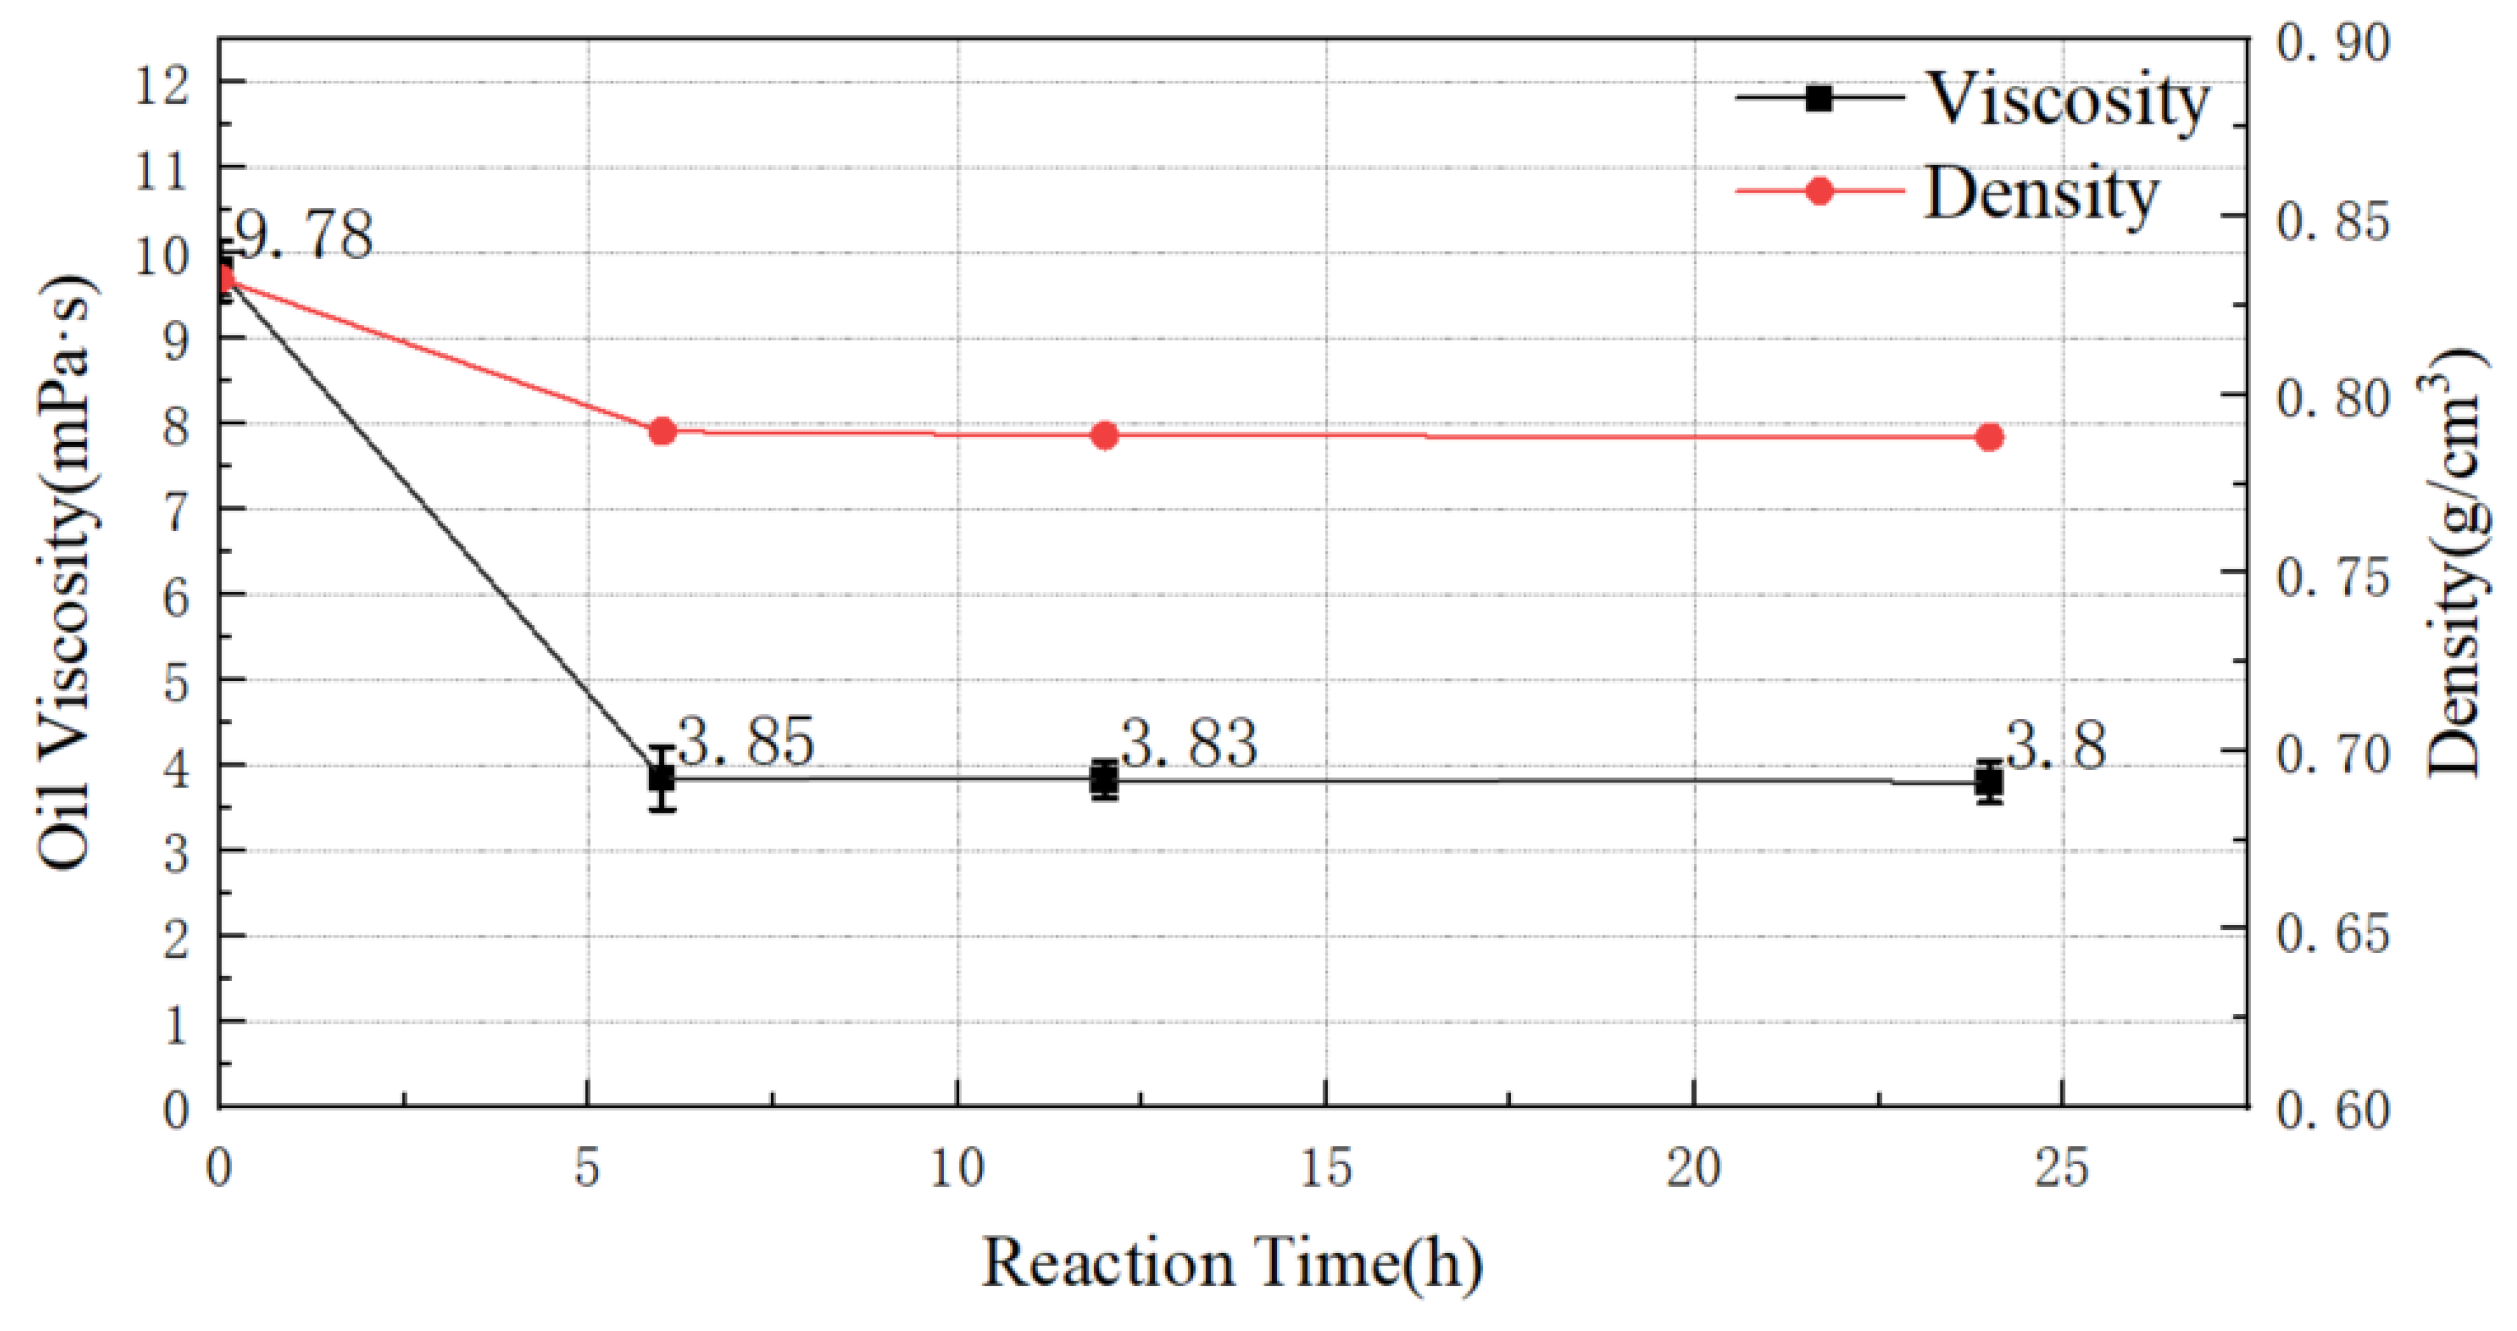
Figure 11 shows that most changes in viscosity and density occurred during the first 6 h of CO
2–oil contact. At the highest tested added CO
2/oil molar ratio, viscosity decreased from 9.78 to 3.85 mPa·s during 0–6 h, whereas only minor additional changes occurred between 6 and 24 h. A similar stabilization was observed for density and oil-phase composition, indicating that the confined, continuously stirred fluid approached a reproducible dynamic quasi-equilibrium after approximately 6 h.
This 6 h period represents laboratory-scale mixing and equilibration within the PVT cell and should not be interpreted as a reservoir soaking time. In a shale reservoir, CO2 transport from fractures into the matrix is controlled by diffusion distance, effective diffusivity, adsorption, confinement, and fracture–matrix connectivity. A characteristic diffusion time may be expressed as , but was not measured in this study; therefore, no direct conversion from the laboratory contact time to field soaking duration was attempted.
3.3. Whole-Hydrocarbon Compositional Response to CO2 Contact
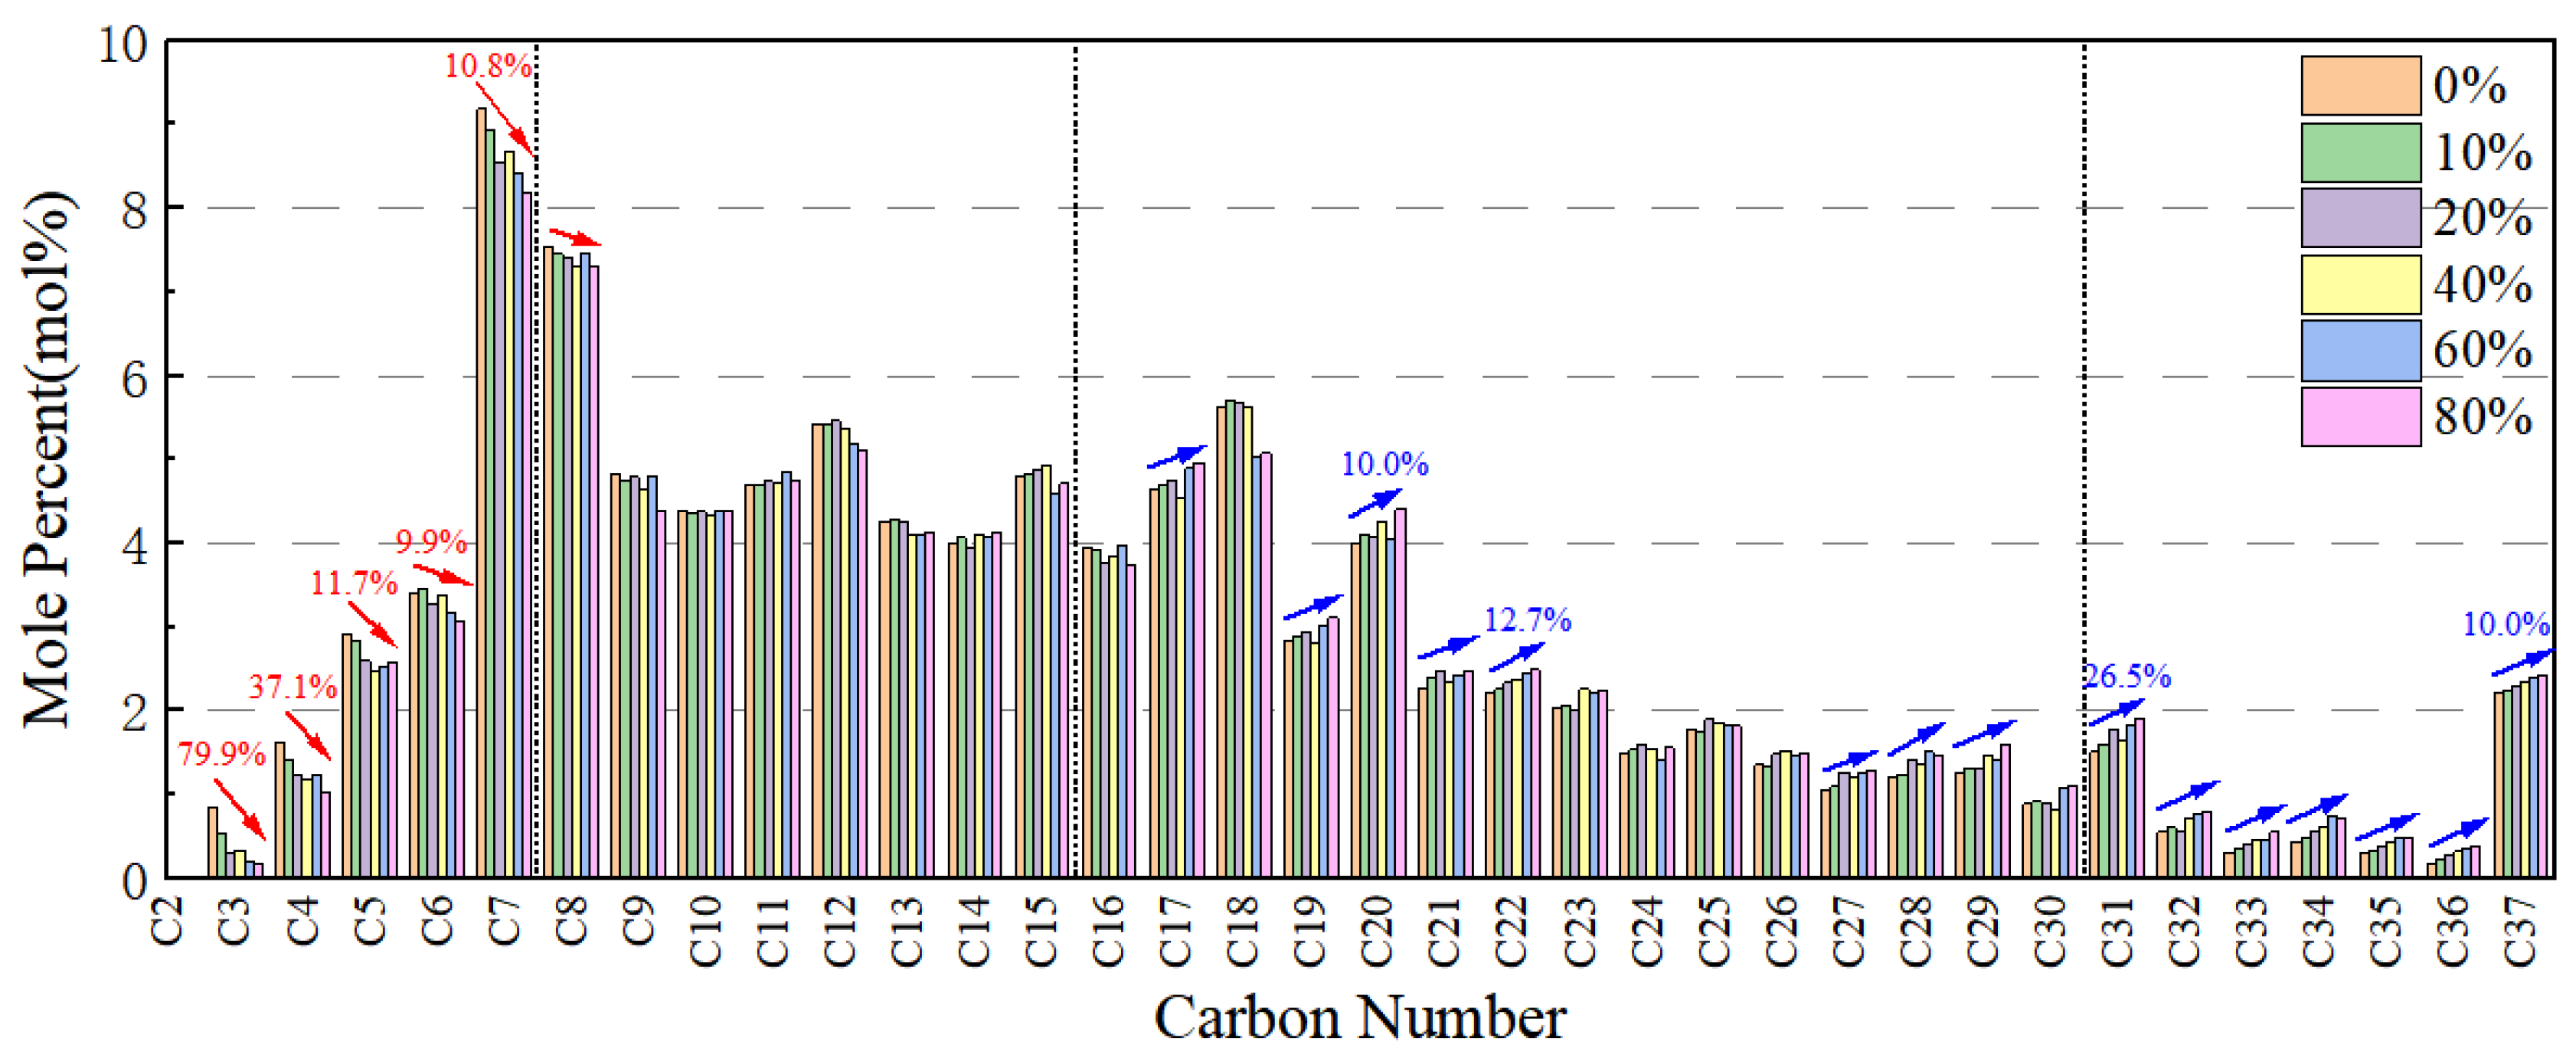
Figure 12 presents the oil-rich phase sampled after CO
2 contact rather than the total closed system or a produced-fluid stream. Hydrocarbons transferred into a CO
2-rich phase remained in the cell but were not included in the analyzed oil sample.
With increasing added CO
2/oil molar ratio, the C3–C7 fraction in the analyzed oil-rich phase decreased by 16.5%, including reductions of 79.9% and 37.1% in C3 and C4, respectively. In contrast, the relative abundance of C15–C37 increased by 31.5%, and both
and
decreased. The corresponding light-to-heavy hydrocarbon ratios are summarized in
Table 5. These trends indicate preferential transfer of low-carbon-number hydrocarbons out of the analyzed oil-rich phase and relative enrichment of intermediate and heavy components in the residual oil. Because the CO
2-rich phase was not separately sampled and analyzed, the term “extraction” is used here in a phase-transfer sense rather than as a complete component mass balance.
The changes in whole-hydrocarbon composition under different reaction times are shown in
Figure 13. The compositional response with contact time was consistent with the viscosity and density results. Most of the decrease in C3–C7 and the relative increase in C15–C37 occurred during the first 6 h, whereas the oil-phase composition changed only slightly between 6 and 24 h. This consistency supports the interpretation that the tested PVT system approached a dynamic quasi-equilibrium after approximately 6 h.
3.4. Field-Scale Pressure, Oil-Mobility and Produced-Oil Compositional Responses
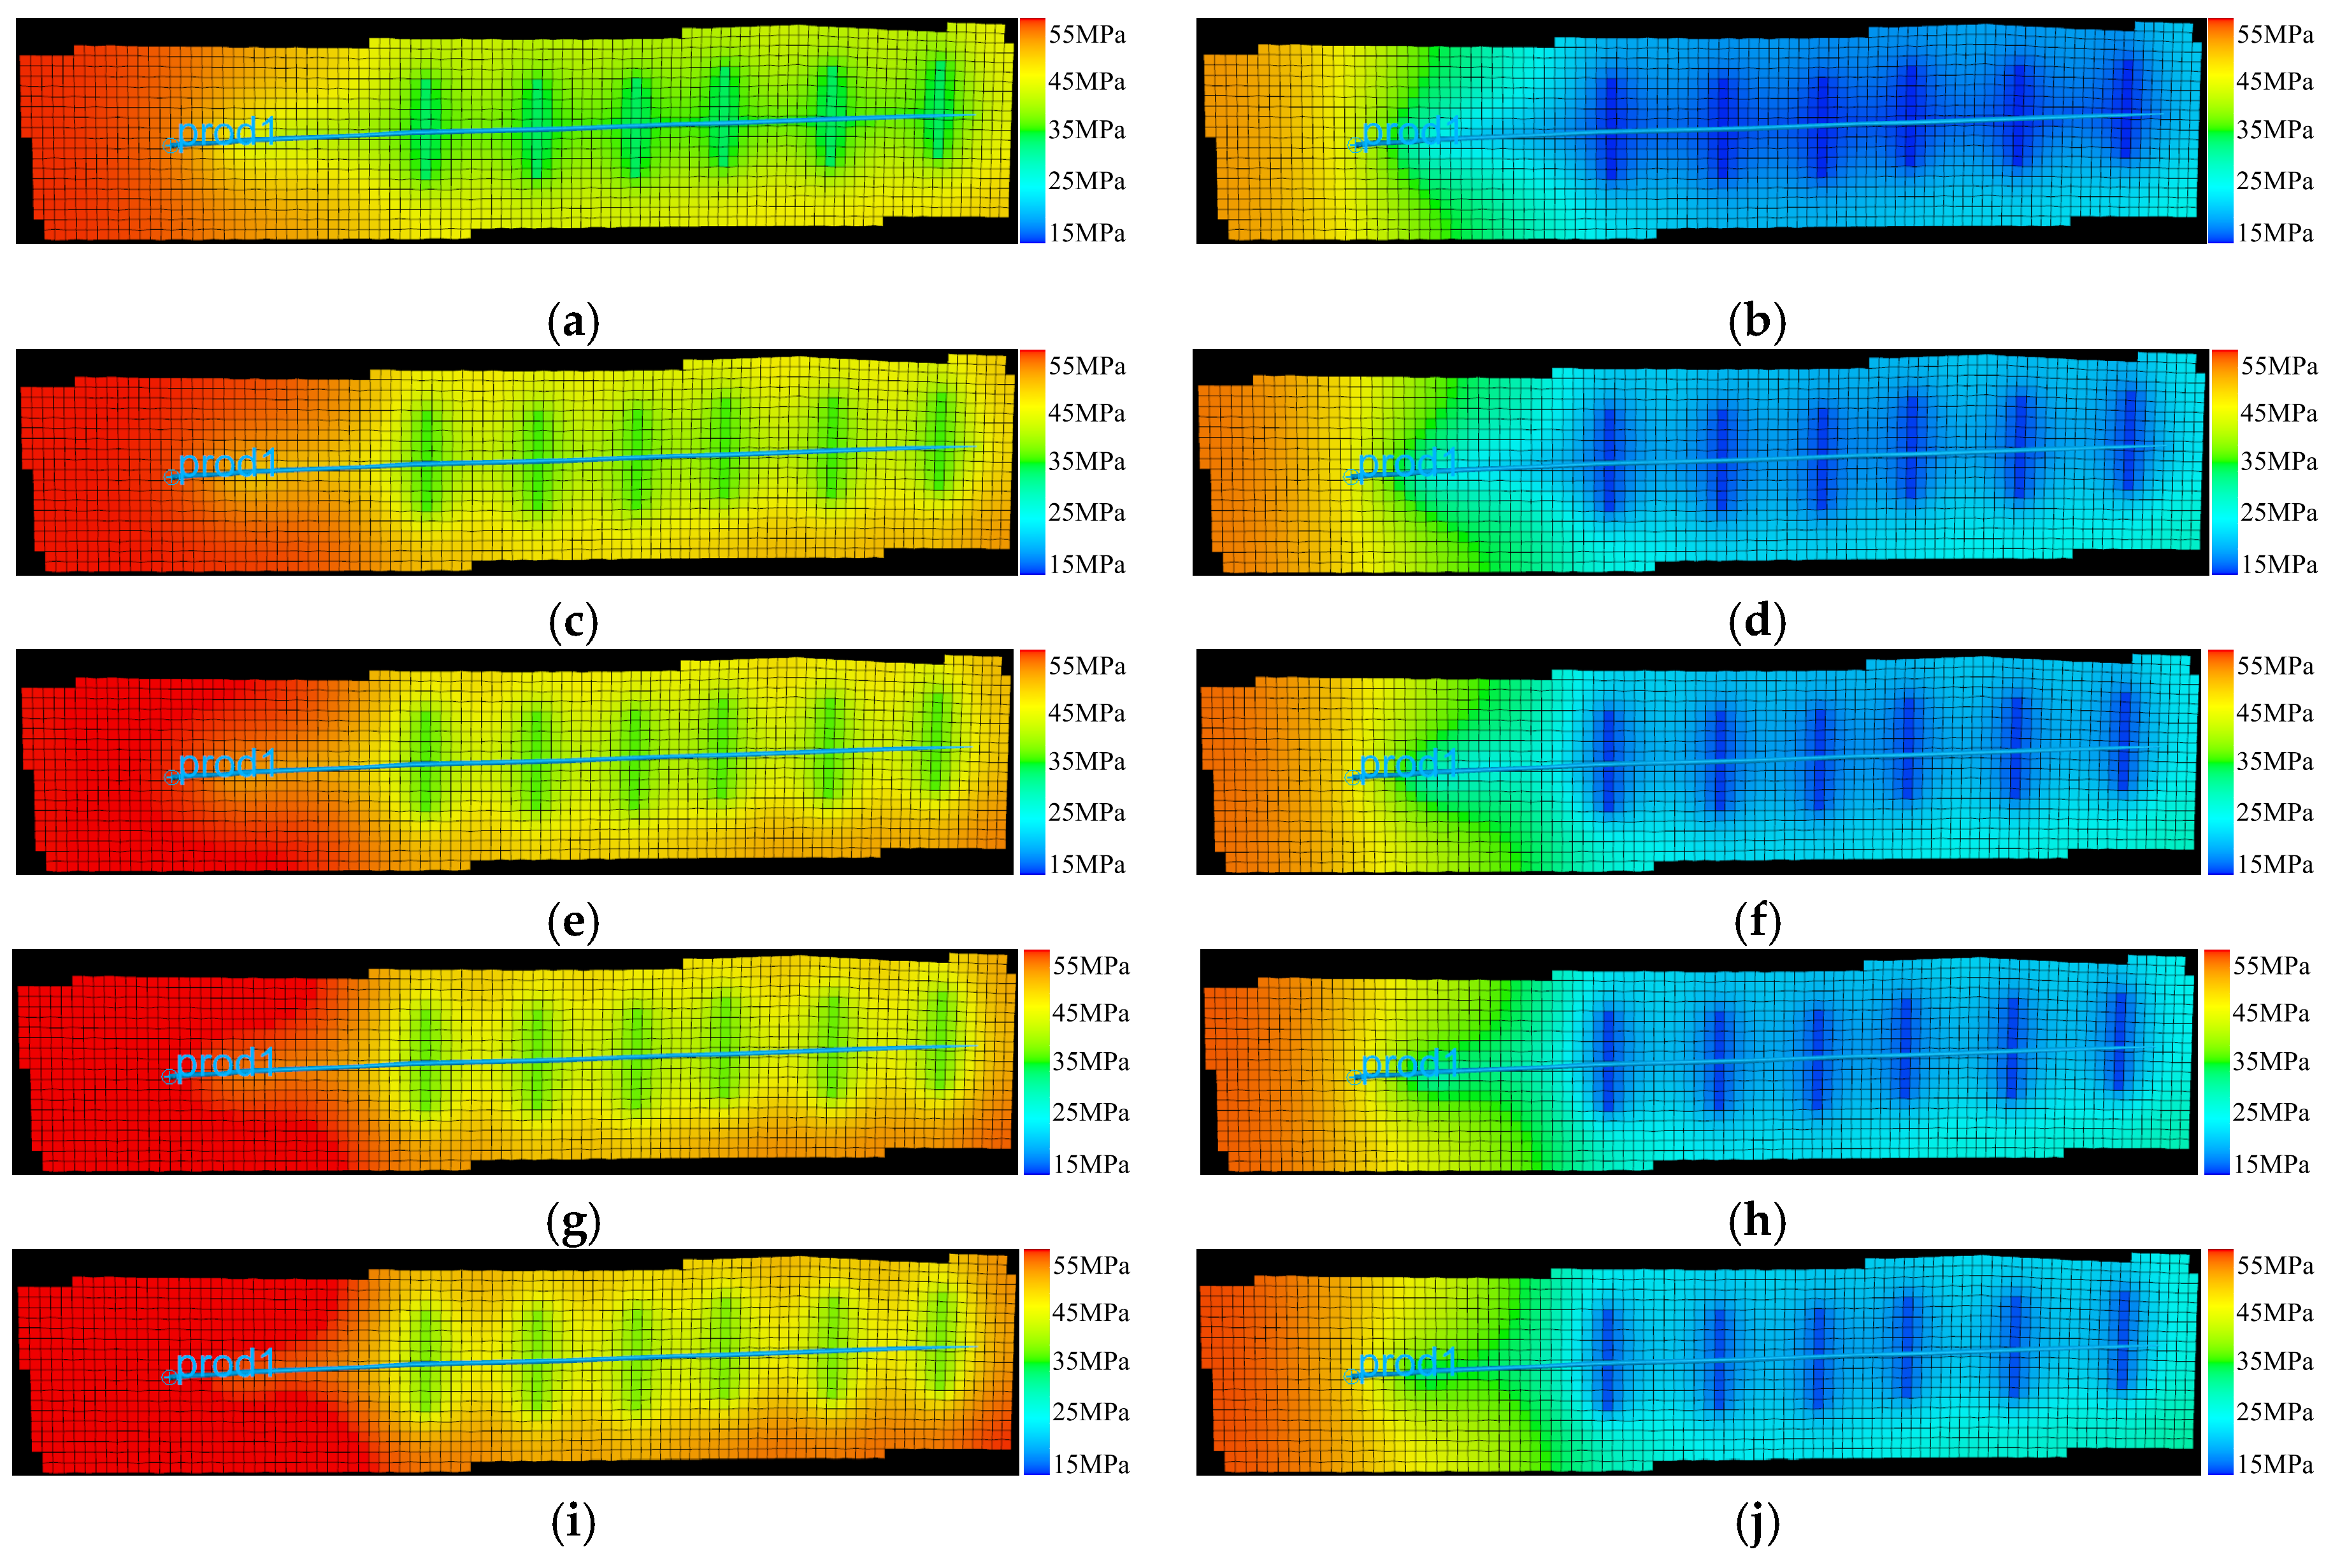
Figure 14 shows that the no-CO
2 case developed an expanding pressure-depletion zone around the horizontal well. Increasing the added CO
2/oil molar ratio progressively reduced the extent of this low-pressure region, with the 20 and 25% cases maintaining the highest pressure levels after 3 years. The limited difference between these two cases indicates diminishing pressure-maintenance benefits at a high added CO
2/oil molar ratio.
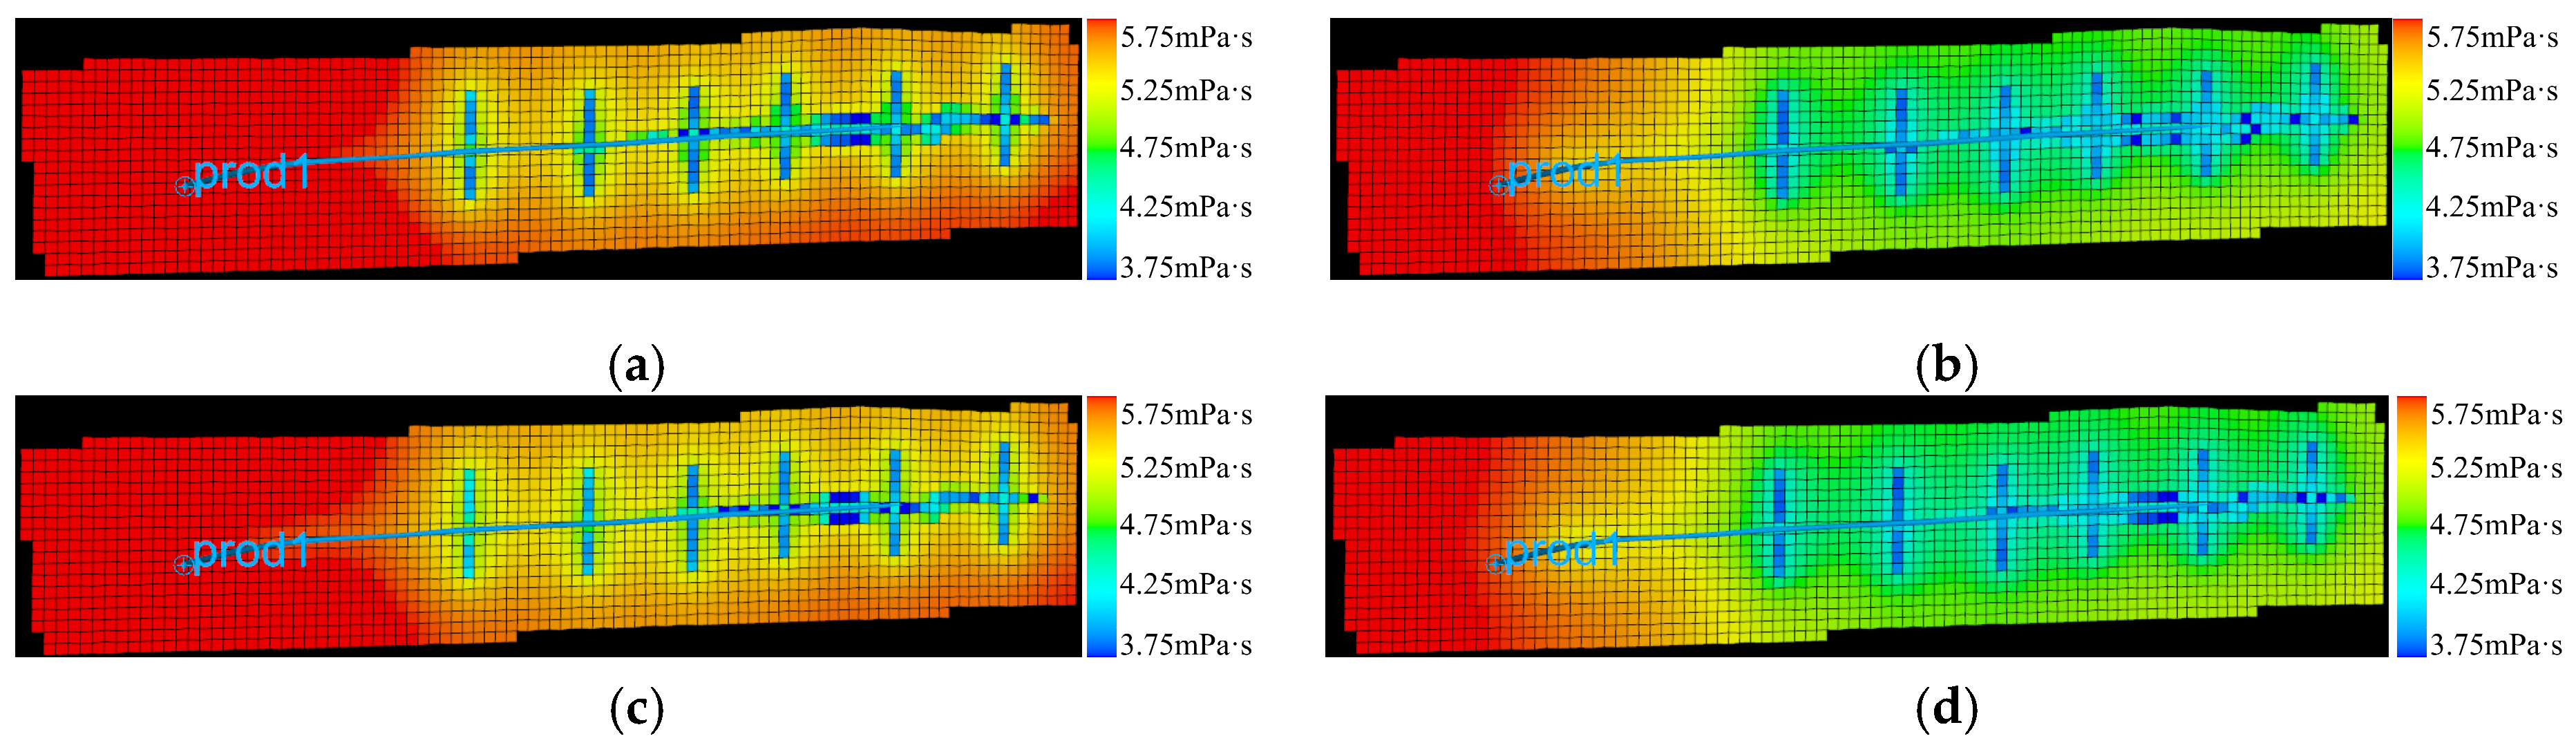
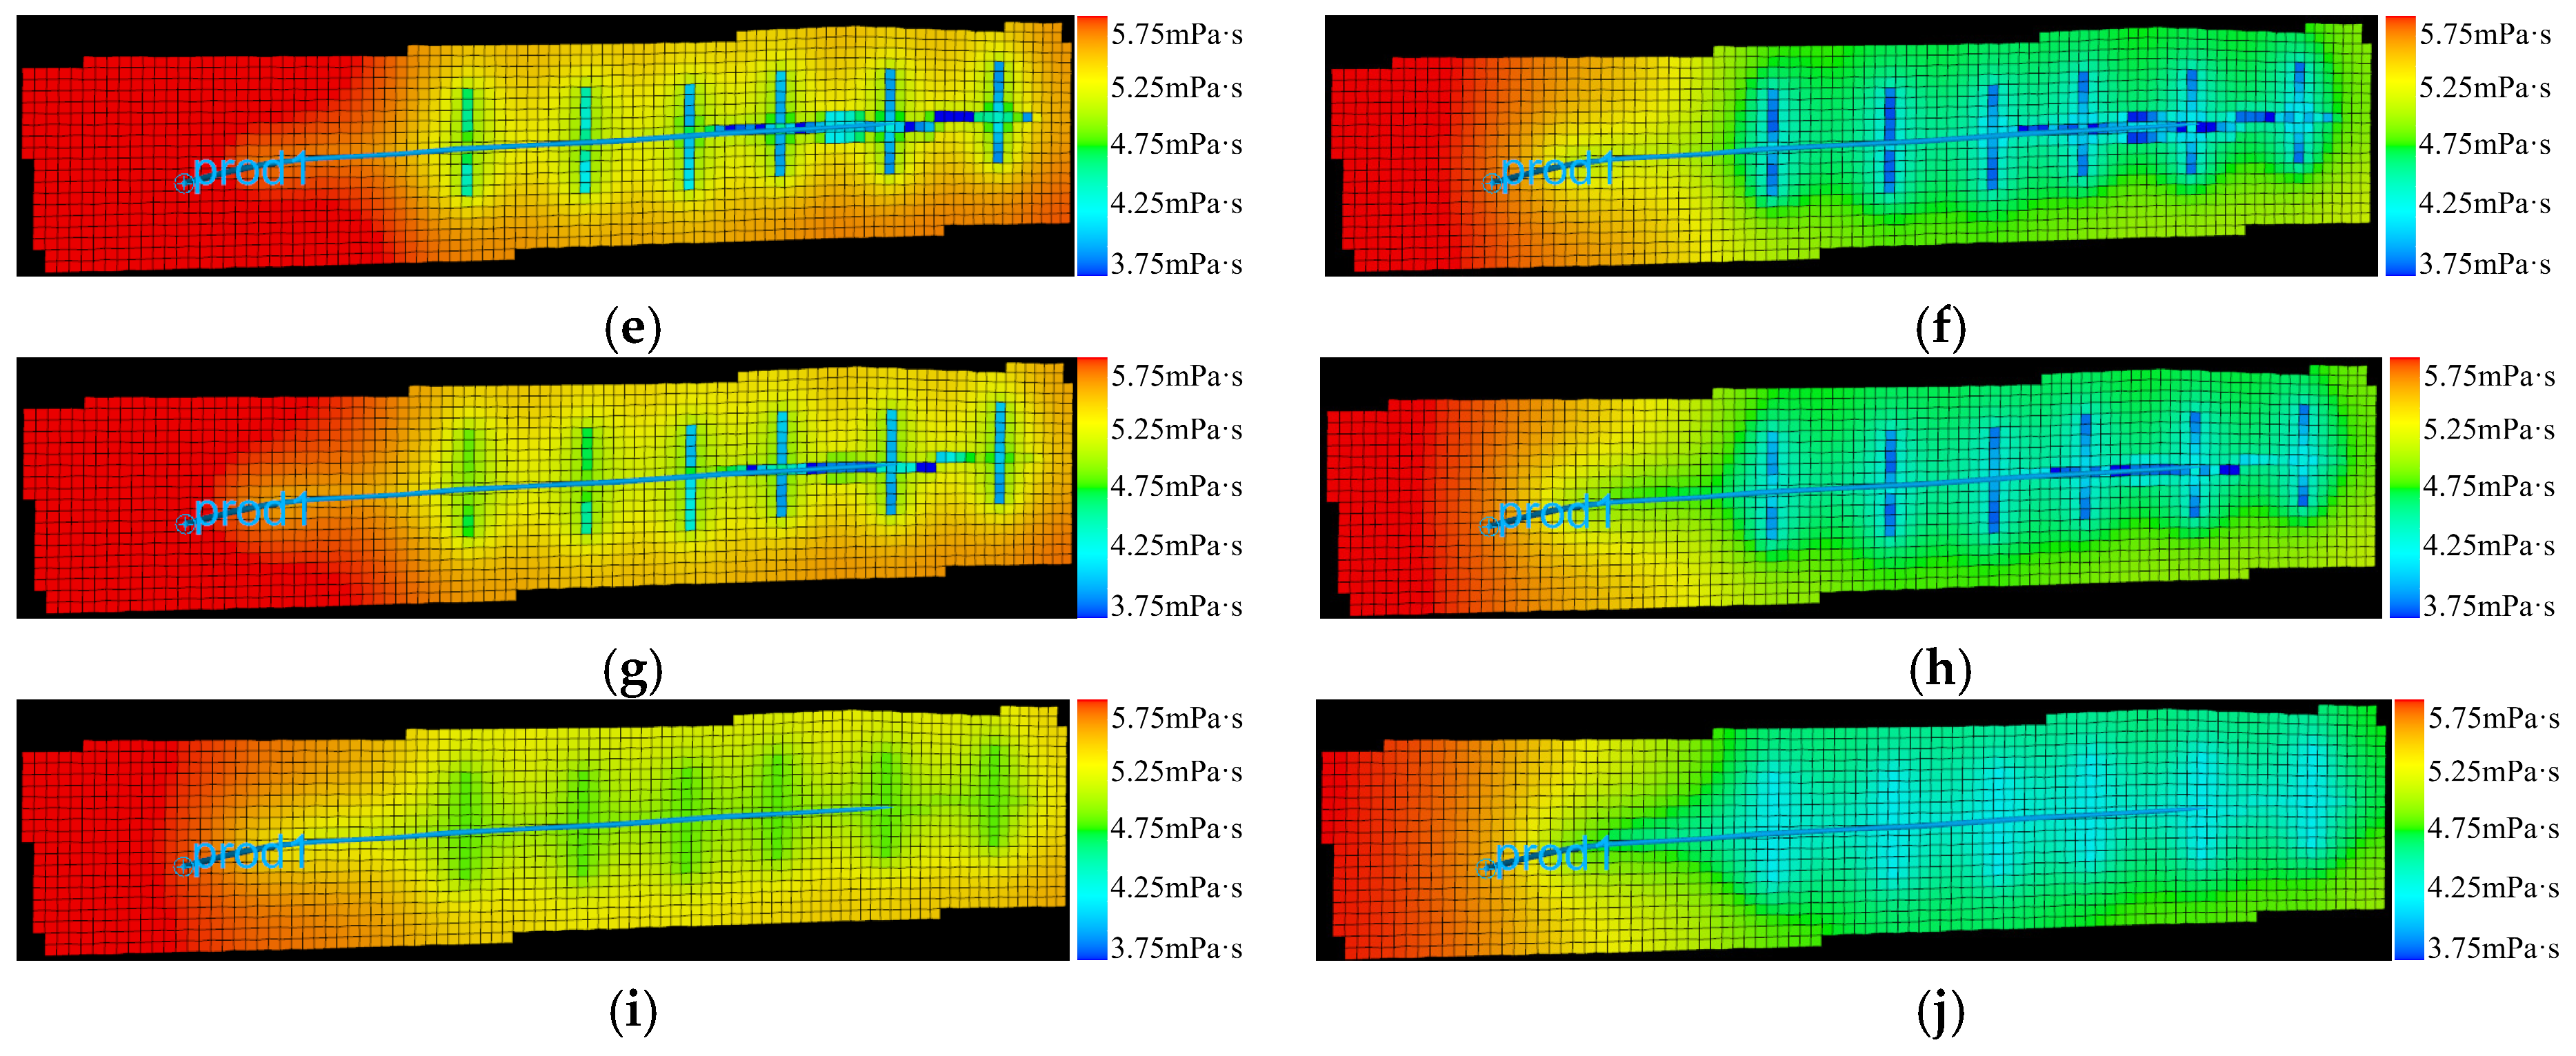
Figure 15 shows that CO
2-induced viscosity reduction was concentrated along the horizontal well and hydraulic fracture network. Low-viscosity zones expanded with increasing added CO
2/oil molar ratio, whereas regions remote from dominant fracture-controlled flow paths retained relatively high-viscosity. The limited difference between the 20 and 25% cases indicates that field-scale improvement was constrained by accessible sweep volume rather than by fluid property response alone. The simulated expansion of low-viscosity regions and the associated production benefit therefore do not account for local permeability loss caused by asphaltene deposition. If precipitation occurs in strongly contacted fracture matrix pathways, effective conductivity and incremental recovery could be lower than predicted; targeted CO
2 corefloods, solid detection measurements, and post-flood permeability tests are required to quantify this effect for the Mabei fluid–rock system.
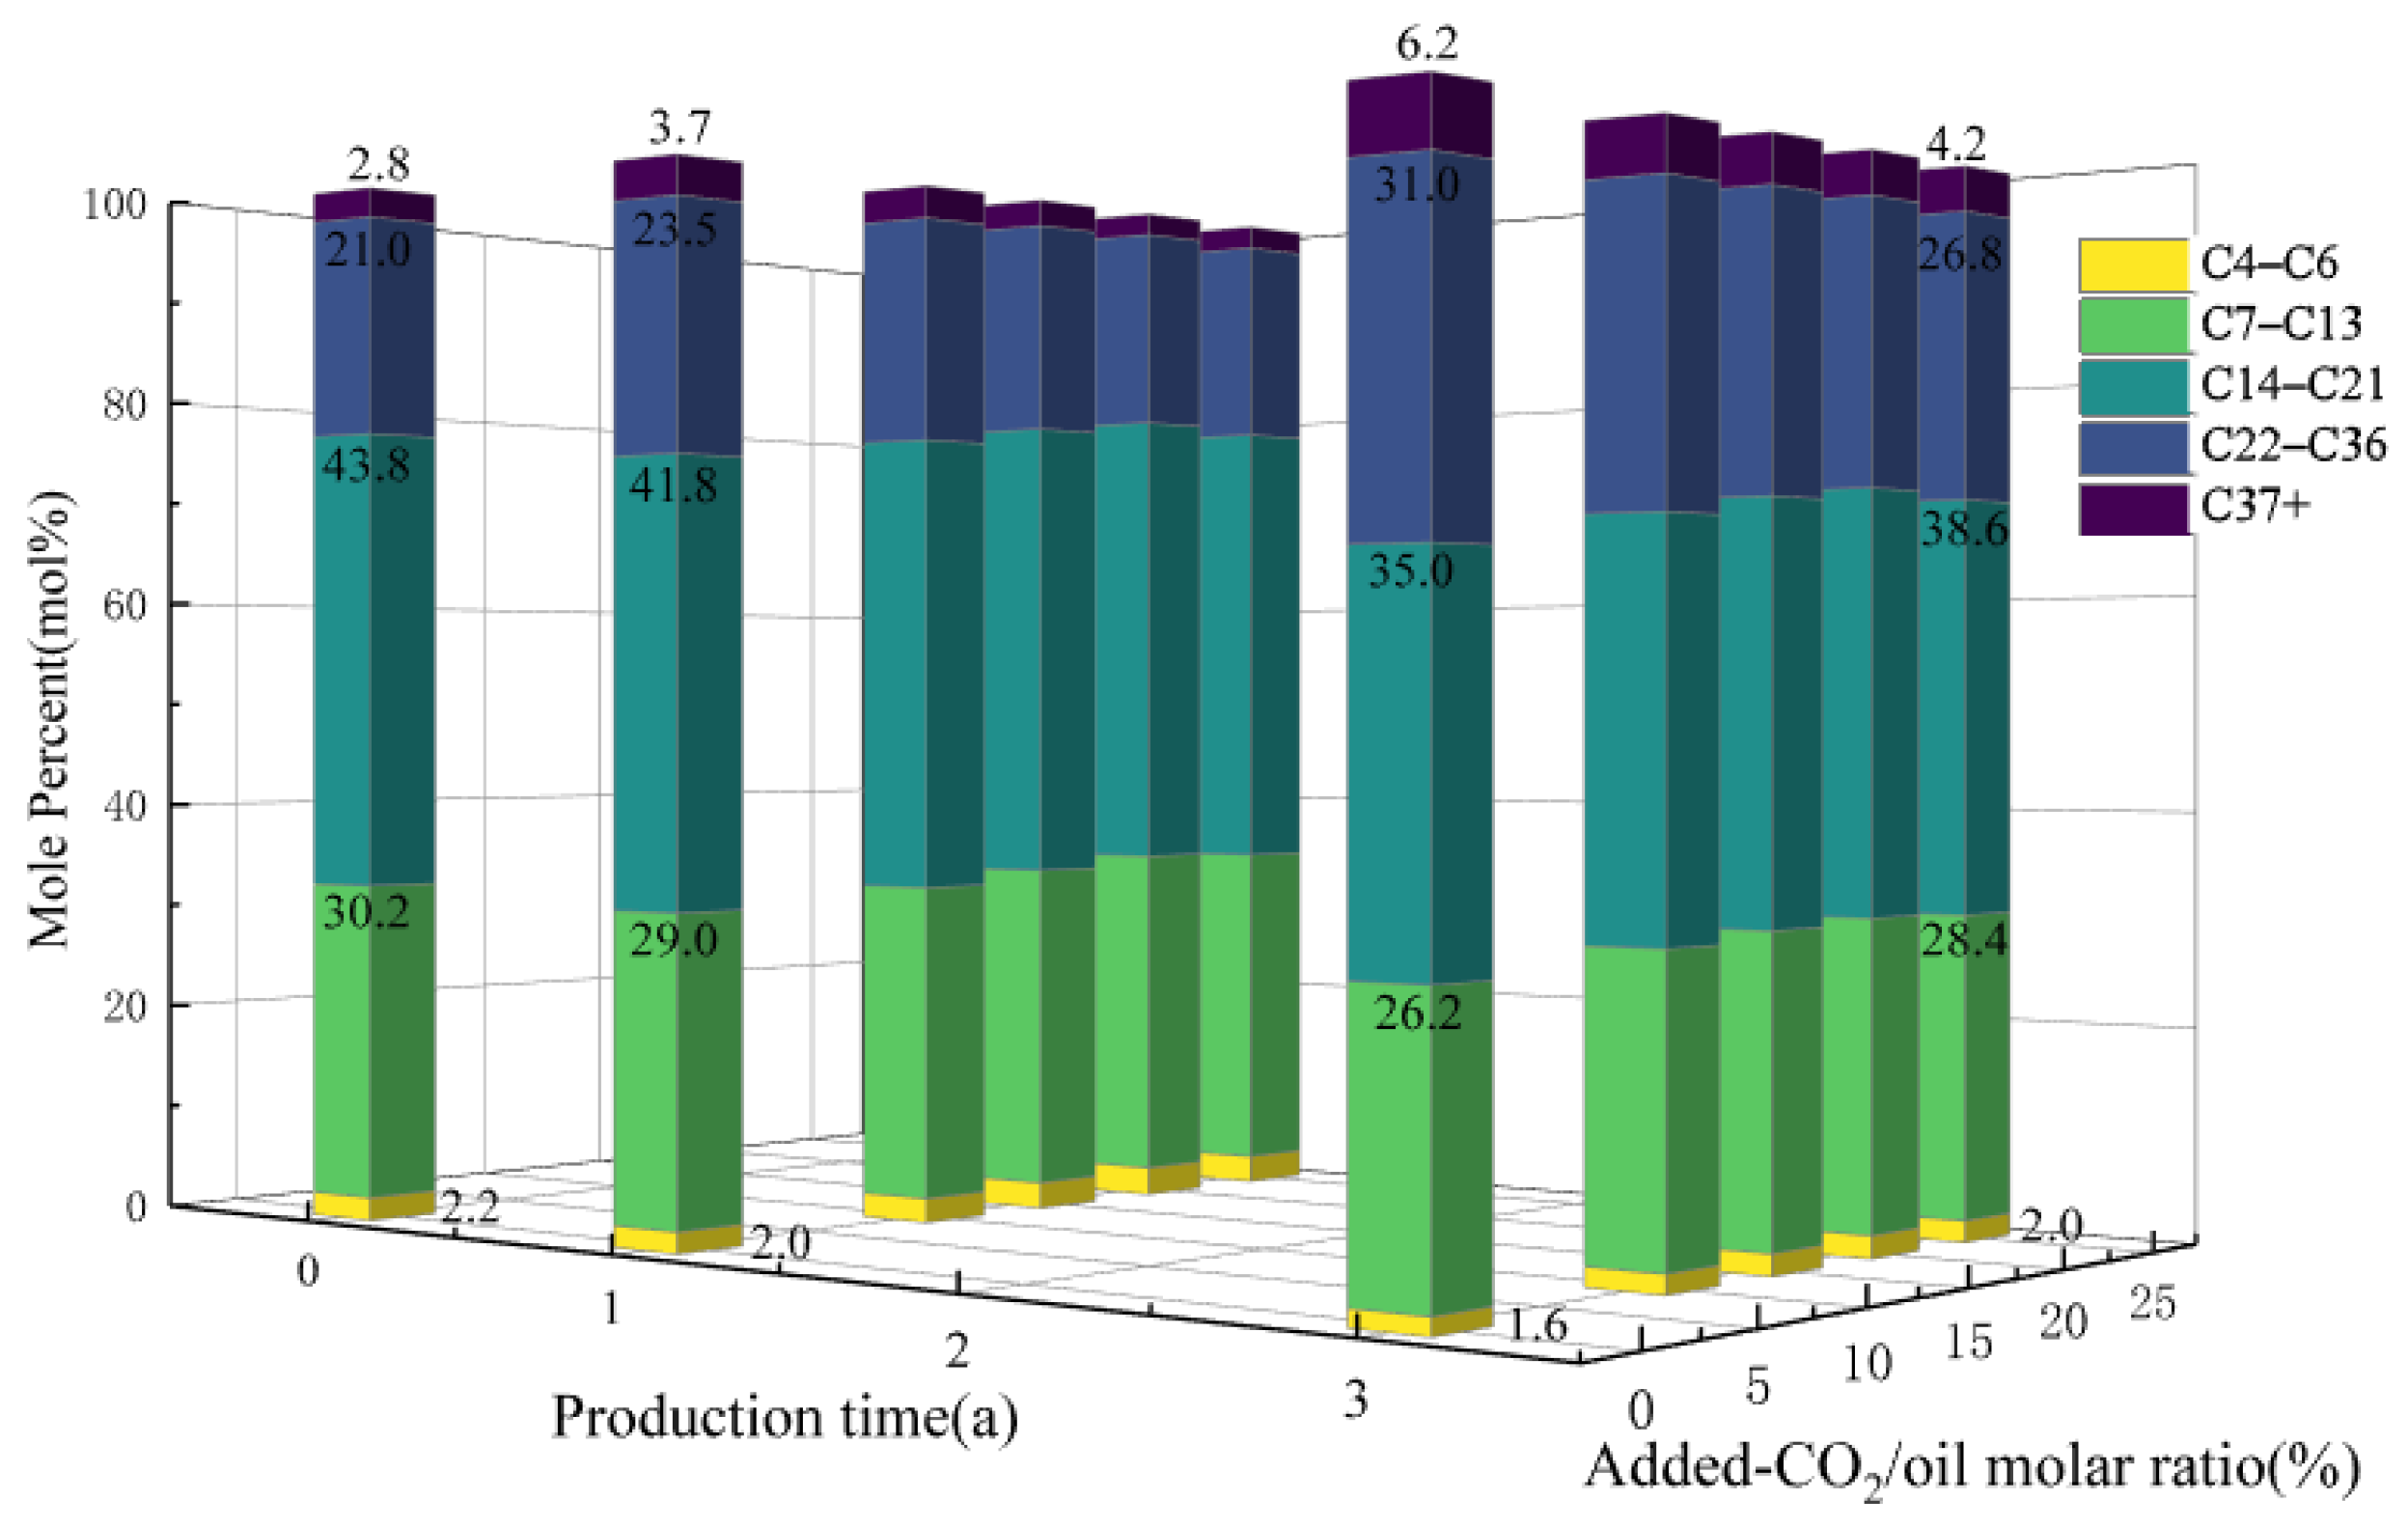
Figure 16 shows the composition of the produced oil stream rather than that of the oil remaining in the reservoir. After 1 year, increasing the simulated added CO
2/oil molar ratio from 0 to 20% increased the C7–C13 and C14–C21 fractions from 29.0 and 41.8% to 31.8 and 44.2%, respectively, while decreasing C22+ from 27.2 to 21.3%. The additional change at 25% was limited. The laboratory and simulation results describe different fluid populations. The PVT analysis characterizes the residual oil-rich phase after interphase transfer, whereas the simulation reports hydrocarbons transported to the production well. Preferential mobilization of light and intermediate components can therefore make the produced stream lighter while leaving contacted residual oil relatively heavier.
Table 6 compares the compositions of the initial oil, residual oil in regions with different degrees of CO
2 contact, and the produced oil after 3 years of production. In the CO
2-contacted region, the C22–C36 and C37+ fractions increased from 21.0 and 2.8% in the initial oil to 40.5 and 13.3%, respectively, whereas the combined C4–C21 fraction decreased from 76.2 to 46.2%. This indicates that strong CO
2–oil interaction preferentially mobilized light and intermediate hydrocarbons, leaving the local residual oil relatively enriched in heavy components. The weakly contacted residual oil showed an intermediate composition, with C22+ accounting for 42.6%, confirming that the extent of compositional redistribution depended on the degree of CO
2 contact.
In contrast, the produced oil contained 69.0% C4–C21 and only 31.0% C22+ and was therefore considerably lighter than the CO
2-contacted residual oil, for which C22+ reached 53.8%. This difference shows that the light and intermediate hydrocarbons mobilized from CO
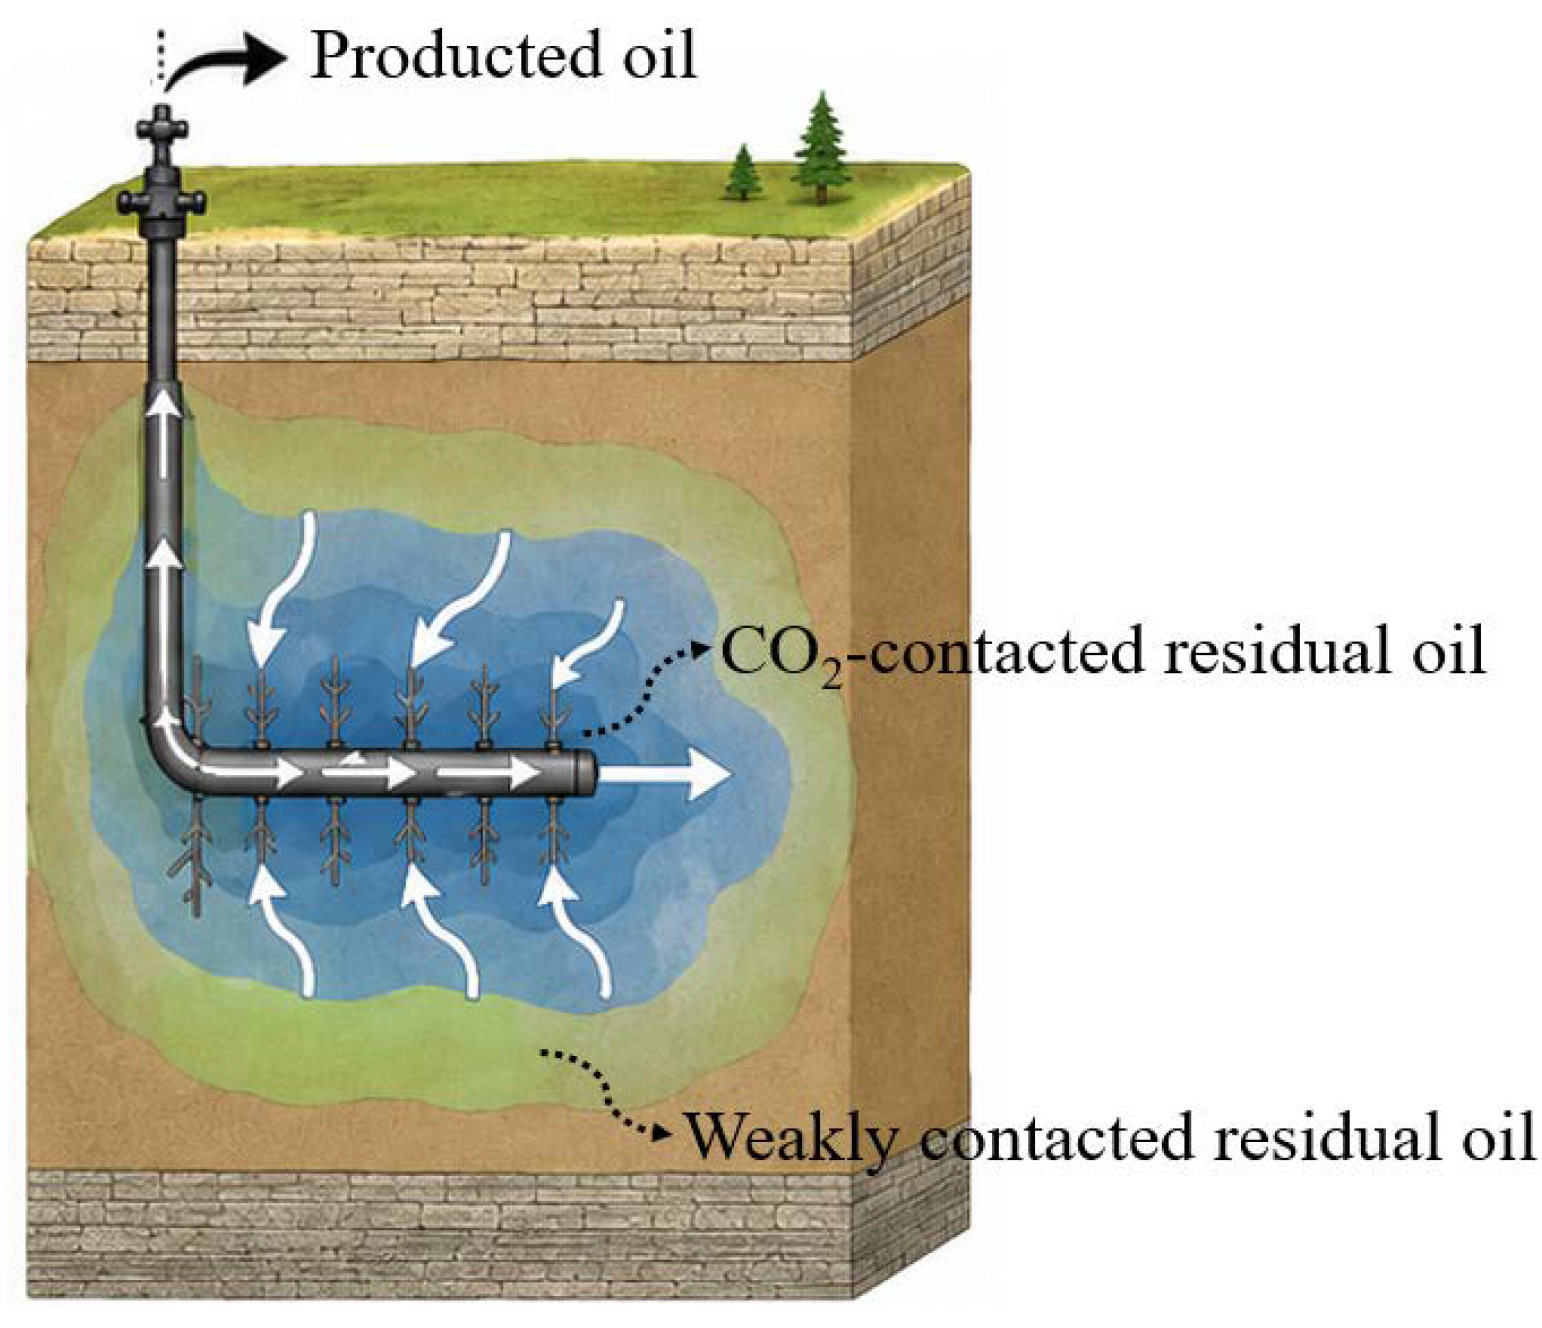
2-contacted regions were preferentially transported through fracture-connected flow paths to the production well. This spatially heterogeneous CO
2–oil contact and the associated compositional redistribution are schematically illustrated in
Figure 17. The heavying of residual oil in strongly contacted regions and the relative lightening of produced oil are complementary consequences of CO
2-induced compositional redistribution rather than contradictory results.



 ,
,