Article

Optimizing the Performance of Microbial Fuel Cells: Linking Laboratory Analysis and Multivariate Machine Learning Approach to Enhance Bioelectricity Generation from Wastewater


by
Mosammat Mustari Khanaum
1,*,
Shafiqur Rahman
2 and
Md. Saidul Borhan
3
1
Environmental and Conservation Sciences Program, North Dakota State University, Fargo, ND 58108, USA
2
Agricultural Research and Development Program (ARDP), Central State University, 1400 Brush Row Road, Wilberforce, OH 45384, USA
3
Department of Agricultural and Biosystems Engineering, North Dakota State University, Fargo, ND 58108, USA
*
Author to whom correspondence should be addressed.
Submission received: 20 October 2025 / Revised: 2 December 2025 / Accepted: 15 January 2026 / Published: 20 January 2026

Abstract

Laboratory-based research on microbial fuel cells (MFCs) is often costly and limited to a small number of variables, making optimization challenging. However, machine learning (ML) offers a promising solution by enabling efficient multivariate principal component analysis (PCA) and multivariable optimization. These techniques can provide significant insights and optimization opportunities. The goal of this study is to propose an ML-based approach to explore the relationships between bioelectricity generation (in terms of voltage, power density (PD), current density (CD), and coulombic efficiency (CE)) and two key variables, chemical oxygen demand (COD) and pH, as well as to recommend their optimal combinations. Specifically, the objectives are to (1) integrate a laboratory-based MFC study with multivariate data analyses; (2) apply PCA to reduce data complexity by focusing on the principal components that account for the greatest variance, thus improving interpretability; and (3) identify the optimal combinations of COD and pH for maximizing bioelectricity generation. The PCA results demonstrated that COD positively influenced the generated voltage while having an inverse effect on CE. Additionally, both PD and CD increased with higher pH values. The optimal combination of COD and pH improved CD, PD, and CE; however, their optimal combination for generated voltage differed, with higher COD leading to higher voltage. The optimal predicted voltage, CD, PD, and CE of the study were 795.71 (mV), 1451.80 (mA/m2), 57.46 (mW/m2), and 4.85%, respectively. By integrating ML approaches, this study contributed to the optimization of bioelectricity generation from wastewater and offered valuable insights for researchers working in this field.

1. Introduction

Microbial fuel cell (MFC) study is highly experimental in nature [1,2], making it both challenging and costly to identify the optimal combination of independent variables to yield the best outputs (e.g., electricity and/or pollutant removal). Due to the high costs of laboratory analysis, alternative approaches like an optimization method could serve as a potential solution. A properly designed MFC experiment may serve dual purposes, such as simultaneously generating electricity and removing pollutants from wastewater. However, their performance is enormously dependent on several factors, including substrate [3,4,5]; substrate chemical oxygen demand (COD) [4,6,7]; surface area of the electrode and electrode spacing [8,9,10]; pH of both anolyte and catholyte [11]; ion exchange membranes [12,13]; and others.
Studies on MFC primarily focus on three main aspects: bioelectricity generation, pollutant removal, and microbial community analysis. Several studies have examined MFC performance using a single or limited set of variables. For example, Li et al. [14] studied the effect of substrate pH on bacterial distribution to observe bioelectricity generation and noted maximum power densities (PD) at higher substrate pH values (8.5 to 10.5). Similar studies have observed that maximum PD, current density (CD), and voltage using alkaline anolytes [15,16]. However, a focus on univariate analysis may be insufficient to account for the complex, multidimensional relationships between multiple variables that influence bioelectricity generation. This makes MFC research challenging to optimize power generation across different variables. Due to the experimental nature of MFC research, studies often focus on a limited number of variables, sometimes with only a single variable/factor. Nonetheless, understanding the complex interactions between factors, such as anolyte COD and pH, and their combined effect on bioelectricity generation is crucial.
Machine learning (ML) offers a promising approach to optimizing combinations of multiple variables (factors) to achieve the best possible outcomes. It has increasingly been applied across various scientific fields, including MFC research. A few studies have applied ML to MFC research, with different scopes. For instance, Tardast [17] employed an artificial neural network (ANN) with a multilayer perceptron architecture to predict bioelectricity production from glucose. Similarly, Tsompanas [2] used an ANN to simulate the polarization of cylindrical MFCs with different membrane materials and electrode configurations, predicting the voltage. Qazani et al. [18] applied a type-2 fuzzy neural network (T2FNN) to predict MFC performance, in terms of COD removal, coulombic efficiency (CE), and electricity generation, based on varying input parameters, such as glucose, yeast extract, and aeration rate. ANNs, specifically, support vector machine (SVM) and boosted regression tree, have also been used to predict power generation based on key operating parameters, improving both the accuracy and reliability of models [19].
ML techniques, particularly Extreme Gradient Boosting (XGBoost), Categorical Boosting (CatBoost), Adaptive Boosting (Adaboost), Random Forest, and linear regression, have been used to accurately predict power output by evaluating multiple catalyst materials in MFCs [20,21]. (SVMs) and random forests have been explored for parameter optimization, allowing for better control of MFC processes [22]. Moreover, hybrid ML models, which combine real-time sensor data with these techniques, have been shown to enhance monitoring and control in dynamic MFC systems [23]. Despite these advancements, challenges remain, including issues related to scalability for large-scale applications and model generalizability [24]. To enhance fuel-cell efficiency, lower costs, and maximize power production, studies have trained different Artificial Intelligence (AI) models on comprehensive simulation and experimental datasets to accurately predict power output [18,25,26]. All of these models were predictive tools that trained datasets to estimate electricity generation. However, none of these studies examined the relationships among multiple variables or identified the optimal combination needed to maximize performance. The integration of ML into MFC research holds promising potential for optimizing energy production and advancing sustainable bioelectrochemical systems [27,28].
Multivariate data analysis can be a simple and efficient way to uncover hidden relationships between multiple variables and determine the optimal combination of these variables to achieve the best outcome. To improve the performance of MFC, several studies conducted multivariate data analysis by considering two or more types of the same variables. For example, two different membrane types, normal ultrafiltration (UF) and polyaniline (PANI), were used to determine the structure and diversity of the bacterial community in the MFCs, with principal component analysis (PCA) analysis indicating that the UF membrane favored electroactive bacteria and could generate more electricity [29]. Similarly, to compare the performance of MFCs using different types of substrates, studies conducted PCA to identify different patterns, relationships, and interplays among variables, showing that MFCs produced the highest electricity with excess sludge [30] and municipal wastewater [31]. However, the method for identifying the optimal combination of two or more MFC variables to achieve the best bioelectricity output is still unknown. ML-induced PCA and multivariate regression analysis can provide better insights into the optimal conditions for power generation and improve model interpretability. Therefore, the goal of this study is to propose an ML technique to understand the relationships between bioelectricity generation (in terms of voltage, PD, CD, and CE) and two key variables, COD and pH, as well as their various combinations. To achieve this goal, the specific objectives of the study are to (1) integrate a laboratory-based MFC study with ML; (2) employ PCA to reduce data complexity, focusing on principal components that explain the most variance and help improve interpretability; and (3) identify the optimal combinations of COD and pH values to achieve the best outcome for bioelectricity generation, in terms of voltage, PD, CD, and CE. By employing these proposed techniques, the study contributes to improving process optimization, which could lead to efficient bioelectricity generation from wastewater and provide valuable guidelines for researchers and policy makers in this field.

2. Materials and Methods

2.1. Experimental Design, Instrumentation, and Operation

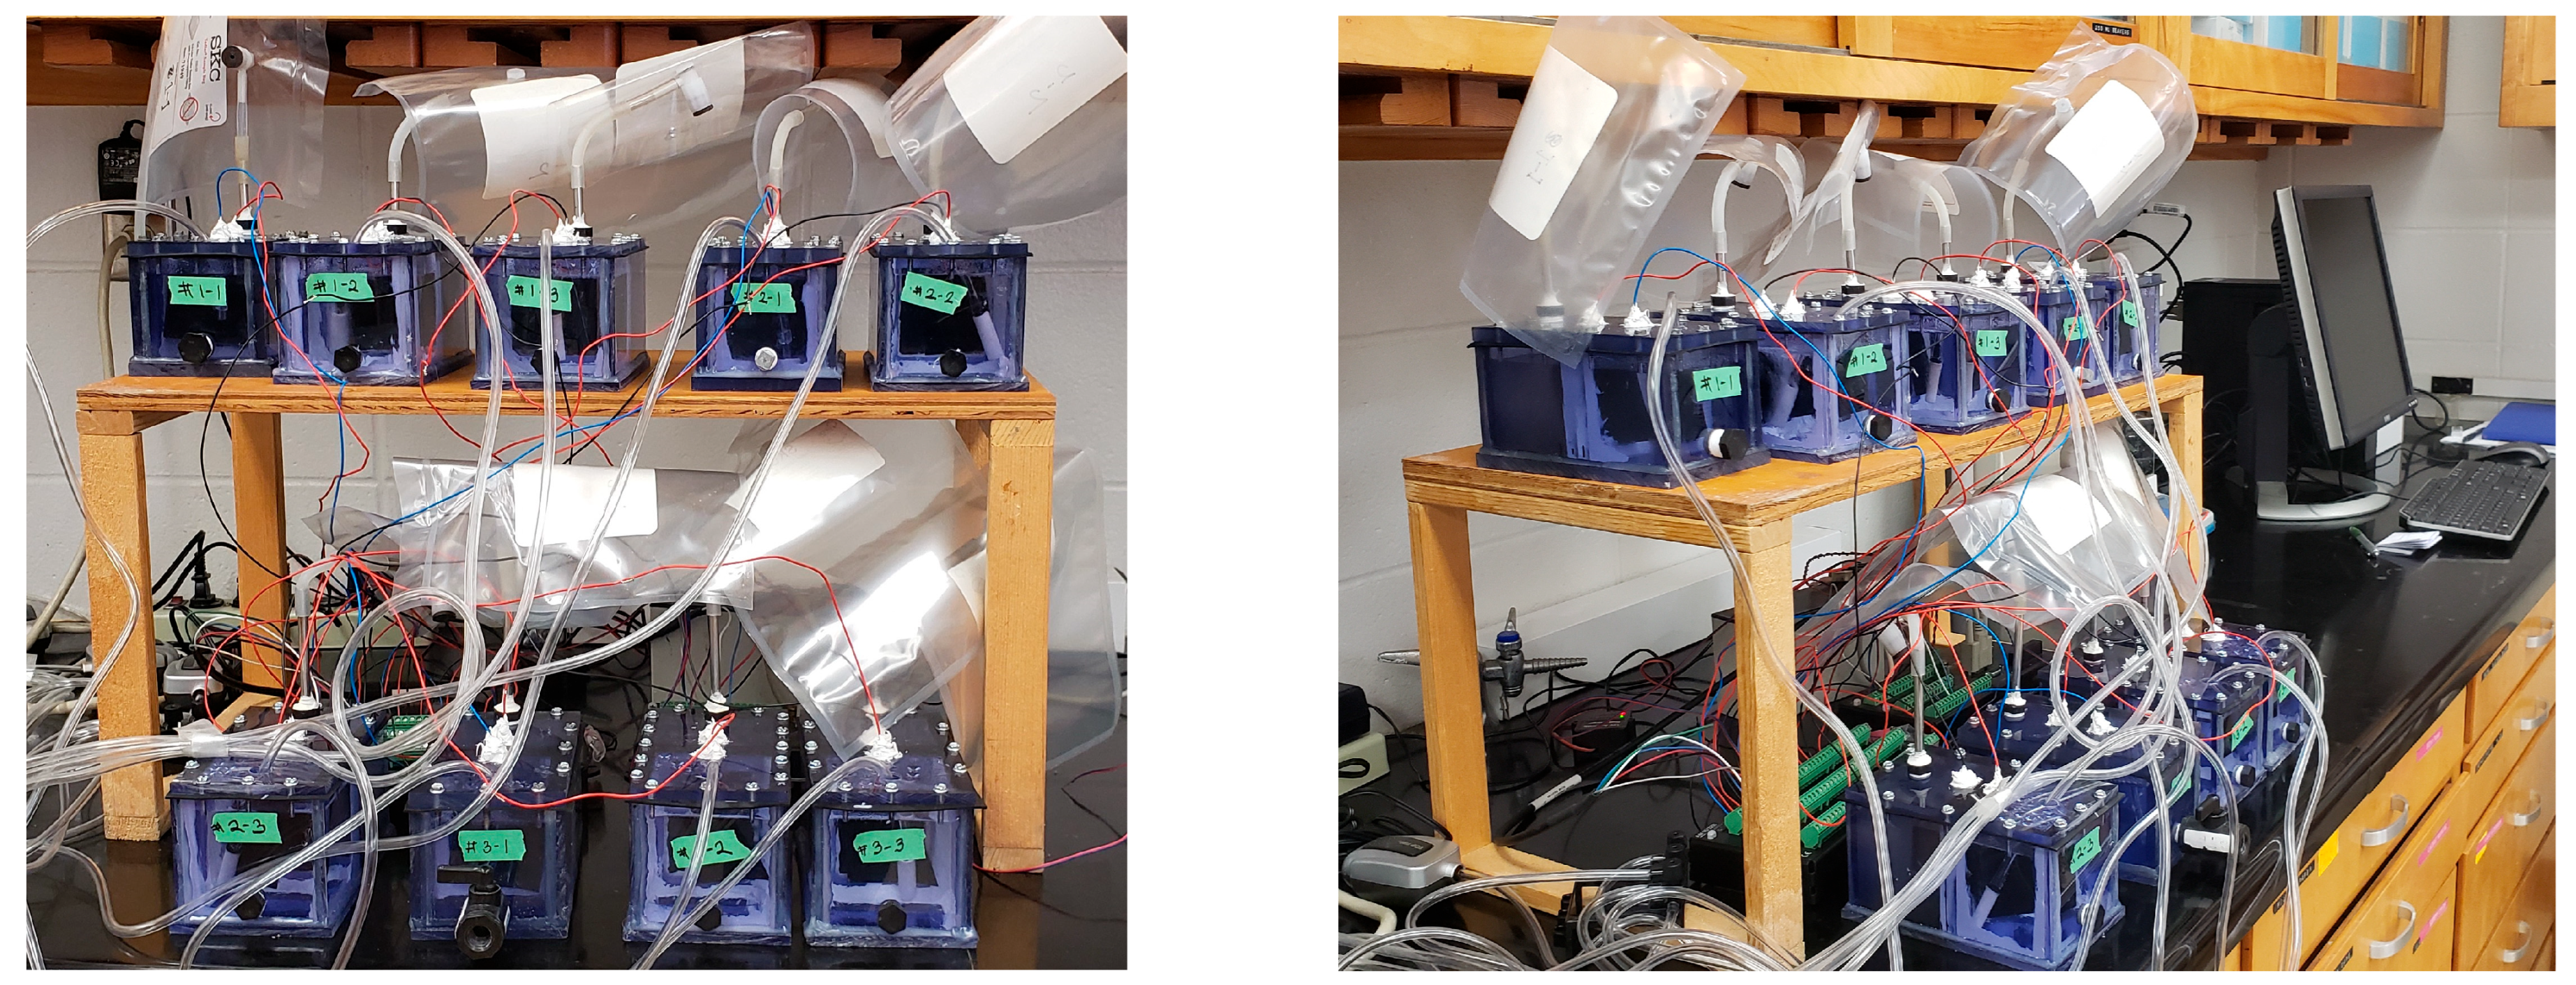
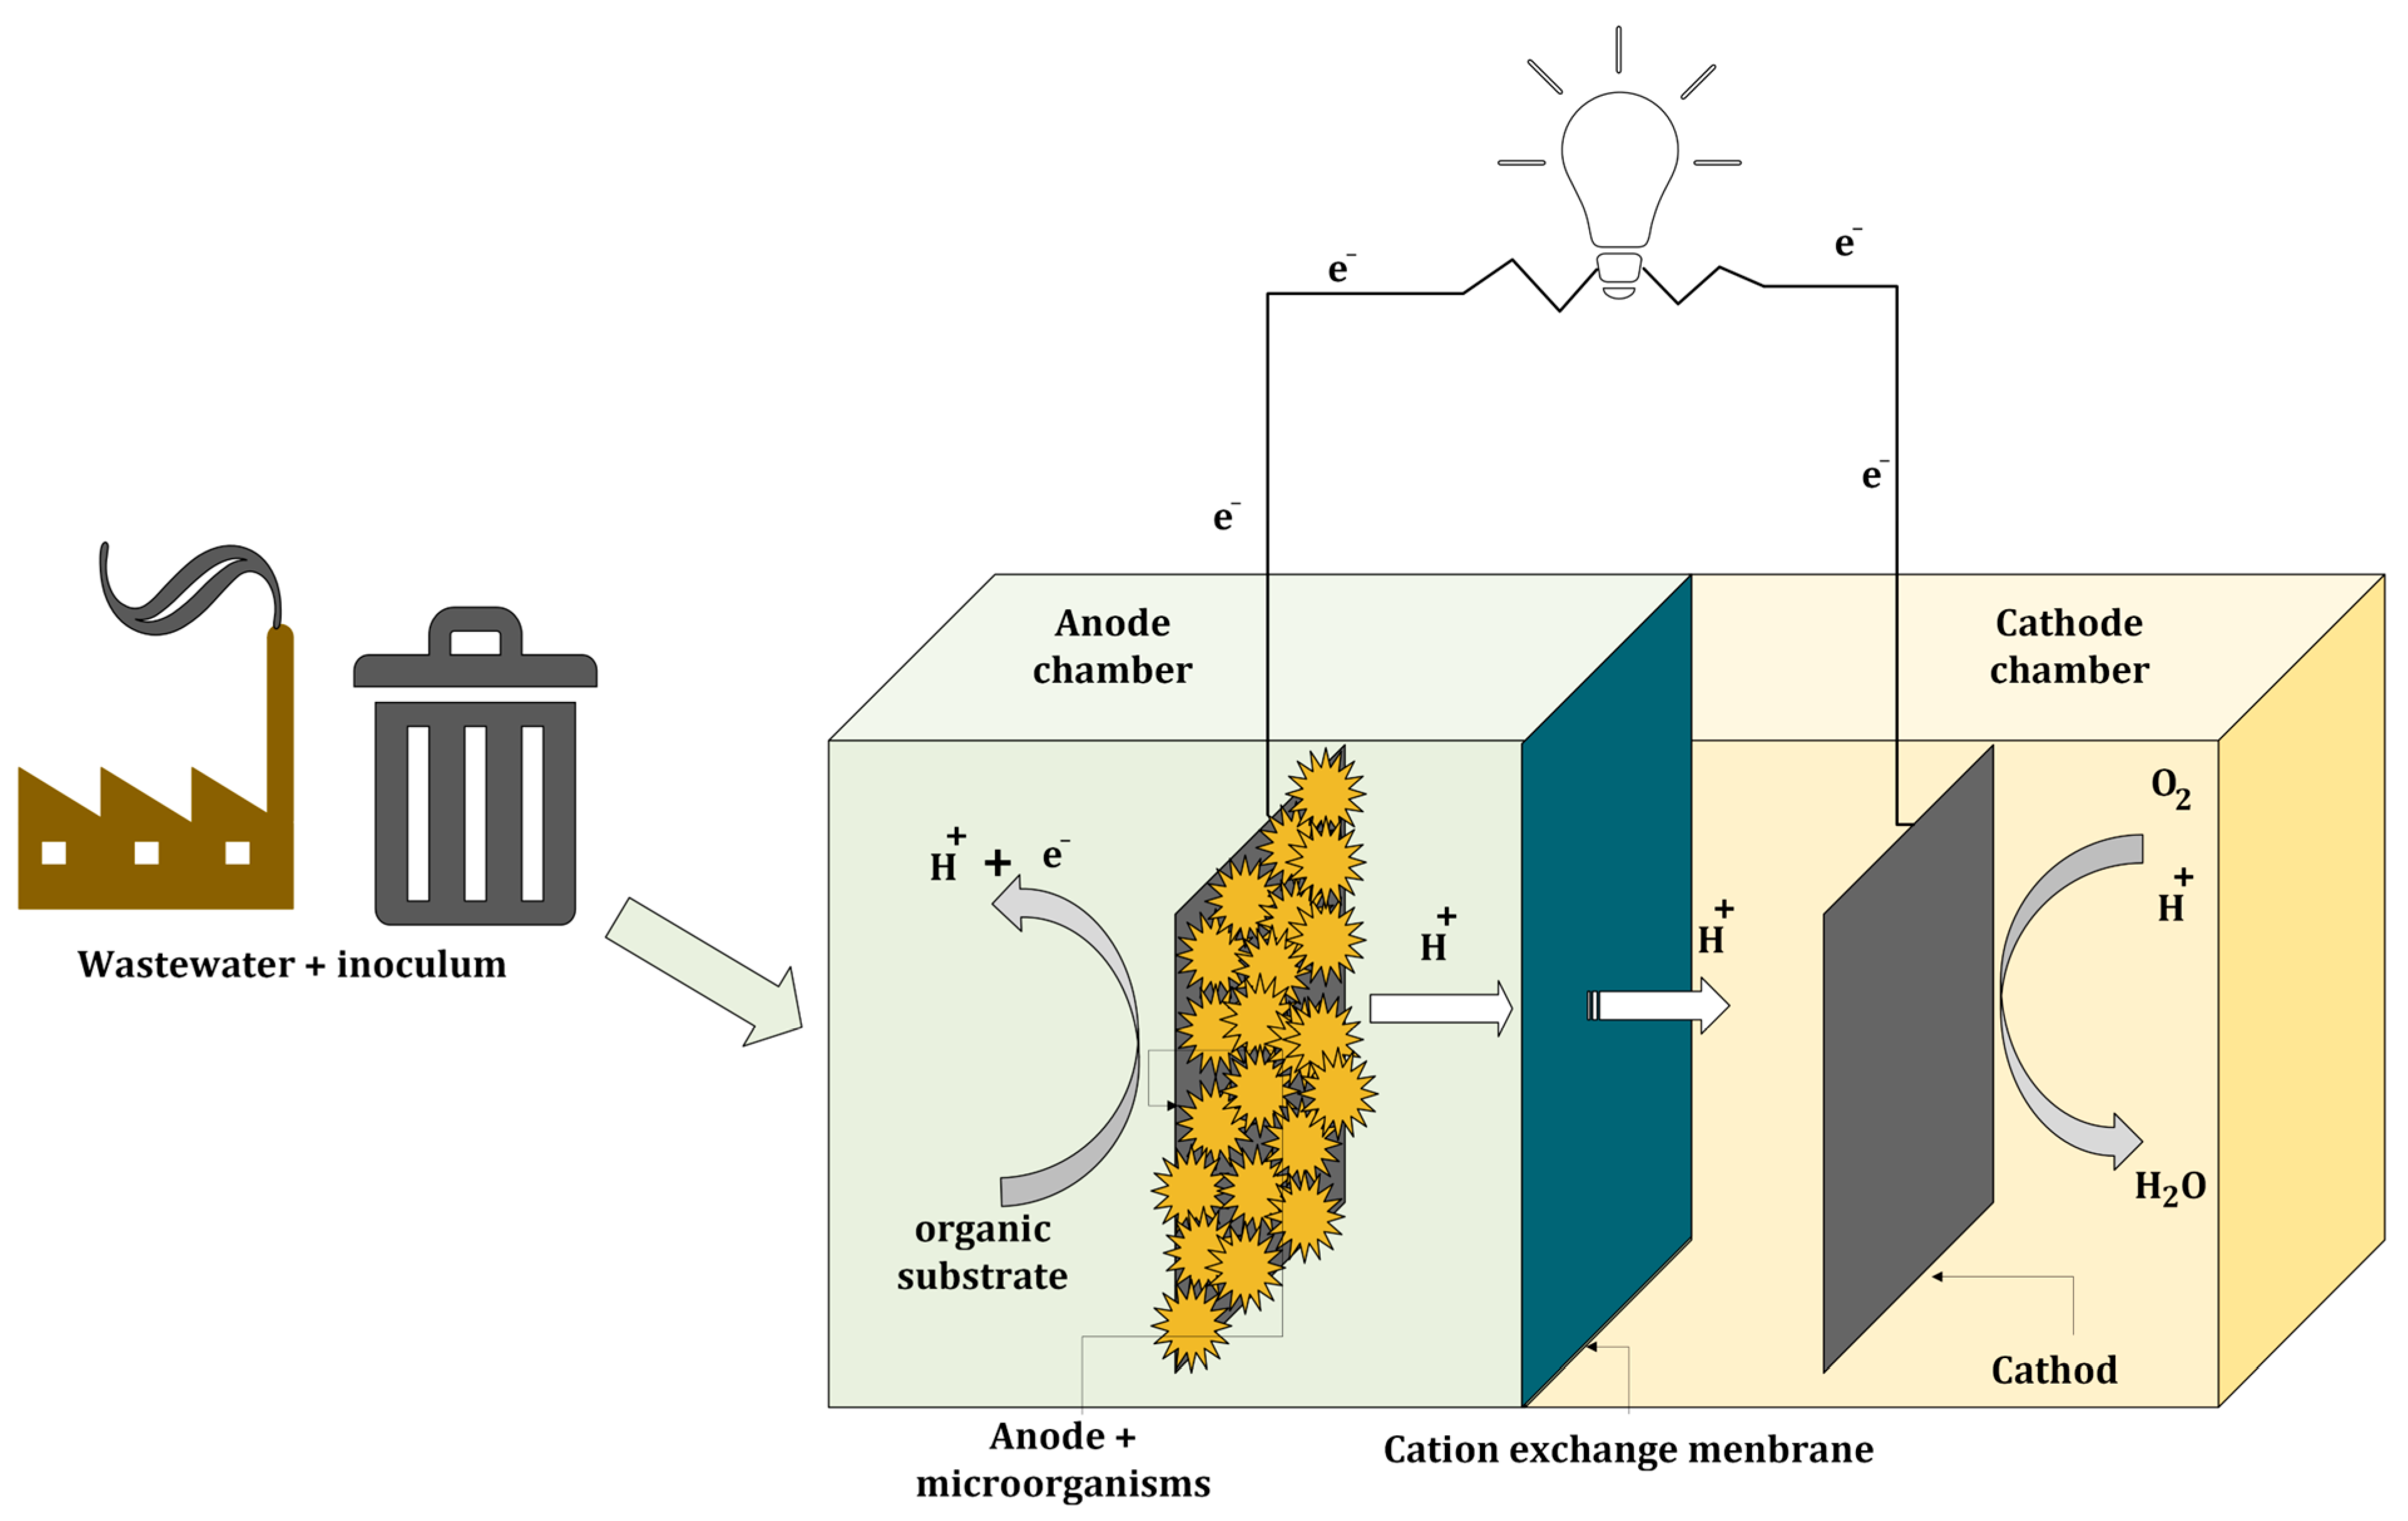
This study involved batch-mode testing of nine dual-chamber MFCs (Figure 1) made from clear polyvinyl chloride (PVC), while anode and cathode chambers (volume 350 ± 15 mL) were separated using a Cation Exchange Membrane (CEM), Nafion (N117-30, Fuel Cell Earth LLC, Woburn, MA, USA). Carbon cloth (EC40-40, Fuel Cell Earth LLC, Woburn, MA, USA) was used as electrodes (31 cm2 each) and connected to a datalogger (CR 1000X, Campbell Scientific LLC, Logan, UT, USA) using 22 AWG copper wire. The datalogger recorded voltage data every 15 min, while thermocouples monitored the temperature. A low-flow air-stone (Small Fish Tank Air Stone- Air-1000 pump, Top Fin, Phoenix, AZ, USA) system ensured oxygen presence in the cathode chamber (Figure 2). To create anaerobic conditions in the anode chamber, nitrogen gas was purged before sealing the anode chamber.
The study used a 50 mM potassium phosphate (KH2PO4 molecular weight 136.086 g/mol, VWR, West Chester, PA, USA) solution as the catholyte and wastewater from American Crystal Sugar Co. (46°54′10.5192″ N, 96°45′31.9356″ W), Moorhead, MN, USA, processing plant as the substrate, inoculated with exoelectrogenic microorganisms from Fargo City Wastewater Treatment Plant (46°55′21.2844″ N, 96°47′15.234″ W), Fargo, ND, USA. The study was conducted at room temperature and involved regular monitoring of voltage, current density, power density, and coulombic efficiency under varying external resistances (10–4700 Ω), and the data were used to generate polarization and power curves. For detailed procedures and calculations, readers may refer to our previous studies [7,16,32].
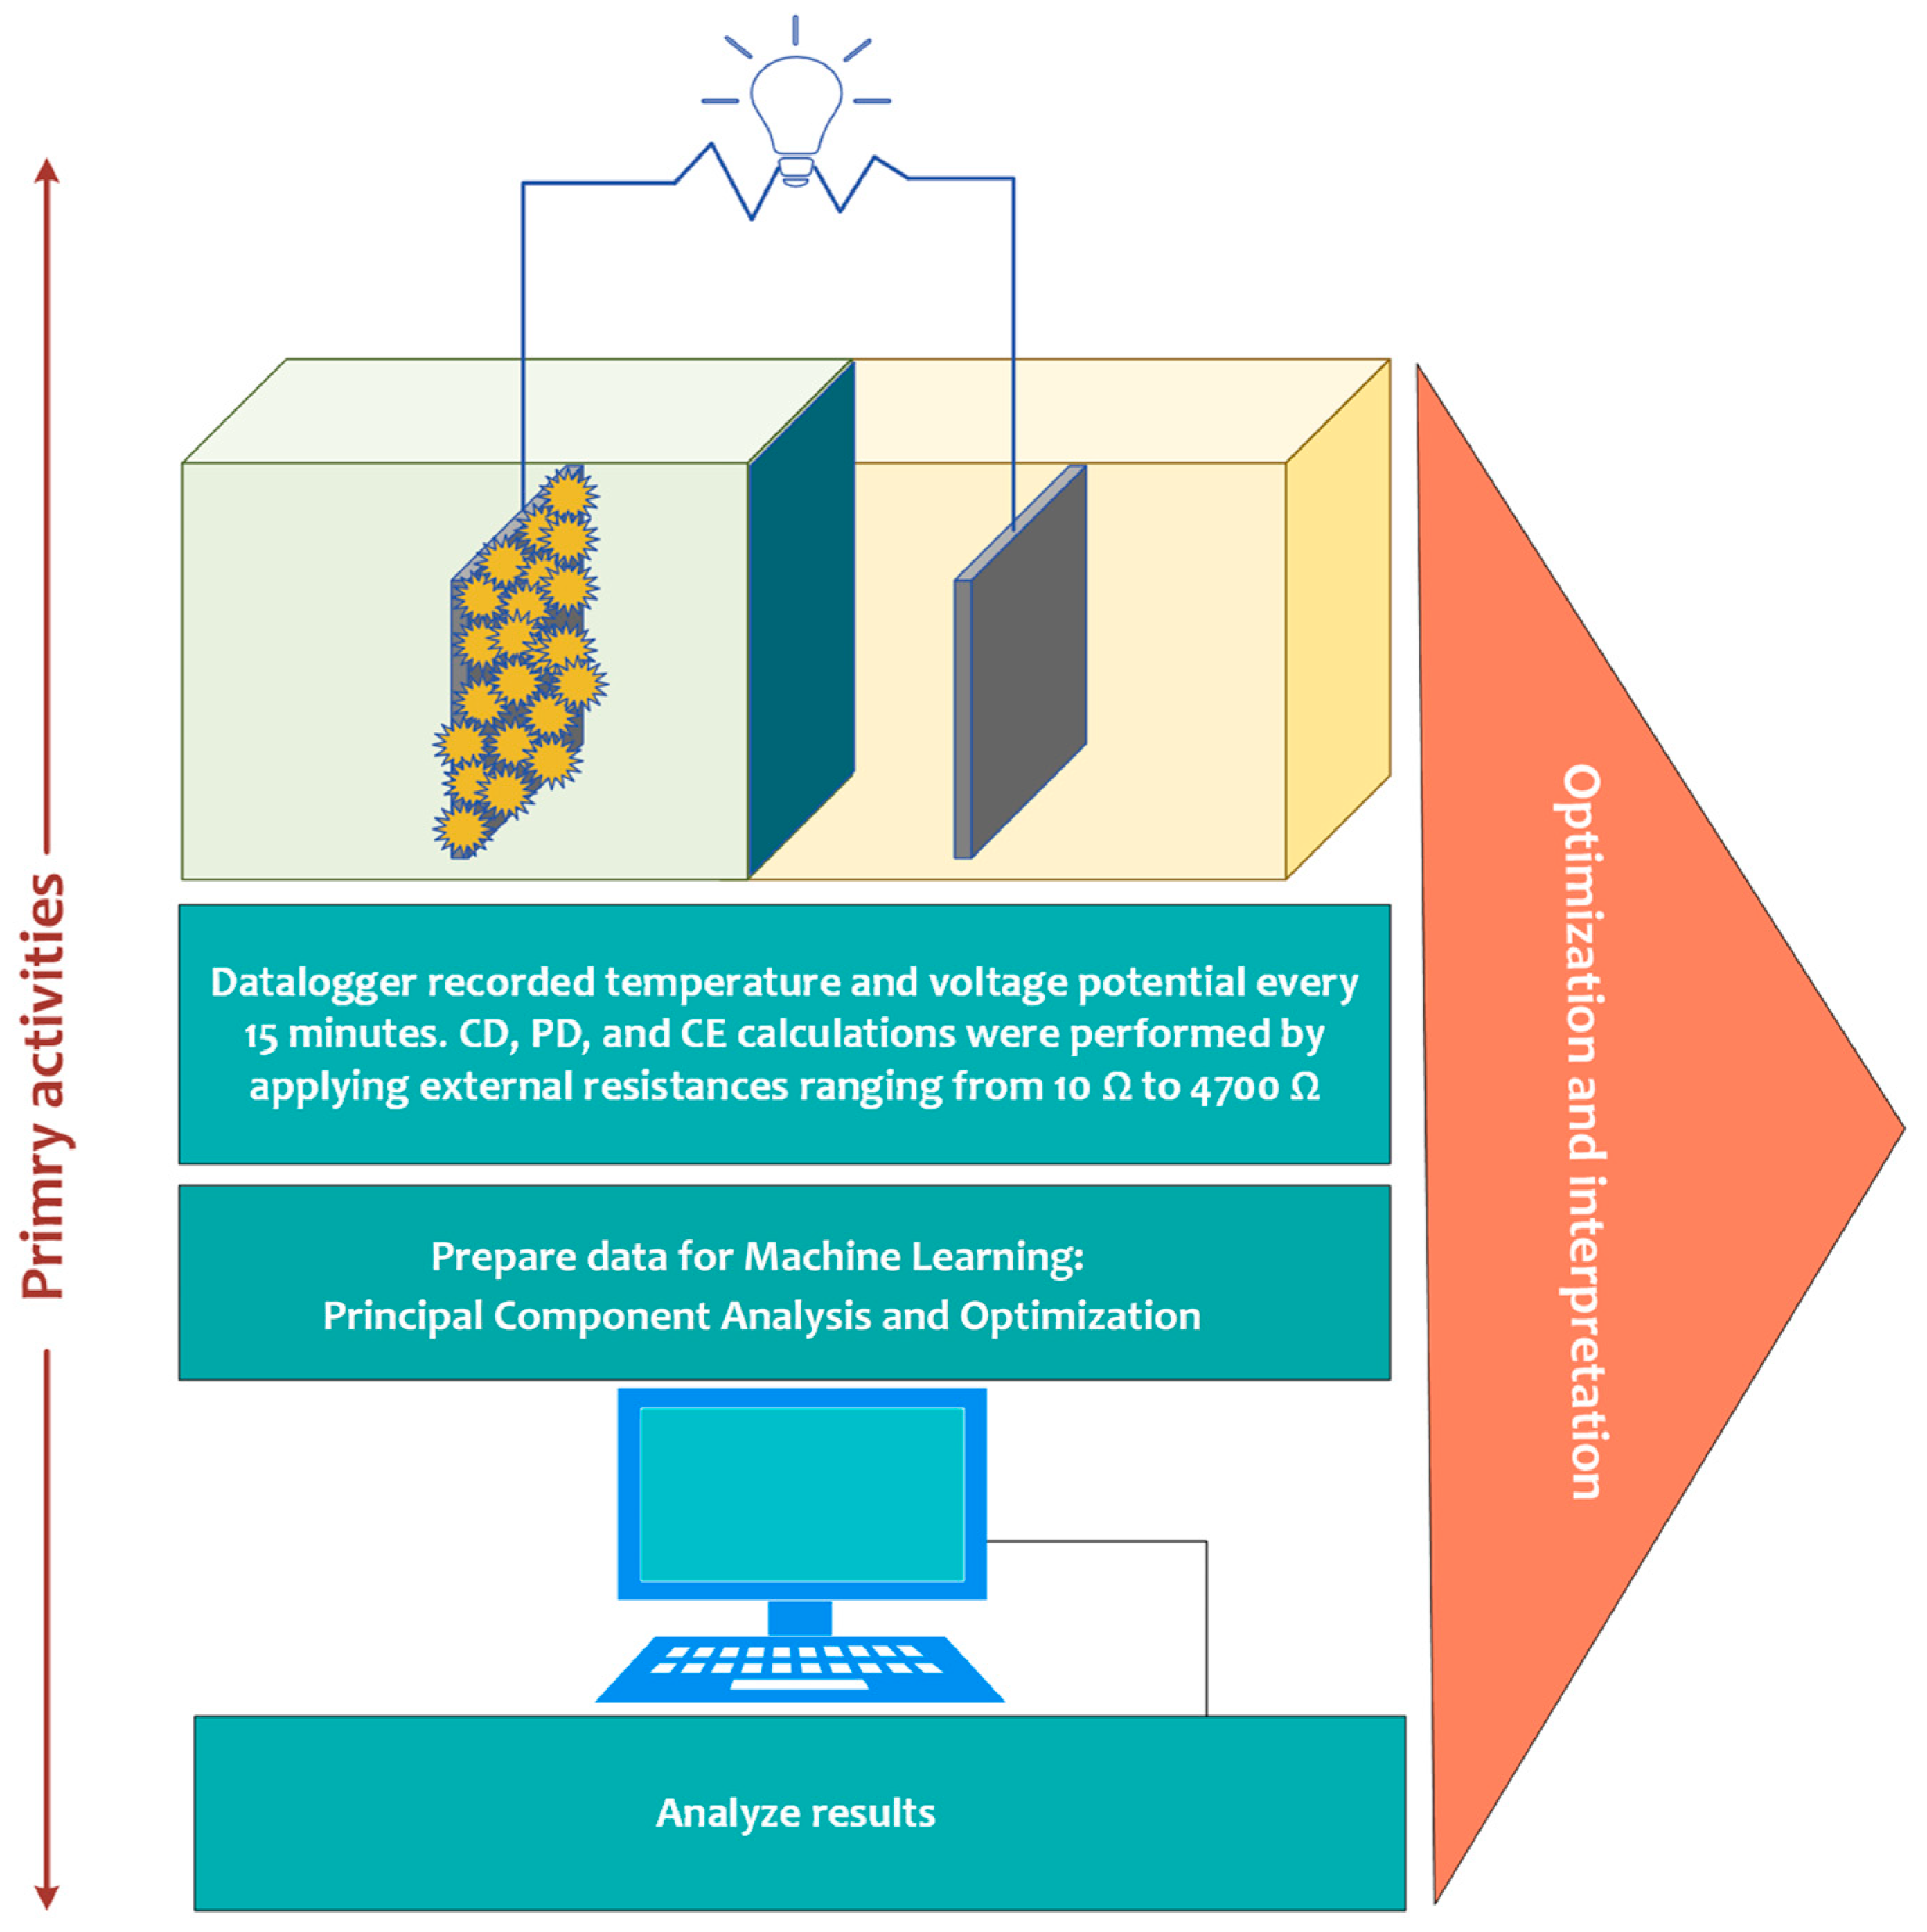
In this study, two experimental batches, each comprising nine reactors (Figure 2), were conducted: Batch one (B1) explored three different COD levels, and Batch two (B2) investigated three different pH levels. Batch-mode experiments with three replications were conducted. At B1, three different substrate CODs (e.g., 1373 ± 40, 1990 ± 56, and 3570 ± 20 mg/L) were employed to analyze the pollutant reduction, while B2 tested different pH levels (6.5 ± 0.10; 8.6 ± 0.10; 9.5 ± 0.10). Table 1 shows the initial parameters of substrate and catholyte used in this study, and Figure 3 shows the detailed framework of the study. In all experiments, the substrate was analyzed for elemental content, and replicates were performed for consistency. Polarization and power curves were generated by applying step changes to digital resistors connected to each cell. Initially, the resistance was set to 10 Ω and then increased up to 4700 Ω (10, 22, 47, 100, 220, 330, 470, 680, 1000, 2200, 3300, and 4700 Ω). Polarization and power curves were developed to examine the relationships between voltage potential and current density, and between power density and current density, respectively. In addition, the coulombic efficiency (CE) was calculated to evaluate how efficiently the reactors transferred electrons during operation.
The initial wastewater parameters, including electrical conductivity (EC), pH, and COD, were measured both before and after the experiment for both the substrate and the catholyte. EC and pH were analyzed using a HANNA multi-parameter bench meter (Model HI 4522; Hanna, Woonsocket, RI, USA). COD in the SBWW was determined using the HACH high-range COD reagent and the HACH-8000 method. In this procedure, 2 mL of sample was added to a high-range COD reagent vial and digested at 150 °C for 2 h using a HACH block digester (DRB 200, Loveland, CO, USA). After cooling to room temperature, the colorimetric test was conducted using a HACH spectrophotometer (Model 2800, Loveland, CO, USA). Elemental analysis of the before- and after-experiment substrate was performed using an inductively coupled plasma (ICP) analyzer, and 16S rRNA gene sequencing was conducted separately to evaluate microbial diversity in the post-experiment substrate and anode samples. However, the results of ICP and microbial analyses were not interpreted in this study, as they fall outside the scope of the current work.

2.2. Reduction of Dimention Using Principal Component Analysis (PCA)

The results from all the experiments, including B1 and B2, were subjected to multivariate statistical analysis using principal component analysis (PCA) (R Studio version 2024.04.2) to gain deeper insights into the relationships between various experimental levels, key performance indicators, and selected monitoring variables. The related multivariate analysis R packages, such as ggplot2 and dplyr, were used to identify possible relationships between different variables. The PCA was performed to reduce the dimensionality of the dataset. Since multiple parameters associated with bioelectricity were considered, PCA helped identify the most important components that explain the most variance in the data. This reduced the complexity of the data and focused on the most informative features. In this study, power density (PD), current density (CD), coulombic efficiency (CE), generated voltage (VOL), and voltage with external resistance (VOLR) were selected as five dependent variables, whereas chemical oxygen demands (CODs) and pHs of anolyte were considered as independent variables. A total of 18 observations were available for each variable, with no missing data. Multicollinearity was tested using the Variance Inflation Factor (VIF), where VIF ≥ 10 was considered a problematic issue [33,34].
In order to run PCA, it was necessary to scale the dataset. Therefore, the dataset was centered and scaled to ensure that the variables with different scales are treated equally. Before performing PCA, the dataset was standardized to make all variables on a comparable scale. Standardization was carried out using the scale() function in R, which applies z-score normalization (mean = 0, standard deviation = 1), ensuring that variables with different units contributed equally to the analysis. A scree plot was prepared to select the number of principal components to be extracted from the original data, which were then used as predictors in the regression models.
A correlation matrix based on the standardized variables was then generated to represent all pairwise correlations. This matrix was used to compute eigenvalues and eigenvectors, which describe the magnitude and direction of the variance structure in the dataset. Principal components (PCs) were formed by ordering eigenvalues in descending order, with each PC representing a combination of the original variables. In this study, seven PCs summarized the compressed information contained in all variables. In addition to dimensionality reduction, PCA highlighted the correlation patterns and interdependencies among the variables influencing MFC performance. The PCs were selected using Kaiser’s law (eigenvalue > 1) [35]. This approach captures most of the information from the original variables in the newly derived dimensions. A variance score ≥ 70% was considered sufficient to capture the majority variance of the data set. Following Jackson [36], PCs with an eigenvalue ≥ 1, explained up to 70% of the sample variability and were retained for further analysis. In addition, the scree plot was utilized to confirm the appropriate number of PCs [37].

2.3. Optimal Combination of Independent Variables

Following PCA, regression models were constructed with each dependent variable identified, transforming discrete experimental data into continuous predictions across the studied parameters. Regression models generated continuous predicted values for all five dependent variables. Model performance was evaluated using metrics, including R2 and p-values, to evaluate the model fit and predictive reliability. The R2 for those models with PD, CD, CE, VOL, and VOLR were 0.83, 0.73, 0.89, 0.77, and 0.65, respectively, and the p-values were <0.0006 for all. The resulting continuous model outputs enabled the preparation of heatmaps, which were used to visualize and explore optimal combinations of independent variable levels for maximizing bioelectricity production in MFCs. This integrated approach, using multivariate analysis for variable selection, robust regression modeling for prediction, and graphical interpretation, provided an effective framework to identify and optimize MFC operational conditions for enhanced bioelectricity output.
In order to determine the optimum combination of independent variables (CODs and pHs) that generate the highest predicted outcomes (VOL, VOLR, PD, CD, and CE), heatmaps were created using the gridExtra package in R Studio (version 2024.04.2). The results were presented in both tabular and heatmap visuals using R Studio version 2024.04.2. Since MFC experiments are highly laboratory-based and expensive, three to seven different levels (for example, three pH levels or five COD levels) of the independent variables are most commonly used in scientific research. In this study, we used three different pH levels and four different COD levels. With the help of this analysis, these discrete levels were transformed into continuous levels, allowing us to visualize the continuous results within the range of the independent variables.

3. Results

3.1. Overall Experimental Results

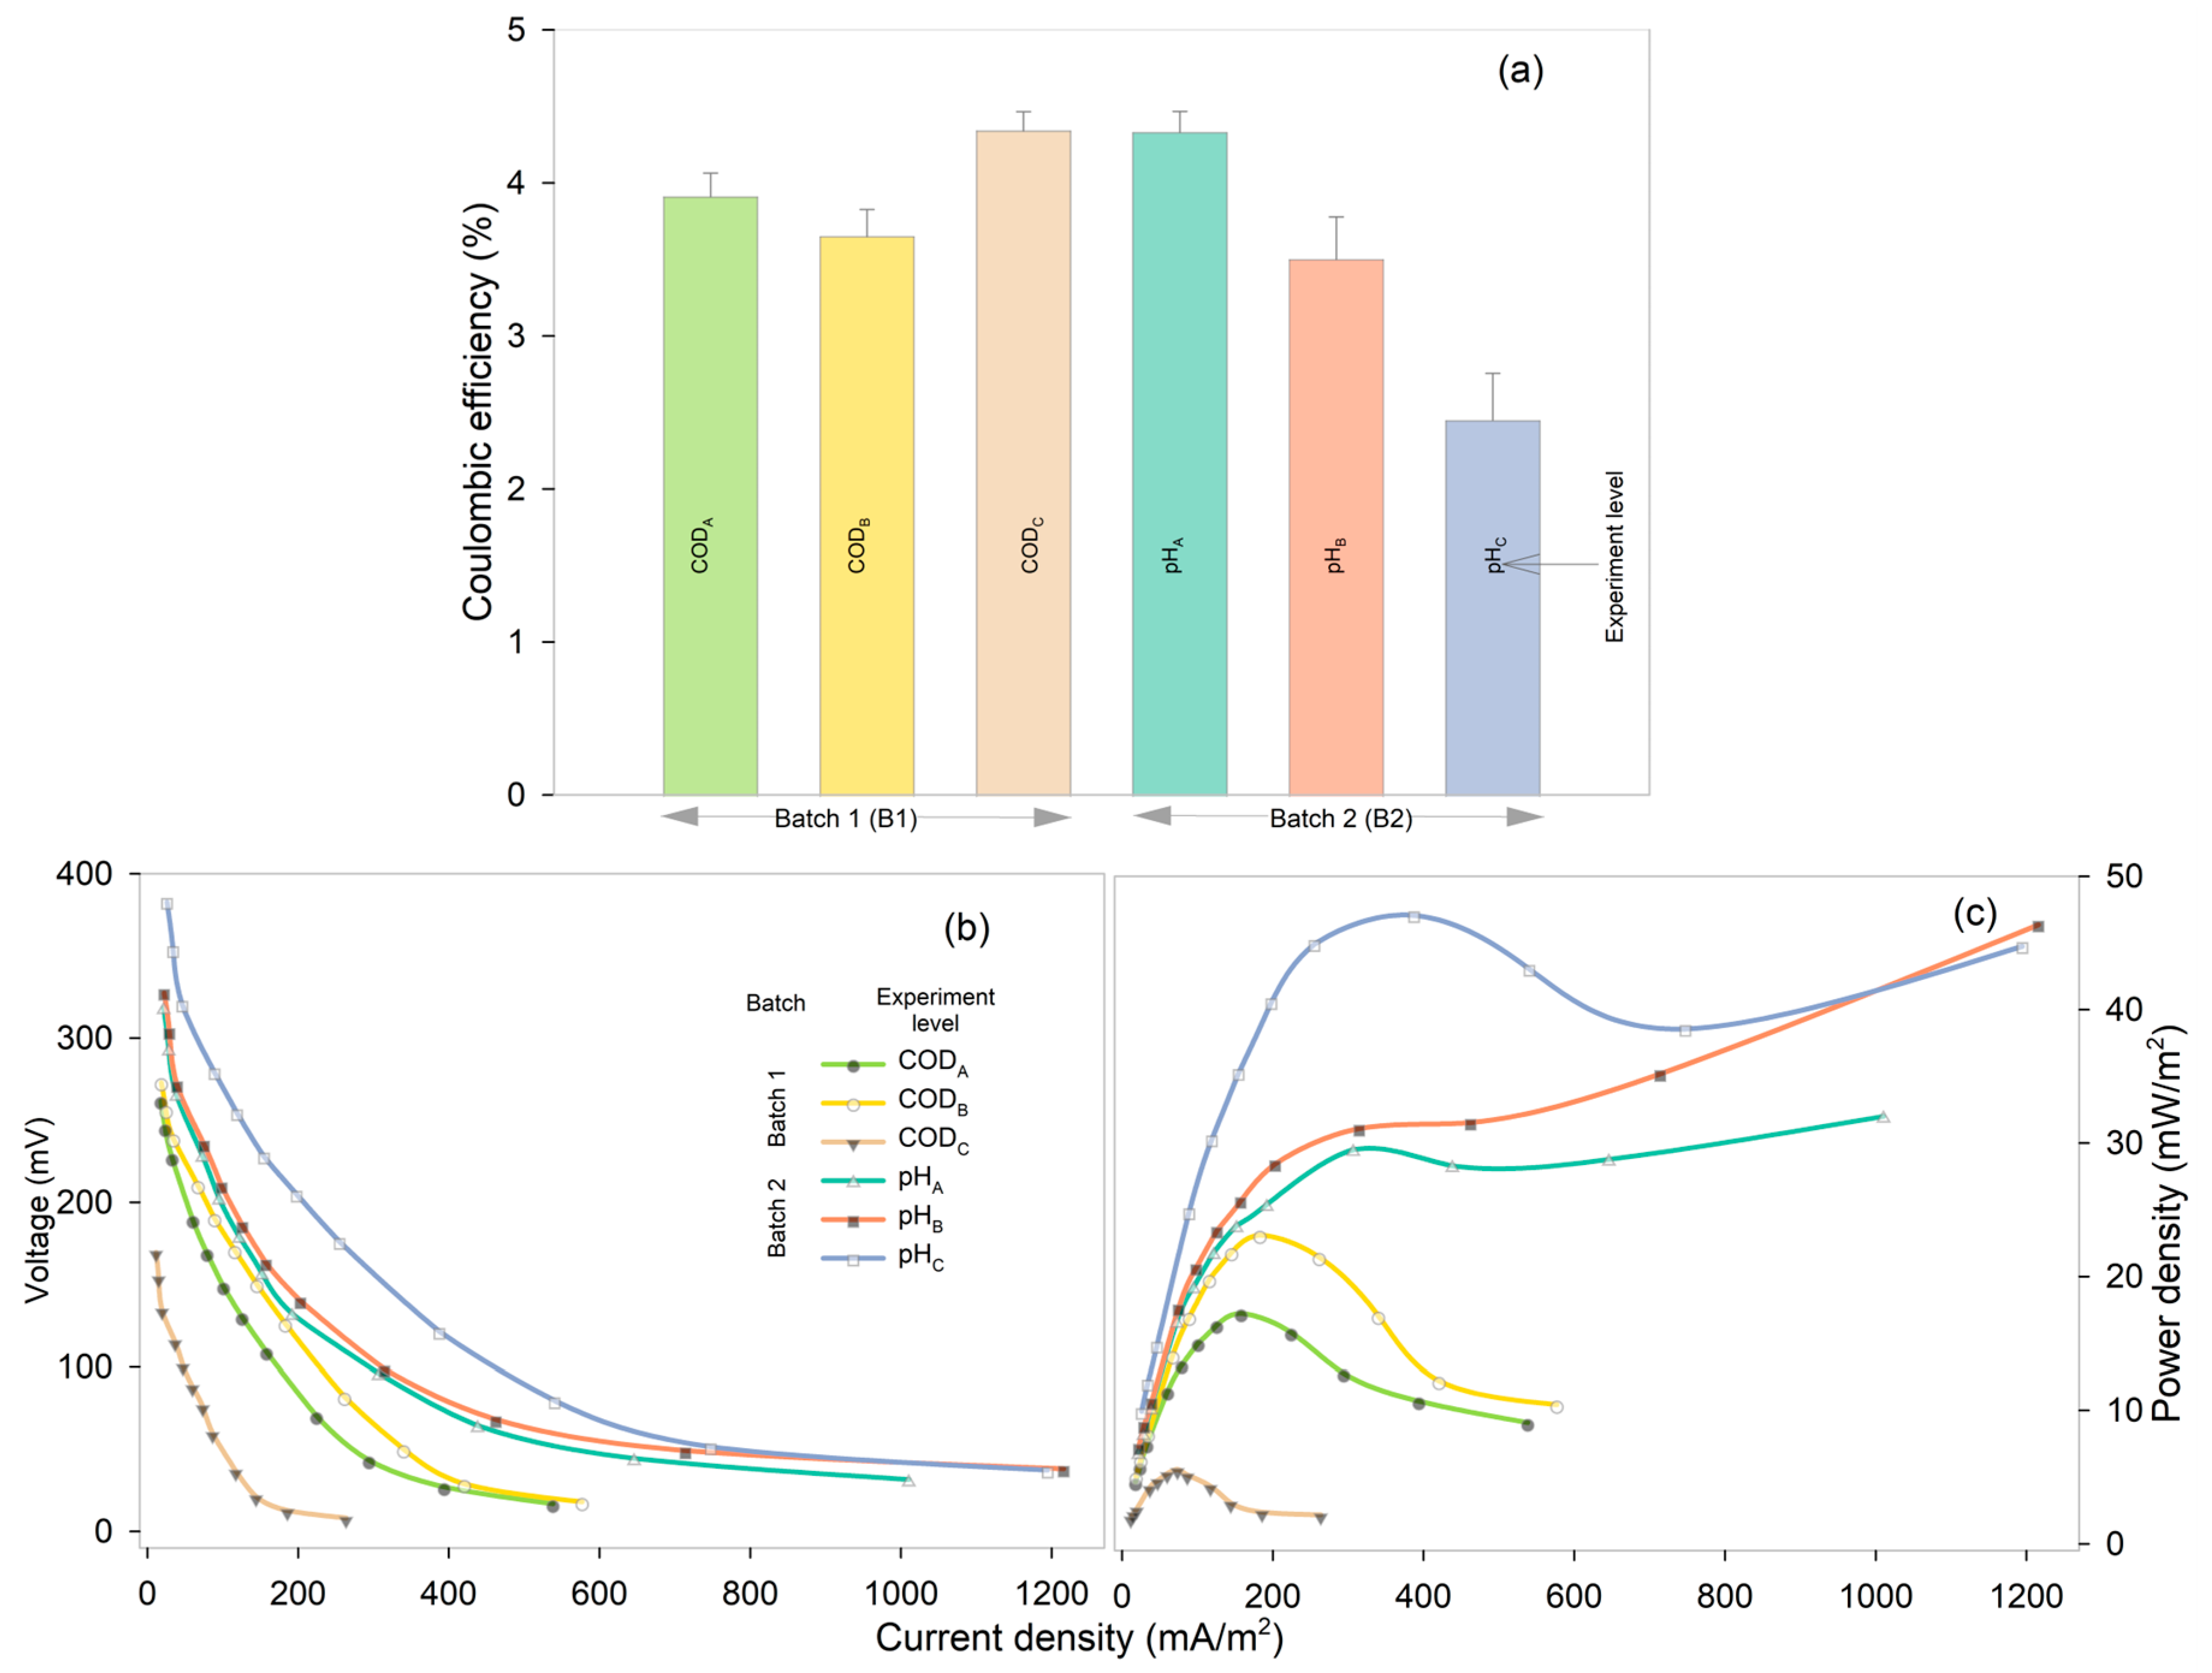
Experiments were conducted over 31 days for both batches (B1 and B2) and all six experiment levels (CODA, CODB, CODC, pHA, pHB, pHC). The highest observed voltage in B1 was 781.6 ± 9.9 mV on day 15, while in B2 it was 807.6 ± 6.8 mV on day 13. Figure 4 shows the coulombic efficiency (CE), power curves, and polarization curves derived from all nine reactors for B1 and B2. The maximum CE was 4.3% for both batches, obtained in B1 on day 15 and in B2 on day 14 (Figure 4a).
Both the polarization and power curve indicated that B2 performed better than B1. The power curve shows the relationship between power density and current density across external resistors. Figure 4b indicated that in B1, power density increased with current density up to a certain extent, after which it began to decrease gradually. The highest power density observed was 23.8 ± 4.7 mW/m2 at 110 Ω external resistance for B1, and 44.7 ± 4.7 mW/m2 at 10 Ω for B2. As shown in Figure 4c, current density decreased with increasing voltage, which aligns with Ohm’s law that voltage = current × resistance. When external resistance increases, the reactor generates less current density, as current is inversely proportional to resistance. The highest current density was 590 ± 75.8 mA/m2 at 10 Ω for B1 and 1215.9 ± 71.8 mA/m2 at 10 Ω for B2 (Figure 4c).

3.2. Insights from Principal Component Analysis (PCA)

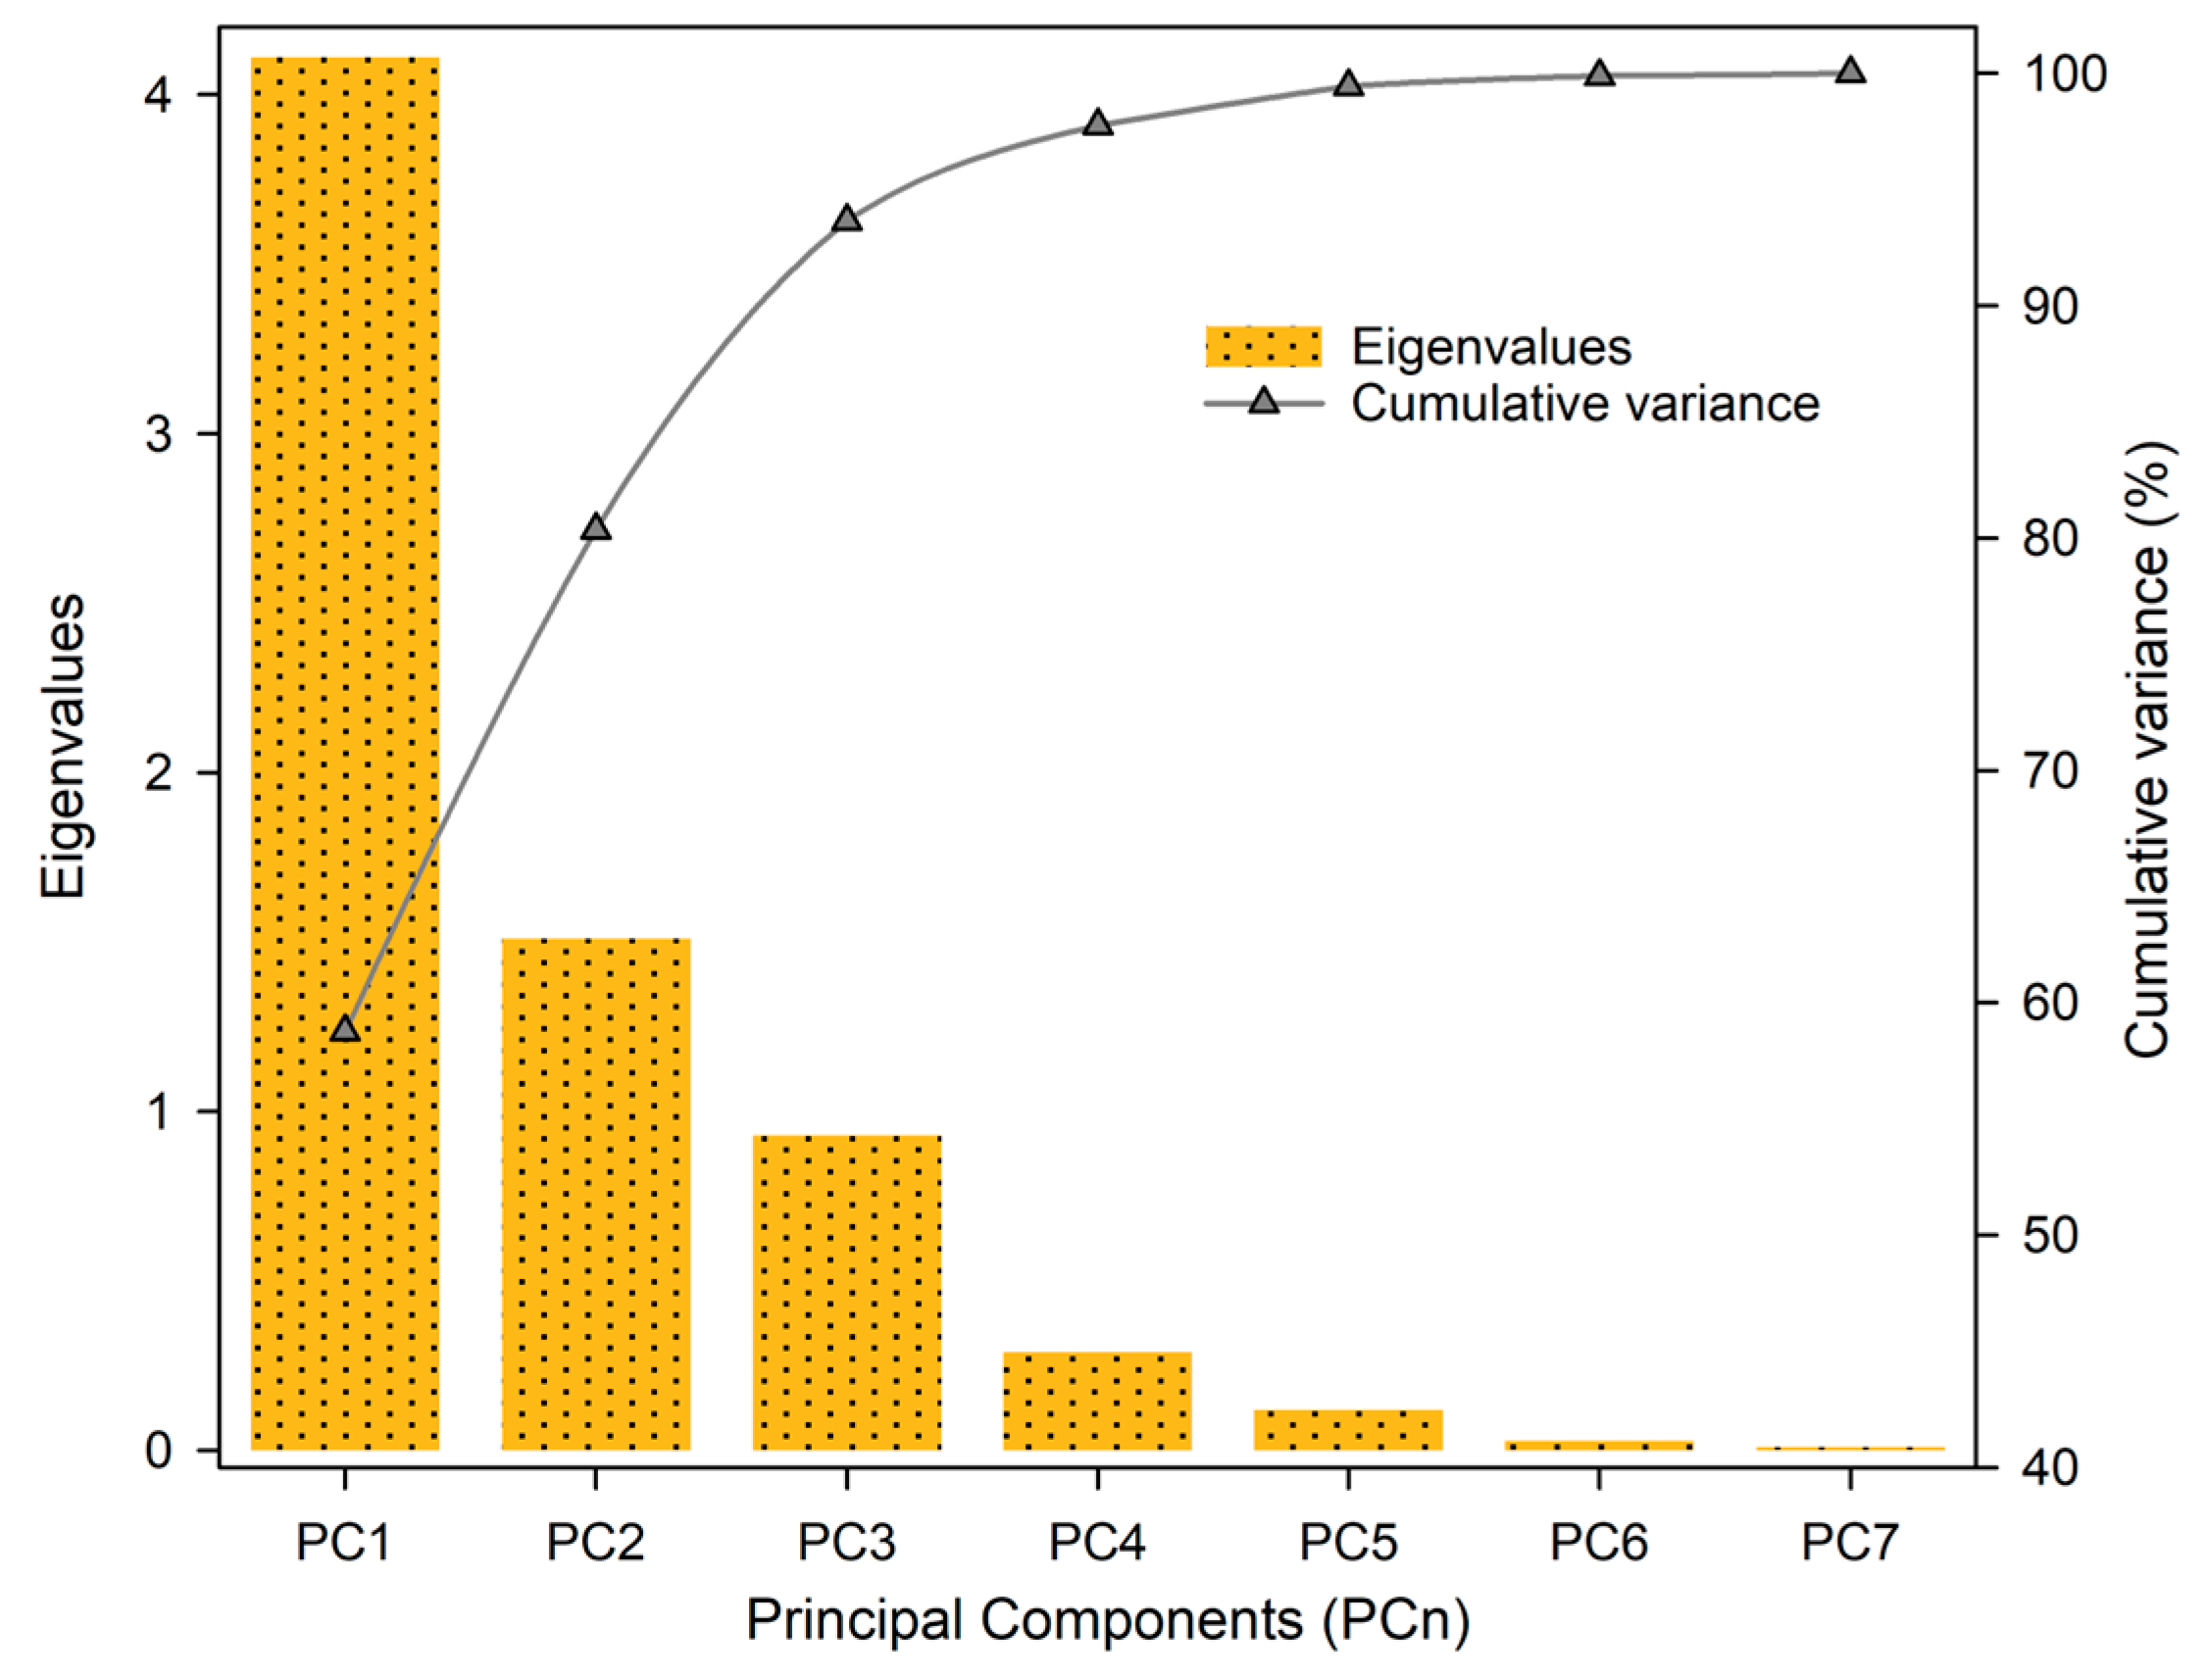
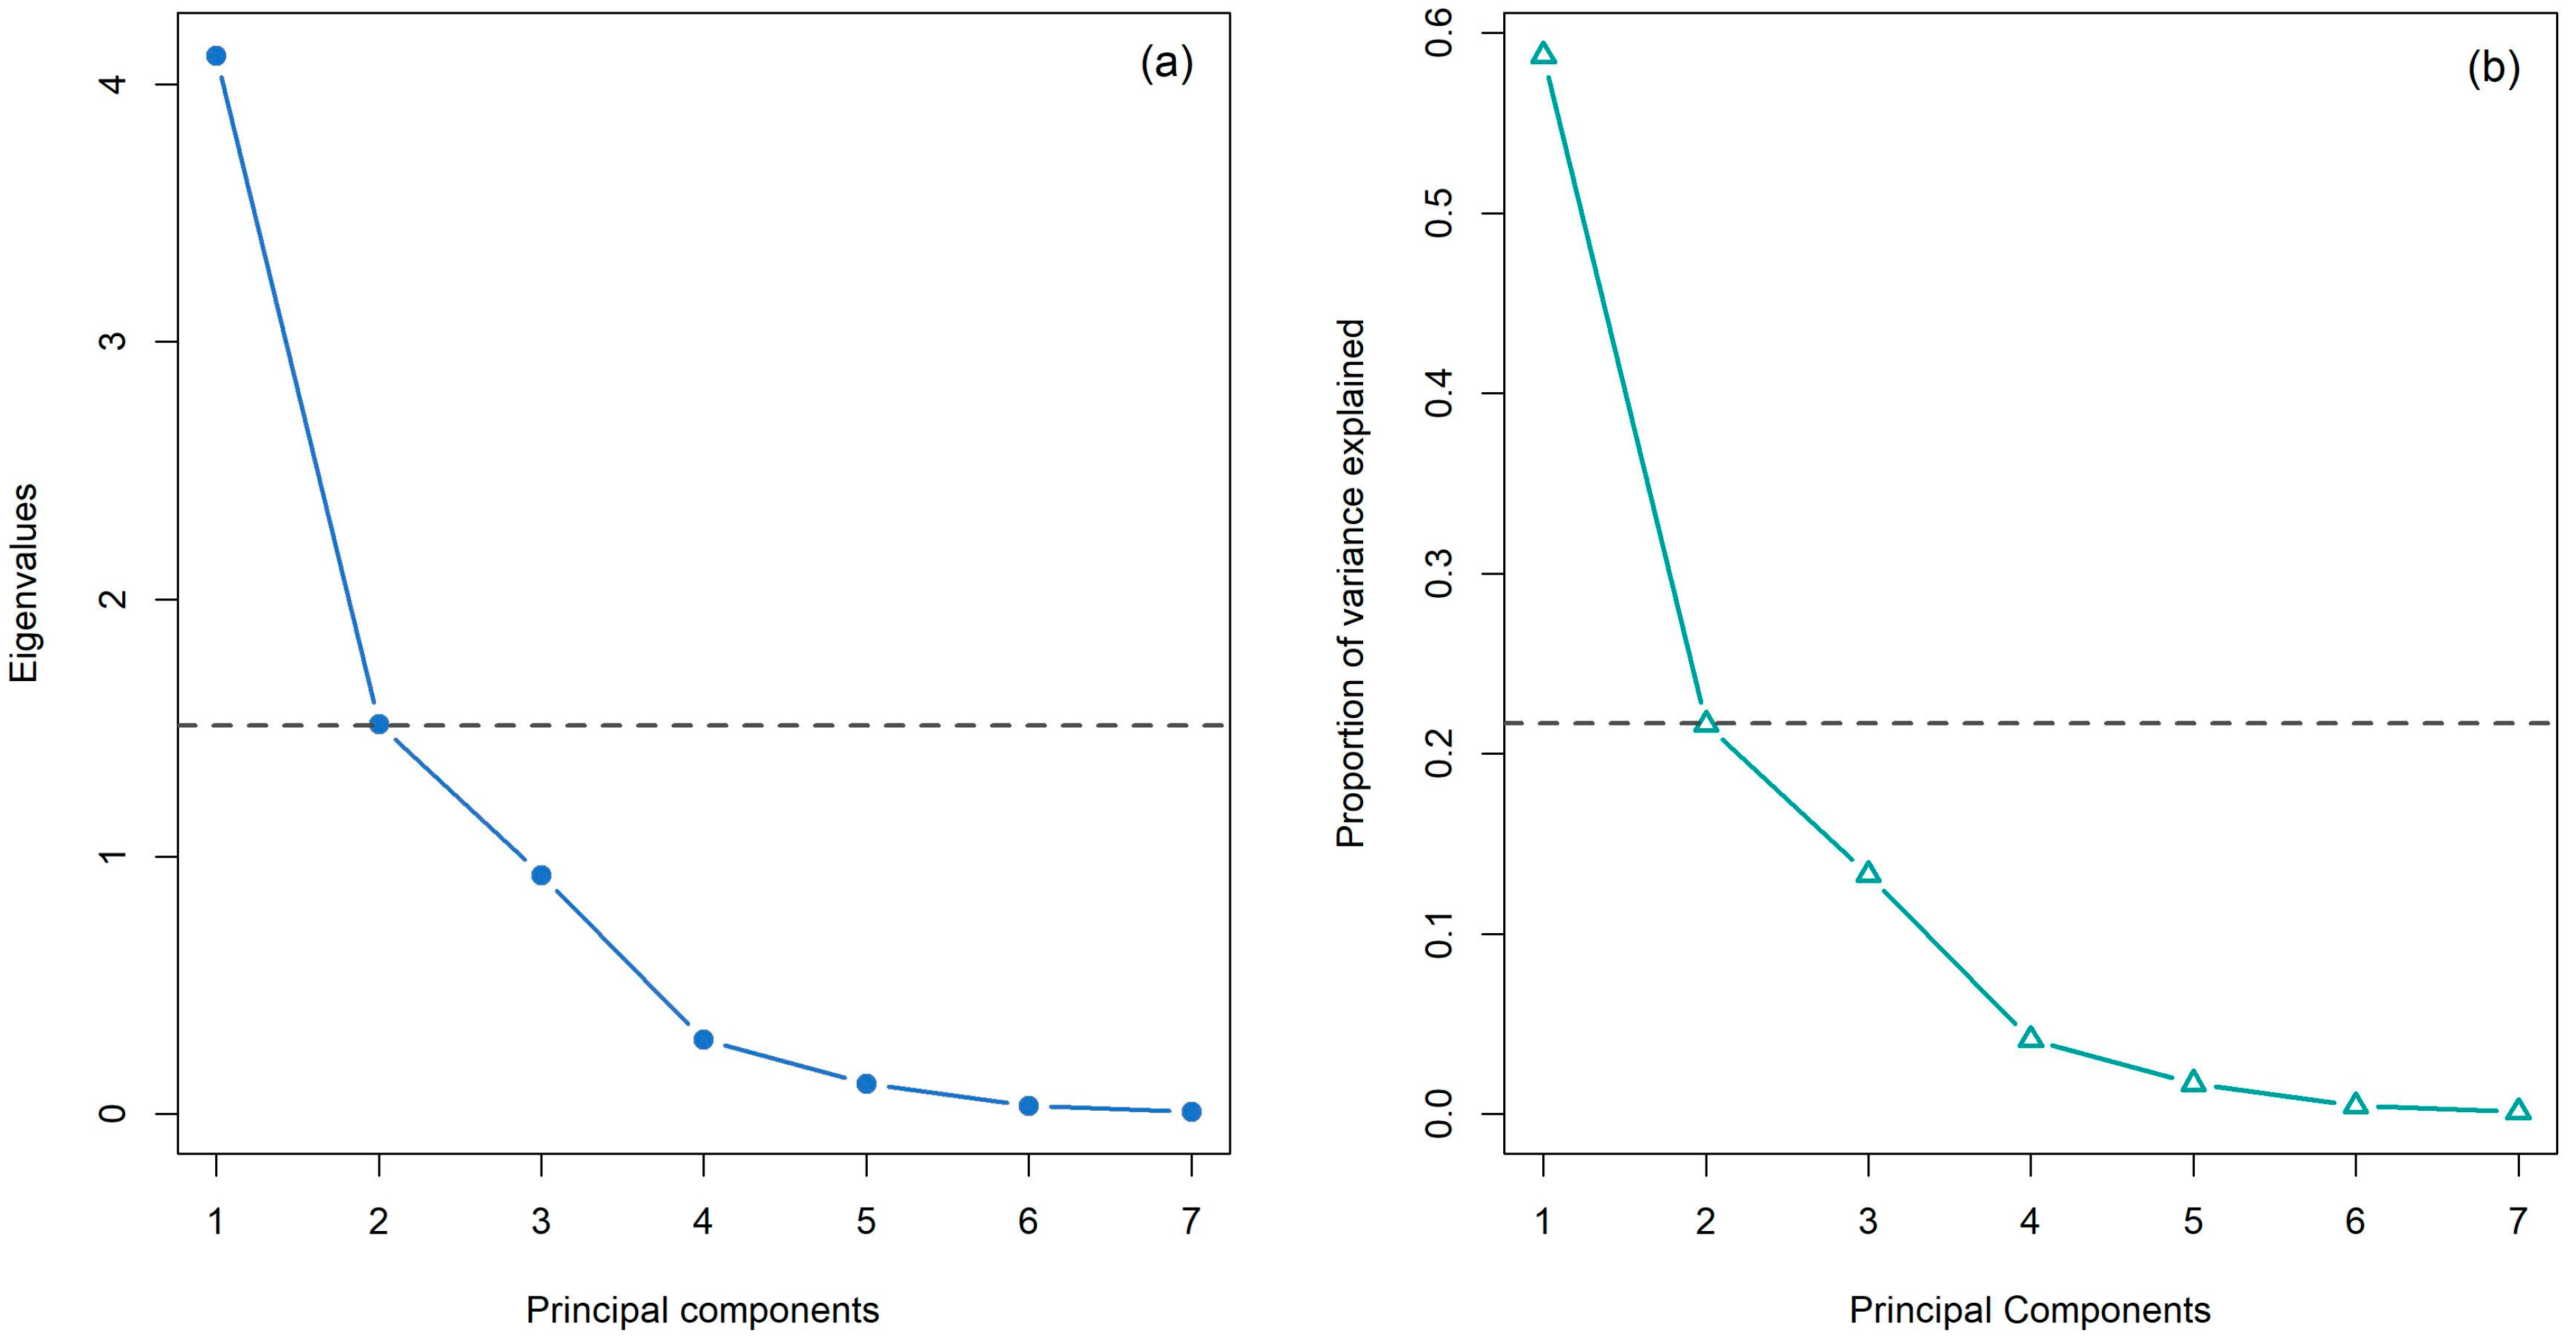
The scree plot provided a valuable method for identifying the number of significant factors in principal component analysis. It illustrates the eigenvalues and the percentage of variance associated with each principal component by plotting eigenvalues against principal component numbers (Figure 5a) and the proportion of variance explained against principal component (PC) numbers (Figure 5b). Eigenvalue was plotted as a function of PC in the scree plot, as shown in Figure 5a,b. The grey dashed line represents Kaiser’s criterion, implying that only PCs with eigenvalues above this line were selected. Based on Figure 5a, the first two PCs were selected, as their eigenvalue were above 1. Other PCs were neglected because their eigenvalues were below 1, implying redundancy with less important factors [38].
The eigenvalue, cumulative variance, and PCs for bioelectricity generation are represented in Figure 6. The eigenvalue (Table 2) for the first two PCs lies between 4.11 and 1.51, whereas the remaining PCs have eigenvalues in the range of 0–0.93 (Figure 6). In this study, the first principal component (PC1) accounted for 58.75% of the total variation, with an eigenvalue of 4.11, while the second principal component (PC2) explained 21.62% of the total variation > 70%, with an eigenvalue of 1.51. A sharp decline in eigenvalues was observed after PC1, indicating its dominant contribution. Similarly, Gour et al. [39] reported the highest variability in PC1 associated with a high eigenvalue. However, the 70% rule of thumb based on eigenvalues was not met with PC1 alone (Figure 6). Table 2 reveals that the combination of PC1 and PC2 explains 80.37% of the cumulative variance, making this pair of components suitable for further analysis. The elbow-shaped curvature observed in the scree plot (Figure 5a,b), where the eigenvalues shifted from high to low, served as another important criterion for selecting the PCs.
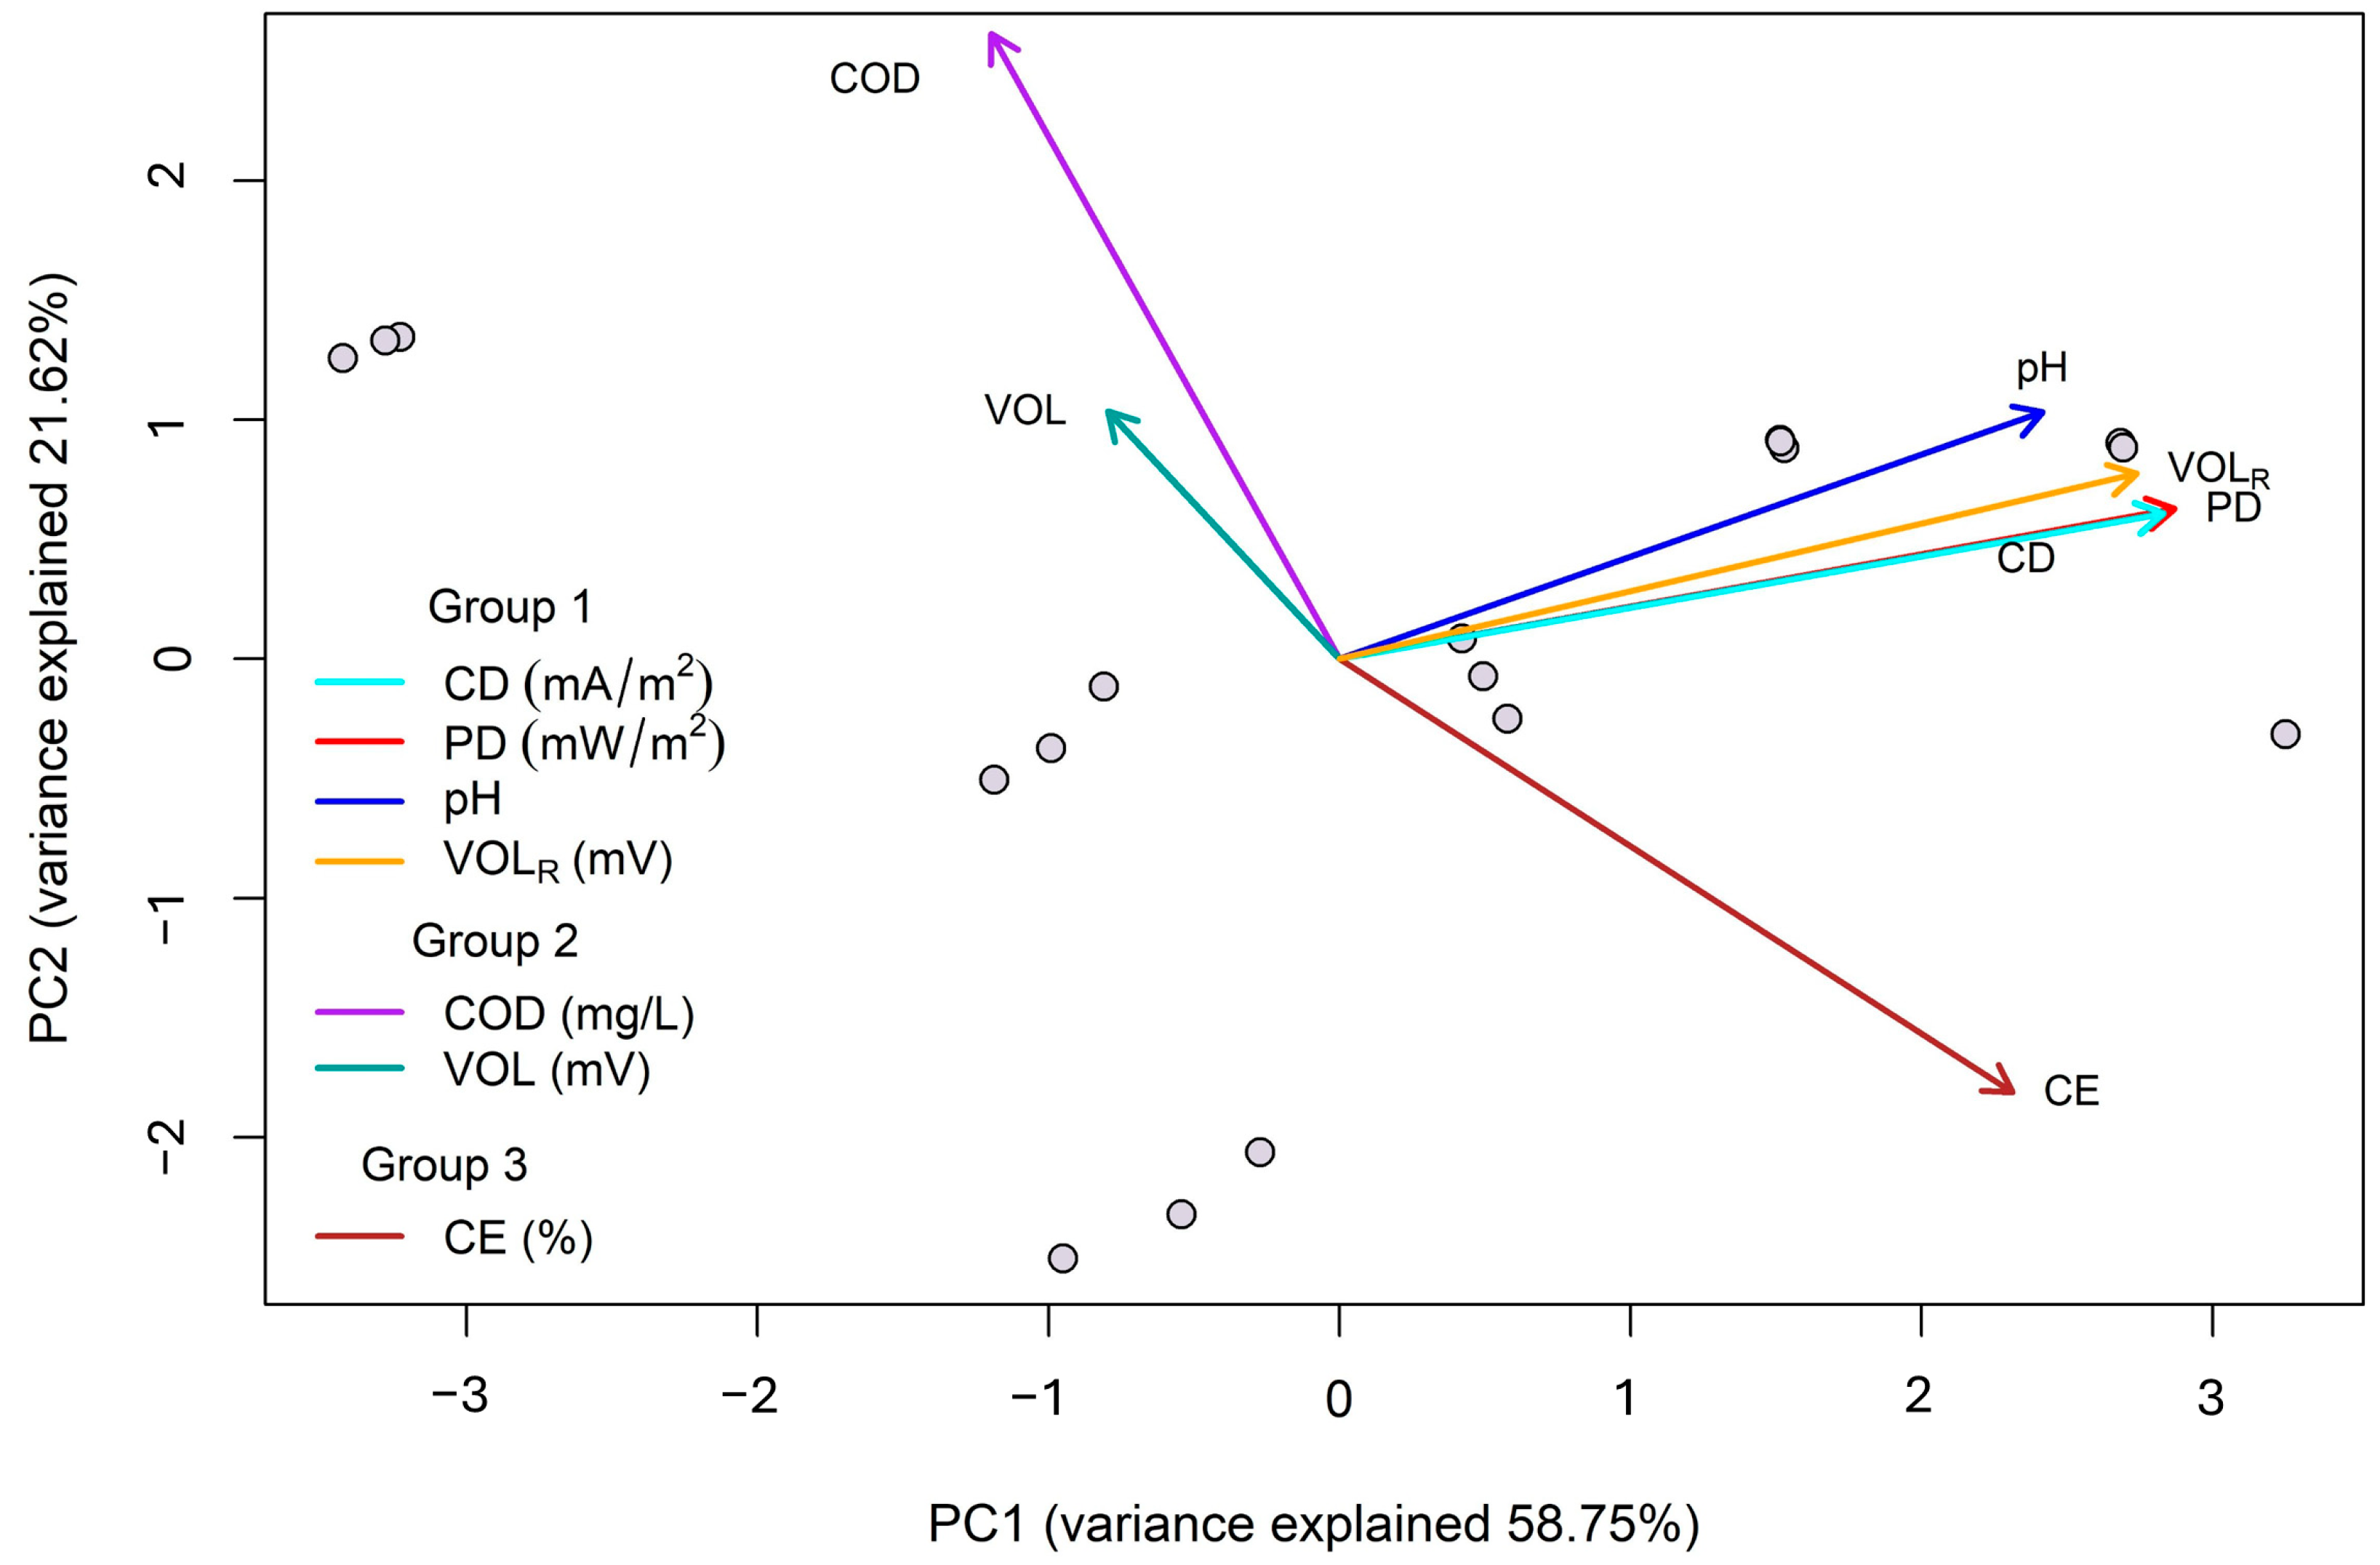
Interpretation of the PCA results was based solely on the independent and dependent variables included in the analysis, while other mechanical or electrochemical factors that may influence MFC performance were not accounted for in the interpretation. The relationships between the first two PCs, which contributed the most to the overall variance, are illustrated in Figure 7. In the ordination plot (Figure 7), all variables are represented by vectors. The direction and length of each vector indicate the magnitude and nature of the contribution of the respective variable to the two PCs. For instance, PC1, represented on the horizontal axis, has positive coefficients for pH, PD, CD, and VOLR, and negative coefficients for COD, CE, and VOL. Consequently, the vectors for pH, PD, CD, CE, and VOLR point to the right half of the plot, while those for COD and VOL were directed to the left half. The PC2, represented on the vertical axis, has negative coefficients only for CE and positive coefficients for all remaining variables. Figure 7 shows that samples distributed in the upper quadrants are enriched with COD, VOL, pH, CD, PD, and VOLR, while those in the lower quadrants are dominated by CE.
Each directional line joining a variable and passing through the origin in the plot of the factor loadings is indicative of the contribution of the variable to the samples. The proximity of vectors for two variables reflects the strength of their mutual association [40,41]. For example, PCA aligns with laboratory observations, showing that higher CD, PD, and VOLR were associated with higher anolyte pH. The grouping of parameters such as pH, CD, PD, and VOLR in the loadings plot suggested their significant mutual positive correlation.
The PCA plots provide insights into the characteristics of the samples and their spatial distribution. For instance, the reciprocal relationship between VOL and CE observed in the PCA was consistent with laboratory findings. Similarly, the positive association between COD and VOL corroborated the laboratory analysis. PCA identified the two most influential principal components, PC1 and PC2, accounting for 58.75% and 21.62% of the total variance, respectively, which are mainly responsible for controlling bioelectricity generation from wastewater. It was observed that the first two components together explained 80.37% of the cumulative variance. These components are primarily responsible for controlling bioelectricity generation from wastewater, highlighting the significance of the observed relationships among the parameters.
From the ordination plot (Figure 7), three main groups can be recognized: group 1, consisting of pH, CD, VOLR, and PD (quadrant I); group 2, consisting of COD and VOL (quadrant II); and group 3, consisting of CE alone (quadrant IV). In summary, the PCA results strongly suggested that the original variables could be reduced to two explanatory variables, i.e., two PCs, further simplifying the experimental results. Three different groups of characteristic variables suggest three different relationships among them, which would be helpful for the better performance of the MFC experiment. Moreover, the PCA helped to reinforce the conclusion of both positive–negative effects of the variables of MFC and their relationship.

3.3. Optimization Results

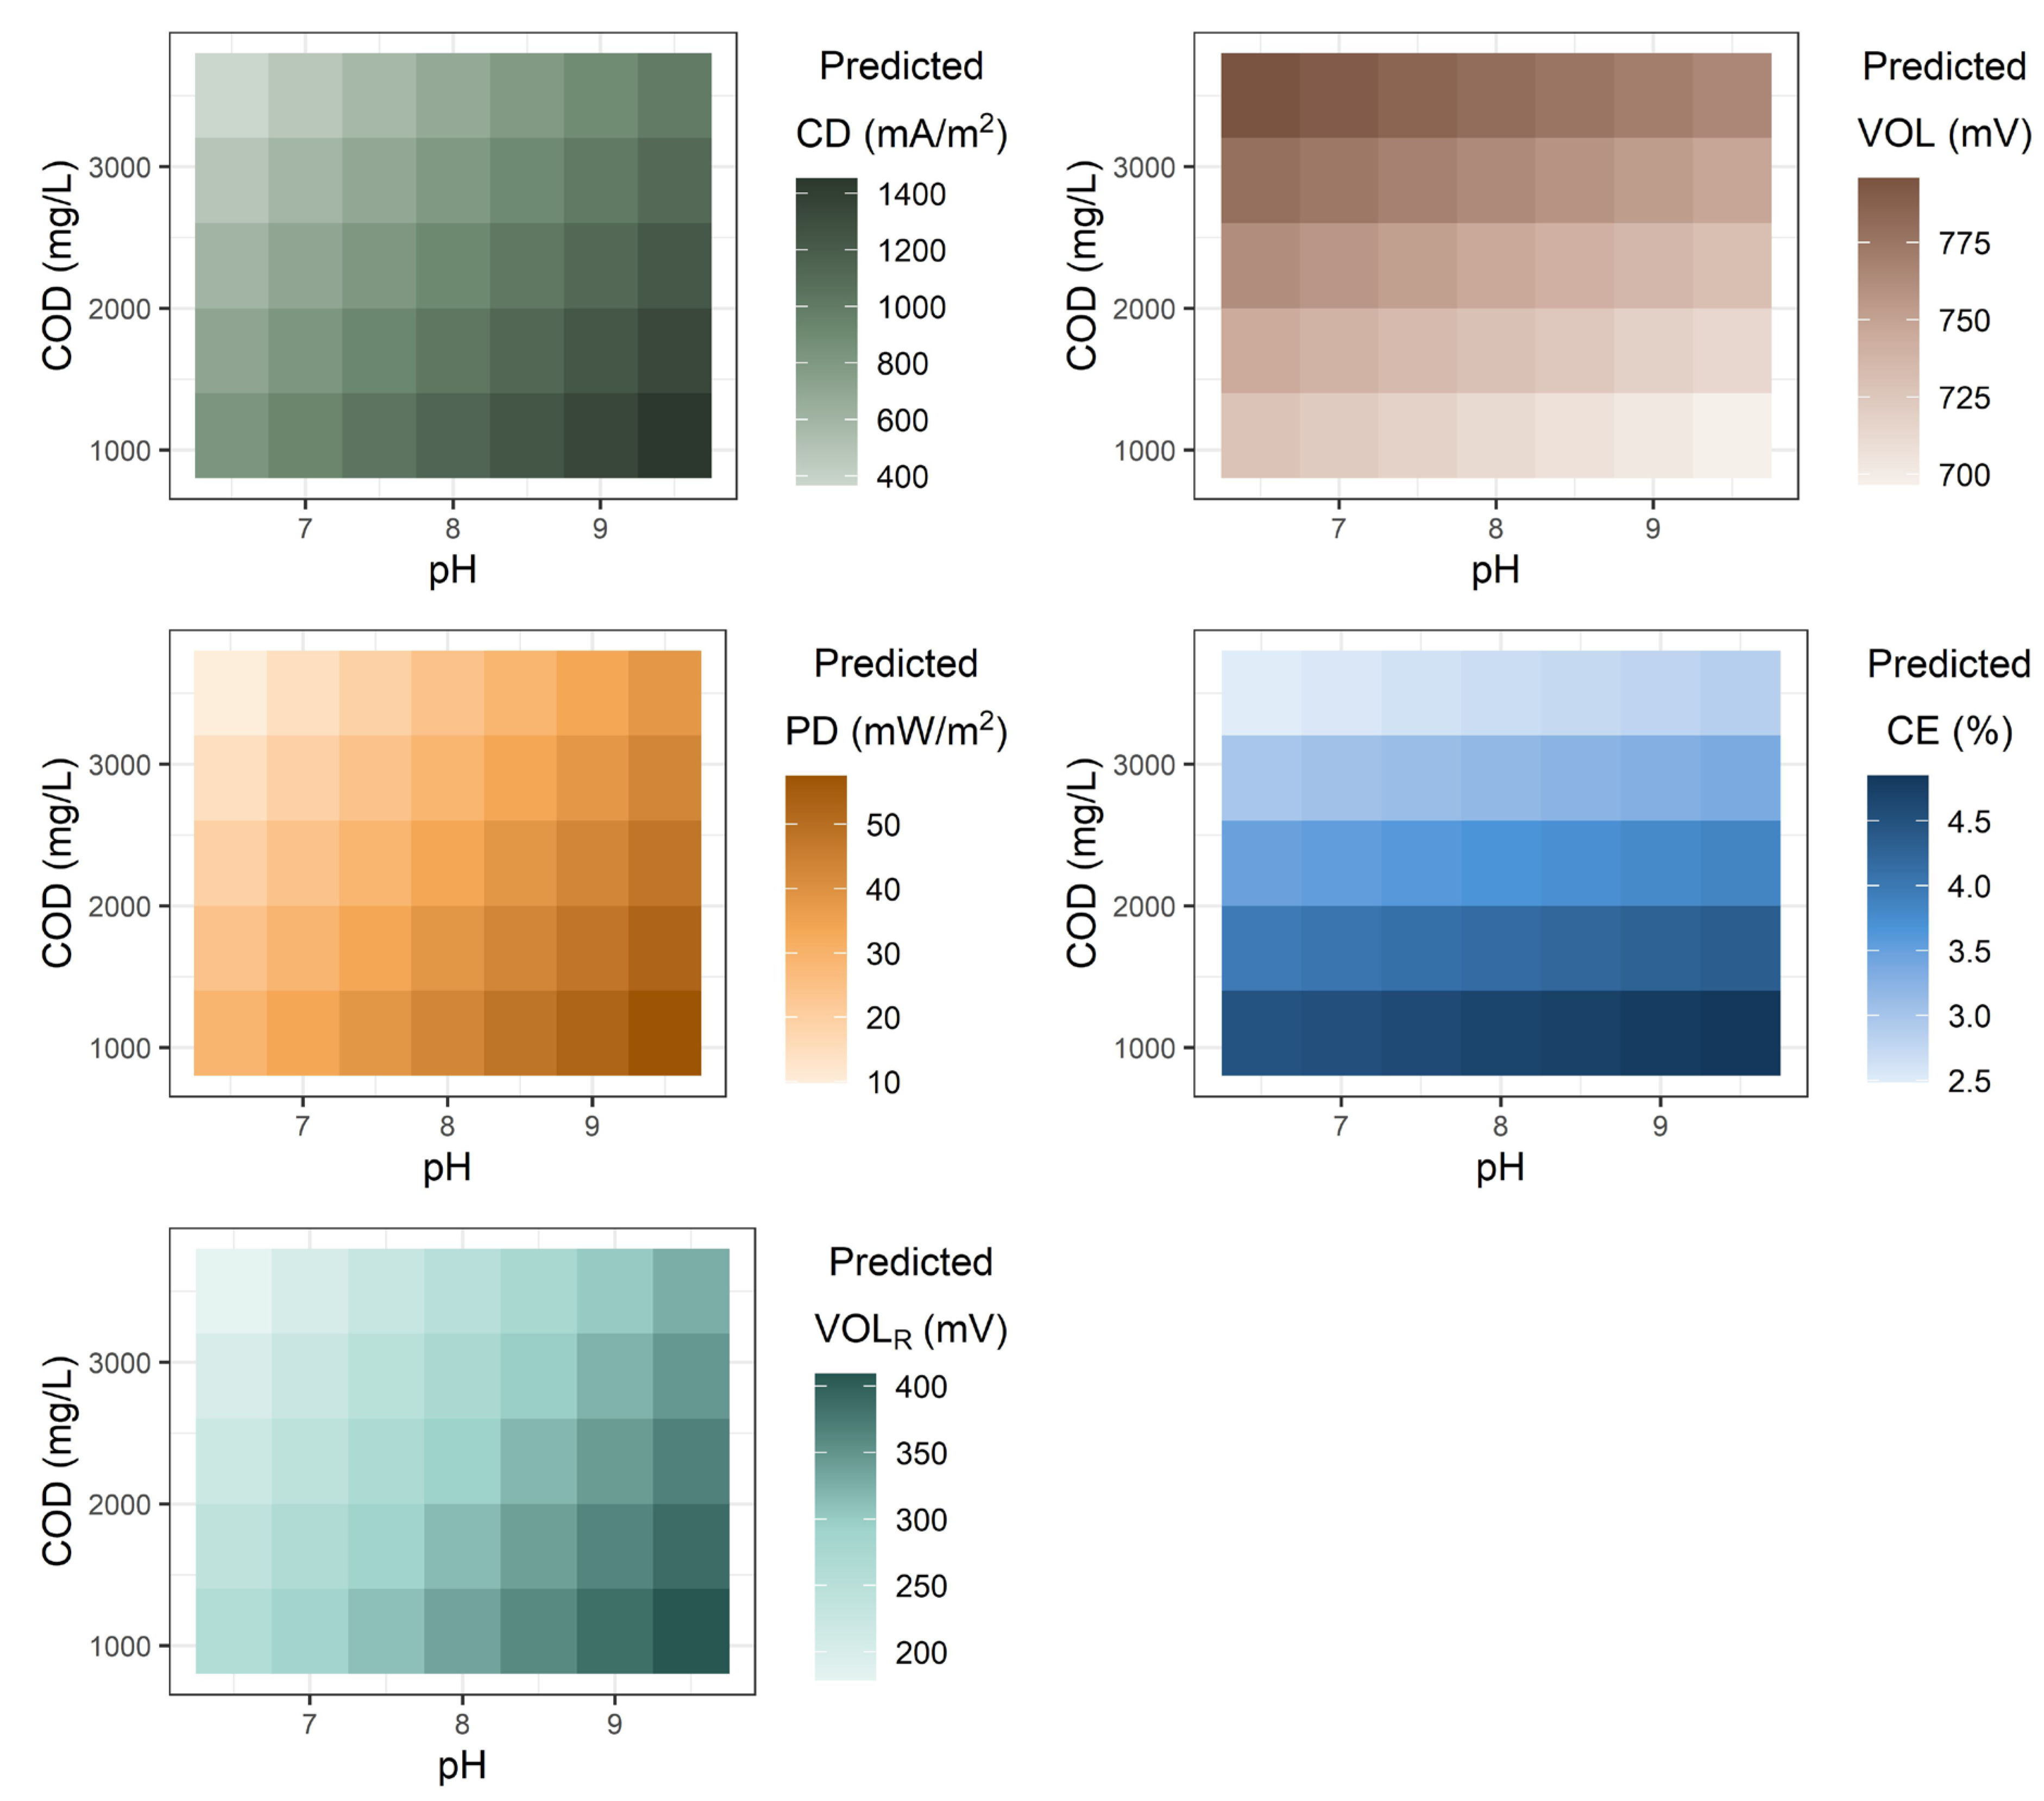
The study evaluated the optimal anolyte COD and pH combinations to achieve the highest predicted values of current density (CD), coulombic efficiency (CE), power density (PD), generated voltage (VOL), and voltage under resistance (VOLR). Figure 8 presents heatmaps depicting the optimal combinations of anolyte COD and pH for generating the highest predicted CD, CE, PD, VOL, and VOLR. The figure illustrates how these variables are predicted as a function of the anolyte COD and pH. Predicted voltage was calculated by determining the ratio of COD pixels to pH pixels within each bin of the heatmap. The highest predicted CD was observed in the bin with COD values ranging from 1100 to 1700 mg/L and pH values between 9.25 and 9.75 (Figure 8). Similar trends were observed for the CE, PD, and VOLR, where their maximum values were found in bins corresponding to lower COD and higher pH values. In contrast, the highest predicted VOL occurred in the bin with COD values ranging from 2900 to 3500 mg/L and pH values between 6.25 and 6.75 (Figure 8).
The optimal combination of pH and COD for maximizing bioelectricity generation in terms of VOL, VOLR, PD, CD, and CE from the MFC is shown in Table 3. The results revealed a couple of significant findings regarding the relationship between pH, COD, and the performance indicators. Two different pH and COD combinations were observed to yield the optimum results for VOL, VOLR, PD, CD, and CE: one at a pH of 9.5 with a COD of 1100 mg/L, and another at a pH of 6.5 with a COD of 3500. The first combination, with a pH of 9.5 and COD of 1100 mg/L, yields the highest predicted PD, CD, and CE, with a predicted VOLR of 409.20 mV, PD of 57.46 mW/m2, a CD of 1451.80 mA/m2, and a CE of 4.85%. This indicated that the combination was effective in generating electricity in the MFC. The second combination, with a pH of 6.5 and COD of 3500 mg/L, showed a significantly higher predicted VOL of 795.77 mV, suggesting strong performance in terms of voltage generation under these conditions.

4. Discussion

The study addressed the research gap by applying ML to explore the relationships between multiple key MFC variables and bioelectricity generation indicators (voltage, PD, CD, and CE), thereby identifying the optimal combinations of variables for achieving the highest performance. Recent peer-reviewed MFC studies have been largely univariate or bivariate in nature and have used ML primarily as a predictive tool, training datasets to estimate electricity generation [18,20,21]. Very few studies have used multivariate analysis to identify different patterns, relationships, and interplays among variables [29,30], and these did not provide optimal combinations of MFC variables. Our study bridges this gap by proposing a method to identify the optimal combinations of multiple key MFC variables for achieving the highest performance. Like other studies, this work has limitations, specifically the comparatively lower CE and PD observed; however, these limitations are related to the MFC design (substrate characteristics, reactor volume, electrode material, size, spacing, etc.) and not related to the proposed ML-based method. Although the dataset used for the PCA was relatively small, the study focused on an interdependence multivariate approach rather than dependence methods such as regression or discriminant analysis. Following [42,43], we verified that the dataset was suitable for multivariate PCA because the variables were random, interrelated, and could not be meaningfully interpreted in isolation.
Coulombic efficiency (CE) reflects the proportion of electrons recovered as electricity from the substrate relative to the theoretical maximum [44]. Low CE in this study suggests that a significant portion of the substrate was utilized by non-electrogenic microbes, such as methanogens, rather than by electroactive bacteria [45,46]. Our previous publication from the same research demonstrated that the substrate used in this study was rich in both nitrogen and sulfate-sulfur, and was substantially reduced after the experiment [16]. This suggested that heterotrophic denitrifier bacteria and sulfate-reducing bacteria, Desulfovibrio, have outcompeted electrogens for the same electron donors, diverting electrons into nitrogen and sulfur reduction pathways and thereby lowering CE [47].
In this study, microbial niche growth likely promoted methanogens, leading to higher COD removal but comparatively lower electricity generation. Similar low CE values (ranging from 0.7 to 8.31%) have been reported in other studies using high-COD substrates, such as sucrose solution of starch processing wastewater [45,46,48,49]. This explained that the lower CE might be due to diffusion of oxygen from the cathode into the anode chamber through CEM; as a result, methanogenesis and fermentation processes occurred in the anode chamber. This study demonstrated that higher CE was achieved due to more electrons were generated during COD degradation, and that the enhanced substrate COD removal was due to the electro-Fenton reaction, which released additional organic matter [50]. These findings highlight the need for strategies to suppress methanogenesis and improve electron recovery. Although high CE and power density are often desirable, low CE and power density in MFCs can be advantageous in wastewater treatment contexts. Low CE and power density typically reflect slower, more stable bio-electrochemical activity, which supports long-term system durability and reduces electrode degradation. It also indicates that the system is operating under less intensive electrical demand, allowing the microbial community to prioritize wastewater treatment efficiency rather than rapid electron transfer.
Power and current densities showed a typical trend, increasing up to a certain point before declining (Figure 4c). A secondary rise in current density was observed in B2, likely due to enhanced substrate degradation under low voltage. High current density leaves considerable requirements on the oxygen transportation mechanism, as partial air starvation can lead to poor cell performance and accelerated end-of-life due to insufficient power production [51]. The maximum current density (1215.9 ± 71.8 mA/m2) observed in this study is comparable to previous literature using synthetic or domestic wastewater [52,53,54,55], such as 641.6 ± 50.6 mA/m2 [39], 130 ± 18.2 mA/ m2 [56], 430 mA/ m2 [29], and 148 ± 8 mA/ m2 [31].
In contrast, the power density achieved in this study (44.7 ± 4.7 mW/m2) was lower, possibly due to the cathode’s lower ohmic resistance resulting from the conductivity of the carbon cloth used in this research [57]. The presence of sulfate-reducing bacteria such as Geobacter sulfurreducens may also have contributed to the reduced power output [58]. Power density in MFC systems is influenced by multiple factors, including substrate type, MFC configuration, cathode material, reactor volume, applied voltage, electrode type, electrode spacing, pH, microbial community, and temperature [59,60,61,62]. Several studies have also reported low PD values, such as 10.0 mW/m2 [63], 9.05 mW/m2 [64], and 5.65 mW/m2 [59]. Low power density is expected when electrode materials have low conductivity or when the pore size of carbon-based electrodes does not match the size of electrolyte ions, as this mismatch limits ion transport [65]. Therefore, selecting rapidly degradable substrates, highly conductive electrode materials, and, importantly, increasing the abundance of exoelectrogens could be effective strategies to suppress methanogenesis and improve electron recovery, thereby achieving higher CE and power density.
Introducing PCA to the MFC study, we intended to combine two independent variables and five dependent variables to account for the multivariate relationships that exist between those variables and the bioelectricity generation process. By incorporating the dimensionality reduction method through machine learning, we have identified and isolated the most influential variables affecting MFC output, reducing data complexity and improving model interpretability [66]. PCA results indicated that pH positively impacted current density, power density, and voltage under resistors, while COD positively impacted voltage generated from the fuel cell. Therefore, research aiming at bioelectricity generation via MFC should focus on higher COD.
The varying performance indicators between pH and COD combinations highlight the intricate role of both parameters in optimizing the MFC performance. The higher COD value of 3200 mg/L at pH 6.5 may indicate a more considerable available substrate in favor of microbial activity, potentially leading to higher voltage production. The relatively lower pH of 6.5 is likely more favorable for the microbial electrochemical activity in this instance, as certain microbial species may thrive better in slightly acidic environments, thus improving the overall power output. Results indicated that the ideal performance would likely involve optimizing variables (in this case, pH and COD) simultaneously, balancing their effects on voltage, power density, current density, and coulombic efficiency.
The methodology proposed in the study offers strong scalability, making it suitable for both laboratory-scale and industrial MFC systems. Since ML can efficiently handle datasets ranging from very small to extremely large, the coding effort is essentially one-time; once developed, the model can perform the analysis in under half a minute. Even though this study used only two independent variables, industrial applications may involve dozens; however, handling more variables does not reduce the efficiency or performance of the proposed approach. Including additional mechanical or electrochemical factors would further improve the interpretation of MFC performance and should be considered in future studies. Overall, the proposed methodology provides a promising and flexible tool for optimizing bioelectricity generation by enabling researchers to visualize complex multi-variable interactions and identify optimal operating conditions.

5. Conclusions

Univariate natured MFC studies may lead to an inability to account for the multidimensional relationships that exist between multiple variables and the bioelectricity generation process. Understanding the complex interactions between different factors, such as COD and pH, and their combined effect on bioelectricity generation using MFCs, is significantly important. By incorporating the dimensionality reduction method through multivariate data analysis, this study identified and isolated the most influential variables affecting MFC output, reducing data complexity and improving model interpretability.
Machine learning-induced principal component analysis (PCA) and heatmap analysis have provided new insights into the optimization of bioelectricity generation via MFC in wastewater treatment. By reducing the complexity of the data and focusing on the most important components, ML effortlessly detected important independent variables for bioelectricity generation. Results showed that PC1 (pH) played a significant role in CD, PD, and VOLR, while PC2 (COD) suggested that it played a significant role in VOL than in pH. Results also suggested higher COD with low pH, potentially leading to higher voltage production, likely due to more favorable microbial electrochemical activity in this instance, as certain microbial species may thrive better in slightly acidic environments, thus improving the overall power output.
The methodology presented in this study would be a promising approach for optimizing chemical removal processes in various industrial and environmental applications; this study highlights the importance of combining multiple factors/variables to achieve the desired chemical concentrations. This study is also relevant for research related to bioelectricity generation using MFCs with more different independent variables (e.g., COD, pH, electrode spacing, different substrates, temperature, etc.), in which the true hypothesis may change the optimal combinations of independent variables. Using a 3D heatmap with a similar hypothesis, researchers can obtain the optimal combination of electrode spacing, COD, and temperature (or other independent variable) to achieve the best results. This approach allows researchers to visualize complex interactions between multiple variables and determine the ideal conditions for enhancing bioelectricity generation.

Author Contributions

Conceptualization, methodology, setup experimental design, investigation, data analysis, visualization, writing—original draft, M.M.K.; setup experimental design, writing—review and editing, M.S.B.; writing—review and editing, supervision, funding acquisition, S.R. All authors have read and agreed to the published version of the manuscript.

Funding

This research was partially funded by the North Dakota Established Program to Stimulate Competitive Research (ND EPSCoR, Award number—FAR0031770).

Data Availability Statement

The datasets generated during and/or analyzed during the current study are available from the corresponding author upon reasonable request.

Acknowledgments

The authors acknowledge the financial support from The North Dakota Established Program to Stimulate Competitive Research (ND EPSCoR), the Environmental and Conservation Sciences program at North Dakota State University, and the National Agricultural Technology Program—Phase II Project (NATP-2), Bangladesh Agricultural Research Council (BARC), Dhaka, Bangladesh.

Conflicts of Interest

The authors declare that they have no known competing financial interest or personal relationships that could have appeared to influence the work reported in this paper.

Abbreviations

The following abbreviations are used in this manuscript:
MFCMicrobial Fuel Cells
CDCurrent Density
PDPower Density
CECoulombic Efficiency

References

  1. Ieropoulos, I.A.; You, J.; Gajda, I.; Greenman, J. A new method for modulation, control and power boosting in microbial fuel cells. Fuel Cells 2018, 18, 663–668. [Google Scholar] [CrossRef] [PubMed]
  2. Tsompanas, M.A.; You, J.; Wallis, L.; Greenman, J.; Ieropoulos, I. Artificial neural network simulating microbial fuel cells with different membrane materials and electrode configurations. J. Power Sources 2019, 436, 226832. [Google Scholar] [CrossRef]
  3. Sonawane, J.M.; Mahadevan, R.; Pandey, A.; Greener, J. Recent progress in microbial fuel cells using substrates from diverse sources. Heliyon 2022, 8, e12353. [Google Scholar] [CrossRef]
  4. Rahmani, A.R.; Navidjouy, N.; Rahimnejad, M.; Alizadeh, S.; Samarghandi, M.R.; Nematollahi, D. Effect of different concentrations of substrate in microbial fuel cells toward bioenergy recovery and simultaneous wastewater treatment. Environ. Technol. 2022, 43, 1–9. [Google Scholar] [CrossRef]
  5. Thakur, S.; Calay, R.K.; Mustafa, M.Y.; Eregno, F.E.; Patil, R.R. Importance of substrate type and its constituents on overall performance of microbial fuel cells. Curr. Res. Biotechnol. 2025, 9, 100272. [Google Scholar] [CrossRef]
  6. Ullah, Z.; Zeshan, S. Effect of substrate type and concentration on the performance of a double chamber microbial fuel cell. Water Sci. Technol. 2020, 81, 1336–1344. [Google Scholar] [CrossRef]
  7. Khanaum, M.M.; Borhan, M.S.; Rahman, S. Efficacy of Microbial Fuel Cell for bioelectricity generation and pollutant reduction at different CODs of sugar beet processing wastewater. In Proceedings of the 2021 ASABE Annual International Virtual Meeting; American Society of Agricultural and Biological Engineers: St. Joseph, MI, USA, 2021. [Google Scholar] [CrossRef]
  8. Simeon, M.I.; Freitag, R. Influence of electrode spacing and fed-batch operation on the maximum performance trend of a soil microbial fuel cell. Int. J. Hydrogen Energy 2022, 47, 12304–12316. [Google Scholar] [CrossRef]
  9. Simeon, I.M.; Weig, A.; Freitag, R. Optimization of soil microbial fuel cell for sustainable bio-electricity production: Combined effects of electrode material, electrode spacing, and substrate feeding frequency on power generation and microbial community diversity. Biotechnol. Biofuels Bioprod. 2022, 15, 124. [Google Scholar] [CrossRef]
  10. Du, J.; Wang, M.; Zhang, X.; Tao, T.; Gao, M.; Su, Y.; Zhang, Y.; Zhao, J.; Jin, B.; Cao, X.; et al. The synergistic effect of electrode spacing and aeration intensity on the performance of pyrite based constructed wetland-microbial fuel cells. Chem. Eng. J. 2025, 505, 159787. [Google Scholar] [CrossRef]
  11. Gao, S.C.; Jiang, H.C.; Zhang, Z.; Fan, X.X.; Gao, T.P.; Liu, Y. Electricity production performance and pH optimization of MFCs using enriched starch-degrading culture. iScience 2025, 28, 111869. [Google Scholar] [CrossRef]
  12. Rostami, K.; Ghasemi, M.; Sedighi, M.; Ismail, A.F.; Rezk, H.; Kuo, J.K. Benchmarking anion vs. cation exchange membranes in microbial fuel cells: A comparative study of PTFE and Nafion 117. Bioelectrochemistry 2025, 167, 109083. [Google Scholar] [CrossRef]
  13. Wang, H.; Song, X.; Zhang, H.; Tan, P.; Kong, F. Removal of hexavalent chromium in dual-chamber microbial fuel cells separated by different ion exchange membranes. J. Hazard. Mater. 2020, 384, 121459. [Google Scholar] [CrossRef]
  14. Li, X.; Lu, Y.; Luo, H.; Liu, G.; Torres, C.I.; Zhang, R. Effect of pH on bacterial distributions within cathodic biofilm of the microbial fuel cell with maltodextrin as the substrate. Chemosphere 2021, 265, 129088. [Google Scholar] [CrossRef]
  15. Halim, M.A.; Rahman, M.O.; Ibrahim, M.; Kundu, R.; Biswas, B.K. Effect of Anolyte pH on the Performance of a Dual-Chambered Microbial Fuel Cell Operated with Different Biomass Feed. J. Chem. 2021, 2021, 5465680. [Google Scholar] [CrossRef]
  16. Khanaum, M.M.; Rahman, S.; Borhan, M.S.; Bergholz, P. Balancing pH for enhanced bacterial community performance in microbial fuel cells: Implications for bio-electricity generation and pollutant reduction. Water SA 2024, 50, 282–292. [Google Scholar] [CrossRef]
  17. Tardast, A.; Rahimnejad, M.; Najafpour, G.; Ghoreyshi, A.; Premier, G.C.; Bakeri, G.; Oh, S.E. Use of artificial neural network for the prediction of bioelectricity production in a membrane less microbial fuel cell. Fuel 2014, 117, 697–703. [Google Scholar] [CrossRef]
  18. Qazani, M.R.C.; Ghasemi, M.; Asadi, H. Optimizing microbial fuel cells with multiple-objectives PSO and type-2 fuzzy neural networks. Fuel 2024, 372, 132090. [Google Scholar] [CrossRef]
  19. Hossain, S.Z.; Sultana, N.; Haji, S.; Mufeez, S.T.; Janahi, S.E.; Ahmed, N.A. Modeling of microbial fuel cell power generation using machine learning-based super learner algorithms. Fuel 2023, 349, 128646. [Google Scholar] [CrossRef]
  20. Ghasemi, M.; Rostami, K.; Farahani, H.; Sedighi, M. Integrating Functionalized Catalysts and Machine Learning to Optimize Microbial Fuel Cells for Clean Energy Applications. Sustain. Energy Fuels 2025, 9, 4320–4336. [Google Scholar] [CrossRef]
  21. Houmsi, M.R.; Ishaq, A.; Mohammad, S.J.; Jagun, Z.T. Optimizing leachate treatment and energy generation in microbial fuel cells through advanced machine learning. Int. J. Energy Water Resour. 2025, 9, 1339–1357. [Google Scholar] [CrossRef]
  22. Cai, W.; Lesnik, K.L.; Wade, M.J.; Heidrich, E.S.; Wang, Y.; Liu, H. Incorporating microbial community data with machine learning techniques to predict feed substrates in microbial fuel cells. Biosens. Bioelectron. 2019, 133, 64–71. [Google Scholar] [CrossRef]
  23. Ghasemi, M.; Rezk, H. Performance improvement of microbial fuel cell using experimental investigation and fuzzy modelling. Energy 2024, 286, 129486. [Google Scholar] [CrossRef]
  24. Tan, W.H.; Chong, S.; Fang, H.W.; Pan, K.L.; Mohamad, M.; Lim, J.W.; Tiong, T.J.; Chan, Y.J.; Huang, C.M.; Yang, T.C.K. Microbial fuel cell technology—A critical review on scale-up issues. Processes 2021, 9, 985. [Google Scholar] [CrossRef]
  25. Nguyen, D.D.; Shin, M.C.; Han, J.H.; Kim, G.M. Artificial Intelligence–Assisted Optimization of Microfluidic and Microbial Fuel Cells: An Updated Review. Int. J. Precis. Eng. Manuf. 2025, 26, 2389–2409. [Google Scholar] [CrossRef]
  26. Ding, R.; Zhang, S.; Chen, Y.; Rui, Z.; Hua, K.; Wu, Y.; Li, X.; Duan, X.; Wang, X.; Li, J.; et al. Application of machine learning in optimizing proton exchange membrane fuel cells: A review. Energy AI 2022, 9, 100170. [Google Scholar] [CrossRef]
  27. Chaudhuri, S.K.; Lovley, D.R. Electricity generation by direct oxidation of glucose in mediatorless microbial fuel cells. Nat. Biotechnol. 2003, 21, 1229–1232. [Google Scholar] [CrossRef]
  28. Gyaneshwar, A.; Selvaraj, S.K.; Ghimire, T.; Mishra, S.J.; Gupta, S.; Chadha, U.; Manoharan, M.; Paramasivam, V. A survey of applications of MFC and recent progress of artificial intelligence and machine learning techniques and applications, with competing fuel cells. Eng. Res. Express 2022, 4, 022001. [Google Scholar] [CrossRef]
  29. Szakács, S.; Koók, L.; Pientka, Z.; Otmar, M.; Zitka, J.; Brožová, L.; Kujawski, W.; Rózsenberszki, T.; Fitos-Boros, A.; Bahaa, A.; et al. Demonstration of a novel, polyaniline film-coated composite membrane as an efficient separator for microbial fuel cells operated in the long-term. Chem. Eng. J. Adv. 2025, 23, 100824. [Google Scholar] [CrossRef]
  30. Reda, S.; Safwat, S.M.; Elawwad, A.; Abdel-Halim, H. Dual-chamber microbial fuel cells for enhanced bioelectricity generation and chemical oxygen demand removal from sludges: A comparative study of different real sludge generated from a wastewater treatment plant. Biomass Bioenergy 2025, 201, 108063. [Google Scholar] [CrossRef]
  31. Hernández-Flores, G.; Solorza-Feria, O.; Poggi-Varaldo, H.M. Bioelectricity generation from wastewater and actual landfill leachates: A multivariate analysis using principal component analysis. Int. J. Hydrogen Energy 2017, 42, 20772–20782. [Google Scholar] [CrossRef]
  32. Khanaum, M.M.; Borhan, M.S.; Rahman, S.; Bergholz, P. Wastewater treatment and electricity generation from sugarbeet processing wastewater (SBWW) using microbial fuel cell (MFC). In Proceedings of the 2020 ASABE Annual International Virtual Meeting (p. 1); American Society of Agricultural and Biological Engineers: Omaha, NE, USA, 2020. [Google Scholar] [CrossRef]
  33. Cohen, J.; Cohen, P.; West, S.G.; Aiken, L.S. Applied Multiple Regression/Correlation Analysis for the Behavioral Sciences, 3rd ed.; Routledge: New York, NY, USA, 2013; pp. 1–536. [Google Scholar]
  34. Gwelo, A.S. Principal components to overcome multicollinearity problem. Oradea J. Bus. Econ. 2019, 4, 79–91. [Google Scholar] [CrossRef]
  35. Zaffar, A.; Prabhakar, M.R.; Jayaraman, S.; Liu, C.; Balasubramanian, P. Multivariate Optimization of Electrochemical Struvite Precipitation from Wastewater Using Principal Component Analysis. ACS EST Water 2025, 5, 2361–2372. [Google Scholar] [CrossRef]
  36. Jackson, D.A. Stopping rules in principal components analysis: A comparison of heuristical and statistical approaches. Ecology 1993, 74, 2204–2214. [Google Scholar] [CrossRef]
  37. Kapoor, A.; Krishnamoorthy, N.; Pathy, A.; Balasubramanian, P. Chemometric analysis unravelling the effect of key influencing factors on algal biochar yield. Algal Res. 2023, 69, 102908. [Google Scholar] [CrossRef]
  38. Azid, A.; Juahir, H.; Toriman, M.E.; Kamarudin, M.K.A.; Saudi, A.S.M.; Hasnam, C.N.C.; Aziz, N.A.A.; Azaman, F.; Latif, M.T.; Zainuddin, S.F.M.; et al. Prediction of the level of air pollution using principal component analysis and artificial neural network techniques: A case study in Malaysia. Water Air Soil Pollut. 2014, 225, 2063. [Google Scholar] [CrossRef]
  39. Gour, L.; Maurya, S.B.; Koutu, G.K.; Singh, S.K.; Shukla, S.S.; Mishra, D.K. Characterization of rice (Oryza sativa L.) genotypes using principal component analysis including scree plot & rotated component matrix. Int. J. Chem. Stud. 2017, 5, 975–983. [Google Scholar]
  40. Qu, W.; Kelderman, P. Heavy metal contents in the Delft canal sediments and suspended solids of the River Rhine: Multivariate analysis for source tracing. Chemosphere 2001, 45, 919–925. [Google Scholar] [CrossRef]
  41. Ravikumar, P.; Somashekar, R.K. Principal component analysis and hydrochemical facies characterization to evaluate groundwater quality in Varahi river basin, Karnataka state, India. Appl. Water Sci. 2017, 7, 745–755. [Google Scholar] [CrossRef]
  42. Hair, J.F.; Anderson, R.E.; Tatham, R.L.; Black, W.C. Multivariate Data Analysis, 4th ed.; Prentice-Hall Publisher: Upper Saddle River, NJ, USA, 1998; pp. 1–730. [Google Scholar]
  43. Hair, J.F.; Black, W.C.; Babin, B.J.; Anderson, R.E. Multivariate Data Analysis, 8th ed.; Cengage Learning Publisher: Hampshire, UK, 2019; pp. 1–813. [Google Scholar]
  44. Bhattacharya, A.; Chatterjee, P. Enhancing the coulombic efficiency and power output during anodic heterotrophic denitrification using dual electrode assembly in a three chambered microbial fuel cell. J. Water Process Eng. 2025, 79, 108853. [Google Scholar] [CrossRef]
  45. Bagchi, S.; Behera, M. Methanogenesis Suppression During Pharmaceutical Wastewater Treatment in Ceramic Separator Microbial Fuel Cell. Water Air Soil Pollut. 2025, 236, 528. [Google Scholar] [CrossRef]
  46. Nam, J.Y.; Kim, H.W.; Shin, H.S. Ammonia inhibition of electricity generation in single-chambered microbial fuel cells. J. Power Sources 2010, 195, 6428–6433. [Google Scholar] [CrossRef]
  47. Fang, Z.; Huang, Y.; Tang, S.; Fan, Q.; Zhang, Y.; Xiao, L.; Yong, Y.C. Direct interspecies electron transfer for environmental treatment and chemical electrosynthesis: A review. Environ. Chem. Lett. 2024, 22, 3107–3133. [Google Scholar] [CrossRef]
  48. Wang, W.; Wang, K.; Zhao, Q.; Liu, Y. Simultaneous degradation of anodic sludge and cathodic refractory pollutant in a MFC powered EF system enhanced by co-addition of lysozyme and 2-bromoethane sulfonate. J. Environ. Chem. Eng. 2022, 10, 108074. [Google Scholar] [CrossRef]
  49. Rahman, A.; Borhan, M.S.; Rahman, S. Evaluation of microbial fuel cell (MFC) for bioelectricity generation and pollutants removal from sugar beet processing wastewater (SBPW). Water Sci. Technol. 2018, 77, 387–397. [Google Scholar] [CrossRef] [PubMed]
  50. Lv, J.; Zhao, Q.; Jiang, J.; Ding, J.; Wei, L.; Liang, J. Electron transfer performance and mechanism in twin microbial fuel cell powered electro-Fenton system with waste activated sludge as substrate. Bioelectrochemistry 2025, 168, 109154. [Google Scholar] [CrossRef] [PubMed]
  51. Hartnig, C.; Roth, C. Polymer Electrolyte Membrane and Direct Methanol Fuel Cell Technology: Volume 1: Fundamentals and Performance of Low Temperature Fuel Cells; Elsevier: Amsterdam, The Netherlands; Woodhead Publishing: Philadelphia, PA, USA, 2012. [Google Scholar]
  52. Almasri, R.A.; Barakat, N.A.; Irfan, O.M. Enhancing sustainability and power generation from sewage-driven air-cathode microbial fuel cells through innovative anti-biofouling spacer and biomass-derived anode. J. Chem. Technol. Biotechnol. 2025, 100, 344–359. [Google Scholar] [CrossRef]
  53. Maletić, S.; Borello, D.; Gagliardi, G.G.; Cosentini, C.; Ancona, V.; Caracciolo, A.B.; Mariani, L.; Garbini, G.L.; Narciso, A.; Visca, A.; et al. Multidisciplinary assessment of microbial fuel cells with river sediments historically contaminated by hydrocarbons amended with compost. J. Power Sources 2025, 658, 238307. [Google Scholar] [CrossRef]
  54. Bisht, B.; James, J.; Ahmad, W.; Kumar, A.; Dmitriev, A.A.; Pal, M.; Huang, J.; Vlaskin, M.S.; Verma, M.; Kumar, V. Exploring microbial electrochemical technology for the treatment of wastewater and removal of ampicillin. Chem. Eng. J. 2025, 521, 166793. [Google Scholar] [CrossRef]
  55. Tesfaye, T.; Shuka, Y.; Tadesse, S.; Eyoel, T.; Mengesha, M. Improving the power production efficiency of microbial fuel cell by using biosynthesized polyanaline coated Fe3O4 as pencil graphite anode modifier. Sci. Rep. 2025, 15, 587. [Google Scholar] [CrossRef]
  56. Lay, C.H.; Daengbussadee, C.; Laopaiboon, L.; Deng, Y.C.; Wahby, B.E.; Kumar, G.; Kumar, P.V.; Kurniawan, S.B.; Abdul, P.M. Bioremediation enhancement by current-powered solenoid magnetic field in microbial fuel cell. World J. Microbiol. Biotechnol. 2025, 41, 447. [Google Scholar] [CrossRef]
  57. Malunga-Makatu, K.B.; Tichapondwa, S.M.; Chirwa, E.M. Enhancing air-cathode MFC performance using bio-palladium catalysts and microbial consortia. Sustain. Energy Fuels 2025, 9, 5882–5893. [Google Scholar] [CrossRef]
  58. Hou, L.; Cortez, R.; Hagerman, M.; Hu, Z.; Majumder, E.L.W. Co-occurrence of direct and indirect extracellular electron transfer mechanisms during electroactive respiration in a dissimilatory sulfate reducing bacterium. Microbiol. Spectr. 2025, 13, e01226-24. [Google Scholar] [CrossRef]
  59. Hsu, W.H.; Lin, Z.Y. Performance Enhancement of Microbial Fuel Cells Using Graphene-coated Stainless Steel Mesh Anodes via Electrophoretic Deposition. Sens. Mater. 2025, 37, 3515–3529. [Google Scholar] [CrossRef]
  60. Chen, Z. Study on Factors Affecting Power Generation Efficiency of Microbial Fuel Cells. In Proceedings of the 3rd International Conference on Materials Engineering, New Energy and Chemistry; MATEC Web of Conferences; EDP Sciences: Les Ulis, France, 2025. [Google Scholar] [CrossRef]
  61. Chong, P.L.; Chuah, J.H.; Chow, C.O.; Ng, P.K. Plant microbial fuel cells: A comprehensive review of influential factors, innovative configurations, diverse applications, persistent challenges, and promising prospects. Int. J. Green Energy 2025, 22, 599–648. [Google Scholar] [CrossRef]
  62. Zhang, L.; Zhang, Y.; Liu, Y.; Wang, S.; Lee, C.K.; Huang, Y.; Duan, X. High power density redox-mediated Shewanella microbial flow fuel cells. Nat. Commun. 2024, 15, 8302. [Google Scholar] [CrossRef] [PubMed]
  63. Yadav, S.; Kumar, S.; Choubey, R.K.; Gupta, T.K.; Kumar, V. Electrodeposition of SnO2 and SnO2/PPy coating on Cu electrode for enhanced performance of microbial fuel cell. Appl. Phys. A 2025, 131, 851. [Google Scholar] [CrossRef]
  64. Ouyang, B.; Zhang, Z.; Chen, F.; Li, F.; Fu, M.L.; Lan, H.; Yuan, B. Energy production and denitrogenation performance by sludge biochar based constructed wetlands-microbial fuel cells system: Overcoming carbon constraints in water. Water Res. 2025, 273, 123024. [Google Scholar] [CrossRef]
  65. Pameté, E.; Köps, L.; Kreth, F.A.; Pohlmann, S.; Varzi, A.; Brousse, T.; Balducci, A.; Presser, V. The many deaths of supercapacitors: Degradation, aging, and performance fading. Adv. Energy Mater. 2023, 13, 2301008. [Google Scholar] [CrossRef]
  66. Kumar, K. Principal component analysis: Most favourite tool in chemometrics. Resonance 2017, 22, 747–759. [Google Scholar] [CrossRef]
Figure 1. Schematic diagram of a dual-chambered microbial fuel cell.
Fuels 07 00006 g001
Figure 2. Illustration framework of the study involving nine dual-chamber microbial fuel cells operated in batch mode.
Fuels 07 00006 g002
Figure 3. Flowchart illustrating the detailed framework of the study.
Fuels 07 00006 g003
Figure 4. Performance metrics: (a) coulombic efficiency, (b) polarization curves, and (c) power curves with two batches and six different experiment levels in this study.
Fuels 07 00006 g004
Figure 5. Scree plot representing (a) the eigenvalues and (b) the proportion of variance accounted for by the principal components. The grey dashed line indicates Kaiser’s criterion, showing that only principal components with eigenvalues exceeding this threshold were retained.
Fuels 07 00006 g005
Figure 6. Summary of principal components with associated eigenvalues and cumulative variances explained by the seven principal components (PC) for bioelectricity generation.
Fuels 07 00006 g006
Figure 7. Principal component analysis (PCA) ordination of bioelectricity generation parameters.
Fuels 07 00006 g007
Figure 8. Optimization results shown in a heatmap for predicted CD (mA/m2), predicted voltage (mV), predicted PD (mW/m2), predicted CE (%), and predicted voltage with external resistance (mV). CD: current density (mA/m2), Volt: voltage (mV), PD: power density (mW/m2), CE: coulombic efficiency (%), VOLR: voltage with external resistance (mV).
Fuels 07 00006 g008
Table 1. Initial parameters of the substrate and catholyte utilized in the study.
BatchExperiment LevelSubstrateCatholyte
pHCOD (mg/L)EC (mS)pHEC (mS)
Batch 1
(B1)
CODA6.5 ± 0.021373 ± 40 2.8 ± 0.107.19 ± 0.035.5 ± 0.02
CODB6.5 ± 0.021990 ± 562.8 ± 0.10
CODC6.5 ± 0.023570 ± 202.8 ± 0.10
Batch 2
(B2)
pHA6.5 ± 0.102050 ± 89 1.2 ± 0.02
pHB8.6 ± 0.10 2050 ± 89 1.2 ± 0.02
pHC9.5 ± 0.102050 ± 89 1.2 ± 0.02
Table 2. Summary of PCA importance by eigenvalues and their proportion.
Principal Component (PC)EigenvalueVariance Explained (%)Cumulative Variance (%)
PC14.1158.7558.75
PC21.5121.6280.37
PC30.9313.2793.64
PC40.294.1297.76
PC50.121.6899.44
PC60.030.4599.89
PC70.010.11100
Table 3. Optimal combination results of pH and COD generating the highest voltage, power density, current density, and coulombic efficiency.
Optimal CombinationPredicted Values
pHCODVOLVOLRPDCDCE
9.51100 409.2057.461451.804.85
6.53500795.71
Note: COD: Chemical oxygen demand (mg/L), VOL: voltage (mV), VOLR: voltage under resistance (mV), PD: power density (mW/m2), CD: current density (mA/m2), CE: coulombic efficiency (%).
Disclaimer/Publisher’s Note: The statements, opinions and data contained in all publications are solely those of the individual author(s) and contributor(s) and not of MDPI and/or the editor(s). MDPI and/or the editor(s) disclaim responsibility for any injury to people or property resulting from any ideas, methods, instructions or products referred to in the content.