Article

A Global Review of Blue and Green Hydrogen Fuel Production Technologies, Trends and Future Outlook to 2050

by
Muhammad Ammar
1,
Babatunde Oyeleke Oyewale
1,
Ahmed Elseragy
2,
Ibrahim M. Albayati
3,* and
Aliyu M. Aliyu
1,*
1
School of Engineering and Physical Sciences, University of Lincoln, Lincoln LN6 7TS, UK
2
Faculty of Art and Design, The British University of Egypt, Suez Desert Road, El-Sherouk City 11837, Egypt
3
School of Engineering and Physical Sciences, Heriot-Watt University, Edinburgh EH14 4AS, UK
*
Authors to whom correspondence should be addressed.
Fuels 2025, 6(4), 88; https://doi.org/10.3390/fuels6040088
Submission received: 29 July 2025 / Revised: 8 November 2025 / Accepted: 21 November 2025 / Published: 26 November 2025

Abstract

Hydrogen is emerging as a key energy carrier in the transition to a low-carbon economy. This study reviews blue and green hydrogen, analysing their production technologies, environmental impacts, economic viability and global deployment trends. Blue hydrogen, derived from natural gas, coal or biomass with carbon capture, utilisation and storage, offers a transitional pathway by reducing emissions relative to unabated fossil routes, but its benefits depend on high CO2 capture efficiencies and strict methane leakage control. Green hydrogen, produced via renewable-powered electrolysis and advanced thermochemical, photochemical and photoelectrochemical methods, represents the most sustainable long-term solution, though it is currently limited by cost and scale. This comparative assessment shows that green hydrogen’s production emissions, in the range of 0.67 kgCO-eq/kgH to 1.74 kgCO2-eq/kgH2, are substantially lower than those of blue hydrogen, in the range of 1.21 kgCO2-eq/kgH2 to 4.56 kgCO2-eq/kgH2, reinforcing its alignment with climate neutrality goals. Global production remains below 1% from low-emission sources, yet momentum is growing, with renewable-rich regions investing in large-scale electrolysers. A long short-term memory forecast suggests that blue hydrogen will dominate in the short term, but green hydrogen will surpass it around 2042. Together, both pathways are essential, blue hydrogen as a bridging option and green hydrogen as the foundation of a sustainable hydrogen economy.

1. Introduction

Global warming, currently the biggest threat to humanity, is a consequence of uncontrolled and excessive use of fossil fuels and the dependency on carbon-based fuels [1]. The planet is now facing a huge problem in the form of climate change, primarily because of increasing concentrations of carbon emissions in the environment escalated by increasing need for energy as a result of growth in the world’s population [2,3]. Hence there is a need for carbon-free fuels, and hydrogen (H2), being a carbon-free fuel due to its combustible properties, could be a fuel of the future. Therefore, there is now greater focus on hydrogen fuel in global efforts to decarbonise, as pledged by nations during the Paris Agreement adopted in 2015 by 196 countries at the United Nations Framework Convention on Climate Change (UNFCCC) in order to meet their ambitious net-zero targets [4,5,6]. As a clean energy carrier, hydrogen offers a versatile solution across multiple sectors, including transport, industry, residential heating and energy storage [7,8]. Hydrogen is notably useful for scenarios involving challenging electrification, like shipping services and aircraft, pharmaceuticals, the iron industry and seasonal storage [9]. This gas is produced around the world by different methods, and because of its current importance in ensuring a carbon-free planet, there is a need to analyse and assess its relevance as the main alternative to fossil fuel in order to develop a carbon-free economy of renewable and green fuels. This review focuses on only two major low-carbon hydrogen pathways—blue hydrogen, produced from fossil fuels [10,11,12], and green hydrogen, produced via water electrolysis using renewable energy [13,14,15]—because both are the most economically viable and environmentally friendly options with improved infrastructure in hydrogen fuel production, obtainable with the newest technological advancements [16]. The objective of this study is to present an in-depth evaluation of the technological, economic and regional dimensions and future trends of blue and green hydrogen development, supported by data visualisation and scenario analysis to aid with strategic planning for sustainable energy futures.
According to Hordeski [17], Zohuri [18] and Hoffmann [19], a major reason hydrogen fuel alternative is highly desirable as an alternative fuel is the almost infinite abundance of the hydrogen component in many organic and inorganic compounds. It is present in enormous amounts as a component of water in oceans, ice caps, rivers, lakes and the atmosphere [19], and despite being the most abundant element, hydrogen barely makes up 0.14 percent of the Earth’s crust in terms of weight [20,21]. Even though carbon has more known compounds than any other element, hydrogen compounds are more likely to be numerous because hydrogen is a component of nearly all carbon compounds and forms a wide variety of compounds with other elements, except for noble gases. This gas is a component of many carbon compounds and is found in every plant and animal tissue, as well as in petroleum [22].

Properties of Hydrogen

Table 1 and Table 2 show a list of hydrogen’s main characteristics. The modest forces of attraction between hydrogen molecules are the reasons for the gas’s extraordinarily low melting (−259.20 °C) and boiling (−252.77 °C) points [23]. The fact that hydrogen gas expands from high to low pressure at normal temperature, whereas most other gases experience temperature drops, indicate presence of these weak intermolecular interactions [24]. This is an indication that at ambient temperature, repulsive forces are greater than attractive interactions between hydrogen molecules, since the expansion would cool the hydrogen gas. Attraction forces take place at −68.6 °C, and as a result, hydrogen cools upon being allowed to expand below that temperature [25].
Hydrogen can be compressed in gaseous form in underground caverns, liquefied, or contained in solid-state materials such as metal hydrides for small applications such as drones [26]. For storage, hydrogen has to be compressed to around 350 to 700 times atmospheric pressure [27] as a gas because of its very low critical density of 0.0310 g/cm3, or cryogenically cooled to −253 °C as a liquid due to its critical temperature of −240.0 °C [28] to reach its liquid density of 0.07099 g/cm3, as shown in Table 2. As the lightest element with low volumetric energy density, hydrogen is challenging to store and transport because of its aforementioned properties, and for many practical uses, needs to be compressed or liquefied [26]. The potential for hydrogen to embrittle the steel and welds used to fabricate the pipelines [29] and the need to control hydrogen permeation and leaks are the obstacles involved in transporting hydrogen [30]. These demands mean that it is typically manufactured close to where it is used [26,31,32], a situation which makes hydrogen fuel less versatile and economical as an alternative to fossil fuel. Another method being explored in transporting hydrogen is using ammonia (NH3) as its carrier, but the downside to this method is the risk of ammonia pollution due to pipe leakage, which could have profound environmental impacts [33]. Storage and transportation are quite important when determining the levelised cost of hydrogen (LCOH) in hydrogen production.
Table 1. Properties of atomic hydrogen [34].
PropertiesNormal HydrogenDeuterium
Atomic number11 [34]
Atomic weight1.00802.0141
Electron affinity0.7542 electron volts0.754 electron volts
Nuclear spin½1
Table 2. Properties of molecular hydrogen [33].
PropertiesMolecular HydrogenDeuterium
Bond distance0.7416 Angstrom0.7416 Angstrom
Dissociation energy (25 °C)104.19 kilocalories/mol105.97 kilocalories/mol
Ionisation potential15.427 electron volts15.457 electron volts
Density of solid0.08671 g/cm30.1967 g/cm3
Melting point−259.20 °C−254.43 °C
Heat of fusion28 calories/mol47 calories/mol
Density of liquid0.07099 g/cm3 (−252.78 °C)0.1630 g/cm3 (−249.75 °C)
Boiling point−252.77 °C [33]−249.49 °C
Heat of vaporisation216 calories/mol293 calories/mol
Critical temperature−240.0 °C−243.8 °C
Critical pressure13.0 atmospheres16.4 atmospheres
Critical density0.0310 g/cm30.0668 g/cm3

2. Technologies of Blue and Green Hydrogen Fuel Production

Hydrogen is classified into many colour codes (which form a spectrum): grey, blue, green, brown, yellow, turquoise, pink, aqua and white hydrogen [35]. The process and energy used in production, and whether carbon capture utilisation and storage (CCUS) are utilised, determine its classification into these colour codes [16,36]. When hydrogen is made from water via electrolysis powered by a renewable source of energy, it is referred to as green hydrogen [37], and hydrogen made from natural gas which incorporates CCUS into the process so as to be a low-carbon-based process is classified as blue hydrogen [10]. Hydrogen made from natural gas and other carbon-rich energy sources which does not incorporate CCUS into the process is called grey hydrogen [38]. Pink hydrogen is produced with water electrolysis using electricity from a nuclear power plant, while purple hydrogen is obtained by using nuclear power and heat through combined electrolysis and thermochemical water splitting [16]. Yellow hydrogen is produced with electrolysis using electricity from the energy grid, with carbon emissions varying significantly over time, depending on the grid’s energy sources [39]. Turquoise hydrogen also uses methane (CH4) as the feedstock but is produced via CH4 pyrolysis, and contrary to steam methane reforming (SMR), the byproduct is solid carbon appearing as filamentous carbon or carbon nanotubes [40,41]. Considering the use of black coal or lignite (brown coal) in the hydrogen-making process, these black and brown hydrogens are the absolute opposite of green hydrogen in the hydrogen spectrum and the most environmentally damaging [16,42], creating as much carbon dioxide (CO2) as burning the source fuel would have created in the first place [16]. Aqua hydrogen technology involves injecting oxygen into heavy oil reservoirs or oil sands deep underground, after which a chemical reaction occurs where a spontaneous form of oxidation releases heat [10]. White hydrogen is naturally occurring hydrogen found in nature as a free gas in layers of the continental crust; deep in the oceanic crust; or in volcanic gases, geysers and hydrothermal systems [16,43]. The scope of this paper is, however, limited to critically examining the production, trends and future potential of blue and green hydrogen. This is because of all the hydrogen types mentioned above, blue and green hydrogen still remain the most feasible economically, environmentally and infrastructurally [16]. Blue hydrogen production consists of many processes like steam reforming of methane and light hydrocarbons and gasification of coal, biomass and heavy hydrocarbons.

2.1. Blue Hydrogen

Blue hydrogen is based on the idea that the current processes used to produce hydrogen from fossil fuels could be coupled to CCUS technologies to reduce their greenhouse gas (GHG) emissions [44,45]. Although this strategy appears to be less expensive than switching to green hydrogen, it is vital to keep in mind that implementing CCUS and the associated capital expenditure (CAPEX) often present technological challenges in addition to issues with social acceptability [46]. The technology readiness levels (TRL) for blue hydrogen routes range from 7 (coal gasification + CCUS) to 8 (SMR + CCUS) [47]. The CO2 capture rate needed to change grey to blue hydrogen does not seem to have a standard definition. Depending on the technology and the stages at which CO2 capture is used, most studies report maximum capture rates between 70% and 95% when changing from grey to blue hydrogen. For instance, Arcos and Santos [16] confirmed the capture of CO2 from any of the three streams shown in Figure 1, with a removal efficiency of about 90% from pressure swing adsorption (PSA) tail gas and steam-reforming flue gas, and more than 99% from the raw hydrogen at higher pressure.
It is crucial to remember the extra impact CH4 leakage in the upstream phases has when considering blue hydrogen derived from natural gas [47]. The CertifHy Steering Group, a project created to reach a common European-wide definition of green and low-carbon hydrogen, proposed a reference threshold to define low-carbon hydrogen (also known as blue hydrogen) in 2019 by taking into account a 60% reduction in GHG emissions in comparison with a benchmark process based on SMR [48]. This threshold has been set to 36.4 gCO2e/MJ (131 gCO2e/kWh), starting from a benchmark value of 91 gCO2e/MJ of hydrogen (328 gCO2e/kWh) [47]. Simoes et al. [49] observed that when considering the blue hydrogen pathway, the water consumption rate is often not considered. While a high water consumption rate is often associated with the electrolysis process, blue hydrogen production often consumes more water than the electrolysis process [49]. When comparing embodied water following a life cycle inventory, results show that water consumption per kg of H2 can be as high as 24 litres for SMR and 38 litres for coal gasification [47,50,51].

2.1.1. Production of Blue Hydrogen by Steam Reforming of Methane and Light Hydrocarbons

The SMR process includes three reactions, which are separation of hydrocarbons with steam, water–gas shift (WGS) and formation of CH4. Equations (1), (2) and (3), respectively, illustrate the SMR procedures below [45,52]:
C n H m + n H 2 O n C O + n + m 2 H 2
C O + H 2 O C O 2 + H 2
C O + 3 H 2 C H 4 + H 2 O
An important element defining the SMR process is the raw feedstock’s hydrogen-to-carbon ratio. The formation of carbon dioxide decreases with a higher ratio of hydrogen. Methane has a H:C ratio of 4:1, resulting in the lowest CO2 emission of about 7 kg CO2/kg H2 [53]. The products are controlled by thermodynamics, which favours the processing of CH4 at a lower temperature of nearly 623 K, while higher values of hydrogen can be attained at a higher temperature of approximately 1273 K [54]. During steam reforming reaction, the catalyst used mainly comprises nickel (Ni) as a major metallic component [55]. The catalytic activity depends on the metal area, and it works in severe operating conditions such as temperatures ranging from 600 K to 1300 K and a steam partial pressure of maximum 35 bar [45]. A typical Ni catalyst speeds up the turnover frequency to approximately 0.5 s−1 at 723 K under industrial conditions, leading to CH4 conversion of about 10% [56,57]. The main obstacle is the equilibrium conversion, which only determines extremely large conversions at temperatures exceeding 1170 K. Due to severe restrictions on mass and heat transport, kinetics is rarely the limiting factor for classical reformers, which are instead restricted by the efficacy factor of pelletised catalysts, i.e., nickel/aluminium oxide (Ni/Al2O3) pellets, which is often less than 10% [58]. On an industrial scale, the SMR process produces hydrogen with a thermal efficiency of between 80 and 85 percent [59,60].
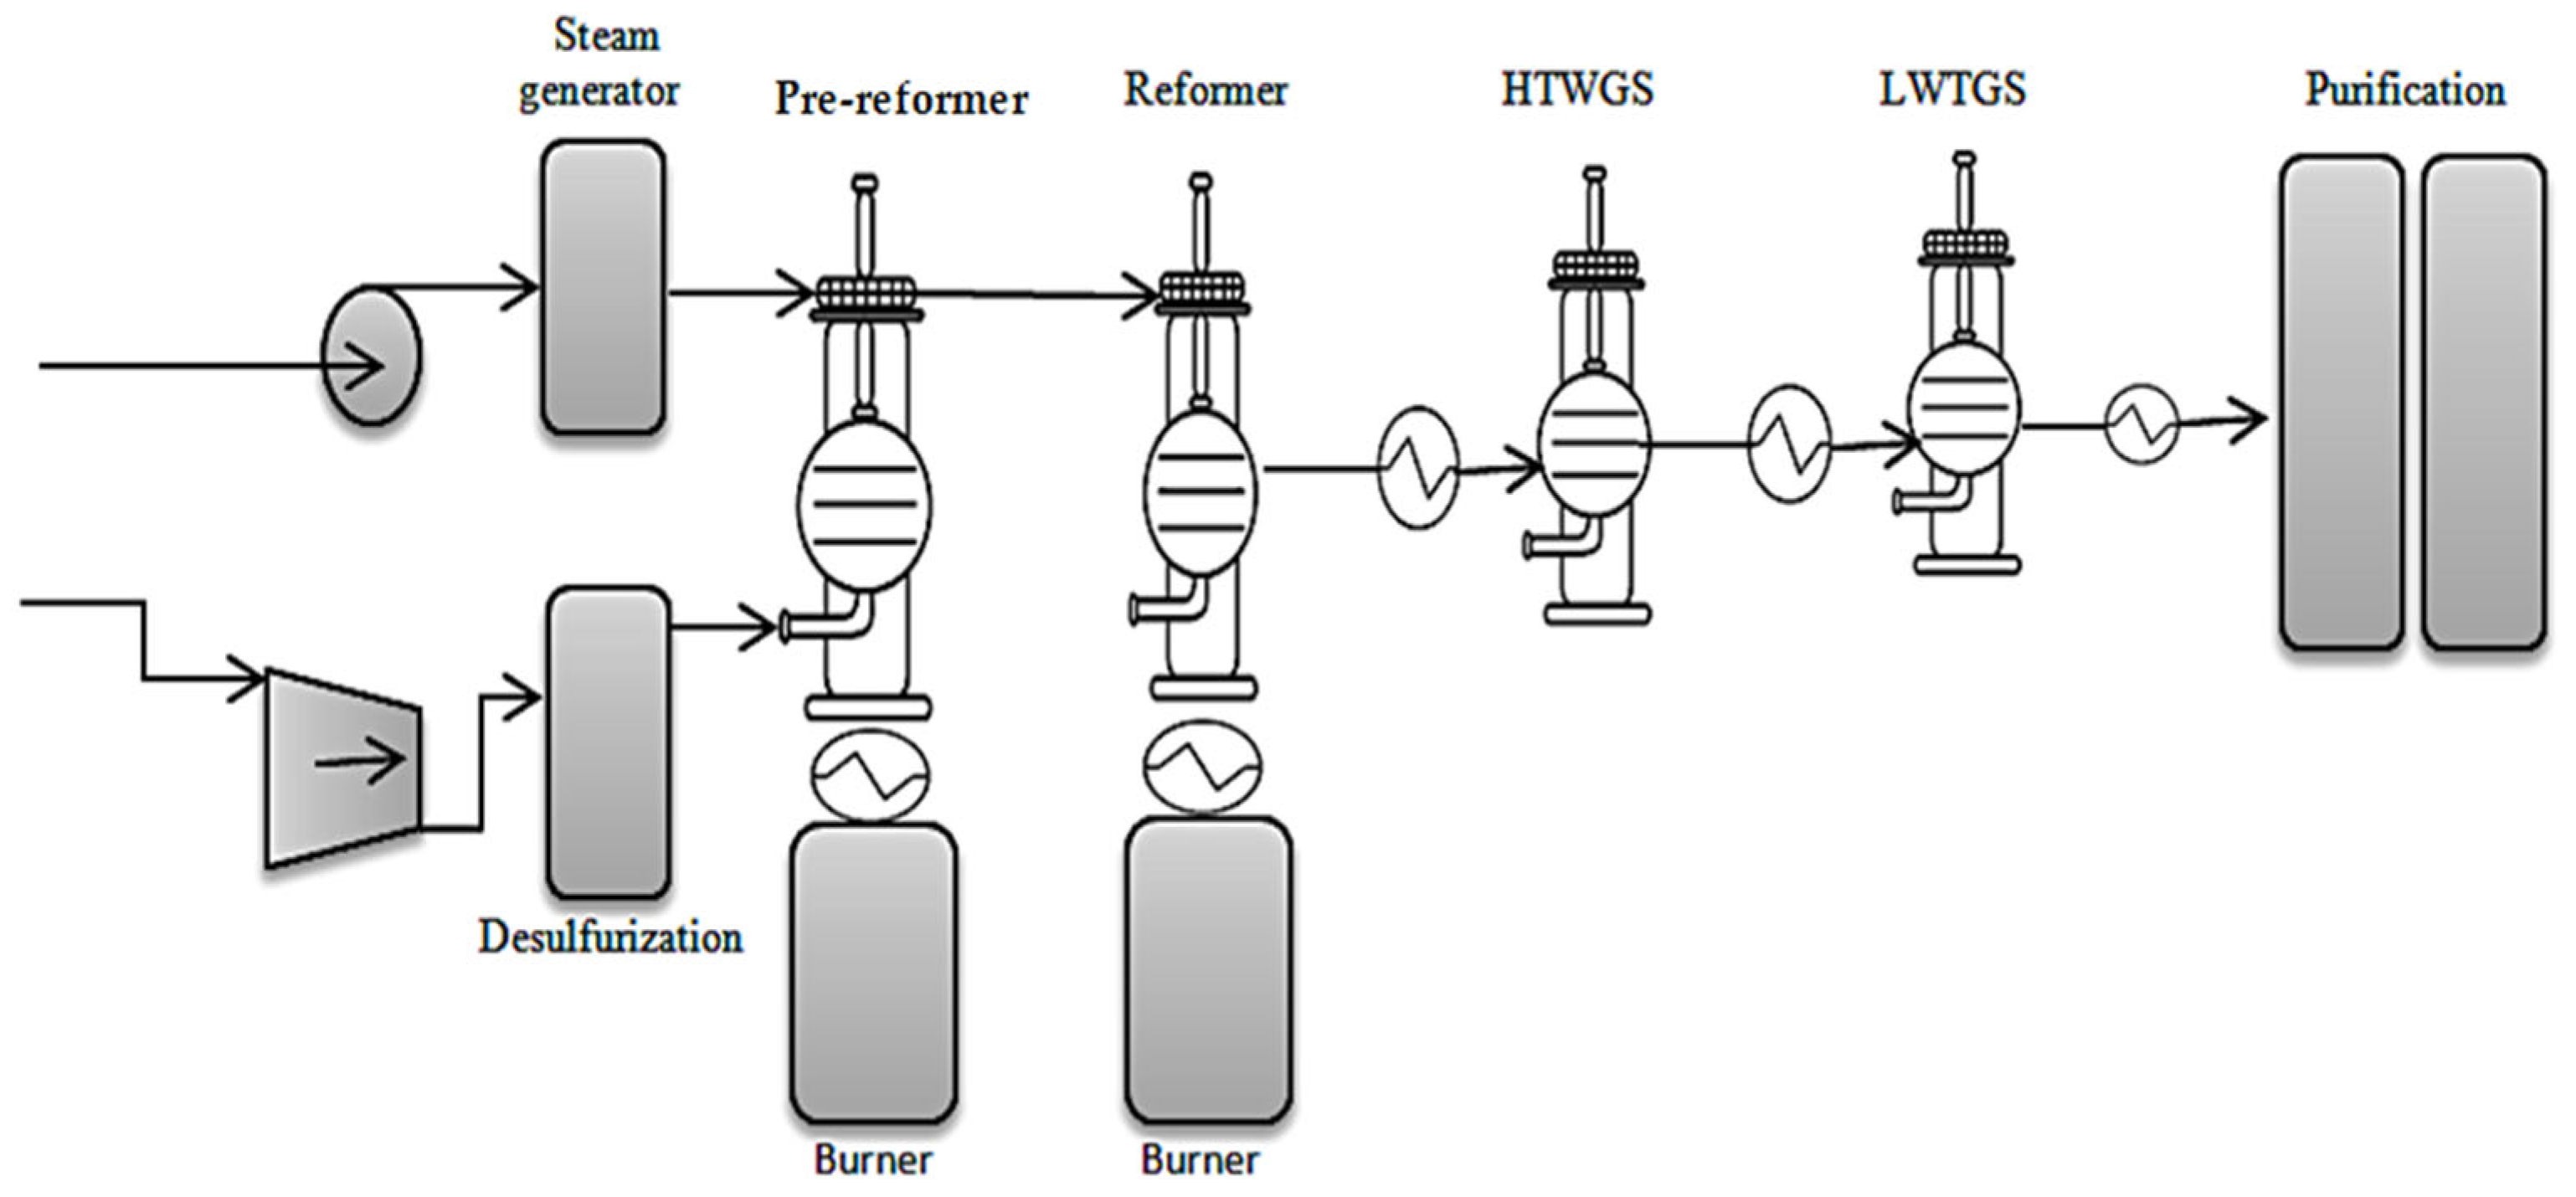
The SMR process consists of the following units, as illustrated in Figure 2: a feed gas preheating or pre-treatment unit, a pre-reformer unit, a reforming unit, high-temperature water–gas shift (HTWGS), low-temperature water–gas shift (LWTGS) and a purification unit. All high hydrocarbons fed into the pre-reformer unit are instantly transformed into C1 components (CH4 and carbon oxides) in the pre-reformer at a low temperature, generally between 673 K and 823 K [61]. The danger of carbon production from thermal cracking of the fuel before it reaches the catalyst bed for reforming might be reduced by heating the products from the pre-reformer to temperatures as high as 1073 K. The low working temperature makes the pre-reforming catalyst particularly vulnerable to carbon deactivation [62]. The pre-reforming method uses specially precipitated high-nickel-loaded catalysts (Ni = 20 to 30 wt%) with alkaline-property supports (magnesium oxide (MgO) = 60 to 70 wt%) and a high surface area [45].
High-temperature shift (HTS) and low-temperature shift (LTS) are the two catalytic stages used in the WGS process, and throughout the WGS process, more hydrogen is produced from the carbon monoxide (CO) left over after reforming, as illustrated in Equation (2). The CO content is then ideally reduced to less than a 0.5 percent volume by these two units situated downstream of the reformer [63]. Fe2O3-Cr2O3 and Cu-ZnO-Al2O3 [64] are the traditional catalyst compositions used in industrial applications for the HTS and LTS units, respectively. For typical reformate streams (8–10% volume CO), the HTS reactor operates at close to equilibrium (623–693 K), reducing the CO level to roughly a 4% volume, while the LTS operates at 453–613 K, achieving a 0.4–0.8% volume of CO [56]. Chakrabarti et al. [65], however, observed that in the H2-rich stream created by WGS, there are still some pollutants present, such as unconverted CH4 and trace amounts of CO.
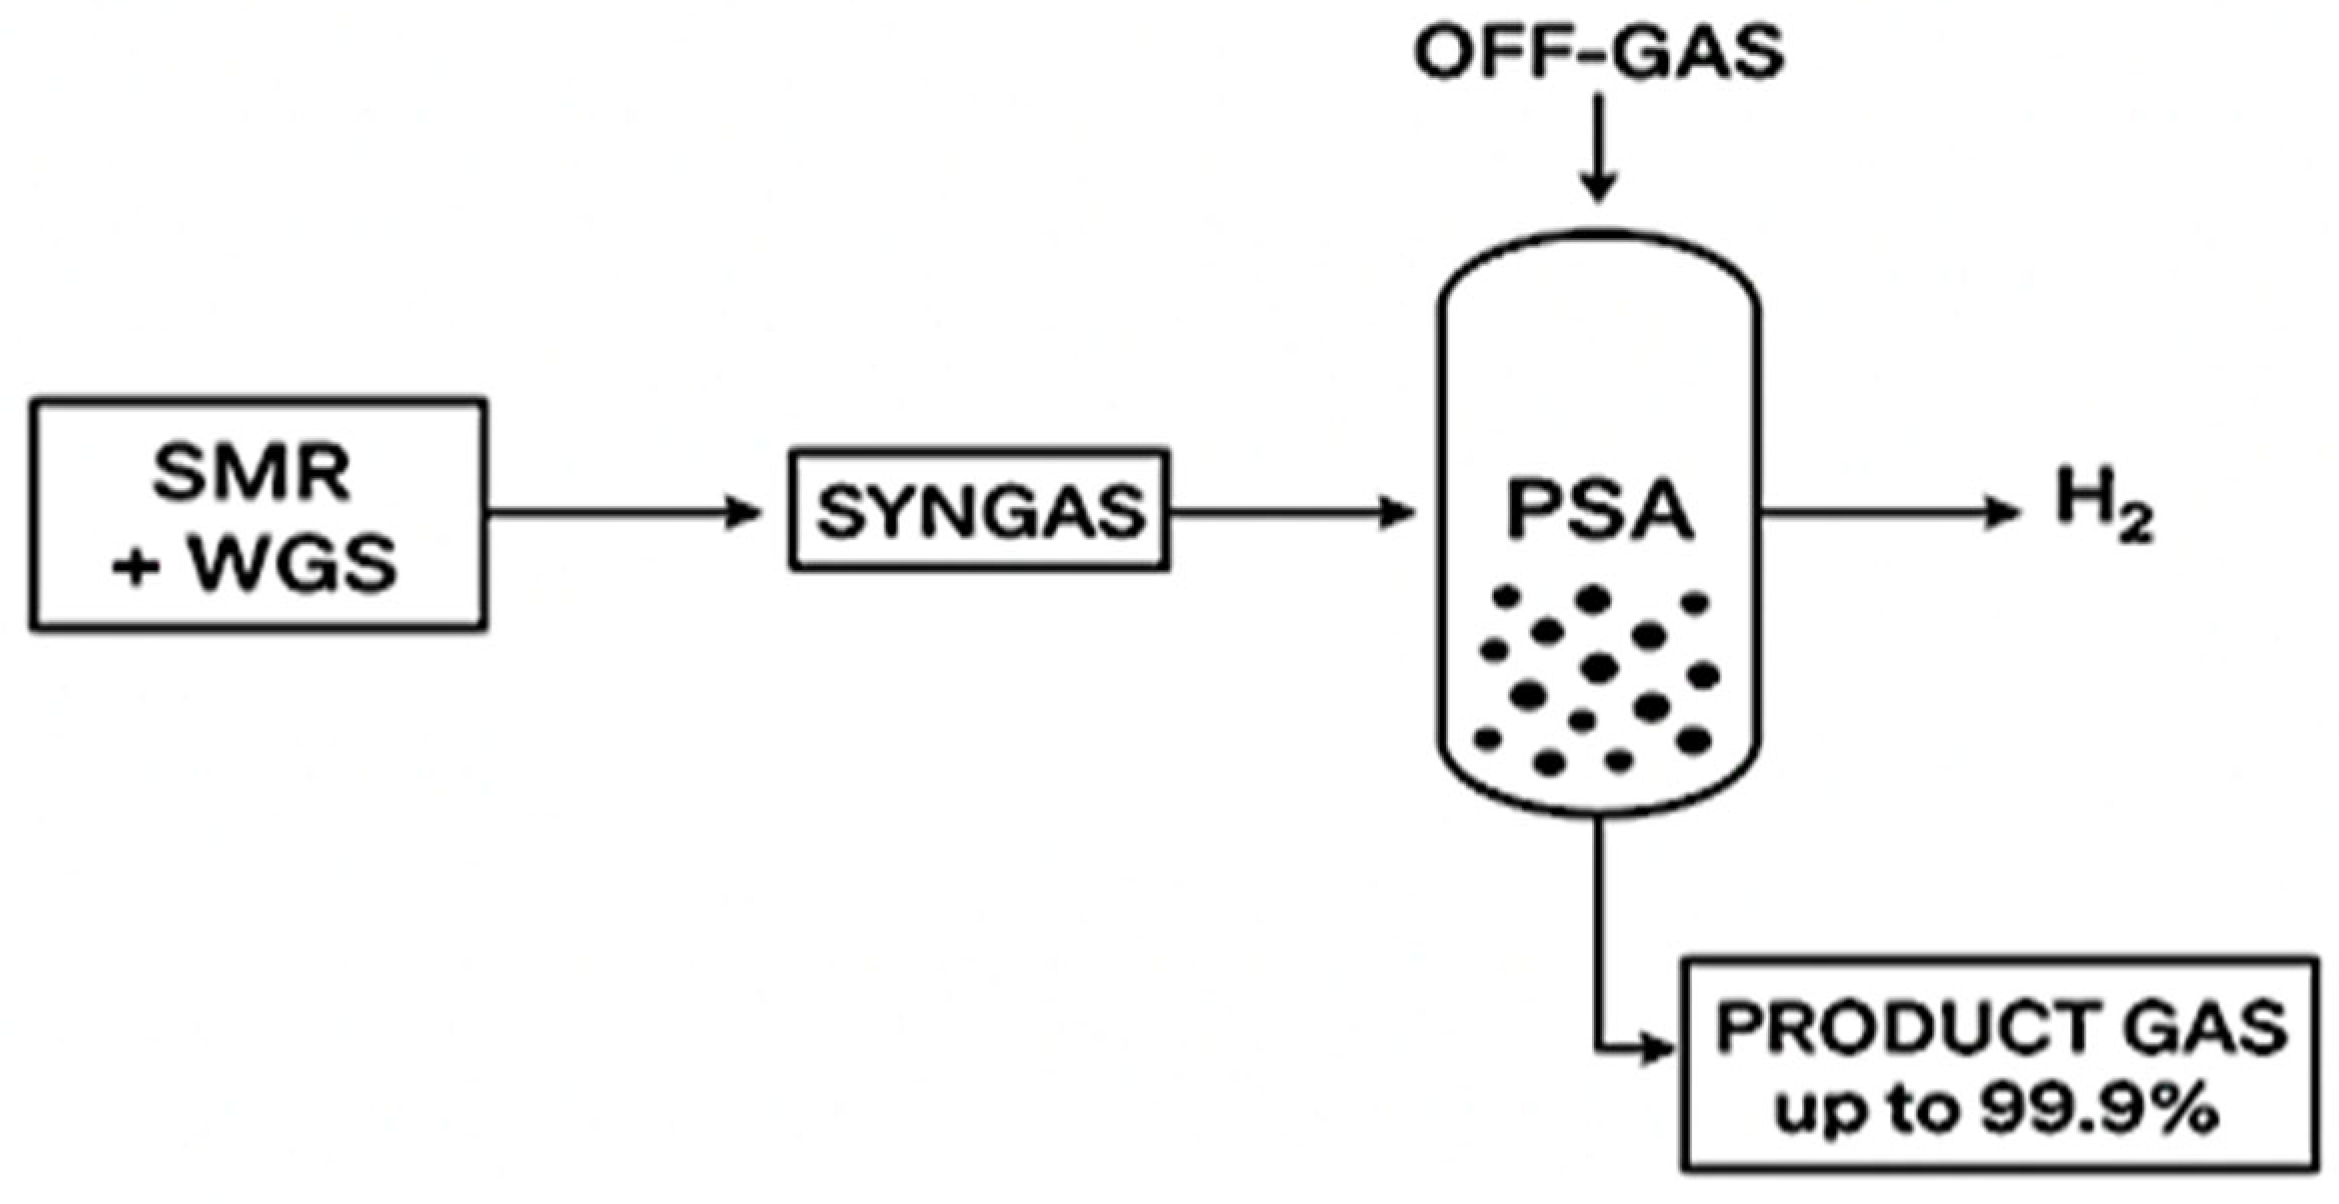
Pressure swing adsorption (PSA) systems are often used according to Krótki et al. [66] to remove these gases, and in the process produce a stream of filtered H2 that has a usual purity of 99.99% volume, as shown in Figure 3. PSA is the most common industrial method to purify hydrogen from the SMR and WGS processes [67,68]. After the SMR-WGS process, the syngas mainly contains H2, CO2, CO, CH4 and nitrogen (N2) [69]. PSA then uses adsorbents (zeolites, activated carbon, silica gel, etc.) that preferentially adsorb CO2, CO, CH4 and N2 while allowing H2 to pass through as the product gas [66]. The process works by cycling between high pressure (where impurities are adsorbed) and low pressure (desorption step) to regenerate the adsorbent, and in the process produce high-purity hydrogen (up to 99.9%) from the WGS/SMR syngas streams [70].
Methane leakage is one of the challenges in producing blue hydrogen using the SMR technique [71]. Davids et al. [72] attributed a significant portion of observed anthropogenic global warming to date to CH4, a potent greenhouse gas and the main component of natural gas. There are estimates of 22% of annual global CH4 emissions (80 Tg/y) coming from oil and gas supply chains and utilisation [72]. Hence there is a need to mitigate CH4 emission during hydrogen production, because small leakage rates (1–3%) can reverse the emission reduction gains achieved by CCUS [73]. Methane leakage in the production of blue hydrogen arises from fugitive emissions during natural gas extraction and transportation and during the reforming process [74]. Without stringent control of CH4 emissions, blue hydrogen may not achieve the intended decarbonisation objectives and could even exceed the climate impact of fossil fuel use [75].
Mitigating CH4 leakage in blue hydrogen production pathways requires technological, regulatory and operational measures [73]. Advanced leak detection and repair (LDAR) programmes with the use of infrared cameras, continuous monitoring sensors and satellite-based tracking can be carried out to identify and reduce fugitive emissions along pipelines and processing facilities [76]. Moreover, replacing obsolete equipment such as high-bleed pneumatic controllers, improving pipeline integrity and implementing best practices at production sites can reduce leakage [77]. Also, on-site production, where blue hydrogen is manufactured on-site at the extraction facility, can also minimise transport-related emissions [78]. Policy regulations mandating strict monitoring, reporting and verification (MRV) of CH4 emissions with economic incentives or penalties can promote compliance [79]. Integrating these mitigation techniques aligns blue hydrogen production with the broader objectives of achieving net-zero emissions globally and strengthening its climate credibility [80].

2.1.2. Blue Hydrogen Production by Gasification of Coal and Biomass

The gasification process includes the interaction of a carbon source such as coal or biomass with a hydrogen source, often steam or oxygen, at high temperatures (1200–1400 K) and moderate pressures (5–10 bar) [81,82]. Gasification can be carried out in a fixed-bed or fluidised-bed reactor with or without a catalyst, with the latter reactor producing the best results [83]. Separating oxygen from air in order to be utilised as a clean oxidant in the gasifier is necessary for the synthesis of hydrogen, with cryogenics used to separate oxygen from air [84]. The gasification process promotes limited oxidation in pyrolysis processes because oxygen is present. Fast pyrolysis processes usually result in the production of bio-oils, tar (aromatic hydrocarbons) and charcoal [85]. The main difference between coal and biomass gasification processes is the feedstock composition, which also affects the gaseous product compositions [86]. Also, coal gasification is a relatively mature and large-scale technology that uses coal, a finite resource with high upfront carbon emissions [87], while biomass gasification uses renewable organic matter, and is a more sustainable pathway with the potential for lower energy consumption and strong economic competitiveness; it can be carbon-neutral or even carbon-negative when accompanied by CCUS but faces the challenges of feedstock availability and sorting [88].
In coal gasification, gaseous product composition ranges are as follows: H2 (25–40%), CO (15–30%), CO2 (12–18%) and CH4 (0–5%) [89]. When Romero et al. [90] determined gaseous compositions in biomass gasification when the process was carried out on a palm kernel shell at 750 °C, CO and CO2 were observed to be the dominant species, with contents of 48% and 22%, followed by CH4 and H2, with contents of 14% and 13%, respectively. The coal and biomass gasification reaction is generally represented as [91]
H C s + H 2 O + O 2 H 2 + C O x + C H 4 + H C s + c h a r c o a l
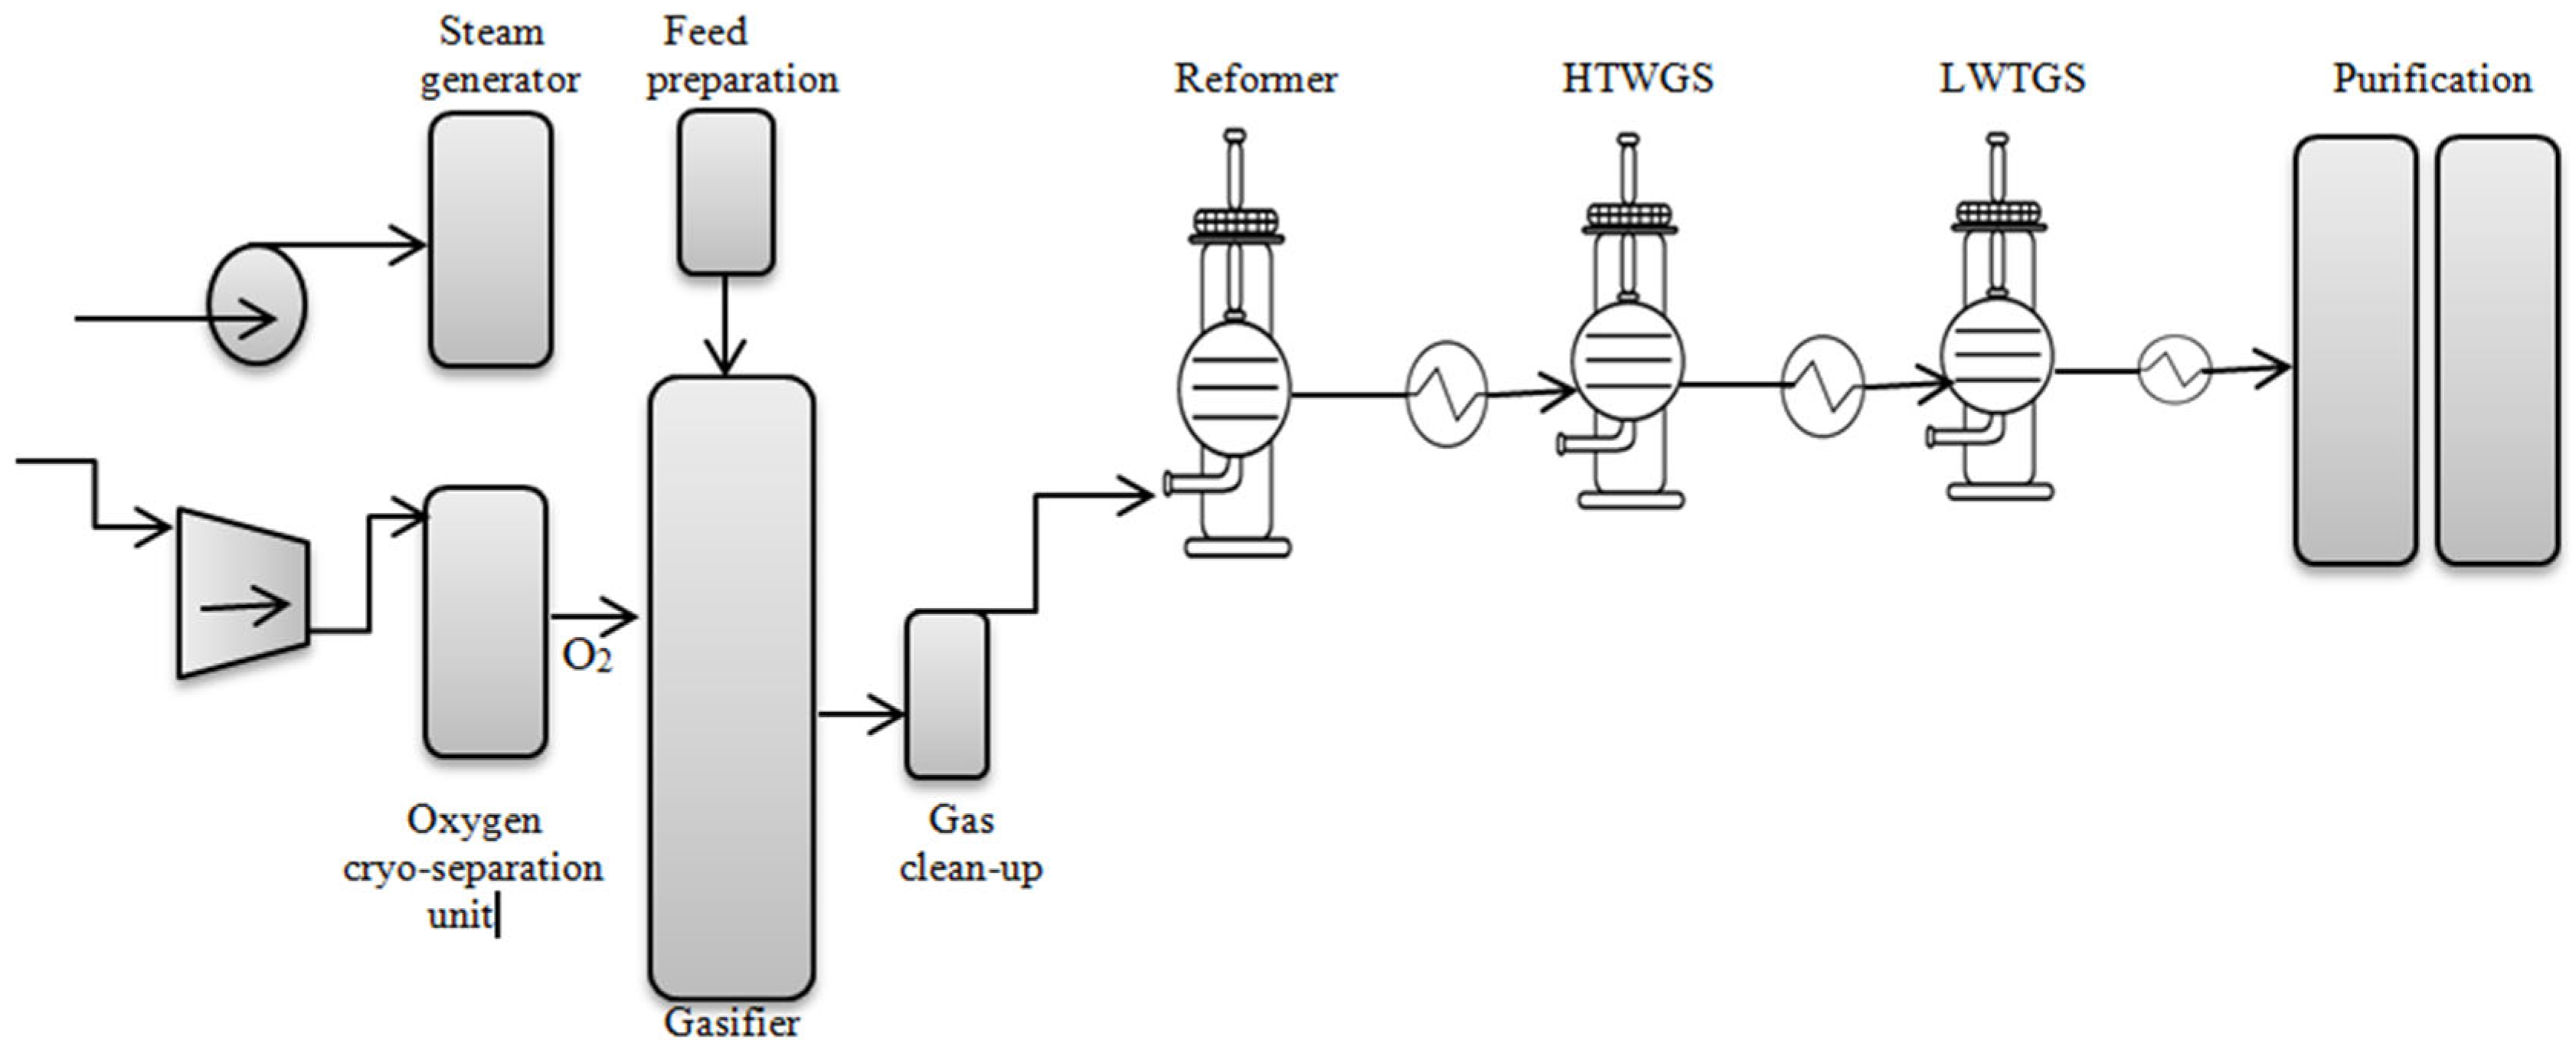
Conditions like heating rate, heating temperature and residence time can be optimised to maximise gasification with minimum by-product formation [92]. The gasification process is a complicated process consisting of cracking, partial oxidation, steam gasification and water–gas shift. Figure 4 shows the setup, consisting of gasification unit, as well as low- and high-temperature water–gas shift units coupled with a hydrogen purification unit. The schematic illustrates an oxygen-blown coal/biomass gasification process for hydrogen production and purification. Oxygen is supplied to the gasifier after being separated from air in a cryogenic separation unit. Using pure O2 instead of air produces nitrogen-free syngas in gasification processes [93,94]. Feedstock reacts with O2 and steam (generated from the steam generator) at elevated pressure (20–80 bar) and temperature (1200–1600 °C) [95] to produce synthesis gas (H2, COx, CH4 and minor impurities), as shown in Equation (4). The raw syngas undergoes gas clean-up to remove particulates and sulphur compounds before entering a reformer, where residual hydrocarbons are converted into H2 and CO [96]. The gas stream is subsequently conditioned through a high-temperature water–gas shift (HTWGS) reactor at
350–400 °C and a low-temperature water–gas shift (LTWGS) reactor at 200–250 °C to maximise hydrogen yield by converting CO to CO2 and H2 [98,99]. Finally, a purification unit, typically pressure swing adsorption, produces high-purity hydrogen (≈99.9%) by removing CO and CH4, and capturing CO2 for potential storage or utilisation [70]. In a gasifier with a reducing condition, most of the sulphur residing in the feedstock is converted to hydrogen sulphide, while a small portion up to 10% forms carbonyl sulphide [100], and nitrogen found in the organic heterostructure produces ammonia and very small quantities of hydrogen cyanide [101]. These contaminants need removal, which is often performed by physical adsorption (acid gases) followed by membrane or PSA devices.
All gasification conditions result in pyrolysis and shift processes [102]. H2, CO and CH4 are produced because of the hydrocracking and gasification processes that the feedstock passes through. The gasification processes, which can use either water or O2, are exothermic and prefer temperatures over 1023 K due to their high enthalpy of 120–160 kJ/mol [103]. With an enthalpy of 32 to 88 kJ/mol and moderately exothermic conditions, the hydrogasification and shift processes are more favourable at temperatures lower than 1023 K [104]. The enthalpy of the combustion reaction is 376 kJ/mol, making it a very exothermic process [104]. The equilibrium constant for this latter reaction indicates that, at temperatures of around 2473 K, the reaction has few thermodynamic restrictions. Under actual gasification circumstances, the combustion reaction completes as gasification and hydrogasification processes get closer to pseudo-equilibrium [104]. Tar, an unwanted by-product of coal or heavy hydrocarbon gasification, is the biggest issue, as it polymerises to complicated structures, which is not advantageous for manufacturing hydrogen using the steam reforming method [105]. Methods used to minimise tar formation are proper design of the gasifier; incorporating a suitable catalyst; and controlling parameters such as temperature, residence time and the gasifying agent. Dolomite, olivine and char are suitable catalysts that can be used to achieve thermal cracking of tar [106]. Ni, platinum (Pt), palladium (Pd), ruthenium (Ru) and alkaline metal oxides supported by dolomite and CeO2/SiO2 could be utilised to catalyse the gasification procedure in order to decrease the formation of tar and increase product gas conversion and clarity efficiency [107,108]. Previous studies have shown that nickel-based catalysts are extremely active for tar destruction [109].

2.2. Green Hydrogen

The green hydrogen pathway uses power generation from renewable sources to electrolyse water to produce hydrogen and oxygen [20,47,110]. In water electrolysis there are many different new technologies in use, including alkaline electrolysers, proton exchange membranes (PEMs) and solid oxide electrolysers. A common and important method of producing green hydrogen is using electrolysis, which is the process of breaking water molecules into hydrogen and oxygen utilising electrochemical means [111]. However, there are multiple other methods, such as direct thermochemical conversion, photochemical conversion and photoelectrochemical conversion, that are currently used to produce green hydrogen.

2.2.1. Green Hydrogen Production by Water Electrolysis

The most widely used electrolytic systems for breaking down water include alkaline electrolysers, polymer electrolyte membranes (PEMs) and solid oxide electrolysers (SOEs) due to their gas purity and efficiency [112]. The PEM electrolyser operates under high pressure (with a thickness ranging from 50 to 300μm) and has strong proton conductivity [113]. The electrolyte in PEM electrolysers is thinner than alkaline electrolyte, with a reduction in electrolysis operation charges due to the PEM’s ability to function with elevated energy density and gases that have a high level of clarity [112,114]. PEM electrolysers are notably efficient at high voltages, but their drawbacks include high component costs, poor durability and vulnerability to corrosion and acid [114,115]. Although alkaline water electrolysis is a very costly technique, it is still one of the simplest processes for producing hydrogen. On-site electrolysis of water may be more cost-effective than alternative technologies when only tiny amounts of hydrogen are needed, and more than 99.989% pure hydrogen gas is produced using this method [116], which is exceedingly clean. Typically, an alkaline medium (20–30% KOH) is used in the production of green hydrogen using electrolysis [117]. The reaction equations are shown in Equations (5)–(7).
C a t h o d e :   2 H 2 O + 2 e 2 O H + H 2
A n o d e : 2 O H 0.5 O 2 + H + + 2 e
O v e r a l l   R e a c t i o n : H 2 O   ( 0.5 ) O 2 + H 2
The reversible voltage and thermoneutral voltage for the whole-water decomposition reaction are represented by the Gibbs free energy and the enthalpy change [118]. According to thermochemistry, a discrepancy among these two values is caused by entropy changes and must be made stable by either adding heat to the system or removing it. The water breakdown reaction is an endothermic process, and heat from the environment is absorbed by the electrolysis cell if the cell voltage is below the thermoneutral voltage (but above the reversible voltage) [119]. Conversely, if the cell voltage is higher than the thermoneutral voltage, extra heat is produced, leading to energy inefficiency [120]. As a result, it is normally preferable to run the cell voltage as close to the thermoneutral voltage as possible. Since alkaline electrolysis currently has a current efficiency that is very near to 100% [116], the power required for the process is precisely proportional to the voltage of the cell. The cell voltage is given as [121]
E = E r e v + a + η c + η o h m
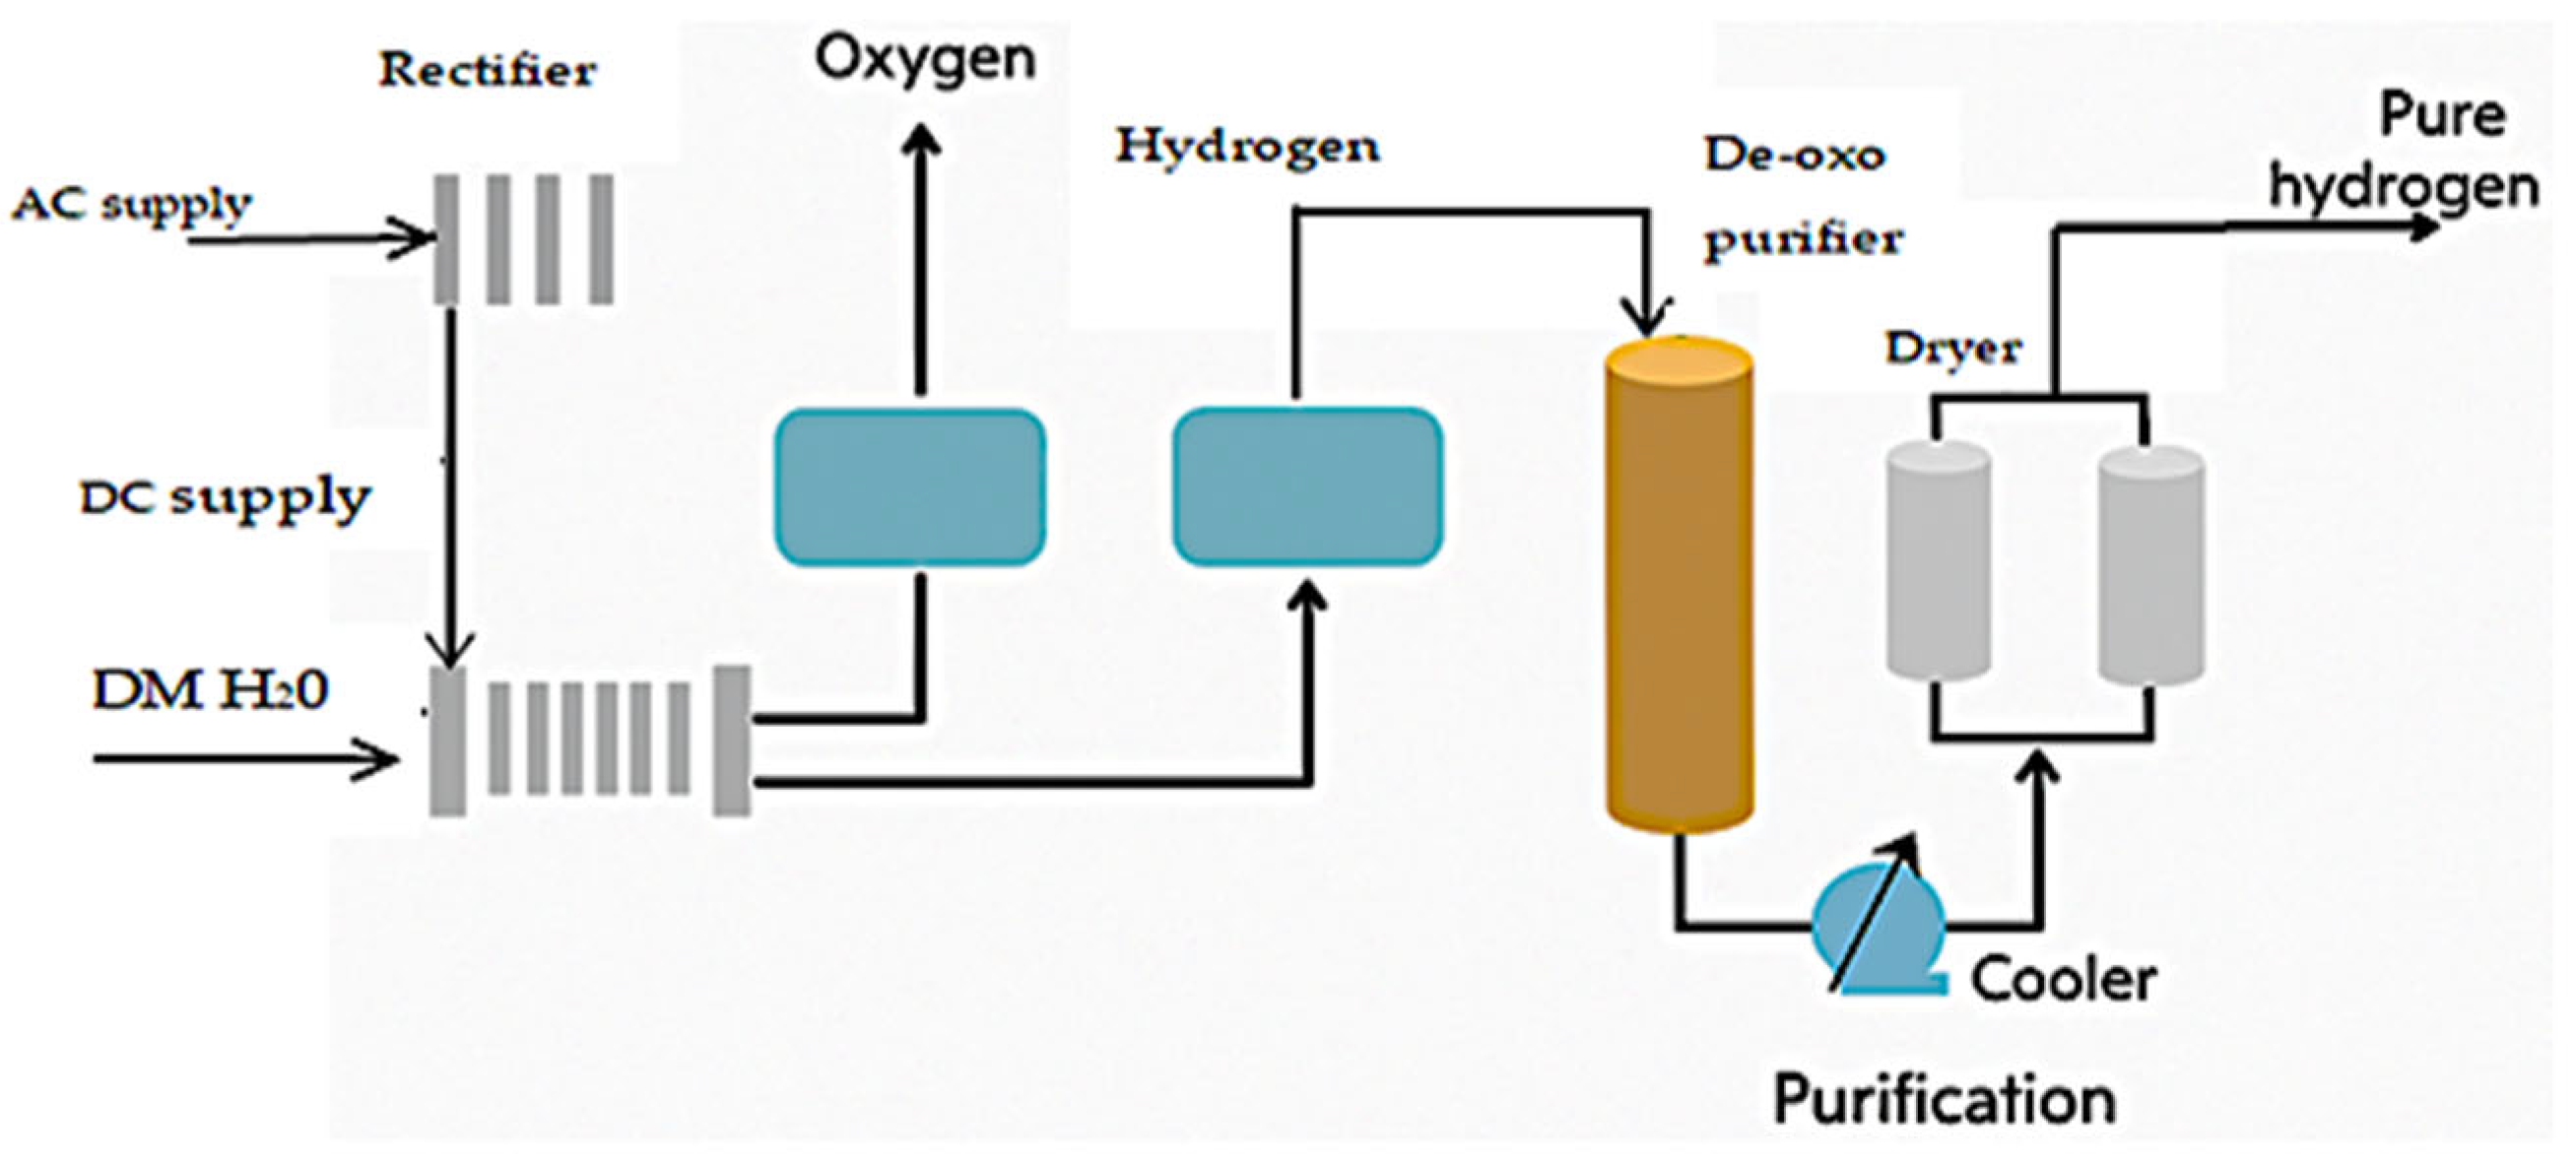
where Erev = reversible thermodynamics decomposition voltage; ⴄa = anode overpotential; ⴄc = cathode overpotential; and ⴄohm = ohmic drop between anodes. The voltage efficiency of current electrolysers is limited to between 68% and 80% since they operate between 343 K and 363 K and have a cell voltage of 1.8–2.2 V [122]. To increase the efficiency, the voltage across the anode and cathode should be reduced along with interelectrode resistance from the electrolyte, membrane and bubbles. There is an increase in cell voltage with a high current density above the density of 150 mA/cm2 due to the higher number of bubbles in the electrolyte, as the gas production linearly increases with current density [123]. Therefore, reducing the bubble residence time in the interelectrode gap to reduce the internal ohmic drop is necessary. The typical bubble size affects the drag and buoyancy force of the bubble movement, which affects the residence duration [124]. The cell configuration (electrode geometry and cell) and operational variables (electrolyte flow conditions, current density, pressure and temperature) both affect the bubble size in electrolytic systems [125]. A diagrammatic illustration of a typical water electrolysis process is shown in Figure 5.
Chatenet et al. [127] described alkaline electrolysers as the a widely deployed and the most mature water electrolysis technology, operating with aqueous potassium hydroxide (KOH) or sodium hydroxide (NaOH) electrolyte to produce H2 and O2 via the electrochemical splitting of water. The electrolyser typically uses porous diaphragm separators to prevent gas crossover while allowing ionic conductivity using non-noble catalysts such as Ni-based electrodes, which reduce the cost compared to that of proton exchange membrane systems [128]. Alkaline electrolysers are commercially available at sizes from kilowatts to multi-megawatts with efficiencies of 60–70% (based on a lower heating value), long operational durability and relatively low capital costs, making them a central technology for short-term low-carbon hydrogen production [129]. Their shortcomings lie in their lower energy efficiency and current density compared to PEM and SOE systems [125]. Alkaline electrolysers also have a poor response to variable power sources, hence limiting their use with intermittent renewable energy [130].
A proton exchange membrane (PEM) is a solid polymer electrolyte that conducts protons while acting as an electronic insulator and gas separator to allow efficient electrochemical conversion in fuel cells and electrolysers [131,132]. PEMs typically comprise perfluorosulfonic acid polymers such as Nafion to facilitate proton transport from the anode to the cathode under hydrated conditions while preventing crossover of reactant gases [133]. Alam Rimon [134] observed their high proton conductivity, chemical stability and thin-film form, which make them central to low-temperature fuel cell technologies, where they enable a compact design, rapid start-up and high power density. PEM electrolysers also have comparable energy consumption when operating at higher output pressures and varying load conditions [135]. But their limitations, as noted by Wang and Yang [136], are high cost and reduced durability and performance under low-humidity or high-temperature operations.
Solid oxide electrolysers (SOEs) are high-temperature electrochemical devices that enable efficient water and CO2 electrolysis to produce hydrogen or syngas [137]. Operating normally at temperature ranges of 700–900 °C, they utilise a solid ceramic electrolyte, most commonly yttria-stabilised zirconia, which conducts oxygen ions while ensuring gas separation [138,139]. High temperatures reduce the required electrical energy input by supplying a significant fraction of the reaction enthalpy as heat, hence enhancing overall efficiency compared to low-temperature electrolysers [140]. SOEs are effective for integration with renewable or nuclear heat sources and have the potential for reversible operation as solid oxide fuel cells, making them a promising technology for sustainable hydrogen production and power-to-X applications [141]. Their downsides are that they are not yet largely commercialised and require extensive heat management and new system designs, because such systems are still largely in the developmental and laboratory stages [142].

2.2.2. Thermochemical Conversion Method of Producing Green Hydrogen

Thermochemical direct conversion takes place at a high temperature (up to 1000 °C), which is needed for the fusion of water to dissociate into hydrogen and oxygen, resulting in exorbitant energy costs for heating, and the unstable mixture carries a significant danger of explosion [143]. Chemicals such as iron oxide are added to the process to lower the temperature, forming an intermediate in the association phase before the release of the hydrogen/oxygen dissociative processes independently [144,145]. Safari and Dincer [146] highlighted that unlike traditional low-temperature electrolysis that uses electricity, thermochemical cycles like sulphur–iodine (S–I) and copper–chlorine (Cu–Cl) cycles exploit thermal energy to drive part of the water-splitting reactions, hence reducing the electrical energy demand. Water reacts with other compounds at elevated temperatures in both cycles, decomposing and being reformed through a closed chemical loop, producing pure hydrogen and oxygen in the process [147]. Because heat energy accounts for most of the supplied energy rather than electricity, the total efficiency of the hydrogen can be enhanced, especially when coupled with high-temperature nuclear reactors or concentrated solar systems [148,149]. This allows for efficient use of intermittent renewable energy sources, where electricity from solar or wind energy can be balanced by heat from nuclear or concentrated solar systems [150]. The result is lower greenhouse gas emissions and a lower costs in large-scale green hydrogen production [151]. Thermochemical conversion could be a promising route in the portfolio of next-generation hydrogen technologies, bridging renewable heat with electrochemical water splitting [152]. However, thermochemical systems are very complex and involve multiple reaction steps and harsh chemical environments, which create challenges in finding durable, cost-effective reactor materials and catalysts that can withstand repeated cycling without rapid degradation [153]. Moreover, scaling up these systems is still at the research and pilot stage, meaning they face significant engineering, safety and economic barriers compared with more mature technologies like alkaline electrolysis or proton exchange membranes (PEMs) [154].
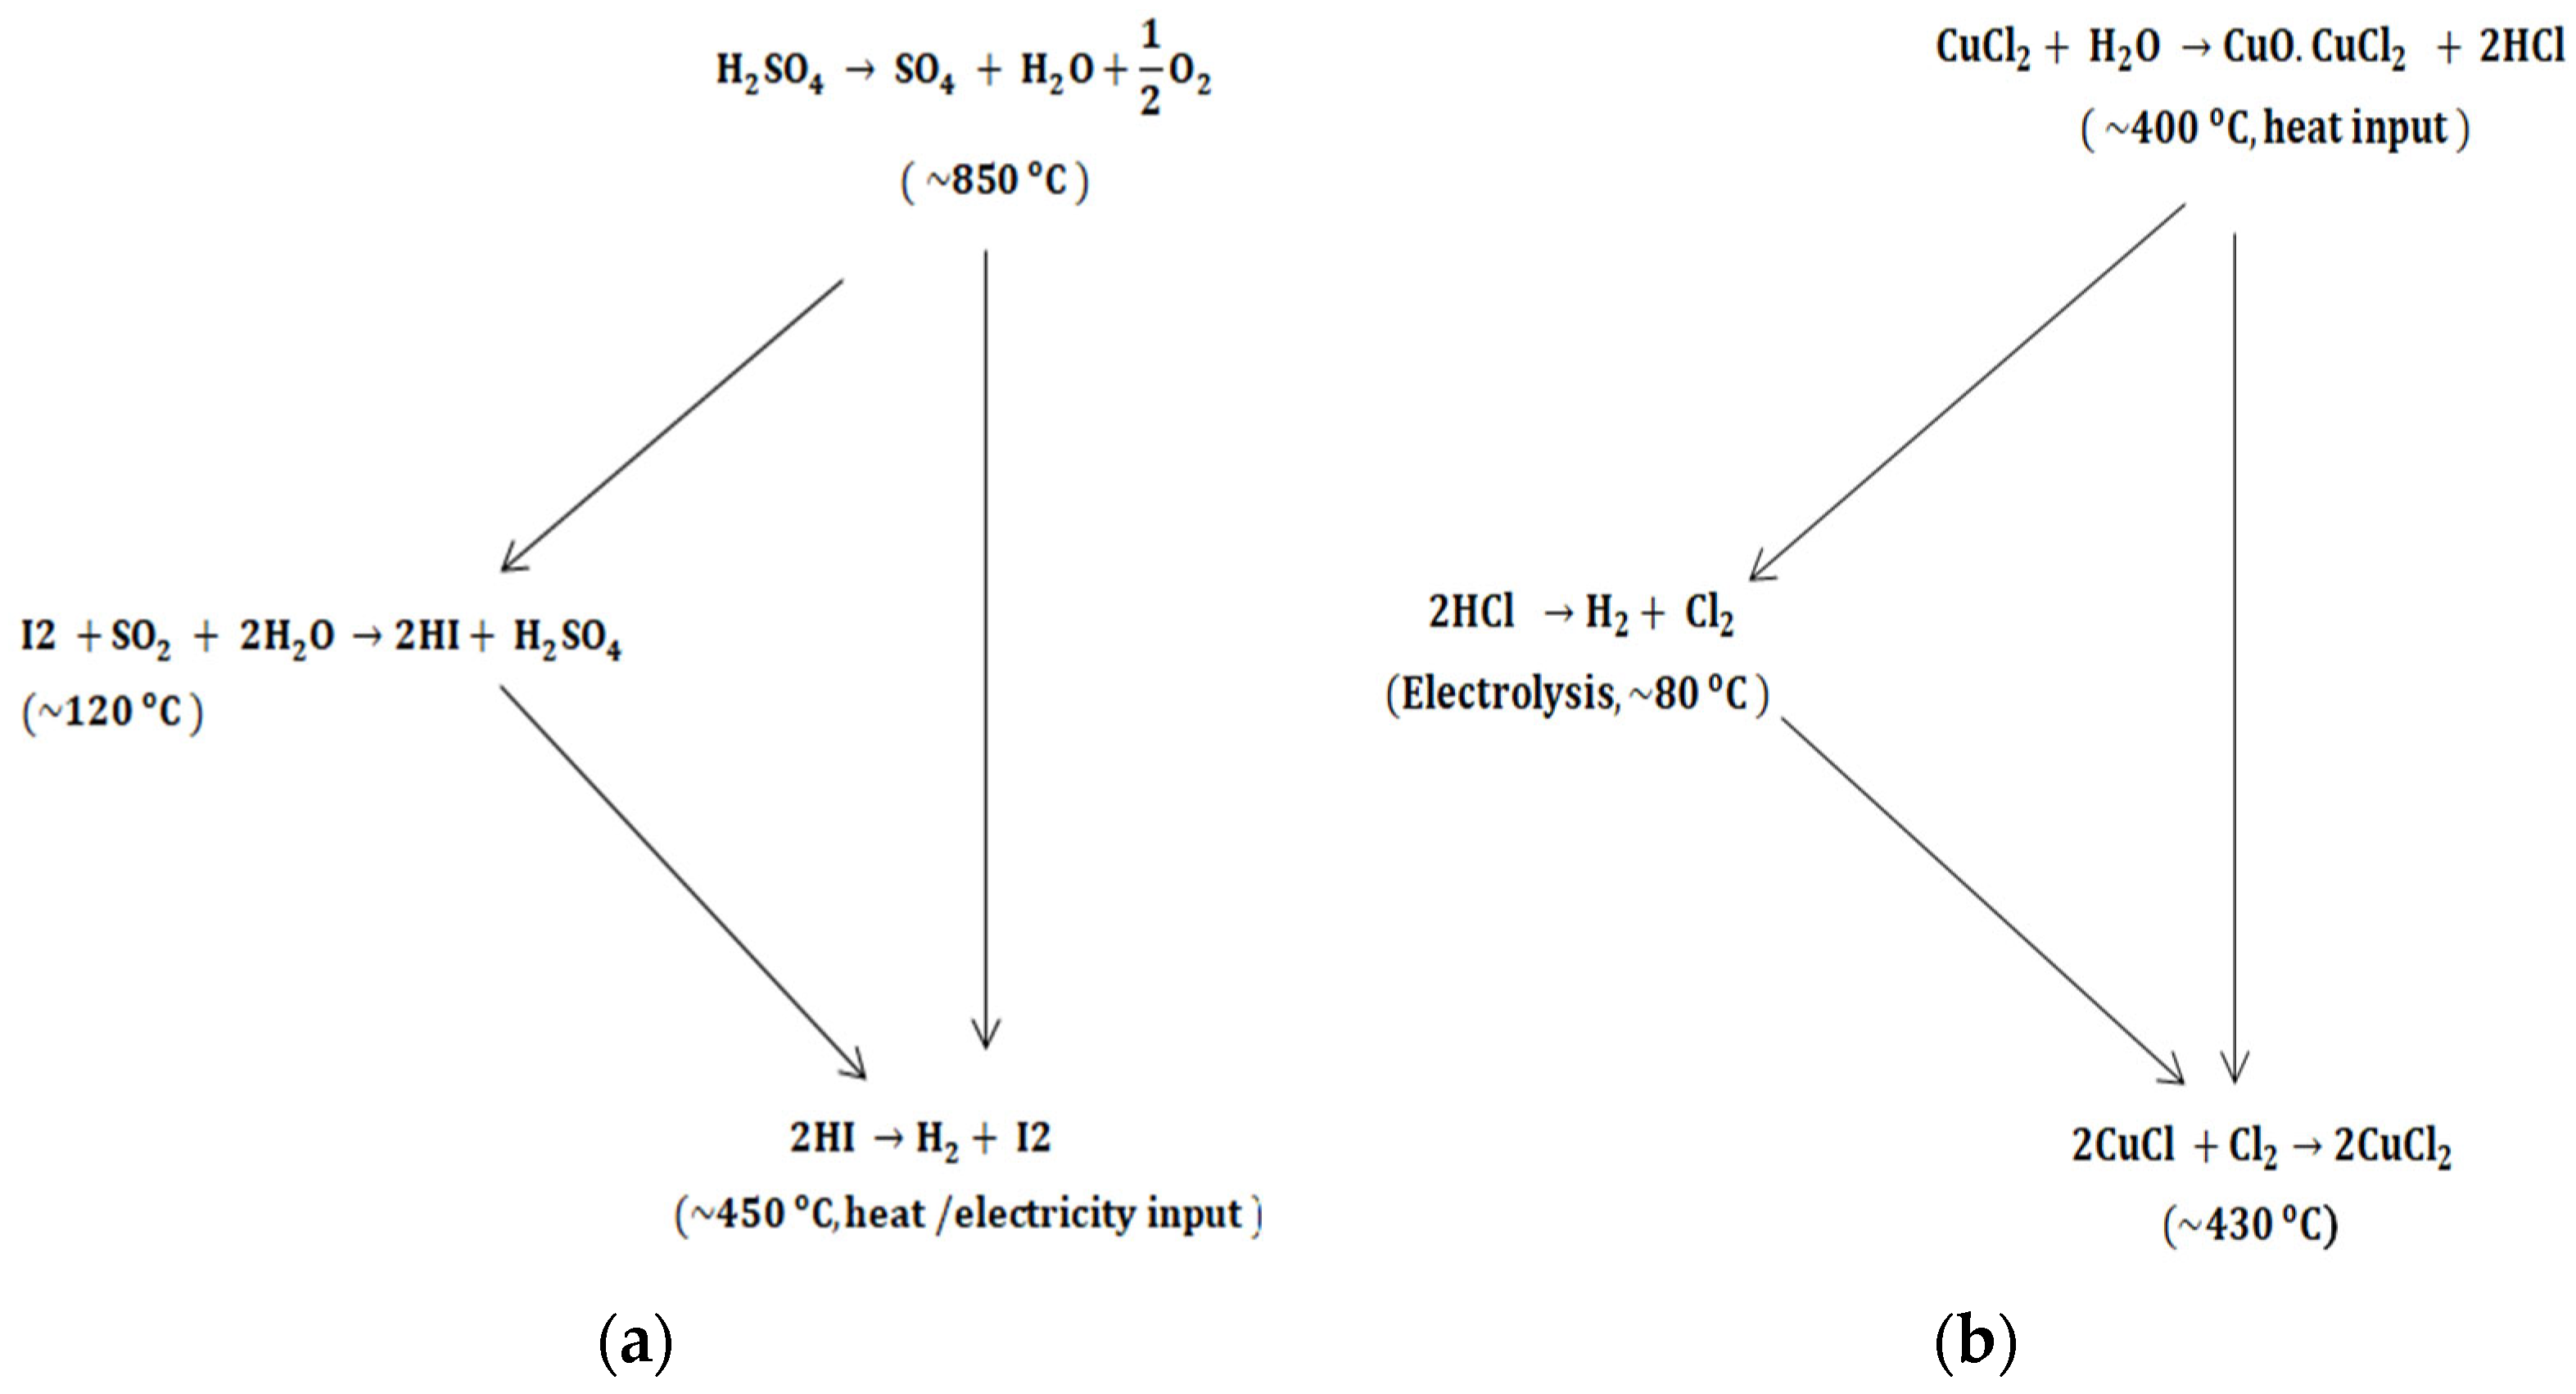
Figure 6a,b show the S–I and Cu–Cl thermochemical cycle, respectively, for hydrogen production. Figure 6a shows how high-temperature heat and limited electricity in the S–I cycle drive three main reactions in a closed loop, ultimately producing H2 and O2 with S and I compounds recycled [155]. The Cu–Cl cycle is attractive because, as shown in Figure 6b, it operates at moderate temperatures of 400–500 °C compared to the S–I cycle (~850 °C), integrating both heat and electrolysis to produce H2 efficiently [147].

2.2.3. Photochemical Conversion Method of Green Hydrogen Production

Photochemical conversion uses sunlight to drive chemical reactions to split water into H2 and O2 with the aid of semiconductor photocatalysts that generate electron–hole pairs under illumination [156]. A photochemical reactor is used in the photochemical conversion process to activate a photocatalyst when light strikes it [156]. However, to remove the light-generated electrons and transfer them to the system’s functional catalysts so they can utilise their potential energy, a number of components must be arranged in supramolecular complexes, much like in natural photosynthesis, where the dissociation of water is powered by solar energy [157,158]. The process involves light absorption; excitation of charge carriers; and separation and migration of electrons and holes, as well as their transfer to water molecules, to produce H2 and O2 [159]. Process efficiency is determined by how much the semiconductor material absorbs visible light, suppresses charge recombination and facilitates charge transfer to the water molecules [160]. A comprehensive review by Pei et al. [161] highlighted the development and modification of semiconductors like graphitic carbon nitride (C3N4), titanium dioxide (TiO2), cadmium sulphide (CdS) and zinc sulphide (ZnS) with strategies such as heterojunction formation to increase light harvesting in the visible spectrum to improve charge separation dynamics, thus enhancing H2 production rates. Integrating co-catalysts on the photocatalyst surface further reduces surface trap states, reduces photo-corrosion and improves overall reaction efficiency [162].
In water splitting, Li et al. [163] confirmed that when a semiconductor photocatalyst absorbs photons with energy equal to or greater than its band gap, an electron–hole pair is formed. The overall process reaction in a photochemical reaction is given as [164].
2 H 2 O 2 H 2 + O 2
Reduction at the conduction band and oxidation at the valence band are shown below [164]:
2 H + + 2 e H 2
2 H 2 O O 2 + 4 H + + 4 e
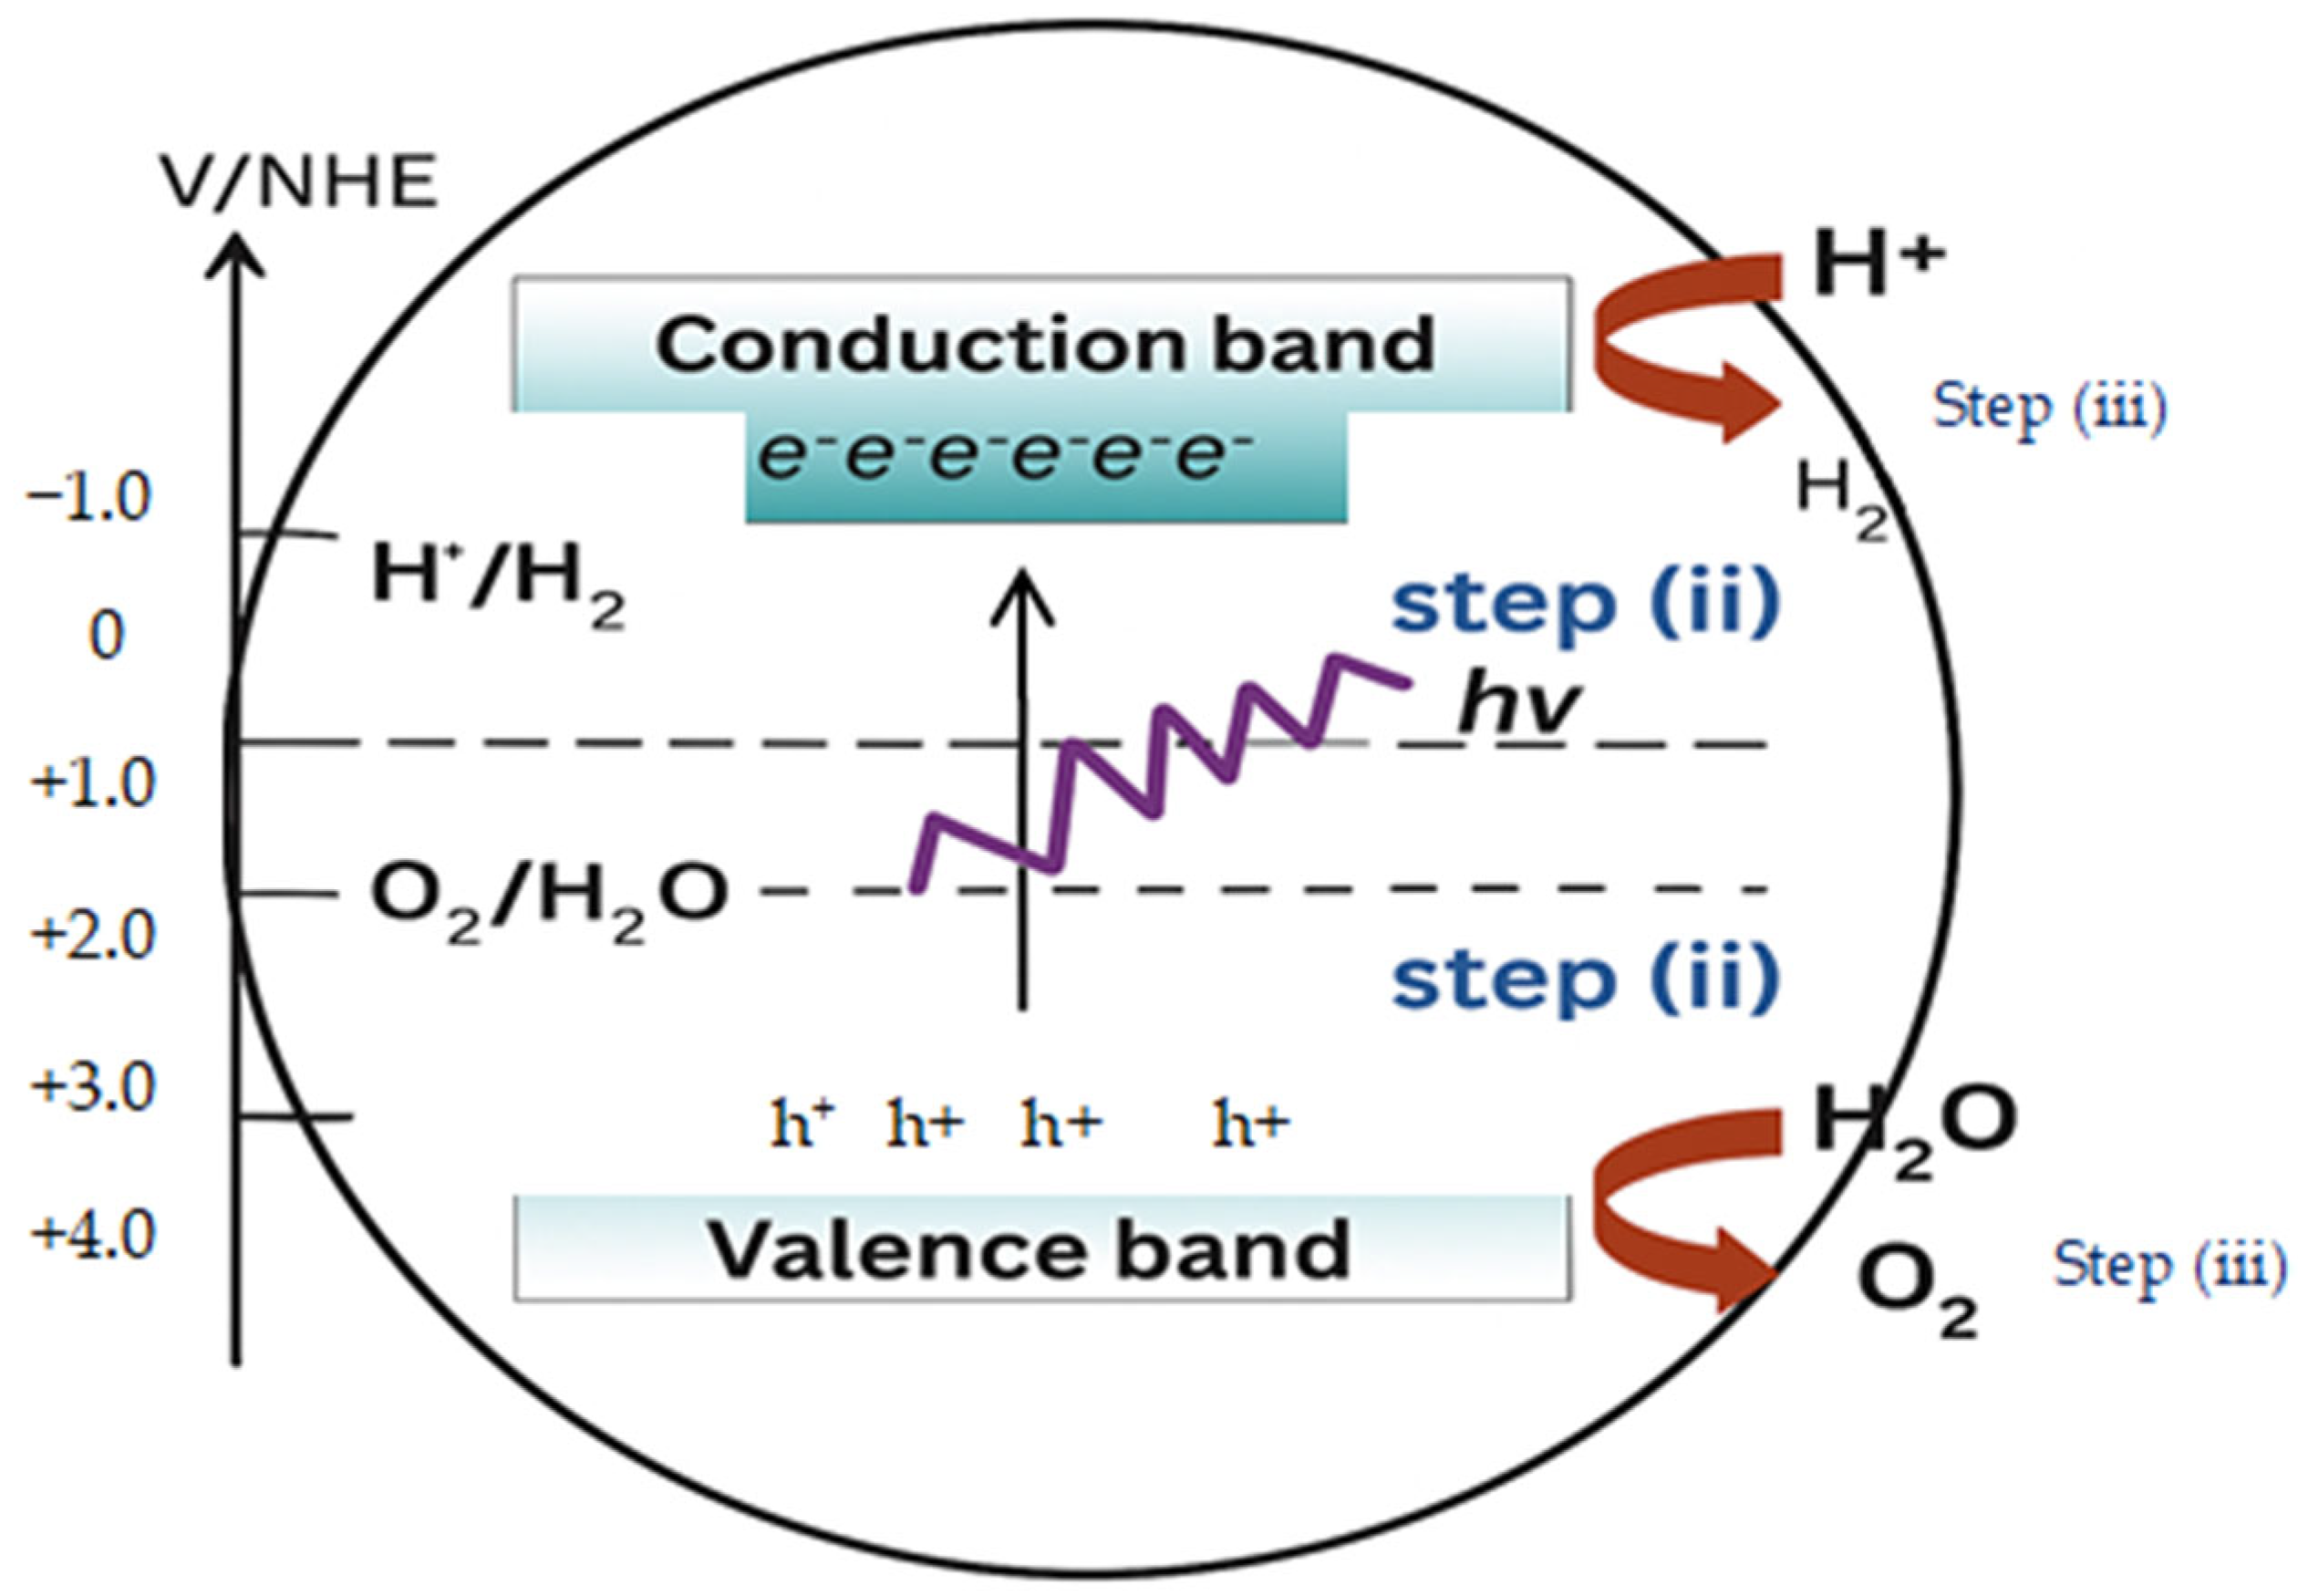
Figure 7 illustrates how the excited electrons move to the conduction band, where they reduce protons (H+) to H2 gas, while the corresponding holes in the valence band oxidise water molecules to O2 [165]. This process supports the production of solar hydrogen, often termed artificial photosynthesis, since it imitates the natural photosynthetic processes in green plants [166].
Photochemical conversion systems are conceptually simple, with no need for external circuits, membranes or complex electrode assemblies, unlike electrolysis. There is potential for low-cost, large-area hydrogen generation, especially if scalable, earth-abundant and stable photocatalysts are developed [167]. But current photochemical systems have problems of very low solar-to-hydrogen (STH) efficiencies (<1–2%), far below the 10% benchmark for commercial viability [168]. Photocatalysts also face stability issues, such as photocorrosion, and often require sacrificial agents that limit their practical deployment [169].

2.2.4. Photoelectrochemical Conversion

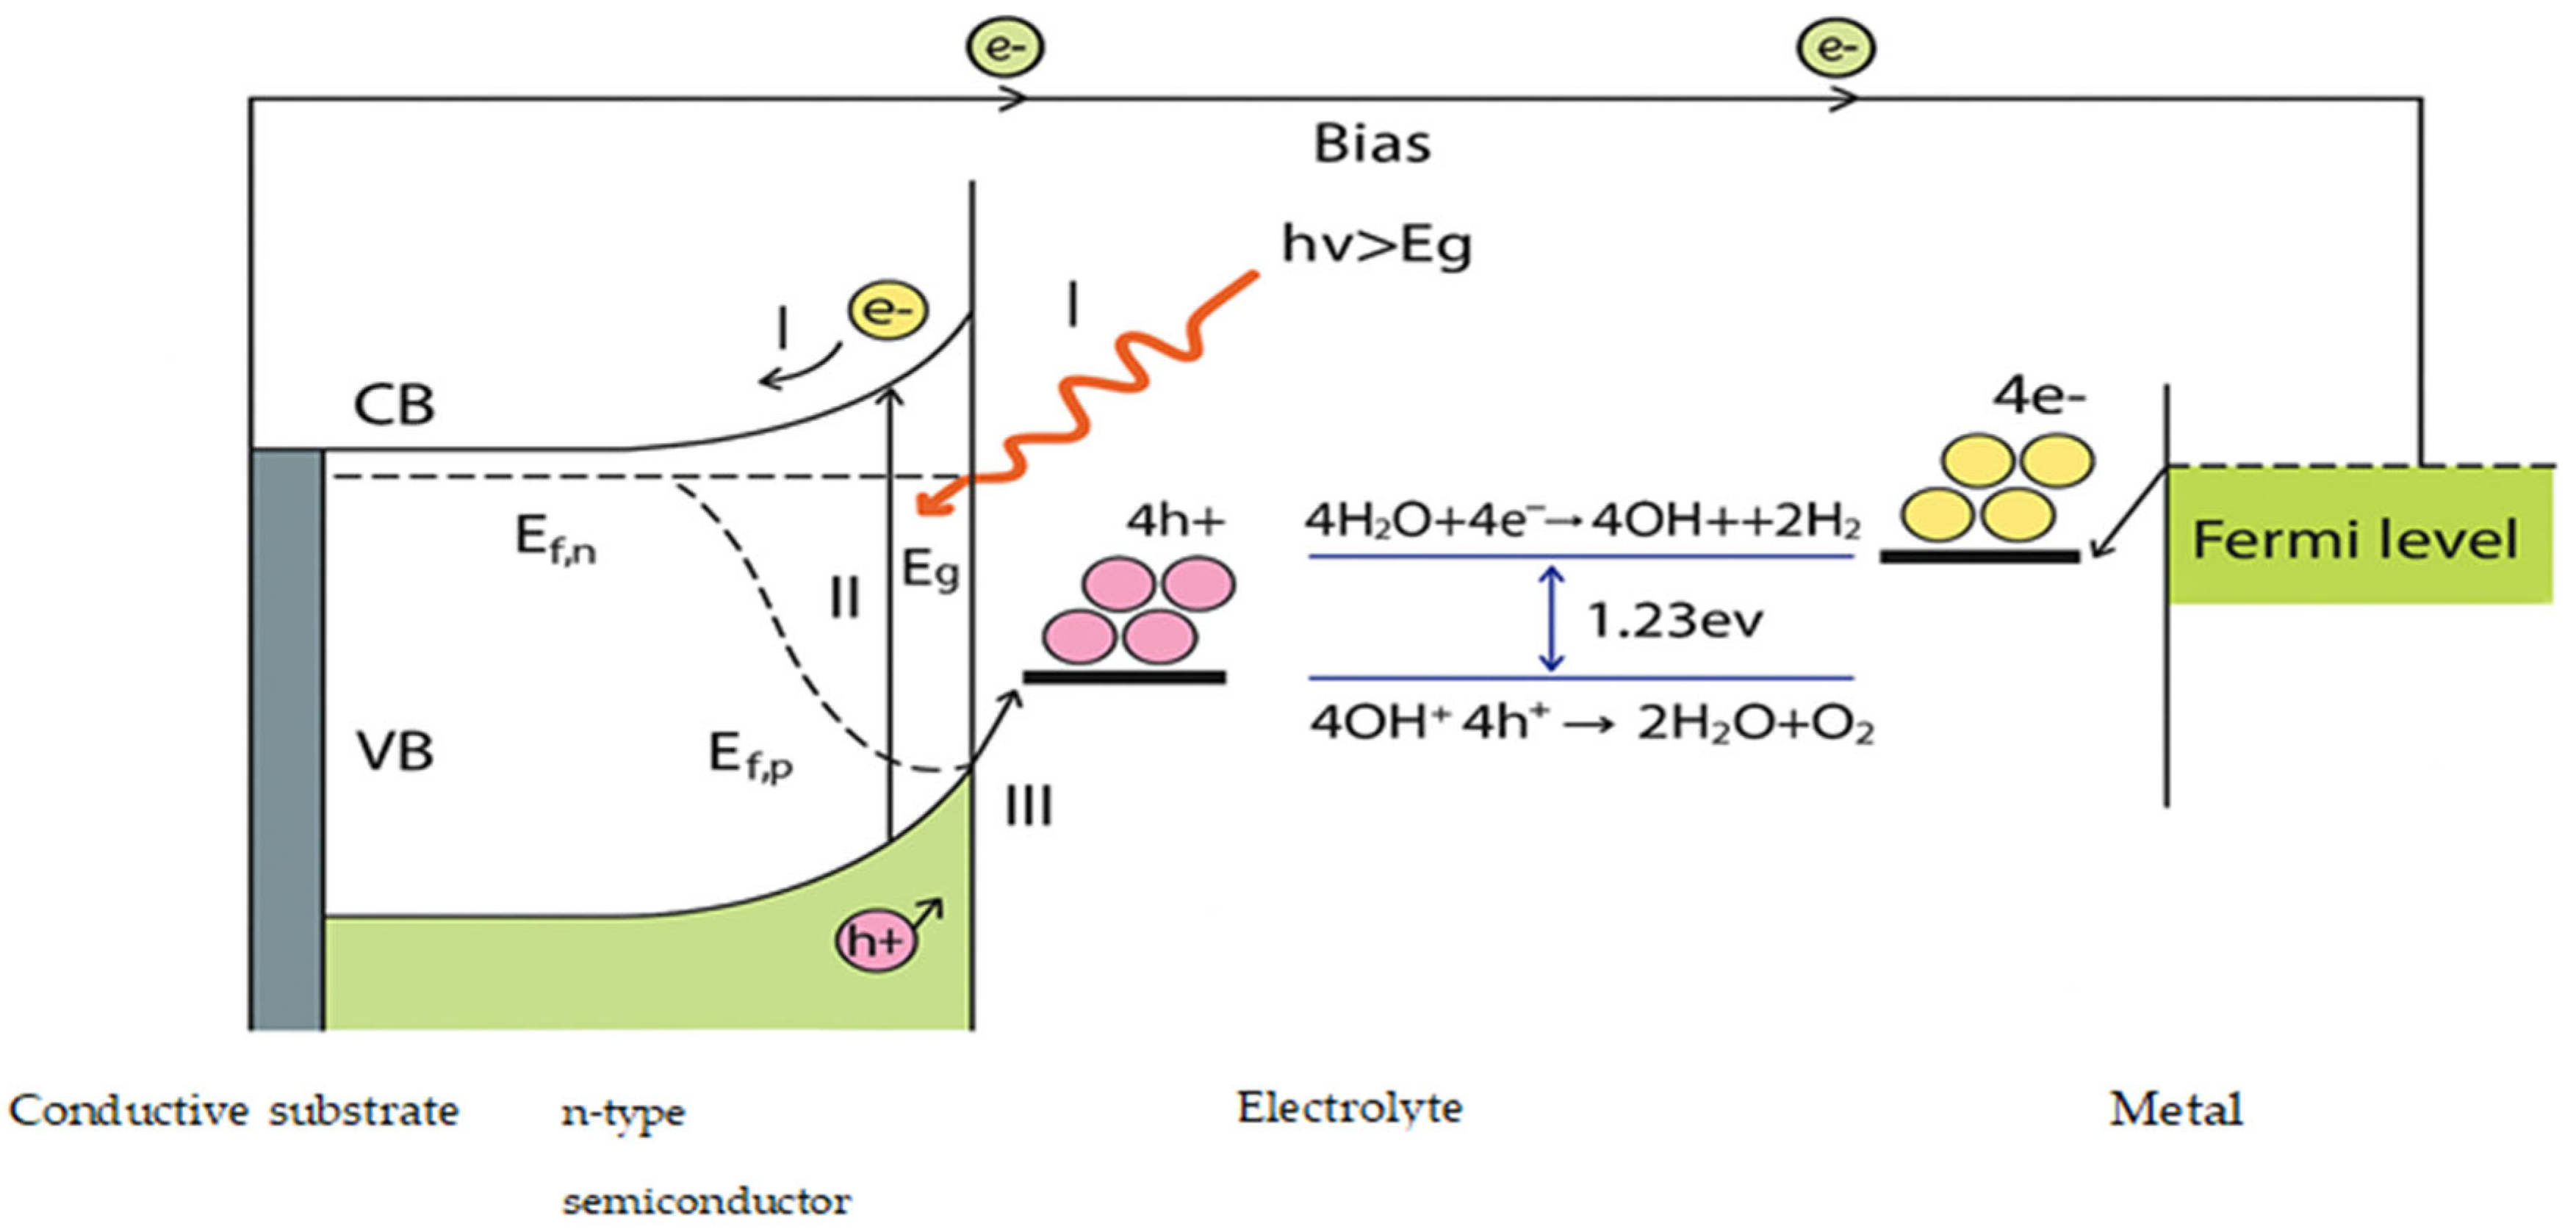
The photoelectrochemical (PEC) method uses sunlight directly through semiconductor photoelectrodes immersed in water, where absorbed photons produce electron–hole pairs that drive water-splitting reactions to produce H2 and O2 [170,171]. This technique starts with light absorption, where photons with energy above the semiconductor’s bandgap move electrons from the valence band to the conduction band [171]. Then there is charge separation and transport, in which photogenerated electrons and holes reach reactive sites without recombining [172]. Lastly, there are surface redox reactions, where electrons reduce protons to hydrogen (HER) at the cathode, and holes oxidise water to oxygen (OER) at the anode [173]. PEC water splitting utilises materials similar to photovoltaics, but these are embedded in aqueous electrolytes, as shown in Figure 8, to directly convert solar energy into chemical fuel with high potential for low or zero greenhouse gas emissions [174].
The overall water-splitting reaction is the same as Equation (9), which is the net PEC reaction where solar energy is converted into chemical energy stored in hydrogen [164]:
2 H 2 O 2 H 2 + O 2
At the photoanode where oxidation takes place, the photogenerated holes (h+) in the semiconductor oxidise water molecules into oxygen gas and in the process release protons and electrons. The oxygen evolution reaction (OER) equation is given below [172].
2 H 2 O + 4 h + O 2 + 4 H +
At the photocathode where reduction takes place, the electrons (e) generated by light absorption reduce protons into hydrogen gas. The hydrogen evolution reaction (HER) is given as [164]
2 H + + 2 e H 2
When there is semiconductor photoexcitation, described as when a semiconductor absorbs a photon (hv) with energy greater than the bandgap, the equation is given as [175]
S e m i c o n d u c t o r + h v e C B + h +
where e is the electron in the conduction band driving HER at the cathode, and h+ is the holes in the valence band driving OER at the anode.
PEC is regarded as one of the most efficient methods for producing hydrogen, but despite its promise, PEC hydrogen generation still faces significant challenges. Stability and efficiency are major barriers [176]. While theoretical solar-to-hydrogen (STH) efficiencies can approach approximately 30%, practical long-term stable cells barely exceed 8% due to problems like photocorrosion and unfavourable band edge positioning [177,178]. Some advancements that have been made to overcome these limitations are development of advanced materials such as heterojunctions, doped or nanostructured semiconductors and protective coatings [179]. Furthermore, there are also operando and in situ characterisation techniques to unravel reaction mechanisms, charge transfer pathways and degradation processes. Additionally, emerging research is looking at the possibility of using carbon-based and organic semiconductor materials to strike a better balance between solar absorption, charge separation surface reaction kinetics and durability [180].

2.3. Comparison of Green and Blue Hydrogen Emissions

Green hydrogen produces very low amount of carbon emissions, which is attributed to the manufacturing of renewable energy infrastructure, like solar panels and wind turbines, and the electrolysis equipment itself [181]. The carbon footprint of green hydrogen is influenced by emissions from the manufacturing of renewable energy components, the carbon intensity of any grid electricity integrated into the process and the energy efficiency of the electrolyser itself [182]. This implies that the overall life-cycle emissions for green hydrogen production are tied to the upstream emissions of building the renewable infrastructure and the effectiveness of the conversion process [183]. Generally, low emissions from green hydrogen make it particularly attractive for hard-to-abate sectors, where the displacement of fossil-based hydrogen can yield significant decarbonisation benefits [184]. Blue hydrogen, in contrast, is derived from natural gas through processes such as SMR, autothermal reforming (ATR), CH4 pyrolysis, coal gasification syngas chemical looping (SCL), and chemical looping reforming (CLR) integrated with CCUS. While CCUS reduces emissions compared with unabated fossil routes, its performance depends heavily on capture efficiency, upstream CH4 leakage and the permanence of CO2 storage [71]. A typical blue hydrogen system still produces emissions due to residual process emissions and fugitive CH4 along the natural gas supply chain [185]. Hence, while blue hydrogen can act as a transitional decarbonisation option according to Ameli et al. [186], only green hydrogen offers a fully sustainable, long-term solution consistent with climate neutrality targets according to Angelico et al. [187].
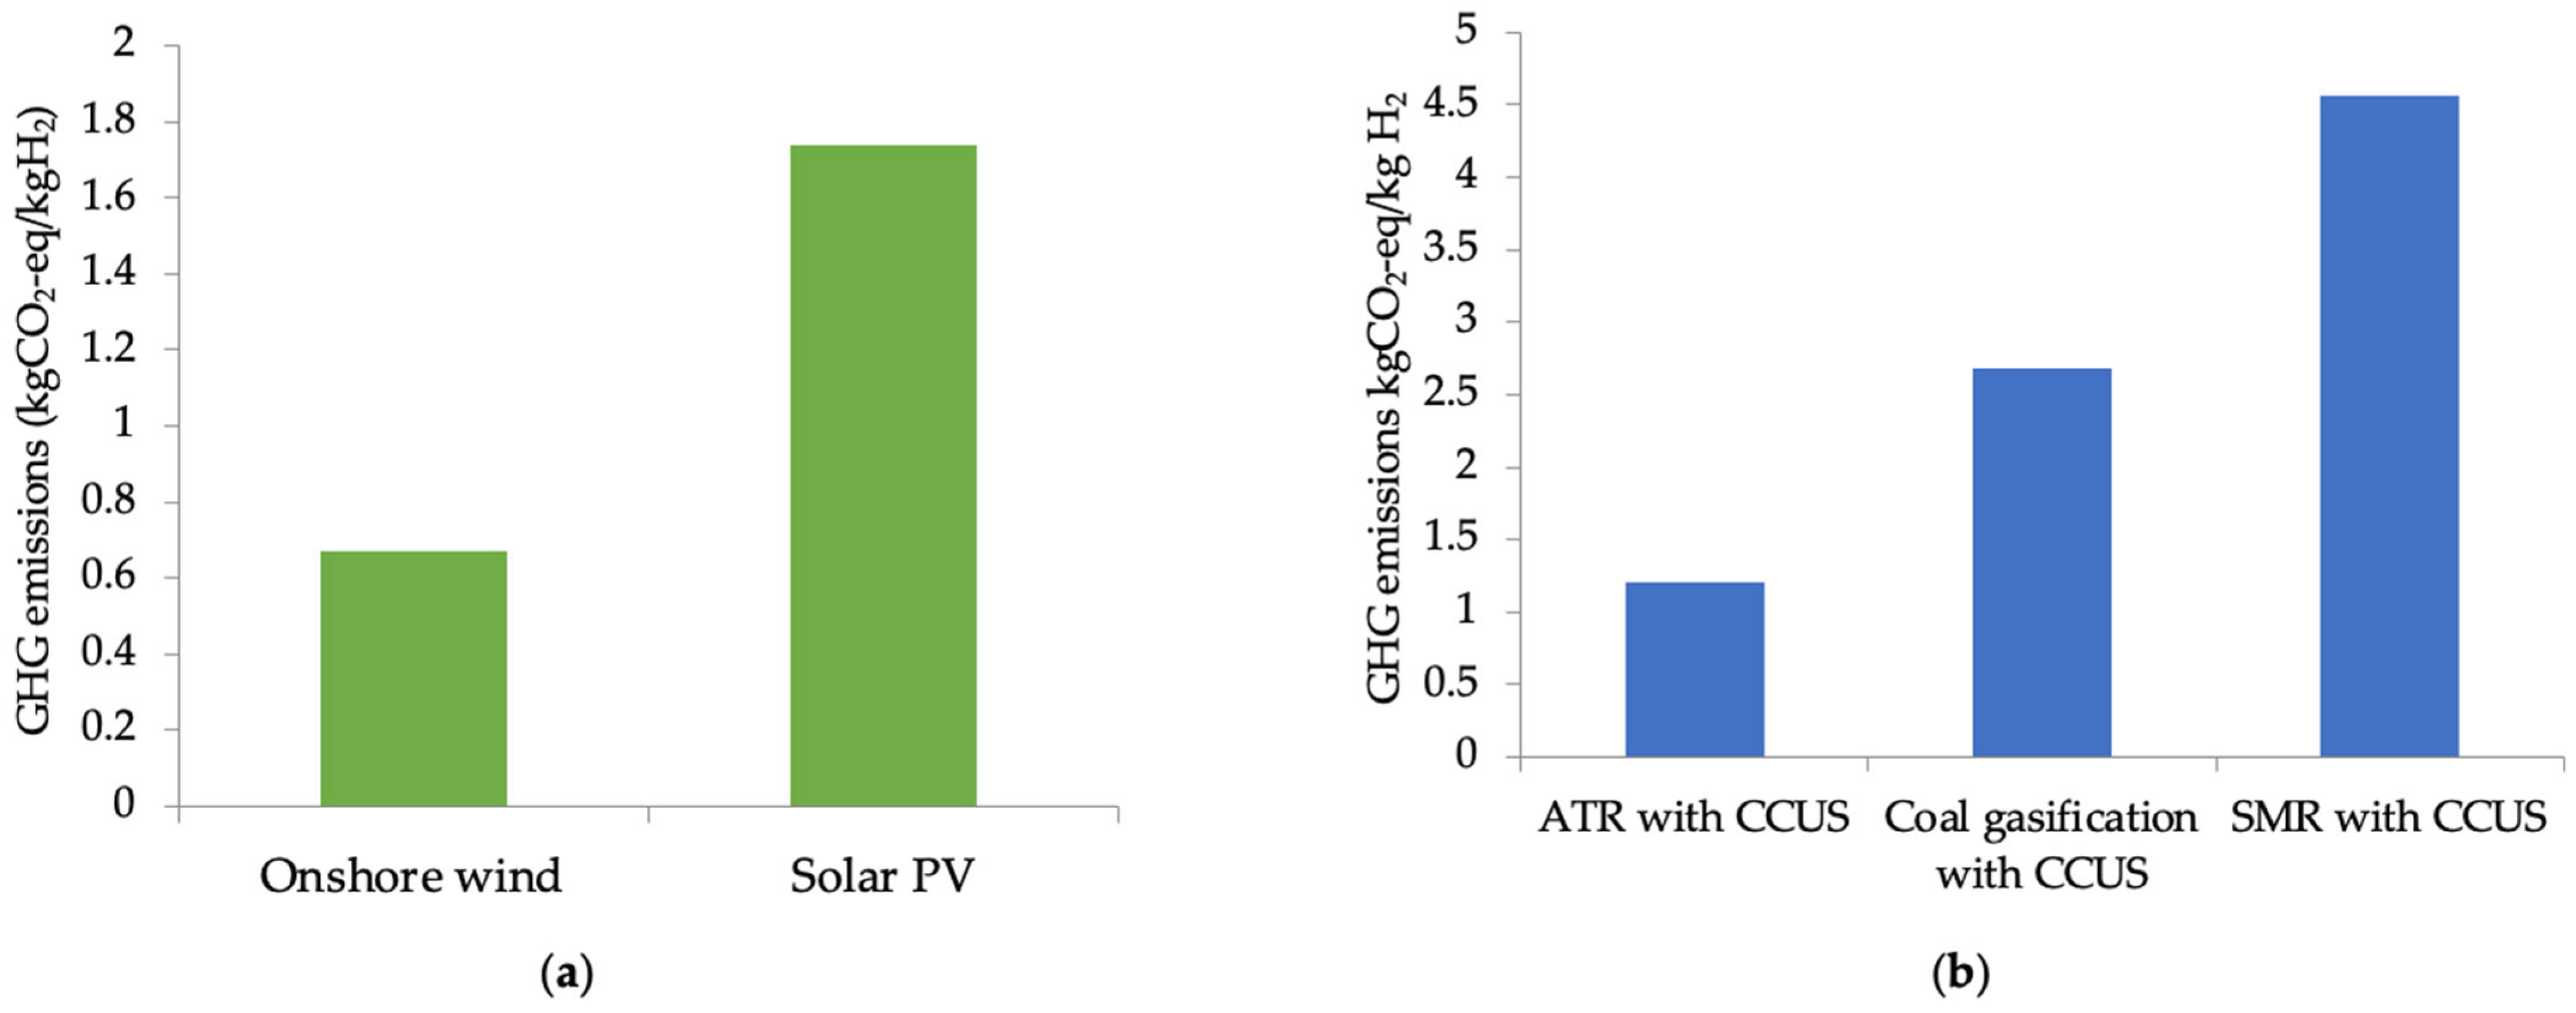
Figure 9a illustrates CO2 emissions from green hydrogen production from electrolysis of water using onshore wind and solar photovoltaic (PV) energy sources with a range of 0.67 kgCO2-eq/kgH2 to 1.74 kgCO2-eq/kgH2. Figure 9b summarises CO2 emissions from blue hydrogen production processes involving SMR with CCUS, coal gasification with CCUS, and autothermal reforming (ATR) with CCUS, with emissions ranging from 1.21 kgCO2-eq/kgH2 to 4.56 kg CO2-eq/kg H2.

3. Global Production of Hydrogen

The attention given to production of blue and green hydrogen is growing significantly because of the need to decarbonize various sectors and transition towards sustainable energy solutions. In 2023, global hydrogen production reached 97 million metric tons per annum (Mtpa), with less than 1% derived from low-emission sources [188,189]. Bal [190] noted that blue hydrogen, produced by SMR or coal gasification combined with CCS, is emerging as a transitional solution. It leverages existing energy infrastructure while reducing carbon emissions and offering a pathway to lower-emission hydrogen production [191]. The United States, for instance, is advancing blue hydrogen projects incentivised by tax credits and planning to scale up production in the coming years [73,192].
On the other hand, green hydrogen, mostly produced via water electrolysis powered by renewable energy sources, represents a long-term solution for a totally sustainable global hydrogen economy. But despite ambitious targets, development of the green hydrogen project has challenges such as financing gaps, technological barriers and policy uncertainties [193]. Hence, the current production of green hydrogen is limited due to high costs and technical barriers. In 2024, global electrolyser capacity reached 1.4 gigawatts, with China leading in terms of committed projects [188]. Odenweller and Ueckerdt [194] noted that only 2% of global capacity announcements were completed on schedule, highlighting a significant implementation gap. Regions with abundant renewable resources like Chile and Brazil are nevertheless developing strategies to become leading exporters of green hydrogen by 2040 [195].

3.1. Global Production of Green and Blue Hydrogen

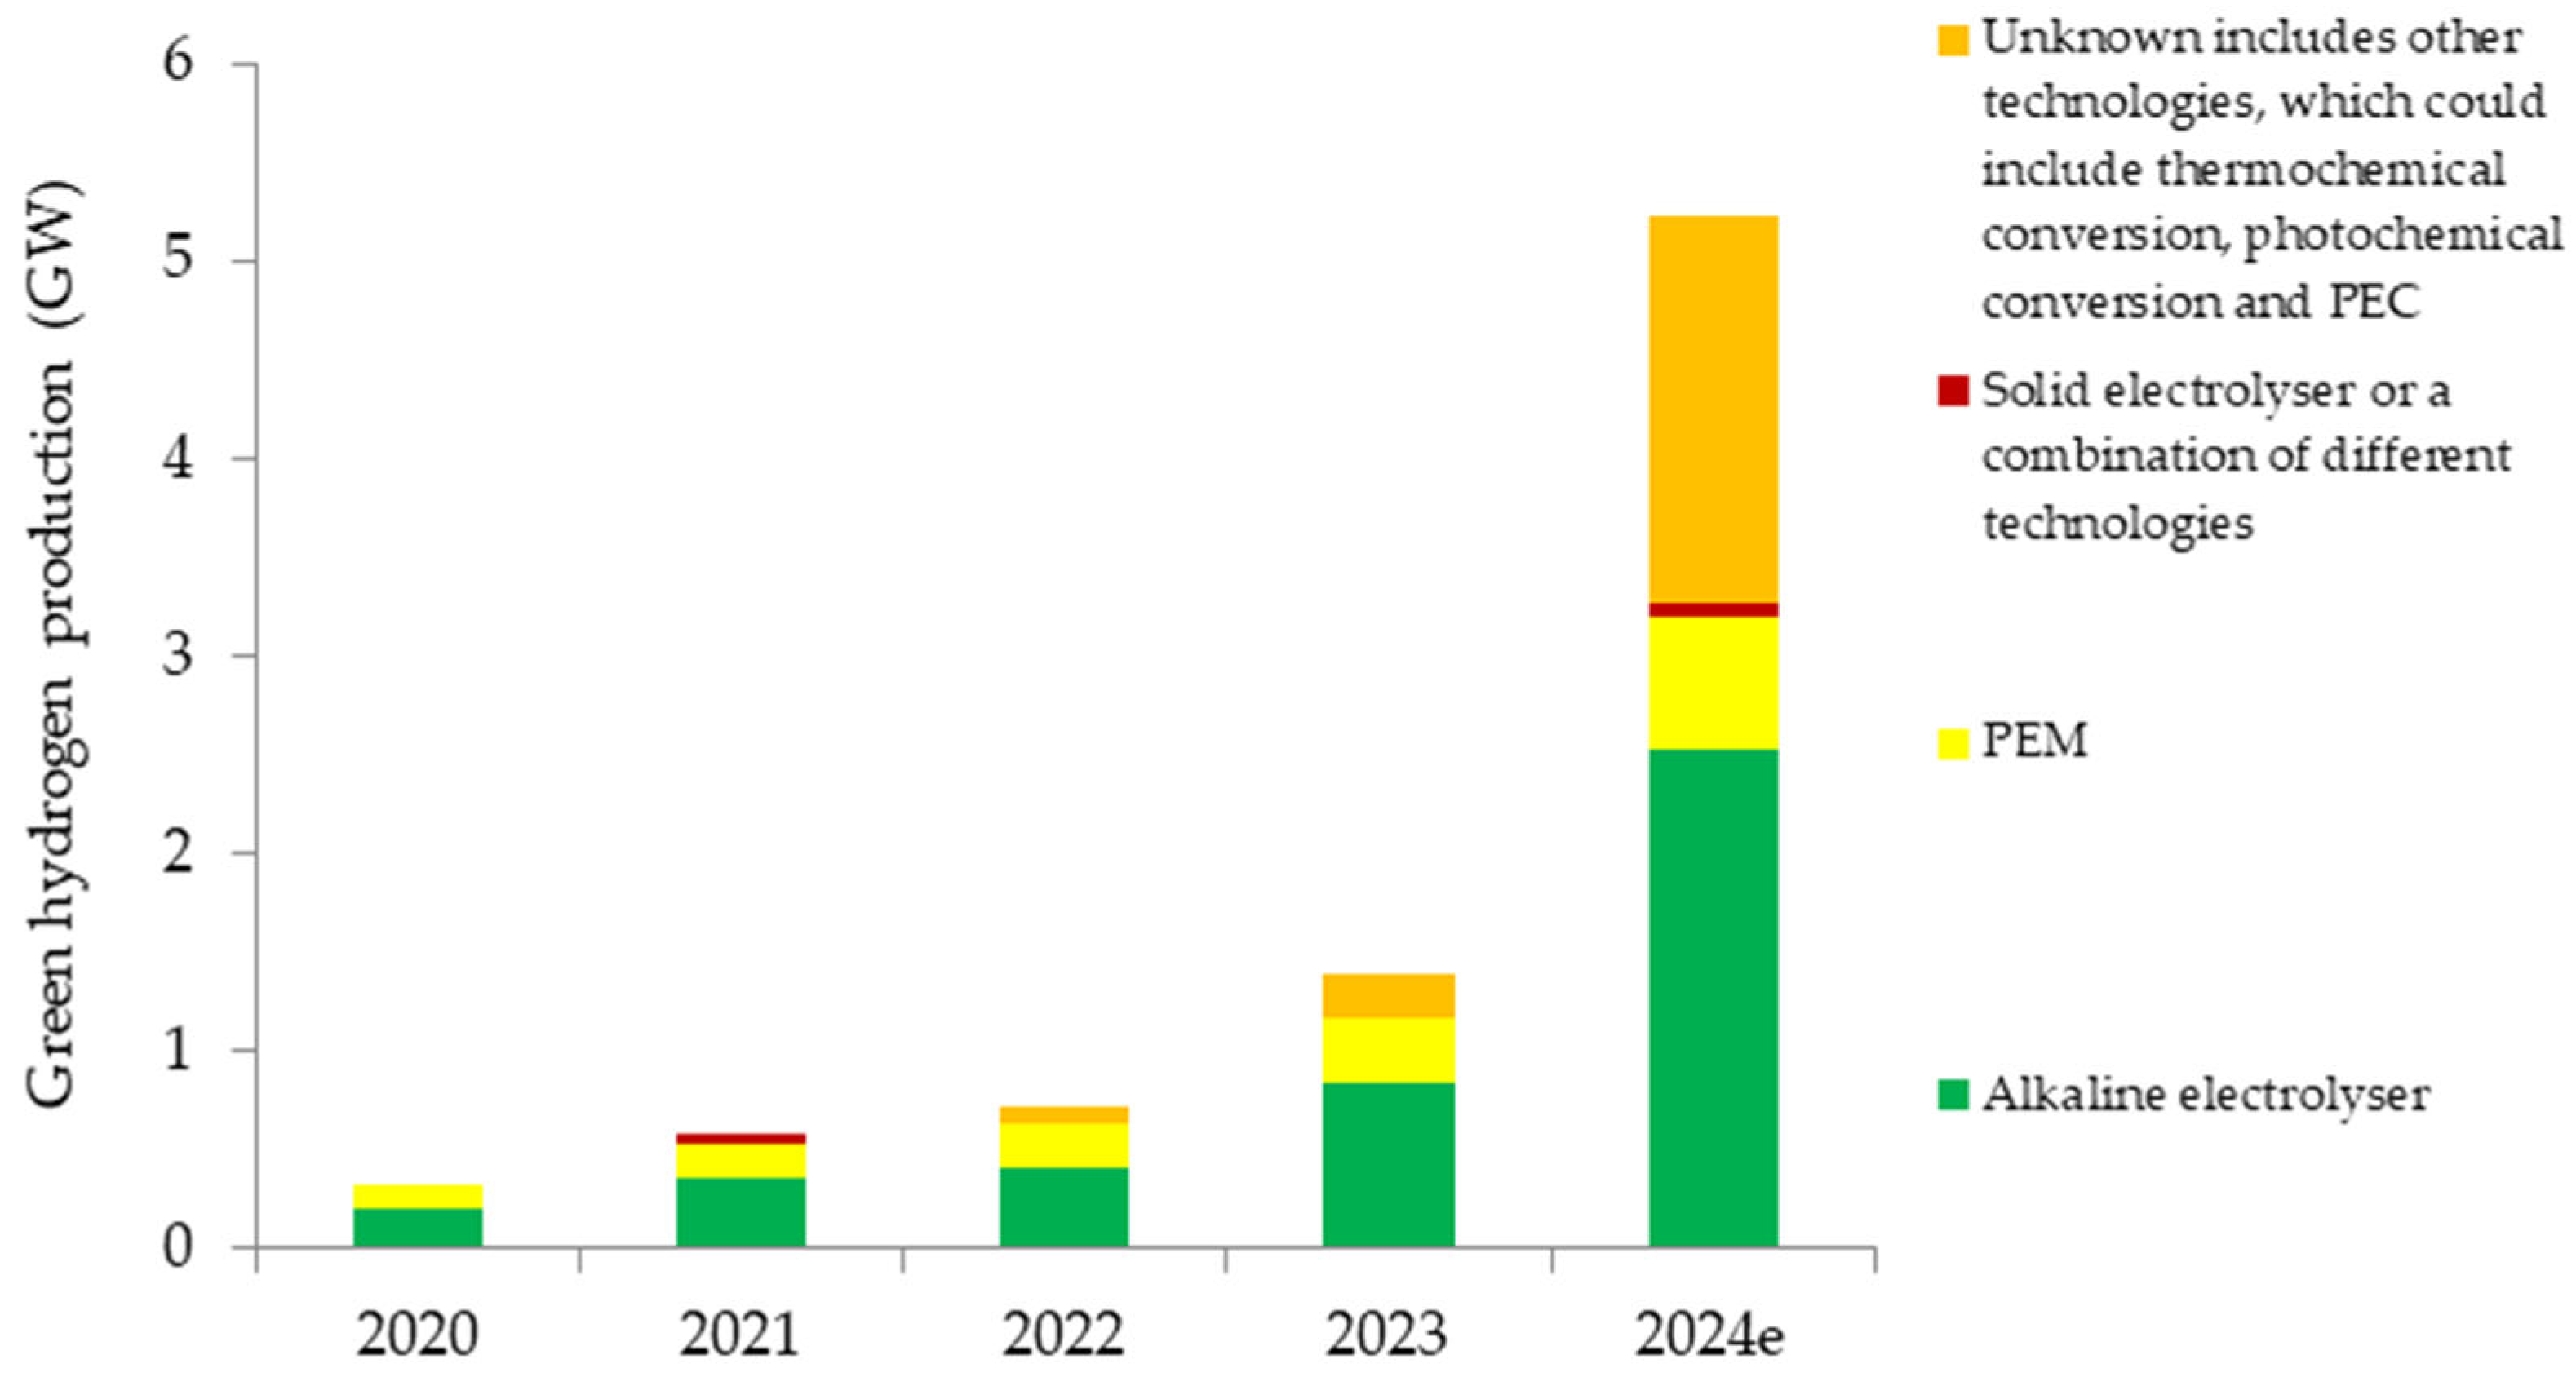
Low-emission hydrogen production has grown marginally since 2023 and under 1 Mtpa H2, which accounts for less than 1% of global production [188]. Low-emission hydrogen depends mostly on production from fossil fuels with CCUS [196]. Electrolytic hydrogen production accounts for only a very small share of the total, remaining below 100 kilo ton (kt) of hydrogen in 2023. Alkaline electrolyser technology has the largest share, accounting for more than 60% of the installed electrolyser capacity in 2023, followed by PEM with 22%, as seen in Figure 10 [188]. Several projects using electrolysers have now begun operations, for instance, the 50 MW electrolyser in the United States and the 10 MW electrolyser at the Szazhalombatta refinery in Hungary [188].
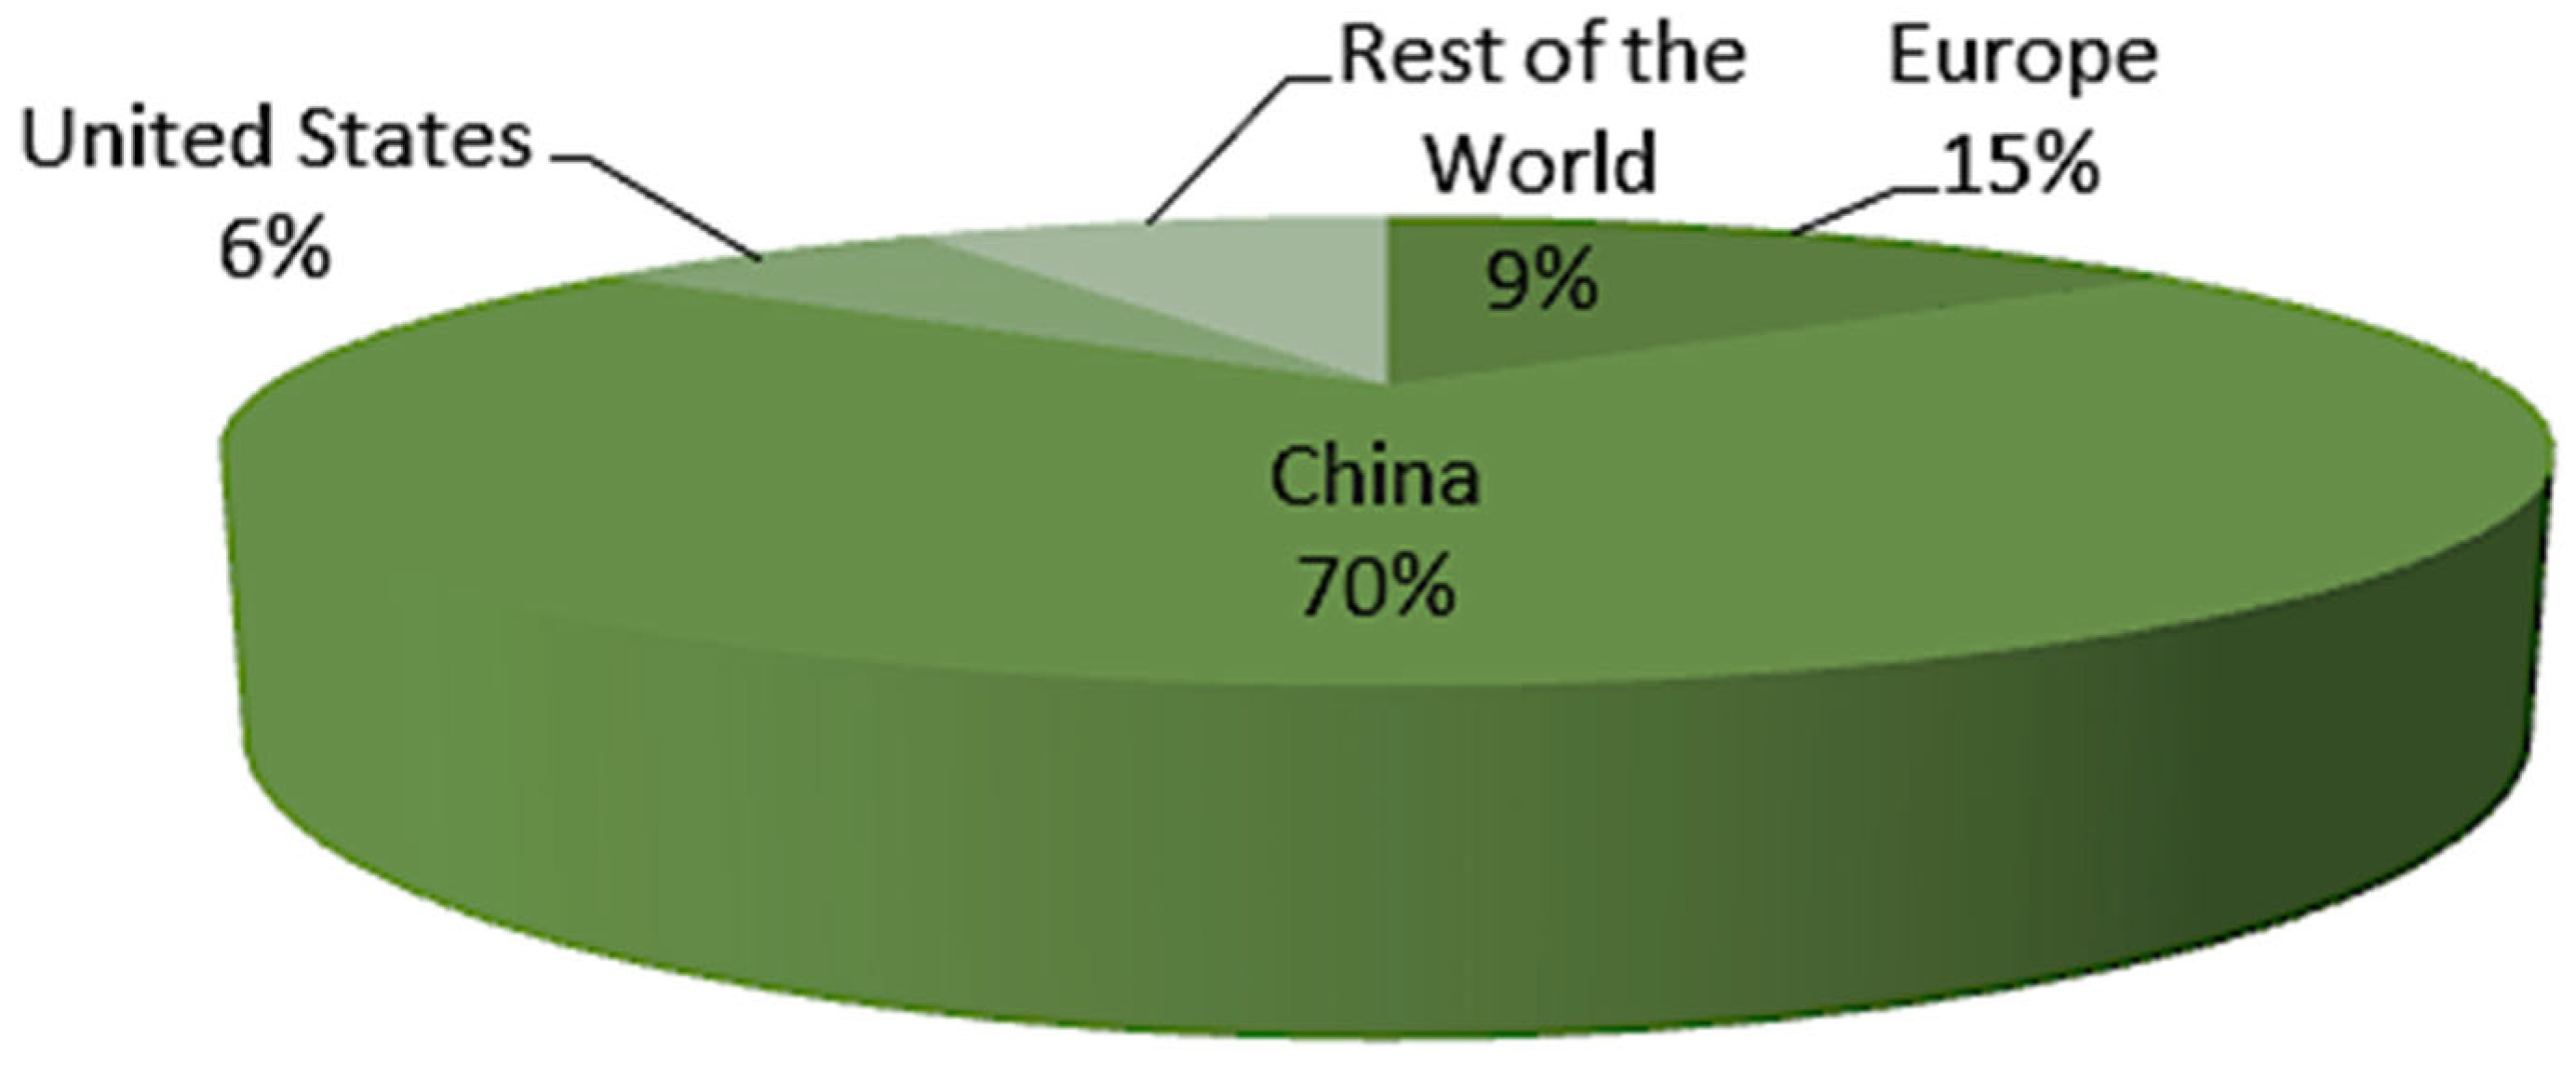
Most electrolytic hydrogen comes from China, Europe and the United States, which together produce around 75% of global electrolytic hydrogen [188], as seen in Figure 11. However regional distribution dynamics are changing, with regions with good renewable resources such as Latin America and Africa investing, and each of these regions’ electrolytic hydrogen production could potentially increase to represent 17% of the total global installed capacity, from just 65 MW of the current total [197].
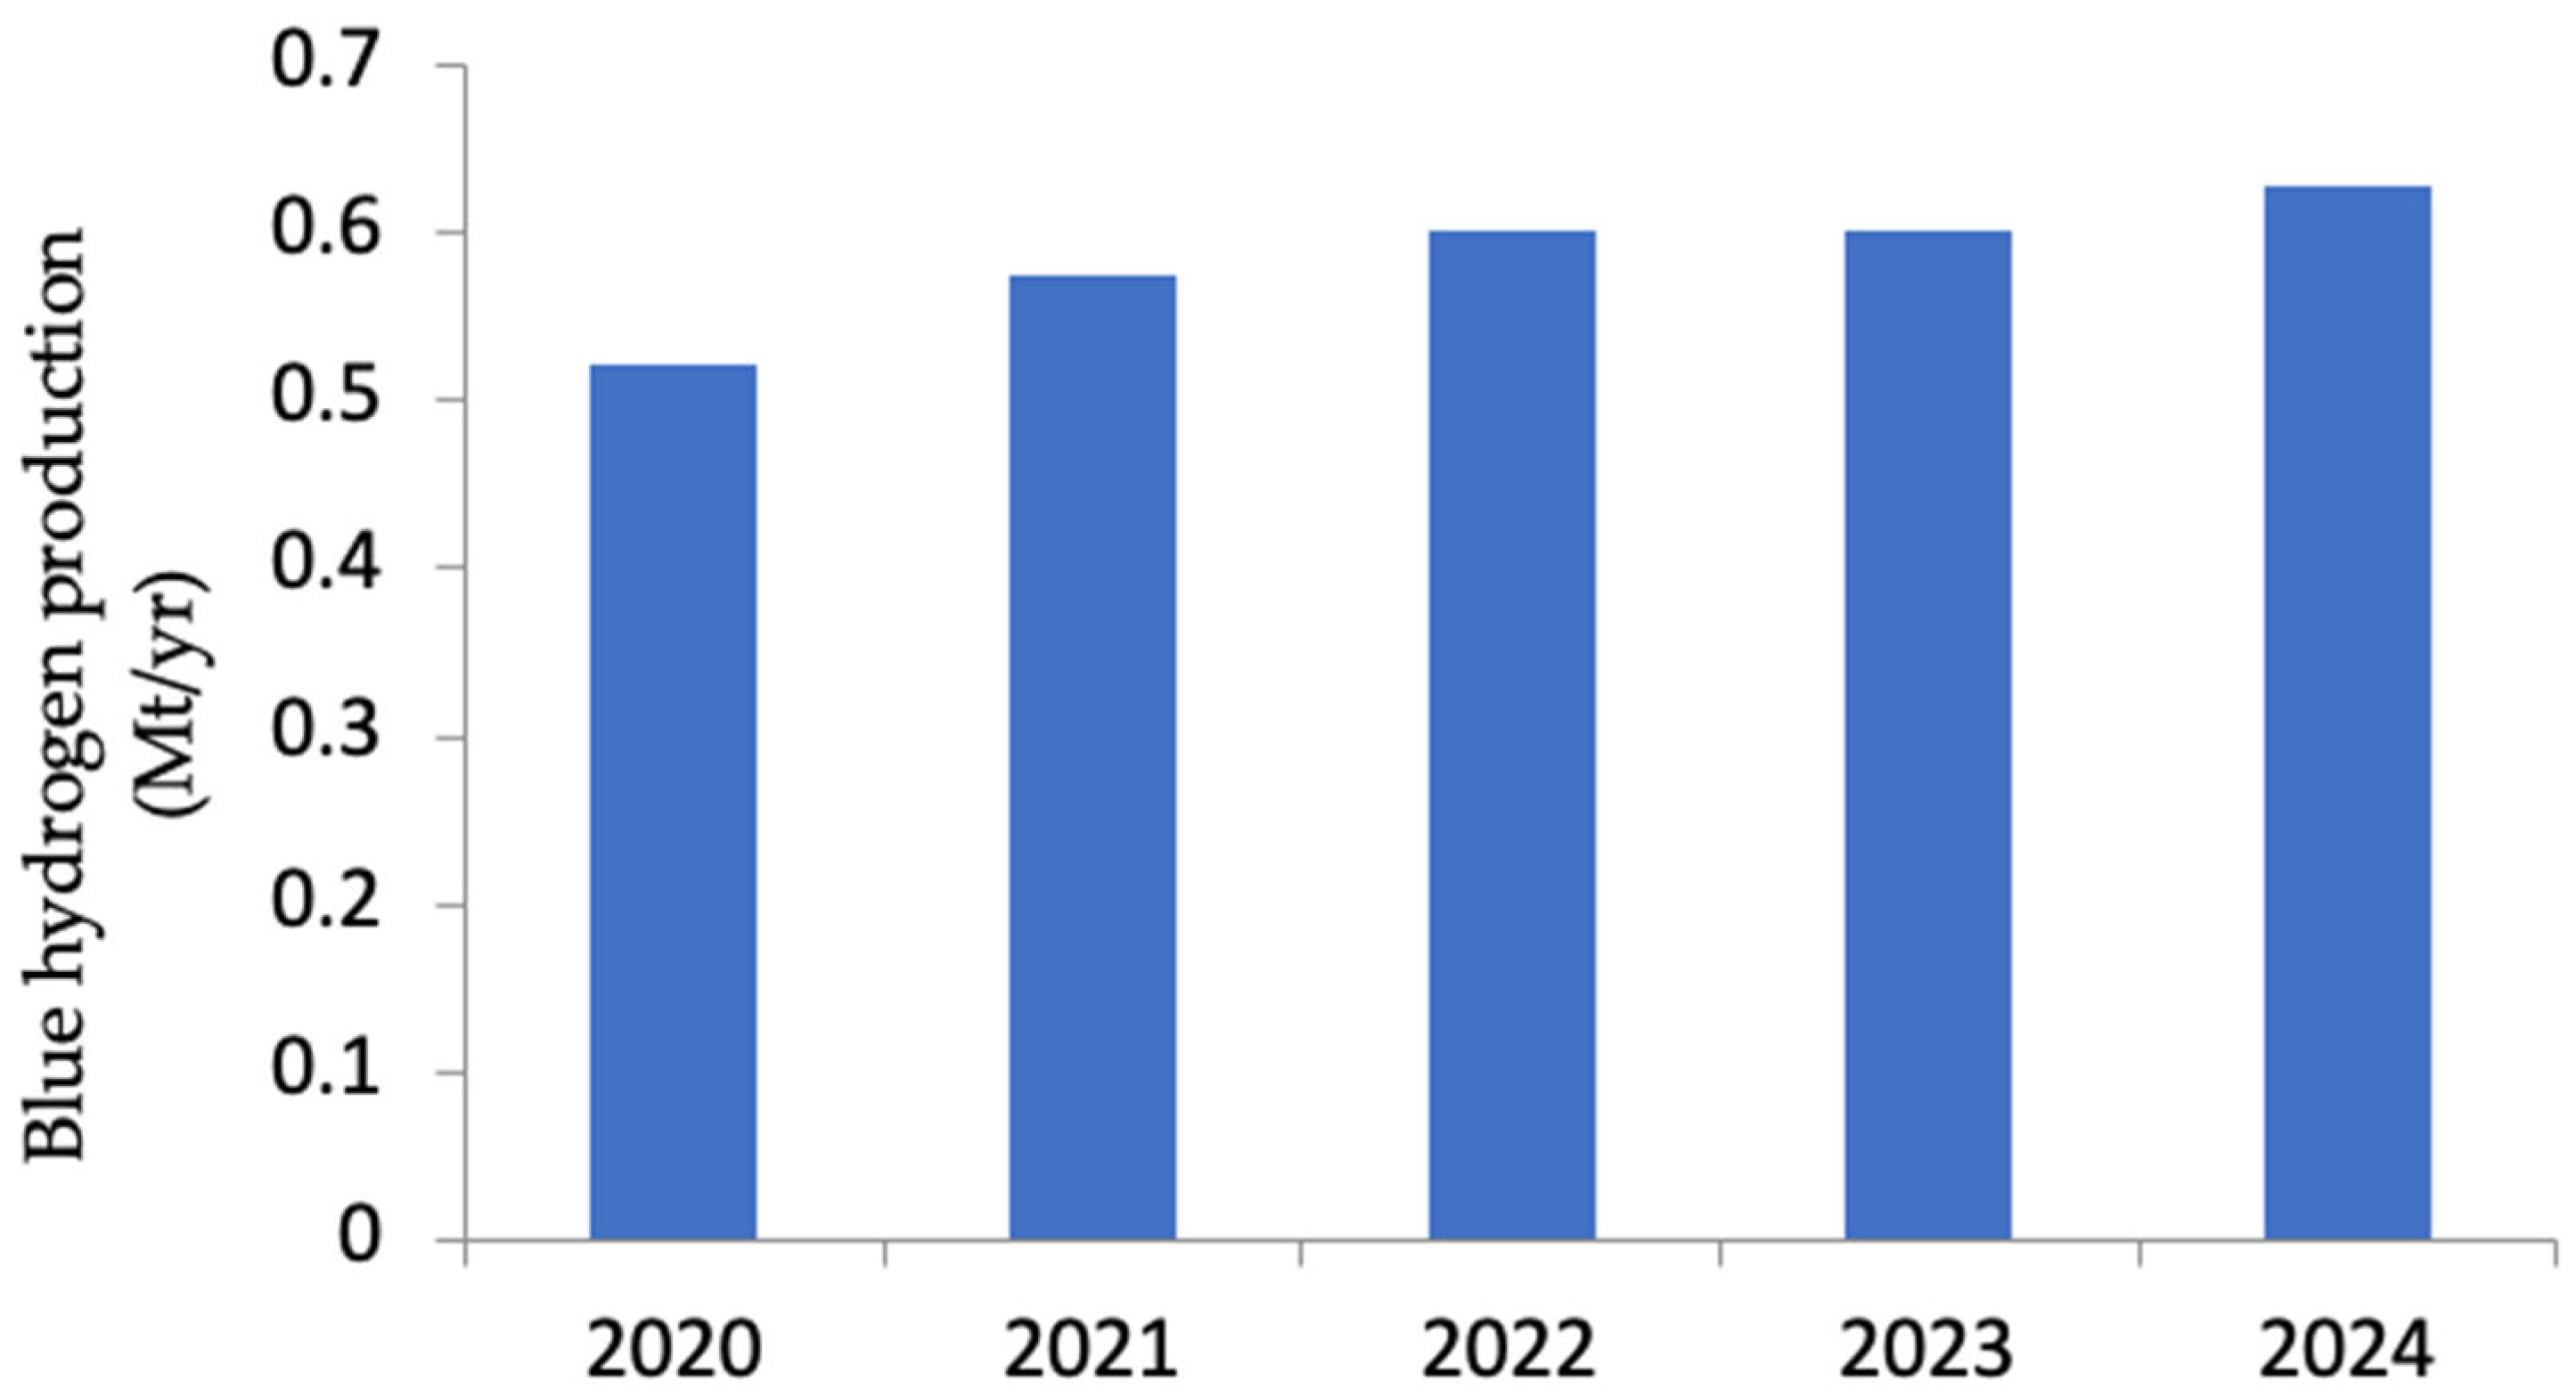
About 15 hydrogen facilities worldwide are equipped with CCUS, with a cumulative capture capacity of around 12 Mtpa CO2 [188]. Most of the facilities are retrofitted hydrogen production units employed in refining and fertiliser production in North America, with first operation dating back to the early 1980s [198]. In Europe, CCUS-based hydrogen production announcements are mostly located around the North Sea area, having access to both natural gas and CO2 storage facilities [199]. The Netherlands has the most advanced CCUS-based hydrogen projects in Europe, with three projects having reached a final investment decision (FID) in 2023, and plans are underway to connect to large CO2 transport and storage infrastructure offshore of Norway and the Netherlands [200]. Illustrated in Figure 12 is an increase from 0.5212 Mt/yr to 0.6281 Mt/yr, representing a 21% increase in global blue hydrogen production from 2020 to 2024.
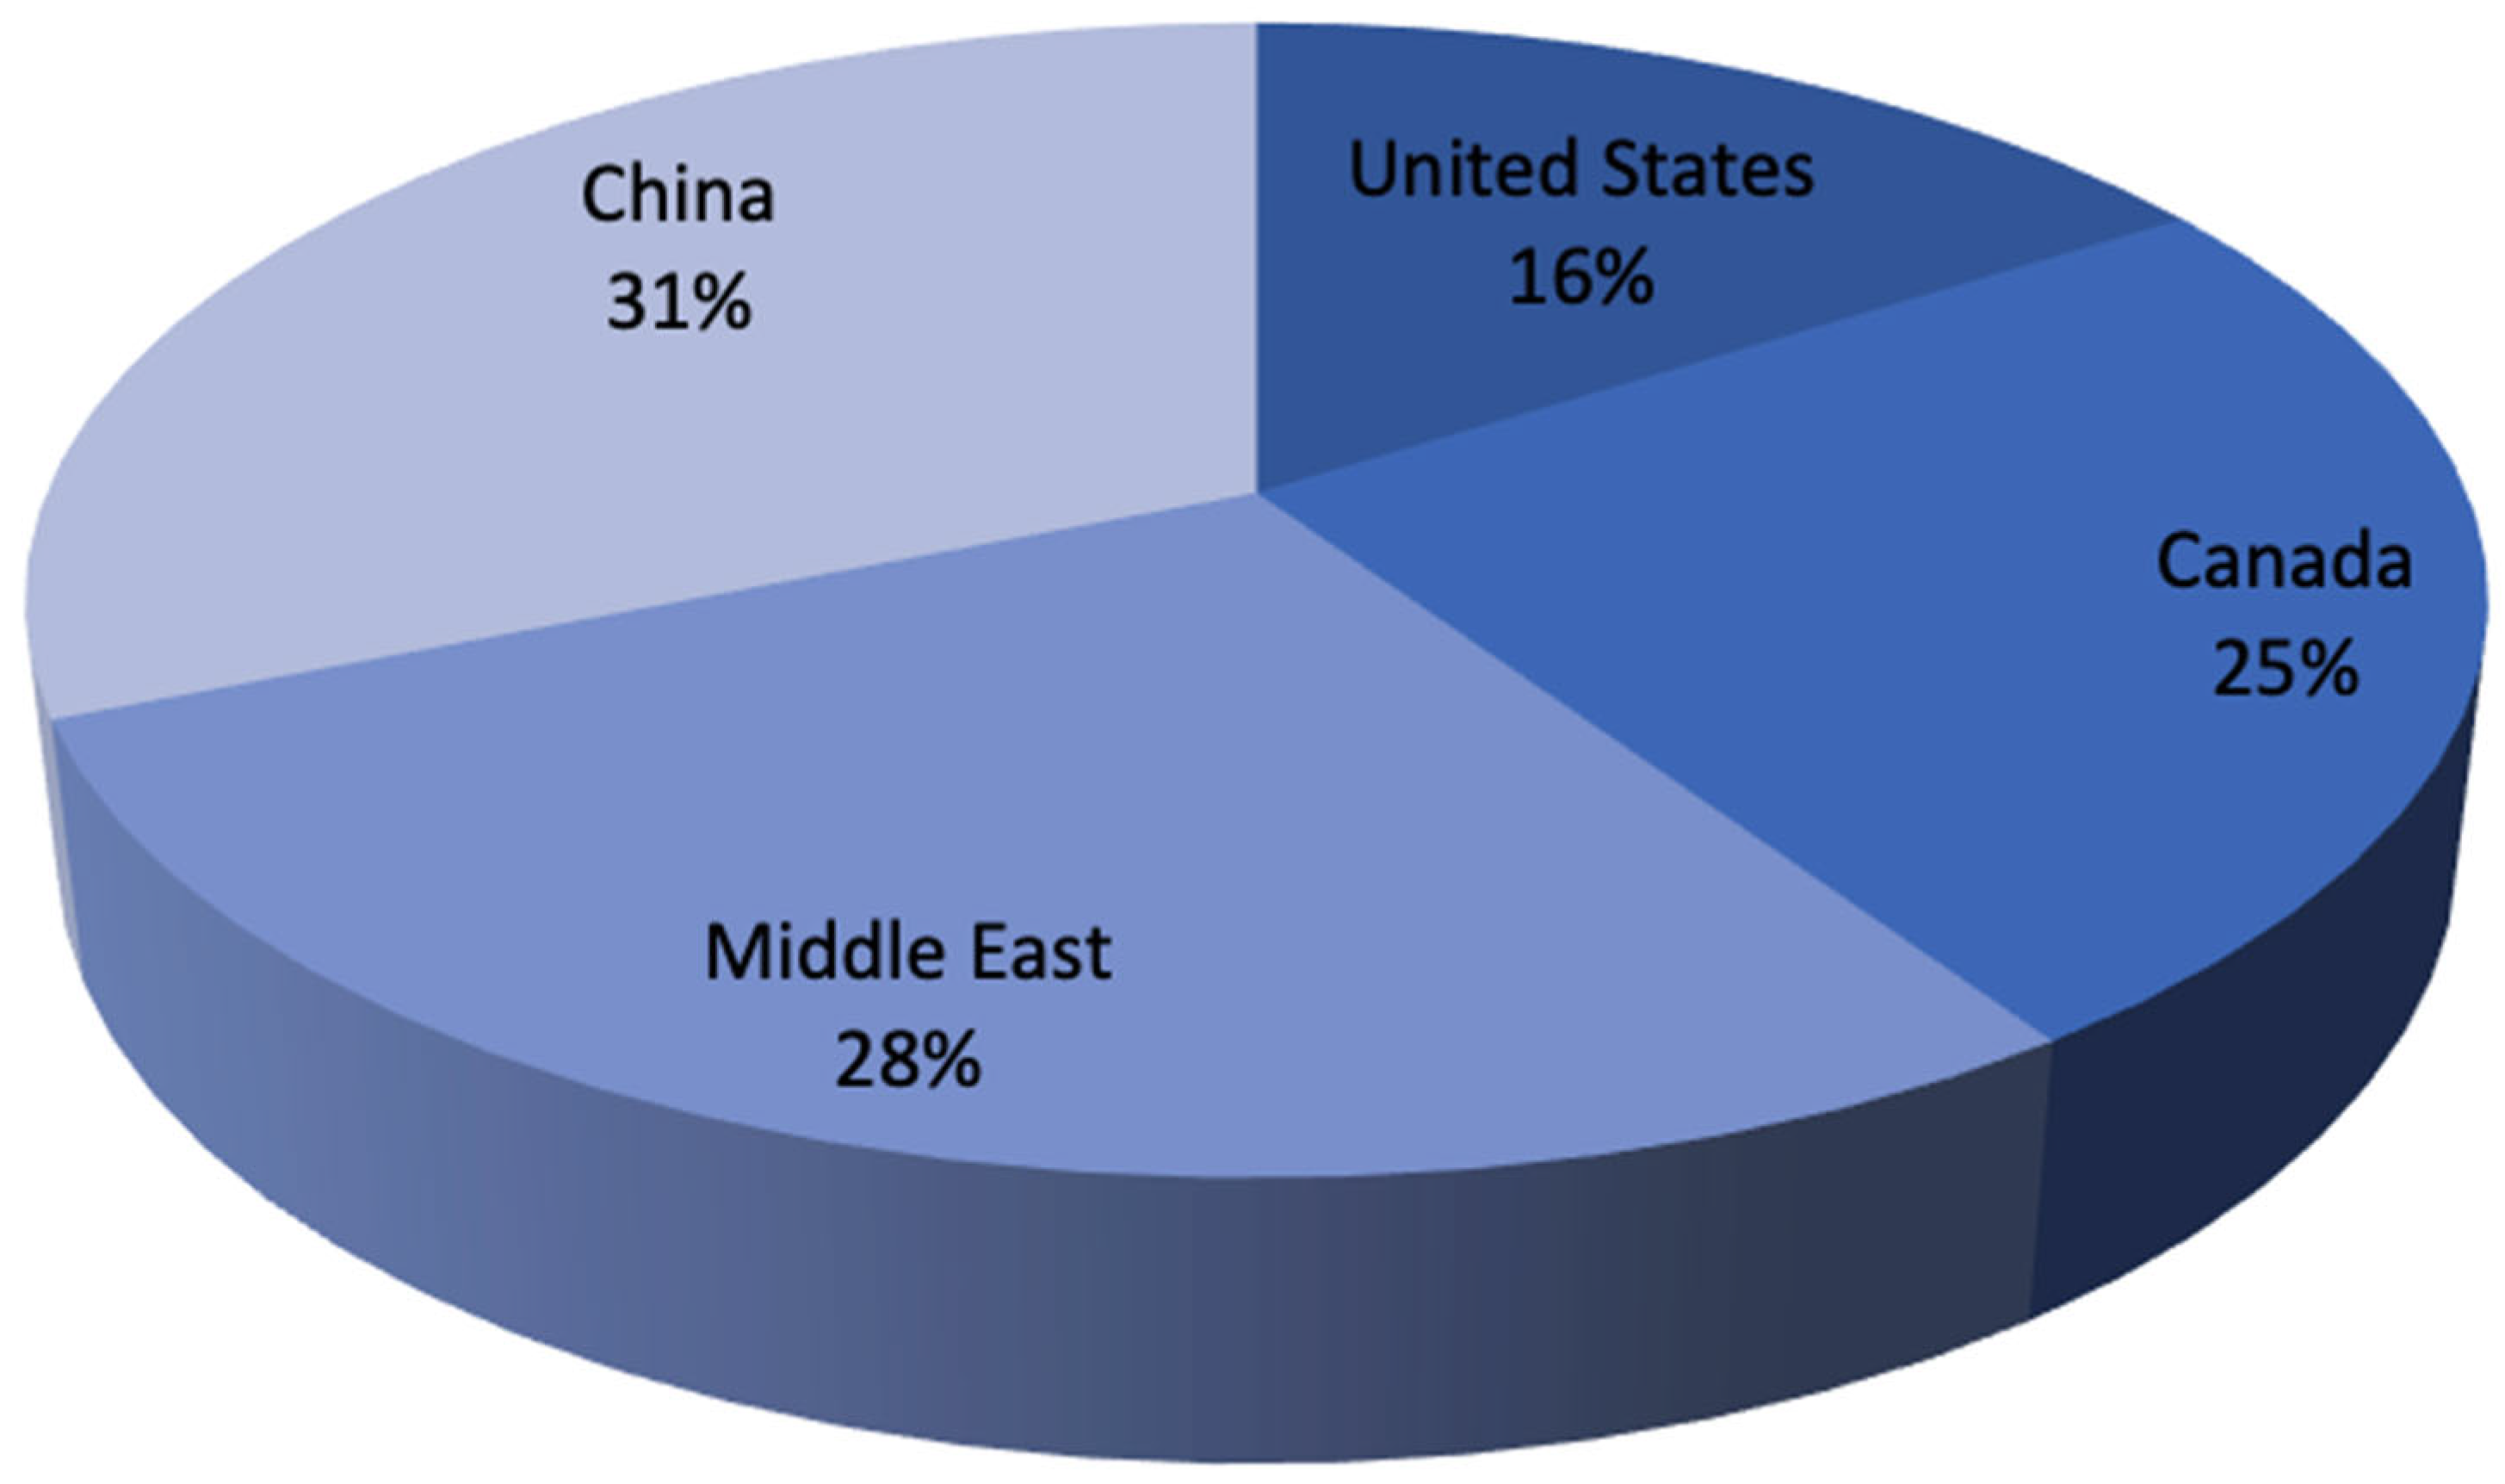
As shown in Figure 13, China and Canada were the largest producers of blue hydrogen in 2024. China pledges to reach peak carbon dioxide emissions before 2030 and achieve carbon neutrality before 2060, and blue hydrogen could play an important and complementary role in achieving this ambitious target [201]. With an average hydrogen production of approximately 36.8 Mtpa in 2023, retrofitting with some of the hydrogen production facilities would increase blue hydrogen production in the country [201]. In Canada, manufacturers of blue hydrogen production have access to CCUS investment tax credits [202]. The development of carbon storage facilities is rapidly advancing in the province of Alberta, with ATCO EnPower reaching FID in June 2024 to proceed with the first phase of the Atlas Carbon Storage Hub [203]. Blue hydrogen projects in the Middle East are also progressing; Fertiglobe, in May 2024, announced FID for a new 1 Mtpa ammonia production facility in the United Arab Emirates [204].

3.2. Blue and Green Hydrogen Production in Europe

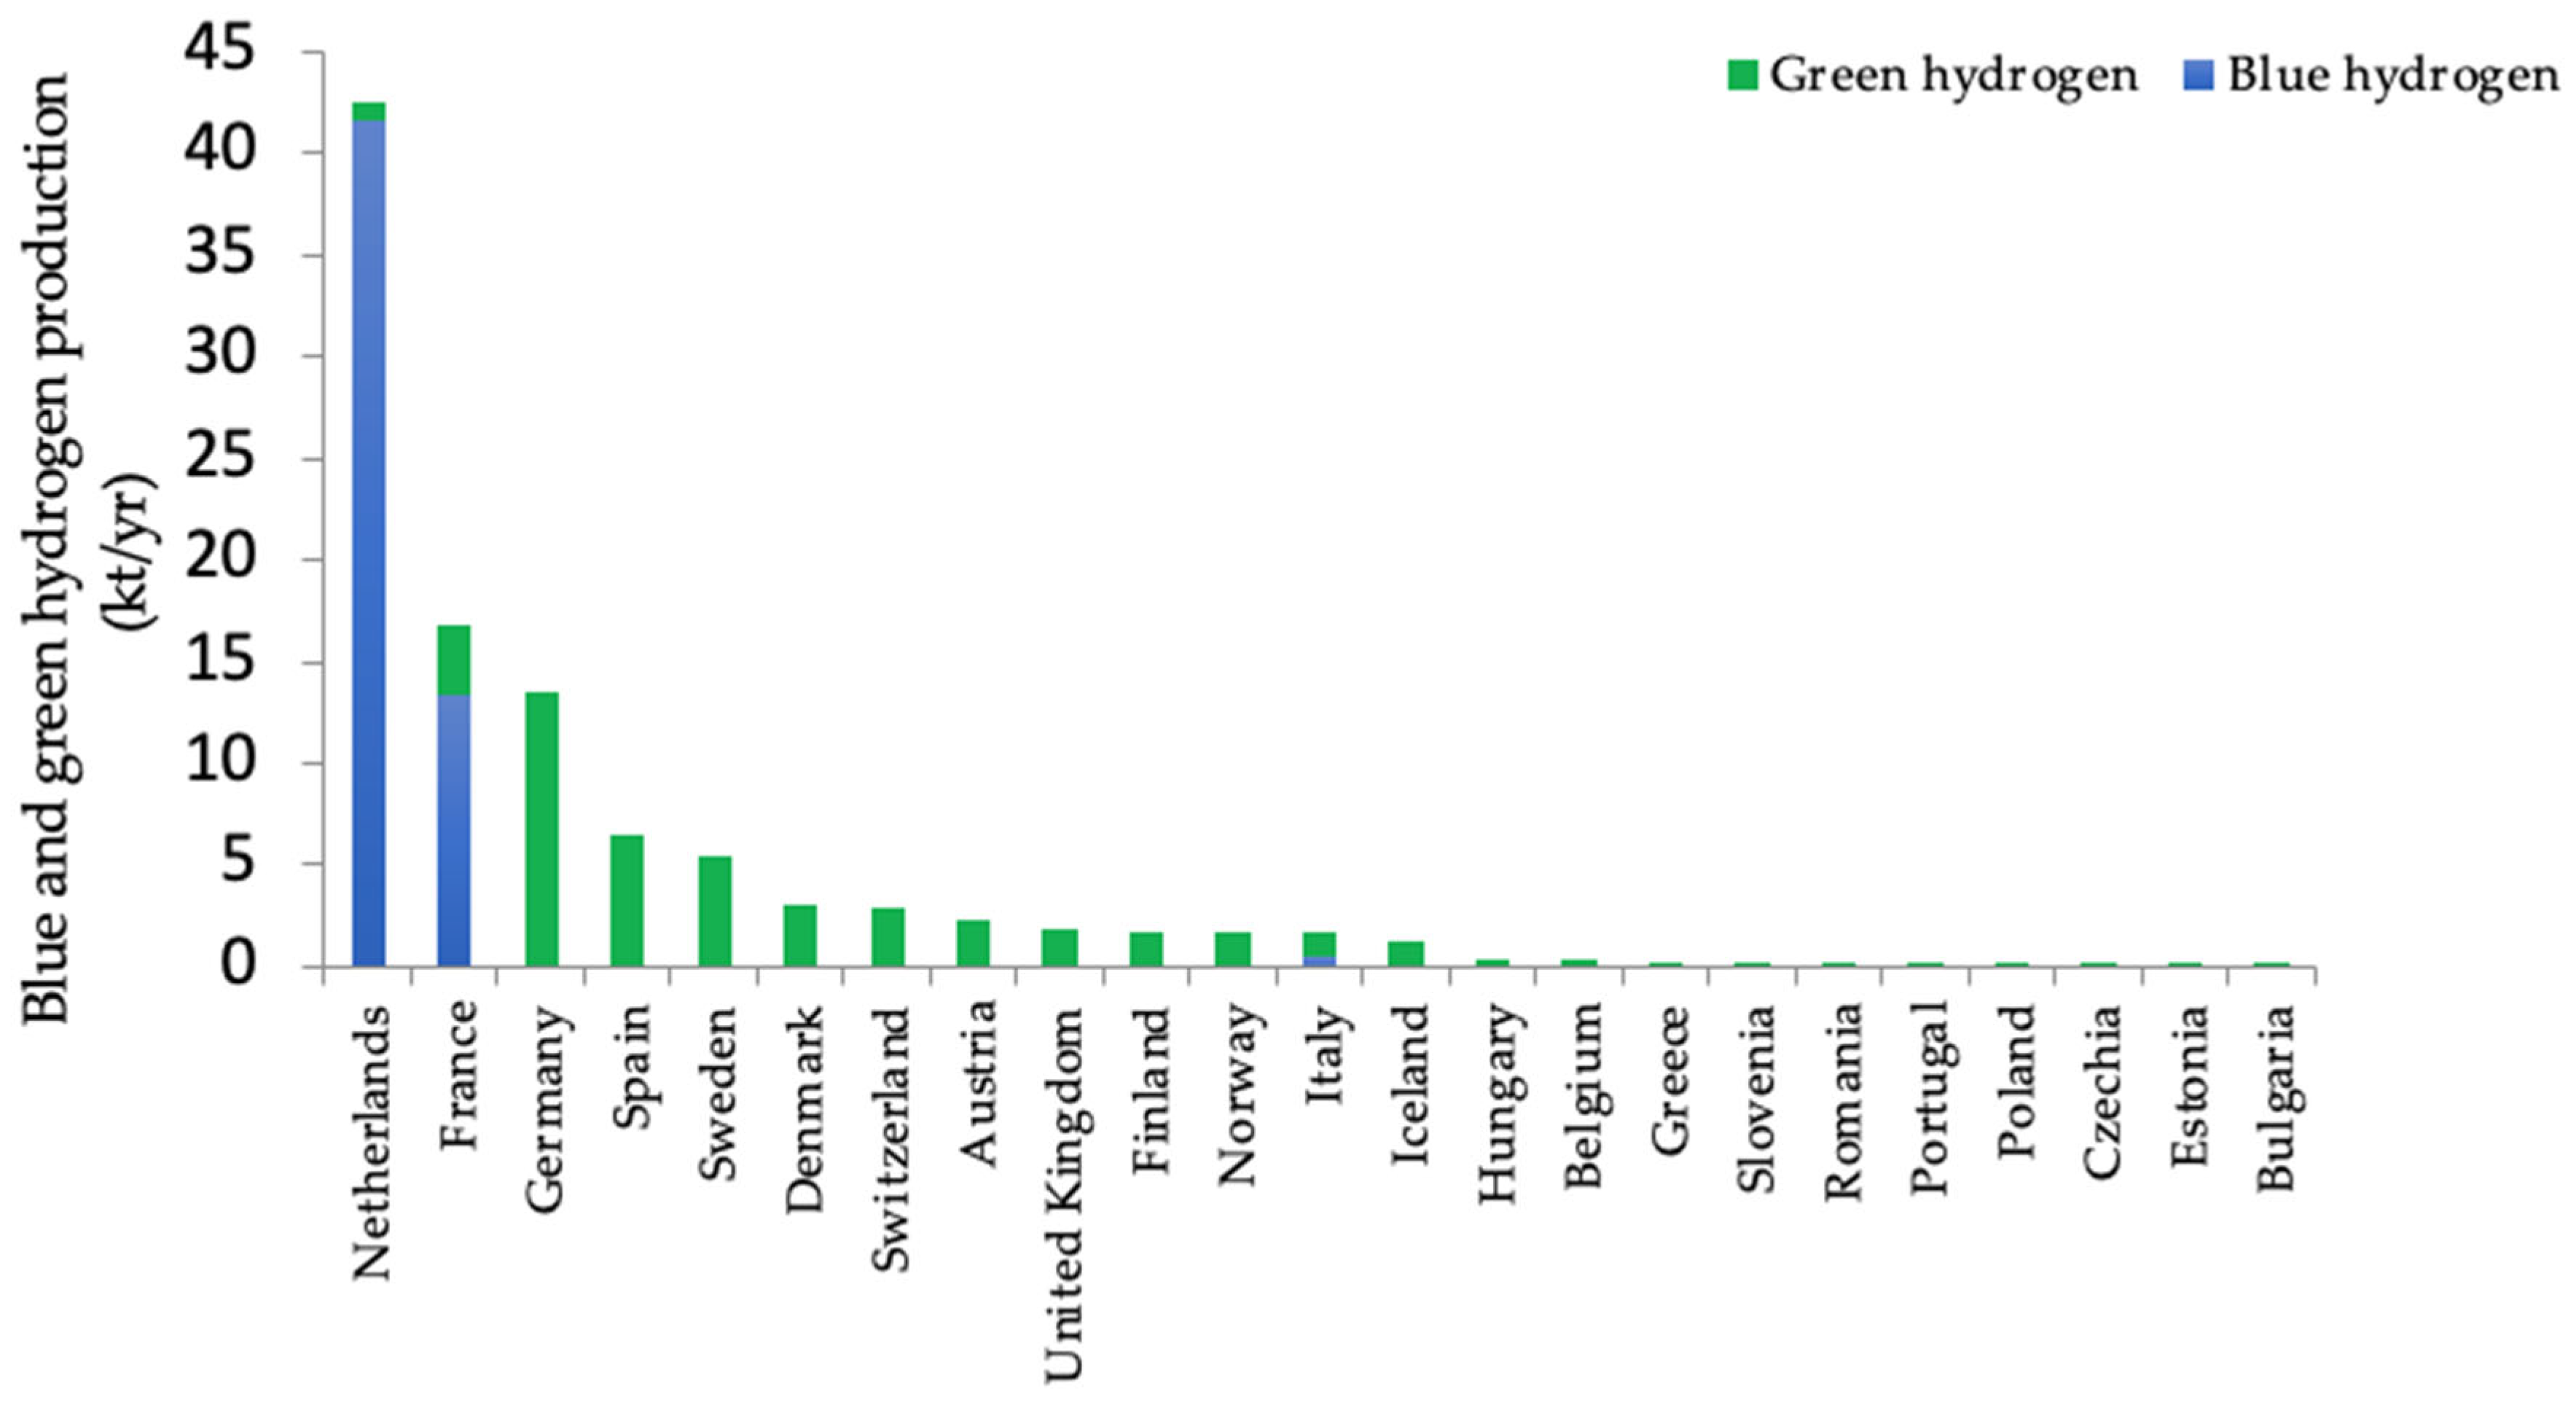
The amount of blue and green hydrogen production in Europe in 2023 is shown in Figure 14. Major producers of blue hydrogen in Europe use either SMR or the hydrogen produced from the by-products of refinery gas or chlor-alkali followed by CCUS [205]. A total of 95% of hydrogen produced in Europe, according to Wu et al. [73], Riera et al. [206] and Khatiwada et al. [207], is mainly produced from fossil fuels using the SMR method without CCUS. Most blue hydrogen in Europe is produced in a few countries, including the Netherlands, France and Italy, as seen in Figure 14. Green hydrogen is produced in Europe mainly from water electrolysis. The scarcity of green hydrogen generation facilities, and of hydrogen storage and transportation infrastructures, are the primary barriers to establishing and growing a hydrogen economy [206]. However, there are many ongoing pilot projects on green hydrogen, and this is expected to shift focus towards more renewable methods of producing hydrogen [208]. Significant advancements in hydrogen production technologies such as electrolysers and hydrogen fuel cells are also being made; this is expected to decrease investment costs over the years due to increased technological efficiency [209].

4. Future Scope of Blue and Green Hydrogen Production and Demand

4.1. Future Scope for Blue and Green Hydrogen as a Fuel

In SMR processes, as shown in Equation (2), a huge amount of carbon dioxide is produced in the process of producing more hydrogen. Carbon capture utilisation and storage technology is then used to remove the carbon dioxide produced, leaving almost pure hydrogen. Since all pollutants from this hydrogen generation process cannot be eliminated, blue hydrogen always has a bigger greenhouse gas footprint than green hydrogen [213]. Although it is crucial to the future of sustainable energy, a blue hydrogen economy with low carbon emissions still presents a challenge to the energy sector. There are several ways to produce hydrogen, but if it is to assist in the fight against climate change, the hydrogen fuel production process must have very low carbon emissions. The actual emissions will differ substantially based on the methods and procedures selected along the entire value chain [71,214]. Therefore, a mixture of hydrogen production and carbon capture technologies that prioritise high conversion rates of captured CO2 and minimal process-related CO2 and CH4 emissions is needed [214].
According to some stakeholders, blue hydrogen is considered entirely incompatible with a future of decarbonised energy [215]. They view CO2 emissions from hydrogen plants and CH4 emissions from natural gas supply chains as fundamental problems that defy solutions [215]. It was further asserted that the greenhouse gas footprint of blue hydrogen is 20% more than that of burning natural gas [215]. Riemer and Duscha [216] suggested that such views are being driven by the oil and gas industry’s self-interest, all the while claiming to presenting the “best-case” scenario. These conclusions are intended to prove technical viability rather than optimise productivity and have been contested by other experts. Conversely, further studies have shown that carbon emissions associated with blue hydrogen can be reduced by ensuring low CH4 emissions and strong CO2 capture rates [217]. Raganati and Ammendola [218] noted that use of advanced CO2 capture technology like ATR with pre-combustion CO2 separation and MEA could be crucial for achieving high capture rates. To ensure low CH4 emissions, it is essential to use natural gas from sources with inherently low upstream emissions, and improve leak detection and response protocols across the entire supply chain [219]. These findings, backed up by more research, indicate that blue hydrogen is a desirable bridging technology with comparable effects on global warming to green hydrogen and compatibility with low-carbon economies [71]. The persistent dependence of blue hydrogen on fossil fuels that exposes pricing and supply to economic uncertainty, and also fails to serve the objective of enhanced energy security [220], is an issue of serious concern in the global search for alternative energy. Nevertheless, the advantages of encouraging investment in blue hydrogen production exceed that of completely giving up on seeking alternatives for fossil fuels energy, as blue hydrogen can be a bridging technology during the coming decades [71].
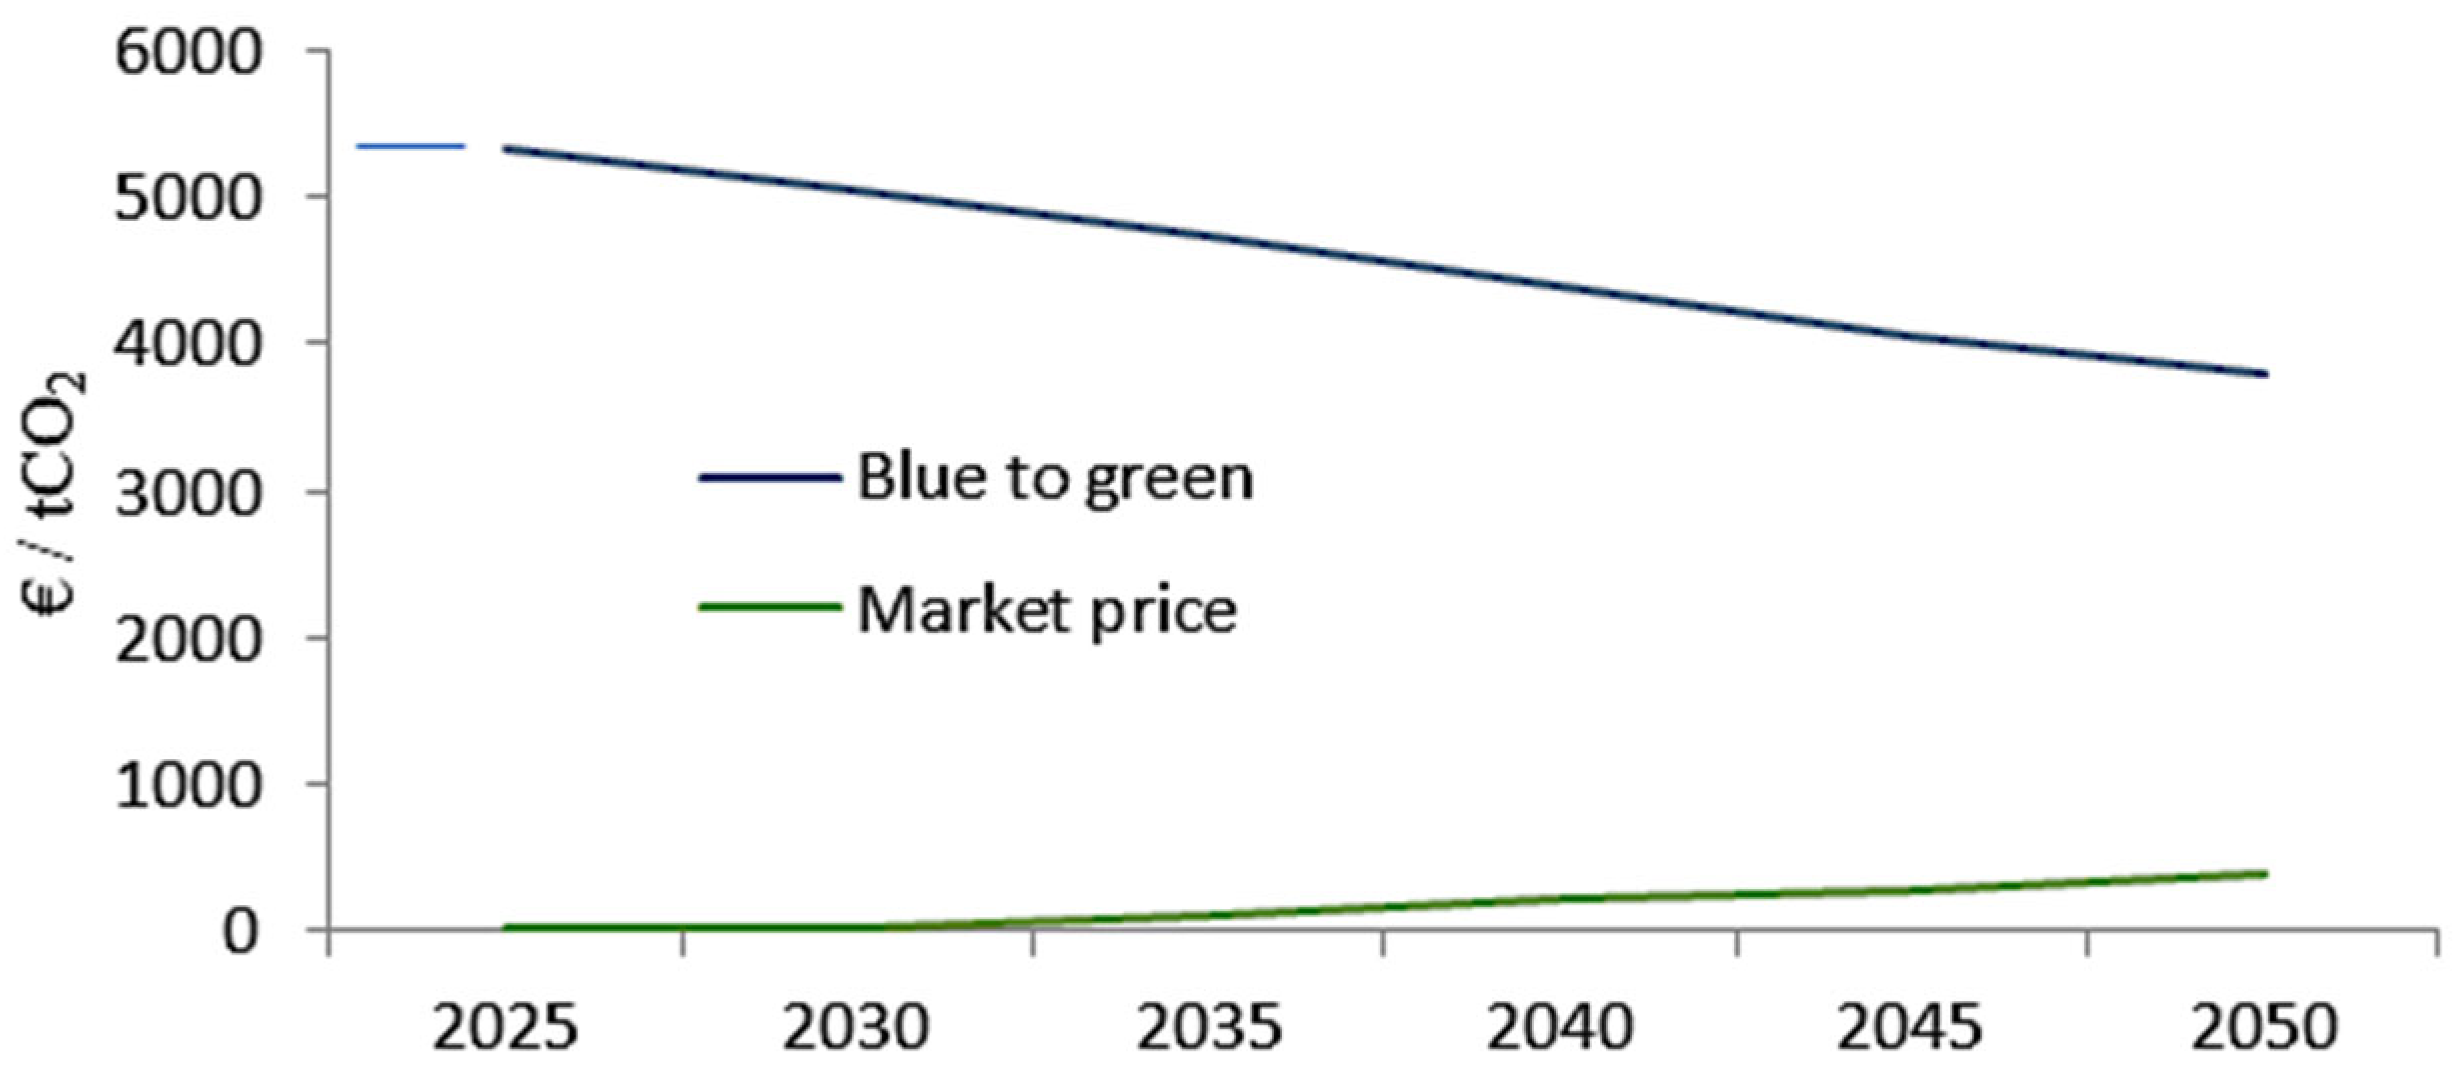
Blue hydrogen fuel, like with any emerging technology, needs strong regulations [73]. To ensure that blue hydrogen contributes to decarbonisation, relevant limits for CH4 production and carbon capture rates are essential [73]. The short-term scaling up of hydrogen production and the commercial development of related technologies and infrastructure along the value chain will both advance the development of blue hydrogen if these conditions are met [221]. Moreover, infrastructural development in the areas of large-scale H2 storage and dedicated long-distance pipelines across regions would reduce the cost of blue hydrogen and make it more accessible to the various sectors of the global economy [222]. Blue hydrogen, which is 2–3 times less expensive than green hydrogen [193], provides an attractive bridge technology that, with strict regulation by the relevant government agencies, could have a favourable environmental impact and assist in the transition to a decarbonised energy system until commercial-scale green hydrogen production is effectively implemented and becomes cost-competitive. The production of hydrogen from fossil fuels and biomass with CCUS has the potential to reduce emissions at a scale of multiple gigatonnes per year [223]. Even though it is less developed than blue hydrogen, hydrogen made from biomass (when combined with CCUS) may still remove between 15 and 20 kg of CO2 in the atmosphere for every kg of hydrogen generated [224]. Blue hydrogen is in a good position to lead the rapid expansion of the use of clean hydrogen for climate mitigation. However, with some characteristic configurations, Ueckerdt et al. [225] projected that blue hydrogen will surpass the levelised cost of hydrogen (LCOH) levels of the renewable energy alternative in 2050 due to the substantial rise in the cost (market price) of CO2 after 2030. Estimates of average CO2 price ranges for a transition from blue to green hydrogen, excluding excise charges, is shown in Figure 15 for cost parity. It shows the average cost ranges of transitioning from blue to green energy decreasing from EUR 5300 in 2025 to EUR 3500 by 2050.
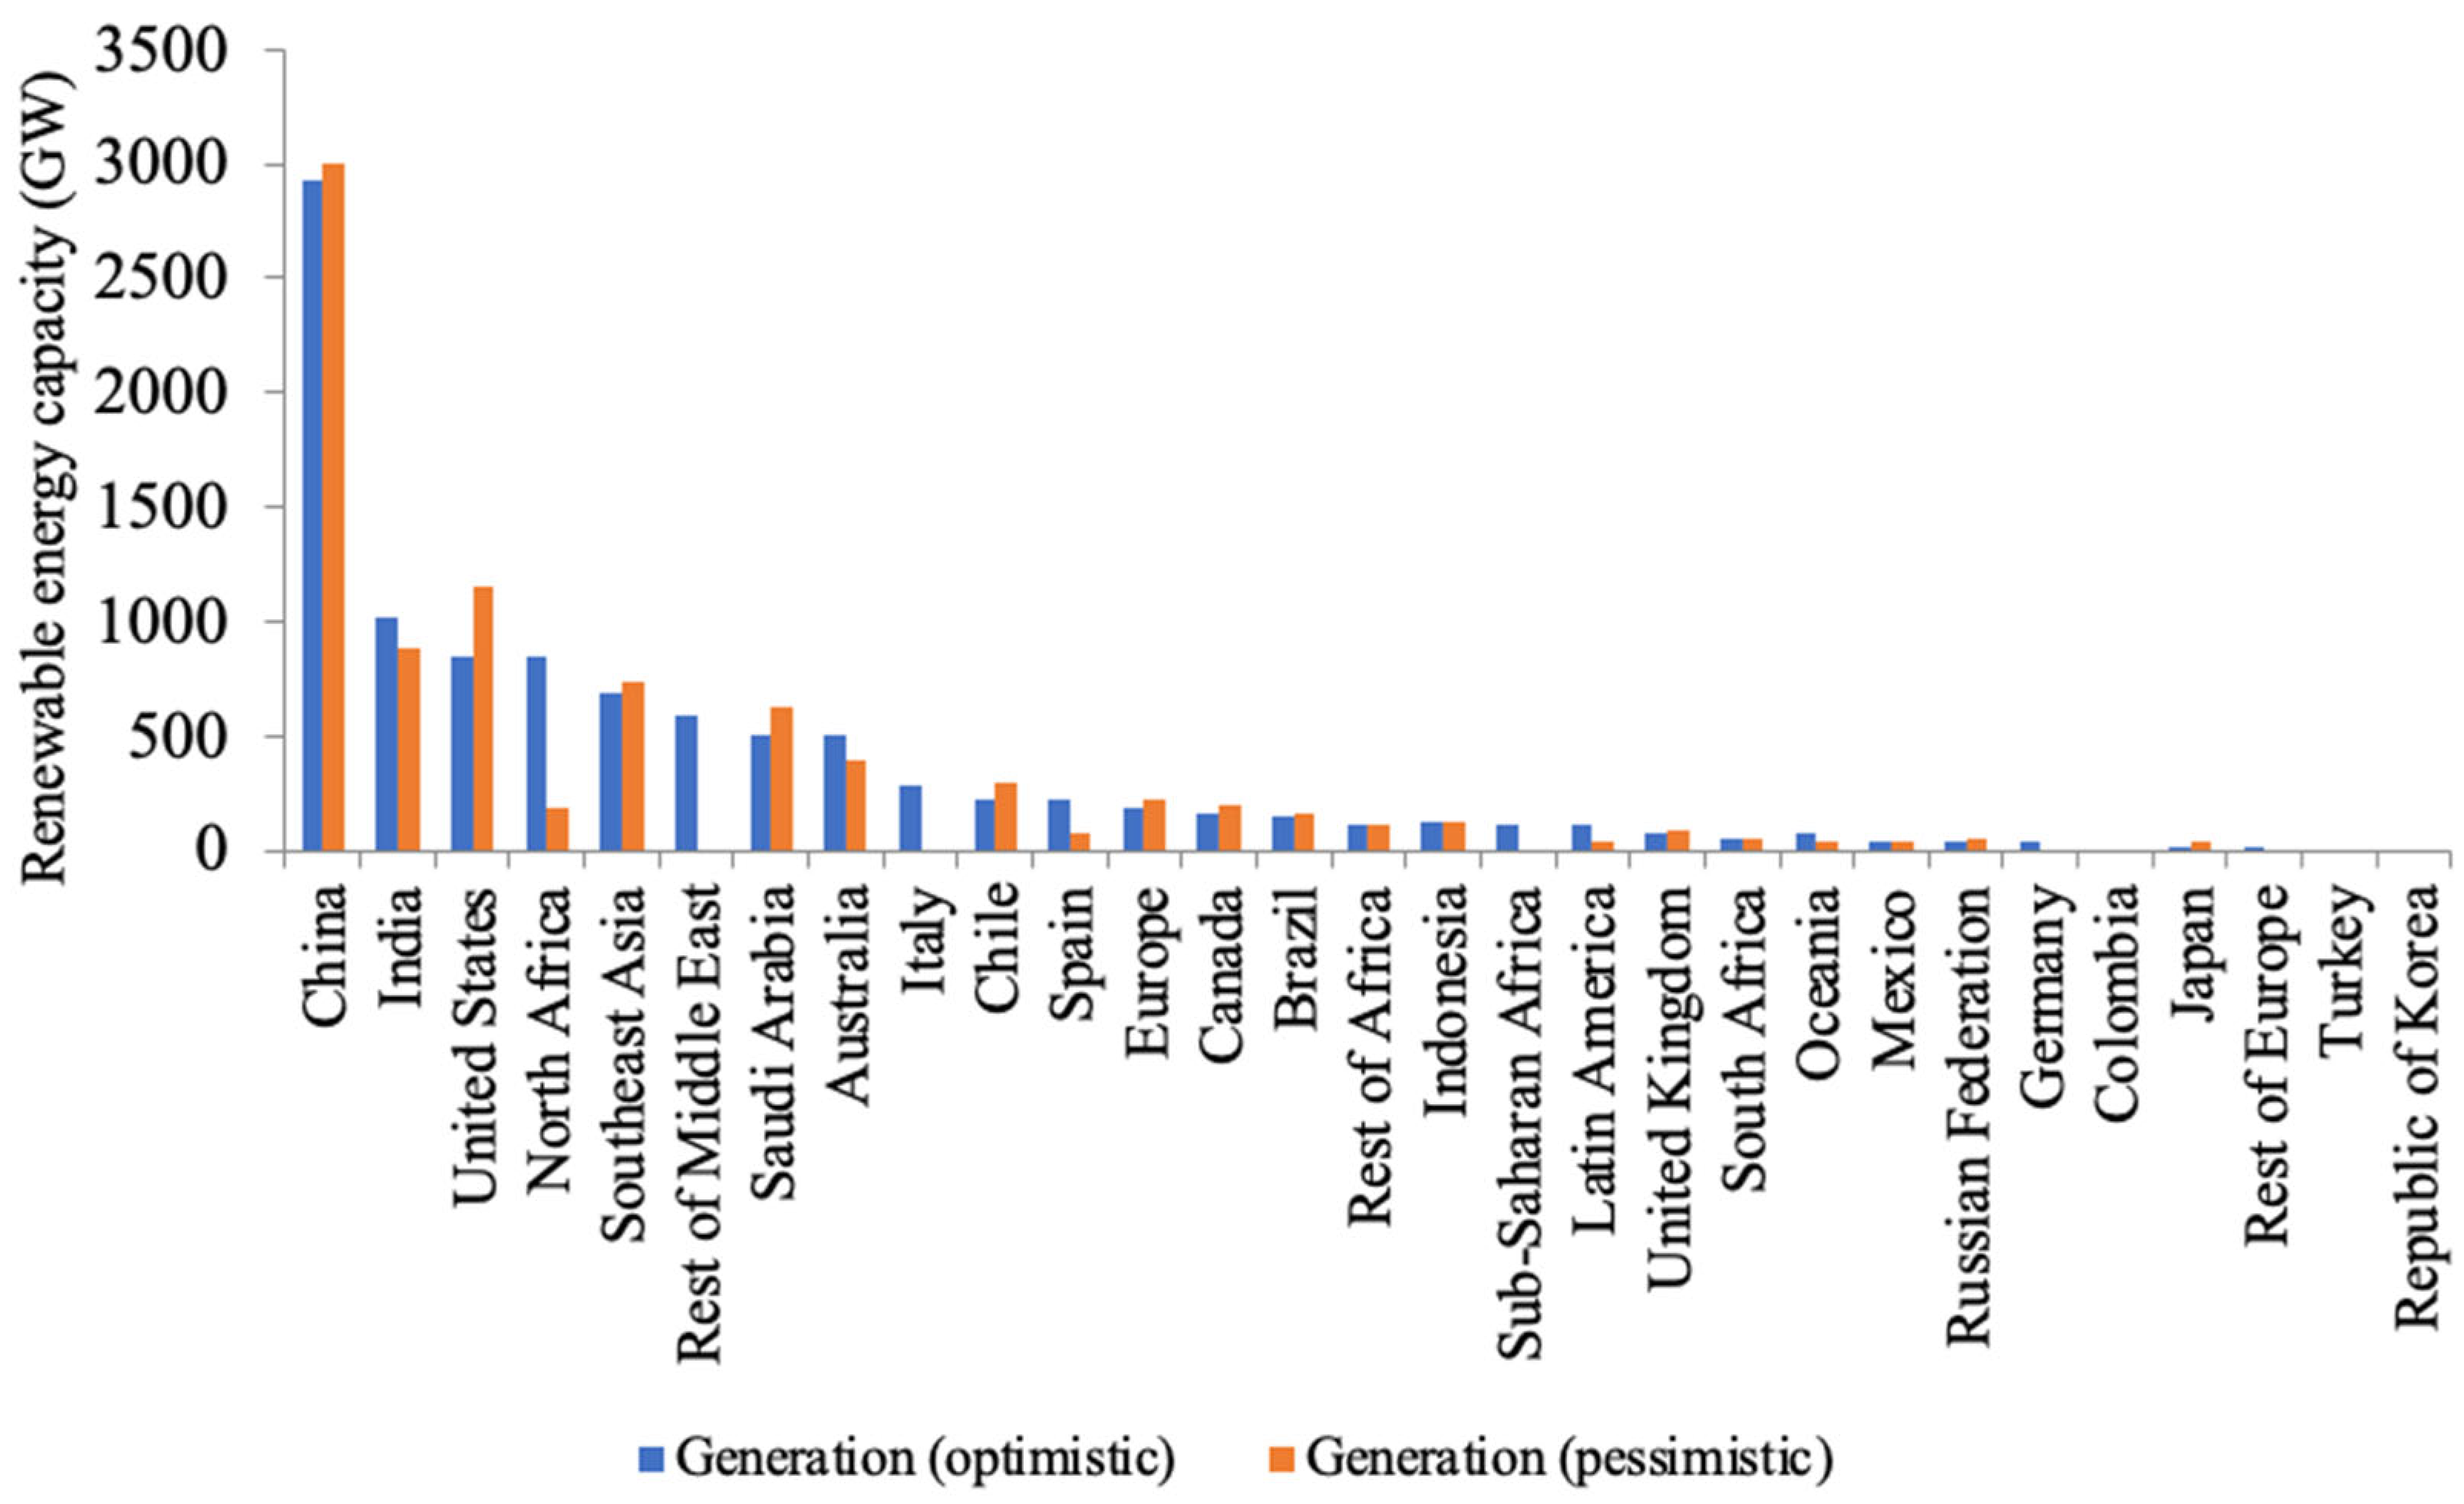
Using renewable sources of energy to electrolyse water to obtain green hydrogen is now generating traction because of its low carbon emissions compared to blue hydrogen, and the hydrogen produced is now further treated to boost its energy density [227,228]. Liquefaction, the utilisation of liquid organic hydrogen carriers or their transformation to ammonium, methanol, iron or synfuels is an example of subsequent treatment or processing [229]. The extra transformation processes result in energy loss, which raises the price per supplied unit of energy [230]. The installed energy production capability for producing green hydrogen by 2050 is shown in Figure 16. Regional capacity varies considerably, and the ideal electrolyser potential ranges from 30% to 60% of the total power production capacity based on different variables, such as the proportion of photovoltaic (PV) vs. wind power, the capabilities of PV and wind, the installed capacity of batteries and the seasonal patterns of reserves [231]. With such a global average proportion of 43%, a maximum of 10,280 GW of wind and solar energy is required to power 4400 GW of water electrolysis [232].
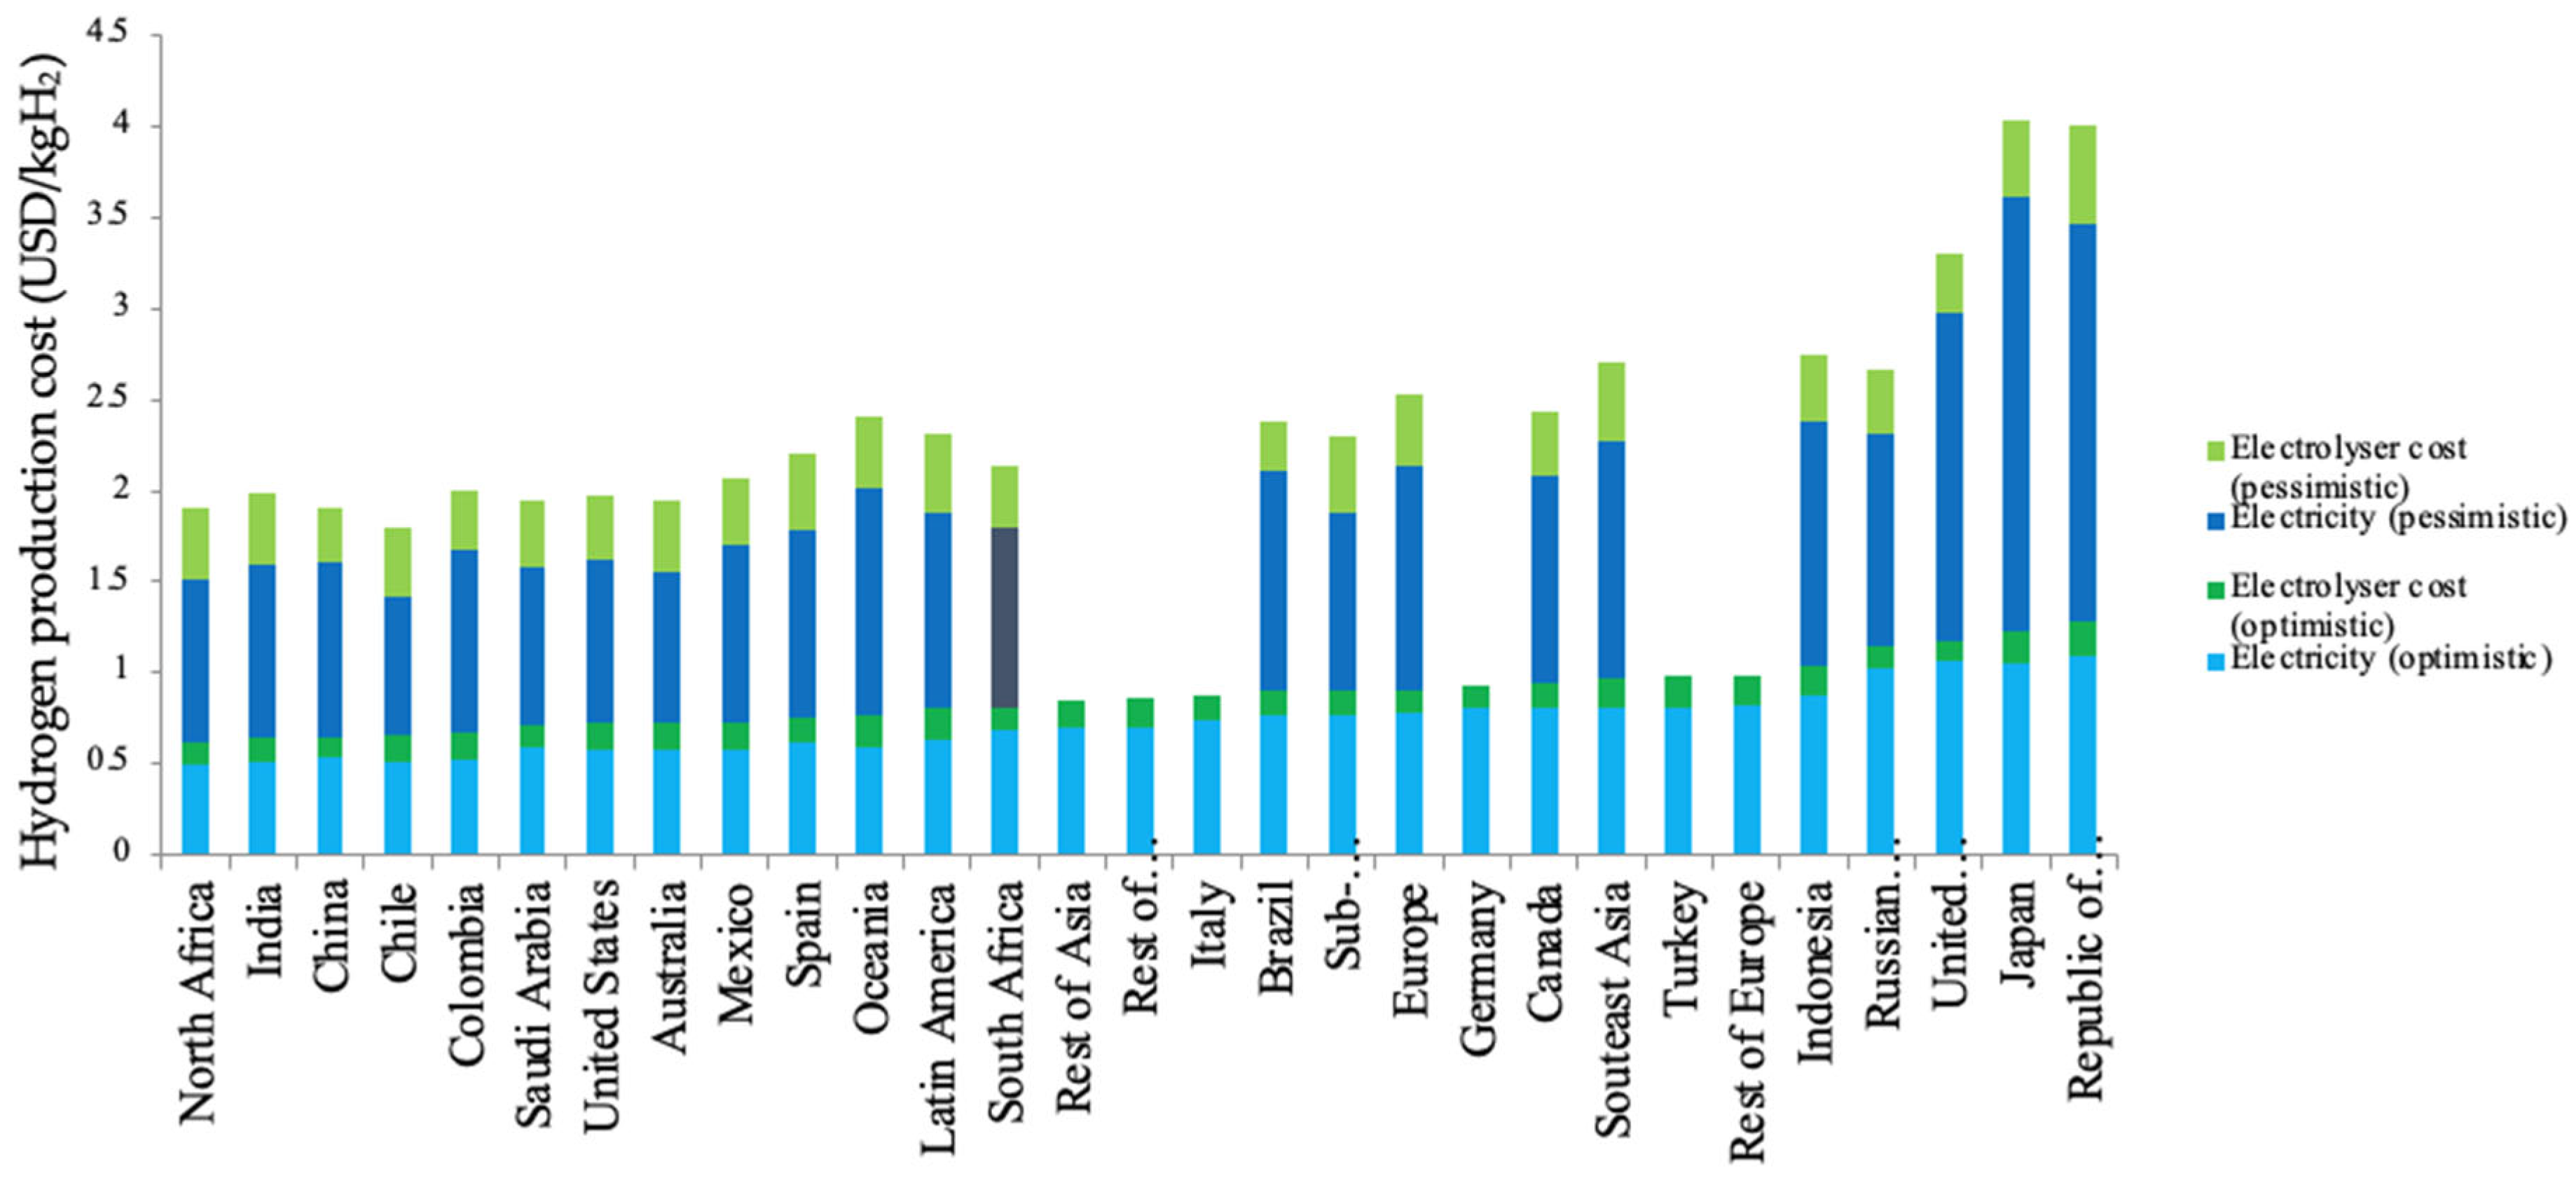
Figure 17 shows the LCOH for each region for optimistic and pessimistic scenarios, with costs rising steadily as supplies are used up. The ideal point has a single cost once the optimum overall productivity from each area is established based on hydrogen consumption and supplies.
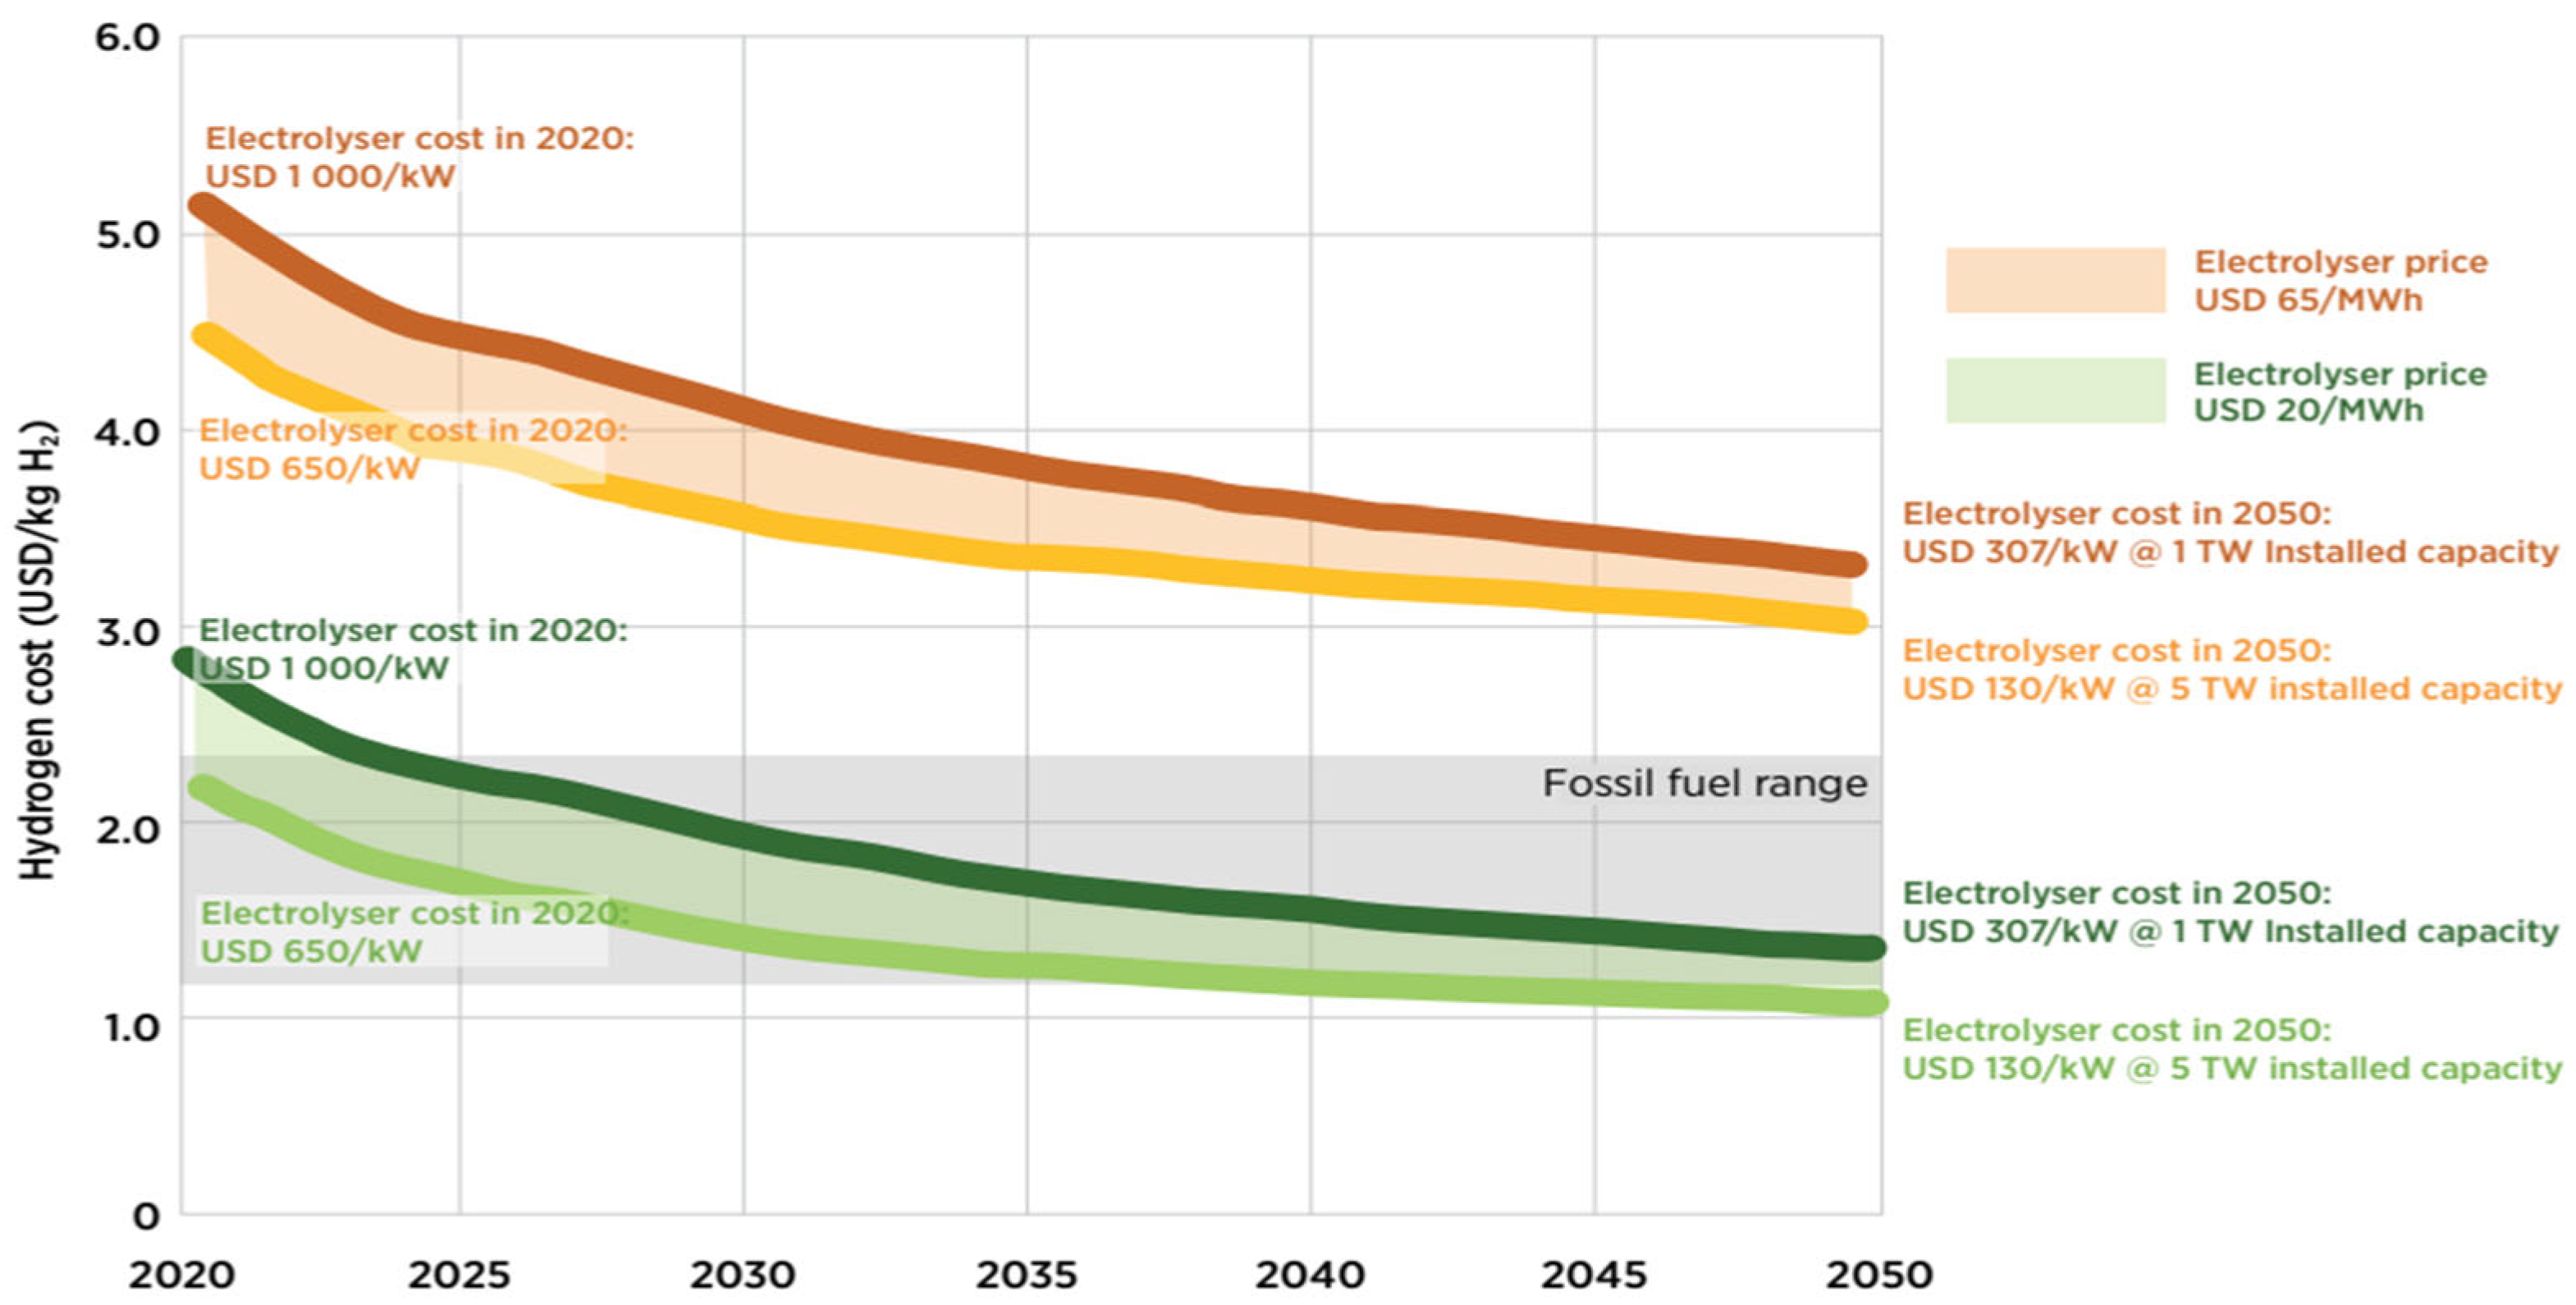
As the price of electrolysers falls, these expenses are consistent with a prior IRENA study [234] on the relative value of electricity versus electrolysis shown in Figure 18. Globally, by 2050, according to the current analysis, huge solar and wind infrastructure for producing hydrogen is expected to provide energy to water electrolysis at a rate of USD 10–20/MWh [235], with many areas predicted to reach production of green hydrogen far below USD 1/kg according to the optimistic projections and USD 1.5/kg [234,236] according to the pessimistic scenario.

4.2. Comparative Analysis for Both Blue and Green Hydrogen

Table 3 shows a comparison of blue and green hydrogen. Use of CCSU to lower emissions from blue hydrogen is already being deployed at commercial scales globally, as discussed earlier. But as seen in the table, blue hydrogen’s lifecycle shows more discharge of greenhouse gas emissions compared to green hydrogen. The total CO2 emissions for blue hydrogen are 10–30 gCO2/MJ, while CO2 emissions for green hydrogen are <5 gCO2/MJ [238], which is considerably lower. There are also leakages of fugitive CH4 emissions associated with blue hydrogen, which are major greenhouse gas emissions [71], whereas green hydrogen involves no CH4 leakage and produces very low indirect carbon emissions, which are attributed to the emissions generated during manufacturing of renewable energy infrastructures and electrolysis equipment. But in spite of the shortcomings of blue hydrogen, green hydrogen is significantly more costly (USD 3.5–6.0/kg H2) than blue hydrogen (USD 2.0–3.5/kg H2) at greater levels of hydrogen consumption, as illustrated in Table 3. To justify this, natural gas can be transformed to hydrogen at a much cheaper cost than it can be turned to electricity, while hydrogen produced through electrolysis is always more costly than the electricity used to produce it [239]. Increased production of green hydrogen increases the levelised cost of electricity and hydrogen (LCOEH), while the LCOEH decreases with increased production of blue hydrogen [225]. Advancements and efficiency in electrolyser production are expected to lead to a fall in cost production for green hydrogen [240]. The combined effects of cheaper, more efficient electrolysers and falling renewable energy prices are projected to make green hydrogen more cost-competitive with blue hydrogen [241].

4.3. Reduction in CO2 Emissions Using Hydrogen Energy

As countries strive to achieve climate change goals, Dincer and Aydin [243] state that hydrogen energy is still the main pathway to removing global reliance on fossil fuels. Hydrogen energy can assist in storing and transporting renewable energy while lowering CO2 emissions in the industry and transportation sectors [7,244]. Green hydrogen is the main source of hope for becoming totally independent of fossil fuels and moving toward a net-zero-carbon future [245,246]. Green hydrogen energy will reform heavily polluting industries like the steel and cement industries and will help in driving net emissions to zero [247]. Use of blue hydrogen is already proven to have the potential to drastically reduce CO2 emissions if proper CCUS technologies are deployed [46].
Hydrogen, which has previously been heralded as the fuel of the future, now has very promising potential, as many of the most polluting nations in the world, including China, the US, India, Canada and the UK, are currently embracing it and making significant investments in blue and green hydrogen technologies to reduce net carbon emissions [248]. Long-term reduction in these emissions would be achieved and sustained with a full shift to the use of green hydrogen. Positive effects of hydrogen energy in terms of reducing global emissions will be noticeable in sectors like iron, steel and cement that produce a lot of CO2 emissions [249], use a lot of coal and are difficult to electrify. In transportation, use of hydrogen-based fuels in hydrogen fuel cell automobiles and trucks, as well as in shipping and aviation, will promote the objective of reducing global emissions [250]. In the areas of transporting and storing renewable energy, these new energy sources would provide more access to renewable energy in areas with limited renewable resource availability [251]. Green hydrogen would be particularly useful in California in the US, which passed a law in June 2020 mandating that by 2035, more than half of the trucks sold must have zero emissions [252,253]. The production of fuel cell trucks has accelerated because of this rule, and Canada is expected to profit when more are made accessible for use in commerce.
To achieve global climate goals and unlock the full potential of hydrogen energy, coordinated policy action from global powers such as the US and China (also the largest consumers of energy and the highest emitters of CO2) is needed to support R&D investments, scale infrastructure, standardise emissions thresholds in hydrogen energy and stimulate its market demand [254]. In this regard, international cooperation, technology transfer and long-term financing will be crucial to balance cost-effectiveness with environmental integrity [255].

4.4. Long Short-Term Memory (LSTM) Prediction Model for Blue and Green Hydrogen Production Until 2050

Long short-term memory (LSTM) is a deep neural network designed to capture historical information of time series data, and is suitable for predicting long-term nonlinear series [256]. It consists of gates such as a forget gate, an input gate and an output gate that capture both long-term and short-term memory along the time steps and avoid gradient exploding and/or vanishing in standard recurrent neural networks (RNNs) [257]. The LSTM unit also has a cell that stores the accumulated information over arbitrary time intervals [258]. The LSTM was used to model the projection of UK’s hydrogen production from 2025 till 2050 using historical data available from 2010 to 2022.
The model used historical production data covering the years 2010 to 2022. It used blue hydrogen historical data covering the years 2010 to 2022 and, similarly, green hydrogen historical data covering the years 2010 to 2022. These two series served as multivariate inputs (blue, green), with the independent variable being year. A synthetic LSTM-style model was employed to mimic the behaviour of a trained LSTM neural network. The logic behind this approach is based on the following: blue hydrogen growth having a steady trajectory with an average annual increment of ~0.15 Mt and small variance (σ = 0.03); green hydrogen growth with an accelerating trajectory with an average annual increment of ~0.25 Mt and larger variance (σ = 0.06) to reflect technological, policy and market uncertainties. The forecast was generated using a stochastic growth equation, which is a time-series process:
X t + 1 X t + N ( µ , σ )
where Xt is the hydrogen production in year t; μ is the annual increment; and σ represents the standard deviation of random fluctuations. This approach simulates how an LSTM captures nonlinear growth patterns and short-term variability. In this synthetic simulation, validation was made conceptual by ensuring that the model’s outputs align with growth rates and crossover points described in authoritative reports. The limitation of this model is that it does not explicitly account for policy changes, energy prices, carbon pricing or technological disruptions that could alter trajectories. Also, the model does not report conventional error metrics (e.g., mean absolute error (MAE), root-mean-squared error (RMSE) and mean absolute percentage error (MAPE)) against a validation set, but instead aligns qualitatively with international energy outlooks.
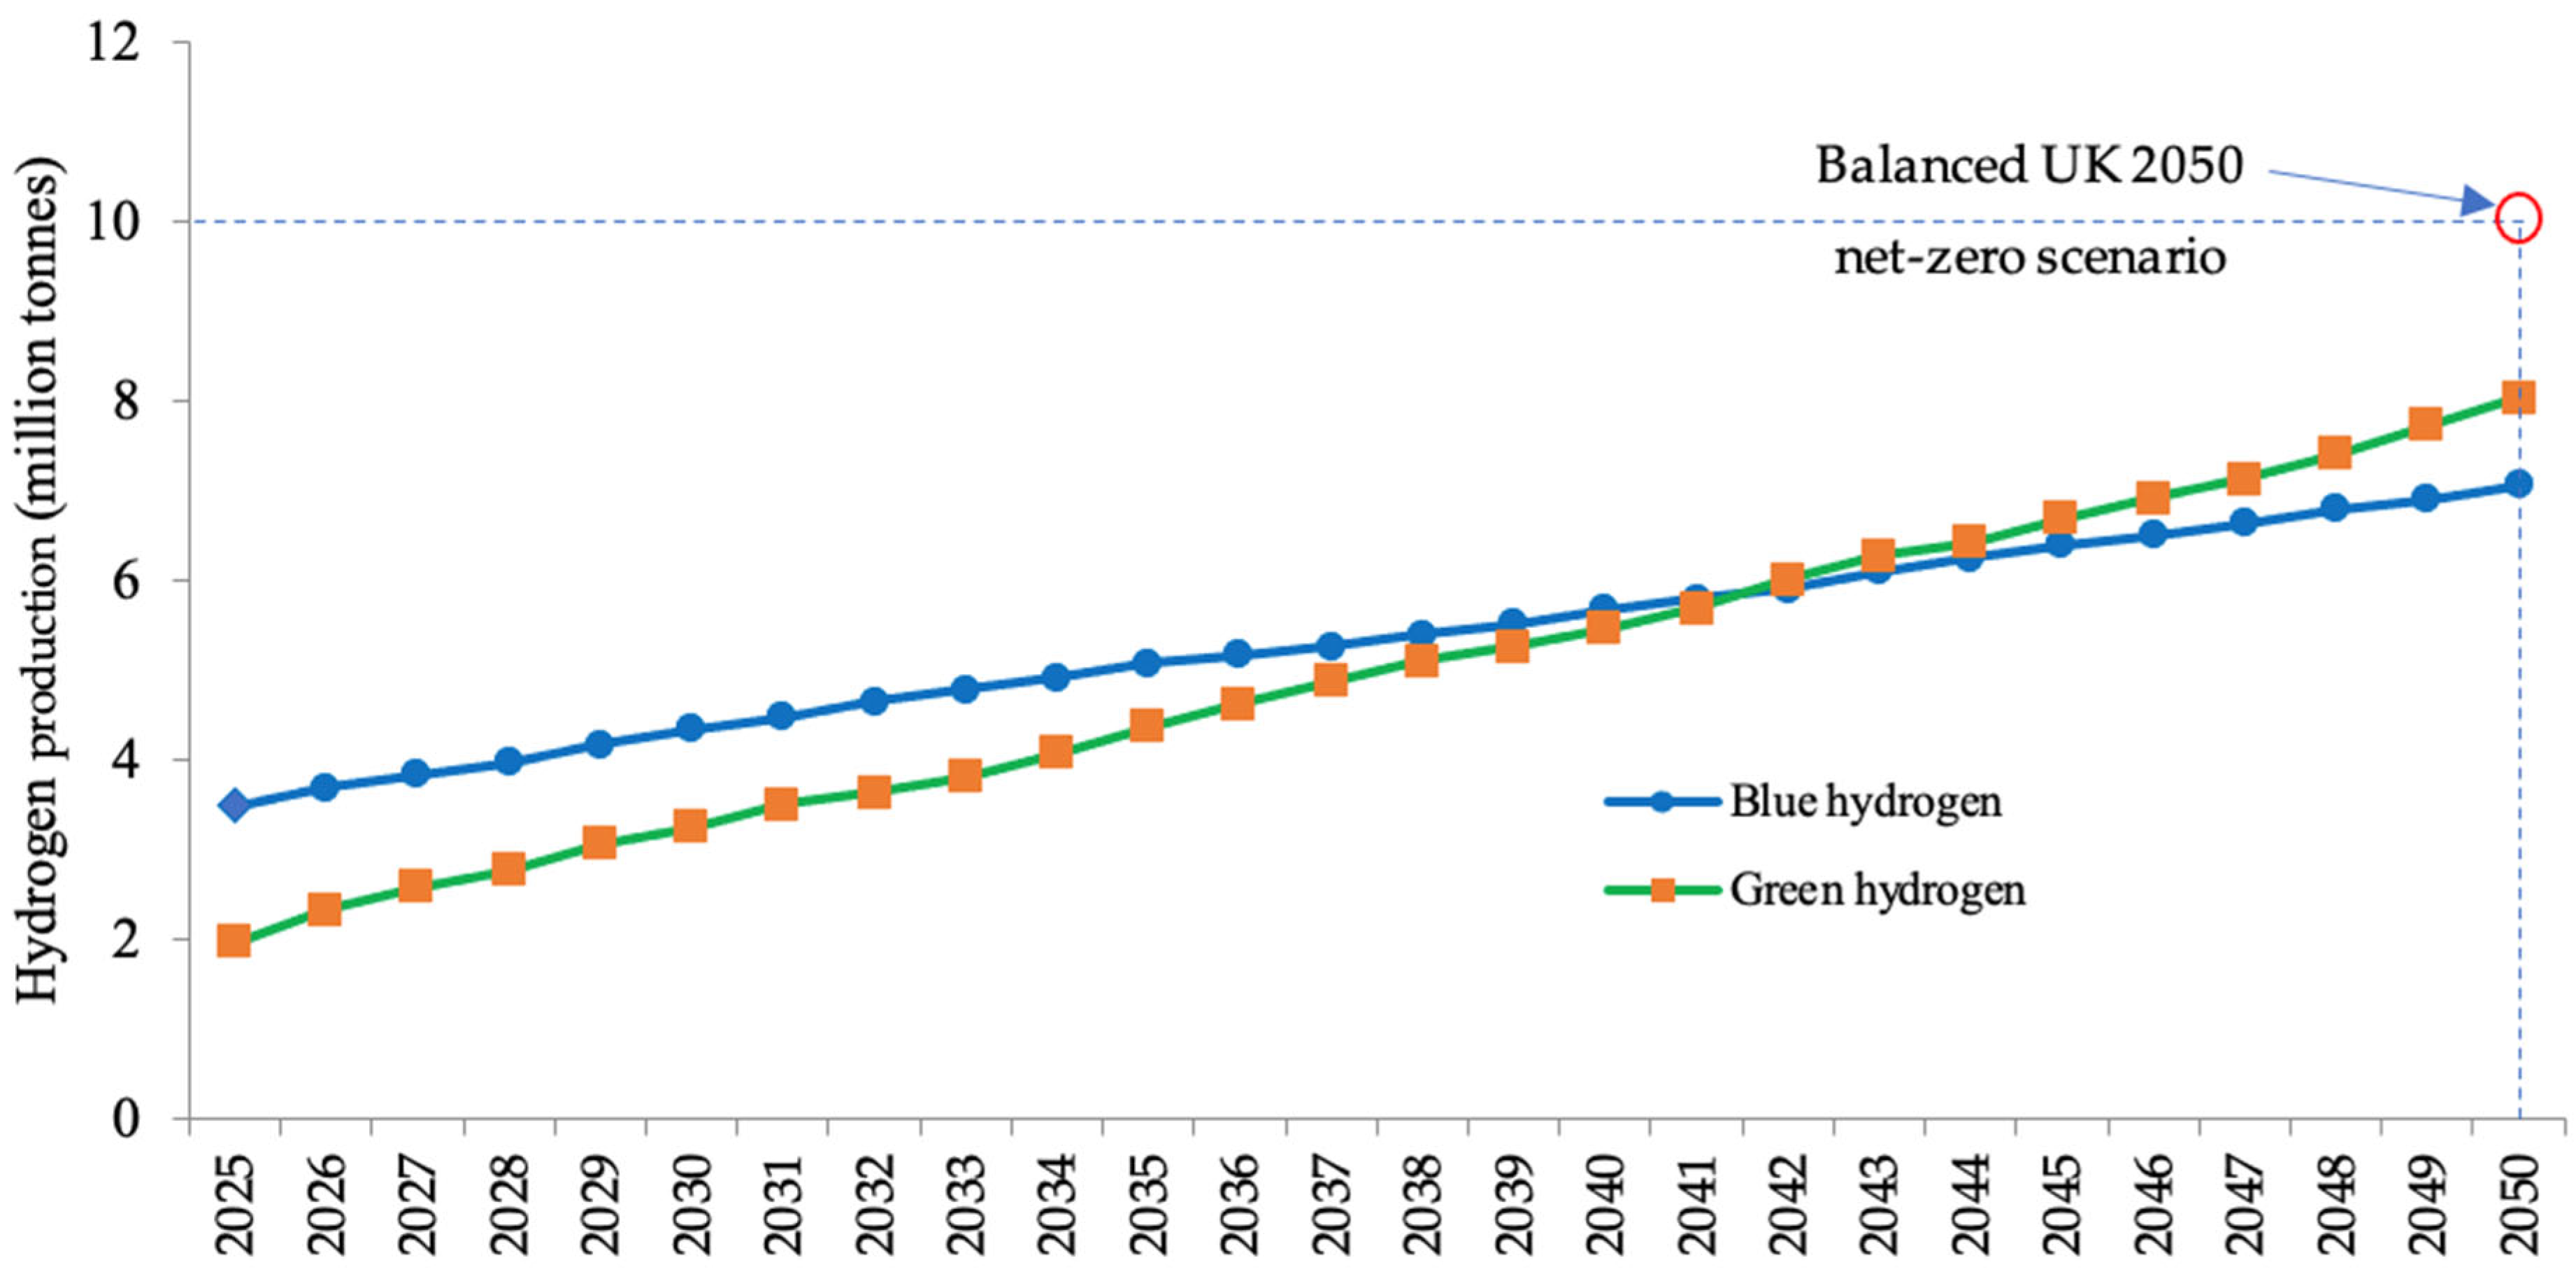
The projection is shown in Figure 19, and Appendix A shows how the LSTM model was coded to produce the result. It can be seen from this LSTM model that both blue and green hydrogen are projected to have an upward trend from 2025, with more blue hydrogen than green hydrogen produced until 2042 when there is equilibrium in the amount of both blue and green hydrogen produced. From 2042 onwards, green hydrogen production is projected to exceed blue hydrogen production. This crossover point signifies a pivotal shift in hydrogen technology preferences.
Also, green hydrogen is clearly projected to have a steeper upward production trajectory than blue hydrogen. This could be a result of current increased focus on more research and development in technologies to optimise green hydrogen production to reduce production costs, as this source of energy is now widely seen as a panacea for substantially reducing carbon emissions and reversing the adverse effects of climate change [259,260].
This result aligns with global decarbonisation targets and suggest that investment and R&D should increasingly favour green hydrogen to ensure long-term sustainability [261]. The projections in Figure 19 for blue and green hydrogen (individually) are just shy of the targets specified by the UK’s Climate Change Committee (CCC) Sixth Carbon Budget [262], which recommended a ‘Balanced Net Zero Pathway’ of 10 million tonnes to achieve net zero by 2050.
While neither green nor blue hydrogen will reach this target, their combination will exceed that of the ‘Balanced Net Zero Pathway’ plan. This is likely to be the case worldwide. As a result, commitments and investments must be ramped up to achieve various global net-zero targets.

5. Conclusions

Hydrogen is increasingly recognised as a cornerstone of future energy systems, offering a versatile, carbon-free energy carrier that can support deep decarbonisation across power generation, industry, transport and energy storage. This review provides a critical assessment of blue and green hydrogen as the two most viable low-carbon pathways. The analysis began by highlighting the unique properties of hydrogen that make it both promising and technically challenging, particularly regarding its storage, transport and safety. These intrinsic characteristics underscore the importance of developing efficient production methods and robust infrastructure to unlock hydrogen’s full potential. Blue hydrogen, derived primarily from natural gas via SMR or coal and biomass gasification integrated with CCUS, currently offers the most scalable and cost-effective low-carbon option. Its climate effectiveness, however, depends strongly on high capture efficiencies and strict control of methane leakage across the natural gas supply chain. Without such measures, we risk undermining blue hydrogen’s role as a decarbonisation tool. In contrast, green hydrogen, produced through water electrolysis powered by renewable energy or advanced routes such as thermochemical, photochemical and photoelectrochemical conversion, has emerged as the most sustainable long-term solution. While still constrained by high capital costs, low electrolyser efficiencies and infrastructure limitations, rapid technological progress and falling renewable energy prices are steadily closing the competitiveness gap.
Comparative life-cycle assessments show that green hydrogen has a substantially lower greenhouse gas footprint, with a range of 0.67 kgCO2-eq/kgH2 to 1.74 kgCO2-eq/kgH2, compared to blue hydrogen, with a range of 1.21 kgCO2-eq/kgH2 to 4.56 kg CO2-eq/kgH2, reinforcing its alignment with net-zero climate goals. Global production analysis reveals that although total low-emission hydrogen capacity remains below 1% of overall output, its momentum is accelerating, with regions such as Europe, China and North America advancing both blue and green hydrogen projects. Current production trends show blue hydrogen leading in terms of deployment, while green hydrogen lags due to financial and technological hurdles. However, regional strategies, particularly in renewable-rich areas like Latin America and the Middle East, indicate strong potential for green hydrogen export hubs by 2040.
Future projections highlight that both pathways will be indispensable in the short to medium term, with blue hydrogen providing a bridge technology to enable early emission reductions while green hydrogen scales. Long-term cost projections suggest a tipping point around the mid-century, when green hydrogen could become cost-competitive with or cheaper than blue hydrogen due to declining electrolyser costs, greater efficiency and abundant renewable integration. The LSTM forecast developed in this study further reinforces this trajectory, predicting that global green hydrogen production will surpass blue hydrogen around 2042, marking a critical shift in hydrogen technology preferences. Importantly, the model aligns with broader energy outlooks, emphasising that neither pathway alone can meet net-zero targets; rather, their combined contributions, supported by strong policy and investment frameworks, will be required. Hydrogen’s role in the energy transition is not a matter of choosing between blue and green hydrogen, but of strategically deploying both in complementary ways. Blue hydrogen, if strictly regulated and coupled with high-performance CCUS, can provide immediate decarbonisation benefits and leverage existing infrastructure. Green hydrogen, on the other hand, represents the ultimate pathway to climate neutrality and energy security, with potential to transform hard-to-abate sectors such as steel, cement and long-distance transport. Coordinated international action through policies, investment in R&D, provision of infrastructure and standardisation of carbon accounting will be crucial to scaling hydrogen production, lowering costs and ensuring environmental integrity. By bridging near-term practicality with long-term sustainability, blue and green hydrogen together can form the backbone of a resilient, low-carbon global economy.

Author Contributions

Conceptualisation, A.M.A., M.A., and B.O.O.; methodology, A.M.A., M.A., and B.O.O.; formal analysis, M.A. and B.O.O.; data curation, M.A. and B.O.O.; writing—original draft preparation, M.A. and B.O.O.; writing—review and editing, M.A., A.M.A., B.O.O., A.E., and I.M.A.; visualisation, B.O.O.; supervision, A.M.A. and B.O.O. All authors have read and agreed to the published version of the manuscript.

Funding

This research received no external funding.

Data Availability Statement

The data are contained within the article.

Conflicts of Interest

The authors declare no conflicts of interest.

Appendix A

import numpy as np
import pandas as pd
import matplotlib.pyplot as plt
from sklearn.preprocessing import MinMaxScaler
from tensorflow.keras.models import Sequential
from tensorflow.keras.layers import LSTM, Dense

# Data
years = np.arange(2010, 2023)
blue_h2 = [1.2, 1.3, 1.4, 1.6, 1.7, 1.9, 2.0, 2.1, 2.3, 2.5, 2.6, 2.8, 3.0]
green_h2 = [0.2, 0.25, 0.3, 0.35, 0.45, 0.5, 0.55, 0.6, 0.7, 0.8, 0.9, 1.1, 1.3]
data = pd.DataFrame({“Blue”: blue_h2, “Green”: green_h2})

# Normalize
scaler = MinMaxScaler()
scaled = scaler.fit_transform(data)

# Sequences
seq_len = 3
X, y = [], []
for i in range(len(scaled) - seq_len):
 X.append(scaled[i:i+seq_len])
 y.append(scaled[i+seq_len])
X, y = np.array(X), np.array(y)

# Model
model = Sequential([
 LSTM(50, activation=‘relu’, input_shape=(seq_len, 2)),
 Dense(2)
])
model.compile(optimizer=‘adam’, loss=‘mse’)
model.fit(X, y, epochs=300, verbose=0)

# Forecast
future_years = np.arange(2023, 2051)
last_seq = scaled[-seq_len:]
preds = []
for _ in future_years:
 pred = model.predict(last_seq[np.newaxis, :, :], verbose=0)[0]
 preds.append(pred)
 last_seq = np.vstack([last_seq [1:], pred])
forecast = scaler.inverse_transform(preds)

# Combine
forecast_df = pd.DataFrame(forecast, columns=[“Blue”, “Green”])
forecast_df[“Year”] = future_years
all_df = pd.concat([data.assign(Year=years), forecast_df], ignore_index=True)

# Plot
plt.figure(figsize=(10,5))
plt.plot(all_df[“Year”], all_df[“Blue”], label=“Blue H2 (LSTM)”)
plt.plot(all_df[“Year”], all_df[“Green”], label=“Green H2 (LSTM)”)
plt.xlabel(“Year”); plt.ylabel(“Million Tonnes”); plt.title(“LSTM Forecast of Hydrogen”)
plt.legend(); plt.grid(); plt.tight_layout()
plt.show()

# Save if needed
all_df.to_excel(“Hydrogen_Production_LSTM_Forecast_2023_2050.xlsx”, index=False)

References

  1. Zhang, J. Energy Access Challenge and the Role of Fossil Fuels in Meeting Electricity Demand: Promoting Renewable Energy Capacity for Sustainable Development. Geosci. Front. 2024, 15, 101873. [Google Scholar] [CrossRef]
  2. Kabir, M.; Habiba, U.E.; Khan, W.; Shah, A.; Rahim, S.; De los Rios-Escalante, P.R.; Farooqi, Z.U.R.; Ali, L. Climate Change Due to Increasing Concentration of Carbon Dioxide and Its Impacts on Environment in 21st Century; a Mini Review. J. King Saud Univ. Sci. 2023, 35, 102693. [Google Scholar] [CrossRef]
  3. Kabir, M.; Habiba, U.; Iqbal, M.Z.; Shafiq, M.; Farooqi, Z.R.; Shah, A.; Khan, W. Impacts of Anthropogenic Activities & Climate Change Resulting from Increasing Concentration of Carbon Dioxide on Environment in 21st Century; A Critical Review. IOP Conf. Ser. Earth Environ. Sci. 2023, 1194, 012010. [Google Scholar] [CrossRef]
  4. Höhne, N.; Gidden, M.J.; den Elzen, M.; Hans, F.; Fyson, C.; Geiges, A.; Jeffery, M.L.; Gonzales-Zuñiga, S.; Mooldijk, S.; Hare, W.; et al. Wave of Net Zero Emission Targets Opens Window to Meeting the Paris Agreement. Nat. Clim. Change 2021, 11, 820–822. [Google Scholar] [CrossRef]
  5. Muchiri, M.K.; Erdei-Gally, S.; Fekete-Farkas, M.; Lakner, Z. Bibliometric Analysis of Green Finance and Climate Change in Post-Paris Agreement Era. J. Risk Financ. Manag. 2022, 15, 561. [Google Scholar] [CrossRef]
  6. King, L.C.; van den Bergh, J.C.J.M. Potential Carbon Leakage under the Paris Agreement. Clim. Change 2021, 165, 52. [Google Scholar] [CrossRef]
  7. Hassan, Q.; Algburi, S.; Sameen, A.Z.; Jaszczur, M.; Salman, H.M. Hydrogen as an Energy Carrier: Properties, Storage Methods, Challenges, and Future Implications. Environ. Syst. Decis. 2024, 44, 327–350. [Google Scholar] [CrossRef]
  8. Zhang, L.; Jia, C.; Bai, F.; Wang, W.; An, S.; Zhao, K.; Li, Z.; Li, J.; Sun, H. A Comprehensive Review of the Promising Clean Energy Carrier: Hydrogen Production, Transportation, Storage, and Utilisation (HPTSU) Technologies. Fuel 2024, 355, 129455. [Google Scholar] [CrossRef]
  9. Geopolitics of the Energy Transformation: The Hydrogen Factor; The International Renewable Energy Agency (IRENA): Abu Dhabi, United Arab Emirates, 2022; p. 117.
  10. Yu, M.; Wang, K.; Vredenburg, H. Insights into Low-Carbon Hydrogen Production Methods: Green, Blue and Aqua Hydrogen. Int. J. Hydrogen Energy 2021, 46, 21261–21273. [Google Scholar] [CrossRef]
  11. Rosenow, J.; Lowes, R. Will Blue Hydrogen Lock Us into Fossil Fuels Forever? One Earth 2021, 4, 1527–1529. [Google Scholar] [CrossRef]
  12. Cloete, S.; Arnaiz del Pozo, C.; Jiménez Álvaro, Á. System-Friendly Process Design: Optimizing Blue Hydrogen Production for Future Energy Systems. Energy 2022, 259, 124954. [Google Scholar] [CrossRef]
  13. Hassan, Q.; Sameen, A.Z.; Salman, H.M.; Jaszczur, M. Large-Scale Green Hydrogen Production via Alkaline Water Electrolysis Using Solar and Wind Energy. Int. J. Hydrogen Energy 2023, 48, 34299–34315. [Google Scholar] [CrossRef]
  14. Hassan, N.S.; Jalil, A.A.; Rajendran, S.; Khusnun, N.F.; Bahari, M.B.; Johari, A.; Kamaruddin, M.J.; Ismail, M. Recent Review and Evaluation of Green Hydrogen Production via Water Electrolysis for a Sustainable and Clean Energy Society. Int. J. Hydrogen Energy 2024, 52, 420–441. [Google Scholar] [CrossRef]
  15. Shin, H.; Jang, D.; Lee, S.; Cho, H.S.; Kim, K.H.; Kang, S. Techno-Economic Evaluation of Green Hydrogen Production with Low-Temperature Water Electrolysis Technologies Directly Coupled with Renewable Power Sources. Energy Convers. Manag. 2023, 286, 117083. [Google Scholar] [CrossRef]
  16. Arcos, J.M.M.; Santos, D.M.F. The Hydrogen Color Spectrum: Techno-Economic Analysis of the Available Technologies for Hydrogen Production. Gases 2023, 3, 25–46. [Google Scholar] [CrossRef]
  17. Hordeski, M.F. Alternative Fuels: The Future of Hydrogen, 3rd ed.; Taylor & Francis Group: Oxford, UK, 2020. [Google Scholar] [CrossRef]
  18. Zohuri, B. Hydrogen Energy: Challenges and Solutions for a Cleaner Future; Springer International Publishing AG: Cham, Switzerland, 2018; pp. 1–283. [Google Scholar] [CrossRef]
  19. Hoffmann, P. The Forever Fuel: The Story of Hydrogen; Westview Press: Boulder, CO, USA, 2019; pp. 1–271. [Google Scholar] [CrossRef]
  20. Nouni, M.R.; Manna, J. Green Hydrogen: An Introduction. In Challenges and Opportunities in Green Hydrogen Production. Energy, Environment, and Sustainability; Part F2879; Springer: Singapore, 2024; pp. 9–38. [Google Scholar] [CrossRef]
  21. Bin Navaid, H.; Emadi, H.; Watson, M. A Comprehensive Literature Review on the Challenges Associated with Underground Hydrogen Storage. Int. J. Hydrogen Energy 2023, 48, 10603–10635. [Google Scholar] [CrossRef]
  22. Ince, M.; Ince, O.K. Hydrocarbon Pollution and Its Effect on the Environment; IntechOpen: London, UK, 2019. [Google Scholar]
  23. Panigrahi, P.K.; Chandu, B.; Motapothula, M.R.; Puvvada, N. Potential Benefits, Challenges and Perspectives of Various Methods and Materials Used for Hydrogen Storage. Energy Fuels 2024, 38, 2630–2653. [Google Scholar] [CrossRef]
  24. Lin, Z.J.; Mahammed, S.A.R.; Liu, T.F.; Cao, R. Multifunctional Porous Hydrogen-Bonded Organic Frameworks: Current Status and Future Perspectives. ACS Cent. Sci. 2022, 8, 1589–1608. [Google Scholar] [CrossRef] [PubMed]
  25. Peng, S. Storage and Application of Hydrogen Energy. In Electrochemical Hydrogen Production from Water Splitting; Springer: Singapore, 2023; pp. 203–235. [Google Scholar] [CrossRef]
  26. Climate Change: Science and Solutions Hydrogen and Ammonia 1 Climate Change: Science and Solutions|Briefing 4. Available online: https://pdf4pro.com/view/climate-change-science-and-solutions-briefing-4-663daa.html (accessed on 5 November 2025).
  27. Orlova, S.; Mezeckis, N.; Vasudev, V.P.K. Compression of Hydrogen Gas for Energy Storage: A Review. Latv. J. Phys. Tech. Sci. 2023, 60, 4–16. [Google Scholar] [CrossRef]
  28. Sakoda, N.; Shindo, K.; Shinzato, K.; Kohno, M.; Takata, Y.; Fujii, M. Review of the Thermodynamic Properties of Hydrogen Based on Existing Equations of State. Int. J. Thermophys. 2010, 31, 276–296. [Google Scholar] [CrossRef]
  29. Hoschke, J.; Chowdhury, M.F.W.; Venezuela, J.; Atrens, A. A Review of Hydrogen Embrittlement in Gas Transmission Pipeline Steels. Corros. Rev. 2023, 41, 277–317. [Google Scholar] [CrossRef]
  30. Li, H.; Cao, X.; Liu, Y.; Shao, Y.; Nan, Z.; Teng, L.; Peng, W.; Bian, J. Safety of Hydrogen Storage and Transportation: An Overview on Mechanisms, Techniques, and Challenges. Energy Rep. 2022, 8, 6258–6269. [Google Scholar] [CrossRef]
  31. Hydrogen Pipelines|Department of Energy. Available online: https://www.energy.gov/eere/fuelcells/hydrogen-pipelines (accessed on 19 August 2025).
  32. Ausfelder, F.; Beilmann, C.; Bertau, M.; Bräuninger, S.; Heinzel, A.; Hoer, R.; Koch, W.; Mahlendorf, F.; Metzelthin, A.; Peuckert, M.; et al. Energy Storage as Part of a Secure Energy Supply. ChemBioEng Rev. 2017, 4, 144–210. [Google Scholar] [CrossRef]
  33. Chatterjee, S.; Parsapur, R.K.; Huang, K.W. Limitations of Ammonia as a Hydrogen Energy Carrier for the Transportation Sector. ACS Energy Lett. 2021, 6, 4390–4394. [Google Scholar] [CrossRef]
  34. Di Martino, R.M.C.; Maxwell, B.D.; Pirali, T. Deuterium in Drug Discovery: Progress, Opportunities and Challenges. Nat. Rev. Drug Discov. 2023, 22, 562–584. [Google Scholar] [CrossRef] [PubMed]
  35. Incer-Valverde, J.; Korayem, A.; Tsatsaronis, G.; Morosuk, T. “Colors” of Hydrogen: Definitions and Carbon Intensity. Energy Convers. Manag. 2023, 291, 117294. [Google Scholar] [CrossRef]
  36. El-Adawy, M.; Dalha, I.B.; Ismael, M.A.; Al-Absi, Z.A.; Nemitallah, M.A. Review of Sustainable Hydrogen Energy Processes: Production, Storage, Transportation, and Color-Coded Classifications. Energy Fuels 2024, 38, 22686–22718. [Google Scholar] [CrossRef]
  37. Franco, A.; Giovannini, C. Recent and Future Advances in Water Electrolysis for Green Hydrogen Generation: Critical Analysis and Perspectives. Sustainability 2023, 15, 16917. [Google Scholar] [CrossRef]
  38. Hasan, M.M.; Rasul, M.G.; Jahirul, M.I.; Sattar, M.A.; Hassan, N.M.S. Hydrogen Horizons: Navigating Challenges and Opportunities for a Sustainable Energy Future. In Proceedings of the 2023 International Conference on Sustainable Technology and Engineering (i-COSTE), Nadi, Fiji, 4–6 December 2023. [Google Scholar] [CrossRef]
  39. Lubbe, F.; Rongé, J.; Bosserez, T.; Martens, J.A. Golden Hydrogen. Curr. Opin. Green Sustain. Chem. 2023, 39, 100732. [Google Scholar] [CrossRef]
  40. Ingale, G.U.; Kwon, H.M.; Jeong, S.; Park, D.; Kim, W.; Bang, B.; Lim, Y., II; Kim, S.W.; Kang, Y.B.; Mun, J.; et al. Assessment of Greenhouse Gas Emissions from Hydrogen Production Processes: Turquoise Hydrogen vs. Steam Methane Reforming. Energies 2022, 15, 8679. [Google Scholar] [CrossRef]
  41. Boretti, D.A. Advances in Sustainable Turquoise Hydrogen Production via Methane Pyrolysis in Molten Metals. Clean. Chem. Eng. 2025, 11, 100139. [Google Scholar] [CrossRef]
  42. The Hydrogen Colour Spectrum|National Grid. Available online: https://www.nationalgrid.com/stories/energy-explained/hydrogen-colour-spectrum (accessed on 5 November 2025).
  43. Joseph, V.; Oghenegare, E. Article No.JENRR.99222 Review Article Joseph and Oghenegare. J. Energy Res. Rev. 2023, 13, 64–79. [Google Scholar] [CrossRef]
  44. AlHumaidan, F.S.; Absi Halabi, M.; Rana, M.S.; Vinoba, M. Blue Hydrogen: Current Status and Future Technologies. Energy Convers. Manag. 2023, 283, 116840. [Google Scholar] [CrossRef]
  45. Massarweh, O.; Al-khuzaei, M.; Al-Shafi, M.; Bicer, Y.; Abushaikha, A.S. Blue Hydrogen Production from Natural Gas Reservoirs: A Review of Application and Feasibility. J. CO2 Util. 2023, 70, 102438. [Google Scholar] [CrossRef]
  46. Sovacool, B.K.; Del Rio, D.F.; Herman, K.; Iskandarova, M.; Uratani, J.M.; Griffiths, S. Reconfiguring European Industry for Net-Zero: A Qualitative Review of Hydrogen and Carbon Capture Utilisation and Storage Benefits and Implementation Challenges. Energy Environ. Sci. 2024, 17, 3523–3569. [Google Scholar] [CrossRef]
  47. Noussan, M.; Raimondi, P.P.; Scita, R.; Hafner, M. The Role of Green and Blue Hydrogen in the Energy Transition—A Technological and Geopolitical Perspective. Sustainability 2020, 13, 298. [Google Scholar] [CrossRef]
  48. Página No Encontrada—CERTIFHY. Available online: https://www.certifhy.eu/images/media/files/CertifHy_2_deliverables/CertifHy_H2-criteria-definition_V1-1_2019-03-13_clean_endorsed.pdf (accessed on 20 August 2025).
  49. Simoes, S.G.; Catarino, J.; Picado, A.; Lopes, T.F.; di Berardino, S.; Amorim, F.; Gírio, F.; Rangel, C.M.; Ponce de Leão, T. Water Availability and Water Usage Solutions for Electrolysis in Hydrogen Production. J. Clean. Prod. 2021, 315, 128124. [Google Scholar] [CrossRef]
  50. Verma, A.; Kumar, A. Life Cycle Assessment of Hydrogen Production from Underground Coal Gasification. Appl. Energy 2015, 147, 556–568. [Google Scholar] [CrossRef]
  51. Al-Qahtani, A.; Parkinson, B.; Hellgardt, K.; Shah, N.; Guillen-Gosalbez, G. Uncovering the True Cost of Hydrogen Production Routes Using Life Cycle Monetisation. Appl. Energy 2021, 281, 115958. [Google Scholar] [CrossRef]
  52. Rafique, N.; Khalil, F.K.; Ullah, I.U.I.; Abbas, M.T.; Safdar, M.; Aziz, U. Hydrogen fuel cell technology: A sustainable future for mechanical power systems. Spectr. Eng. Sci. 2025, 3, 214–224. [Google Scholar] [CrossRef]
  53. Wismann, S.T. Electrically Heated Steam Methane Reforming; Technical University of Denmark: Lyngby, Denmark, 2019. [Google Scholar]
  54. Wang, N.; Otor, H.O.; Rivera-Castro, G.; Hicks, J.C. Plasma Catalysis for Hydrogen Production: A Bright Future for Decarbonisation. ACS Catal. 2024, 14, 6749–6798. [Google Scholar] [CrossRef]
  55. Yusuf, B.O.; Umar, M.; Kotob, E.; Abdulhakam, A.; Taialla, O.A.; Awad, M.M.; Hussain, I.; Alhooshani, K.R.; Ganiyu, S.A. Recent Advances in Bimetallic Catalysts for Methane Steam Reforming in Hydrogen Production: Current Trends, Challenges, and Future Prospects. Chem. An Asian J. 2024, 19, e202300641. [Google Scholar] [CrossRef] [PubMed]
  56. Navarro, R.M.; Guil, R.; Fierro, J.L.G. Introduction to Hydrogen Production. In Compendium of Hydrogen Energy; Woodhead Publishing: London, UK, 2015; pp. 21–61. [Google Scholar] [CrossRef]
  57. Supported Metals in Catalysis (2nd Edition)—Google Books. Available online: https://books.google.co.uk/books?hl=en&lr=&id=Bk67CgAAQBAJ&oi=fnd&pg=PA301&dq=A+typical+nickel+(Ni)+catalyst+speeds+the+turnover+frequency+of+approximately+0.5s-1+at+723+K+under+industrial+conditions,+leading+to+CH4+conversion+of+about+10%25&ots=NYtVVjPi6b&sig=x0Xnv4UEm0BRlIHca7pi0RIjmpk&redir_esc=y#v=onepage&q&f=false (accessed on 20 August 2025).
  58. Pashchenko, D. Intra-Particle Diffusion Limitation for Steam Methane Reforming over a Ni-Based Catalyst. Fuel 2023, 353, 129205. [Google Scholar] [CrossRef]
  59. Deng, M.; Liu, J.; Zhang, X.; Li, J.; Fu, L. Energy and Parameter Analysis of SOFC System for Hydrogen Production from Methane Steam Reforming. J. Therm. Sci. 2022, 31, 2088–2110. [Google Scholar] [CrossRef]
  60. Ma, J.; Jiang, B.; Gao, Y.; Yu, K.; Lv, Z.; Si-ma, W.; Yuan, D.; Tang, D. A Compact and High-Efficiency Electrified Reactor for Hydrogen Production by Methane Steam Reforming. Int. J. Hydrogen Energy 2022, 47, 41421–41431. [Google Scholar] [CrossRef]
  61. Didenko, L.P.; Babak, V.N.; Sementsova, L.A.; Dorofeeva, T.V.; Chizhov, P.E.; Gorbunov, S.V. Steam Conversion of Ethane and Methane–Ethane Mixtures in a Membrane Reactor with a Foil Made of a Pd–Ru Alloy. Membr. Membr. Technol. 2023, 5, 69–79. [Google Scholar] [CrossRef]
  62. Gupta, A.; Kumar, R.; Sharma, J.P.; Ahmadi, M.H.; Najser, J.; Blazek, V.; Prokop, L. The Role of Catalyst in Hydrogen Production: A Critical Review. J. Therm. Anal. Calorim. 2024, 149, 14517–14534. [Google Scholar] [CrossRef]
  63. Fowles, M.; Carlsson, M. Steam Reforming of Hydrocarbons for Synthesis Gas Production. Top. Catal. 2021, 64, 856–875. [Google Scholar] [CrossRef]
  64. Jeong, D.W.; Subramanian, V.; Shim, J.O.; Jang, W.J.; Seo, Y.C.; Roh, H.S.; Gu, J.H.; Lim, Y.T. High-Temperature Water Gas Shift Reaction over Fe/Al/Cu Oxide Based Catalysts Using Simulated Waste-Derived Synthesis Gas. Catal. Lett. 2013, 143, 438–444. [Google Scholar] [CrossRef]
  65. Chakrabarti, D.; De Klerk, A.; Prasad, V.; Gnanamani, M.K.; Shafer, W.D.; Jacobs, G.; Sparks, D.E.; Davis, B.H. Conversion of CO2over a Co-Based Fischer-Tropsch Catalyst. Ind. Eng. Chem. Res. 2015, 54, 1189–1196. [Google Scholar] [CrossRef]
  66. Krótki, A.; Bigda, J.; Spietz, T.; Ignasiak, K.; Matusiak, P.; Kowol, D. Performance Evaluation of Pressure Swing Adsorption for Hydrogen Separation from Syngas and Water–Gas Shift Syngas. Energies 2025, 18, 1887. [Google Scholar] [CrossRef]
  67. Kim, Y.; Yang, H. Hydrogen Purity: Influence of Production Methods, Purification Techniques, and Analytical Approaches. Energies 2025, 18, 741. [Google Scholar] [CrossRef]
  68. Mohd Yunus, S.; Yusup, S.; Johari, S.S.; Mohd Afandi, N.; Manap, A.; Mohamed, H. Comparative Hydrogen Production Routes via Steam Methane Reforming and Chemical Looping Reforming of Natural Gas as Feedstock. Hydrogen 2024, 5, 761–775. [Google Scholar] [CrossRef]
  69. Pangestu, M.R.G.; Malaibari, Z.; Muhammad, A.; Al-Rowaili, F.N.; Zahid, U. Comprehensive Review on Methane Pyrolysis for Sustainable Hydrogen Production. Energy Fuels 2024, 38, 13514–13538. [Google Scholar] [CrossRef]
  70. Oh, T.; Lee, S. Optimisation of Steam-Methane Reforming Process Using PSA off Gas. Int. J. Hydrogen Energy 2024, 95, 902–915. [Google Scholar] [CrossRef]
  71. Bauer, C.; Treyer, K.; Antonini, C.; Bergerson, J.; Gazzani, M.; Gencer, E.; Gibbins, J.; Mazzotti, M.; McCoy, S.T.; McKenna, R.; et al. On the Climate Impacts of Blue Hydrogen Production. Sustain. Energy Fuels 2021, 6, 66–75. [Google Scholar] [CrossRef]
  72. Davids, D.; Grant, N.; Mittal, S.; Hawkes, A.; Oluleye, G. Impact of Methane Leakage Rate and Carbon Capture Rate on Blue Hydrogen Sustainability Using Combined Warming Index. Appl. Energy 2025, 394, 125888. [Google Scholar] [CrossRef]
  73. Wu, W.; Zhai, H.; Holubnyak, E. Technological Evolution of Large-Scale Blue Hydrogen Production toward the U.S. Hydrogen Energy Earthshot. Nat. Commun. 2024, 15, 5684. [Google Scholar] [CrossRef]
  74. Novotny, V. Blue Hydrogen Can Be a Source of Green Energy in the Period of Decarbonisation. Int. J. Hydrogen Energy 2023, 48, 7202–7218. [Google Scholar] [CrossRef]
  75. Shirizadeh, B.; Villavicencio, M.; Douguet, S.; Trüby, J.; Bou Issa, C.; Seck, G.S.; D’herbemont, V.; Hache, E.; Malbec, L.M.; Sabathier, J.; et al. The Impact of Methane Leakage on the Role of Natural Gas in the European Energy Transition. Nat. Commun. 2023, 14, 5756. [Google Scholar] [CrossRef] [PubMed]
  76. Fox, T.A.; Barchyn, T.E.; Risk, D.; Ravikumar, A.P.; Hugenholtz, C.H. A Review of Close-Range and Screening Technologies for Mitigating Fugitive Methane Emissions in Upstream Oil and Gas. Environ. Res. Lett. 2019, 14, 053002. [Google Scholar] [CrossRef]
  77. Financing Solutions to Reduce Natural Gas Flaring and Methane Emissions—Gianni Lorenzato, Silvana Tordo, Berend van Den Berg, Huw Martyn Howells—Google Books. Available online: https://books.google.co.uk/books?hl=en&lr=&id=TU9uEAAAQBAJ&oi=fnd&pg=PP1&dq=replacing+outdated+equipment+such+as+high-bleed+pneumatic+controllers,+improving+pipeline+integrity+and+implementing+best+practices+in+natural+gas+production+sites+can+minimize+methane+leakage&ots=rixXngyumO&sig=f9Y38Ba3iiemeEM2Wr6TEKe3MJg&redir_esc=y#v=onepage&q&f=false (accessed on 27 August 2025).
  78. Ruokonen, J.; Nieminen, H.; Dahiru, A.R.; Laari, A.; Koiranen, T.; Laaksonen, P.; Vuokila, A.; Huuhtanen, M. Modelling and Cost Estimation for Conversion of Green Methanol to Renewable Liquid Transport Fuels via Olefin Oligomerisation. Processes 2021, 9, 1046. [Google Scholar] [CrossRef]
  79. Olczak, M.; Piebalgs, A.; Balcombe, P. A Global Review of Methane Policies Reveals That Only 13% of Emissions Are Covered with Unclear Effectiveness. One Earth 2023, 6, 519–535. [Google Scholar] [CrossRef]
  80. Pettersen, J.; Steeneveldt, R.; Grainger, D.; Scott, T.; Holst, L.M.; Hamborg, E.S. Blue Hydrogen Must Be Done Properly. Energy Sci. Eng. 2022, 10, 3220–3236. [Google Scholar] [CrossRef]
  81. Sharma, G.; Dewangan, A.K.; Yadav, A.K.; Ahmad, A. Feasibility of Waste-to-Hydrogen Generation System Based on Gasification/Pyrolysis: A Comprehensive Review of Experimental Studies. J. Therm. Anal. Calorim. 2024, 149, 13629–13651. [Google Scholar] [CrossRef]
  82. Wang, B.; Li, W.; Ma, C.; Yang, W.; Pudasainee, D.; Gupta, R.; Sun, L. Synergistic Effect on the Co-Gasification of Petroleum Coke and Carbon-Based Feedstocks: A State-of-the-Art Review. J. Energy Inst. 2022, 102, 1–13. [Google Scholar] [CrossRef]
  83. Rauch, R.; Kiros, Y.; Engvall, K.; Kantarelis, E.; Brito, P.; Nobre, C.; Santos, S.M.; Graefe, P.A. Hydrogen from Waste Gasification. Hydrogen 2024, 5, 70–101. [Google Scholar] [CrossRef]
  84. Singh, A.; Shivapuji, A.M.; Dasappa, S. Hydrogen Production through Agro-Residue Gasification and Adsorptive Separation. Appl. Therm. Eng. 2023, 234, 121247. [Google Scholar] [CrossRef]
  85. Dada, T.K.; Sheehan, M.; Murugavelh, S.; Antunes, E. A Review on Catalytic Pyrolysis for High-Quality Bio-Oil Production from Biomass. Biomass Convers. Biorefinery 2021, 13, 2595–2614. [Google Scholar] [CrossRef]
  86. Brar, J.S.; Singh, K.; Wang, J.; Kumar, S. Cogasification of Coal and Biomass: A Review. Int. J. For. Res. 2012, 2012, 363058. [Google Scholar] [CrossRef]
  87. Istiqamah, D.A.; Boedoyo, M.S.; Thamrin, S. Coal Gasification Technology to Support the Energy Transition: Opportunities and Challenges. Int. J. Humanit. Educ. Soc. Sci. 2024, 3, 2007–2015. [Google Scholar] [CrossRef]
  88. Smith, K.H.; Stanislowski, J.J.; Swanson, M.L.; Siefert, N.S. Biomass and Coal Cofiring Gasification with Pre-Combustion Carbon Capture: Impact of Mixed Feedstocks on CO2 Absorption Using a Physical Solvent. Int. J. Greenh. Gas Control 2025, 141, 104300. [Google Scholar] [CrossRef]
  89. Emery Energy Company, LLC. Executive Summary Extended Operational Runs on Emery Hybrid Gasifier to Accelerate Commercial Adoption. 2012. Available online: https://www.uwyo.edu/ser/_files/docs/cleancoal/executive-summary-reports/2009/final-executive-summary-phillips-2009.pdf (accessed on 20 August 2025).
  90. Romero, M.; German, B.; Rivadeneira, D.; Chulde, D.; Chico-Proano, A.; Narvaez, R.A.; Martinez-Gomez, J. Assessment of Pilot Scale Pyrolysis Gas Production as Fuel for Cogeneration. Chem. Eng. Trans. 2022, 92, 211–216. [Google Scholar] [CrossRef]
  91. State, R.N.; Volceanov, A.; Muley, P.; Boldor, D. A Review of Catalysts Used in Microwave Assisted Pyrolysis and Gasification. Bioresour. Technol. 2019, 277, 179–194. [Google Scholar] [CrossRef]
  92. Miroshnychenko, D.; Korchak, B.; Ungureanu, N.; Vlădut, N.-V.; Tefan, B.; Ionescu, M.; Gheorghiță, N.-E. Municipal Solid Waste Gasification: Technologies, Process Parameters, and Sustainable Valorisation of By-Products in a Circular Economy. Sustainability 2025, 17, 6704. [Google Scholar] [CrossRef]
  93. Frolov, S.M. Organic Waste Gasification: A Selective Review. Fuels 2021, 2, 556–650. [Google Scholar] [CrossRef]
  94. Kun, U.H.; Ksepko, E. Advancing Municipal Solid Waste Management Through Gasification Technology. Process 2025, 13, 2000. [Google Scholar] [CrossRef]
  95. Kelley, M.A.; Jakulewicz, M.S.; Dreyer, C.B.; Parker, T.E.; Porter, J.M. System Overview and Characterisation of a High-Temperature, High-Pressure, Entrained-Flow, Laboratory-Scale Gasifier. Rev. Sci. Instrum. 2015, 86, 55106. [Google Scholar] [CrossRef] [PubMed]
  96. Dossow, M.; Klüh, D.; Umeki, K.; Gaderer, M.; Spliethoff, H.; Fendt, S. Electrification of Gasification-Based Biomass-to-X Processes—A Critical Review and in-Depth Assessment. Energy Environ. Sci. 2024, 17, 925–973. [Google Scholar] [CrossRef]
  97. Zisopoulos, G.; Detsios, N.; Atsonios, K.; Nikolopoulos, N.; Grammelis, P. Process Analysis and Design Considerations of a Low Carbon Methanol Synthesis Plant from Lignite/Waste Gasification. Fuels 2022, 3, 245–274. [Google Scholar] [CrossRef]
  98. Baraj, E.; Ciahotný, K.; Hlinčík, T. The Water Gas Shift Reaction: Catalysts and Reaction Mechanism. Fuel 2021, 288, 119817. [Google Scholar] [CrossRef]
  99. Cui, X.; Su, H.Y.; Chen, R.; Yu, L.; Dong, J.; Ma, C.; Wang, S.; Li, J.; Yang, F.; Xiao, J.; et al. Room-Temperature Electrochemical Water–Gas Shift Reaction for High Purity Hydrogen Production. Nat. Commun. 2019, 10, 86. [Google Scholar] [CrossRef]
  100. Boruah, A.; Phukan, A.; Singh, S. Utilisation of Coal for Hydrogen Generation. Int. J. Coal Prep. Util. 2024, 45, 1412–1433. [Google Scholar] [CrossRef]
  101. Oviroh, P.O.; Oyinbo, S.T.; Karimzadeh, S.; Imoisili, P.E.; Jen, T.-C. Technologies of Hydrogen Generation and Purification. Emerg. At. Layer Depos. Hydrog. Energy 2025, 348, 27–76. [Google Scholar] [CrossRef]
  102. Porshnov, D. Evolution of Pyrolysis and Gasification as Waste to Energy Tools for Low Carbon Economy. Wiley Interdiscip. Rev. Energy Environ. 2022, 11, e421. [Google Scholar] [CrossRef]
  103. Mishra, A.; Gautam, S.; Sharma, T. Effect of Operating Parameters on Coal Gasification. Int. J. Coal Sci. Technol. 2018, 5, 113–125. [Google Scholar] [CrossRef]
  104. Wu, Y.; Wang, H.; Li, H.; Han, X.; Zhang, M.; Sun, Y.; Fan, X.; Tu, R.; Zeng, Y.; Xu, C.C.; et al. Applications of Catalysts in Thermochemical Conversion of Biomass (Pyrolysis, Hydrothermal Liquefaction and Gasification): A Critical Review. Renew. Energy 2022, 196, 462–481. [Google Scholar] [CrossRef]
  105. Bashir, M.A.; Ji, T.; Weidman, J.; Soong, Y.; Gray, M.; Shi, F.; Wang, P. Plastic Waste Gasification for Low-Carbon Hydrogen Production: A Comprehensive Review. Energy Adv. 2025, 4, 330–363. [Google Scholar] [CrossRef]
  106. Jayanarasimhan, A.; Pathak, R.M.; Shivapuji, A.M.; Rao, L. Tar Formation in Gasification Systems: A Holistic Review of Remediation Approaches and Removal Methods. ACS Omega 2024, 9, 2060–2079. [Google Scholar] [CrossRef]
  107. Lysne, A.; Saxrud, I.; Snidaro, R.L.G.; Blekkan, E.A. Noble Metal (Pt, Pd and Rh) Promoted Ni-Co/Mg(Al)O Catalysts for Steam Reforming of Tar Impurities from Biomass Gasification. J. Catal. 2024, 436, 115567. [Google Scholar] [CrossRef]
  108. Xu, M.-X.; Liu, Z.-S.; Zhang, X.-Y.; Di, J.-Y.; Meng, X.-X.; Zhao, L.; Lu, Q. Steam Reforming of Biomass Gasification Tar over Ni-Based Catalyst Supported by TiO2-SiO2 Composite. Fuel 2023, 343, 127934. [Google Scholar] [CrossRef]
  109. Naikoo, G.A.; Arshad, F.; Hassan, I.U.; Tabook, M.A.; Pedram, M.Z.; Mustaqeem, M.; Tabassum, H.; Ahmed, W.; Rezakazemi, M. Thermocatalytic Hydrogen Production Through Decomposition of Methane-A Review. Front. Chem. 2021, 9, 736801. [Google Scholar] [CrossRef]
  110. Panigrahy, B.; Narayan, K.; Ramachandra Rao, B. Green Hydrogen Production by Water Electrolysis: A Renewable Energy Perspective. Mater. Today Proc. 2022, 67, 1310–1314. [Google Scholar] [CrossRef]
  111. Hassan, Q.; Tabar, V.S.; Sameen, A.Z.; Salman, H.M.; Jaszczur, M. A Review of Green Hydrogen Production Based on Solar Energy; Techniques and Methods. Energy Harvest. Syst. 2024, 11, 20220134. [Google Scholar] [CrossRef]
  112. Noor Azam, A.M.I.; Li, N.K.; Zulkefli, N.N.; Masdar, M.S.; Majlan, E.H.; Baharuddin, N.A.; Mohd Zainoodin, A.; Mohamad Yunus, R.; Shamsul, N.S.; Husaini, T.; et al. Parametric Study and Electrocatalyst of Polymer Electrolyte Membrane (PEM) Electrolysis Performance. Polymers 2023, 15, 560. [Google Scholar] [CrossRef] [PubMed]
  113. Yuan, X.Z.; Shaigan, N.; Song, C.; Aujla, M.; Neburchilov, V.; Kwan, J.T.H.; Wilkinson, D.P.; Bazylak, A.; Fatih, K. The Porous Transport Layer in Proton Exchange Membrane Water Electrolysis: Perspectives on a Complex Component. Sustain. Energy Fuels 2022, 6, 1824–1853. [Google Scholar] [CrossRef]
  114. Wang, Y.; Pang, Y.; Xu, H.; Martinez, A.; Chen, K.S. PEM Fuel Cell and Electrolysis Cell Technologies and Hydrogen Infrastructure Development—A Review. Energy Environ. Sci. 2022, 15, 2288–2328. [Google Scholar] [CrossRef]
  115. Ahmed, K.W.; Jang, M.J.; Park, M.G.; Chen, Z.; Fowler, M. Effect of Components and Operating Conditions on the Performance of PEM Electrolyzers: A Review. Electrochem 2022, 3, 581–612. [Google Scholar] [CrossRef]
  116. Liao, Y.; Deng, G.; Ding, L.; Wang, H. A Thin and Flexible Composite Membrane with Low Area Resistance and High Bubble Point Pressure for Advanced Alkaline Water Electrolysis. J. Memb. Sci. 2024, 689, 122182. [Google Scholar] [CrossRef]
  117. Tüysüz, H. Alkaline Water Electrolysis for Green Hydrogen Production. Acc. Chem. Res. 2023, 57, 558–567. [Google Scholar] [CrossRef]
  118. Sher, F.; Ziani, I.; Al-Shara, N.K.; Chupin, A.; Horo, N.; Wang, B.; Rahman, S.; Fareed, B.; Nemţanu, M.R. Critical Insights into Eutectic Molten Hydroxide Electrolysis for Sustainable Green Hydrogen Production. Sustain. Energy Fuels 2024, 8, 4429–4452. [Google Scholar] [CrossRef]
  119. Cavaliere, P. Alkaline Liquid Electrolyte Water Electrolysis. In Water Electrolysis for Hydrogen Production; Springer: Cham, Switzerland, 2023; pp. 203–232. [Google Scholar] [CrossRef]
  120. Tello, A.; Cataño, F.A.; Arunachalam, A.; Oyarzún, D.; Henriquez, R.; Valdivia, P.; Ramalinga Viswanathan, M.; Gómez, H. Green Hydrogen Production by Photovoltaic-Assisted Alkaline Water Electrolysis: A Review on the Conceptualisation and Advancements. Int. J. Hydrogen Energy 2025, 107, 378–395. [Google Scholar] [CrossRef]
  121. Lopes, F.D.C.; Watanabe, E.H. Experimental and Theoretical Development of a PEM Electrolyzer Model Applied to Energy Storage Systems. In Proceedings of the 2009 Brazilian Power Electronics Conference, Bonito, Mato Grosso do Sul, Brazil, 27 September–1 October 2009; pp. 775–782. [Google Scholar] [CrossRef]
  122. Li, Y.; Feng, A.; Dai, L.; Xi, B.; An, X.; Xiong, S.; An, C. Progress on the Design of Electrocatalysts for Large-Current Hydrogen Production by Tuning Thermodynamic and Kinetic Factors. Adv. Funct. Mater. 2024, 34, 2316296. [Google Scholar] [CrossRef]
  123. Bashkatov, A.; Park, S.; Demirkır, Ç.; Wood, J.A.; Koper, M.T.M.; Lohse, D.; Krug, D. Performance Enhancement of Electrocatalytic Hydrogen Evolution through Coalescence-Induced Bubble Dynamics. J. Am. Chem. Soc. 2024, 146, 10177–10186. [Google Scholar] [CrossRef]
  124. Sangtam, B.T.; Park, H. Review on Bubble Dynamics in Proton Exchange Membrane Water Electrolysis: Towards Optimal Green Hydrogen Yield. Micromachines 2023, 14, 2234. [Google Scholar] [CrossRef]
  125. Riaz, M.A.; Trogadas, P.; Aymé-Perrot, D.; Sachs, C.; Dubouis, N.; Girault, H.; Coppens, M.O. Water Electrolysis Technologies: The Importance of New Cell Designs and Fundamental Modelling to Guide Industrial-Scale Development. Energy Environ. Sci. 2025, 18, 5190–5214. [Google Scholar] [CrossRef]
  126. Le, T.T.; Sharma, P.; Bora, B.J.; Tran, V.D.; Truong, T.H.; Le, H.C.; Nguyen, P.Q.P. Fueling the Future: A Comprehensive Review of Hydrogen Energy Systems and Their Challenges. Int. J. Hydrogen Energy 2024, 54, 791–816. [Google Scholar] [CrossRef]
  127. Chatenet, M.; Pollet, B.G.; Dekel, D.R.; Dionigi, F.; Deseure, J.; Millet, P.; Braatz, R.D.; Bazant, M.Z.; Eikerling, M.; Staffell, I.; et al. Water Electrolysis: From Textbook Knowledge to the Latest Scientific Strategies and Industrial Developments. Chem. Soc. Rev. 2022, 51, 4583–4762. [Google Scholar] [CrossRef]
  128. Henkensmeier, D.; Cho, W.C.; Jannasch, P.; Stojadinovic, J.; Li, Q.; Aili, D.; Jensen, J.O. Separators and Membranes for Advanced Alkaline Water Electrolysis. Chem. Rev. 2024, 124, 6393–6443. [Google Scholar] [CrossRef] [PubMed]
  129. Krishnan, S.; Koning, V.; Theodorus de Groot, M.; de Groot, A.; Mendoza, P.G.; Junginger, M.; Kramer, G.J. Present and Future Cost of Alkaline and PEM Electrolyser Stacks. Int. J. Hydrogen Energy 2023, 48, 32313–32330. [Google Scholar] [CrossRef]
  130. Paulec, T.; Tvarožek, J.; Resutík, P.; Špánik, P.; Praženica, M. Review of the Dynamic Response of Water Electrolyzer. Electr. Eng. 2025, 107, 10499–10506. [Google Scholar] [CrossRef]
  131. Ahmad Kamaroddin, M.F.; Sabli, N.; Tuan Abdullah, T.A.; Siajam, S.I.; Abdullah, L.C.; Abdul Jalil, A.; Ahmad, A. Membrane-Based Electrolysis for Hydrogen Production: A Review. Membranes 2021, 11, 810. [Google Scholar] [CrossRef] [PubMed]
  132. Nagao, Y. Proton-Conducting Polymers: Key to Next-Generation Fuel Cells, Electrolyzers, Batteries, Actuators, and Sensors. ChemElectroChem 2024, 11, e202300846. [Google Scholar] [CrossRef]
  133. Safronova, E.Y.; Lysova, A.A.; Voropaeva, D.Y.; Yaroslavtsev, A.B. Approaches to the Modification of Perfluorosulfonic Acid Membranes. Membranes 2023, 13, 721. [Google Scholar] [CrossRef]
  134. Alam Rimon, S.T.; Mourshed, M.; Kibria, M.G. Proton Exchange Membrane Fuel Cells: Advances in Materials Development, Performance Optimisation, and Future Outlook. Energy Convers. Manag. X 2025, 27, 101102. [Google Scholar] [CrossRef]
  135. Hancke, R.; Bujlo, P.; Holm, T.; Ulleberg, Ø. High-Pressure PEM Water Electrolyser Performance up to 180 Bar Differential Pressure. J. Power Sources 2024, 601, 234271. [Google Scholar] [CrossRef]
  136. Wang, H.; Yang, L. Analysis of Proton Exchange Membranes for Fuel Cells Based on Statistical Theory and Data Mining. iScience 2024, 27, 109360. [Google Scholar] [CrossRef]
  137. Hou, X.; Jiang, Y.; Wei, K.; Jiang, C.; Jen, T.C.; Yao, Y.; Liu, X.; Ma, J.; Irvine, J.T.S. Syngas Production from CO2 and H2O via Solid-Oxide Electrolyzer Cells: Fundamentals, Materials, Degradation, Operating Conditions, and Applications. Chem. Rev. 2024, 124, 5119–5166. [Google Scholar] [CrossRef]
  138. Matkin, D.E.; Starostina, I.A.; Hanif, M.B.; Medvedev, D.A. Revisiting the Ionic Conductivity of Solid Oxide Electrolytes: A Technical Review. J. Mater. Chem. A 2024, 12, 25696–25714. [Google Scholar] [CrossRef]
  139. Li, J.; Cai, Q.; Amini Horri, B. Highly Conductive and Stable Electrolytes for Solid Oxide Electrolysis and Fuel Cells: Fabrication, Characterisation, Recent Progress and Challenges. Mater. Adv. 2025, 6, 39–83. [Google Scholar] [CrossRef]
  140. Yoon, K.J.; Lee, S.; Park, S.Y.; Minh, N.Q. Advances in High-Temperature Solid Oxide Electrolysis Technology for Clean Hydrogen and Chemical Production: Materials, Cells, Stacks, Systems and Economics. Prog. Mater. Sci. 2025, 154, 101520. [Google Scholar] [CrossRef]
  141. Reznicek, E.P.; Braun, R.J. Reversible Solid Oxide Cell Systems for Integration with Natural Gas Pipeline and Carbon Capture Infrastructure for Grid Energy Management. Appl. Energy 2020, 259, 114118. [Google Scholar] [CrossRef]
  142. Naeini, M.; Cotton, J.S.; Adams, T.A. An Eco-Technoeconomic Analysis of Hydrogen Production Using Solid Oxide Electrolysis Cells That Accounts for Long-Term Degradation. Front. Energy Res. 2022, 10, 1015465. [Google Scholar] [CrossRef]
  143. Mehrpooya, M.; Habibi, R. A Review on Hydrogen Production Thermochemical Water-Splitting Cycles. J. Clean. Prod. 2020, 275, 123836. [Google Scholar] [CrossRef]
  144. Peng, S. Electrochemical Hydrogen Production from Water Splitting: Basic, Materials and Progress; Springer Nature: Singapore, 2023; pp. 1–243. [Google Scholar] [CrossRef]
  145. Sameer; Havilah, P.R.; Yadav, U.S.; Sharma, A.K. Hydrogen Production and Utilisation Through Electrochemical Techniques. In Challenges and Opportunities in Green Hydrogen Production. Energy, Environment, and Sustainability; Part F2879; Springer: Singapore, 2024; pp. 177–209. [Google Scholar] [CrossRef]
  146. Safari, F.; Dincer, I. A Review and Comparative Evaluation of Thermochemical Water Splitting Cycles for Hydrogen Production. Energy Convers. Manag. 2020, 205, 112182. [Google Scholar] [CrossRef]
  147. Farsi, A.; Zamfirescu, C.; Dincer, I.; Naterer, G.F. Thermodynamic Assessment of a Lab-Scale Experimental Copper-Chlorine Cycle for Sustainable Hydrogen Production. Int. J. Hydrogen Energy 2019, 44, 17595–17610. [Google Scholar] [CrossRef]
  148. Boretti, A. Concentrated Solar Energy with Thermal Energy Storage for Hydrogen Production by Three-Step Thermochemical Water-Splitting Cycles. Energy Fuels 2021, 35, 10832–10840. [Google Scholar] [CrossRef]
  149. Araya, S.S.; Liso, V.; Venizelou, V.; Poullikkas, A. Comprehensive Overview of Recent Research and Industrial Advancements in Nuclear Hydrogen Production. Energies 2024, 17, 2836. [Google Scholar] [CrossRef]
  150. Temiz, M.; Dincer, I. Concentrated Solar Driven Thermochemical Hydrogen Production Plant with Thermal Energy Storage and Geothermal Systems. Energy 2021, 219, 119554. [Google Scholar] [CrossRef]
  151. Lee, J.E.; Shafiq, I.; Hussain, M.; Lam, S.S.; Rhee, G.H.; Park, Y.K. A Review on Integrated Thermochemical Hydrogen Production from Water. Int. J. Hydrogen Energy 2022, 47, 4346–4356. [Google Scholar] [CrossRef]
  152. Mehrpooya, M.; Ghorbani, B.; Khodaverdi, M. Hydrogen Production by Thermochemical Water Splitting Cycle Using Low-Grade Solar Heat and Phase Change Material Energy Storage System. Int. J. Energy Res. 2022, 46, 7590–7609. [Google Scholar] [CrossRef]
  153. Kumar, G.; Eswari, A.P.; Kavitha, S.; Kumar, M.D.; Kannah, R.Y.; How, L.C.; Muthukaruppan, G.; Banu, J.R. Thermochemical Conversion Routes of Hydrogen Production from Organic Biomass: Processes, Challenges and Limitations. Biomass Convers. Biorefinery 2023, 13, 8509–8534. [Google Scholar] [CrossRef]
  154. Jolaoso, L.A.; Bello, I.T.; Ojelade, O.A.; Yousuf, A.; Duan, C.; Kazempoor, P. Operational and Scaling-up Barriers of SOEC and Mitigation Strategies to Boost H2 Production- a Comprehensive Review. Int. J. Hydrogen Energy 2023, 48, 33017–33041. [Google Scholar] [CrossRef]
  155. Zhang, J.; He, Y.; Zeng, J.; Song, W.; Weng, W.; Wang, Z. Updating and 24 H Testing of State Key Laboratory of Clean Energy Utilisation’s Thermochemical Iodine–Sulfur Cycle Water-Splitting Hydrogen Production System. Appl. Sci. 2025, 15, 5183. [Google Scholar] [CrossRef]
  156. Molaei, M.J. Recent Advances in Hydrogen Production through Photocatalytic Water Splitting: A Review. Fuel 2024, 365, 131159. [Google Scholar] [CrossRef]
  157. Kumar, M.; Singh, N.K.; Kumar, R.S.; Singh, R. Production of Green Hydrogen through Photocatalysis. ACS Symp. Ser. 2024, 1468, 1–24. [Google Scholar] [CrossRef]
  158. Sahu, P.K.; Champati, A.; Pradhan, A.; Naik, B. Design and Development of Nanostructured Photocatalysts for Large-Scale Solar Green Hydrogen Generation. Sustain. Energy Fuels 2024, 8, 1872–1917. [Google Scholar] [CrossRef]
  159. Navalón, S.; Dhakshinamoorthy, A.; Álvaro, M.; Ferrer, B.; García, H. Metal-Organic Frameworks as Photocatalysts for Solar-Driven Overall Water Splitting. Chem. Rev. 2023, 123, 445–490. [Google Scholar] [CrossRef]
  160. Nasir, J.A.; Rehman, Z.U.; Shah, S.N.A.; Khan, A.; Butler, I.S.; Catlow, C.R.A. Recent Developments and Perspectives in CdS-Based Photocatalysts for Water Splitting. J. Mater. Chem. A 2020, 8, 20752–20780. [Google Scholar] [CrossRef]
  161. Pei, J.; Li, H.; Yu, D.; Zhang, D. G-C3N4-Based Heterojunction for Enhanced Photocatalytic Performance: A Review of Fabrications, Applications, and Perspectives. Catalysts 2024, 14, 825. [Google Scholar] [CrossRef]
  162. Melchionna, M.; Fornasiero, P. Updates on the Roadmap for Photocatalysis. ACS Catal. 2020, 10, 5493–5501. [Google Scholar] [CrossRef]
  163. Li, R.; Luan, J.; Zhang, Y.; Jiang, L.; Yan, H.; Chi, Q.; Yan, Z. A Review of Efficient Photocatalytic Water Splitting for Hydrogen Production. Renew. Sustain. Energy Rev. 2024, 206, 114863. [Google Scholar] [CrossRef]
  164. Srinivasu, K.; Ghosh, S.K. Photocatalytic Splitting of Water on S-Triazine Based Graphitic Carbon Nitride: An Ab Initio Investigation. J. Mater. Chem. A 2015, 3, 23011–23016. [Google Scholar] [CrossRef]
  165. Zong, X.; Li, C. 7-Photocatalytic Water Splitting on Metal Oxide-Based Semiconductor Photocatalysts. In Metal Oxides in Heterogeneous Catalysis; Elsevier: Amsterdam, The Netherlands, 2018; pp. 355–399. ISBN 978-0-12-811631-9. [Google Scholar] [CrossRef]
  166. Allakhverdiev, S.I. Artificial Photosynthesis: Powering a Green New Deal for Sustainable Energy. Int. J. Hydrogen Energy 2024, 90, 199–209. [Google Scholar] [CrossRef]
  167. Lakhera, S.K.; Rajan, A.; Bernaurdshaw, N. A Review on Particulate Photocatalytic Hydrogen Production System: Progress Made in Achieving High Energy Conversion Efficiency and Key Challenges Ahead. Renew. Sustain. Energy Rev. 2021, 152, 111694. [Google Scholar] [CrossRef]
  168. Bahnemann, D.; Robertson, P.; Wang, C.; Choi, W.; Daly, H.; Danish, M.; de Lasa, H.; Escobedo, S.; Hardacre, C.; Jeon, T.H.; et al. 2023 Roadmap on Photocatalytic Water Splitting. J. Phys. Energy 2023, 5, 012004. [Google Scholar] [CrossRef]
  169. Wang, Y.; Wang, R.; Ding, S.; Wawrzy´nczak, A.; Wawrzy´nczak, W.; Feliczak-Guzik, A. Hydrogen Production Using Modern Photocatalysts. Coatings 2024, 14, 366. [Google Scholar] [CrossRef]
  170. Zhao, Y.; Niu, Z.; Zhao, J.; Xue, L.; Fu, X.; Long, J. Recent Advancements in Photoelectrochemical Water Splitting for Hydrogen Production. Electrochem. Energy Rev. 2023, 6, 14. [Google Scholar] [CrossRef]
  171. Khan, H.; Bera, S.; Jung, M.J.; Kwon, S.H. Rational Design of Photoanodes to Produce Value-Added Chemicals Coupled with Hydrogen. ChemElectroChem 2024, 11, e202400239. [Google Scholar] [CrossRef]
  172. Li, S.; Xu, W.; Meng, L.; Tian, W.; Li, L. Recent Progress on Semiconductor Heterojunction-Based Photoanodes for Photoelectrochemical Water Splitting. Small Sci. 2022, 2, 2100112. [Google Scholar] [CrossRef]
  173. Zeng, Y.; Zhao, M.; Huang, Z.; Zhu, W.; Zheng, J.; Jiang, Q.; Wang, Z.; Liang, H. Surface Reconstruction of Water Splitting Electrocatalysts. Adv. Energy Mater. 2022, 12, 2201713. [Google Scholar] [CrossRef]
  174. Liu, D.; Kuang, Y. Particle-Based Photoelectrodes for PEC Water Splitting: Concepts and Perspectives. Adv. Mater. 2024, 36, 2311692. [Google Scholar] [CrossRef]
  175. Jiang, C.; Moniz, S.J.A.; Wang, A.; Zhang, T.; Tang, J. Photoelectrochemical Devices for Solar Water Splitting—Materials and Challenges. Chem. Soc. Rev. 2017, 46, 4645–4660. [Google Scholar] [CrossRef]
  176. Zabara, M.A.; Ölmez, B.; Buldu-Akturk, M.; Yarar Kaplan, B.; Kırlıoğlu, A.C.; Alkan Gürsel, S.; Ozkan, M.; Ozkan, C.S.; Yürüm, A. Photoelectrocatalytic Hydrogen Generation: Current Advances in Materials and Operando Characterisation. Glob. Chall. 2024, 8, 2400011. [Google Scholar] [CrossRef]
  177. Moss, B.; Babacan, O.; Kafizas, A.; Hankin, A. A Review of Inorganic Photoelectrode Developments and Reactor Scale-Up Challenges for Solar Hydrogen Production. Adv. Energy Mater. 2021, 11, 2003286. [Google Scholar] [CrossRef]
  178. Thangamuthu, M.; Ruan, Q.; Ohemeng, P.O.; Luo, B.; Jing, D.; Godin, R.; Tang, J. Polymer Photoelectrodes for Solar Fuel Production: Progress and Challenges. Chem. Rev. 2022, 122, 11778–11829. [Google Scholar] [CrossRef] [PubMed]
  179. Suri, D.; Das, S.; Choudhary, S.; Venkanna, G.; Sharma, B.; Afroz, M.A.; Tailor, N.K.; Joshi, R.; Satapathi, S.; Tripathi, K. Enigma of Sustainable CO2 Conversion to Renewable Fuels and Chemicals Through Photocatalysis, Electrocatalysis, and Photoelectrocatalysis: Design Strategies and Atomic Level Insights. Small 2025, 21, 2408981. [Google Scholar] [CrossRef] [PubMed]
  180. Feng, Z.Y.; Jiang, J.C.; Meng, L.Y. Carbon-Based Photoelectrochemical Sensors: Recent Developments and Future Prospects. Dalt. Trans. 2024, 53, 11192–11215. [Google Scholar] [CrossRef]
  181. Garcia, G.M.; Oliva, H.S. Technical, Economic, and CO2 Emissions Assessment of Green Hydrogen Production from Solar/Wind Energy: The Case of Chile. Energy 2023, 278, 127981. [Google Scholar] [CrossRef]
  182. de Kleijne, K.; Huijbregts, M.A.J.; Knobloch, F.; van Zelm, R.; Hilbers, J.P.; de Coninck, H.; Hanssen, S.V. Worldwide Greenhouse Gas Emissions of Green Hydrogen Production and Transport. Nat. Energy 2024, 9, 1139–1152. [Google Scholar] [CrossRef]
  183. Akhtar, M.S.; Dickson, R.; Liu, J.J. Life Cycle Assessment of Inland Green Hydrogen Supply Chain Networks with Current Challenges and Future Prospects. ACS Sustain. Chem. Eng. 2021, 9, 17152–17163. [Google Scholar] [CrossRef]
  184. Franco, A. Green Hydrogen and the Energy Transition: Hopes, Challenges, and Realistic Opportunities. Hydrogen 2025, 6, 28. [Google Scholar] [CrossRef]
  185. Romano, M.C.; Antonini, C.; Bardow, A.; Bertsch, V.; Brandon, N.P.; Brouwer, J.; Campanari, S.; Crema, L.; Dodds, P.E.; Gardarsdottir, S.; et al. Comment on “How Green Is Blue Hydrogen? ” Energy Sci. Eng. 2022, 10, 1944–1954. [Google Scholar] [CrossRef]
  186. Ameli, H.; Strbac, G.; Pudjianto, D.; Ameli, M.T. A Review of the Role of Hydrogen in the Heat Decarbonisation of Future Energy Systems: Insights and Perspectives. Energies 2024, 17, 1688. [Google Scholar] [CrossRef]
  187. Angelico, R.; Giametta, F.; Bianchi, B.; Catalano, P. Green Hydrogen for Energy Transition: A Critical Perspective. Energies 2025, 18, 404. [Google Scholar] [CrossRef]
  188. Hydrogen Production—Global Hydrogen Review 2024—Analysis—IEA. Available online: https://www.iea.org/reports/global-hydrogen-review-2024/hydrogen-production (accessed on 28 August 2025).
  189. Global Hydrogen Review 2023—Analysis—IEA. Available online: https://www.iea.org/reports/global-hydrogen-review-2023 (accessed on 16 July 2025).
  190. Bal, S. Global Trends in Innovation across Hydrogen Production, Supply and Demand Chains. Int. J. Thermofluids 2025, 29, 101365. [Google Scholar] [CrossRef]
  191. Ishaq, H.; Crawford, C. Towards Less Carbon-Intensive Blue Hydrogen: Integrated Natural Gas Reforming and CO2 Capture Approach. J. Environ. Chem. Eng. 2025, 13, 115043. [Google Scholar] [CrossRef]
  192. Vallejo, V.; Nguyen, Q.; Ravikumar, A.P. Geospatial Variation in Carbon Accounting of Hydrogen Production and Implications for the US Inflation Reduction Act. Nat. Energy 2024, 9, 1571–1582. [Google Scholar] [CrossRef]
  193. Patonia, A.; Rahmatallah, P. Cost-Competitive Green Hydrogen: How to Lower the Cost of Electrolysers? The Oxford Institute for Energy Studies: Oxford, UK, 2022. [Google Scholar]
  194. Odenweller, A.; Ueckerdt, F. The Green Hydrogen Ambition and Implementation Gap. Nat. Energy 2025, 10, 110–123. [Google Scholar] [CrossRef]
  195. Spilleir, D.; Castañeda-Ayarza, J.; de Mello-Ayres, R.; Brucieri, A. Characteristics and Influence of Macroenvironment in the Brazilian Hydrogen Energy Sector. Clean. Prod. Lett. 2024, 6, 100059. [Google Scholar] [CrossRef]
  196. Saha, P.; Akash, F.A.; Shovon, S.M.; Monir, M.U.; Ahmed, M.T.; Khan, M.F.H.; Sarkar, S.M.; Islam, M.K.; Hasan, M.M.; Vo, D.V.N.; et al. Grey, Blue, and Green Hydrogen: A Comprehensive Review of Production Methods and Prospects for Zero-Emission Energy. Int. J. Green Energy 2024, 21, 1383–1397. [Google Scholar] [CrossRef]
  197. Nuttall, W.J.; Powell, J.B.; Anaya-Stucchi, K.L.; Bakenne, A.T.; Wilson, A. Hydrogen Around the World. In Insights into the New Hydrogen Economy; Springer: Cham, Switzerland, 2025; pp. 85–112. [Google Scholar] [CrossRef]
  198. U.S. Refinery Hydrogen Production Capacity as of January 1 (Million Cubic Feet per Day). Available online: https://www.eia.gov/dnav/pet/hist/LeafHandler.ashx?n=PET&s=8_NA_8PH_NUS_6&f=A (accessed on 29 August 2025).
  199. Bolscher, H.; Brownsort, P.; Guevara Opinska, L.; Jordal, K.; Kraemer, D.; Mikunda, T.; Parmiter, P.; Rycroft, L.; Yearwood, J. High Level Report: CCUS in Europe. 2019. Available online: https://www.ccusnetwork.eu/?wsidchk=17844817 (accessed on 27 August 2025).
  200. Akerboom, S.; Waldmann, S.; Mukherjee, A.; Agaton, C.; Sanders, M.; Kramer, G.J. Different This Time? The Prospects of CCS in the Netherlands in the 2020s. Front. Energy Res. 2021, 9, 644796. [Google Scholar] [CrossRef]
  201. Kollar, D.J.; Qin, S.; Xiao, Y. Executive Summary 2 China Hydrogen Economy Report. Available online: https://www.s-ge.com/sites/default/files/publication/free/2024_e_campaign_clean_website_gatedcontent_text_ct5_en_china-hyd.pdf (accessed on 29 August 2025).
  202. Ghorbani, B.; Zendehboudi, S.; Saady, N.M.C.; Naterer, G.F. Canada’s Hydrogen Future: Innovations, Policies, and Global Perspectives. Energy Fuels 2025, 39, 7605–7648. [Google Scholar] [CrossRef]
  203. ATCO EnPower to Proceed with Atlas Carbon Storage Hub: “A Significant Step Forward in Alberta’s Energy Transition”. Available online: https://www.atco.com/en-ca/about-us/news/2024/123013-atco-enpower-to-proceed-with-atlas-carbon-storage-hub-a-signific.html (accessed on 29 August 2025).
  204. Friedmann, J. About Qamar Energy. 2021. Available online: https://www.qamarenergy.com/sites/default/files/The%20UAE%27s%20Role%20in%20the%20Global%20Hydrogen%20Economy.pdf (accessed on 29 August 2025).
  205. IOGP. CCUS Projects in Europe. Available online: https://iogpeurope.org/wp-content/uploads/2022/11/Map-of-EU-CCUS-Projects.pdf (accessed on 29 August 2025).
  206. Riera, J.A.; Lima, R.M.; Knio, O.M. A Review of Hydrogen Production and Supply Chain Modeling and Optimisation. Int. J. Hydrogen Energy 2023, 48, 13731–13755. [Google Scholar] [CrossRef]
  207. Khatiwada, D.; Vasudevan, R.A.; Santos, B.H. Decarbonisation of Natural Gas Systems in the EU—Costs, Barriers, and Constraints of Hydrogen Production with a Case Study in Portugal. Renew. Sustain. Energy Rev. 2022, 168, 112775. [Google Scholar] [CrossRef]
  208. Algburi, S.; Munther, H.; Al-Dulaimi, O.; Fakhruldeen, H.F.; Sapaev, I.B.; Al Seedi, K.F.K.; Khalaf, D.H.; Jabbar, F.I.; Hassan, Q.; Khudhair, A.; et al. Green Hydrogen Role in Sustainable Energy Transformations: A Review. Results Eng. 2025, 26, 105109. [Google Scholar] [CrossRef]
  209. Nyangon, J.; Darekar, A. Advancements in Hydrogen Energy Systems: A Review of Levelized Costs, Financial Incentives and Technological Innovations. Innov. Green Dev. 2024, 3, 100149. [Google Scholar] [CrossRef]
  210. Hydrogen—IEA. Available online: https://www.iea.org/energy-system/low-emissions-fuels/hydrogen (accessed on 16 July 2025).
  211. Merchant Hydrogen Plant Capacities in Europe|H2tools|Hydrogen Tools. Available online: https://h2tools.org/hyarc/hydrogen-data/merchant-hydrogen-plant-capacities-europe (accessed on 18 July 2025).
  212. Hydrogen Production Capacity|Tableau Public. Available online: https://public.tableau.com/app/profile/h2observatory/viz/Hydrogenproductioncapacity/Productioncostsdashboard (accessed on 27 August 2025).
  213. Osman, A.I.; Mehta, N.; Elgarahy, A.M.; Hefny, M.; Al-Hinai, A.; Al-Muhtaseb, A.H.; Rooney, D.W. Hydrogen Production, Storage, Utilisation and Environmental Impacts: A Review. Environ. Chem. Lett. 2021, 20, 153–188. [Google Scholar] [CrossRef]
  214. Ramezani, R.; Di Felice, L.; Gallucci, F. A Review of Chemical Looping Reforming Technologies for Hydrogen Production: Recent Advances and Future Challenges. J. Phys. Energy 2023, 5, 024010. [Google Scholar] [CrossRef]
  215. Howarth, R.W.; Jacobson, M.Z. Reply to Comment on “How Green Is Blue Hydrogen?". Energy Sci. Eng. 2022, 10, 1955–1960. [Google Scholar] [CrossRef]
  216. Riemer, M.; Duscha, V. Carbon Capture in Blue Hydrogen Production Is Not Where It Is Supposed to Be—Evaluating the Gap between Practical Experience and Literature Estimates. Appl. Energy 2023, 349, 121622. [Google Scholar] [CrossRef]
  217. Ocko, I.B.; Hamburg, S.P. Climate Consequences of Hydrogen Emissions. Atmos. Chem. Phys. 2022, 22, 9349–9368. [Google Scholar] [CrossRef]
  218. Raganati, F.; Ammendola, P. CO2 Post-Combustion Capture: A Critical Review of Current Technologies and Future Directions. Energy Fuels 2024, 38, 13858–13905. [Google Scholar] [CrossRef]
  219. Williams Rioux, B. Reducing Methane Emissions. Lect. Notes Energy 2023, 98, 145–182. [Google Scholar] [CrossRef]
  220. Hancock, L.; Ralph, N. A Framework for Assessing Fossil Fuel ‘Retrofit’ Hydrogen Exports: Security-Justice Implications of Australia’s Coal-Generated Hydrogen Exports to Japan. Energy 2021, 223, 119938. [Google Scholar] [CrossRef]
  221. Jesse, B.J.; Kramer, G.J.; Koning, V.; Vögele, S.; Kuckshinrichs, W. Stakeholder Perspectives on the Scale-up of Green Hydrogen and Electrolyzers. Energy Rep. 2024, 11, 208–217. [Google Scholar] [CrossRef]
  222. Xie, Z.; Jin, Q.; Su, G.; Lu, W. A Review of Hydrogen Storage and Transportation: Progresses and Challenges. Energies 2024, 17, 4070. [Google Scholar] [CrossRef]
  223. Osman, A.I.; Hefny, M.; Abdel Maksoud, M.I.A.; Elgarahy, A.M.; Rooney, D.W. Recent Advances in Carbon Capture Storage and Utilisation Technologies: A Review. Environ. Chem. Lett. 2020, 19, 797–849. [Google Scholar] [CrossRef]
  224. Chari, S.; Sebastiani, A.; Paulillo, A.; Materazzi, M. The Environmental Performance of Mixed Plastic Waste Gasification with Carbon Capture and Storage to Produce Hydrogen in the U.K. ACS Sustain. Chem. Eng. 2023, 11, 3248–3259. [Google Scholar] [CrossRef]
  225. Ueckerdt, F.; Verpoort, P.C.; Anantharaman, R.; Bauer, C.; Beck, F.; Longden, T.; Roussanaly, S. On the Cost Competitiveness of Blue and Green Hydrogen. Joule 2024, 8, 104–128. [Google Scholar] [CrossRef]
  226. George, J.F.; Müller, V.P.; Winkler, J.; Ragwitz, M. Is Blue Hydrogen a Bridging Technology? The Limits of a CO2 Price and the Role of State-Induced Price Components for Green Hydrogen Production in Germany. Energy Policy 2022, 167, 113072. [Google Scholar] [CrossRef]
  227. Jumah, A. bin A Comprehensive Review of Production, Applications, and the Path to a Sustainable Energy Future with Hydrogen. RSC Adv. 2024, 14, 26400–26423. [Google Scholar] [CrossRef]
  228. Boettcher, S.W. Introduction to Green Hydrogen. Chem. Rev. 2024, 124, 13095–13098. [Google Scholar] [CrossRef]
  229. Southall, E.; Lukashuk, L. Hydrogen Storage and Transportation Technologies to Enable the Hydrogen Economy: Liquid Organic Hydrogen Carriers: Overview and Perspectives on Liquid Organic Hydrogen Carriers Technology. Johnson Matthey Technol. Rev. 2022, 66, 246–258. [Google Scholar] [CrossRef]
  230. Athia, N.; Pandey, M.; Sen, M.; Saxena, S. Factors Affecting the Production Cost of Green Hydrogen and Its Challenge for Sustainable Development. Environ. Dev. Sustain. 2024, 1–45. [Google Scholar] [CrossRef]
  231. Liponi, A.; Pasini, G.; Baccioli, A.; Ferrari, L. Evaluating the Potential and Limits of Green Electrolysis in Future Energy Scenarios with High Renewable Share. Energies 2025, 18, 1654. [Google Scholar] [CrossRef]
  232. Ikuerowo, T.; Bade, S.O.; Akinmoladun, A.; Oni, B.A. The Integration of Wind and Solar Power to Water Electrolyzer for Green Hydrogen Production. Int. J. Hydrogen Energy 2024, 76, 75–96. [Google Scholar] [CrossRef]
  233. Global Planned Electrolyser Capacity and Estimation of Additional Renewable Capacity by Country/Region—Charts—Data & Statistics—IEA. Available online: https://www.iea.org/data-and-statistics/charts/global-planned-electrolyser-capacity-and-estimation-of-additional-renewable-capacity-by-country-region (accessed on 13 July 2025).
  234. IRENA (International Renewable Energy Agency). Global Hydrogen Trade to Meet the 1.5 °C Climate Goal: Green Hydrogen Cost and Potential; International Renewable Energy Agency: Abu Dhabi, United Arab Emirates, 2022; pp. 1–114. [Google Scholar]
  235. European Commission; Joint Research Center; Bolard, J.; Dolci, F.; Gryc, K.; Eynard, U.; Georgakaki, A.; Letout, S.; Mountraki, A.; Ince, E.; et al. Clean Energy Technology Observatory: Water Electrolysis and Hydrogen in the European Union—2024 Status Report on Technology Development, Trends, Value Chains and Markets; Publications Office of the European Union: Luxembourg, 2024. [Google Scholar] [CrossRef]
  236. Madadi Avargani, V.; Habibzadeh, M.; Abdlla Maarof, H.; Zendehboudi, S.; Duan, X. Harnessing Renewable Energy for Hydrogen Production: Advances, Challenges, and Opportunities. Ind. Eng. Chem. Res. 2025, 64, 12368–12418. [Google Scholar] [CrossRef]
  237. Koeva, D.; Rachev, S. Integrating Hydrogen Production Capacity in the Energy Transition: Energy Efficiency and Challenges. In Proceedings of the 2023 4th International Conference on Communications, Information, Electronic and Energy Systems (CIEES), Plovdiv, Bulgaria, 23–25 November 2023. [Google Scholar] [CrossRef]
  238. Curcio, E. Techno-Economic Analysis of Hydrogen Production: Costs, Policies, and Scalability in the Transition to Net-Zero. Int. J. Hydrogen Energy 2025, 128, 473–487. [Google Scholar] [CrossRef]
  239. Frieden, F.; Leker, J. Future Costs of Hydrogen: A Quantitative Review. Sustain. Energy Fuels 2024, 8, 1806–1822. [Google Scholar] [CrossRef]
  240. Zun, M.T.; McLellan, B.C. Cost Projection of Global Green Hydrogen Production Scenarios. Hydrogen 2023, 4, 932–960. [Google Scholar] [CrossRef]
  241. Durakovic, G.; del Granado, P.C.; Tomasgard, A. Are Green and Blue Hydrogen Competitive or Complementary? Insights from a Decarbonized European Power System Analysis. Energy 2023, 282, 128282. [Google Scholar] [CrossRef]
  242. Benalcazar, P.; Komorowska, A. Techno-Economics of Green Hydrogen: Present Trends and Future Prospects. In Challenges and Opportunities in Green Hydrogen Production. Energy, Environment, and Sustainability; Part F2879; Springer: Singapore, 2024; pp. 569–597. [Google Scholar] [CrossRef]
  243. Dincer, I.; Aydin, M.I. New Paradigms in Sustainable Energy Systems with Hydrogen. Energy Convers. Manag. 2023, 283, 116950. [Google Scholar] [CrossRef]
  244. Borup, R.; Krause, T.; Brouwer, J. Hydrogen Is Essential for Industry and Transportation Decarbonisation. Electrochem. Soc. Interface 2021, 30, 79–83. [Google Scholar] [CrossRef]
  245. Shaterabadi, M.; Sadeghi, S.; Jirdehi, M.A. The Role of Green Hydrogen in Achieving Low and Net-Zero Carbon Emissions: Climate Change and Global Warming. In Green Hydrogen in Power Systems. Green Energy and Technology; Part F2414; Springer: Cham, Switzerland, 2024; pp. 141–153. [Google Scholar] [CrossRef]
  246. Sakthimurugan, V.; Lakshmikanth, G.; Balaji, N.; Roopashree, R.; Kumar, D.; Devarajan, Y. Green Hydrogen Revolution: Advancing Electrolysis, Market Integration, and Sustainable Energy Transitions towards a Net-Zero Future. Results Eng. 2025, 26, 104849. [Google Scholar] [CrossRef]
  247. Bataille, C.; Nilsson, L.J.; Jotzo, F. Industry in a Net-Zero Emissions World: New Mitigation Pathways, New Supply Chains, Modelling Needs and Policy Implications. Energy Clim. Change 2021, 2, 100059. [Google Scholar] [CrossRef]
  248. Marouani, I.; Guesmi, T.; Alshammari, B.M.; Alqunun, K.; Alzamil, A.; Alturki, M.; Hadj Abdallah, H. Integration of Renewable-Energy-Based Green Hydrogen into the Energy Future. Process 2023, 11, 2685. [Google Scholar] [CrossRef]
  249. Patnaik, D.; Pattanaik, A.K.; Bagal, D.K.; Rath, A. Reducing CO2 Emissions in the Iron Industry with Green Hydrogen. Int. J. Hydrogen Energy 2023, 48, 23449–23458. [Google Scholar] [CrossRef]
  250. Dash, S.K.; Chakraborty, S.; Roccotelli, M.; Sahu, U.K. Hydrogen Fuel for Future Mobility: Challenges and Future Aspects. Sustainability 2022, 14, 8285. [Google Scholar] [CrossRef]
  251. Kyriakopoulos, G.L.; Aravossis, K.G. Literature Review of Hydrogen Energy Systems and Renewable Energy Sources. Energies 2023, 16, 7493. [Google Scholar] [CrossRef]
  252. Brown, A.L.; Sperling, D.; Austin, B.; DeShazo, J.; Fulton, L.; Lipman, T.; Murphy, C.W.; Saphores, J.D.; Tal, G.; Abrams, C.; et al. Driving California’s Transportation Emissions to Zero. 2021. Available online: https://escholarship.org/uc/item/3np3p2t0 (accessed on 22 August 2025).
  253. Jeffers, M.; Kelly, K.; Lipman, T.; Fernandes Tomon Avelino, A.; Johnson, C.; Li, M.; Post, M.; Zhang, Y. Comprehensive Review of California’s Innovative Clean Transit Regulation: Phase I Summary Report. 2022. Available online: https://research-hub.nrel.gov/en/publications/comprehensive-review-of-californiaaposs-innovative-clean-transit-/ (accessed on 20 August 2025).
  254. Dou, Y.; Sun, L.; Ren, J.; Dong, L. Opportunities and Future Challenges in Hydrogen Economy for Sustainable Development. In Hydrogen Economy; Academic Press: Berlin, Germany, 2023; pp. 537–569. [Google Scholar] [CrossRef]
  255. Jaradat, M.; Almashaileh, S.; Bendea, C.; Juaidi, A.; Bendea, G.; Bungau, T. Green Hydrogen in Focus: A Review of Production Technologies, Policy Impact, and Market Developments. Energies 2024, 17, 3992. [Google Scholar] [CrossRef]
  256. Zaheer, S.; Anjum, N.; Hussain, S.; Algarni, A.D.; Iqbal, J.; Bourouis, S.; Ullah, S.S. A Multi Parameter Forecasting for Stock Time Series Data Using LSTM and Deep Learning Model. Mathematics 2023, 11, 590. [Google Scholar] [CrossRef]
  257. Malashin, I.; Tynchenko, V.; Gantimurov, A.; Nelyub, V.; Borodulin, A. Applications of Long Short-Term Memory (LSTM) Networks in Polymeric Sciences: A Review. Polymers 2024, 16, 2607. [Google Scholar] [CrossRef]
  258. Bui, V.; Le, N.T.; Nguyen, V.H.; Kim, J.; Jang, Y.M. Multi-Behavior with Bottleneck Features LSTM for Load Forecasting in Building Energy Management System. Electronics 2021, 10, 1026. [Google Scholar] [CrossRef]
  259. Elegbeleye, I.; Oguntona, O.; Elegbeleye, F. Green Hydrogen: Pathway to Net Zero Green House Gas Emission and Global Climate Change Mitigation. Hydrogen 2025, 6, 29. [Google Scholar] [CrossRef]
  260. Li, X.; Raorane, C.J.; Xia, C.; Wu, Y.; Tran, T.K.N.; Khademi, T. Latest Approaches on Green Hydrogen as a Potential Source of Renewable Energy towards Sustainable Energy: Spotlighting of Recent Innovations, Challenges, and Future Insights. Fuel 2023, 334, 126684. [Google Scholar] [CrossRef]
  261. Segovia-Hernández, J.G.; Hernández, S.; Cossío-Vargas, E.; Juarez-García, M.; Sánchez-Ramírez, E. Green Hydrogen Production for Sustainable Development: A Critical Examination of Barriers and Strategic Opportunities. RSC Sustain. 2025, 3, 134–157. [Google Scholar] [CrossRef]
  262. Dudley, H.; Jordan, A.; Lorenzoni, I. Advising National Climate Policy Makers: A Longitudinal Analysis of the UK Climate Change Committee. Glob. Environ. Change 2022, 76, 102589. [Google Scholar] [CrossRef]
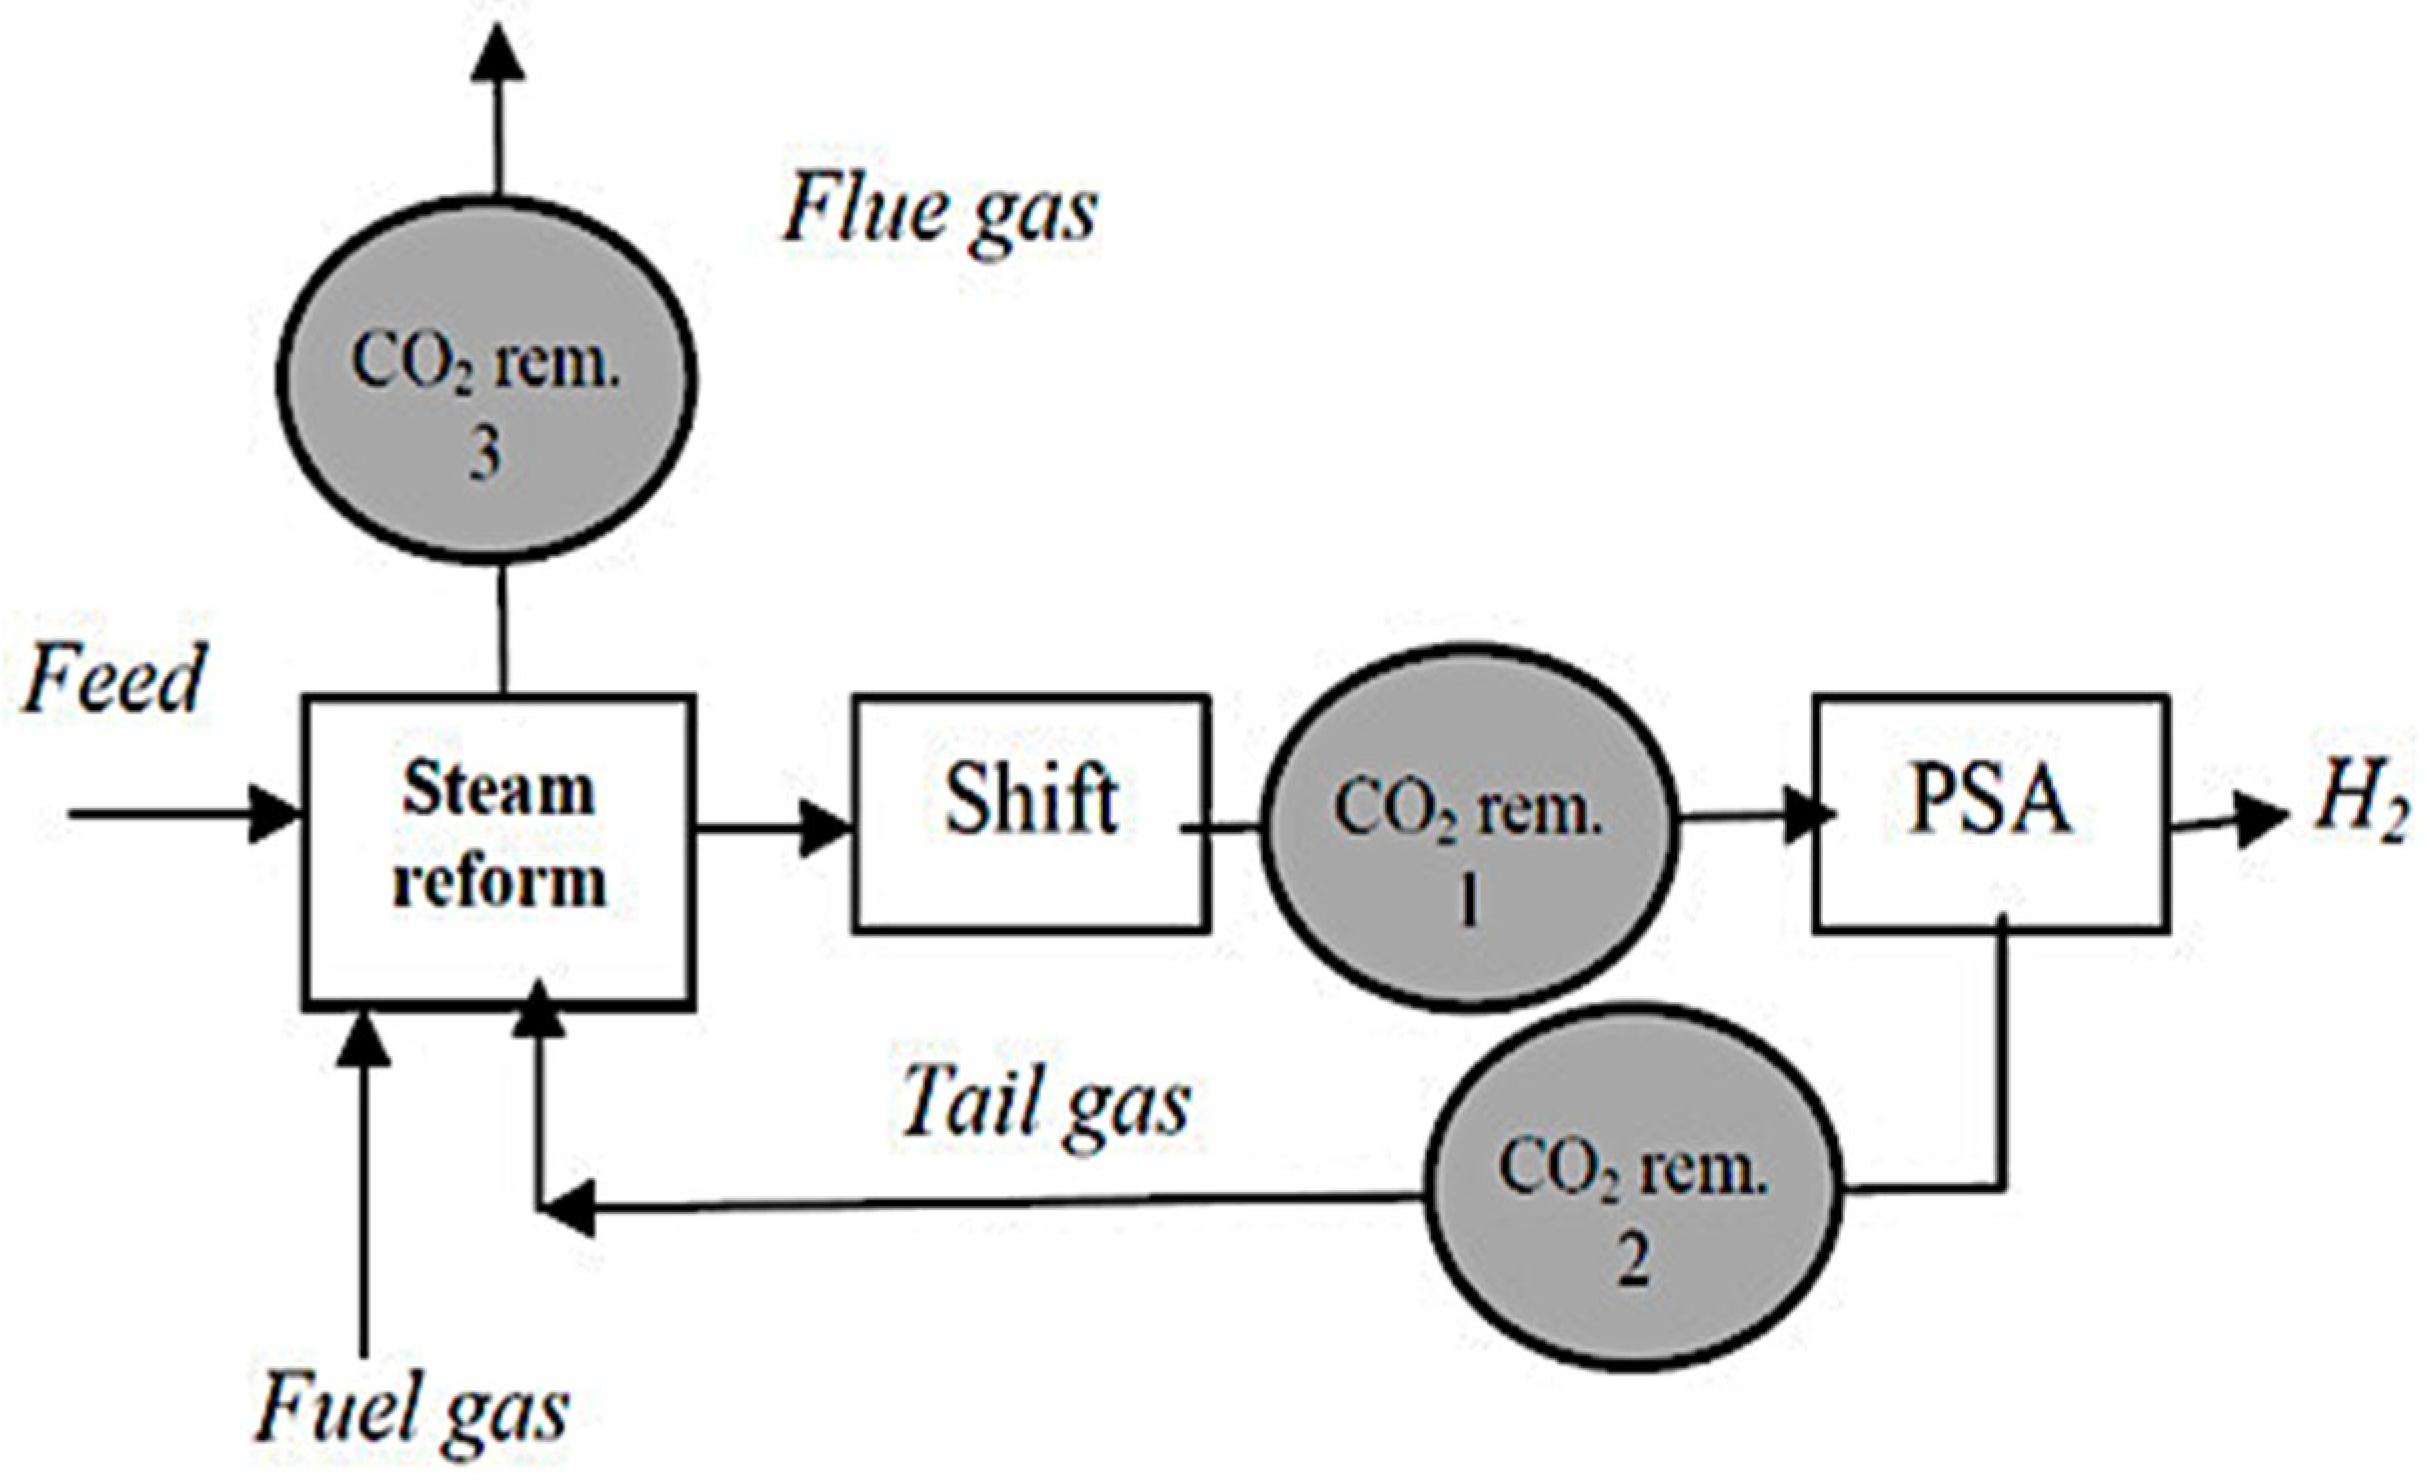
Figure 1. Flowchart of a modern steam methane reforming hydrogen plant with CO2 removal [16].
Fuels 06 00088 g001
Figure 2. Flow diagram of conventional steam methane reforming hydrocarbon process [63].
Fuels 06 00088 g002
Figure 3. A block flow diagram of blue hydrogen production via the SMR, WGS and PSA processes [66].
Fuels 06 00088 g003
Figure 4. Flow diagram of coal and biomass gasification with CCUS processes [97].
Fuels 06 00088 g004
Figure 5. A typical flow chart of hydrogen production through electrolysis [126].
Fuels 06 00088 g005
Figure 6. (a) Sulphur–iodine thermochemical cycle [155]. (b) Copper–chloride thermochemical cycle [147].
Fuels 06 00088 g006
Figure 7. Photocatalytic reaction of water splitting using photon energy [165].
Fuels 06 00088 g007
Figure 8. A schematic diagram of a simple PEC cell in alkaline conditions [174].
Fuels 06 00088 g008
Figure 9. (a) Greenhouse gas emissions for green hydrogen production. (b) Greenhouse gas emissions for blue hydrogen production [188].
Fuels 06 00088 g009
Figure 10. Global green hydrogen production from 2020 to 2024 using various technologies [188].
Fuels 06 00088 g010
Figure 11. Green hydrogen production by region in 2024 [188].
Fuels 06 00088 g011
Figure 12. Global blue hydrogen production from 2020 to 2024 using various technologies [188].
Fuels 06 00088 g012
Figure 13. Blue hydrogen production share by region in 2023 [188].
Fuels 06 00088 g013
Figure 14. Blue and green hydrogen production in Europe in 2023 [189,210,211,212].
Fuels 06 00088 g014
Figure 15. Average CO2 pricing ranges from blue to green excluding excise charges [226].
Fuels 06 00088 g015
Figure 16. Installed renewable energy generation capacity (GW) for green hydrogen production by region in 2050 for optimistic and pessimistic scenarios [233].
Fuels 06 00088 g016
Figure 17. LCOH by region in 2050 for optimistic and pessimistic scenarios [189,234].
Fuels 06 00088 g017
Figure 18. Cost reduction potential for green hydrogen until 2050 for various scenarios and conditions [234,237].
Fuels 06 00088 g018
Figure 19. LSTM forecast of blue and green hydrogen production (2025–2050).
Fuels 06 00088 g019
Table 3. Comparison of blue and green hydrogen technologies [71,238,242].
ParameterBlue HydrogenGreen Hydrogen
FeedstockNatural gasWater and renewable electricity
Emission profileLow (10–30 gCO2/MJ)Very low (<5 gCO2/MJ)
CAPEXUSD 800–$1400/KwUSD 1100–1800/kW
Levelised cost USD 2.0–$3.5/kg H2USD 3.5–6.0/kg H2
MaturityHigh (commercial)Emerging (pilot-scale to low-scale)
Key barrierCH4 leakage, CCS costHigh electricity demand/cost
Disclaimer/Publisher’s Note: The statements, opinions and data contained in all publications are solely those of the individual author(s) and contributor(s) and not of MDPI and/or the editor(s). MDPI and/or the editor(s) disclaim responsibility for any injury to people or property resulting from any ideas, methods, instructions or products referred to in the content.