Article

Multi-Objective Optimization of Grid Mix Scenarios for Green Hydrogen Production in Germany: Balancing Environmental Impact and Energy Costs

August-Wilhelm Scheer Institut für Digitale Produkte und Prozesse gGmbH, Center for Digital Greentech, 38678 Clausthal-Zellerfeld, Germany
*
Authors to whom correspondence should be addressed.
Fuels 2025, 6(4), 85; https://doi.org/10.3390/fuels6040085
Submission received: 30 June 2025 / Revised: 4 September 2025 / Accepted: 19 November 2025 / Published: 21 November 2025
(This article belongs to the Special Issue Sustainability Assessment of Renewable Fuels Production)

Abstract

As global decarbonization accelerates, the environmental and economic viability of hydrogen production largely depends on the evolving electricity supply mix. This study focused on alkaline water electrolysis (AWE) to identify the key factors affecting the competitiveness of green hydrogen. In this study, the temporal dynamics of grid transformation in Germany and the EU over a 20-year period (2025–2045) were addressed by developing a multi-objective optimization framework that integrates environmental impact analysis with machine-learning surrogate models to evaluate trade-offs between the carbon footprint and energy cost per kilogram of hydrogen. Grid-mix scenarios were generated via constrained Latin Hypercube Sampling under policy constraints, including coal phase-out and ≥80% renewables, screened for Pareto optimality, and clustered into distinct archetypes. The results indicated that cost-effective, low-carbon hydrogen production can be achieved through balanced portfolios that emphasize hydropower, biomass, and solar energy. Scenarios that minimize energy costs alone tend to breach environmental targets, whereas ultra-low-emission paths incur steep energy cost penalties. A representative scenario for 2034 (GWP = 24.57 kg CO2-eq/kg H2; Energy Cost = 9.47 €/kg H2) demonstrated a realistic synergy between policy constraints, cost, and environmental impact.

1. Introduction

The production of clean hydrogen via water electrolysis has emerged as a critical enabling technology for achieving deep decarbonization across “hard-to-abate” sectors, such as heavy industry and mobility [1]. Among the various electrolyzer technologies, alkaline water electrolysis (AWE) remains particularly attractive owing to its technological maturity, relatively low cost, and operational flexibility [2]. However, the environmental and economic performance of electrolytic hydrogen is overwhelmingly determined by the underlying electricity supply mix, which typically constitutes the dominant life-cycle impact in most life-cycle assessment (LCA) studies on hydrogen pathways [2,3].
A key shortcoming of existing research is the widespread assumption of static representations of the electricity grid, which overlooks the rapid transformation of national power systems under ambitious decarbonization policies. In Germany, where coal phase-out mandates and renewables targets are reshaping the grid landscape, such a static assumption may significantly misestimate both the carbon footprint and the energy cost of hydrogen produced over the coming decades. Consequently, there is a pressing need for dynamic, forward-looking analyses that embed projected grid mixes into hydrogen LCA and techno-economic assessments [4].
To bridge this gap, this study developed a novel multi-objective optimization framework that integrates environmental impact modeling with cost forecasting and machine learning surrogate models to evaluate the trade-off between environmental impact and energy cost for AWE-based hydrogen production under evolving grid scenarios and various policy constraints. By generating policy-compliant grid-mix trajectories for Germany over a 20-year horizon (2025–2045) via constrained Latin Hypercube Sampling (cLHS) [5] and by identifying Pareto-optimal solutions, this study systematically explores how different electricity portfolios influence both the GWP (kg CO2-eq/kg H2) and the production cost (€/kg H2). Clustering these Pareto-efficient points further distills representative “strategy archetypes,” thereby offering policymakers and industry stakeholders clear guidance on balanced pathways that align cost and climate objectives.
This study contributes to the broader discourse on sustainable hydrogen production in three ways: First, it moves beyond the common static-grid assumption by implementing a dynamic, policy-aligned scenario generation process that reflects Germany’s coal exit and the expansion of ambitious renewables. Second, it employs data-driven surrogate models, rigorously validated via cross-validation, to enable rapid yet more accurate environmental and cost assessments across various hypothetical grid compositions. Third, it leverages Pareto analysis [6,7] and clustering to translate complex multi-objective results into actionable transition benchmarks, highlighting the feasibility of low-carbon hydrogen at competitive costs. Overall, this study offers a robust, transparent framework for evaluating and comparing future hydrogen strategies, thus supporting informed decision-making in the quest for carbon neutrality [8,9].
The proposed optimization framework offers a practical decision-support tool for both industrial and policy stakeholders. For companies, it enables a comparative assessment of potential electrolyzer locations and the strategic planning of electricity procurement. For policymakers, it facilitates the evaluation of subsidy schemes, grid infrastructure enhancements, and renewable energy quota targets. By quantifying how changes in the electricity mix influence both production costs and CO2 emissions, the model provides a data-driven foundation for investment and policy decisions aimed at scaling green hydrogen production in Germany. This study makes three principal contributions: (1) it develops a dynamic, policy-constrained multi-objective optimization framework [6] for hydrogen production using grid electricity. (2) It integrates machine learning-based surrogate models [10] to evaluate trade-offs between environmental impact and production costs across diverse power mix scenarios. (3) It identifies Pareto-optimal transition pathways that align Germany’s decarbonization objectives with economic viability.
The structure of the paper is as follows: Section 2 outlines the materials and methods employed in the study. Section 3 presents the key results related to the environmental performance, cost metrics, and Pareto optimization. Section 4 discusses the broader implications of the findings. Section 5 concludes the study with a summary and potential directions for future work.

2. Materials and Methods

This section describes the data sources and methodology used in this study to forecast future electricity prices, analyze Germany’s electricity generation mix, assess the environmental impacts, and optimize energy input strategies for industrial-scale hydrogen production via AWE.

2.1. Data

  • Electricity Cost:
Historical electricity price data for non-household consumers in Germany, spanning 2007 to 2024, were obtained from Eurostat’s online database [11], as shown in Figure 1. Specifically, the dataset “Electricity prices for non-household consumers—biannual data (from 2007 onwards)” was used. The selected dataset encompasses all applicable taxes and levies, including capacity taxes, environmental taxes, network costs, renewable energy taxes, value-added taxes, energy and supply taxes, and other relevant taxes. The analysis focuses on the consumption band of 20,000 to 69,999 MWh per year, which aligns with the typical electricity demand range for industrial-scale water electrolysis facilities. This range is based on the energy consumption of 1 kg of hydrogen, which is approximately 53 kWh, and the total hydrogen production in Germany is expected to reach 979,400 kg per year [12].
2.
Grid Mix:
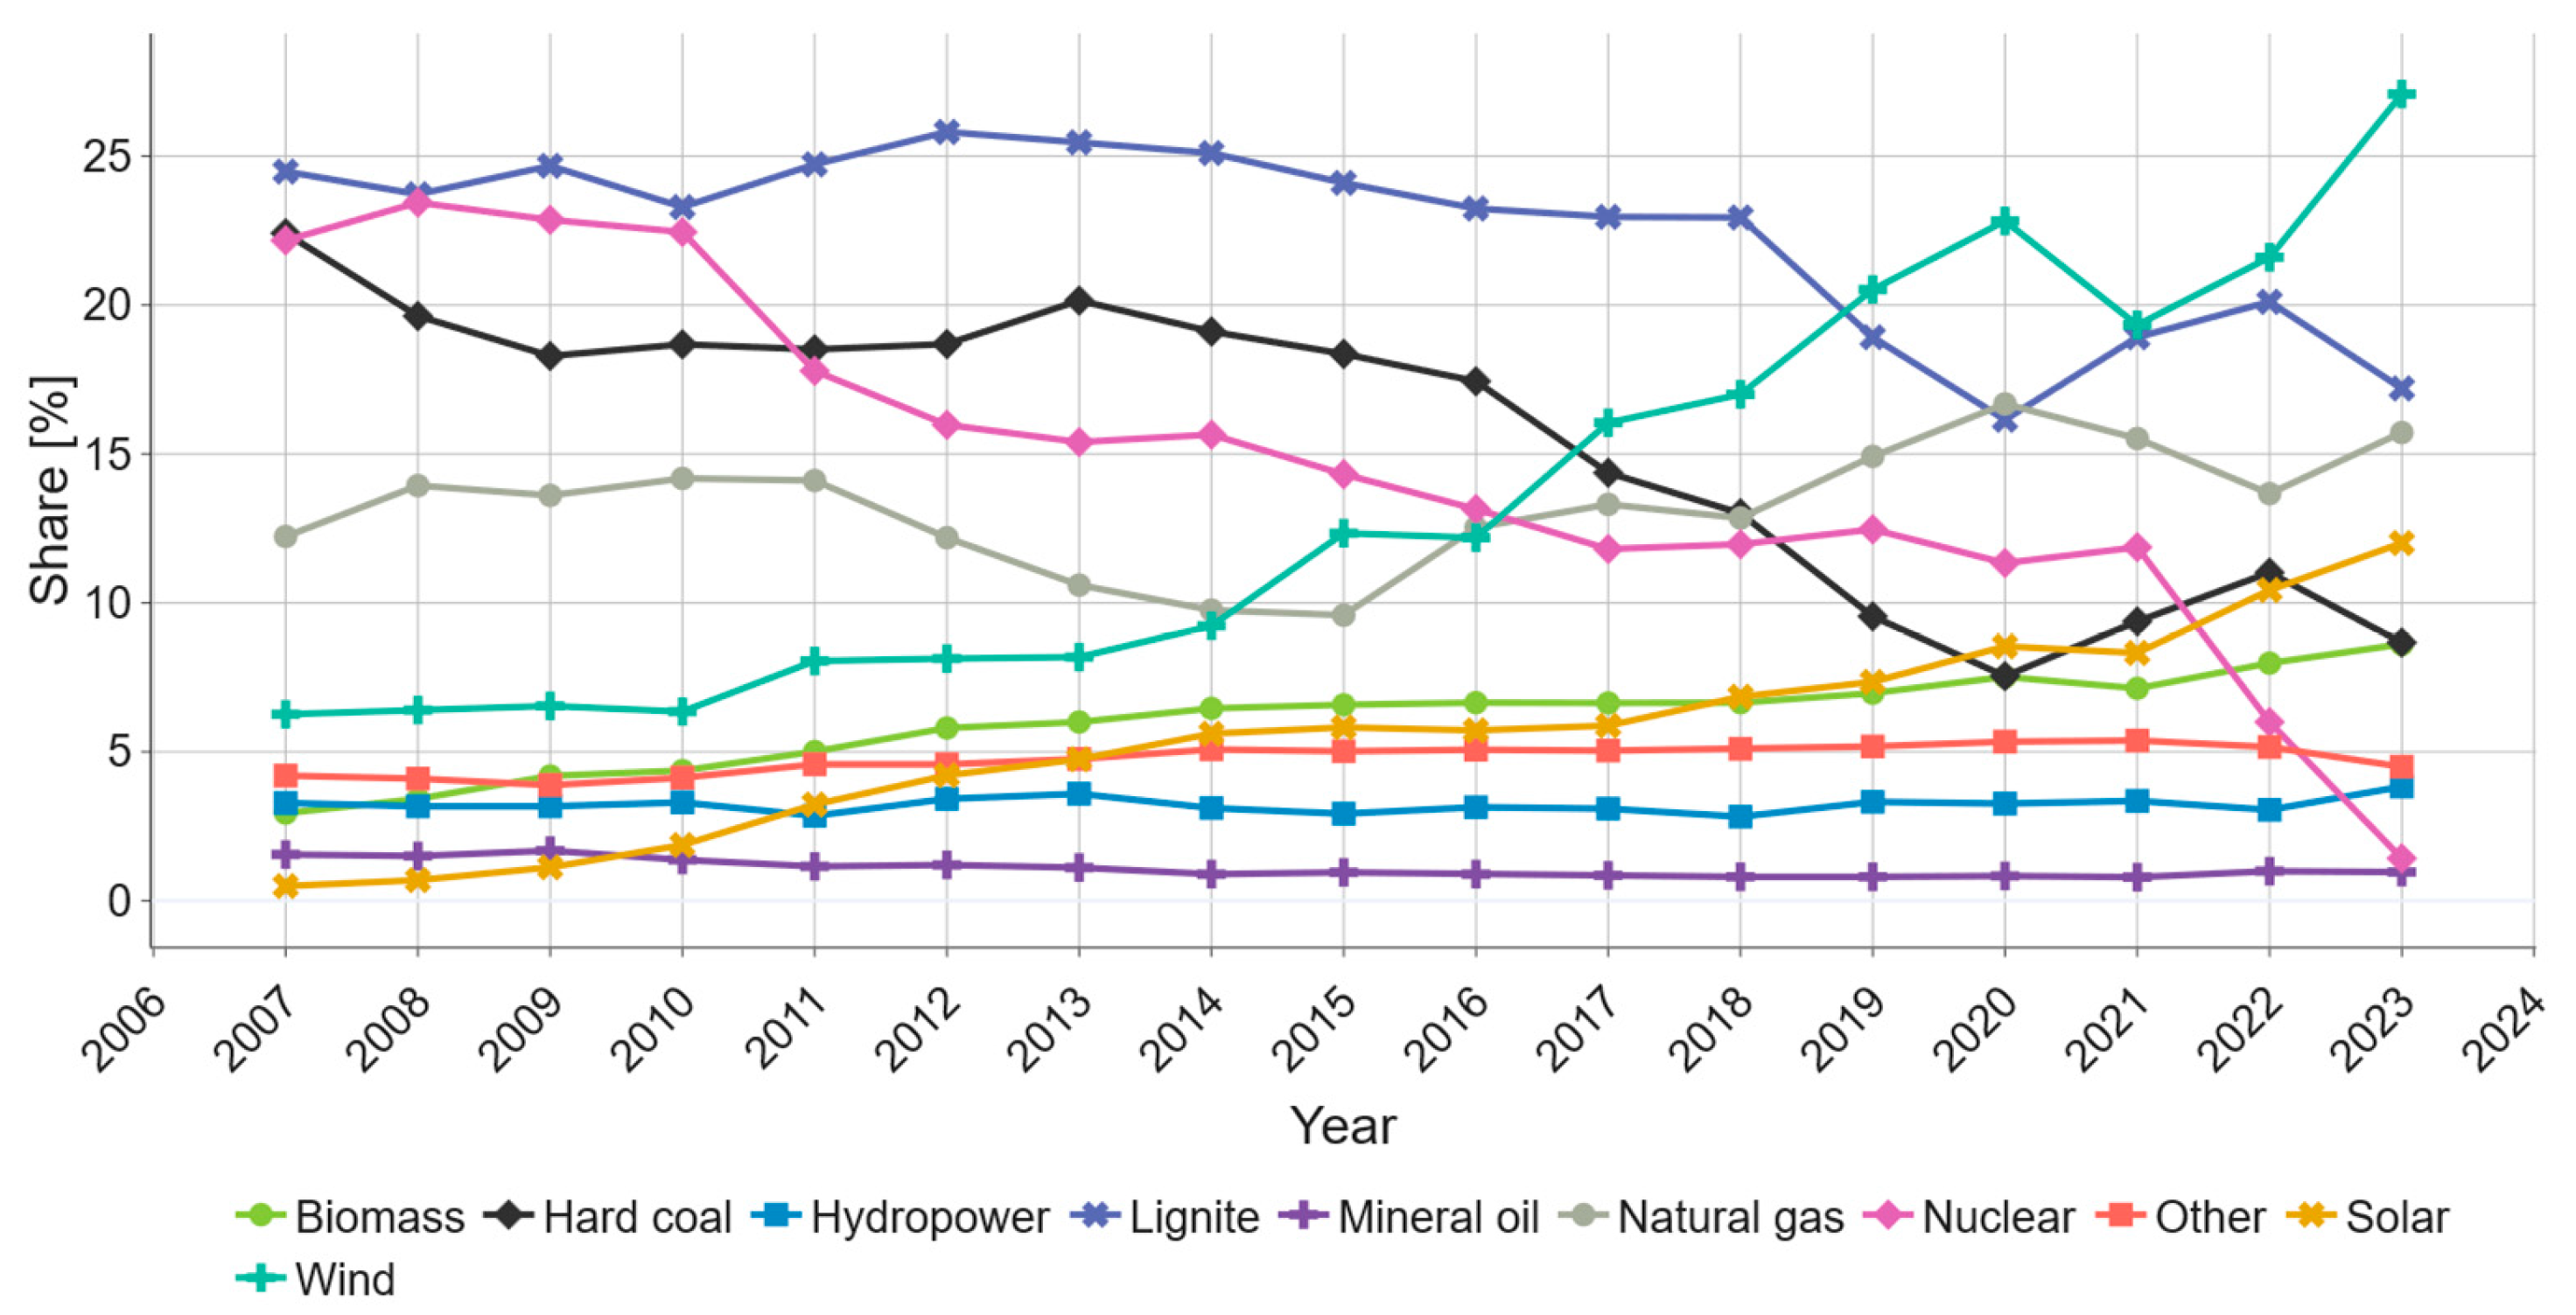
To analyze Germany’s electricity generation mix (grid mix), historical data from 1990 to 2023 were used [13]. The following energy sources were differentiated in the data: biomass, hard coal, hydropower, lignite, mineral oil, natural gas, nuclear, solar, wind, and others, as shown in Figure 2. These categories encompass all the primary conventional and renewable sources that contribute to Germany’s gross electricity production.
3.
Environmental Data:
Environmental data were obtained from Ecoinvent v3.8 [14], which is widely used and recognized in LCA studies for water electrolysis, as shown in Table 1, previous studies utilized Ecoinvent, demonstrating its reliability and broad acceptance. Therefore, Ecoinvent was selected to ensure consistency and comparability of environmental data.

2.2. Methods

The methodological framework of this study was structured into three sequential steps.
  • Environmental impact of the energy mix: Historical data from Figure 2 serves as an input for environmental analysis that quantifies the environmental impact of each power technology. Emission factors including fuel extraction (or raw material extraction), transportation, operation, and decommissioning were applied to calculate the carbon footprint per unit of electricity produced [15]. This study employs the ReCiPe 2016 methodology [16] for impact analysis, focusing on nine selected midpoint categories [12], as detailed in Table 2. ReCiPe 2016 is a widely used life cycle impact analysis method, as shown in Table 1, it is frequently adopted in environmental studies.
  • Cost analysis: A cost analysis was conducted based on the historical electricity price data presented in Figure 1. The price of electricity per kilowatt-hour was first determined for the relevant periods. These values were used to estimate the energy costs of hydrogen production through electrolysis. Considering that producing one kilogram of hydrogen consumes approximately 53 kWh of electricity [12], the energy cost per kilogram of hydrogen is obtained by multiplying the historical unit electricity price in Figure 1 by this consumption value. This approach provides a direct and transparent estimate of the electricity-based cost component of hydrogen production. The method highlights the impact of temporal fluctuations in electricity prices on the economics of hydrogen production, enabling historical comparisons and identification of cost-effective periods or regions based on electricity price trends.
  • Optimization and scenario analysis: The core objective of this study was to identify electricity grid mix configurations for Germany that minimize both the environmental impact and cost of hydrogen production via AWE over a projected 20-year operational horizon (2025–2045). This is achieved through a multi-objective optimization framework that integrates historical data, policy constraints, surrogate modeling, constrained sampling, and Pareto frontier analysis. The analysis spans 2025 to 2045, in alignment with the national energy transition goals. The scope is limited to grid electricity-based hydrogen production, with environmental burdens quantified on a per-kilogram of hydrogen (kg H2) basis using the ReCiPe 2016 Midpoint LCA Method and the Ecoinvent v3.8 database. The methodological process integrates historical data, surrogate modeling, constrained sampling, predictive analytics, and Pareto optimization. A multi-objective optimization approach aimed at minimizing both lifecycle environmental impacts and economic costs was used. The approach centers on the identification of Pareto-optimal solutions, that is, grid mix configurations for electricity supply in which no objective (cost or environmental impact) can be improved without worsening the other. The detailed breakdown of this methodology is presented below.
Owing to the lack of detailed prospective LCA and cost data for future grid mix scenarios, surrogate models have been developed to estimate the environmental impacts and hydrogen production costs. Multiple regression techniques were evaluated, including Ridge Regression, Random Forest Regression (RFR), and Gaussian Process Regression (GPR) [17,18]. These models were trained using the shares of electricity sources in the German grid mix as input features and historical techno-environmental simulation outputs, specifically, hydrogen production cost (€/kg H2) and global warming potential (GWP in kg CO2-eq/kg H2)as targets. The model training was performed separately for each response variable. A 5-fold cross-validation procedure with shuffling and fixed random seed was employed to ensure robust generalization performance, assessed primarily via the coefficient of determination, R-squared (R2).
Random Forest Regression [19] was ultimately selected for both targets due to its superior ability to model nonlinear relationships, handle multicollinearity, and mitigate overfitting. Input features were standardized using StandardScaler for consistency, particularly to facilitate comparison with linear models, although Random Forests are inherently scale-invariant. Hyperparameter tuning was conducted using a grid search over the following parameters. The surrogate model was trained using a feature matrix X R n × p , where p = 10 corresponds to the shares of the electricity sources in the German grid mix, and n represents the number of sampled grid-mix scenarios.
A pipeline was constructed by combining preprocessing and model fitting. To optimize model performance, a grid search was conducted over the following hyperparameters: n _ e s t i m a t o r s :   100 ,   200 ,   m a x _ d e p t h :   5 ,   10 ,   20 ,   N o n e ,
m i n _ s a m p l e s _ s p l i t :   2 ,   5 ,     m i n _ s a m p l e s _ l e a f :   1 ,   2 .  
A pipeline integrating preprocessing and model fitting ensured reproducibility and modularity. The final models demonstrated strong predictive accuracy and generalization capabilities, enabling reliable approximation of the objective functions in subsequent optimization and sensitivity analysis tasks.
In this study, constrained Latin Hypercube Sampling (cLHS) [5] was used to systematically generate policy-compliant electricity grid mix scenarios across a multi-dimensional decision space representing energy source shares (e.g., wind, solar, coal, nuclear, natural gas, hydro, other, etc.). Standard Latin Hypercube Sampling (LHS) is a stratified sampling technique that ensures that the entire range of each input variable is sampled evenly, enabling efficient exploration of the input space with relatively few samples. However, when real-world policy constraints are imposed, such as the minimum or maximum thresholds for certain energy technologies, the standard LHS must be modified to ensure the feasibility of the sampled scenarios. The constrained Latin Hypercube Sampling (LHS) strategy is used to efficiently explore the multidimensional space of energy source shares while ensuring statistical stratification. To explore feasible future grid configurations, synthetic grid-mix scenarios were generated for each year from 2025 to 2045 using a cLHS approach. An LHS design matrix of size N × D (e.g., 100 × 10 for 10 energy types) was generated with each variable stratified into N equal-probability bins. Sampling within each bin was randomized to maintain diversity and orthogonality across the dimensions. This ensured that each variable was sampled uniformly, without requiring an impractically large number of scenarios. For each year, 100 candidate grid mix vectors were sampled such that the total share was 100%, the sampled values were uniformly distributed across the feasible space, and the scenarios adhered to dynamic policy constraints, as previously described. Each sampled vector is evaluated for compliance with the minimum and maximum bounds. Vectors that failed to meet the wind, solar, and fossil constraints were rejected. This initial adjustment ensures compliance with the mandatory renewable deployment baselines. This allowed a systematic exploration of the feasible grid mix solution space, reflecting both the technical feasibility and policy-aligned constraints. National- and EU-level energy policy targets were encoded into the scenario generation process. The constraints varied by year and included the following.
  • Coal Phase-Out:
    Hard coal and lignite were capped to zero from 2038 onwards [20].
  • Renewable Energy Share:
    Minimum 80% of the total electricity generation from renewable sources (Solar, Wind, Hydropower, Biomass, and others) from 2030 onwards [20].
    There is no upper bound on renewables beyond 2030 (allowing up to 100% of renewable scenarios) [21].
  • Technology-Specific Targets
    By 2045, wind and solar energy are expected to contribute 60% and 30%, respectively, based on the Fraunhofer ISE projections [22].
Subsequently, a filter function for each grid mix scenario was applied to enforce a series of year-specific constraints derived from the German policy targets. These include minimum and maximum shares for renewables (Biomass, Solar, Wind, Hydropower, and others) (e.g., >80% renewables post-2030, 60% wind, and 30% solar by 2045), declining caps for hard coal and lignite toward their phase-out deadlines (2030–2038), and a maximum import (foreign electricity) share. Additionally, the total renewable share is linearly interpolated between 40% (2025) and 80% (2030), reaching up to 100% by 2045. The constraints are dynamically adapted for each year to ensure that only policy-compliant scenarios are retained [23]. In addition, a repair mechanism was applied. This function enforces hard constraints (e.g., minimum shares for wind and solar) and proportionally rescales the remaining components to maintain the mass balance. This repair-based cLHS approach improves sampling efficiency and allows the controlled exploration of high-dimensional decision spaces while preserving scenario feasibility across the full time horizon. Invalid samples were discarded, and new samples were drawn iteratively until the target number of feasible scenarios per year (e.g., 100) was reached or the attempt limit was exhausted. This yields a scenario ensemble that is both diverse and policy-consistent, enabling robust downstream optimization or sensitivity analyses. For each future grid mix scenario, the trained surrogate models were used to predict the following:
  • Total Cost (€/kg H2),
  • Global Warming Potential (GWP) (kg CO2-eq/kg H2).
While other environmental indicators (e.g., AP, ODP, and EP), as shown in Table 2, are available, the focus for multi-objective optimization was placed on GWP and Cost, reflecting global climate targets and economic feasibility priorities.
To identify the most favorable scenarios from a large set of generated energy mixes, a Pareto analysis was conducted following a surrogate-assisted, simulation-based approach. After, a large set of potential electricity grid mix scenarios was generated using LHS to ensure a statistically diverse and representative sampling. The infeasible scenarios were filtered out based on policy constraints. The remaining sampled scenarios were evaluated using the trained surrogate models for both hydrogen production cost and GWP, allowing for rapid estimation of outcomes without requiring computationally expensive simulations. Among these evaluated scenarios, the non-dominated solutions are identified using the classical Pareto dominance relation, thereby constructing the empirical Pareto front that highlights the trade-offs between economic and environmental performance.
Scenario A is said to dominate Scenario B if: G W P A G W P B and C o s t A C o s t B , with at least one inequality being strict. The Pareto front thus comprises a subset of scenarios that are non-dominated; that is, a scenario is considered Pareto-optimal if no other scenario performs better in one objective without worsening the other. This empirical front represents the efficient frontier of optimal policy-compliant solutions. The dominance-based multi-objective filtering allows focusing on scenarios that represent efficient trade-offs, supporting decision-makers in identifying robust pathways toward sustainable energy transitions.
Formally, let x R n be a vector representing the grid mix scenario, where each element x i denotes the share of a specific energy source (e.g., wind, solar, coal, gas, etc.), with the constraint: i = 1 n x i   =   1 ,   0     x i 1 .
Let:
  • f 1 x : surrogate model prediction of cost (€/kg H2);
  • f 2 x : surrogate model prediction of GWP (kg CO2-eq/kg H2).
Then, the bi-objective optimization problem is formulated as:
min x [ f 1 x ,   f 2 x ]
subject to:
  • i = 1 n x i = 1 convex combination constraint on the energy mix)
  • x i 0   i { 1 , , n }
  • Policy constraints, e.g., x c o a l θ to represent phase-out strategies.
The resulting Pareto-optimal scenario set was further analyzed using KMeans clustering [24] to identify the representative grid mix archetypes. KMeans is an unsupervised machine learning algorithm that partitions data into k clusters by minimizing within-cluster variance [25]. In this context, each energy mix (represented as a high-dimensional vector of source shares) is assigned to one of the k clusters. The Euclidean distance was used as the default metric to evaluate the similarity between scenarios in this energy mix space. The centroid of each cluster serves as a representative scenario, enabling a reduced but diverse portfolio of solutions to be communicated and analyzed further. Each cluster represents a distinct trade-off strategy, aiding interpretability and policy relevance. This allowed the grouping of solutions into thematic clusters, as follows:
  • Low-cost–high-impact (economically attractive, environmentally suboptimal).
  • High-cost–low-impact (environmentally optimal, economically burdensome).
  • Balanced scenarios (favorable compromise between objectives).
For each Pareto-optimal scenario, the details of the grid mix composition (%), operational year, predicted cost, GWP, cluster label, and policy alignment indicators were extracted. Additionally, statistical summaries (mean, standard deviation, and min–max range) were computed across Pareto solutions to analyze the variation in the share of different energy sources and identify common structural patterns.
Table 1 presents a synthesis of the methodological approaches commonly employed in existing literature.
Table 1. Representative Literature on Methods and Objectives for Optimal Energy Mix Analysis.
AuthorYearMethod
[15] Ajeeb et al.2024LCA of renewable energy-sourced alkaline electrolyser technologies using ecoinvent version 3.
[26] Koj et al.2024Life-cycle environmental impacts and costs of alkaline, PEM, and solid oxide water electrolysis technologies under future German electricity mixes using ecoinvent 3.7.1 data
[27] Lotrič et al.2021Use of Ecoinvent 3.5 database for Life-cycle assessment of hydrogen technologies.
[28] Hoppe and Minke2025LCA of a 5 MW alkaline water electrolysis plant with reuse and recycling scenarios using ecoinvent 3.10 and ReCiPe 2016
[16] Huijbergts et al.2017ReCiPe2016: a harmonized life cycle impact assessment method at midpoint and endpoint level
[29] Huang et al.2025Sustainability assessment of hydrogen production via water electrolysis in China with different photovoltaics-battery-grid systems using ReCiPe 2016
[30] Dincer and Agelin-Chaap2025LCA of electrolysis based green hydrogen production pathways using ReCiPe 2016
[31] Mehmeti et al.2018LCA to assess the performance of hydrogen production with fossil and renewable energy sources via high-temperature Solid Electrolysis Cells using ReCiPe2016
[32] Kiss & Szalay2023Multi-objective optimization approach to predict the sensitivity of buildings.
Table 2. Impact categories from ReCiPe 2016 were adapted from [12].
Impact CategoryAbbreviationUnitLevel
AcidificationAPMole of H+-eqv.Midpoint
Climate changeGWPkg CO2-eqv.Midpoint
Eutrophication freshwaterEP fwkg P-eqv.Midpoint
Eutrophication marineEP swkg N-eqv.Midpoint
Eutrophication terrestrialEP terMole of N-eqv.Midpoint
Ozone depletionODPkg CFC-11-eqv.Midpoint
Respiratory inorganicsPMkg PM2.5-eqv.Midpoint
Photochemical ozone formationPOCPkg NMVOC-eqv.Midpoint
Abiotic depletion potentialADPkg Sb-eqv.Midpoint

3. Results

This section presents the results derived from the data and methods in Section 2, covering the environmental impacts of the energy required to produce 1 kg of hydrogen, the associated energy costs, and the optimization outcomes.

3.1. Environmental Results

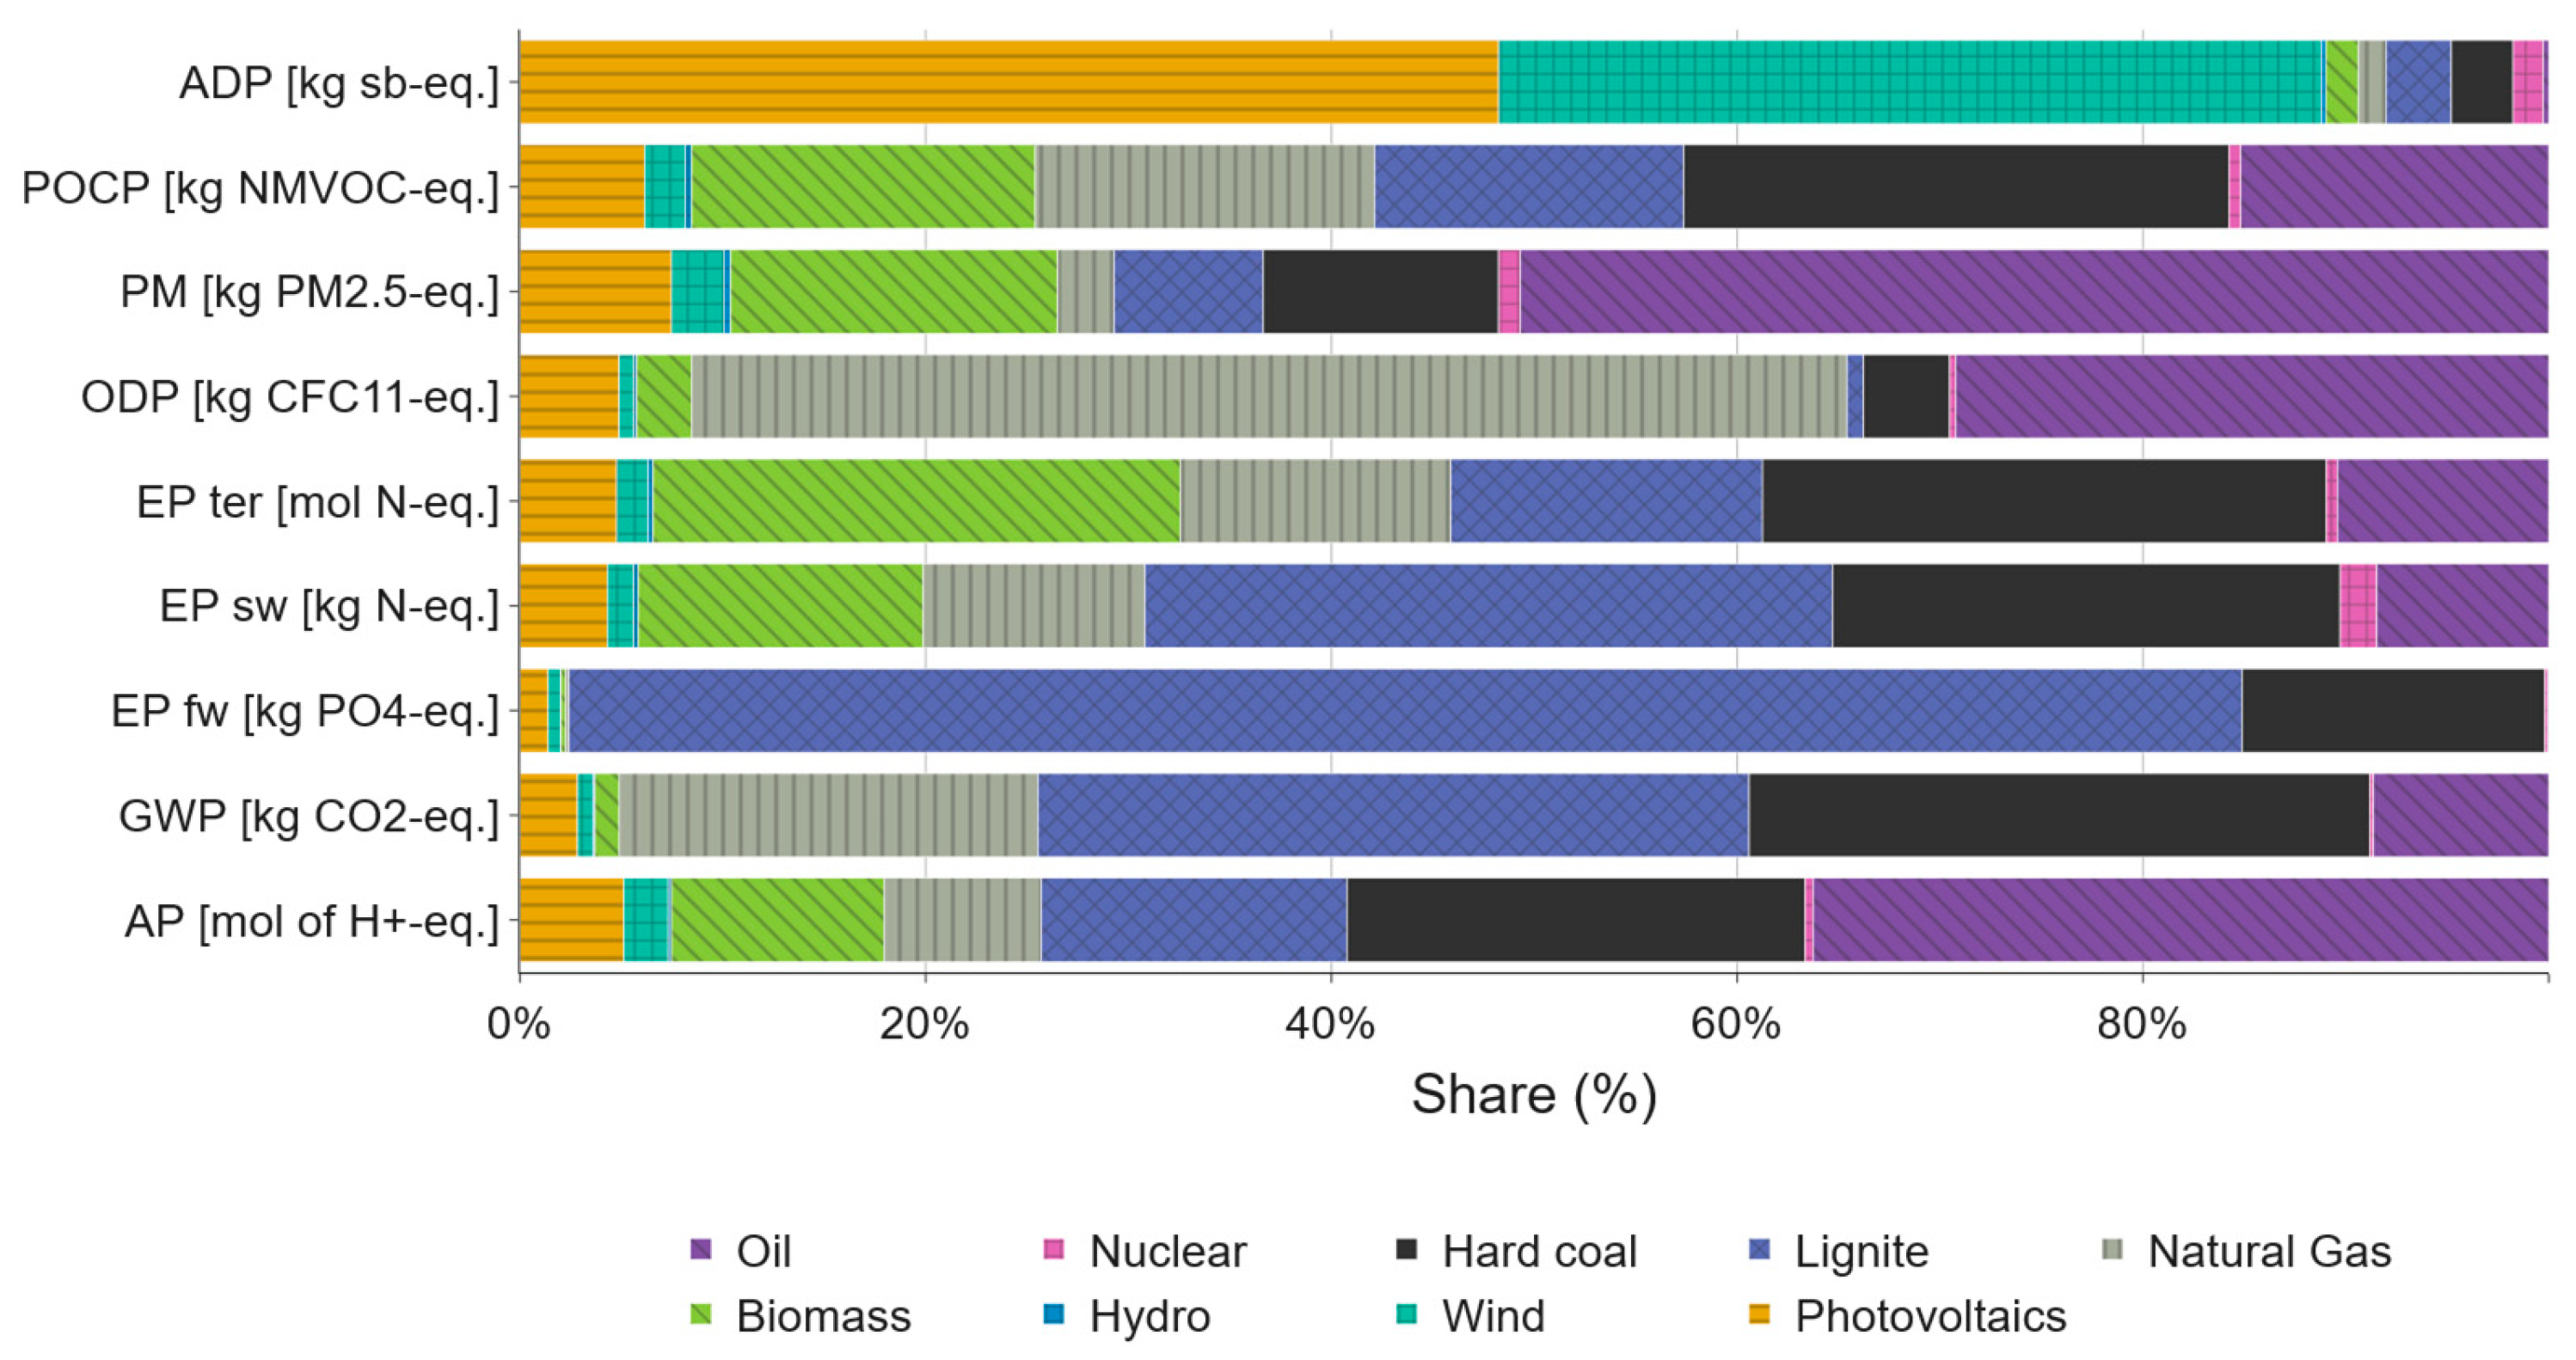
Figure 3 presents the relative contributions of various energy sources to the environmental impact per kilowatt-hour (kWh) of electricity generated across the nine ReCiPe 2016 midpoint categories, as shown in Table 2. Each bar represents an impact category with the share of each energy source stacked horizontally to show its proportional contribution.
The results highlight the stark differences in the environmental profiles of different technologies. Fossil fuels, especially oil, lignite, and hard coal, consistently dominate the impact categories, such as GWP, PM, and POCP. Oil exhibits a disproportionately high contribution to PM and AP, whereas lignite and hard coal are the major contributors to GWP and EP fw.
In contrast, renewable sources such as wind and photovoltaics (PV) make minimal contributions across most categories, particularly in GWP, AP, and Eutrophication Potential (EP). However, PV exhibit a relatively higher share of ADP because of the material-intensive nature of solar panel manufacturing. Similarly, wind energy also makes moderate contributions to ADP, reflecting the impacts associated with infrastructure and its long lifecycle.
Biomass exhibits a mixed profile that contributes significantly to eutrophication (especially EP fw and EP ter), PM, and POCP, which can be attributed to agricultural input and combustion-related emissions. Nuclear energy has a negligible GWP impact but demonstrates a notable share in EP sw and ADP, indicating upstream resource use and waste management burdens.
Overall, the Figure 3 highlights the environmental trade-offs associated with different power generation technologies. Although fossil fuels remain the most detrimental across nearly all impact categories, even low-carbon technologies carry certain environmental burdens that should be considered in comprehensive sustainability assessments. These ecological data form the foundation for calculating the energy-related environmental impacts associated with the production of 1 kg of hydrogen in this study.
Figure 4a illustrates the aggregated environmental impacts of electricity consumption to produce 1 kg of hydrogen via AWE in Germany from 1990 to 2023, quantified using the ReCiPe 2016 midpoint indicator. Among these, GWP, expressed in kg CO2-equivalents, accounted for most of the total environmental burden, and remained relatively stable at approximately 33–35 units between 2007 and 2014. Beginning in 2015, the overall impact began to decline steadily with an accelerated reduction observed after 2018. The combined effects of coal phase-out measures and rapid expansion of renewable energy have led to a marked decrease, reaching the lowest point in 2020. A slight rebound occurred from 2021 to 2022, likely due to the pandemic and war, before resuming its downward trend by 2023.
In contrast, Figure 4b, which excludes GWP, reveals greater interannual variability among the remaining midpoint categories, as shown in Table 2. While these non-GWP burdens also exhibited an overall downward trend, the impacts of acidification and terrestrial eutrophication increased noticeably between 2020 and 2022. This likely reflects a temporary reliance on fossil-fueled peaking plants during periods of pandemic and war. Following 2022, these impacts declined again, consistent with the increased use of renewable energy.
Given that GWP represents the most pressing and prominent environmental challenge at present, our scenario-based analysis centers on GWP as the primary indicator for evaluating the effectiveness of energy transition. Although other environmental pressures (e.g., acidification and eutrophication) may exhibit fluctuations in specific years, a GWP-focused assessment framework currently offers the most direct and robust basis for understanding and advancing decarbonization strategies.

3.2. Cost Results

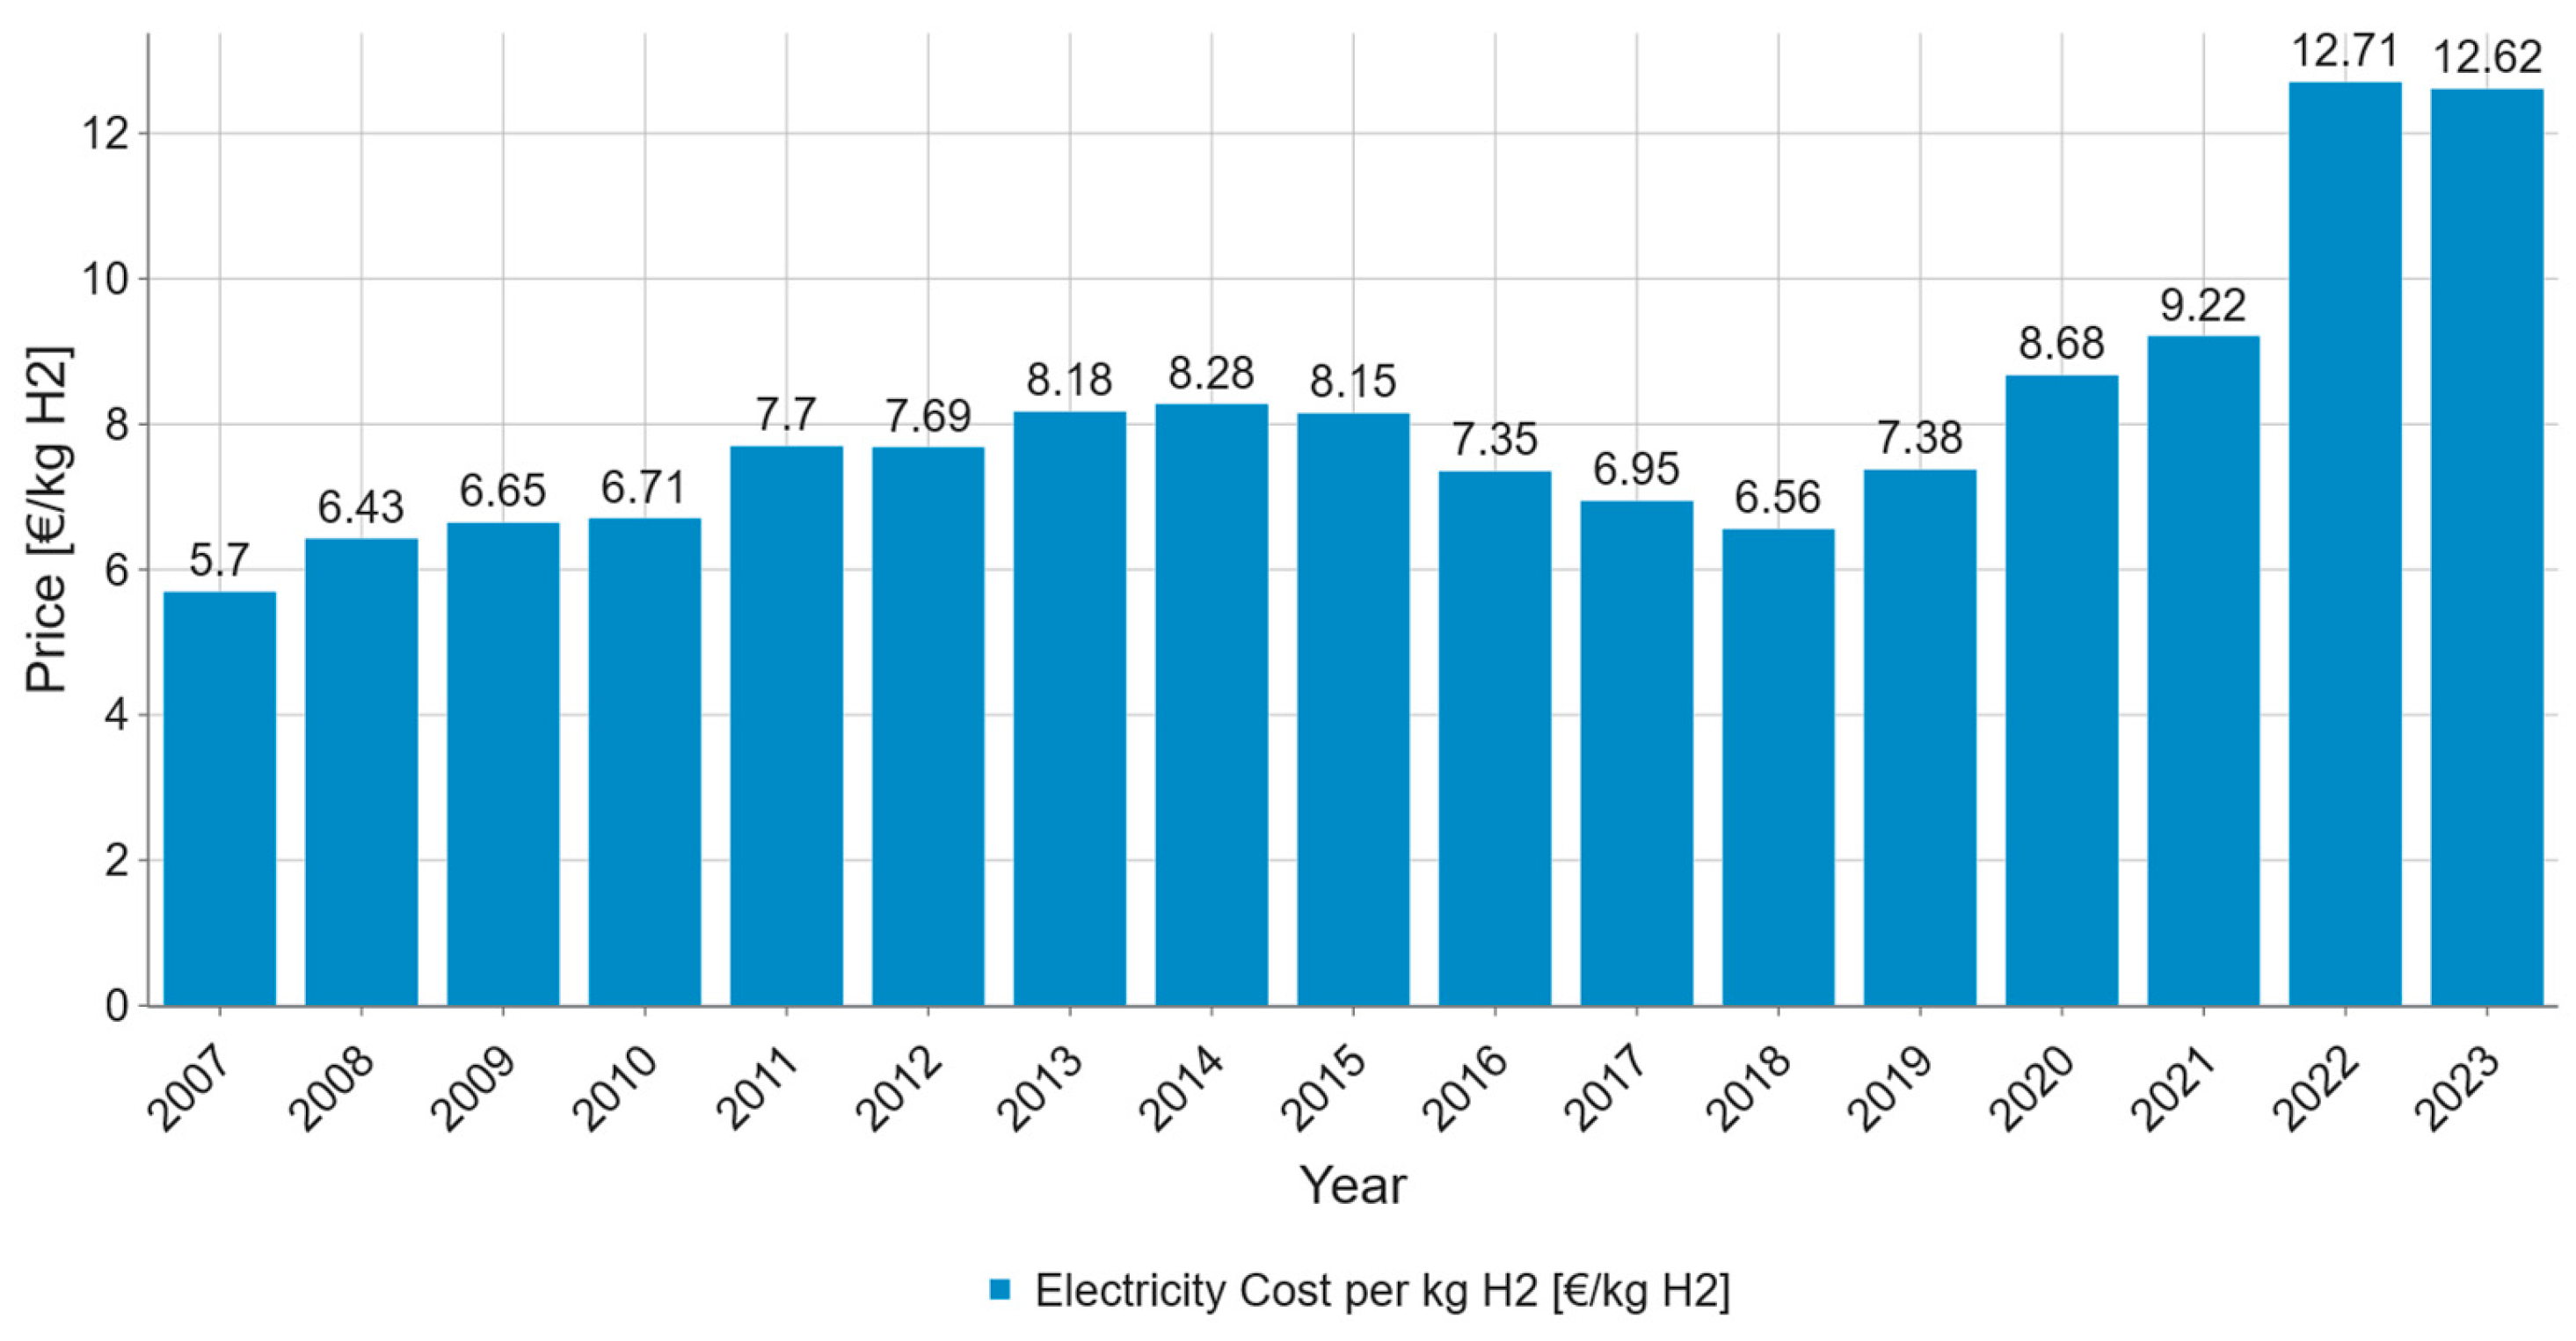
Figure 5 presents the resulting energy cost per kilogram of hydrogen, which was derived by converting the electricity prices in kWh using the method described in Section 2.2. Specifically, the historical unit electricity prices were multiplied by the corresponding annual electricity consumption to determine the total yearly energy cost. It should be noted that historical data from 2024 were excluded from the analysis because of the unavailability of the corresponding environmental data. To maintain consistency in the input parameters used for optimization, the cost analysis was limited to data up to 2023.
The results revealed moderate fluctuations in energy costs until 2023, with values ranging from approximately 6 €/kg H2 (2007) to 12 €/kg H2 (2022). A significant increase was observed between 2020 and 2022, peaking at around 12,71 €/kg of H2. Over the past few decades, electricity prices in Germany have exhibited significant fluctuations, closely linked to energy policy reforms, the gradual phase-out of nuclear energy, and the impact of the pandemic and geopolitical conflicts.
As shown in Figure 5, the unit energy cost for hydrogen production exhibited a modest upward trend from 2007 to 2014, primarily driven by the rising electricity market prices. From 2015 to 2018, a temporary decline in unit energy costs was observed, which was attributed to the rapid expansion of renewable power capacity and a decrease in fossil fuel prices, collectively leading to lower electricity prices. Since 2019, however, the cost trajectory has resumed an upward trend owing to the advancement of carbon neutrality policies, a rebound in fossil energy prices, and changes in grid load. A significant surge occurred in 2022, primarily influenced by the energy crisis triggered by the pandemic and war.
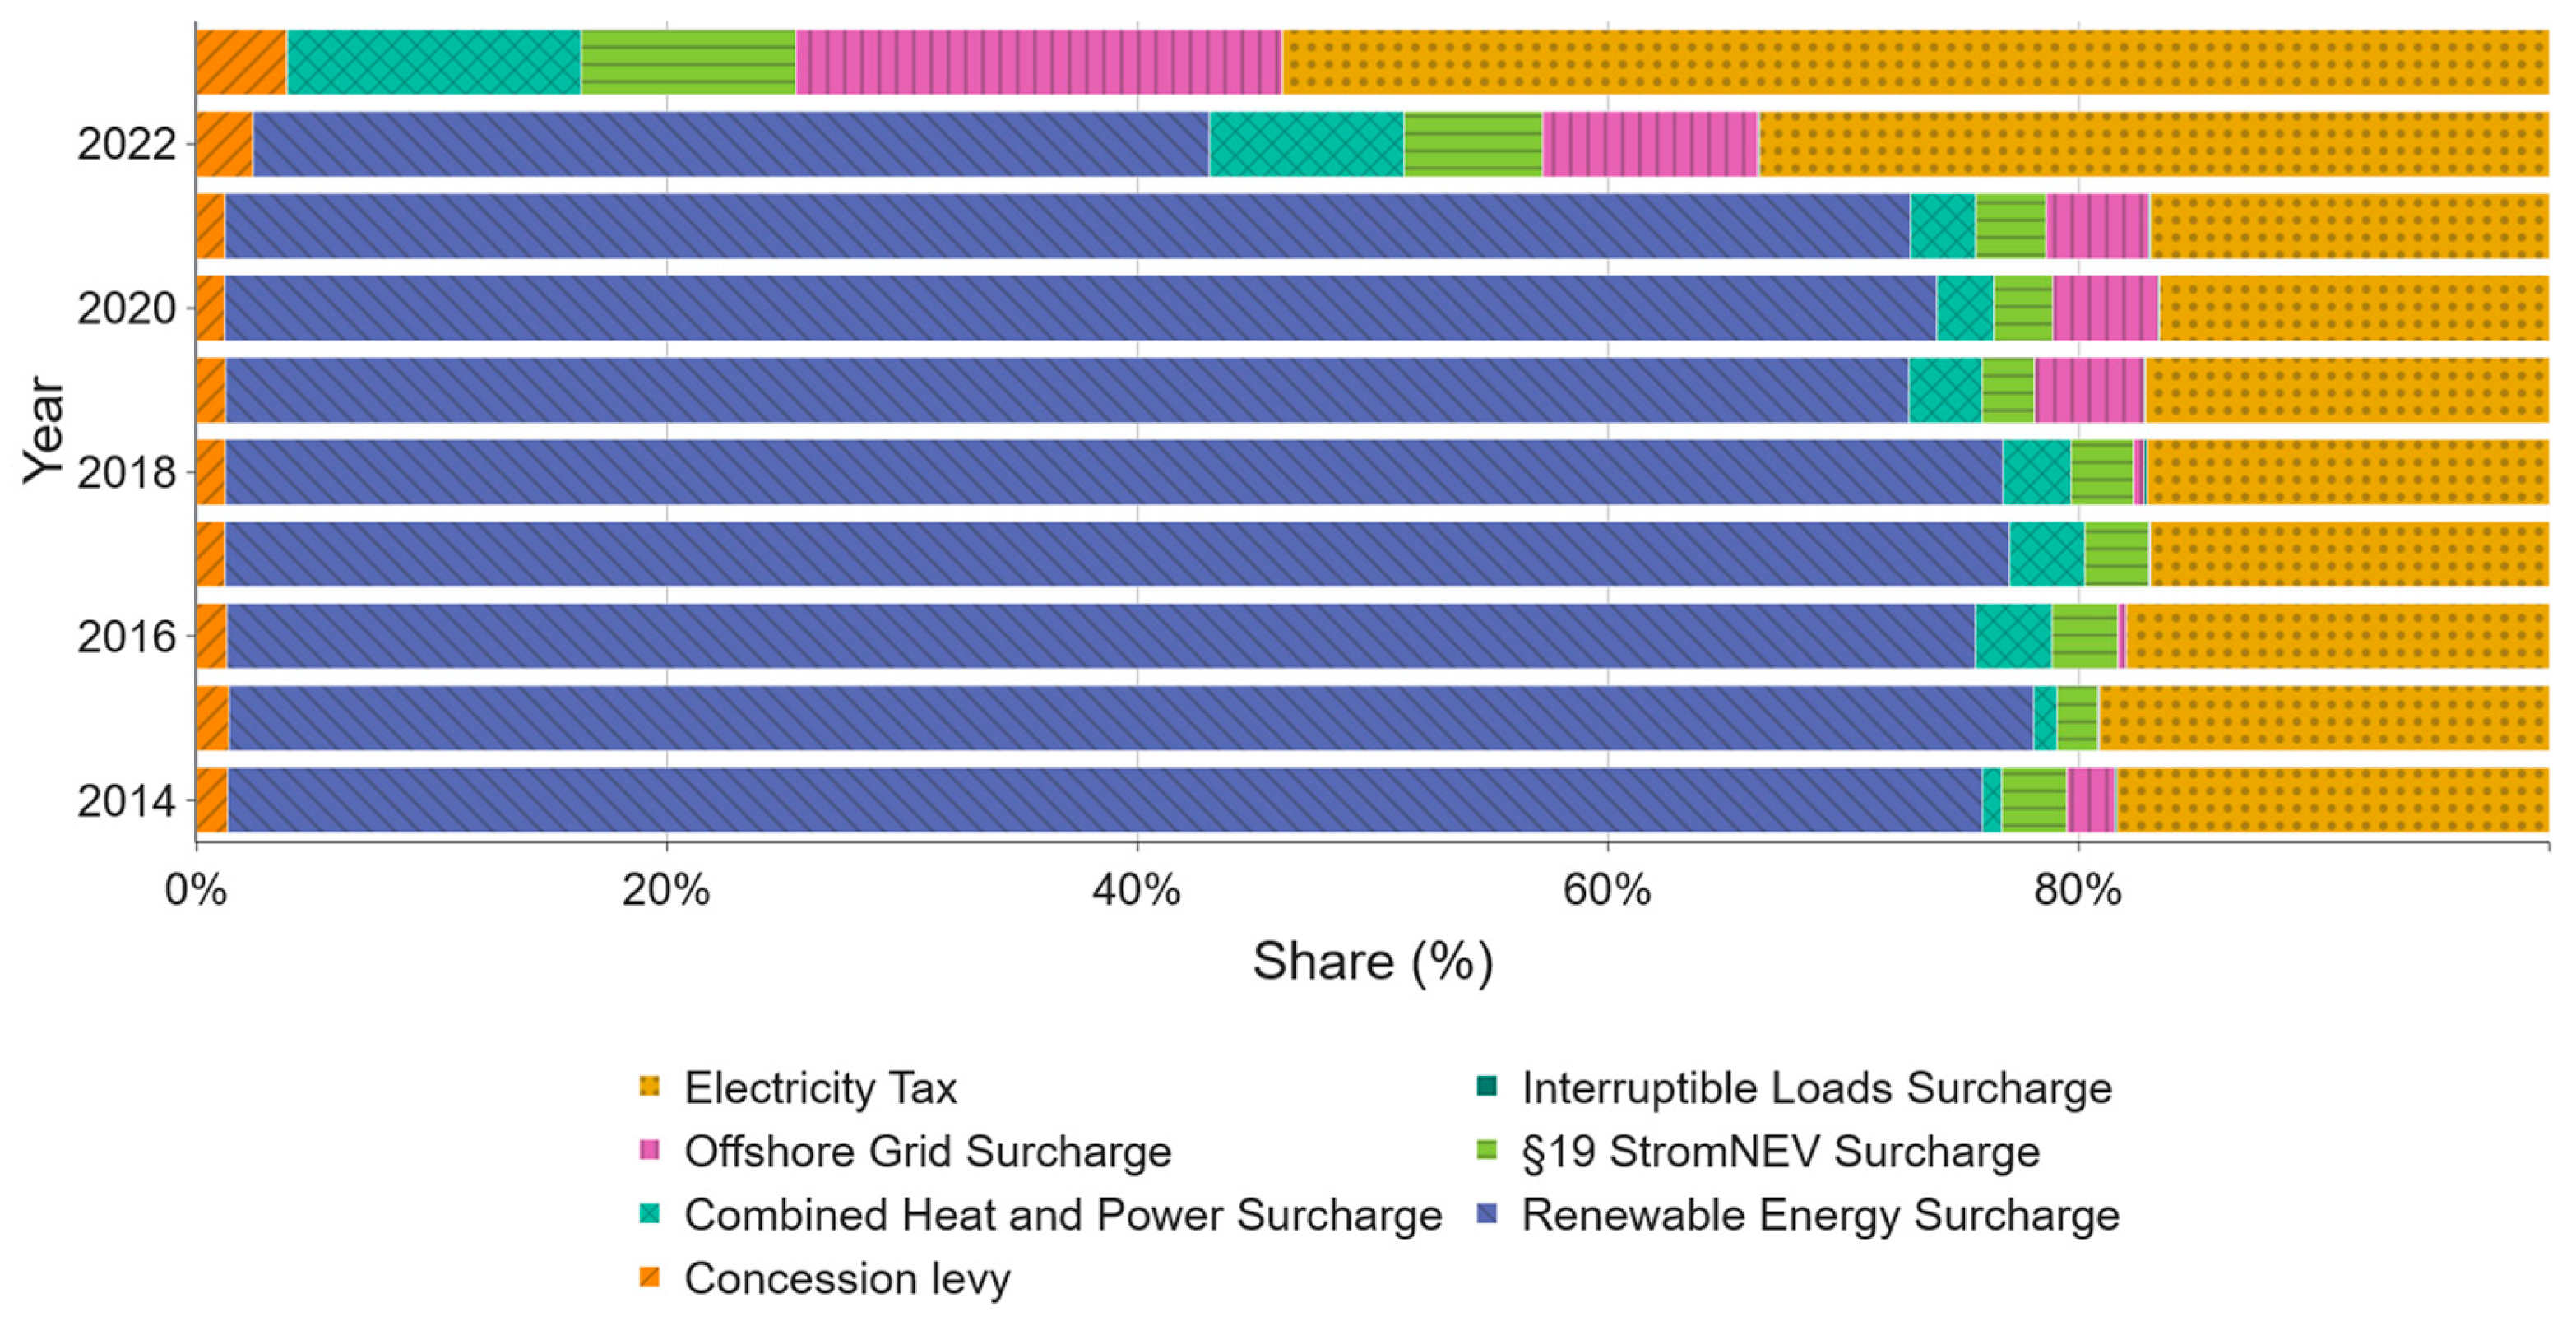
Figure 6 illustrates the breakdown of the energy-cost components for producing 1 kg of hydrogen. From 2014 to 2021, renewable energy surcharge (RES) constituted the dominant share of residential electricity prices in Germany, typically exceeding 50–60% and peaking at nearly 70% in certain years. This surcharge was designed to collect funds from end-users to subsidize the cost differential for photovoltaic, wind power, and other renewable energy generation technologies [33]. During the same period, other components, such as combined heat and power surcharges, grid-related fees, and electricity tax, accounted for relatively small proportions of the total price.
Beginning in 2022, the share attributed to RES declined sharply and was abolished by 2023, as subsidy responsibilities shifted to federal funds [33]. This transition is reflected in Figure 5, which shows a corresponding decrease in the energy cost per kilogram of hydrogen after 2022. Although the overall energy cost decreased, the relative shares of the other cost items within the total electricity price increased significantly. In particular, electricity tax gained importance in 2023. Additionally, surcharges such as those under Section 19 of the StromNEV and the offshore wind grid connection surcharge began to increase substantially after 2023.

3.3. Overview of the Pareto Optimization Results

The surrogate models developed for predicting the hydrogen production cost and GWP demonstrated markedly different levels of predictive accuracy, which directly influenced the robustness of the subsequent multi-objective Pareto optimization. The model trained to predict the GWP exhibited strong alignment with the underlying deterministic process model. Using a 5-fold cross-validated grid search, the optimal Random Forest configuration, comprising 200 estimators, a maximum tree depth of five, and default settings for minimum samples per split and leaf, achieved a high cross-validated coefficient of determination (R2) of 0.899. The predicted GWP values closely matched the process model outputs across the entire range, with residuals showing a near-normal distribution centered around zero. Importantly, there was no evidence of autocorrelation or heteroscedasticity, suggesting that the model reliably captured the dominant drivers of GWP across the grid mix scenarios.
In contrast, the cost surrogate model achieved a considerably lower R2 value of 0.139 despite undergoing the same hyperparameter optimization procedure. Although the selected model configuration (with 200 estimators and a maximum depth of 5, with a slightly more conservative minimum sample split of 5) captured some structural variance in the target, it failed to explain most of the observed variability. This weak performance is attributed to several factors: the narrow variability of the cost data within the scenario space explored, the absence of key influencing variables such as capital and operational expenditure fluctuations, electrolyzer performance degradation over time, dynamic policy instruments such as subsidies, and potentially unmodeled nonlinear threshold effects. These limitations constrain the model’s ability to generalize beyond the training conditions.
Despite the limited explanatory power, the cost surrogate was retained for Pareto optimization due to its utility in relatively ranking grid mix scenarios. Moreover, to address physically implausible predictions, most notably negative hydrogen production costs, a post-prediction plausibility filter was introduced. This mechanism automatically excluded all samples from the optimization domain that violated fundamental thermodynamic or economic constraints, thereby preserving the integrity of the multi-objective optimization outcomes. These surrogate model outcomes formed the basis for the multi-objective Pareto optimization described in the following section, enabling a computationally efficient exploration of trade-offs between economic and environmental objectives under different electricity grid mix compositions.
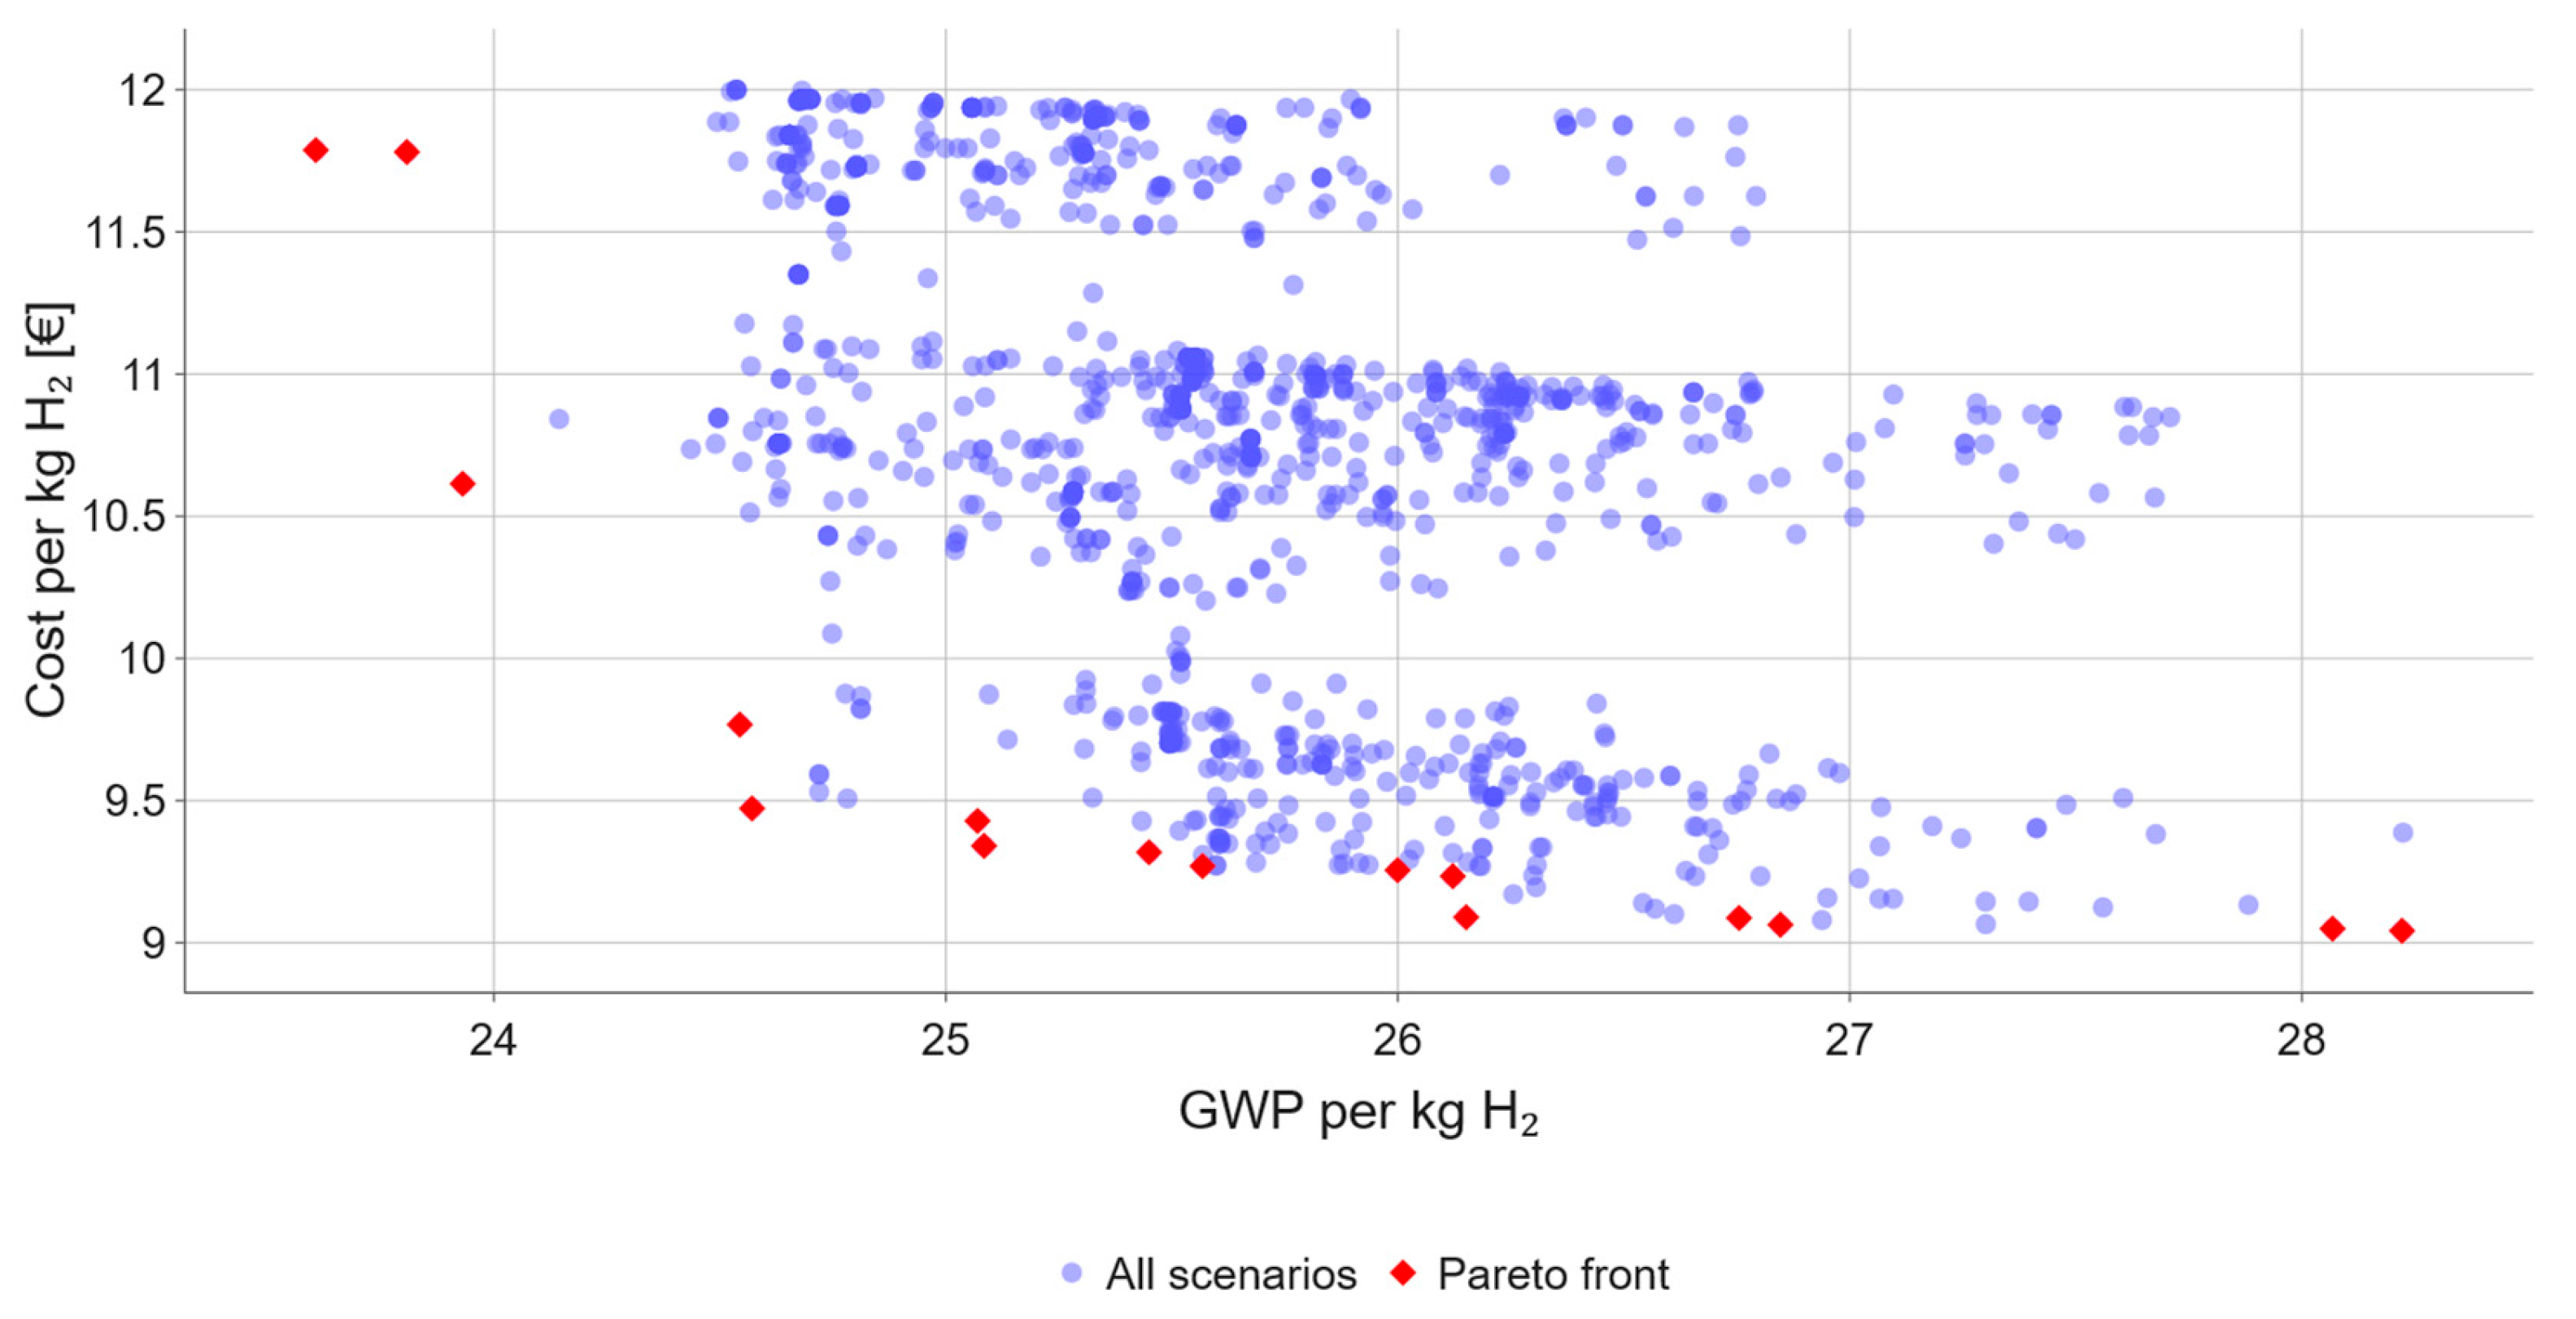
A total of 1300 feasible grid mix scenarios were generated for the years 2025–2045 under national energy transition constraints. From these, Pareto-optimal solutions were identified based on the dual objectives of minimizing the GWP per kilogram of hydrogen and the economic cost per kilogram of hydrogen production. The set of all generated scenarios (n ≈ 1300) was evaluated for Pareto efficiency in the 2D objective space: GWP versus cost. A scenario was marked as Pareto-optimal if no other scenario had both a lower GWP and a lower cost. This resulted in a Pareto front containing 16 non-dominated solutions. Figure 7 presents an overview of the optimization results, showing all evaluated scenarios in the GWP–Cost space, with Pareto-optimal solutions highlighted.
A statistical summary of the Pareto-optimal grid mix compositions is presented in Table 3. Wind and solar emerged as invariant cornerstones of the energy mix, with wind energy fixed at 30% (SD = 0) and solar energy constrained to a minimum of 15%. In contrast, substantial variability was observed for other sources, particularly natural gas (mean = 11.0%, SD = 6.3%) and mineral oil (mean = 6.3%, SD = 4.4%), suggesting flexible roles in achieving the trade-offs. Notably, hydropower exhibited the highest coefficient of variation (CV = 0.97), underscoring its use as a flexible, low-emission balancing option in the selected scenarios.
The key observations include the following.
  • Renewable energy sources (Biomass, Hydropower, Solar, Wind, and others) dominate the energy mix, with wind (mean = 30%) and solar (mean = 15.53%) being particularly prominent.
  • High variability is observed in the shares of hydropower and mineral oil energy (CoV > 0.7), indicating flexibility in how these sources contribute to different cost–impact trade-offs.
  • Nuclear energy plays a crucial balancing role (mean: 10.7%), providing dispatchable baseloads to complement variable renewables.
  • The high standard deviation-to-mean ratios for fossil fuels underscore the necessity of transition to account for volatility and uncertainty, especially under evolving technology costs and policy pressures.
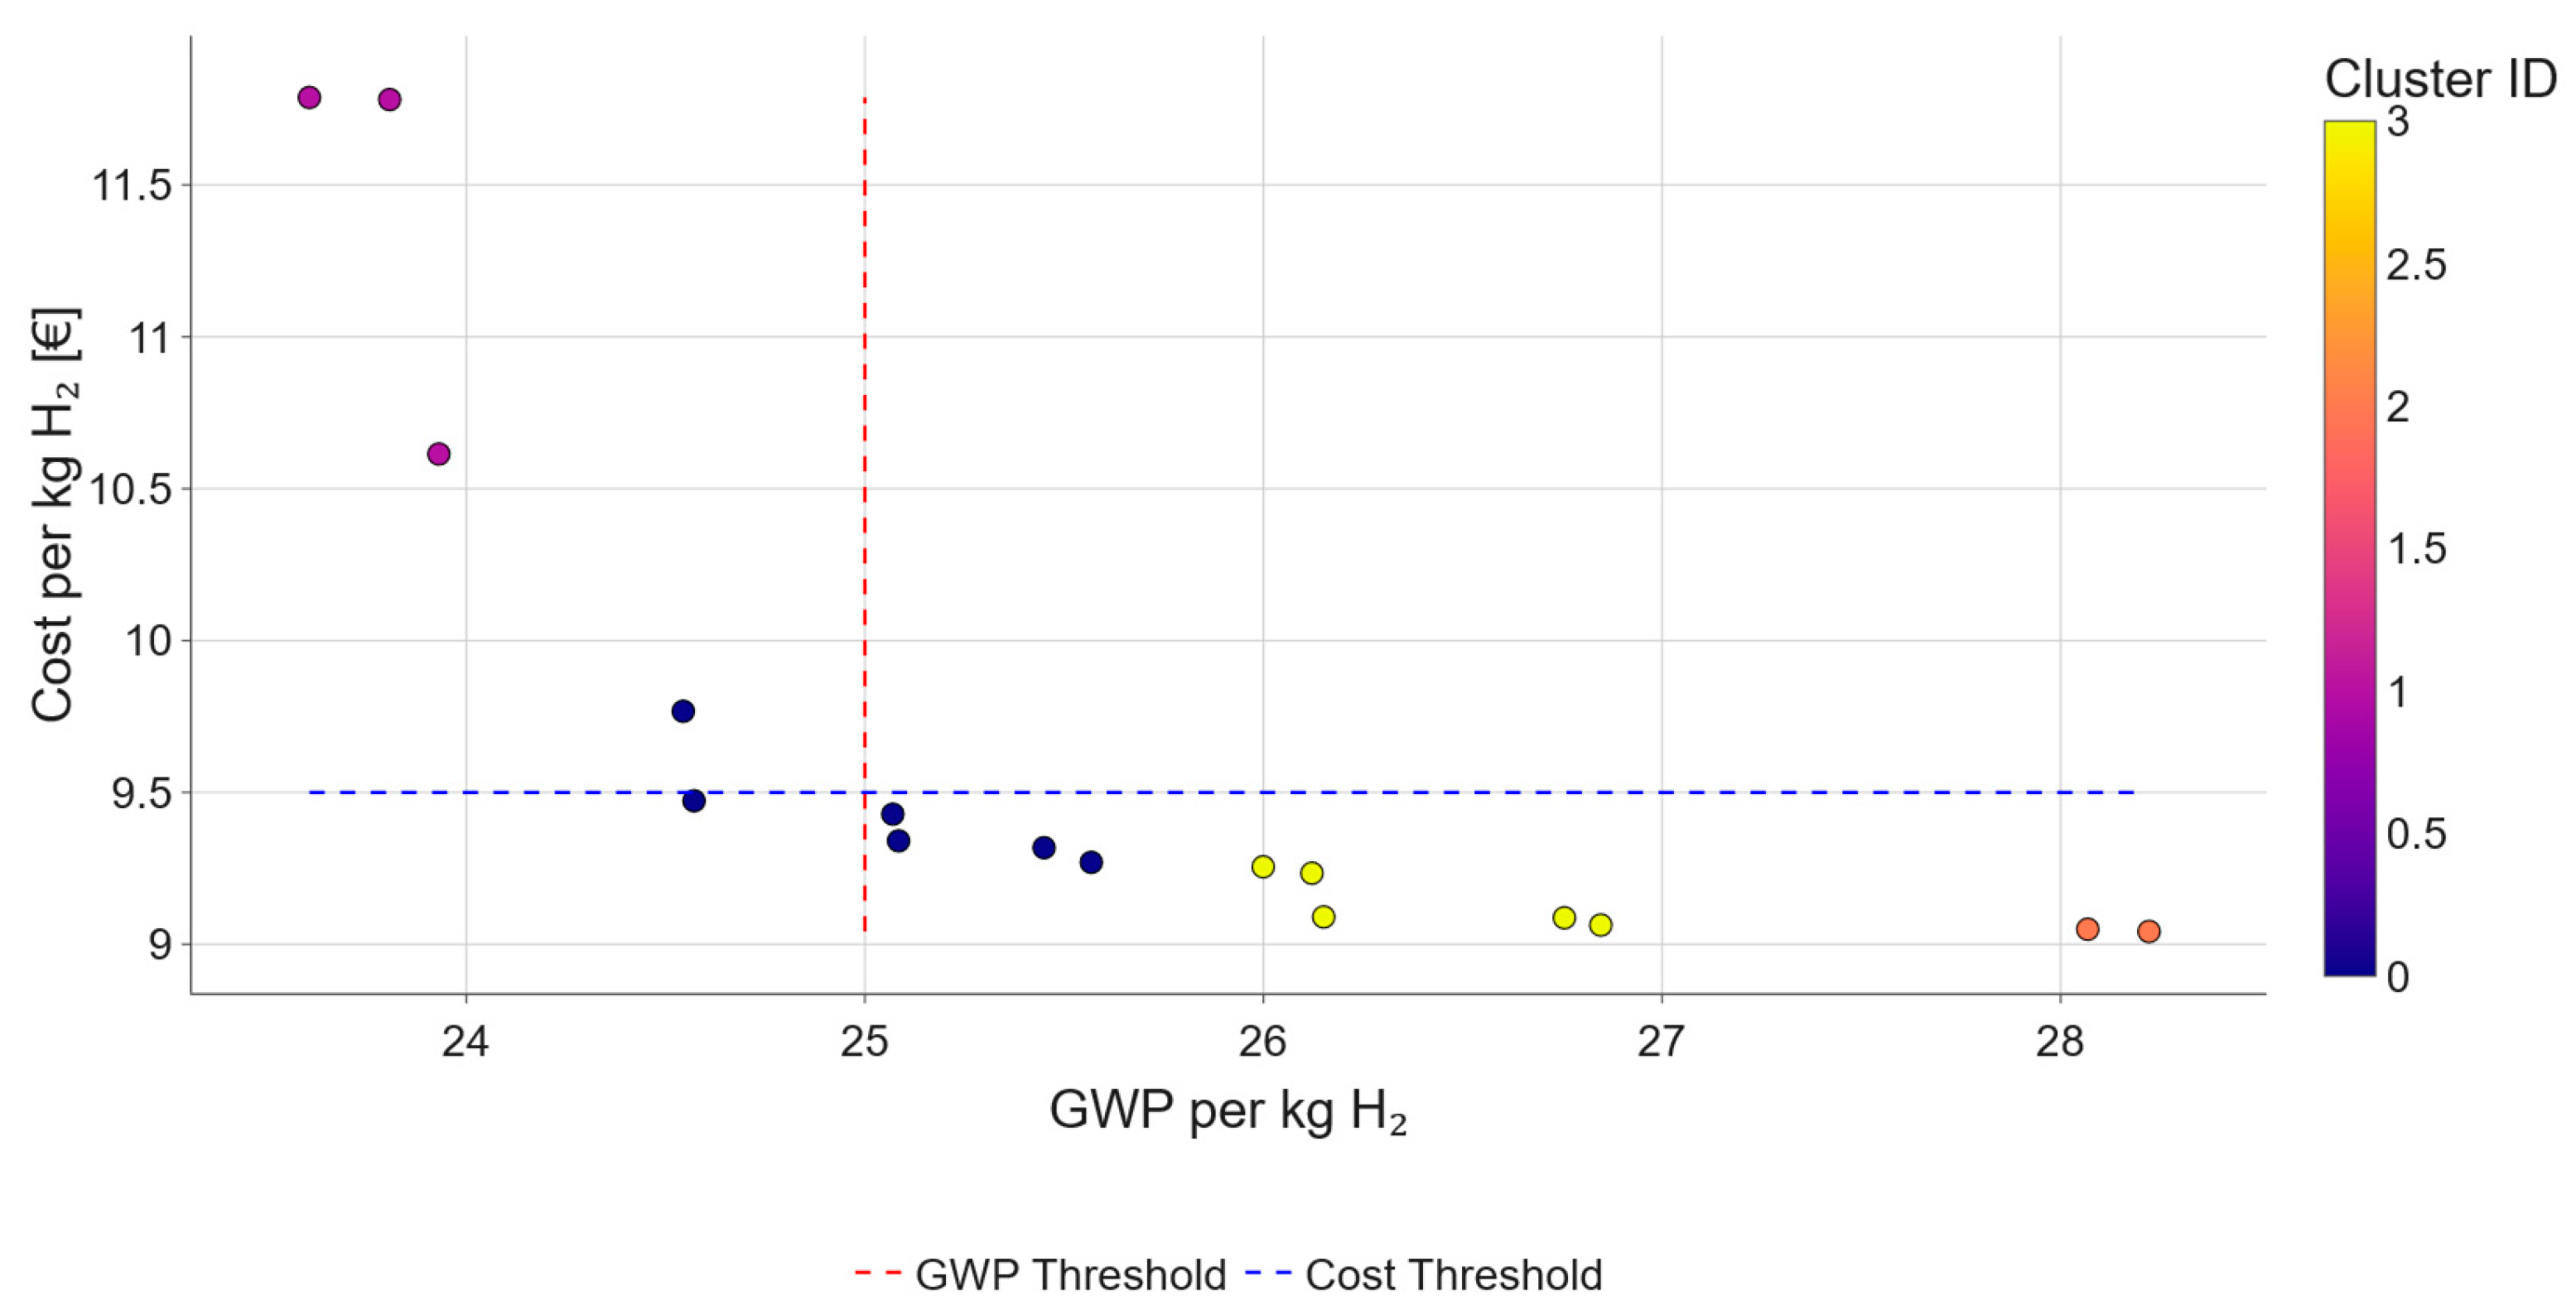
To characterize the different trade-off strategies and solution archetypes, Pareto-optimal scenarios were clustered using K-Means clustering (k = 4). Figure 8 displays the clustered Pareto front solutions in the same objective space with color-coded cluster assignments and overlaid policy thresholds (e.g., GWP < 25 kg CO2-eq/kg H2 and cost < 9.5 €/kg H2) to highlight scenarios that are both environmentally sustainable and economically viable under national targets. These solutions were distributed across four clusters, reflecting distinct strategic directions in the energy policy under multi-objective constraints. Table 4 presents the distribution of Pareto-optimal scenarios across the identified clusters and their strategic insights. Cluster 0 comprised 6 scenarios, representing the most frequently occurring configuration, followed by Cluster 3 (5 scenarios), Cluster 1 (3 scenarios), and Cluster 2 (2 scenarios). The relative scarcity of scenarios in Cluster 2 may indicate a more niche or extreme configuration within the optimization landscape, such as minimal natural gas deployment.
To further illustrate the trade-off landscape, three representative scenarios were selected from the Pareto front (as shown in Figure 8):
Lowest-Cost Scenario (2025, Cluster 2): This configuration prioritizes economic efficiency with a total system cost of 9.04 €/kg H2 and a GWP of 28.22 kg CO2-eq/kg H2. It featured elevated shares of hard coal (13.64%) and nuclear energy (17.34%), with minimal reliance on natural gas (0.97%) and no contribution from hydropower. The lowest natural gas value suggests that the gas is costlier or environmentally burdened in the model. This scenario reflects a cost-minimizing regime where low-carbon flexibility options are deprioritized. The implication of this scenario is that prioritizing short-term affordability leads to substantial GHG emissions, making it likely infeasible under stringent EU 2030/2045 climate targets. It reflects a continuation of legacy infrastructure without aggressive decarbonization.
Lowest-GWP Scenario (2033, Cluster 1): This scenario achieved the lowest GWP (23.61 kg CO2-eq/kg H2) at a higher cost (11.79 €/kg H2), with a diversified portfolio including increased shares of renewables with wind (30%), solar (15%), biomass (10.43%), hydropower (3.49%), and natural gas (19.80%), while significantly reducing hard coal (3.67%) and nuclear (2.13%). The configuration reflects a shift towards moderate-carbon intensity fuels and renewable dispatchable sources, and this scenario achieves GWP reductions through moderate renewable and cleaner combustion sources. Nuclear is minimized (2.13%), possibly due to political constraints or decommissioning assumptions. It may face higher costs from reliance on flexible but high marginal cost sources like gas and biomass.
Balanced Scenario (2034, Cluster 0): Offering a compromise between cost (9.47 €/kg H2) and emissions (24.57 kg CO2-eq/kg H2), this scenario maintained intermediate shares across most technologies. Key features include a diversified mix, with no technology share exceeding 18%. Natural gas (17.39%) and nuclear (10.03%) featured prominently alongside a modest share of lignite (4.35%) and hydropower (3.07%), suggesting that moderate levels of all firm generation technologies may provide the best trade-off under specific constraints. Implications: This scenario strikes a pragmatic balance, with acceptable environmental performance and moderate cost. Nuclear and gas serve as transitional pillars to decarbonization. It indicates the feasibility of near-term optimization without a full transition to renewables. This may represent “transitional pathways” under scenarios like Germany’s Energiewende with import/export hedging. This configuration illustrates a policy-aligned and operationally feasible pathway, balancing sustainability and affordability under real-world constraints.

4. Discussion

4.1. Sensitivity Analysis Using OFAT Methodology

To complement the surrogate modeling and optimization results, we conducted a One-Factor-At-a-Time (OFAT) sensitivity analysis [35] on the trained surrogate models. The objective was to quantify the influence of the individual electricity source shares in the German grid mix on the predicted hydrogen production cost and global warming potential.
A Pareto-optimal scenario corresponding to the year 2034 was selected as the baseline configuration, representing a balanced trade-off between low GWP and hydrogen production cost. For each key input variable—i.e., grid mix shares of solar, wind, biomass, coal, natural gas, and nuclear power, a perturbation of ±10% relative to the baseline value was applied while holding all other variables constant. The resulting impact on GWP and cost was evaluated using the trained surrogate model. The sensitivity index for each input variable was calculated based on the normalized effect of the input perturbation on the model output. The formula used for the normalized sensitivity index S i , n o r m is:
S i , n o r m = Y i + Y i 2 .   Δ X i ·   X i b a s e l i n e Y b a s e l i n e
where
  • Y i + and Y i are the output values (GWP or cost) after increasing and decreasing input X i by 10%, respectively;
  • Δ X i is the magnitude of the perturbation (10% of X i b a s e l i n e );
  • X i b a s e l i n e is the baseline value of the input;
  • Y b a s e l i n e is the baseline output value (GWP or cost).
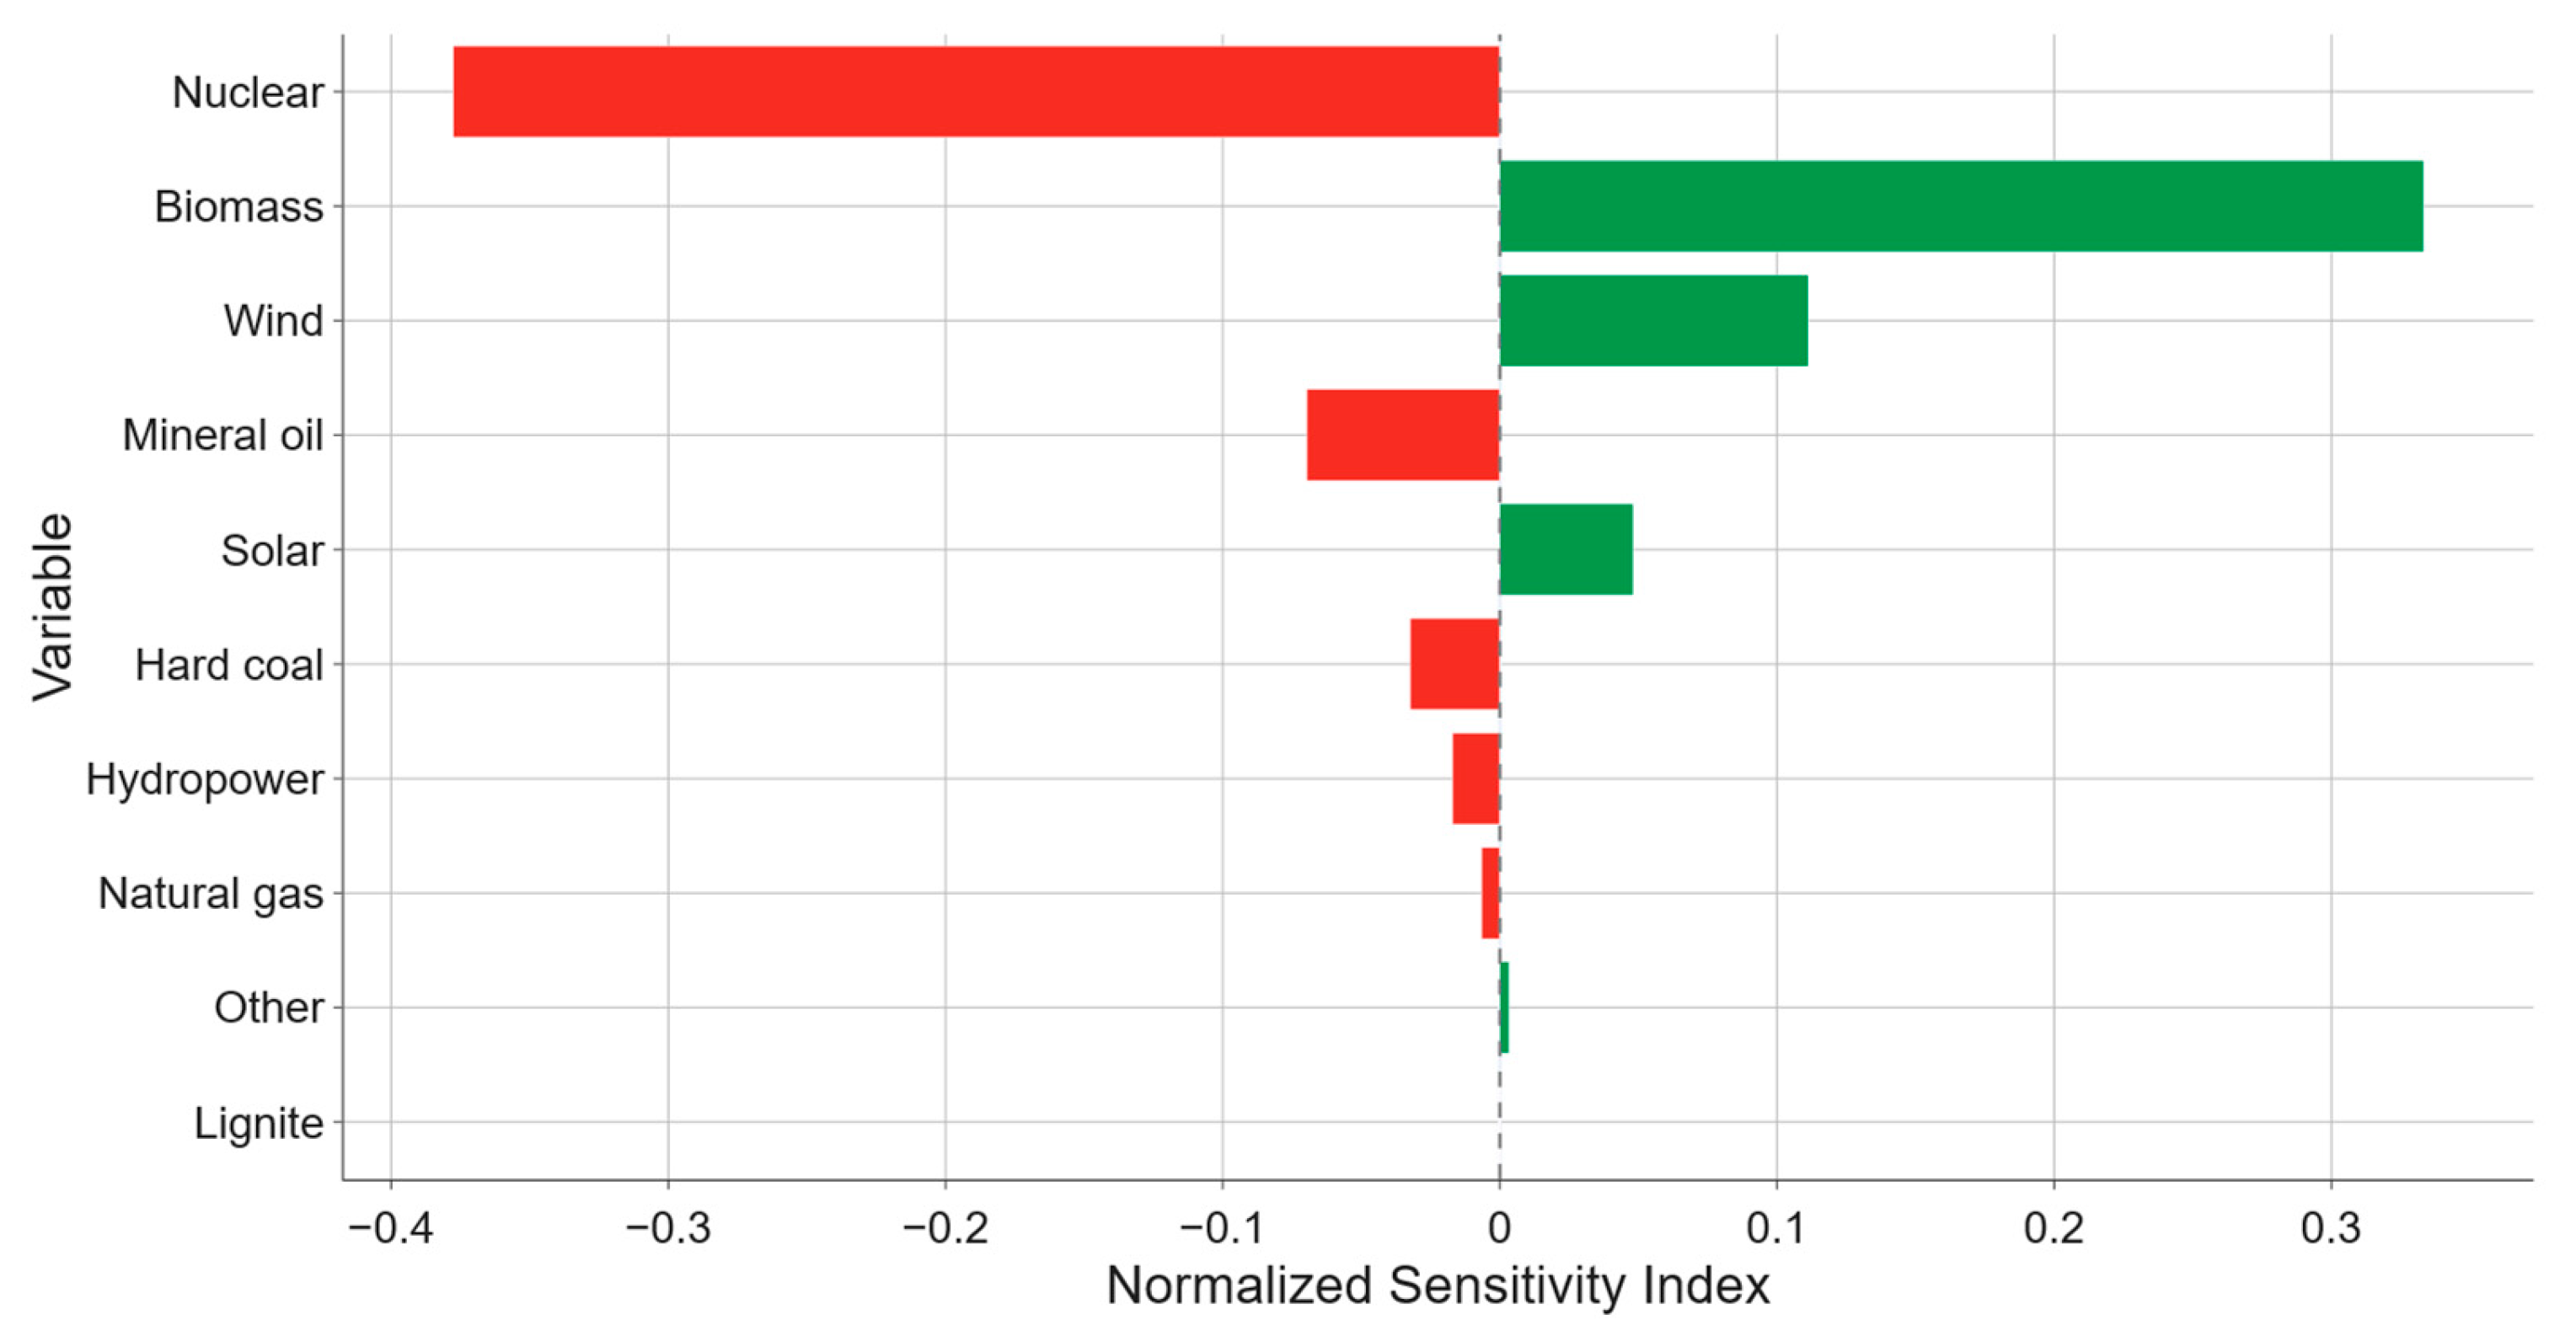
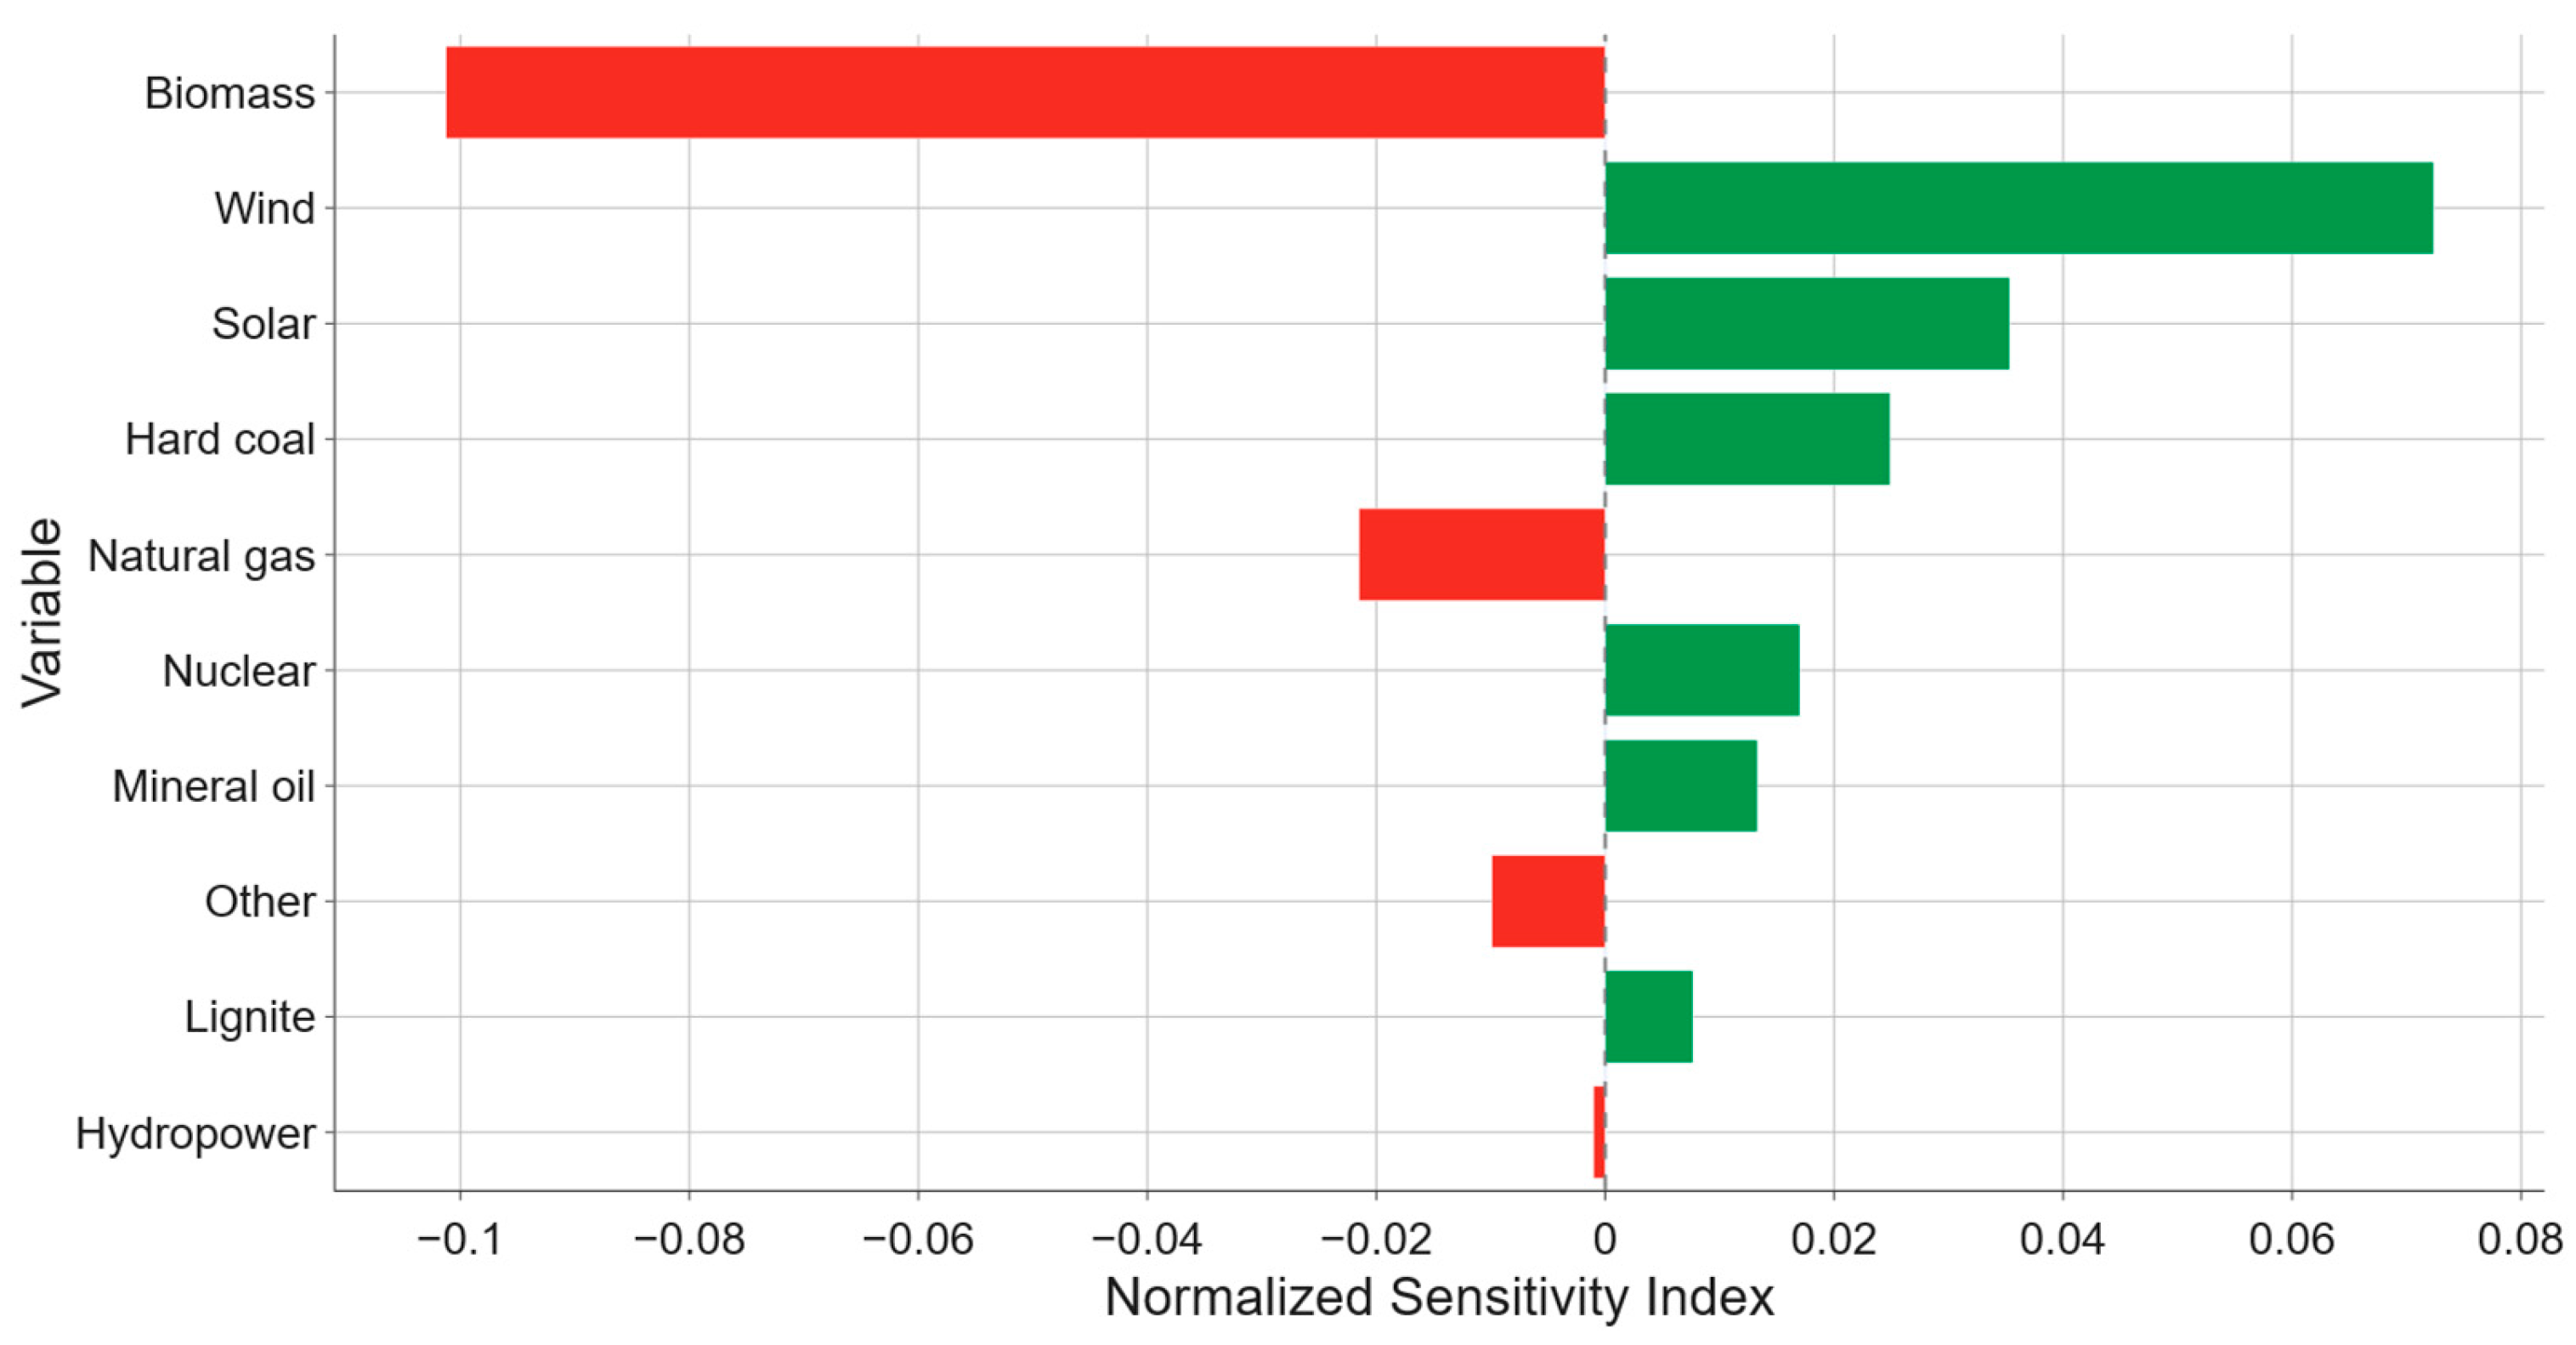
This formulation captures both the local gradient and the relative magnitude of each variable’s influence in a dimensionless manner, enabling comparison across different inputs. The resulting normalized sensitivity indices are shown in Figure 9 (Cost) and Figure 10 (GWP) as Tornado plots.
The most influential factor for hydrogen production cost was nuclear share, with a strong negative sensitivity, indicating that increasing nuclear contribution significantly lowers cost. This is likely due to its role in base-load supply and its low marginal generation cost. Biomass and wind share also had notable positive effects, i.e., cost increases with higher contributions from these sources, due to feedstock pricing in biomass and intermittently related integration costs for wind. Solar energy, natural gas, and coal exhibited relatively minor sensitivities in this scenario. Similarly, the dominant variable influencing GWP was the biomass share, which exhibited the largest negative effect, indicating that higher biomass penetration significantly reduced life-cycle GHG emissions. Conversely, this is followed by wind and solar share contributing positively but with a lesser magnitude. This indicates that increasing their contributions (in the given context) could potentially increase the overall GWP due to embedded emissions and system boundary assumptions in the life cycle inventory.
These results provide several valuable insights: The model is sensitive in expected directions, demonstrating physical and economic consistency. Biomass has high leverage on both environmental and cost outcomes, though in opposite directions. These sensitivity patterns validate the interpretability of the surrogate models and reinforce the findings of the optimization results. Notably, the nonlinearity captured by the Random Forest models allowed for uncovering subtle interaction effects, although OFAT by construction neglects interaction terms. Nevertheless, the OFAT analysis provides an essential first-order approximation of variable importance and demonstrates the surrogate models’ capacity for scenario diagnostics. Future extensions may apply global variance-based methods [36] such as Sobol indices or Morris screening to further capture nonlinear and interactive sensitivities.

4.2. Methodological Advancements and Policy-Constrained

Static-grid assumptions in earlier Studies overlook Germany’s evolving power mix, leading to misleading estimates of hydrogen production [26,37]. These models ignore policy mandates the coal phase out and the renewable targets in the future. In contrast, the dynamic policy-constrained optimization in this paper reveals realistic trade-offs, e.g., a 2034 scenario with 24.57 kg CO2-eq/kg H2 at 9.47 €/kg H2, that static models would miss.
Unlike prior studies that assumed static grid mixes, this study introduces a policy-constrained, dynamically projected multi-objective optimization framework that integrates real-world environmental and cost data with machine-learning-based surrogate modeling. Our analytical pipeline leverages Random Forest regression models trained on time-series data from 2007 to 2023 to estimate the life-cycle GWP and economic cost per kilogram of hydrogen produced from varying electricity mixes.
This approach enables the projection of over 1300 feasible grid-mix scenarios between 2025 and 2045, constrained by German energy policy mandates such as the coal phase-out by 2038 and the renewable share targets of ≥80% by 2030. The use of Pareto optimization allows the simultaneous exploration of trade-offs between environmental impact and economic performance, yielding a spectrum of optimal solutions that are clustered and analyzed in detail.

4.3. Sensitivity to Renewable Share and Energy Sources

The results clearly demonstrate that achieving a GWP below 25 kg CO2-eq/kg H2 is feasible only when renewable electricity contributes over 80% of the energy mix. In particular, high shares of hydropower, solar photovoltaic, and “Other” renewables (e.g., imports, synthetic fuels) are consistently found in low-GWP scenarios. Conversely, scenarios optimized solely for cost often include higher shares of transitional sources, such as natural gas or nuclear sources, which reduce costs but elevate climate impact.
The identification of a balanced optimal scenario (GWP = 24.57 kg CO2-eq/kg H2, cost = 9.47 €/kg H2) in 2032 supports the hypothesis of this study that a constrained optimization procedure respecting national energy policy boundaries can identify environmentally and economically feasible transition pathways. This hypothesis demonstrates that a synergistic mix of biomass, hydropower, and moderate solar energy can align with Germany’s hydrogen strategy without relying on fossil-based inputs, confirming previous assertions that the environmental performance of hydrogen production is highly sensitive to the source of electricity input [38]. The scenarios with the lowest GWP per kg H2 were dominated by high shares of hydropower, solar PV, and other renewable sources, corroborating the findings of Ajeeb et al. (2025) [39] that zero-carbon hydrogen is only achievable with >90% low-emission power. Conversely, scenarios optimized solely for cost showed substantial shares of transitional or fossil-based sources, such as natural gas and nuclear, often yielding lower hydrogen prices but at the expense of higher climate impacts.

4.4. Interpretation of Trade-Offs and Model Limitations

The Pareto frontier reflects clear trade-offs between cost and environmental performance, with viable middle-ground scenarios available, especially from 2030 onwards.
  • Low-GWP scenarios (e.g., 23.61 kg CO2-eq/kg H2 in 2033) demand high shares of intermittent renewables such as solar and hydropower but incur elevated costs (up to 12 €/kg H2), likely due to assumed storage, curtailment, or import penalties.
  • Low-cost scenarios (e.g., 9.04 €/kg H2 in 2025) contain high reliance on contributions from subsidized or legacy sources (e.g., hard coal, nuclear) and are interpreted as artifacts of extrapolation in the surrogate model, likely infeasible under stringent EU 2030/2045 climate targets. These results highlight the limitations of surrogate model generalization, particularly when the training data are sparse or extrapolated.
While these low-cost configurations are mathematically valid on the Pareto front, they are environmentally non-compliant and economically infeasible. Their inclusion underscores the limitation of regression-based surrogate modeling, particularly in extrapolation regimes, where the input feature space (grid mix composition) diverges from historical distributions. Although these data points may exist mathematically on the Pareto frontier, they are physically infeasible and excluded from policy-relevant recommendations. Therefore, negative cost estimates should be treated as unreliable, warranting future model improvements via GPR or ensemble learning approaches that capture predictive uncertainty and bound output more realistically using scenario-aware techno-economic projections. Importantly, several Pareto-optimal configurations include nuclear contributions exceeding 15%, aligning with recent debates on whether phasing out nuclear too early may constrain Germany’s ability to meet decarbonization goals [40].

4.5. Policy and Technological Implications

This analysis offers several insights into guiding hydrogen transition strategies.
  • Feasibility of Renewable Targets: Achieving ≥80% renewable electricity in the hydrogen supply is technically feasible post-2030, contingent on a diversified generation portfolio and adequate dispatchable reserves.
  • Role of Clean Baseload: High shares of hydropower, biomass, and potentially nuclear (or modular/fusion-based substitutes) are critical for maintaining low GWP while containing costs.
  • Technology Neutrality: Some scenarios include moderate nuclear and natural gas with carbon capture (CCS, modeled via proxy), suggesting that technology-neutral frameworks may offer greater flexibility in achieving dual objectives.
  • Cost-Impact Trade-Offs: GWP reductions below 25 kg CO2-eq/kg H2 consistently correlated with costs above 9 €/kg H2. Carbon pricing, subsidies, and green premiums are essential to bridge this gap.
  • Sequencing Matters: The temporal alignment of the coal exit, renewable ramp-up, and infrastructure deployment critically determines the environmental and economic profiles of hydrogen. “Balanced” scenarios—such as that in 2034—should be prioritized for investment modeling, regulatory focus, and incentive schemes.
Importantly, some Pareto-optimal scenarios included >15% nuclear contributions, echoing current debates on the economic and environmental implications of Germany’s nuclear phase-out [40]. Although Germany decommissioned its last three reactors in Emsland, Isar II, and Neckarwestheim II in Apr. 2023 [41], global research on clean baseload options continues, ranging from fusion breakthroughs at the Wendelstein 7-X Stellarator [42] to international projects such as ITER [43]. In addition, small modular reactors have been extensively studied and discussed in Germany owing to their low waste, low cost, and safety. However, the number of facilities must be sufficiently large to cover the output generated by nuclear power plants [40]. This framework allows energy planners and hydrogen producers to compare future supply strategies quantitatively under policy constraints.
  • Scenarios identified as “balanced” should be prioritized for investment modeling and policy incentivization because of their dual performance.
  • Trade-off solutions, such as the Balanced Scenario (2034), offer the most viable pathways for balancing grid feasibility, cost efficiency, and environmental performance.

5. Conclusions

The methodological integration of environmental impact analysis, machine learning, and constrained scenario modeling adds to a growing body of literature advocating multi-objective optimization for energy transition planning [32,44]. The following novelties are emphasized.
  • Policy-Constrained Optimization Framework: A dynamic, policy-compliant, multi-objective optimization framework was developed that integrates national energy targets into hydrogen planning, avoiding the unrealistic assumptions common in unconstrained models.
  • Dynamic Grid Mix Surrogates: The study replaces static assumptions of electricity sourcing with a time-series-based surrogate model that reflects the evolution of Germany’s grid mix over a 20-year period (2025–2045). This enables realistic temporal mapping of the energy input structure in hydrogen production scenarios.
  • Quantified Transition Benchmarks: A feasible cost-impact trade-off is identified, providing clear actionable targets for hydrogen producers and policymakers.
This study enables the evaluation and screening of viable transition pathways for green hydrogen.
However, this study has some limitations. The surrogate models used for impact and cost prediction showed limitations in accuracy (particularly for cost), with negative cost values indicating possible extrapolation artifacts. Therefore, the main policy conclusions must be drawn from the environmental dimension, with cost included for illustrative and comparative purposes. It is intended to serve as a relative indicator to enable trade-off exploration within the optimization framework. Furthermore, while the study provides quantitative results under various policy and grid scenarios, it does not assess the technical feasibility of achieving these outcomes in practice. Critical operational factors, such as dispatchability, reserve margins, seasonal energy balancing, and curtailment, are not considered in the current analysis [45]; however, they play a vital role in determining the real-world viability of such energy system configurations. Therefore, future research is needed to integrate these dimensions and provide a more comprehensive assessment. More robust uncertainty modeling, such as Gaussian Process Regression or Bayesian Neural Networks, should be explored in future studies. Furthermore, future research should aim to enhance the realism and decision relevance of hydrogen system assessments by integrating forward-looking levelized cost of electricity (LCOE) projections and technology-specific learning curves to reflect anticipated cost reductions over time. Incorporating dynamic demand-side modeling and temporal dispatch optimization will allow for a more accurate estimation of the flexibility and storage requirements associated with intermittent renewables. Possible future work could further apply the Pareto-frontier sensitivity framework of Gianellos et al. [6] to expose cost-versus-emission trade-offs and test the easy-transfer reinforcement-learning controller of Zeng et al. [10] to keep electrolyzer operation near-optimal as grid-conditions evolve. In addition, regional disaggregation of electricity supply scenarios is essential for capturing the spatial heterogeneity in renewable resource potential, infrastructure availability, and transmission constraints [45]. Finally, the application of probabilistic modeling frameworks, such as Bayesian optimization or Monte Carlo-based robustness analysis, can improve the reliability of planning under uncertainty by explicitly quantifying the risks and trade-offs associated with alternative grid mix strategies. The future research should apply more advanced interpretability techniques, such as SHAP or permutation importance, to strengthen the robustness of sensitivity results. Finally, the integration of real-world policy levers, such as carbon pricing trajectories, renewable subsidies, and EU-level electricity interconnection flows, can further increase the relevance of the model for policymakers designing transition strategies for a low-carbon hydrogen economy. Furthermore, the approach can be extended to other regions with heterogeneous grid decarbonization timelines (e.g., Eastern Europe, Asia-Pacific), allowing for cross-country optimization under regional constraints.

Author Contributions

Conceptualization, S.M.G. and Y.C.; methodology, S.M.G. and Y.C.; technical analysis, S.M.G.; validation, S.M.G. and Y.C.; formal analysis, S.M.G. and Y.C.; investigation, S.M.G. and Y.C.; resources, S.M.G., Y.C., A.-K.M. and G.S.; data curation, A.-K.M. and G.S.; writing—original draft preparation, S.M.G., Y.C., A.-K.M. and G.S.; writing—review and editing, S.M.G., Y.C., A.-K.M., G.S. and A.F.; visualization, S.M.G., Y.C. and G.S. Supervision, S.M.G., Y.C. and A.F.; project administration, S.M.G., Y.C. and A.F. All authors have read and agreed to the published version of the manuscript.

Funding

This research received no external funding.

Data Availability Statement

The authors confirm that all data used in this study are openly available within the article. Further inquiries can be directed to the corresponding authors.

Conflicts of Interest

The authors declare no conflicts of interest.

Nomenclature

ADPAbiotic Depletion Potential
APAcidification
AWEAlkaline Water Electrolysis
CCSCarbon Capture and Storage
CoVCoefficient of Variation
cLHSConstrained Latin Hypercube Sampling
EP fwEutrophication freshwater
EP swEutrophication marine
EP terEutrophication terrestrial
GPRGaussian Process Regression
GWPGlobal Warming Potential
LCALife Cycle Assessment
LCOELevelized Cost of Electricity
ODPOzone depletion
PMParticulate Matter
POCPPhotochemical ozone formation
PVPhotovoltaics
RESRenewable Energy Surcharge
StromNEVRegulation on Fees for Access to Electricity Supply Grids

References

  1. Franco, A.; Giovannini, C. Recent and Future Advances in Water Electrolysis for Green Hydrogen Generation: Critical Analysis and Perspectives. Sustainability 2023, 15, 16917. [Google Scholar] [CrossRef]
  2. Dash, S.; K, A.S.; S, J.; D, V.H.W.; D, E.; Surapraraju, S.K.; Natarajan, S.K. Advances in green hydrogen production through alkaline water electrolysis: A comprehensive review. Int. J. Hydrogen Energy 2024, 83, 614–629. [Google Scholar] [CrossRef]
  3. Lee, B.; Cho, H.-S.; Kim, H.; Lim, D.; Cho, W.; Kim, C.-H.; Lim, H. Integrative techno-economic and environmental assessment for green H2 production by alkaline water electrolysis based on experimental data. J. Environ. Chem. Eng. 2021, 9, 106349. [Google Scholar] [CrossRef]
  4. Gerloff, N. Comparative Life-Cycle-Assessment analysis of three major water electrolysis technologies while applying various energy scenarios for a greener hydrogen production. J. Energy Storage 2021, 43, 102759. [Google Scholar] [CrossRef]
  5. Petelet, M.; Iooss, B.; Asserin, O.; Loredo, A. Latin hypercube sampling with inequality constraints. AStA Adv. Stat. Anal. 2010, 94, 325–339. [Google Scholar] [CrossRef]
  6. Giannelos, S.; Zhang, X.; Zhang, T.; Strbac, G. Multi-Objective Optimization for Pareto Frontier Sensitivity Analysis in Power Systems. Sustainability 2024, 16, 5854. [Google Scholar] [CrossRef]
  7. Baños, R.; Manzano-Agugliaro, F.; Montoya, F.G.; Gil, C.; Alcayde, A.; Gómez, J. Optimization methods applied to renewable and sustainable energy: A review. Renew. Sustain. Energy Rev. 2011, 15, 1753–1766. [Google Scholar] [CrossRef]
  8. World Energy Outlook 2024—Analysis—IEA. Available online: https://www.iea.org/reports/world-energy-outlook-2024 (accessed on 17 June 2025).
  9. Global Energy Perspective 2024 | McKinsey. Available online: https://www.mckinsey.com/industries/energy-and-materials/our-insights/global-energy-perspective#/ (accessed on 17 June 2025).
  10. Zeng, Y.; Jiang, S.; Konstantinou, G.; Pou, J.; Zou, G.; Zhang, X. Multi-Objective Controller Design for Grid-Following Converters With Easy Transfer Reinforcement Learning. IEEE Trans. Power Electron. 2025, 40, 6566–6577. [Google Scholar] [CrossRef]
  11. Eurostat. Electricity Prices for Non-Household Consumers—Bi-Annual Data (from 2007 Onwards). 2022. Available online: https://ec.europa.eu/eurostat/databrowser/product/page/NRG_PC_205 (accessed on 22 May 2025).
  12. Koj, J.; Wulf, C.; Schreiber, A.; Zapp, P. Site-Dependent Environmental Impacts of Industrial Hydrogen Production by Alkaline Water Electrolysis. Energies 2017, 10, 860. [Google Scholar] [CrossRef]
  13. Bruttostromerzeugung Nach Energieträgern in Deutschland ab 1990. Available online: https://www.destatis.de/DE/Themen/Branchen-Unternehmen/Energie/Erzeugung/bar-chart-race.html (accessed on 22 May 2025).
  14. Ecoinvent Version 3.8. Available online: https://support.ecoinvent.org/ecoinvent-version-3.8 (accessed on 18 June 2025).
  15. Ajeeb, W.; Baptista, P.; Neto, R.C. Life cycle analysis of hydrogen production by different alkaline electrolyser technologies sourced with renewable energy. Energy Convers. Manag. 2024, 316, 118840. [Google Scholar] [CrossRef]
  16. Huijbregts, M.A.J.; Steinmann, Z.J.N.; Elshout, P.M.F.; Stam, G.; Verones, F.; Vieira, M.; Zijp, M.; Hollander, A.; van Zelm, R. ReCiPe2016: A harmonised life cycle impact assessment method at midpoint and endpoint level. Int. J. Life Cycle Assess. 2017, 22, 138–147. [Google Scholar] [CrossRef]
  17. Neupane, B.; Belkadi, F.; Formentini, M.; Rozière, E.; Hilloulin, B.; Abdolmaleki, S.F.; Mensah, M. Machine learning algorithms for supporting life cycle assessment studies: An analytical review. Sustain. Prod. Consum. 2025, 56, 37–53. [Google Scholar] [CrossRef]
  18. Prina, M.G.; Dallapiccola, M.; Moser, D.; Sparber, W. Machine learning as a surrogate model for EnergyPLAN: Speeding up energy system optimization at the country level. Energy 2024, 307, 132735. [Google Scholar] [CrossRef]
  19. Naser, A.Z.; Defersha, F.; Xu, X.; Yang, S. Automating life cycle assessment for additive manufacturing with machine learning: Framework design, dataset buildup, and a case study. J. Manuf. Syst. 2023, 71, 504–526. [Google Scholar] [CrossRef]
  20. Bundesfinanzministerium—Kohleausstieg Zur Erfüllung der Klimaschutzziele Bei Gleichzeitiger Sicherstellung der Energieversorgung. Available online: https://www.bundesfinanzministerium.de/Content/DE/Standardartikel/Themen/Schlaglichter/Nachhaltigkeitsstrategie/kohleausstieg.html (accessed on 30 June 2025).
  21. BMWE—Erneuerbare Energien. Available online: https://www.bundeswirtschaftsministerium.de/Redaktion/DE/Dossier/erneuerbare-energien.html (accessed on 30 June 2025).
  22. Studie: Wege zu Einem Klimaneutralen Energiesystem—Bundesländer Im Transformationsprozess—Fraunhofer ISE. Available online: https://www.ise.fraunhofer.de/de/veroeffentlichungen/studien/wege-zu-einem-klimaneutralen-energiesystem.html (accessed on 30 June 2025).
  23. Schmeling, L.; Buchholz, A.A.I.; Heineke, H.; Klement, P.; Hanke, B.; von Maydell, K. Planning, Optimisation and Evaluation of Small Power-to-Gas-to-Power Systems: Case Study of a German Dairy. Sustainability 2022, 14, 6050. [Google Scholar] [CrossRef]
  24. Hartigan, J.A.; Wong, M.A. Algorithm AS 136: A K-Means Clustering Algorithm. J. R. Stat. Soc. Ser. C Appl. Stat. 1979, 28, 100–108. [Google Scholar] [CrossRef]
  25. Surucu, O.; Gadsden, S.A.; Yawney, J. Condition Monitoring using Machine Learning: A Review of Theory, Applications, and Recent Advances. Expert Syst. Appl. 2023, 221, 119738. [Google Scholar] [CrossRef]
  26. Koj, J.C.; Zapp, P.; Wieland, C.; Görner, K.; Kuckshinrichs, W. Life cycle environmental impacts and costs of water electrolysis technologies for green hydrogen production in the future. Energy Sustain. Soc. 2024, 14, 64. [Google Scholar] [CrossRef]
  27. Lotrič, A.; Sekavčnik, M.; Kuštrin, I.; Mori, M. Life-cycle assessment of hydrogen technologies with the focus on EU critical raw materials and end-of-life strategies. Int. J. Hydrogen Energy 2021, 46, 10143–10160. [Google Scholar] [CrossRef]
  28. Hoppe, A.C.; Minke, C. Reducing Environmental Impacts of Water Electrolysis Systems by Reuse and Recycling: Life Cycle Assessment of a 5 MW Alkaline Water Electrolysis Plant. Energies 2025, 18, 796. [Google Scholar] [CrossRef]
  29. Huang, X.; Jeswani, H.K.; Azapagic, A. Sustainability assessment of hydrogen production via water electrolysis considering different configurations of solar photovoltaics-battery-grid systems in China. Sustain. Prod. Consum. 2025, 56, 221–244. [Google Scholar] [CrossRef]
  30. Dincer, M.; Agelin-Chaab, M. Sustainability analysis of electrolysis based green hydrogen production pathways: A life cycle perspective. Int. J. Hydrogen Energy 2025, 138, 617–625. [Google Scholar] [CrossRef]
  31. Mehmeti, A.; Angelis-Dimakis, A.; Muñoz, C.B.; Graziadio, M.; McPhail, S.J. Eco-thermodynamics of hydrogen production by high-temperature electrolysis using solid oxide cells. J. Clean. Prod. 2018, 199, 723–736. [Google Scholar] [CrossRef]
  32. Kiss, B.; Szalay, Z. Sensitivity of buildings’ carbon footprint to electricity decarbonization: A life cycle–based multi-objective optimization approach. Int. J. Life Cycle Assess. 2023, 28, 933–952. [Google Scholar] [CrossRef]
  33. Bundesfinanzministerium—E—EEG-Umlage. Available online: https://www.bundesfinanzministerium.de/Web/DE/Service/FAQ_Glossar/Glossar/Functions/glossar.html?lv2=176620&lv3=176670 (accessed on 23 June 2025).
  34. Strompreis Entwicklung in Deutschland Für Haushalte Und Industrie | BDEW. Available online: https://www.bdew.de/service/daten-und-grafiken/bdew-strompreisanalyse/ (accessed on 20 June 2025).
  35. Hamby, D.M. A review of techniques for parameter sensitivity analysis of environmental models. Environ. Monit. Assess. 1994, 32, 135–154. [Google Scholar] [CrossRef] [PubMed]
  36. Groen, E.A.; Bokkers, E.A.M.; Heijungs, R.; de Boer, I.J.M. Methods for global sensitivity analysis in life cycle assessment. Int. J. Life Cycle Assess. 2017, 22, 1125–1137. [Google Scholar] [CrossRef]
  37. Schindler, D.; Sander, L.; Jung, C. Importance of renewable resource variability for electricity mix transformation: A case study from Germany based on electricity market data. J. Clean. Prod. 2022, 379, 134728. [Google Scholar] [CrossRef]
  38. Maniscalco, M.P.; Longo, S.; Cellura, M.; Miccichè, G.; Ferraro, M. Critical Review of Life Cycle Assessment of Hydrogen Production Pathways. Environments 2024, 11, 108. [Google Scholar] [CrossRef]
  39. Ajeeb, W.; Neto, R.C.; Baptista, P. Comparative Life Cycle Analysis of Electrolysis Hydrogen Production from Diverse Green Energy Sources. In Technological Advancements and Future Directions in Green Energy; Peng, Z., Ed.; Green Energy and Technology; Springer Nature: Cham, Switzerland, 2025; pp. 49–61. ISBN 978-3-031-83202-4. [Google Scholar]
  40. BASE—Small Modular Reactors (SMR). Available online: https://www.base.bund.de/en/nuclear-safety/nuclear-technology/small-modular-reactors/small-modular-reactors_content.html (accessed on 23 June 2025).
  41. BASE—Nuclear Phase-Out. Available online: https://www.base.bund.de/en/nuclear-safety/nuclear-phase-out/nuclear-phase-out_content.html (accessed on 23 June 2025).
  42. New Performance Records Wendelstein 7-X. Available online: https://www.ipp.mpg.de/5532945/w7x (accessed on 23 June 2025).
  43. ITER—The Way to New Energy. Available online: https://www.iter.org/ (accessed on 23 June 2025).
  44. Prina, M.G.; Barchi, G.; Osti, S.; Moser, D. Optimal future energy mix assessment considering the risk of supply for seven European countries in 2030 and 2050. e-Prime—Adv. Electr. Eng. Electron. Energy 2023, 5, 100179. [Google Scholar] [CrossRef]
  45. Kirchem, D.; Schill, W.-P. Power sector effects of green hydrogen production in Germany. Energy Policy 2023, 182, 113738. [Google Scholar] [CrossRef]
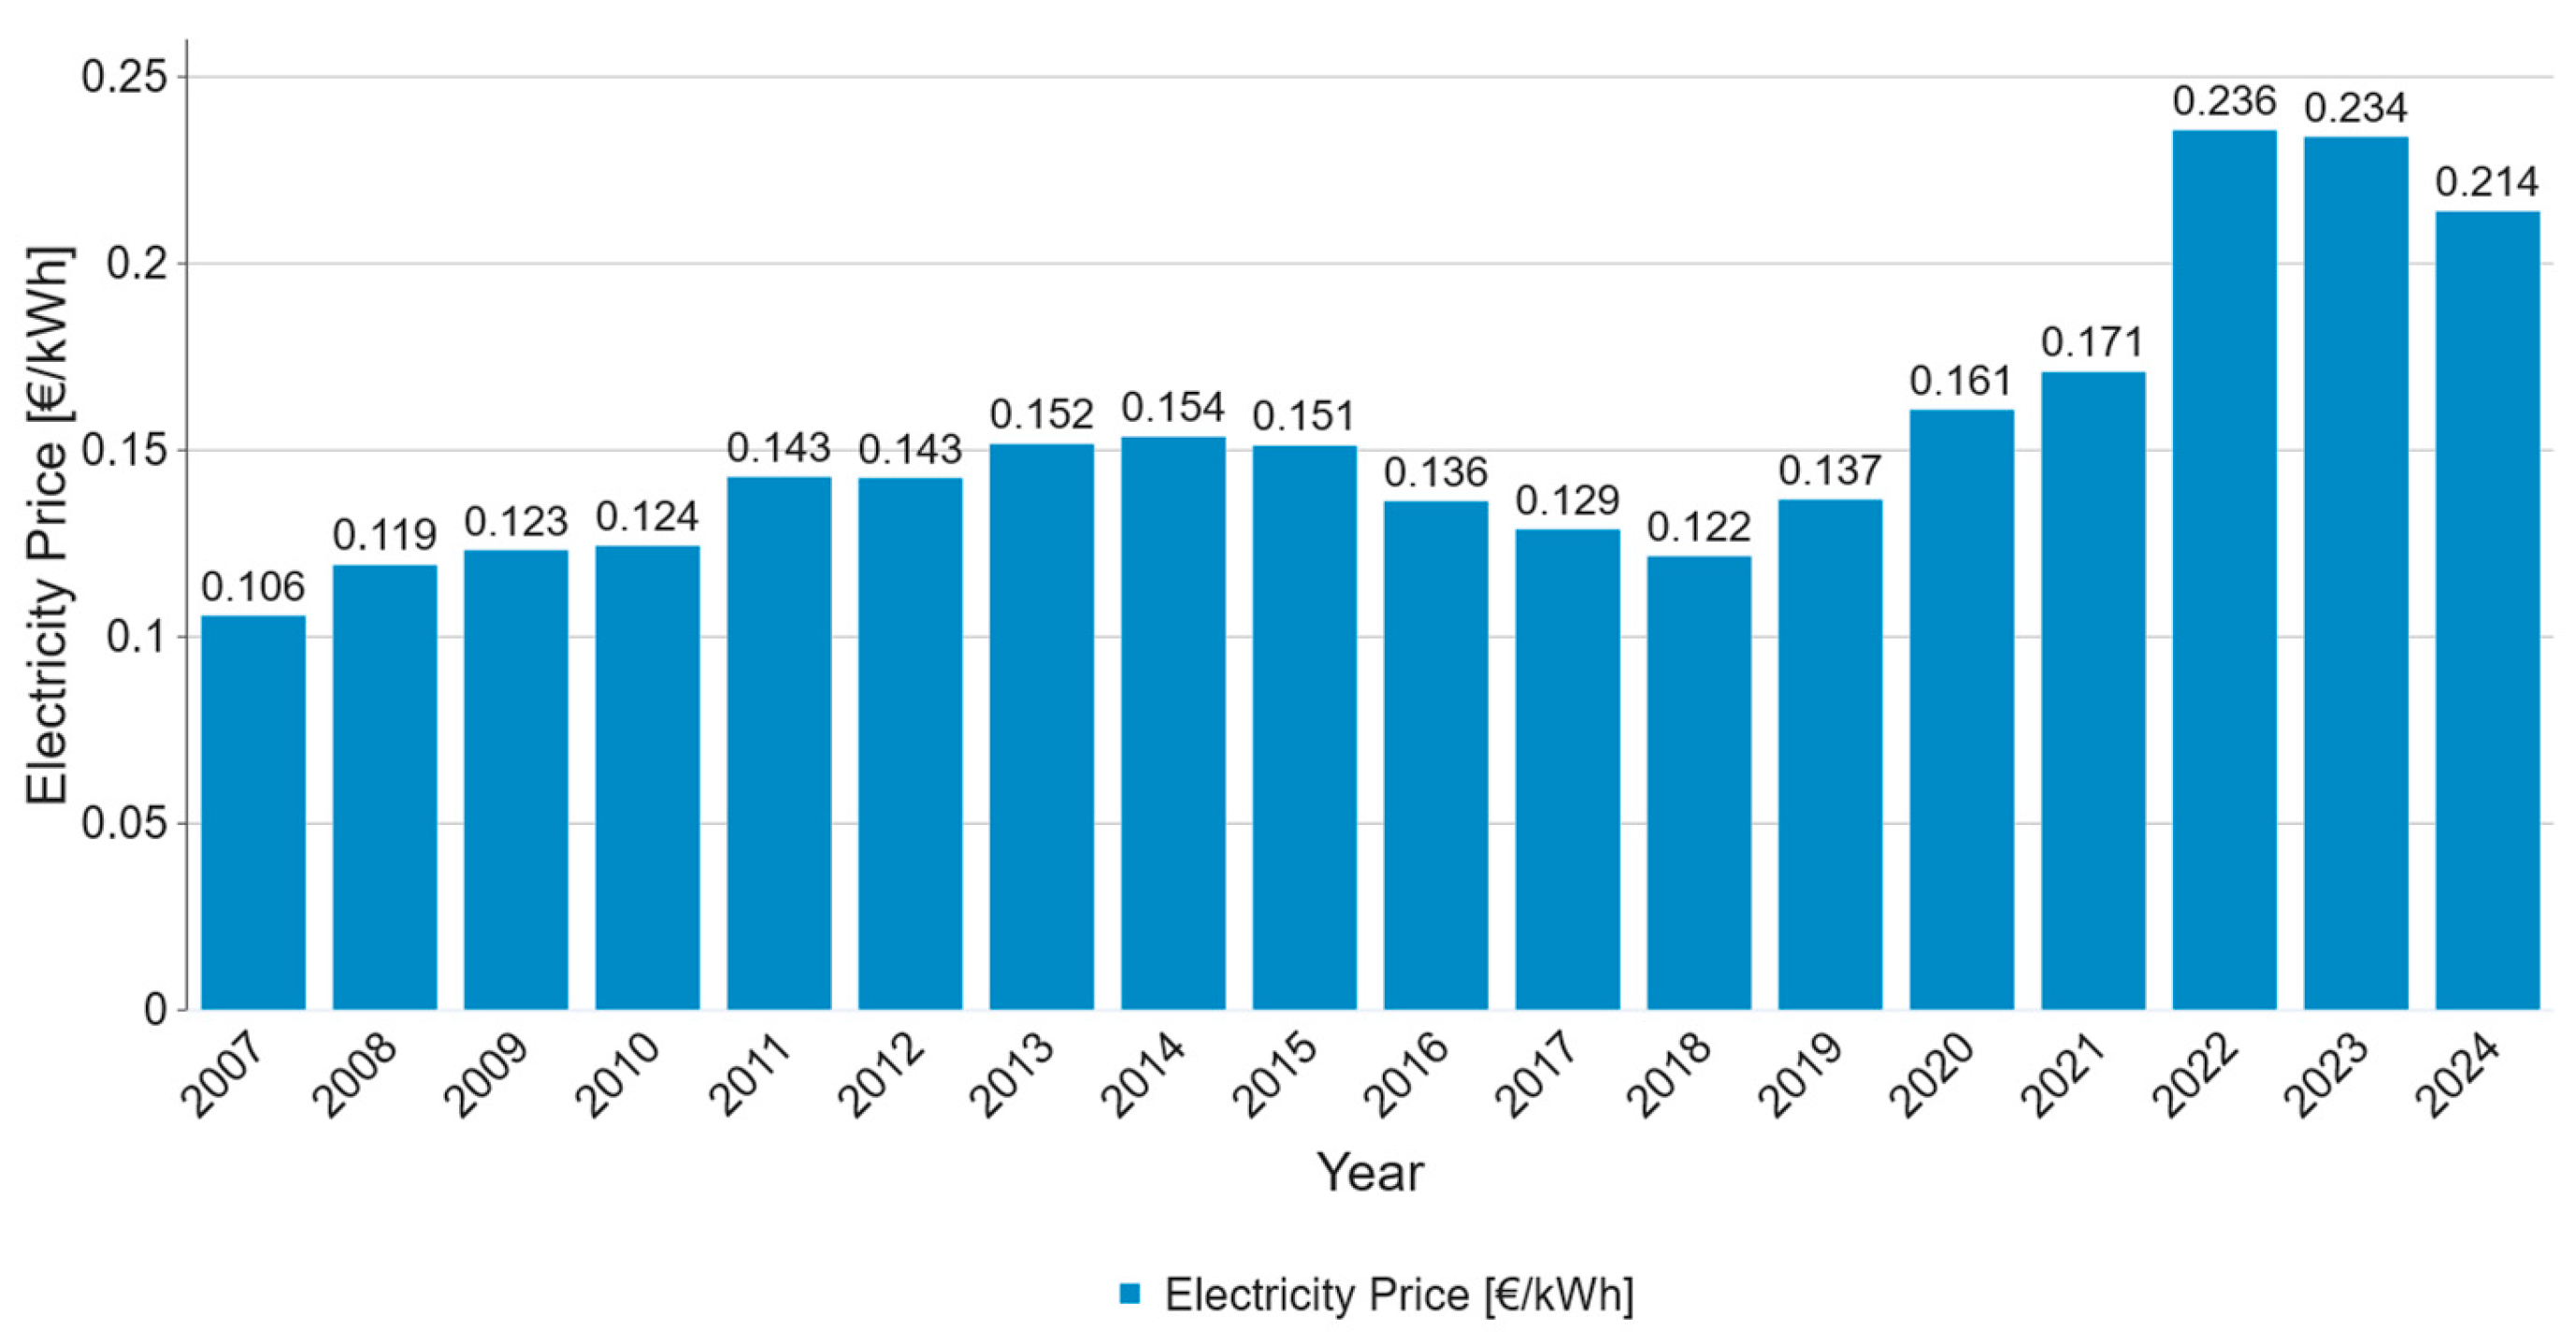
Figure 1. Historical electricity costs in €/kWh for 2007 to 2024 based on [11].
Fuels 06 00085 g001
Figure 2. Historical Gird-mix data in TWh from 1990 to 2023 using different renewable and fossil energy sources, based on [13].
Fuels 06 00085 g002
Figure 3. Environmental impact per 1 kWh of electricity from different energy sources across multiple impact categories.
Fuels 06 00085 g003
Figure 4. Environmental impacts of electricity consumption to produce 1 kg of hydrogen via AWE in Germany from 2007 to 2023: (a) with all environmental impacts and (b) without global warming potential.
Fuels 06 00085 g004
Figure 5. Historical electricity costs associated with the production of 1 kg of hydrogen in Germany (2007–2023).
Fuels 06 00085 g005
Figure 6. Electricity Price Components for Industry in Germany from 2014 to 2023, adapted from [34].
Fuels 06 00085 g006
Figure 7. Pareto optimization of grid mix scenarios (2025–2045) for cost and GWP per kg of H2.
Fuels 06 00085 g007
Figure 8. Clustered pareto-optimal grid mix scenarios (2025–2045) for cost and GWP per kg H2.
Fuels 06 00085 g008
Figure 9. Tornado plot of the normalized sensitivity index for Cost. Red bars indicate variables with a negative normalized sensitivity index, while green bars denote positive sensitivities.
Fuels 06 00085 g009
Figure 10. Tornado plot of the normalized sensitivity index for GWP. Red bars indicate variables with a negative normalized sensitivity index, while green bars denote positive sensitivities.
Fuels 06 00085 g010
Table 3. Descriptive statistics of grid mix contributions in Pareto-optimal solutions.
SourceMean (%)Std (%)Min (%)Max (%)CoV (Std/Mean)Interpretation
Biomass5.133.110.7010.430.61Varied use; contributes more in greener scenarios.
Hard Coal7.243.772.1013.640.52Phase-out trend; minimized in GWP-focused scenarios
Hydropower1.581.530.005.080.97Limited capacity expansion; variable in low GWP setups.
Lignite6.693.470.5813.320.52Similar to hard coal; reduced in greener scenarios.
Mineral Oil6.274.380.0913.010.70High variability; mostly reduced in low GWP scenarios.
Natural Gas10.996.300.9719.800.57Highly variable; used flexibly depending on trade-off strategy.
Nuclear10.704.410.9717.340.41Controlled variability; serves as a flexible baseload or transition source.
Other5.864.010.3315.700.68Catch-all category; includes flexibility levers like imports or renewables.
Solar15.531.2715.0019.460.08Slight variability, likely operating at technical or spatial capacity limits.
Wind30.000.0030.0030.000.00Fixed share across all scenarios; strong policy constraint or saturation effect.
Table 4. Distribution of Pareto-optimal scenarios across the identified clusters and their strategic insights.
ClusterCountGeneral StrategyDominant Traits
0 (Dark blue)6Balanced TransitionHigh diversification, moderate cost and GWP
1 (Purple)3GWP-MinimizationHigh renewables, high gas, low nuclear/fossils
2 (Orange)2Cost-MinimizationHigh fossil share, minimized renewables except solar/wind
3 (Yellow)5Hybrid StrategiesIntermediate between Cluster 0 and 1
Disclaimer/Publisher’s Note: The statements, opinions and data contained in all publications are solely those of the individual author(s) and contributor(s) and not of MDPI and/or the editor(s). MDPI and/or the editor(s) disclaim responsibility for any injury to people or property resulting from any ideas, methods, instructions or products referred to in the content.