1. Introduction and Background
Unconventional reservoirs, characterized by tight oil and shale formations, pose unique drilling and completion challenges primarily due to their geological complexity and narrow operational windows. These difficulties are driven by specific engineering demands related to accessing such resources, particularly the advancements in horizontal drilling and hydraulic fracturing technologies, which have evolved significantly over the past two decades [
1,
2].
One of the primary challenges in drilling unconventional reservoirs is the necessity for high-temperature and high-pressure (HPHT) capabilities. The drilling fluids employed must be thermally stable to withstand the extreme downhole conditions commonly encountered in these formations [
3,
4]. Additionally, the operational complexity involved in horizontal drilling, particularly the requirement for multiple stages of hydraulic fracturing, complicates mud weight management, bit selection, and the optimization of rate of penetration (ROP) in heterogeneous and often brittle formations [
5,
6].
The unique geological characteristics of unconventional reservoirs demand a deeper understanding of their permeability. Many of these formations exhibit extremely low permeability (often less than 0.5 mD), which restricts fluid flow and can significantly increase operational costs while lowering production rates if not properly addressed [
7,
8]. Moreover, completion strategies play a critical role in maximizing recovery efficiency. Effective exploitation of unconventional resources relies on the optimization of well spacing and employment of advanced completion technologies that maximize the contact area with the reservoir [
9,
10]. For instance, techniques such as cemented liner and open-hole multi-stage fracturing systems have become standard approaches in enhancing the fracturing network and improving hydrocarbon recovery rates [
9,
11]. While technological advancements have significantly improved recovery efficiency, they must be balanced with environmental considerations, which remain paramount in the extraction of unconventional resources. Enhanced oil recovery methods, including gas injection, CO
2 flooding, and CO
2 Huff-n-Puff, have been investigated not only for maintaining reservoir pressure but also for their potential to mitigate environmental impacts [
12,
13]. Shale anisotropy is another hurdle—horizontal and vertical rock properties differ, affecting wellbore stability and fracture growth [
14].
While various multilateral well designs, such as those classified by the Technology Advancement of Multi-Laterals (TAML) system, have been employed to increase reservoir contact, they often involve complex junction construction and completion procedures [
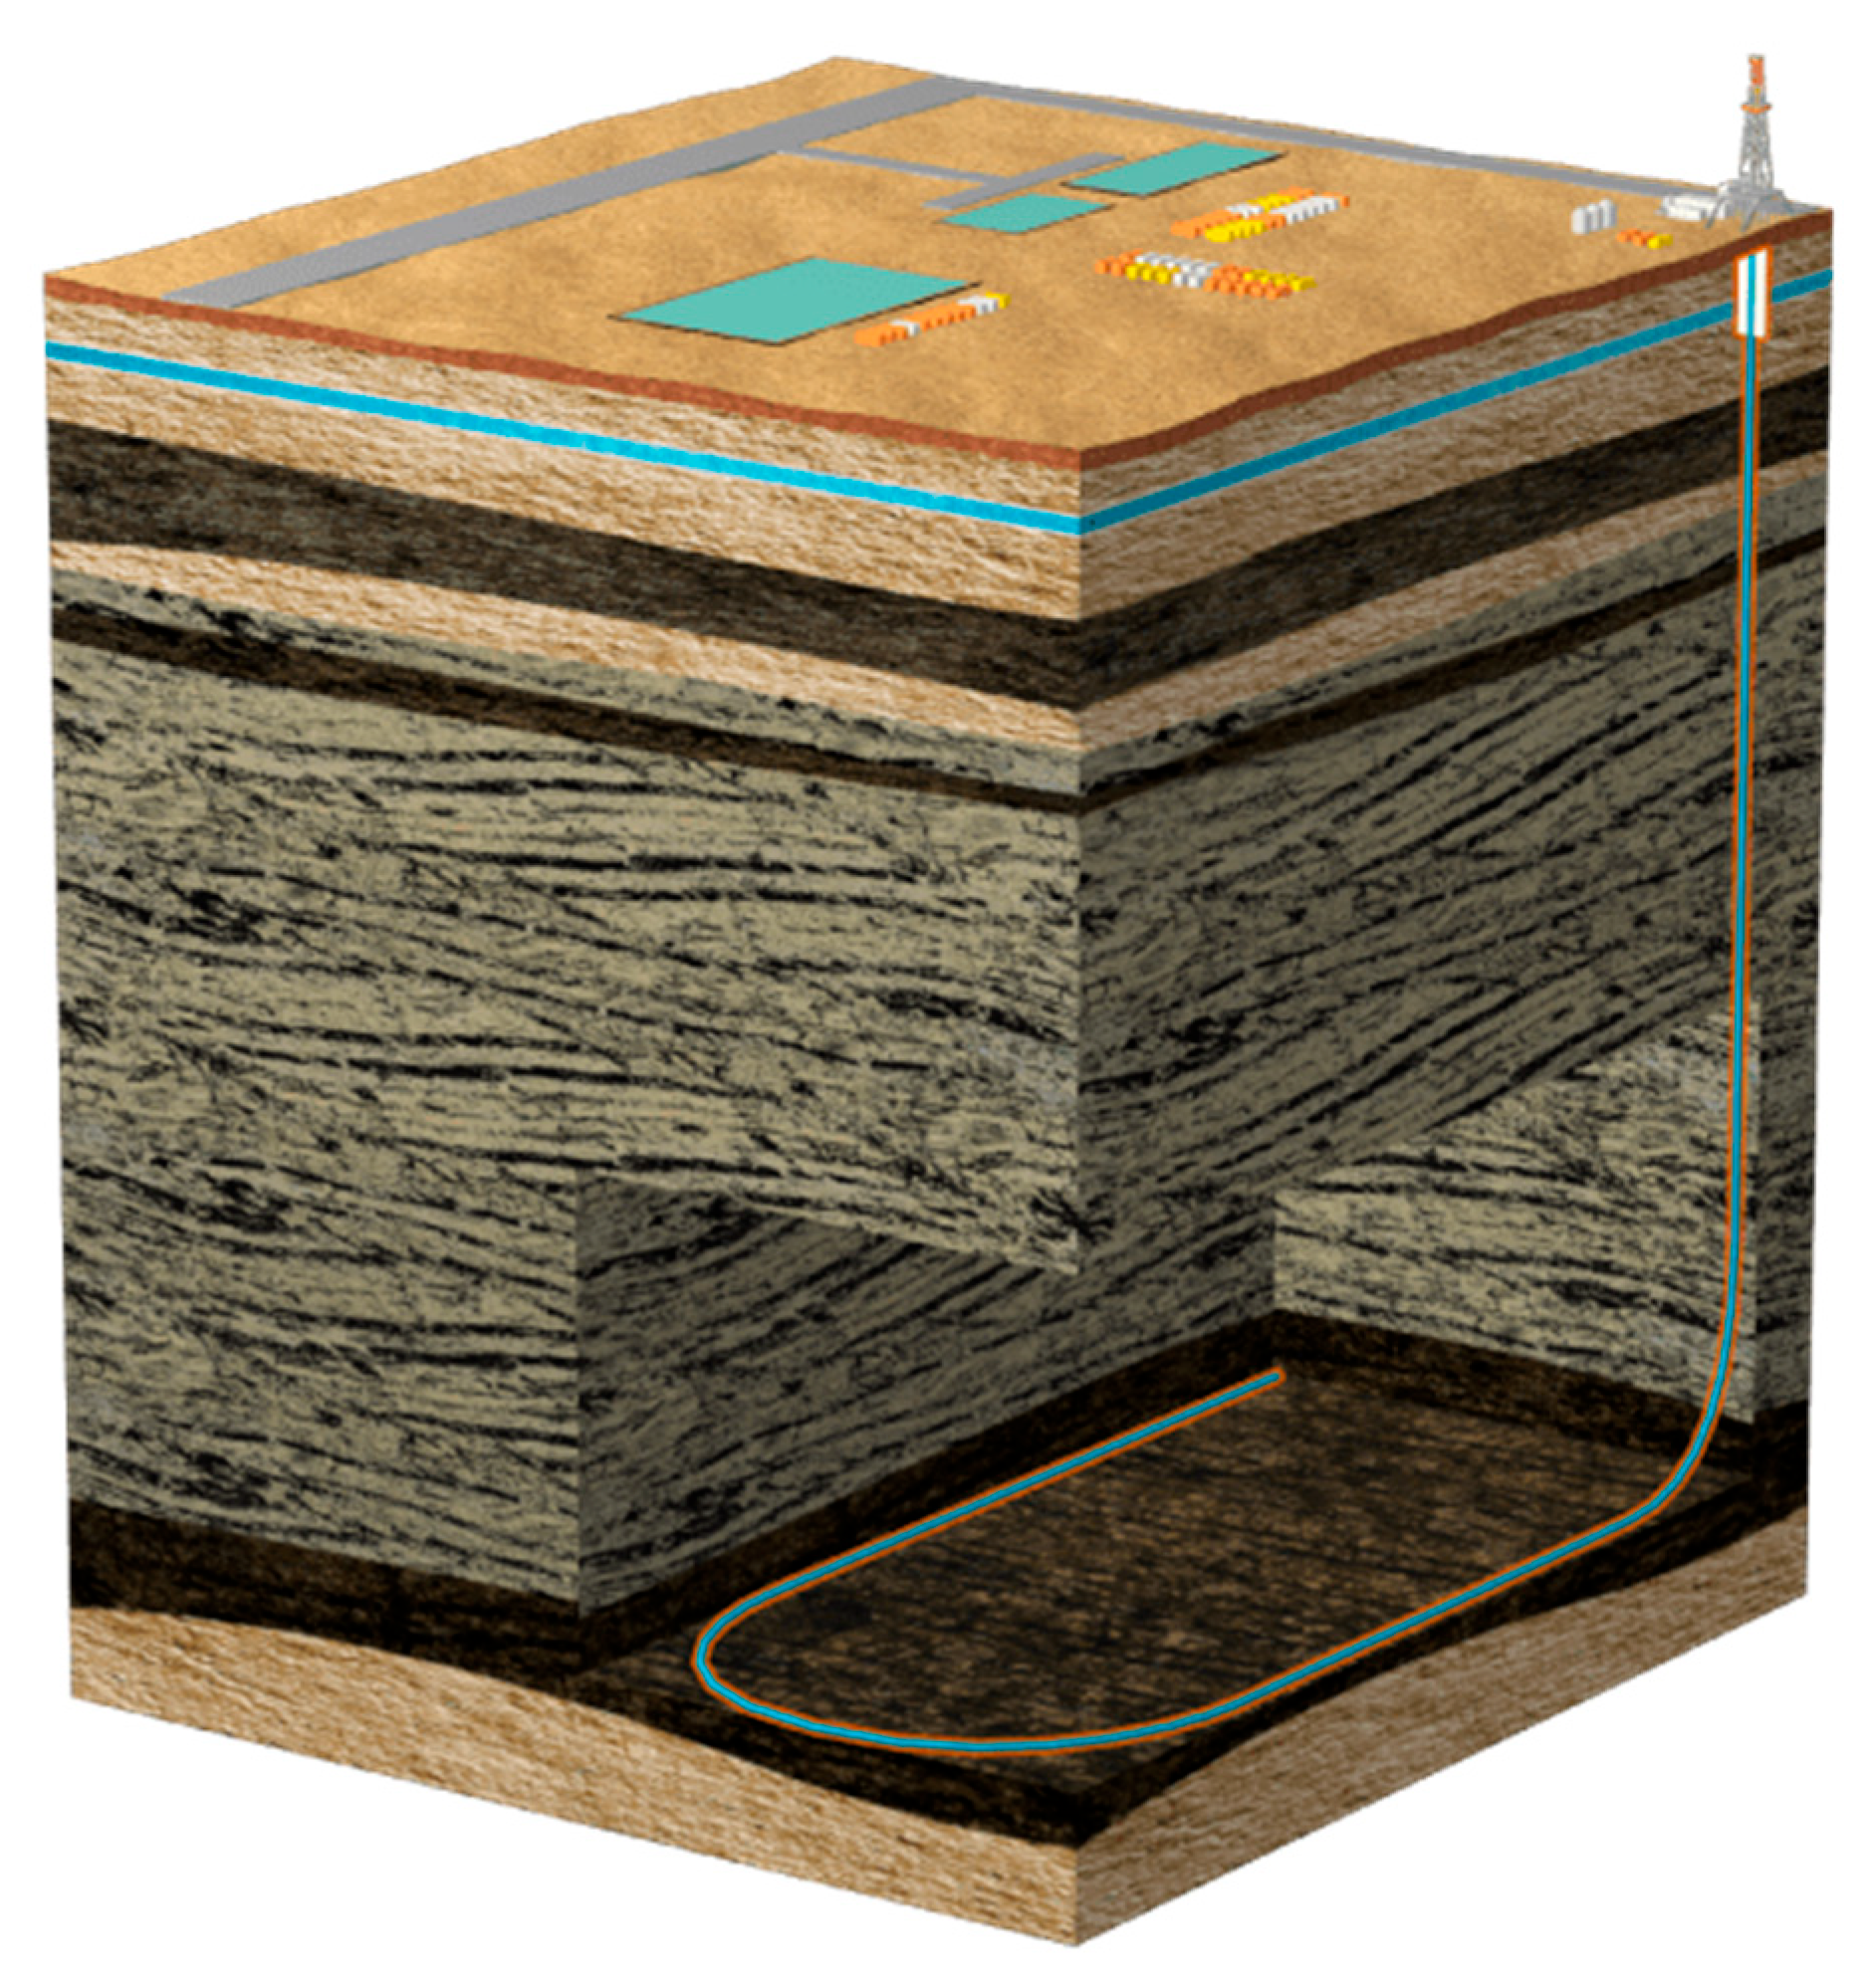
15]. These designs, which include stacked, opposed, and fishbone configurations, can be effective in conventional reservoirs but may present challenges in the unique context of unconventional plays. U-shaped wells, in contrast, offer a simplified approach by connecting two parallel laterals with a continuous 180-degree turn, eliminating the need for complex downhole junctions. This design not only reduces drilling and completion costs but also minimizes the surface footprint, a key consideration in environmentally sensitive areas. The continuous wellbore of a U-shaped well also simplifies artificial lift and intervention operations compared to many multilateral configurations.
The suitability of U-shaped wells for unconventional reservoirs stems from their ability to maximize lateral exposure in geographically constrained areas, a common challenge in mature basins. By doubling the productive length from a single wellhead, operators can more effectively drain low-permeability formations, leading to improved recovery factors and enhanced project economics. Recent studies have shown that U-shaped wells can be significantly more profitable than drilling two separate wells, with reported cost savings of up to
$3 million per well and a 27% increase in net present value per foot in certain formations [
16]. These economic advantages, coupled with the operational efficiencies and reduced environmental impact, position U-shaped wells as a compelling technology for the sustainable development of unconventional resources.
As operators seek to maximize reservoir contact and reduce surface footprint, innovative well configurations have been developed to address the limitations of traditional drilling approaches. U-shaped well technology represents an emerging approach that consolidates two conventional 1-mile lateral wells into a single wellbore with a 180-degree curved section, effectively doubling lateral length while utilizing a single vertical section [
1,
17]. This configuration eliminates the need for duplicate surface infrastructure, reduces drilling operations, and minimizes land disturbance while maintaining comparable reservoir exposure and production performance. However, comprehensive environmental assessments of this technology are limited, with most studies focusing on technical feasibility and economic performance rather than lifecycle environmental impacts.
The “U-shape” or horseshoe well design has been notably piloted by Shell in response to various challenges in drilling unconventional resources. This innovative design reflects an evolution in drilling techniques, aimed at enhancing operational efficiency by maximizing flow rates and improving the management of complex reservoir conditions. One of the primary advantages of the U-shaped well design is its ability to extend the drainage area by creating a configuration that enables fluid production from both ends of the wellbore. This configuration minimizes flow restrictions and allows for improved connectivity with the surrounding formation, as highlighted by Merzoug et al. [
18] who discusses its implementation in unconventional plays like the Bakken and Permian Basins, where lease constraints and overpressured zones complicate drilling operations.
Moreover, the adaptation of U-shaped well technologies has proven especially beneficial in environments such as coalbed methane (CBM) extraction. Zhang et al.,2013 [
19] emphasized that fundamental research on reservoir characteristics, lithology, and the specifics of drilling and completion techniques is a prerequisite for successful U-shaped well implementation. The flexibility of this design allows the integration of various completion technologies, including slotted screen completions that facilitate favorable flow paths, thereby maximizing productivity [
19]. This is further supported by the semi-analytical models developed by Qahtani et al. (2015) [
20] who demonstrate the capability of U-shaped wells in optimizing production under varying operational scenarios. Although primarily focused on CBM and oil extraction, the principles applied in U-shaped well designs also adjust well to geothermal implications, where achieving optimal flow rates is crucial. Xiao et al. (2021) [
21] highlighted the effectiveness of U-shaped structures in geothermal contexts, underscoring their potential in enhancing heat transfer efficiencies and well performance. Comparative design studies further reinforce the adaptability of U-shaped wells across diverse geological and operational environments.
The development of U-shaped well technology can be traced through distinct phases of technological evolution, each driven by specific reservoir challenges and operational requirements. The foundational horizontal drilling technologies that enabled U-shaped wells achieved commercial viability in the late 1980s, with the 1990s becoming known as ‘the decade of the horizontal well’ due to significant advancements in directional drilling control technology [
22].
The earliest applications of U-shaped well concepts emerged in the early 2000s within China’s coalbed methane (CBM) sector, where researchers recognized the potential of connecting horizontal wells to enhance gas recovery from low-permeability coal seams [
23]. By 2013, systematic research on U-shaped well technology for CBM stimulation was being conducted in China’s Qinshui Basin, with studies demonstrating the integration of horizontal well technology, cave building technology, and advanced completion methods [
19]. These early CBM applications established the fundamental principles of U-shaped well design, including optimized drilling and completion schemes that would later inform unconventional oil and gas applications [
24].
The transition to modern unconventional oil and gas applications began in 2019 when Shell pioneered the first commercial U-shaped well in the Delaware Basin of the Permian, driven by the need to overcome drilling challenges and lease constraints [
25]. This milestone marked the beginning of rapid technological adoption, with Chesapeake Energy following in 2020 with the second modern U-lateral in the Eagle Ford Basin [
26]. The technology’s commercial viability was further validated through Shell’s patent application in 2019, which was granted in April 2021, establishing intellectual property protection for key aspects of U-shaped well drilling methodology [
27]. Since 2021, the technology has experienced accelerated adoption across multiple North American shale basins, with operators such as PDC Energy, Matador Resources, and Comstock Resources implementing U-shaped wells to improve project economics and overcome operational constraints [
28].
The approach was first implemented in the Permian (Delaware Basin) on Shell’s Neelie #4H well. By drilling the first lateral (around 5000 ft), executing a U-turn, and drilling a second (around 5000-ft) lateral back parallel to the first, Shell effectively doubled the reservoir exposure within the same lease [
25]. This innovation enabled extended lateral reach up to 10,000–12,000 ft within a single 1-mile
2 lease where only a 5000-ft lateral would normally fit. The horseshoe configuration thereby maximizes footage in lease-constrained areas without needing an offset well. Notably, Shell’s pilot saved ~25% in rig time and ~20% in total drilling cost compared to drilling two separate wells, since one vertical section was eliminated [
25]. It also required only one set of completion operations, further cutting costs [
25]. Following Shell’s success, other operators began adopting U-turn laterals in various shale plays from 2020 onward.
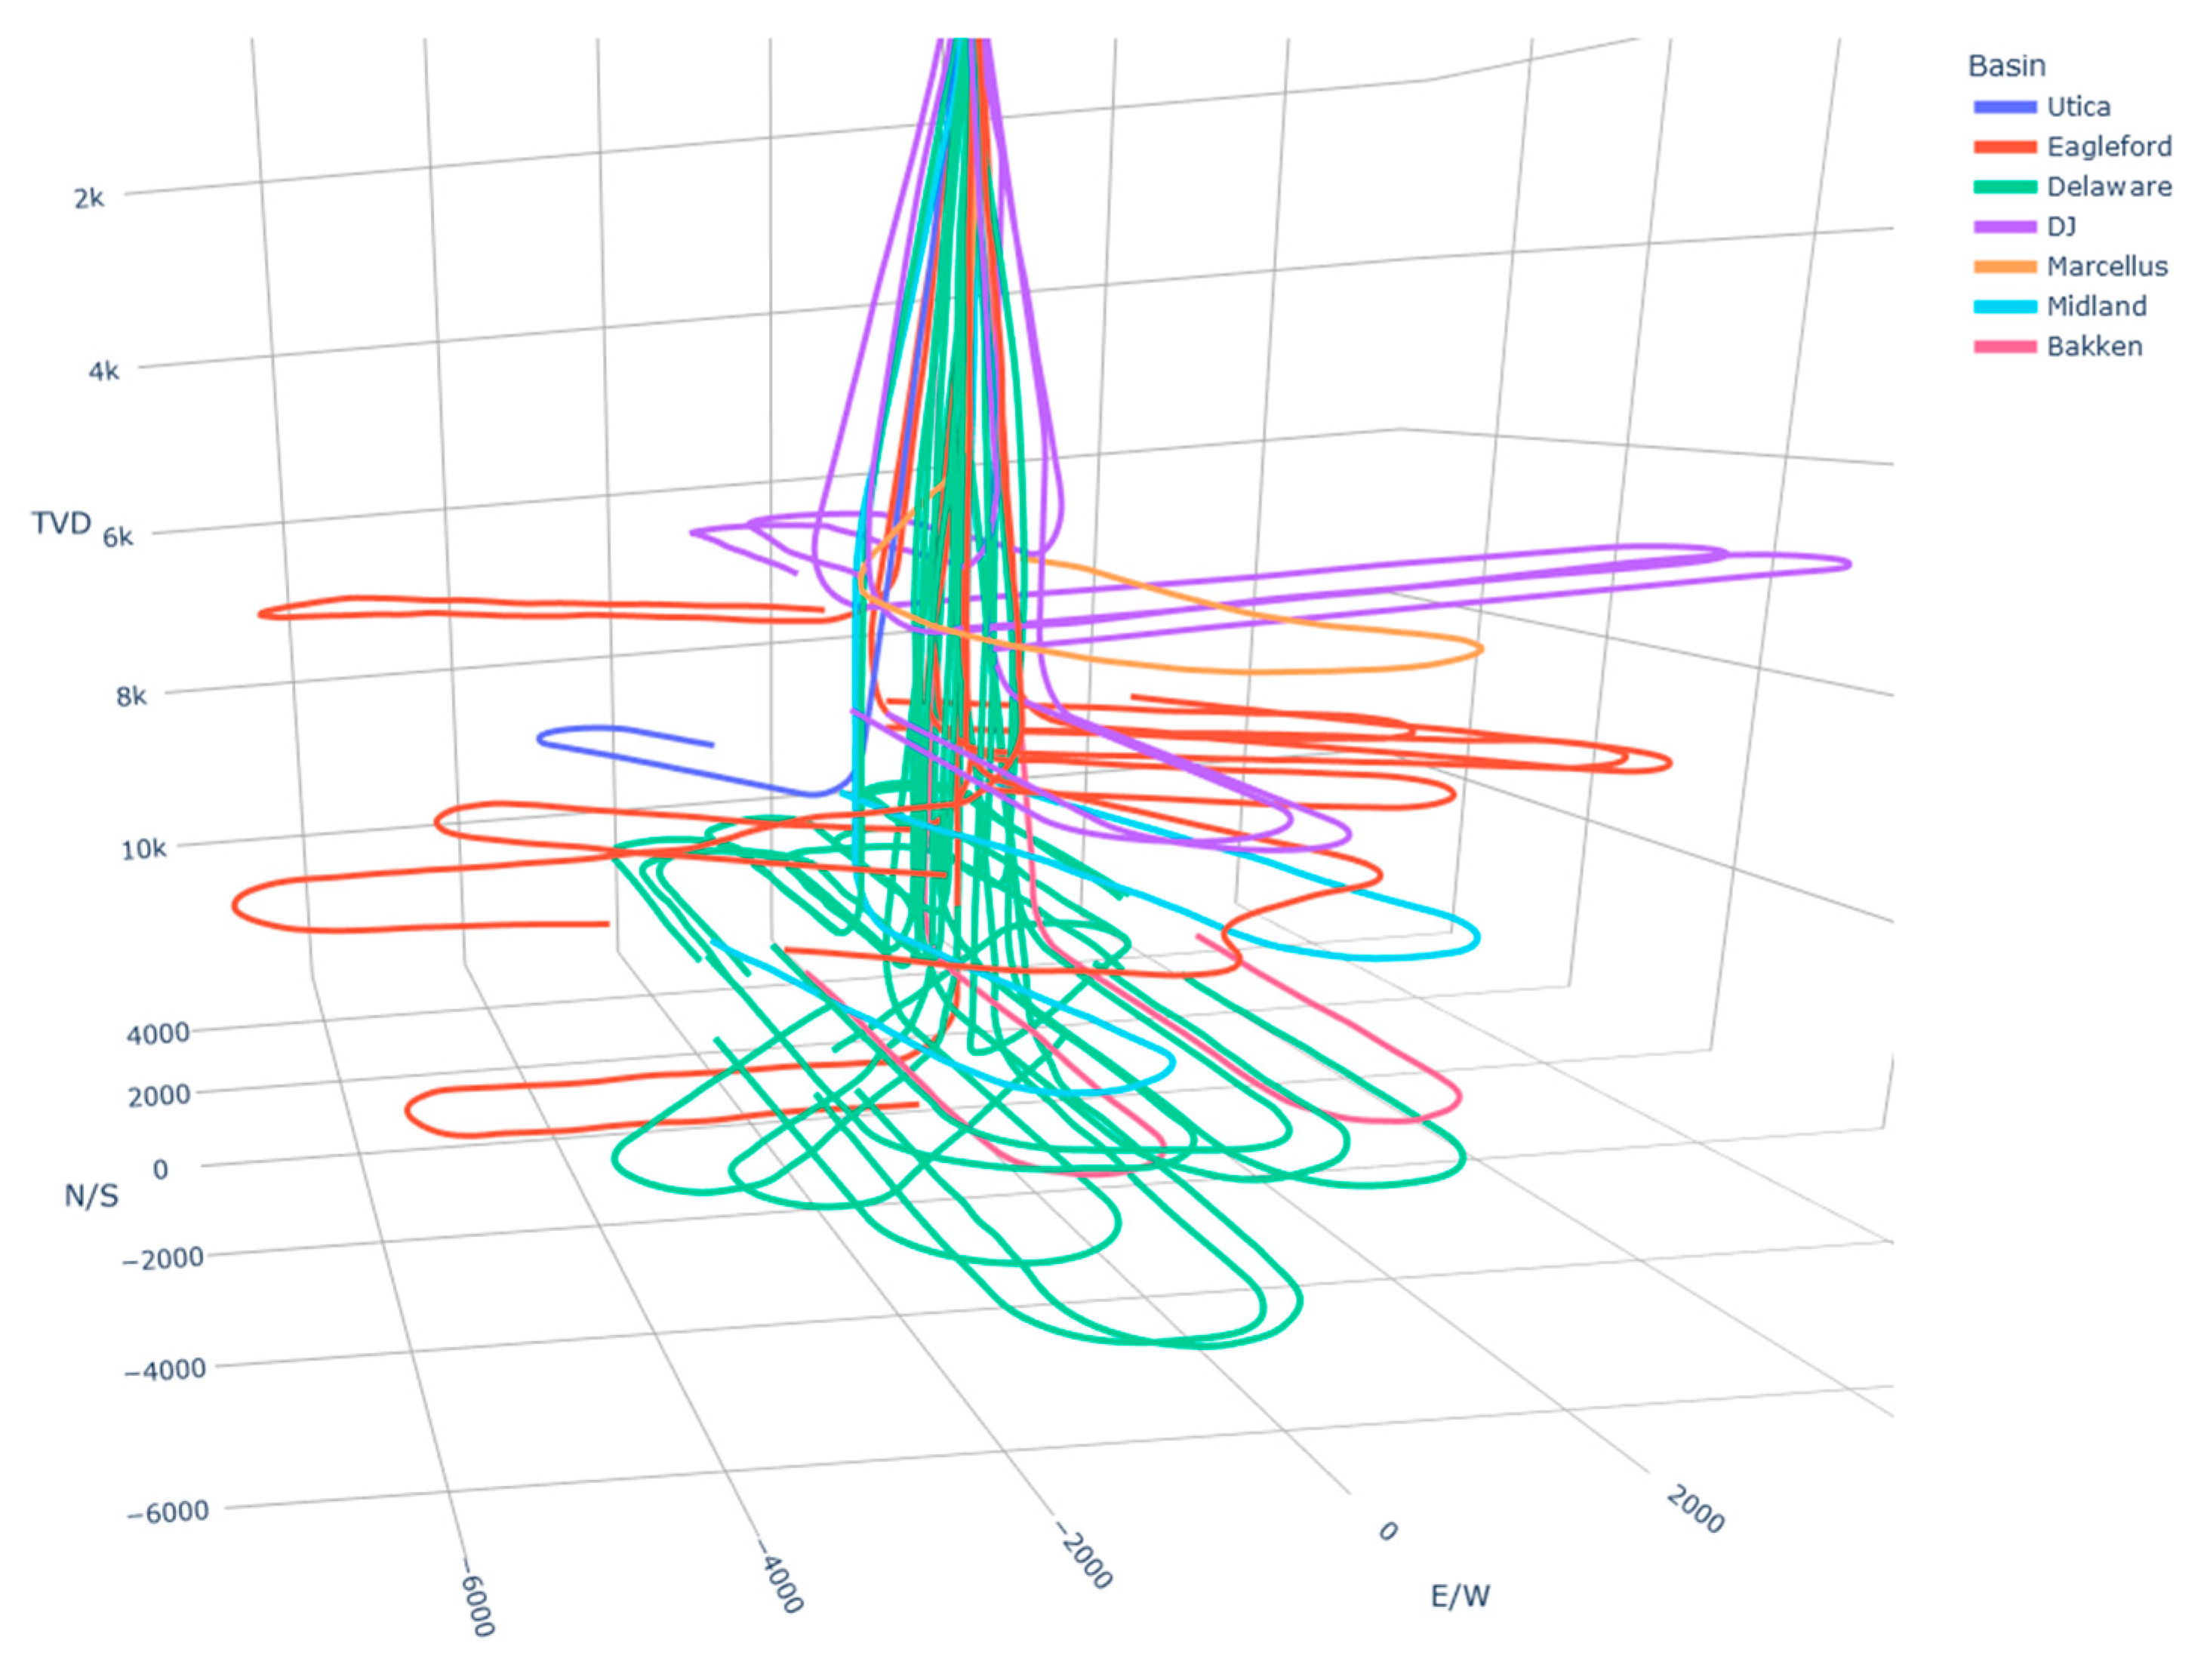
Figure 1 highlights the diversity of U-shaped lateral designs across different basins. Note how deeper formations (e.g., Midland, Bakken) require tighter curve radii to remain within the target zone, whereas shallower plays (e.g., Marcellus, Utica) exhibit more gradual bends. Such spatial patterns underscore the importance of adapting curve geometry to basin-specific stress regimes and structural dips when planning U-turn laterals.
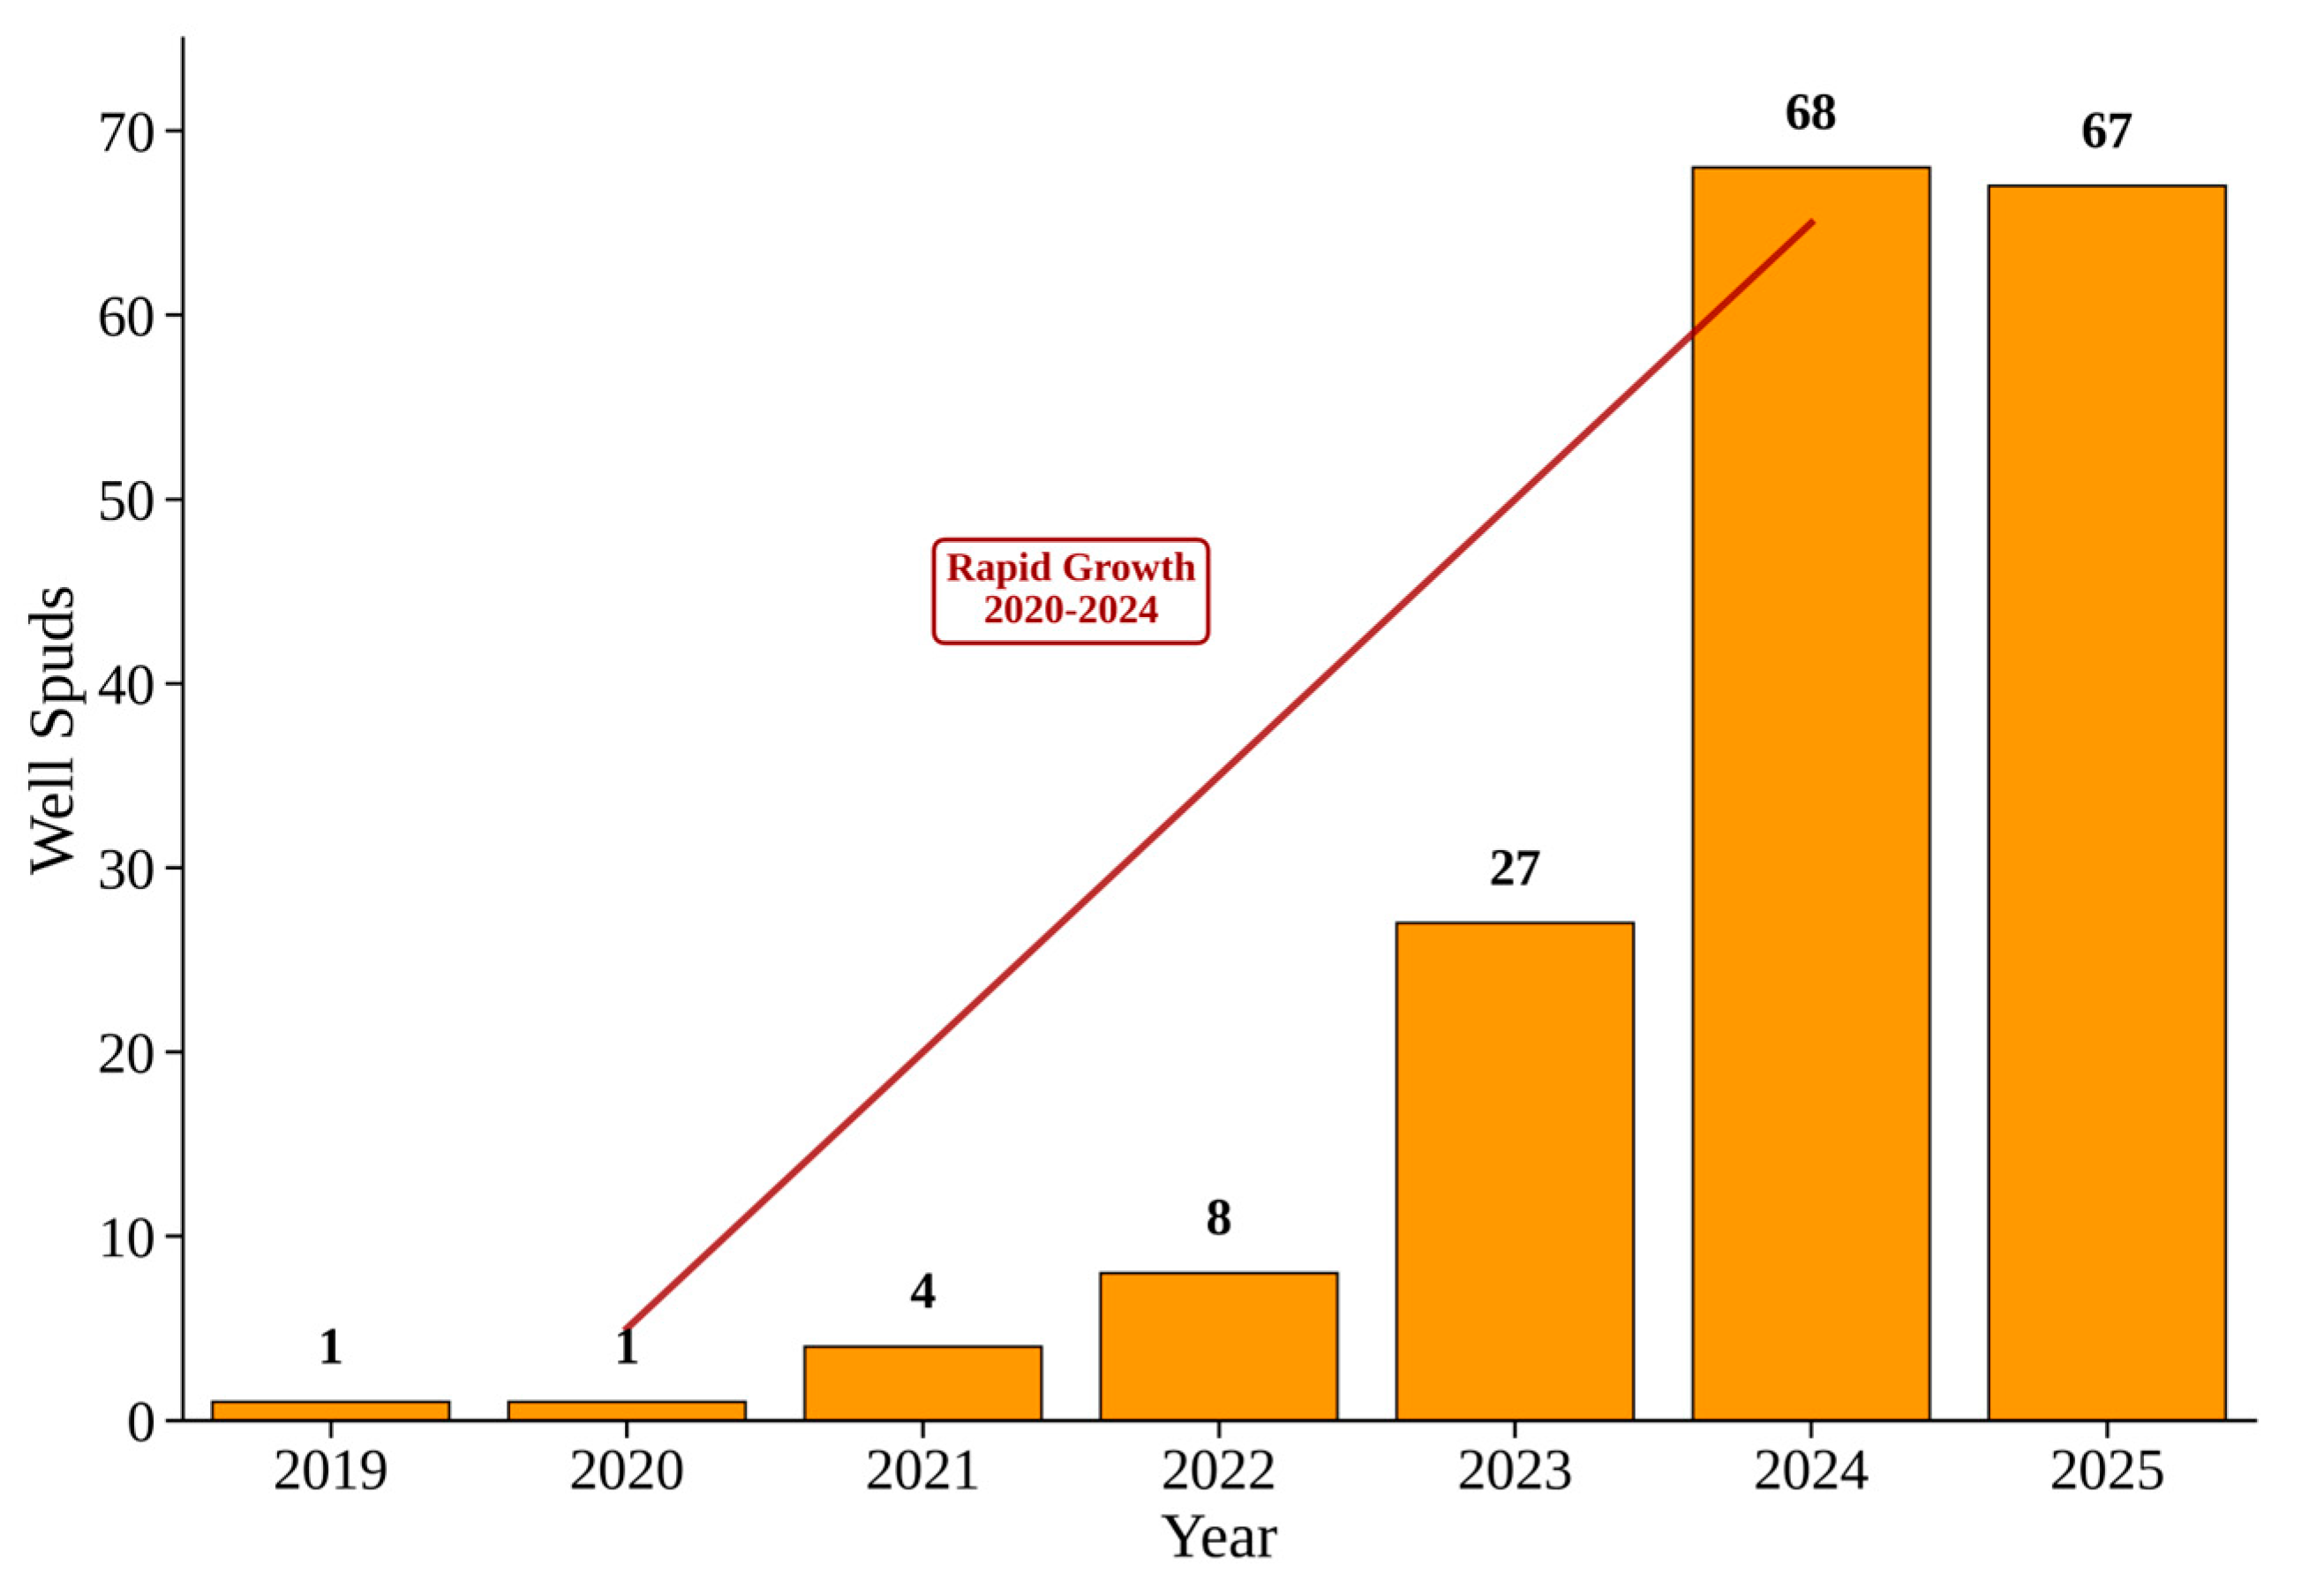
Figure 2 illustrates a bar chart of the number of U-shaped lateral wells spudded each year, illustrating the rapid ramp-up from 1 well in 2019 to nearly 70 wells by 2024–2025. Beginning with pilot projects in 2019–2020, U-turn laterals remained niche until mid-decade. In 2021–2022, early adopters demonstrated the economic and operational benefits, driving a fourfold increase in spuds. By 2023, growing confidence in drilling and completion practices propelled activity to nearly 30 wells, followed by an explosive surge to almost 70 wells in both 2024 and 2025.
Oil and gas companies across the United States are increasingly adopting “horseshoe” or U-shaped wells as a cost-efficient solution for accessing reserves within existing lease acreage. This innovative technique involves drilling a long, U-shaped horizontal lateral, which proves more cost-effective than drilling two separate, shorter straight wells. The adoption of this method is accelerating, with over half of the 70-plus horseshoe wells drilled, to date, being completed in the first nine months of 2024 alone.
Table 1 highlights the pioneering operators and their key U-lateral wells across major North American shale plays.
2. U-Shape Drilling Technology and Performance
The successful implementation of U-shaped wells requires overcoming several unique technical challenges that distinguish them from conventional horizontal drilling. These challenges have driven significant technological innovations in drilling engineering, wellbore stability management, and completion design that enable the economic benefits demonstrated by recent field applications.
Wellbore Stability and 180° Steering Solutions: The most critical technical challenge in U-shaped well construction is maintaining wellbore stability while executing the 180-degree azimuthal turn. This maneuver requires the wellbore to traverse through both minimum and maximum horizontal stress directions, creating complex geomechanical conditions that can lead to wellbore instability, hole collapse, or differential sticking [
30]. Advanced uncertainty analysis methods have been developed specifically for the intersecting process of U-shaped horizontal wells, incorporating probabilistic approaches to quantify drilling risks and optimize trajectory planning [
31]. The solution involves advanced rotary steerable systems (RSS) specifically adapted for U-turn applications, incorporating enhanced torque-and-drag management capabilities with real-time downhole measurements to continuously adjust drilling parameters throughout the turn section [
30]. Geomechanical modeling using 3D finite element analysis predicts stress concentrations and optimizes mud weight programs, while specialized drilling fluids with enhanced lubricity additives and wellbore-strengthening materials maintain stability in the narrow mud weight window during the turn [
32].
Drill String Fatigue Management: The 180-degree turn subjects the drill string to extreme bending stresses and cyclic loading, significantly increasing fatigue risk compared to conventional horizontal wells. Advanced drill string design incorporates fatigue-resistant materials and optimized tool joint configurations specifically engineered for high-curvature applications, while enhanced torque-and-drag modeling software accounts for the complex geometry to minimize fatigue accumulation during drilling operations [
33]. Extended-reach drilling campaigns have demonstrated successful completion of record multilateral wells using advanced drilling technologies and real-time monitoring systems that enable the precise control of drilling parameters throughout complex wellbore geometries [
34].
Long-Distance Fluid and Proppant Transport: The extended wellbore length and complex geometry present significant challenges for hydraulic fracturing operations, requiring fluid and proppant transport through the 180-degree turn and along extended lateral sections. Enhanced fracturing fluid systems with improved proppant-carrying capacity and reduced friction characteristics incorporate advanced friction reducers and proppant transport aids that maintain suspension properties throughout the extended wellbore system. Specialized proppant designs, including ultra-lightweight and coated proppants, improve transport efficiency around the U-turn section, while high-performance dissolvable plugs withstand increased pressure differentials and mechanical stresses [
35]. Real-time fracturing monitoring systems provide continuous feedback on proppant placement and fracture development, enabling immediate adjustment of pumping parameters to optimize treatment effectiveness throughout the entire wellbore system [
36].
Completion and Intervention Innovations: The complex geometry requires specialized completion and intervention technologies to ensure long-term production optimization. Advanced completion designs incorporate intelligent well technology with distributed sensing systems for real-time monitoring along both lateral sections [
37]. Successful intervention operations in U-shaped wells have been demonstrated through careful operational planning and specialized equipment deployment, with field applications showing effective plug milling and wellbore access throughout the complex geometry [
28]. Enhanced coiled tubing intervention capabilities utilize specialized bottom-hole assemblies and advanced tractor systems to navigate the 180-degree turn while maintaining tool functionality [
19]. Completion design and implementation in challenging high-pressure, high-temperature wells have evolved to address the unique requirements of complex well geometries, incorporating advanced tubular design, stress analysis, and specialized completion fluids [
37].
Production Performance Analysis: Production data analysis of U-shaped wells requires specialized techniques to account for the complex flow patterns and reservoir drainage characteristics. Pressure transient analysis methods have been adapted for horseshoe-shaped well configurations, incorporating dual-lateral flow models and interference effects between parallel wellbore sections [
38]. These analytical approaches enable accurate reservoir characterization and production forecasting for U-shaped well systems, supporting optimization of completion design and operational parameters.
Re-entry and Revitalization Applications: U-shaped re-entry drilling has emerged as an effective technique for revitalizing depleted reservoirs, particularly in offshore environments where new well drilling costs are prohibitive [
39]. These applications demonstrate the versatility of U-shaped well technology beyond initial drilling, extending to field redevelopment and enhanced recovery operations. The technique involves drilling the entire well with mud motors and specialized directional drilling equipment, enabling access to previously uncontacted reservoir sections while utilizing existing infrastructure.
These technological innovations have transformed U-shaped wells from a conceptual drilling technique into a proven technology for maximizing reservoir contact in constrained lease environments. The integration of advanced drilling systems, specialized completion technologies, and sophisticated monitoring capabilities enables successful execution of complex U-shaped well projects across diverse geological and operational conditions.
The U-shape (horseshoe) drilling technique introduces unique considerations for well completion and stimulation. Functionally, a horseshoe well operates like two parallel horizontal well systems connected at the toe, forming a continuous single wellbore system. Each lateral leg is typically completed with multi-stage hydraulic fracturing, similar to a normal horizontal well. Key technical aspects that influence U-shaped well performance include fracture geometry, proppant transport around the bend, stress interference, and the decision to stimulate the 180° turn segment (full vs. partial “U” stimulation).
Fracture Geometry and Stress Shadowing: When the two lateral sections are parallel and closely spaced, their fracture networks may interact and interfere with one another. Hydraulic fractures from one lateral create stress shadow zones that may impede or divert fracture propagation from the adjacent lateral if spacing is insufficient. To mitigate this, operators design an adequate offset between the two laterals. For example, Shell spaced the two legs of its horseshoe well about 1300 ft apart, which is similar to spacing separate horizontal wells on a pad. Each lateral was fractured with the same number of clusters as a standalone well, and the U-turn section was left unperforated, serving only as a connection [
25]. These choices minimize fracture–fracture interference, effectively treating the laterals as independent parallel wells. Field results confirmed minimal hydraulic communication between the two arms and even allowed Shell to plan an infill well in between the U-shaped legs [
25]. In cases where laterals are closer, careful fracture sequencing can help mitigate interference (e.g., alternating stage order between legs or allowing time for stress dissipation).
To evaluate the hydraulic fracturing performance and proppant distribution in U-shaped wells, numerical simulations were conducted using ResFrac, a physics-based hydraulic fracturing and reservoir simulator that models multiphase fluid flow, proppant transport, and geomechanical effects. The simulation model incorporated a representative U-shaped wellbore geometry with two parallel 5000-ft laterals connected by a 180-degree turn, consistent with the Shell Neelie #4H well configuration.
The model setup utilized a structured grid with refined mesh spacing of 25 ft near the wellbore and fracture surfaces, expanding to 100 ft in the far-field regions. Reservoir properties representative of the Wolfcamp formation were employed, including a formation porosity of 0.10, a matrix permeability of 0.5 mD, an initial reservoir pressure of 6500 psi, and a formation temperature of 250 °F. Rock mechanical properties included a Young’s modulus of 4.5 MMpsi, a Poisson’s ratio of 0.22, and a minimum horizontal stress gradient of 0.75 psi/ft, with maximum horizontal stress oriented perpendicular to the lateral directions.
The fracturing treatment simulation modeled a slickwater fluid system with viscosity of 15 cp and density of 8.8 ppg, pumped at rates of 60 bbl/min per perforation cluster. Proppant placement utilized 40/70 mesh sand at concentrations ranging from 0.5 to 2.5 ppg throughout the treatment schedule. Perforation clusters were spaced at 50-ft intervals along both laterals, with 15 fracture stages per lateral, totaling to 30 stages for the complete U-shaped well.
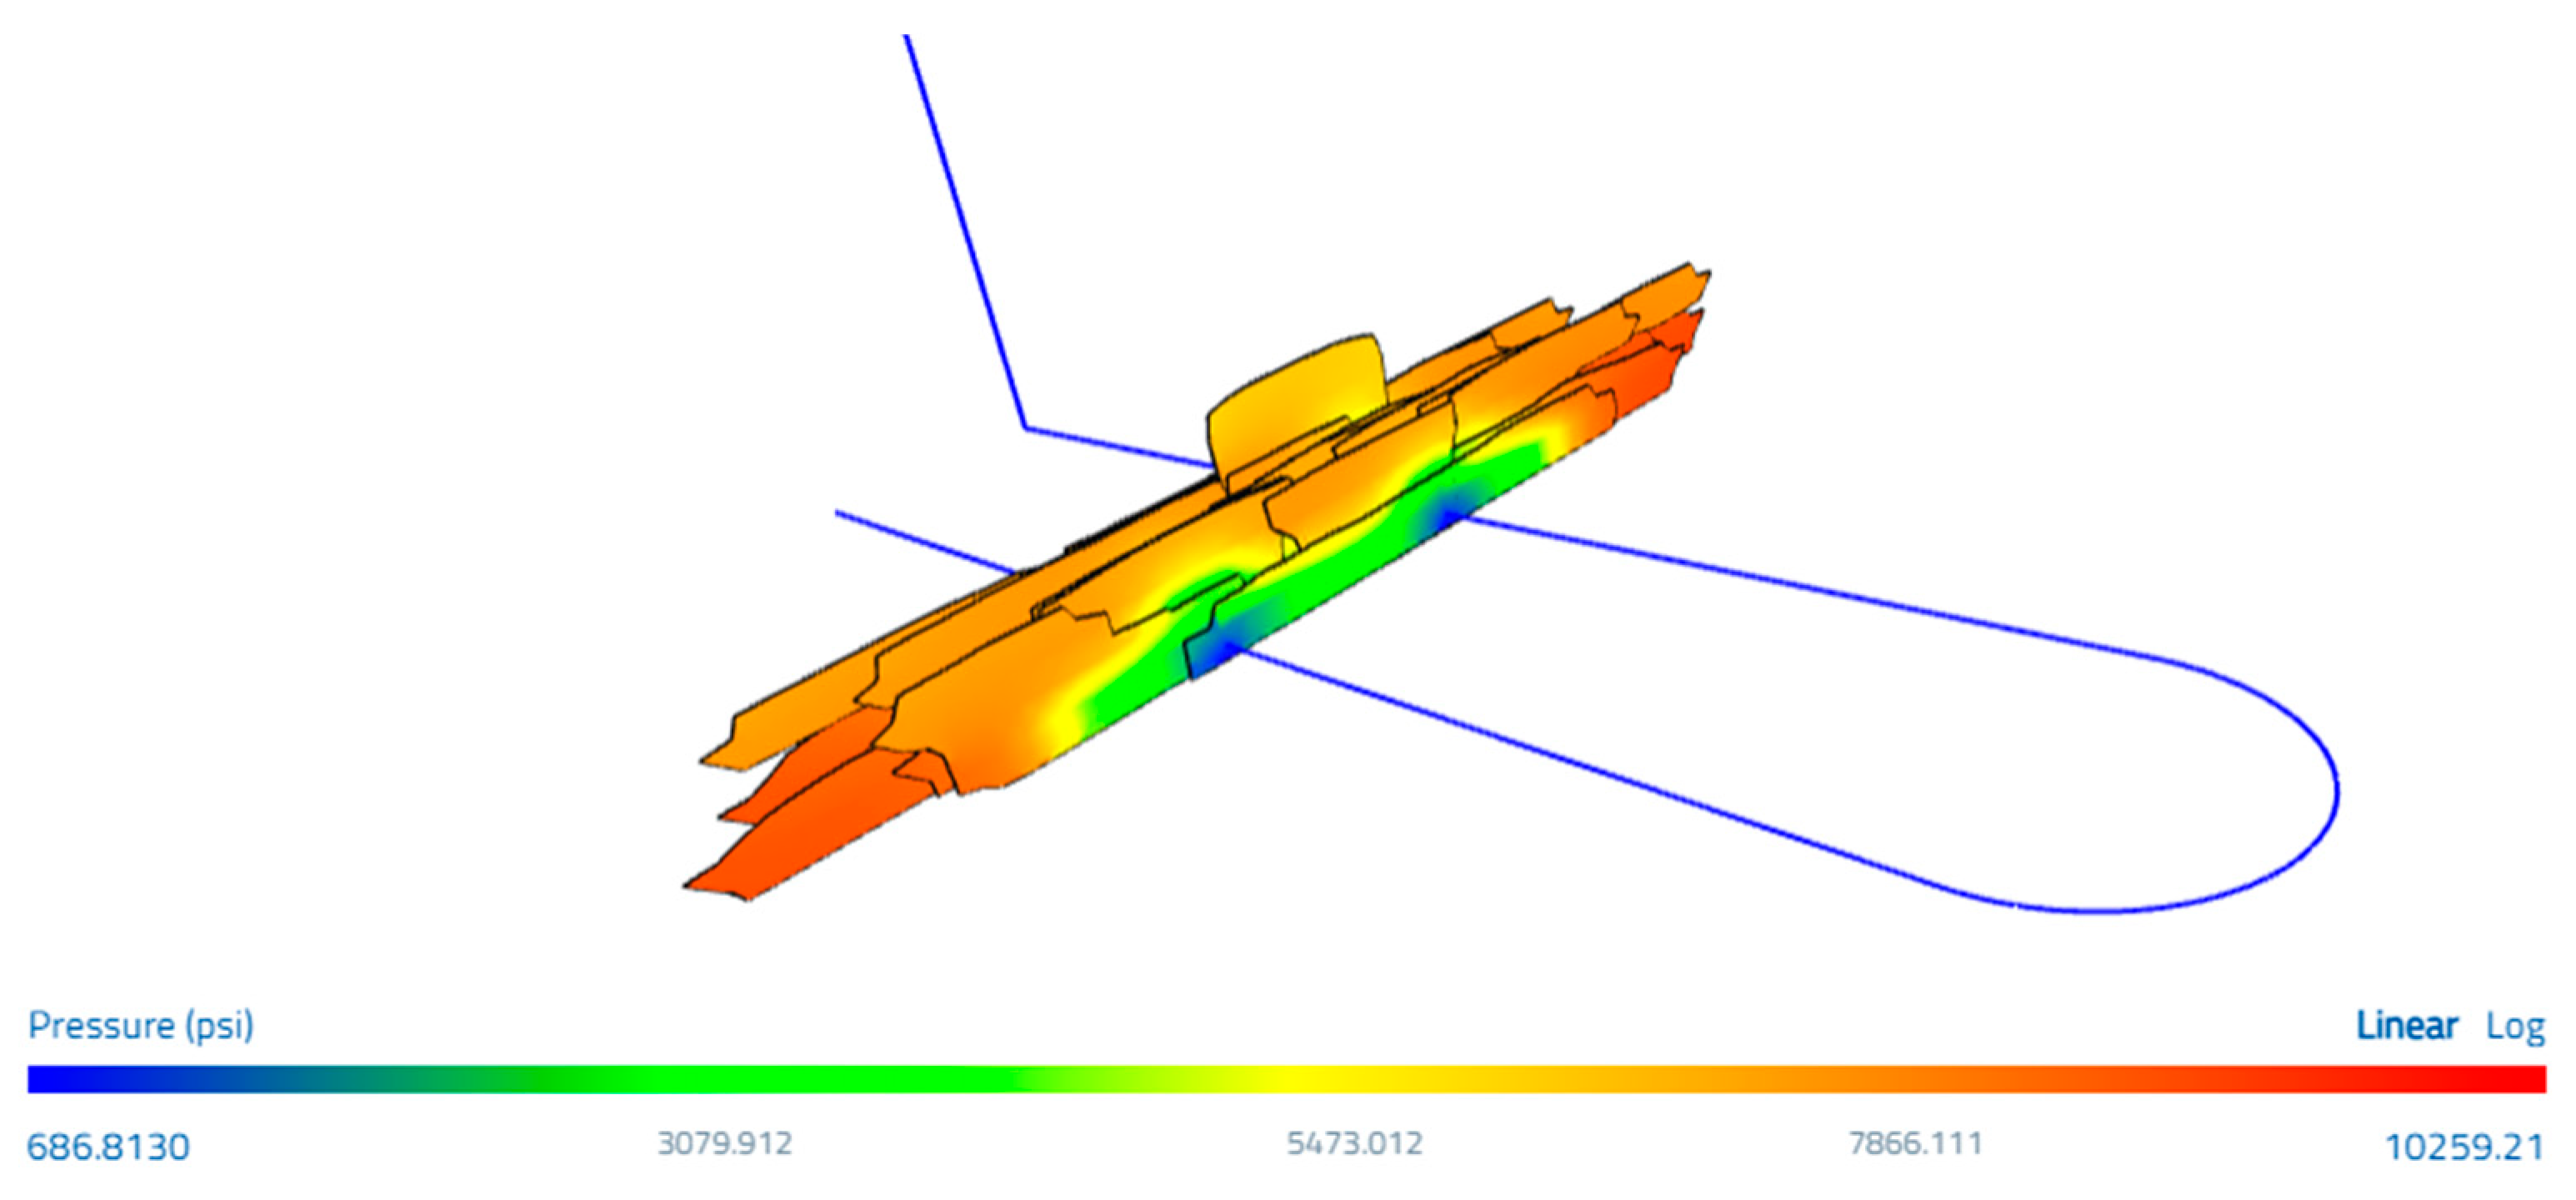
Model validation was performed through comparison with field pressure measurements and production performance data from analogous wells in the Delaware Basin. The simulation results demonstrated good agreement with the observed bottom-hole pressures during fracturing operations, with calculated values falling within 8% of measured data. Sensitivity analysis on key parameters including stress contrast, fluid viscosity, and proppant concentration confirmed the robustness of the simulation results. The pressure map in
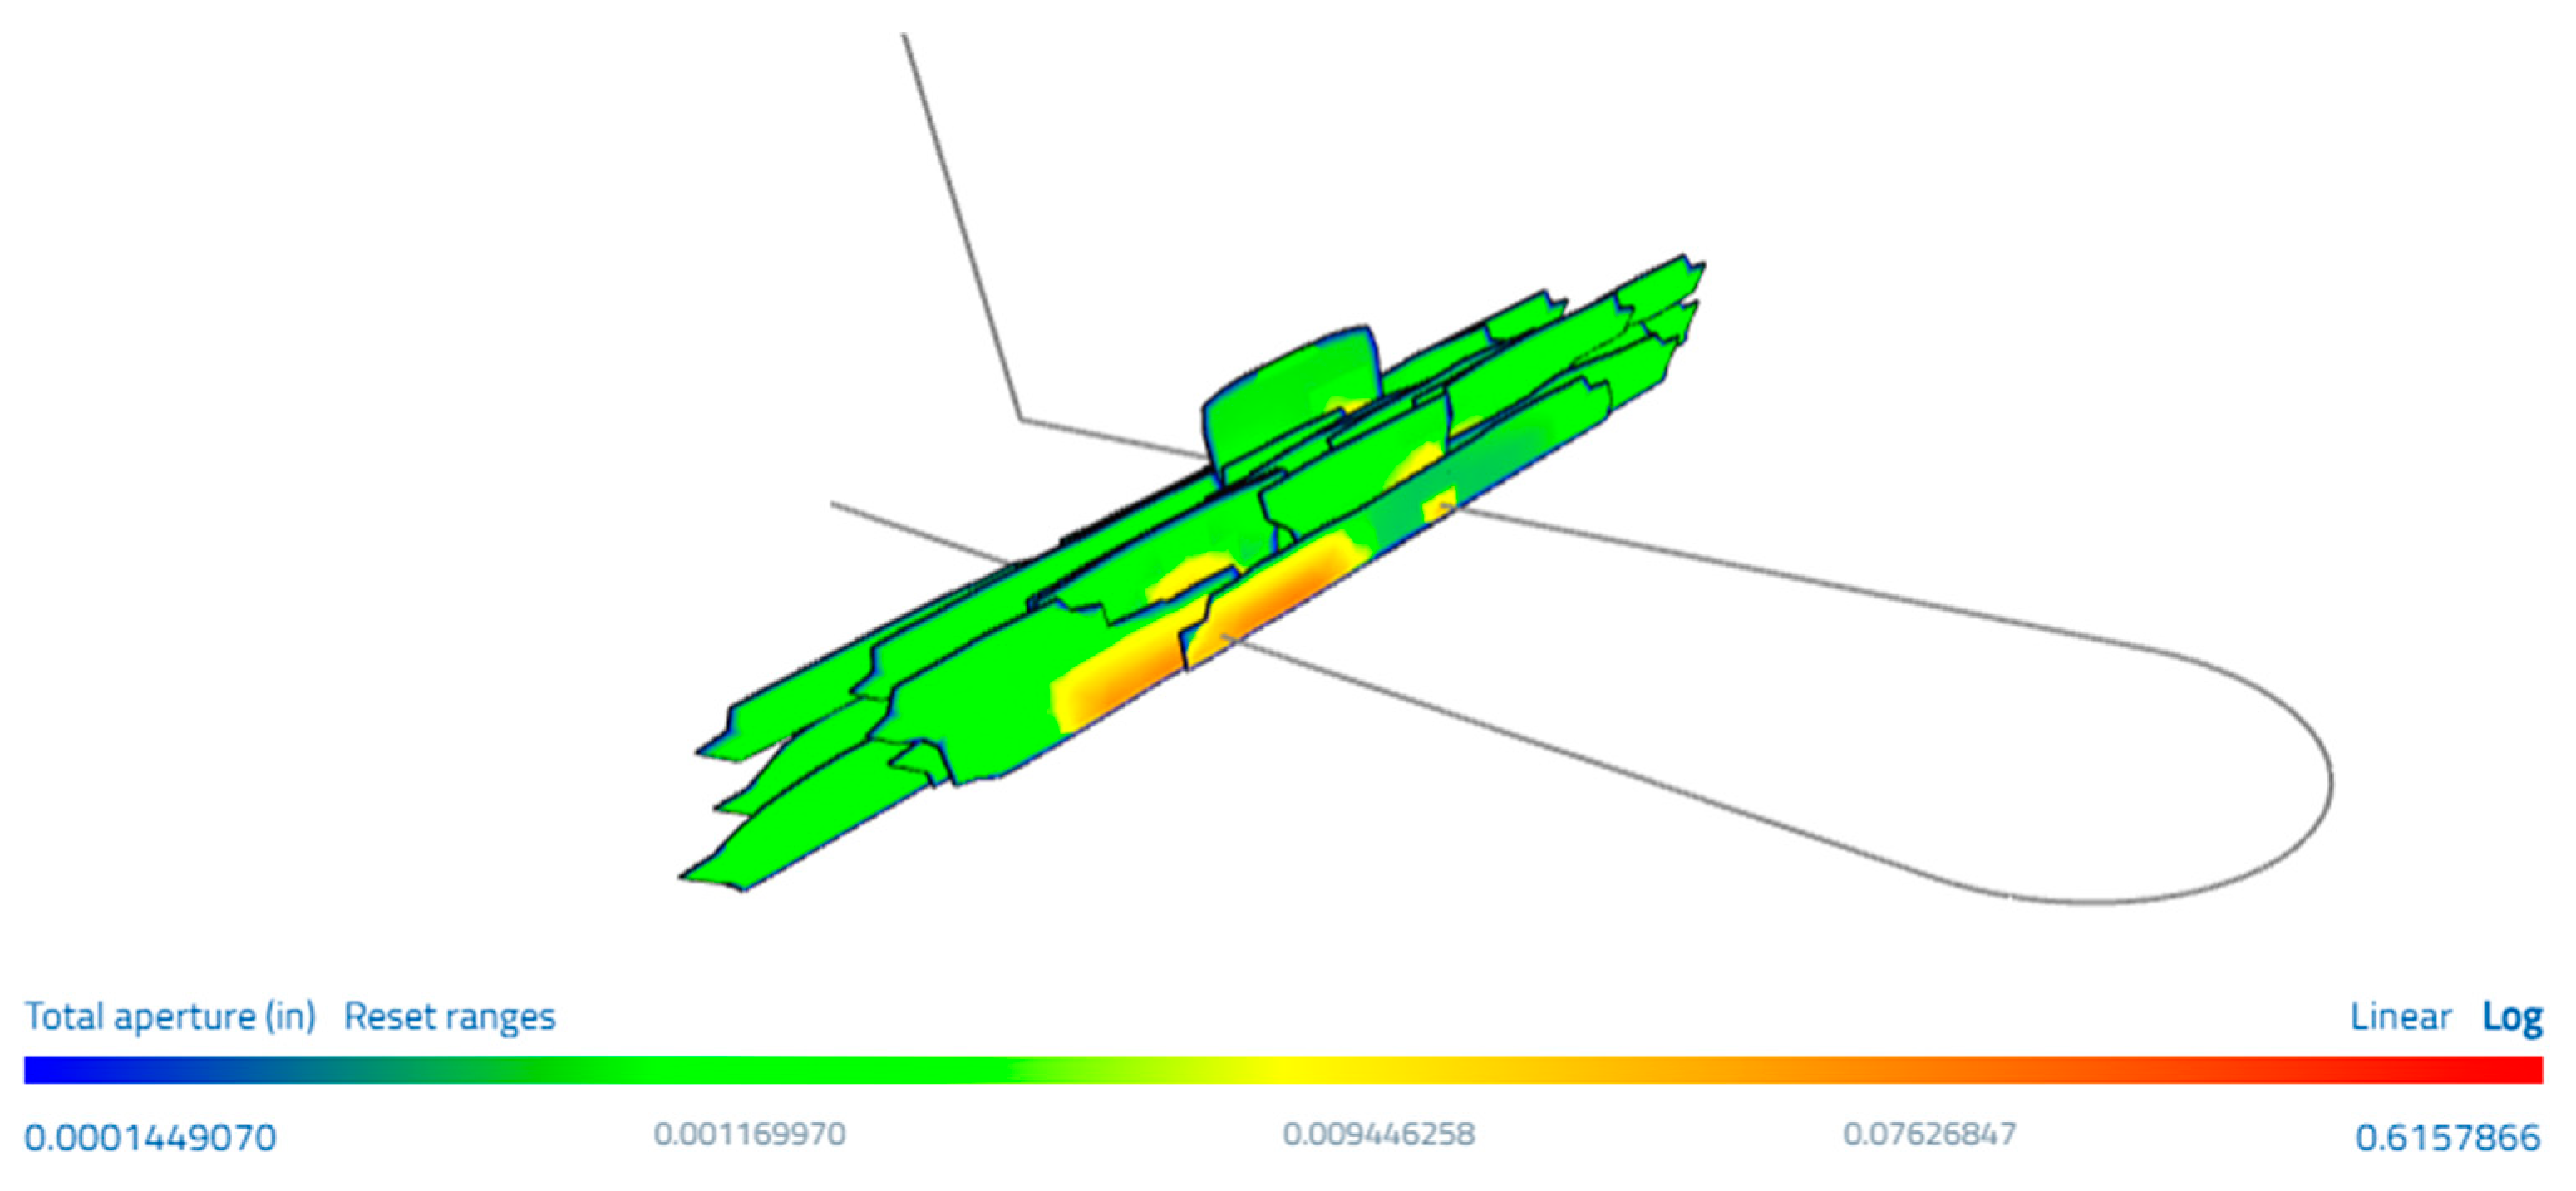
Figure 3 shows both legs reaching similar pressure fronts (reds/oranges) despite the 180° turn, indicating negligible stress shadowing when spaced ~1300 ft apart and leaving the bend unperforated—each leg behaves like an independent well.
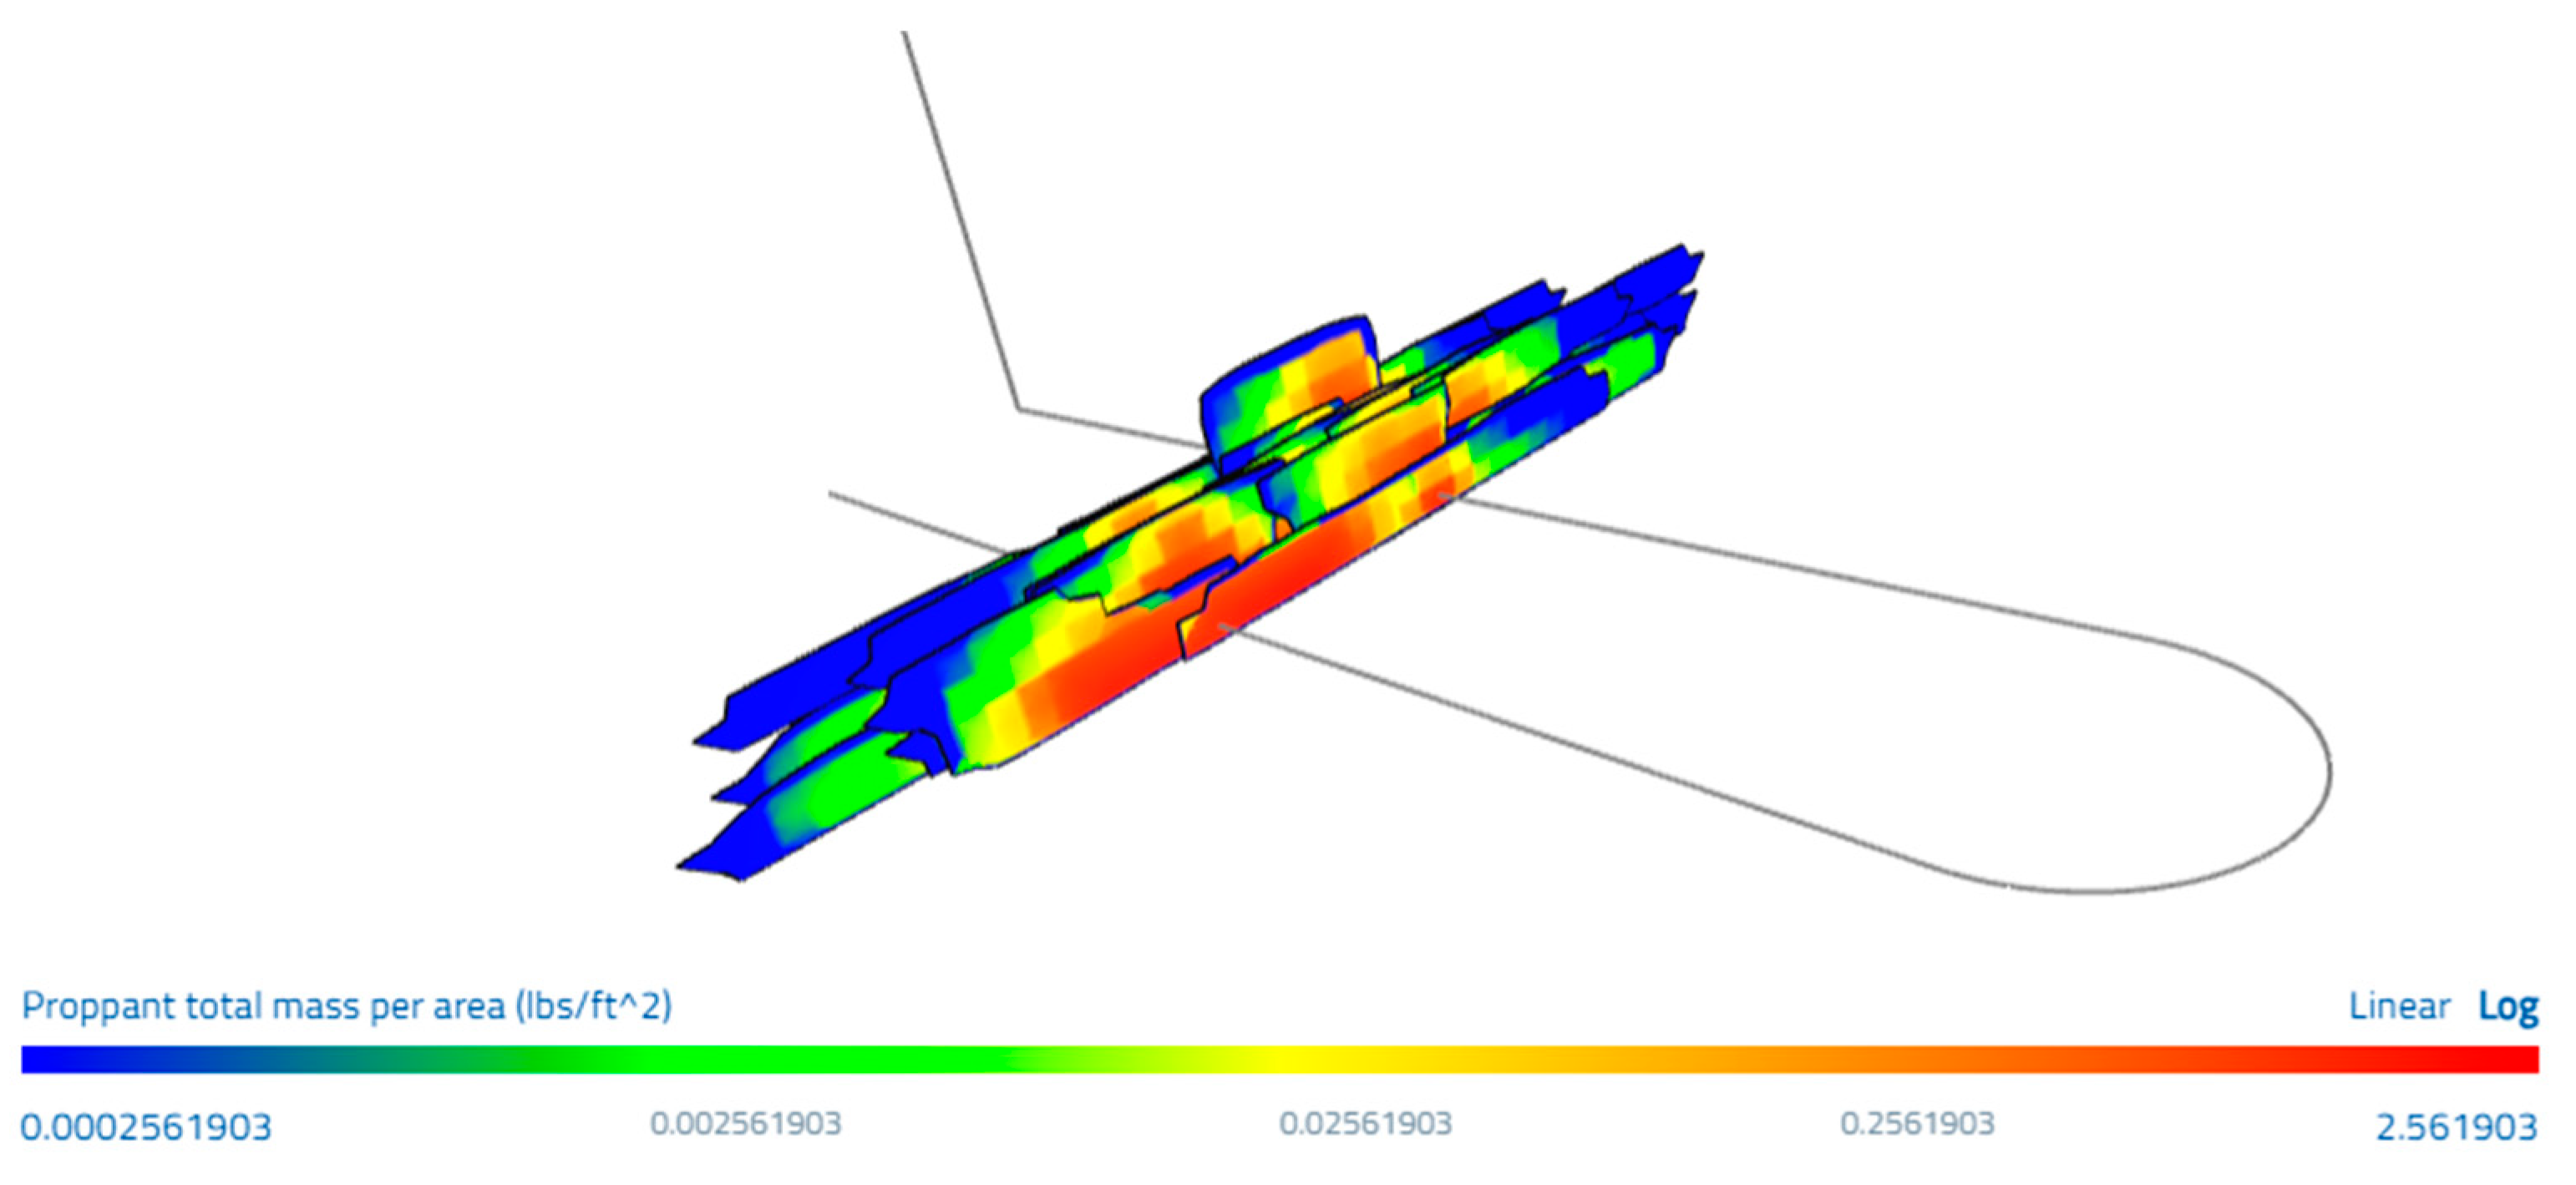
Proppant Placement and Wellbore Dynamics: A practical challenge in U-turn laterals is pumping fracture fluids and proppant around the 180° curved section. The bend introduces additional friction pressure and can increase proppant settling risk if not managed; in the water-based slickwater/hybrid systems, typical of shale U-wells, settling behavior is governed primarily by proppant size/density, carrier-fluid viscosity at bottom-hole temperature, stage rate, and frictional Δp through the 180° bend. Field practice mitigates these effects by sustaining high, steady rates, using viscosity/FR packages appropriate to BHST, shorter stage screens near the curve, and operational sequencing that avoids prolonged low-rate flow around the bend (see
Figure 4 for representative placement behavior). In the reported cases, operators have successfully handled this by using high-performance drilling assemblies and completion tools. Shell’s project utilized standard rotary steerable systems and off-the-shelf dissolvable frac plugs, and even the conventional coiled tubing unit on site was able to mill out plugs in both laterals despite the turn [
25]. Chesapeake similarly noted that no special tools were required beyond a robust drilling motor to build the curve and careful monitoring of torque and drag [
40]. The added tortuosity increases drag on the casing and tubulars (as the pipe must be pushed/pulled around a 180° bend) and adds pressure drop for fluids being pumped around the corner [
41]. However, the field experience at the Eagle Ford and Permian basins demonstrated that these challenges are manageable: Chesapeake reported that casing running and plug pumping in their U-well were completed “within 10%” of the predicted hookload/differential pressure, indicating a smooth operation around the bend.
The proppant and aperture plots in
Figure 4 and
Figure 5 illustrate how effectively the slurry negotiates the bend.
Full vs. Partial U-Turn Stimulation: A critical design consideration is whether to fracture the curved “U-turn” segment itself. In early implementations, operators opted not to perforate or frac the 180° bend portion (i.e., a partial stimulation approach). For example, Shell left the U-turn uncompleted to avoid any fracture interaction between the two laterals, effectively using the curve only as a “transit point” between horizontals. Chesapeake followed a similar approach of omitting curve perforations, citing that fracturing the curve would be “capitally inefficient” because the turn is drilled in the direction of maximum horizontal stress, meaning any induced fractures there would not propagate optimally (they would tend to grow parallel to the wellbore rather than perpendicular) [
40]. In other words, a lateral oriented along the maximum stress direction would initiate longitudinal fractures with poor reservoir reach. By skipping the curve, stimulation effort is focused on the two long laterals where fractures can propagate outward into the minimum stress direction. This partial U approach has been employed in nearly all field trials, to date.
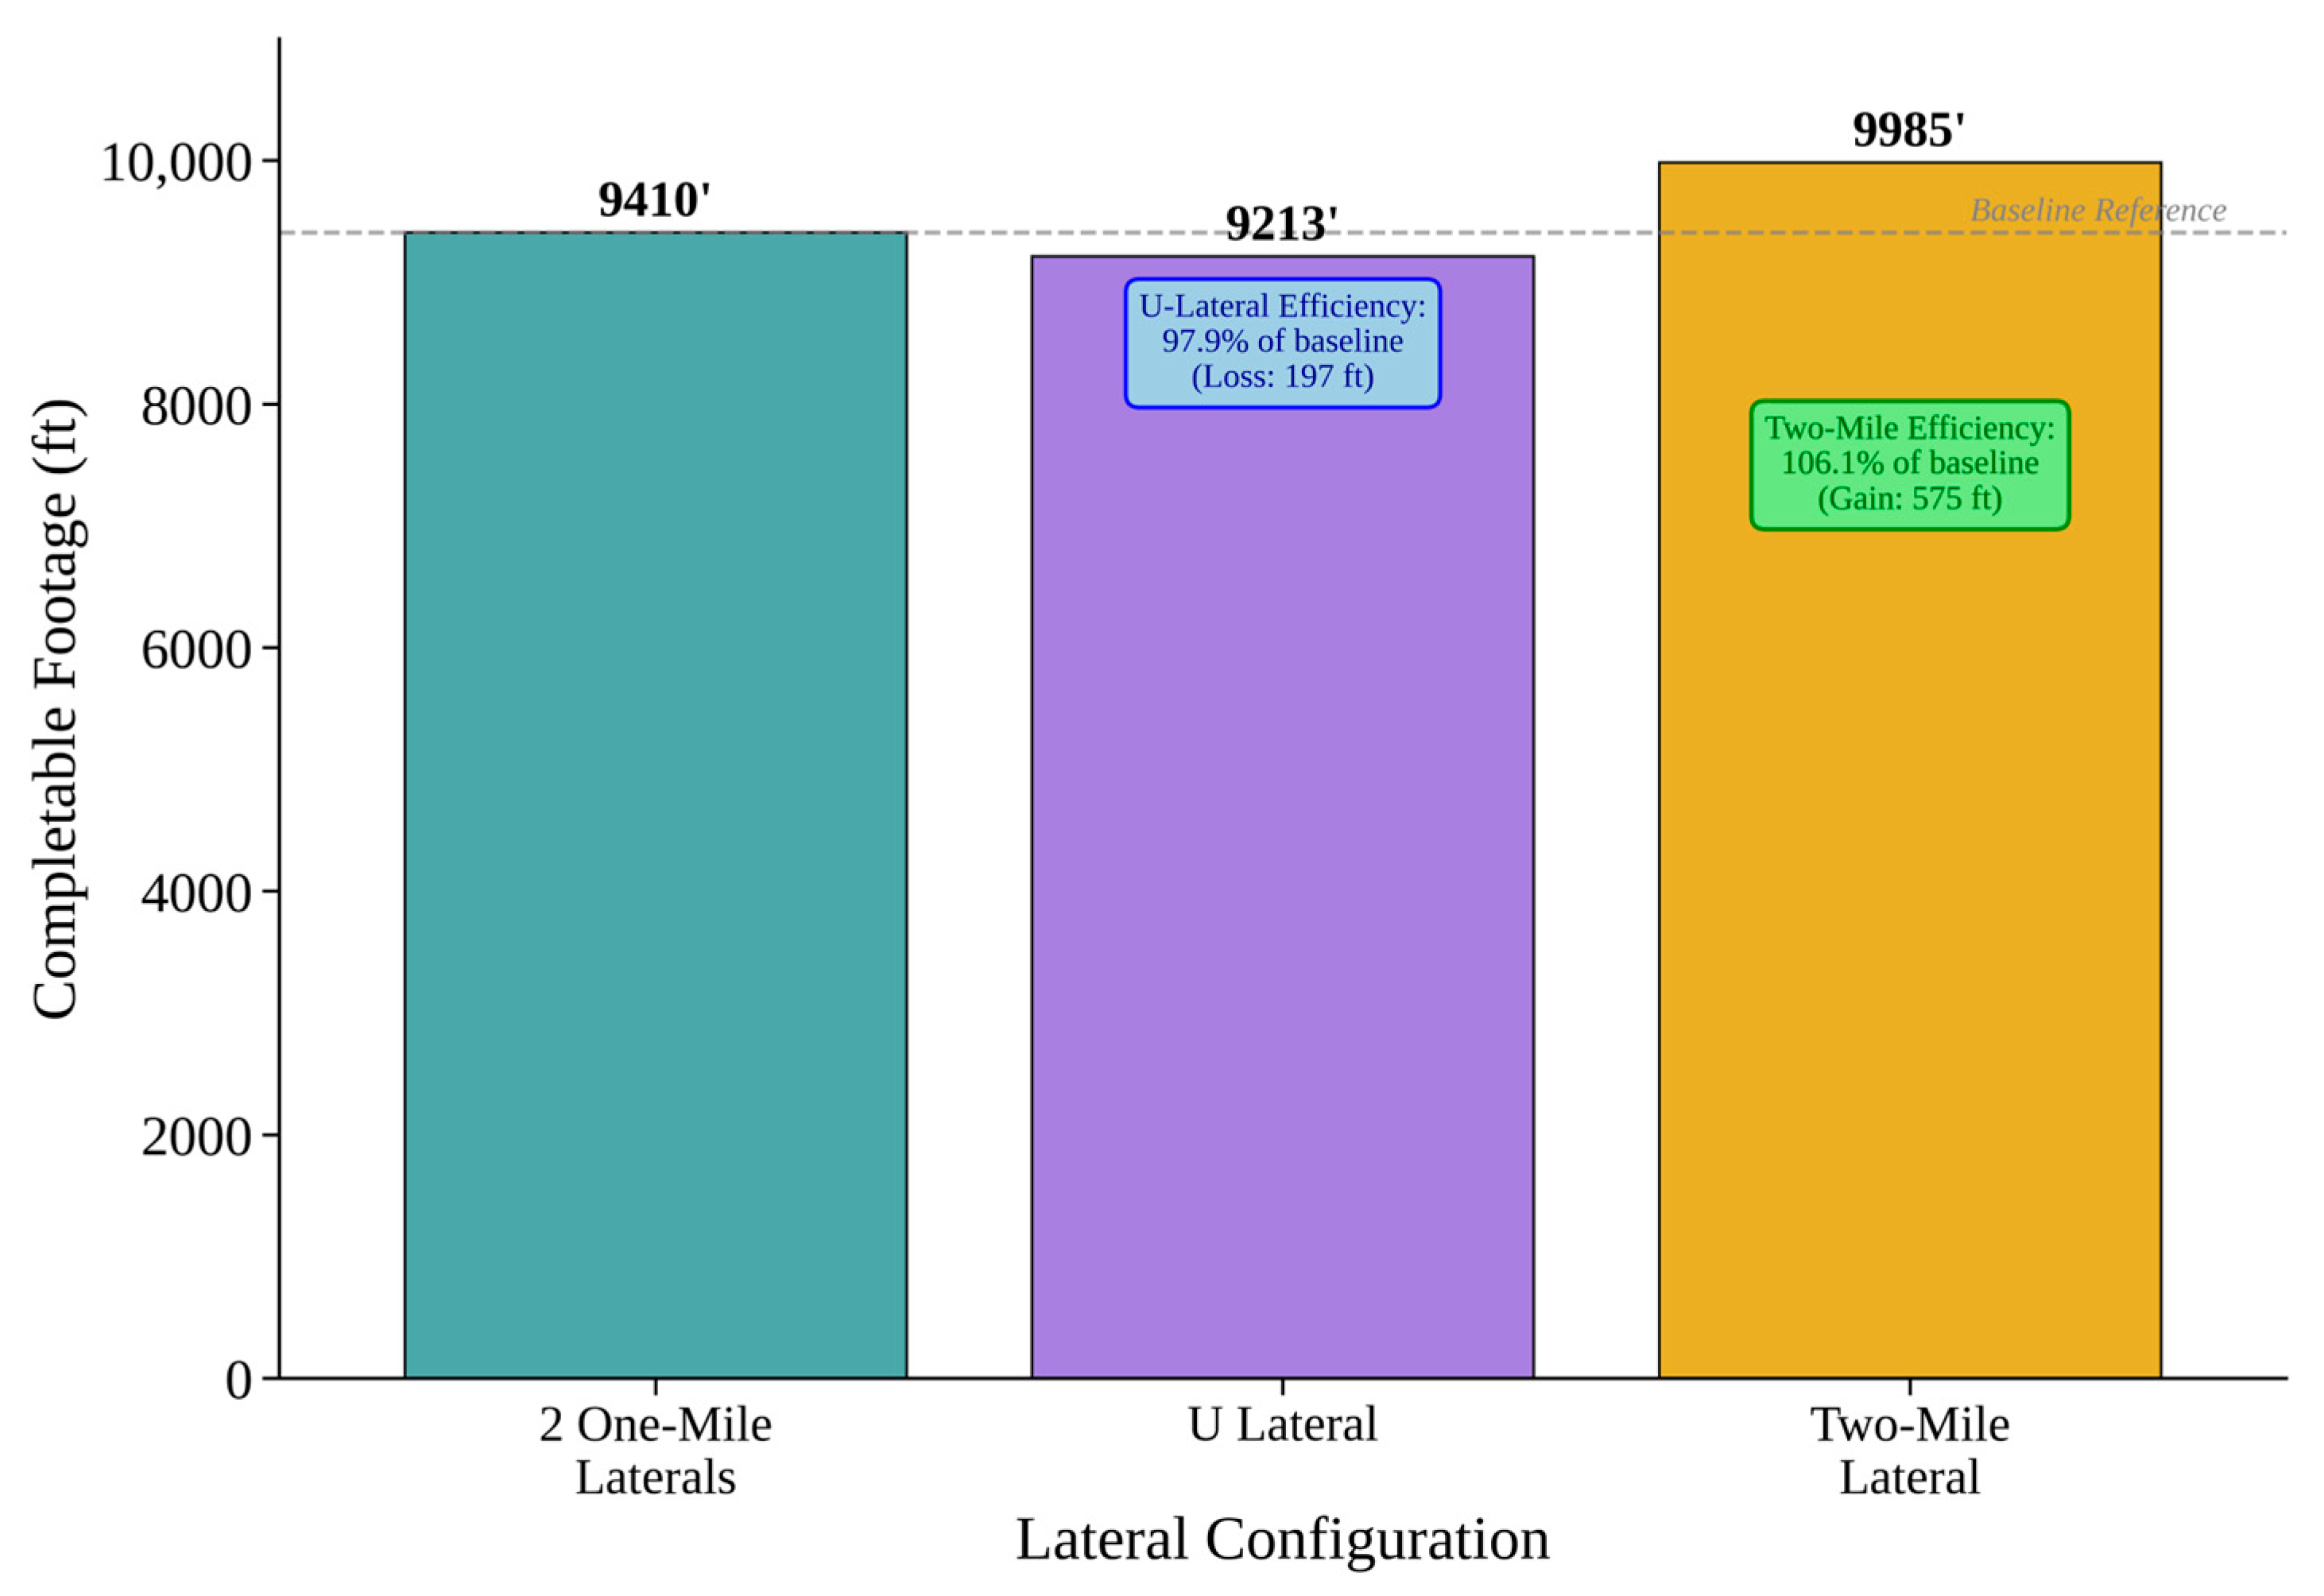
Figure 6 compares total measured depth that can be effectively stimulated (“completable footage”) across the three approaches. Two separate one-mile laterals yield 9410 ft of footage, while the U-lateral achieves 9213 ft—97.9 percent of baseline footage—losing only 197 ft due to the curve. A straight two-mile lateral produces 9985 ft (106.1 percent of two-mile target). A summary box reports the mean footage (9536 ft) and standard deviation (328 ft). This shows that U-laterals deliver nearly the same reservoir exposure as conventional well pairs, validating that the 180° turn imposes minimal sacrifice in producible length.
3. Drilling Feasibility of U-Shaped Laterals in Major North American Shale Basins
The selection of North American shale basins for U-shaped well analysis in this study was based on a systematic evaluation framework that considers both technical feasibility and economic viability criteria. The methodology employed a multi-criteria decision analysis approach, incorporating geological, operational, and economic factors that influence the successful implementation of U-shaped well technology.
Basin selection was primarily driven by documented field applications and pilot projects, ensuring that the analysis focuses on proven rather than theoretical implementations. The primary selection criteria included (1) lease constraint severity, where conventional extended-reach laterals face spatial limitations; (2) geological suitability, characterized by stable stratigraphy and adequate formation thickness to accommodate 180-degree turns; (3) technical feasibility demonstrated through successful field trials; and (4) economic justification based on cost–benefit analysis compared to conventional drilling alternatives [
24].
The basin analysis framework employed a standardized approach to evaluate drilling feasibility, completion challenges, and economic performance across different geological settings. For each basin, the assessment methodology included (1) geological characterization, focusing on formation depth, thickness, and stress regime; (2) drilling technology requirements including equipment specifications and operational complexity; (3) completion methodology evaluation considering fracture stimulation strategies and intervention capabilities; and (4) economic analysis comparing U-shaped wells to conventional alternatives [
19].
The analysis incorporates data from multiple sources including operator presentations, regulatory filings, industry publications, and peer-reviewed research. Field performance data was obtained from publicly available production records, operator investor presentations, and technical conference papers. Where possible, data was cross-validated using multiple independent sources to ensure accuracy and reliability. The geographic distribution of the analyzed basins spans from the Permian Basin in Texas and New Mexico to the Appalachian Basin in Pennsylvania and Ohio, providing a comprehensive coverage of major unconventional plays where U-shaped technology has been deployed or evaluated.
3.1. Bakken Shale
Bakken horizontal wells are typically drilled with polycrystalline diamond compact (PDC) bits and high-performance motors, often using an oil-based mud (invert emulsion) to minimize clay swelling and stabilize the borehole [
42]. For a U-shaped lateral, similar techniques apply with additional planning. Nevertheless, advanced well planning and real-time telemetry are crucial. The 180° turn is executed over several thousand feet to keep dogleg severity low, preventing excessive torque or pipe fatigue (
Figure 7). U-turn laterals have, thus far, seen limited deployment in the Bakken. Slawson Exploration drilled the first known Bakken U-lateral in recent years (with a second one planned), making the Williston one of eight U.S. basins where this concept has been tested. Technically, the main constraint is regarding the execution of a 180° turn within the thin target interval. However, due to Bakken’s flat stratigraphy, this is possible with a large turning radius; the Slawson well demonstrates that it can be steered successfully in the Bakken’s relatively uniform geology.
Economically, a U-shaped Bakken well would enable the development of single-section (640-acre) tracts with two-mile total lateral exposure, which is otherwise only possible by drilling two one-mile wells or negotiating unitization with offset operators. Because most core Bakken acreage is already held in 1280-acre (two-section) units, allowing 2-mile straight laterals, the U-turn approach may be most useful in smaller or irregular lease areas [
29]. Where applicable, the cost trade-offs mirror other basins: one 2-mile U-well costs less than two 1-mile wells (saving on one less vertical and one less surface facility), though it may cost slightly more (~10–15% more) than a standard 2-mile well due to additional drilling time for the turn and higher mechanical complexity [
41].
3.2. Permian Basin
The Permian remains the most active region for U-lateral drilling, with practices now well-established. Some operators commonly utilize high-powered AC rigs with top drives and rotary steerable systems to drill long laterals with minimal tortuosity. In fact, the very first horseshoe well (Shell’s “Neelie 4H”) was drilled using an RSS to ensure a smooth 180° turn. Many subsequent Permian U-wells, however, have shown that conventional directional motors can achieve the trajectory as well—for instance, some operators in 2023 drilled U-turn laterals in the Delaware Basin with standard mud motor assemblies, holding directional control by precisely managing the toolface orientation and build rate [
40]. Permian wells almost exclusively use oil-based or synthetic-based mud for the lateral sections to stabilize reactive shales and reduce friction over long distances. Directional plans for U-wells incorporate extensive torque-and-drag modeling.
Shell’s team, for example, conducted in-house T&D simulations to ensure that the drill string and casing could run smoothly around the turn [
29]. During drilling, close monitoring from remote operations centers is common—Shell supervised their horseshoe well in real time from Houston, with directional drillers and geosteerers watching each critical stage. Casing design in a U-lateral typically entails running production casing (or a liner) all the way to TD and cementing it in place. Despite the 180° curve, operators have reported no issues in getting the casing to the bottom in Permian U-wells [
29]. Centralization and mud displacement practices during cementing are adjusted to the turn section to ensure a good cement sheath.
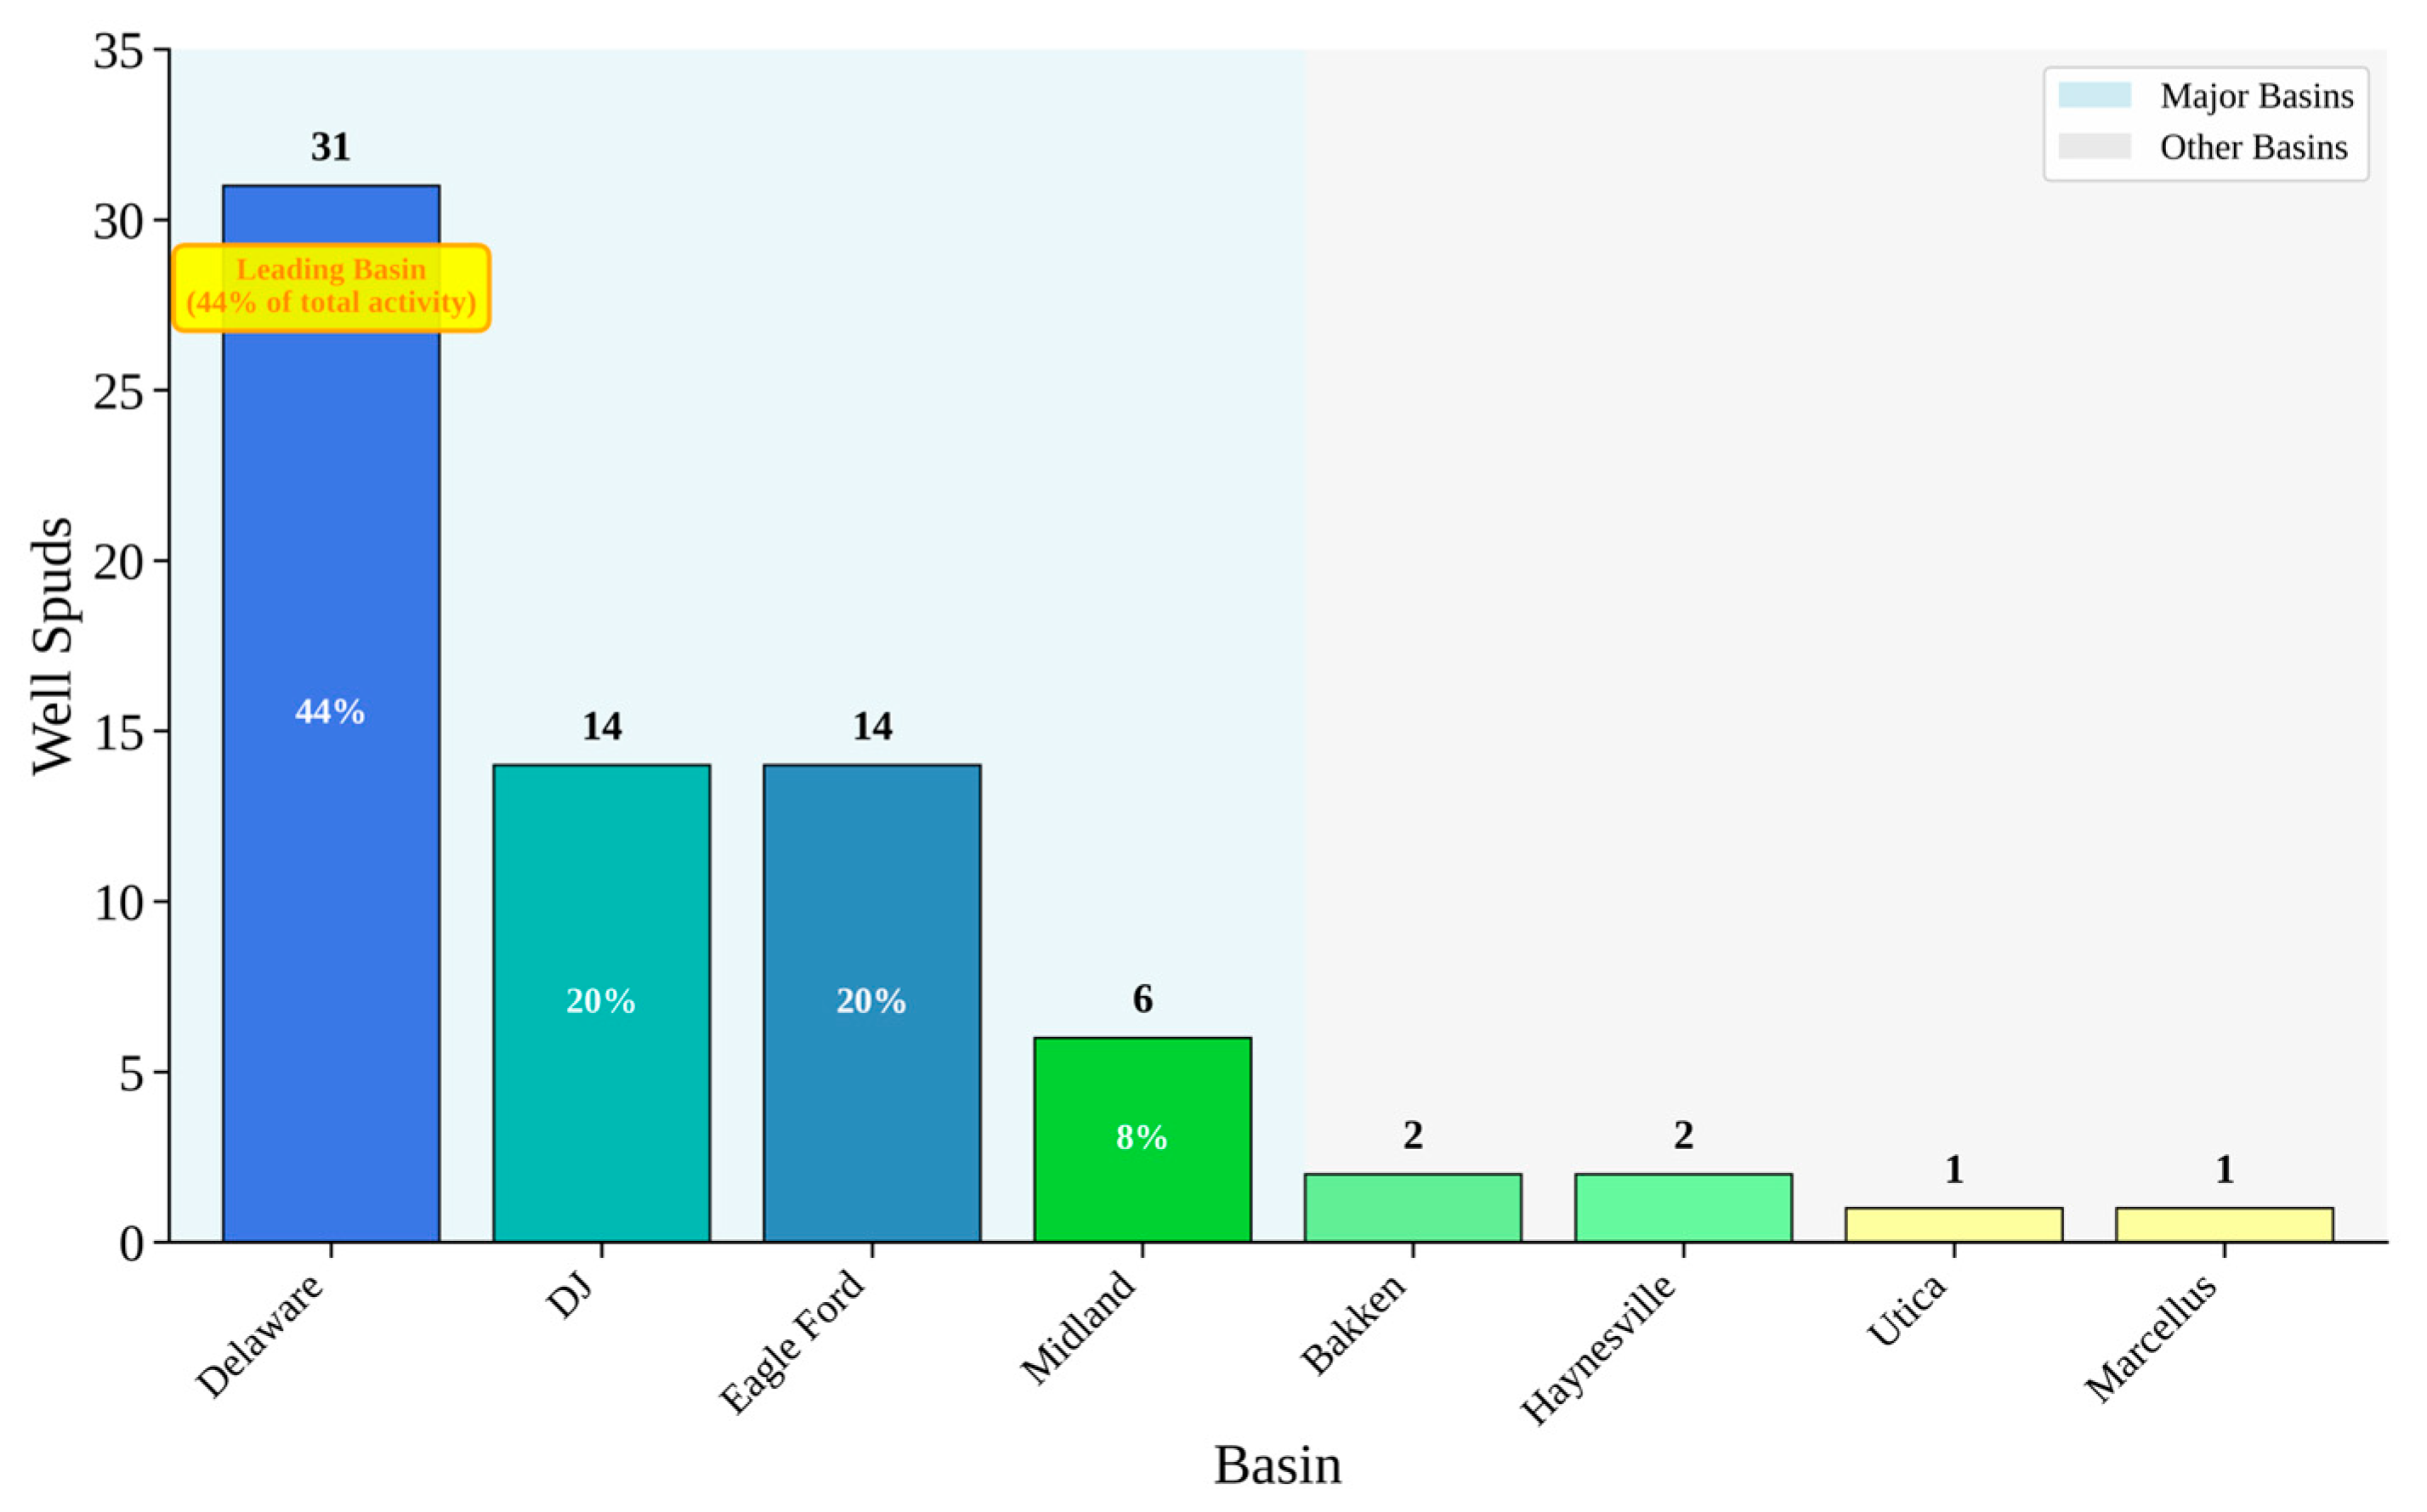
In terms of completions, U-laterals are treated much like two independent laterals that happen to connect. Each lateral leg receives a full-stage hydraulic fracture treatment, with the bend section left unperforated to isolate the two sets of fractures. Typically, the far “toe” of the second leg is perforated first and fractured, then successive stages move back toward the curve, then continue fracturing down the first leg back toward the heel (near the vertical). This means wireline and frac plugs must traverse the horseshoe turn multiple times. Operators address this challenge by using dissolvable frac plugs and performing extensive wireline simulations. The Permian Basin has emerged as the most proven environment for U-shaped laterals. By late 2024, more than 30 U-laterals had been drilled in the Delaware and Midland sub-basins, with numerous operators scaling up deployments as shown in
Figure 7 [
29].
3.3. Eagle Ford Shale
Drilling in the Eagle Ford is characterized by high drilling rates in the brittle zones and the need for inhibitive mud systems to handle gumbo clays. Most operators utilize oil-based mud to drill the lateral section, which provides shale stability and lubricity for long horizontal runs. The first U-shaped lateral in the Eagle Ford was drilled by Chesapeake in 2020 on a 5000-ft wide lease, and it was accomplished using a conventional directional assembly (mud motor) rather than an RSS [
40]. Chesapeake’s drilling team emphasized extensive pre-planning and real-time adaptability in executing the unusual trajectory. They modeled the plan thoroughly (“if it doesn’t work on paper, it won’t work in real life”) and even permitted a contingency well in case the U-turn had to be abandoned mid-way.
In practice, the operation went mostly as planned. The team started the turn with a 7″ motor (1.93° bent housing) and, later, a 2.12° bent motor to build angle, then adjusted to a 1.83° tool once ~1000 ft into the turn to fine-tune the dogleg severity. This kind of on-the-fly BHA change highlights how directional control was maintained to stay within the planned curvature limits. Notably, as the wellbore orientation approached the direction of max horizontal stress, they observed slight hole instability (minor sloughing or tight hole) and proactively increased mud weight based on a real-time mechanical earth model [
43]. The heavier mud stabilized the hole, and no further issues were encountered through the rest of the drilling.
In terms of completion, the Eagle Ford U-turn well was treated with a standard plug-and-perf methodology. Chesapeake ran over 25 wireline simulations to ensure the logging/perforating toolstring could navigate the U-turn and reach the toe of the second leg. Factors like toolstring weight, friction coefficients, and wireline speed were analyzed, and the plan was validated ahead of time. Cementing practices in the Eagle Ford U-wells mirror normal operations: full cement across the lateral, including the curve, to provide zonal isolation and well support. The high carbonate Eagle Ford rock tends to exhibit less creep or deformation, so casing in the curve is expected to remain round and properly cemented (no squeezing like in softer shales). One consideration is the treating pressure during fracturing—with a U-shaped geometry, pressure drop to the far toe is a bit higher, but because both laterals are stimulated via one wellhead, operators save on having to rig up multiple wells.
3.4. Anadarko Basin
As of now, no public instances of U-shaped laterals have been reported in the Anadarko Basin. Drilling a Woodford Shale U-turn well would require a high-spec rig, since a horseshoe well could easily reach that range (2 × 1-mile lateral plus vertical/horizontal build). Mud system selection would be critical; an oil-based mud with significant density (perhaps 14–16 ppg in deep parts) might be needed to maintain wellbore stability in the high-pressure Woodford. The drilling assembly for a U-turn would likely favor a rotary steerable system in such deep wells, because slide drilling with a mud motor at 12,000 ft could be slow and difficult to control over the long turn. Oklahoma’s regulatory framework allows multi-unit laterals (extending across section lines).
3.5. Marcellus Shale (Appalachian Basin)
The Marcellus Shale within the Appalachian Basin is known as one of the most promising frontiers for U-shaped lateral implementation, supported by successful field applications in both Pennsylvania and Ohio. According to recent industry reports, there are currently two operational U-shaped wells in the region: one in Pennsylvania’s Marcellus formation (Susquehanna County) and one in Ohio’s Utica formation (Belmont County) [
44]. The geological characteristics of the Appalachian Basin, marked by stable stratigraphy and well-established horizontal drilling infrastructure, provide favorable conditions for U-turn lateral execution.
Expand Energy has indicated strong interest in implementing U-turn drilling in the Appalachian Basin, with company executives expressing confidence that U-turn wells will be drilled in the region [
43]. The technical feasibility is supported by the basin’s mature drilling practices, extensive use of rotary steerable systems, and proven ability to drill ultra-long laterals exceeding 15,000 feet [
41]. The regulatory environment in Pennsylvania and Ohio, while stringent, has demonstrated an acceptance of innovative drilling techniques that minimize surface disturbance.
3.6. Haynesville Shale
The Haynesville Shale has emerged as a significant testing ground for U-shaped lateral technology, with documented successful implementation of the first 10,000-foot U-turn well in the basin [
45]. This achievement represents a major technical milestone, demonstrating the feasibility of executing complex U-turn geometries in one of the most challenging drilling environments in North America. The extreme depth (typically 11,000–13,000 feet) and high-pressure, high-temperature conditions of the Haynesville require specialized drilling techniques and equipment.
Comstock Resources has been a pioneer in Haynesville U-turn implementation, completing their first horseshoe well, the Sebastian 11 #5H, with a 9382-foot completed lateral length [
46]. The company has indicated plans to convert 57% of its short Haynesville well locations to horseshoe wells, demonstrating strong economic confidence in the technology [
47]. Technical success has been achieved despite the formation’s extreme overpressure conditions, with pressure gradients ranging from 0.85 to 0.95 psi/ft [
48].
3.7. Denver-Julesburg (DJ) Basin
The DJ Basin in Colorado has demonstrated significant success with horseshoe well implementation, particularly in addressing regulatory constraints and maximizing efficiency in tight spaces [
49]. Colorado’s strict regulatory environment has prompted operators to employ creative drilling techniques, including horseshoe wells and extended-reach laterals, to access oil and gas reserves while minimizing surface disturbance [
49].
The technical feasibility in the DJ Basin is enhanced by the relatively shallow depth of the Niobrara formation and favorable drilling conditions. Enverus Intelligence Research has identified that energy firms can generate better breakeven prices using horseshoe wells instead of drilling two separate 1-mile laterals [
49]. However, horseshoe well opportunities generally represent only a small portion of the remaining inventory for the most active operators in the DJ Basin, indicating selective application based on specific lease constraints.
3.8. Utica Shale
The Utica Shale, particularly in Ohio, has demonstrated successful U-shaped lateral implementation, with documented wells in Belmont County [
44]. The formation’s characteristics, including significant depth (8000–12,000 feet) and complex geology, present both challenges and opportunities for U-turn drilling. The technical feasibility is supported by the region’s extensive horizontal drilling experience and advanced completion technologies.
Recent developments include record-setting lateral lengths, with Expand Energy drilling a 5.6-mile lateral in West Virginia’s Utica Shale, potentially the longest onshore shale lateral ever completed in the United States [
50]. This achievement demonstrates the technical capability to execute complex drilling geometries in the formation, providing confidence for U-shaped lateral implementation.
3.9. Fayetteville Shale
The Fayetteville Shale in Arkansas, while historically focused on conventional horizontal drilling, presents potential opportunities for U-shaped lateral implementation. The formation’s characteristics, including relatively uniform geology and established drilling practices, provide a foundation for U-turn technology adoption [
51]. However, no documented U-shaped laterals have been reported in the Fayetteville Shale, to date, representing an untapped opportunity for the technology application.
The technical feasibility is supported by the formation’s successful history of horizontal drilling with lateral lengths exceeding 7000 feet and multiple fracture stages [
33]. The mature nature of the play and established infrastructure could facilitate U-shaped lateral implementation with appropriate economic drivers.
3.10. Tuscaloosa Marine Shale
The Tuscaloosa Marine Shale (TMS) in Mississippi and Louisiana presents unique challenges and opportunities for U-shaped lateral implementation. While no specific U-turn wells have been documented, the formation has a history of innovative drilling approaches, including wells with names like “Horseshoe Hill,” indicating industry recognition of curved drilling concepts [
52,
53].
The technical challenges in the TMS include extreme depth (typically 11,000–15,000 feet), high pressure and temperature conditions, and complex geology. However, successful horizontal drilling campaigns with lateral lengths exceeding 5000 feet demonstrate the technical capability for complex wellbore geometries [
53].
Drilling and Completion for U-Turn Laterals in Major US Shale Basins: Shale plays in North America present distinct drilling and completion challenges driven by variations in depth, lithology, natural fracturing, and thermal regimes. The Bakken, Permian (Midland/Delaware), Eagle Ford, and Anadarko basins—each with unique reservoir architectures—demand tailored bottom-hole assembly (BHA) designs, mud systems, and stimulation strategies to achieve optimal wellbore stability, rate of penetration (ROP), and frac placement.
As leasehold limitations intensify, operators are increasingly exploring horseshoe-shaped (U-turn) laterals to enhance reservoir contact from a single pad (
Figure 8). The feasibility of these designs depends on a variety of formation-specific parameters, including curve related friction, temperature/pressure conditions, and heterogeneity in rock properties. The table below (
Table 2) synthesizes the most critical drilling and completion parameters for these four basins and highlights the feasibility considerations for U-turn lateral designs.
Table 2 also includes two comparative descriptors—anisotropy and geostress and a technical difficulty/economic advantage (TD/EA) score of 1–5. TD reflects curvature/DLS window, HP/HT, and tool/fluid requirements; EA reflects pad consolidation,
$/completed-foot savings, and the unlocked inventory potential.
4. The Economic Advantage
U-shaped wells offer distinct capital efficiency. By merging two laterals within a single wellbore, operators achieve substantial cost savings in both drilling and surface equipment. Industry examples have shown that a 2-mile U-well costs less than two 1-mile wells. For instance, Vital Energy reported that a single 10,000-ft horseshoe well costs significantly less than drilling two 5000-ft “sticks”, enabling them to convert 154 short locations into 77 long U-wells that were previously uneconomic. Comstock Resources reported concrete numbers from Haynesville: they avoided having to use two pads and four short wells (which would have cost ~
$40 million total) by drilling two U-wells from one pad at a cost of ~
$32 million, saving about 20% in capital for the same overall lateral length. Shell’s pilot saved one entire well’s worth of surface infrastructure and drilling, yielding about 20% cost reduction as noted earlier [
55]. While U-shaped wells may incur slightly higher completion costs due to extended drilling time and increased mud motor wear in the bend, these expenses are relatively minor when compared to the savings from avoiding a second well entirely.
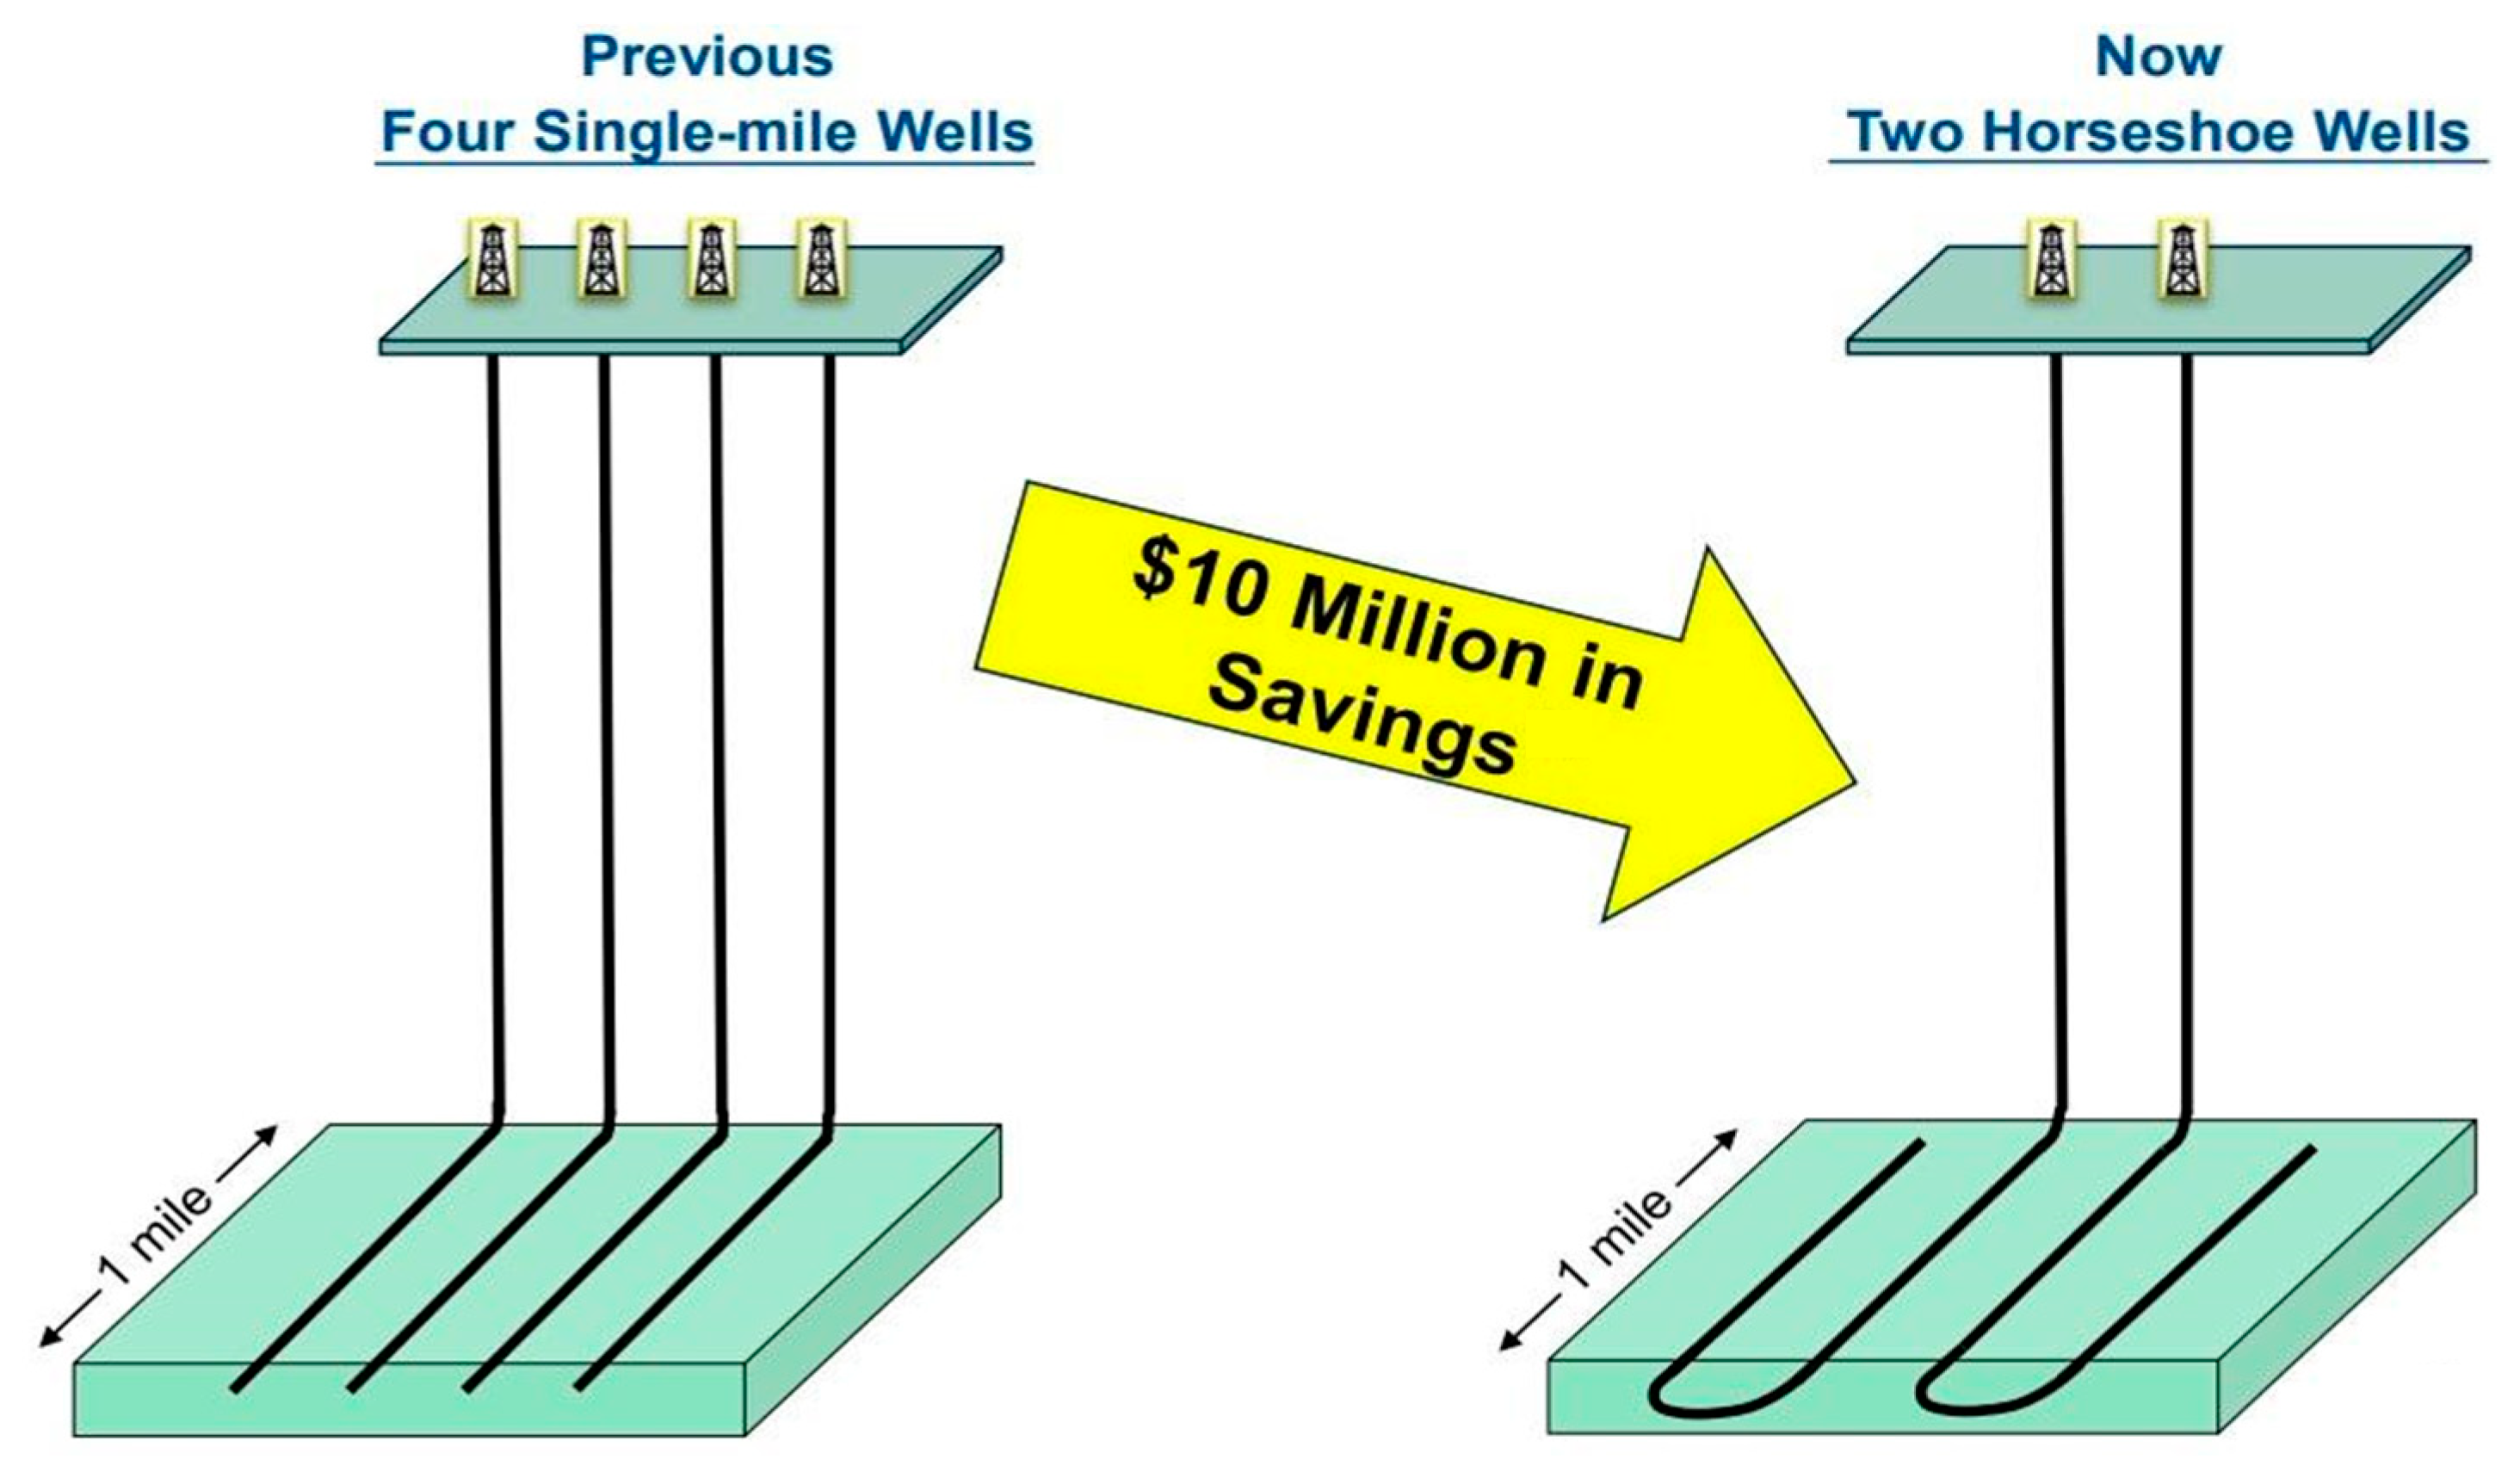
Matador’s early implementation of horseshoe wells in the Delaware Basin has delivered striking economic upside by drilling two 2-mile U-shaped laterals instead of four 1-mile horizontals, the company estimates roughly
$10 million in drilling-and-completion cost savings per pair of wells. Initial production (IP) rates for Matador’s horseshoe wells reached 2477 and 2166 BOE/d, matching the performance typically seen in standard two-mile laterals. Those efficiencies enabled Matador to set quarterly production records (135,000 BOE/d), generate
$144.6 million in adjusted free cash flow, and outpace analyst capex forecasts (spending
$337.7 million versus guided
$129.5–131.5 million BOE/d). A portion of that cash flow paid up
$200 million in debt and funded
$65 million in acreage bolt-on acquisitions, expanding Matador from 7500 net acres in 2012 to over 150,000 acres and 751 wells by mid-2023. As they expand laterals to 2.5–2.7 miles, Matador expects to sustain these cost advantages, further boosting returns and free cash flow generation (
Figure 9).
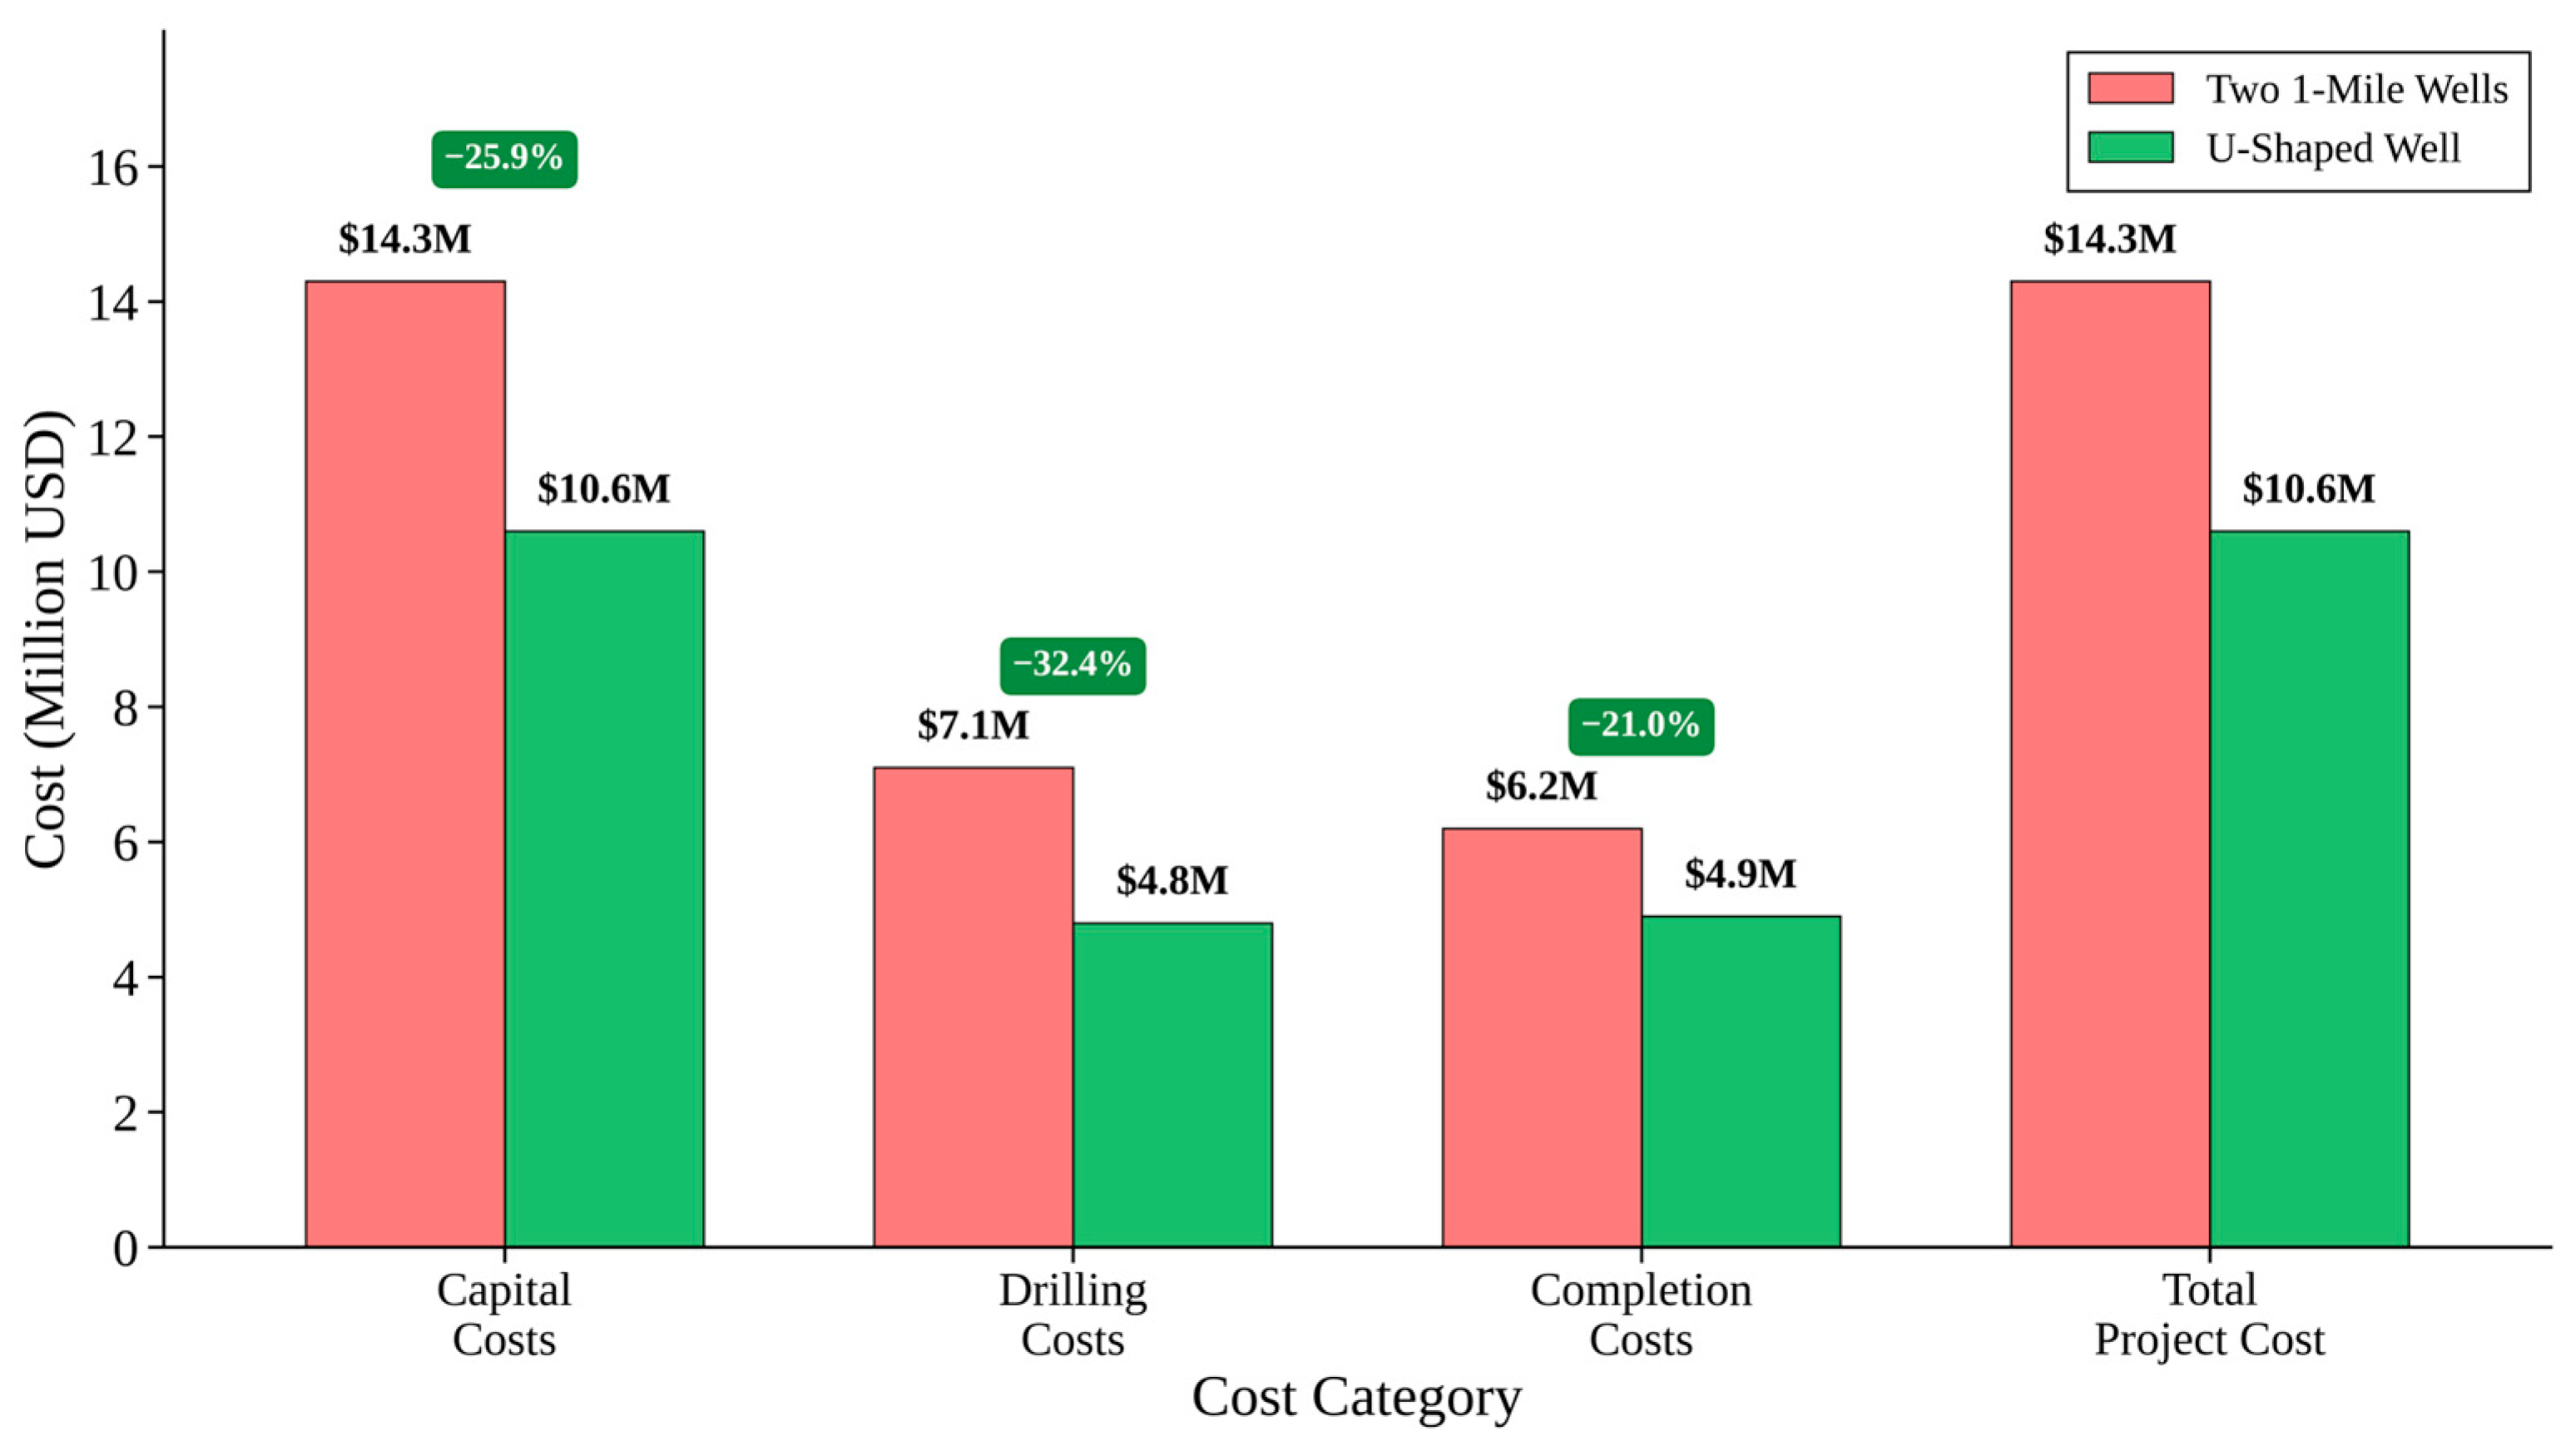
Figure 10 illustrates the capital expenditure breakdown for three distinct well configurations—two conventional one-mile laterals, a single U-lateral, and a full two-mile lateral—of drilling, completion, and total costs. The chart shows that two one-mile laterals incur roughly
$7.1 MM for drilling and
$6.2 MM for completion, totaling to
$14.3 MM. In contrast, the U-lateral cuts drilling costs by
$2.3 MM (to
$4.8 MM) and completion costs by
$1.3 MM (to
$4.9 MM), yielding a
$10.6 MM total—25.9 percent less than two separate wells. A hypothetical two-mile straight lateral (where geology allows) costs slightly lower (
$10.4 MM), though this configuration is often not feasible in lease-constrained zones. This cost–structure comparison underscores that U-laterals deliver most of the economics of extended laterals while avoiding the duplicate vertical and surface work of two wells.
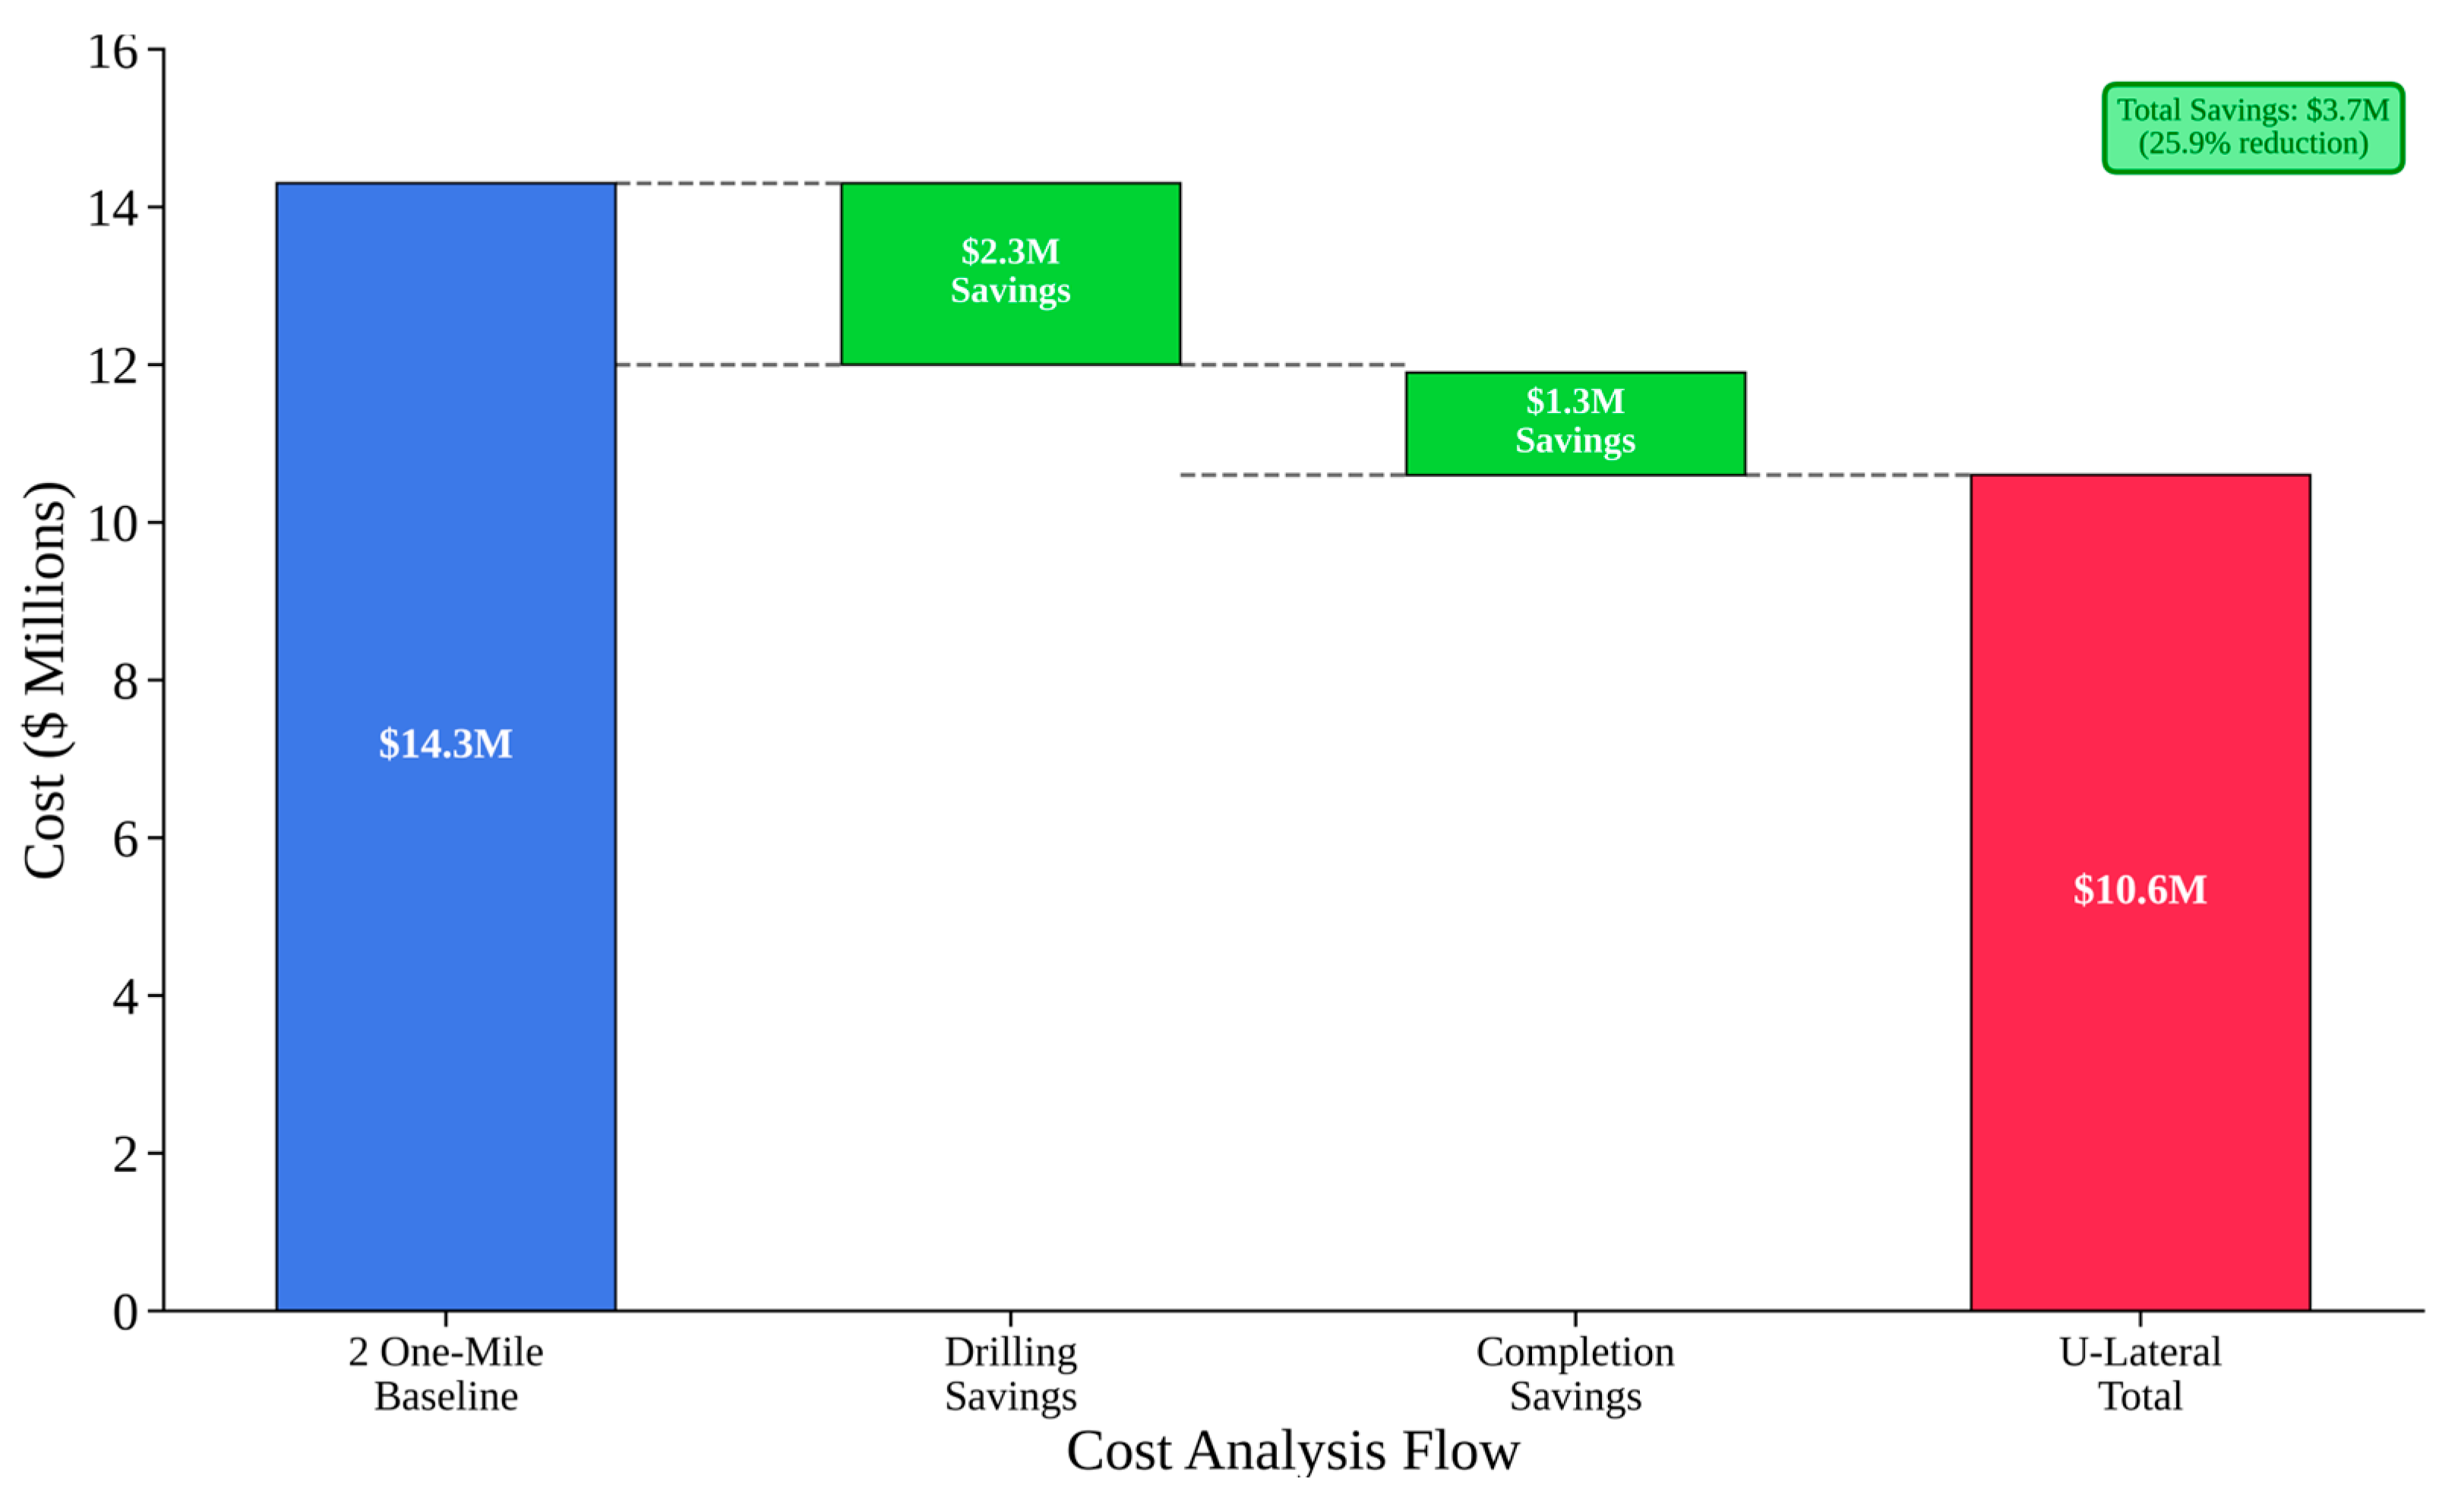
Figure 11 isolates the sources of the
$3.7 MM total savings achieved when replacing two one-mile wells (
$14.3 MM) with a single U-lateral (
$10.6 MM). The blue baseline bar shows the original capital of
$14.3 MM. Progressing from left to right, a green bar quantifies the
$2.3 MM reduction from lower drilling expenses, and another green bar shows the
$1.3 MM decrease from streamlined completion operations. The red bar at the far right marks the resulting U-lateral total of
$10.6 MM. A call-out confirms the overall 25.2 percent reduction. This waterfall illustrates how drilling optimization and elimination of duplicate completion steps each contribute materially to the U-lateral’s economic advantage.
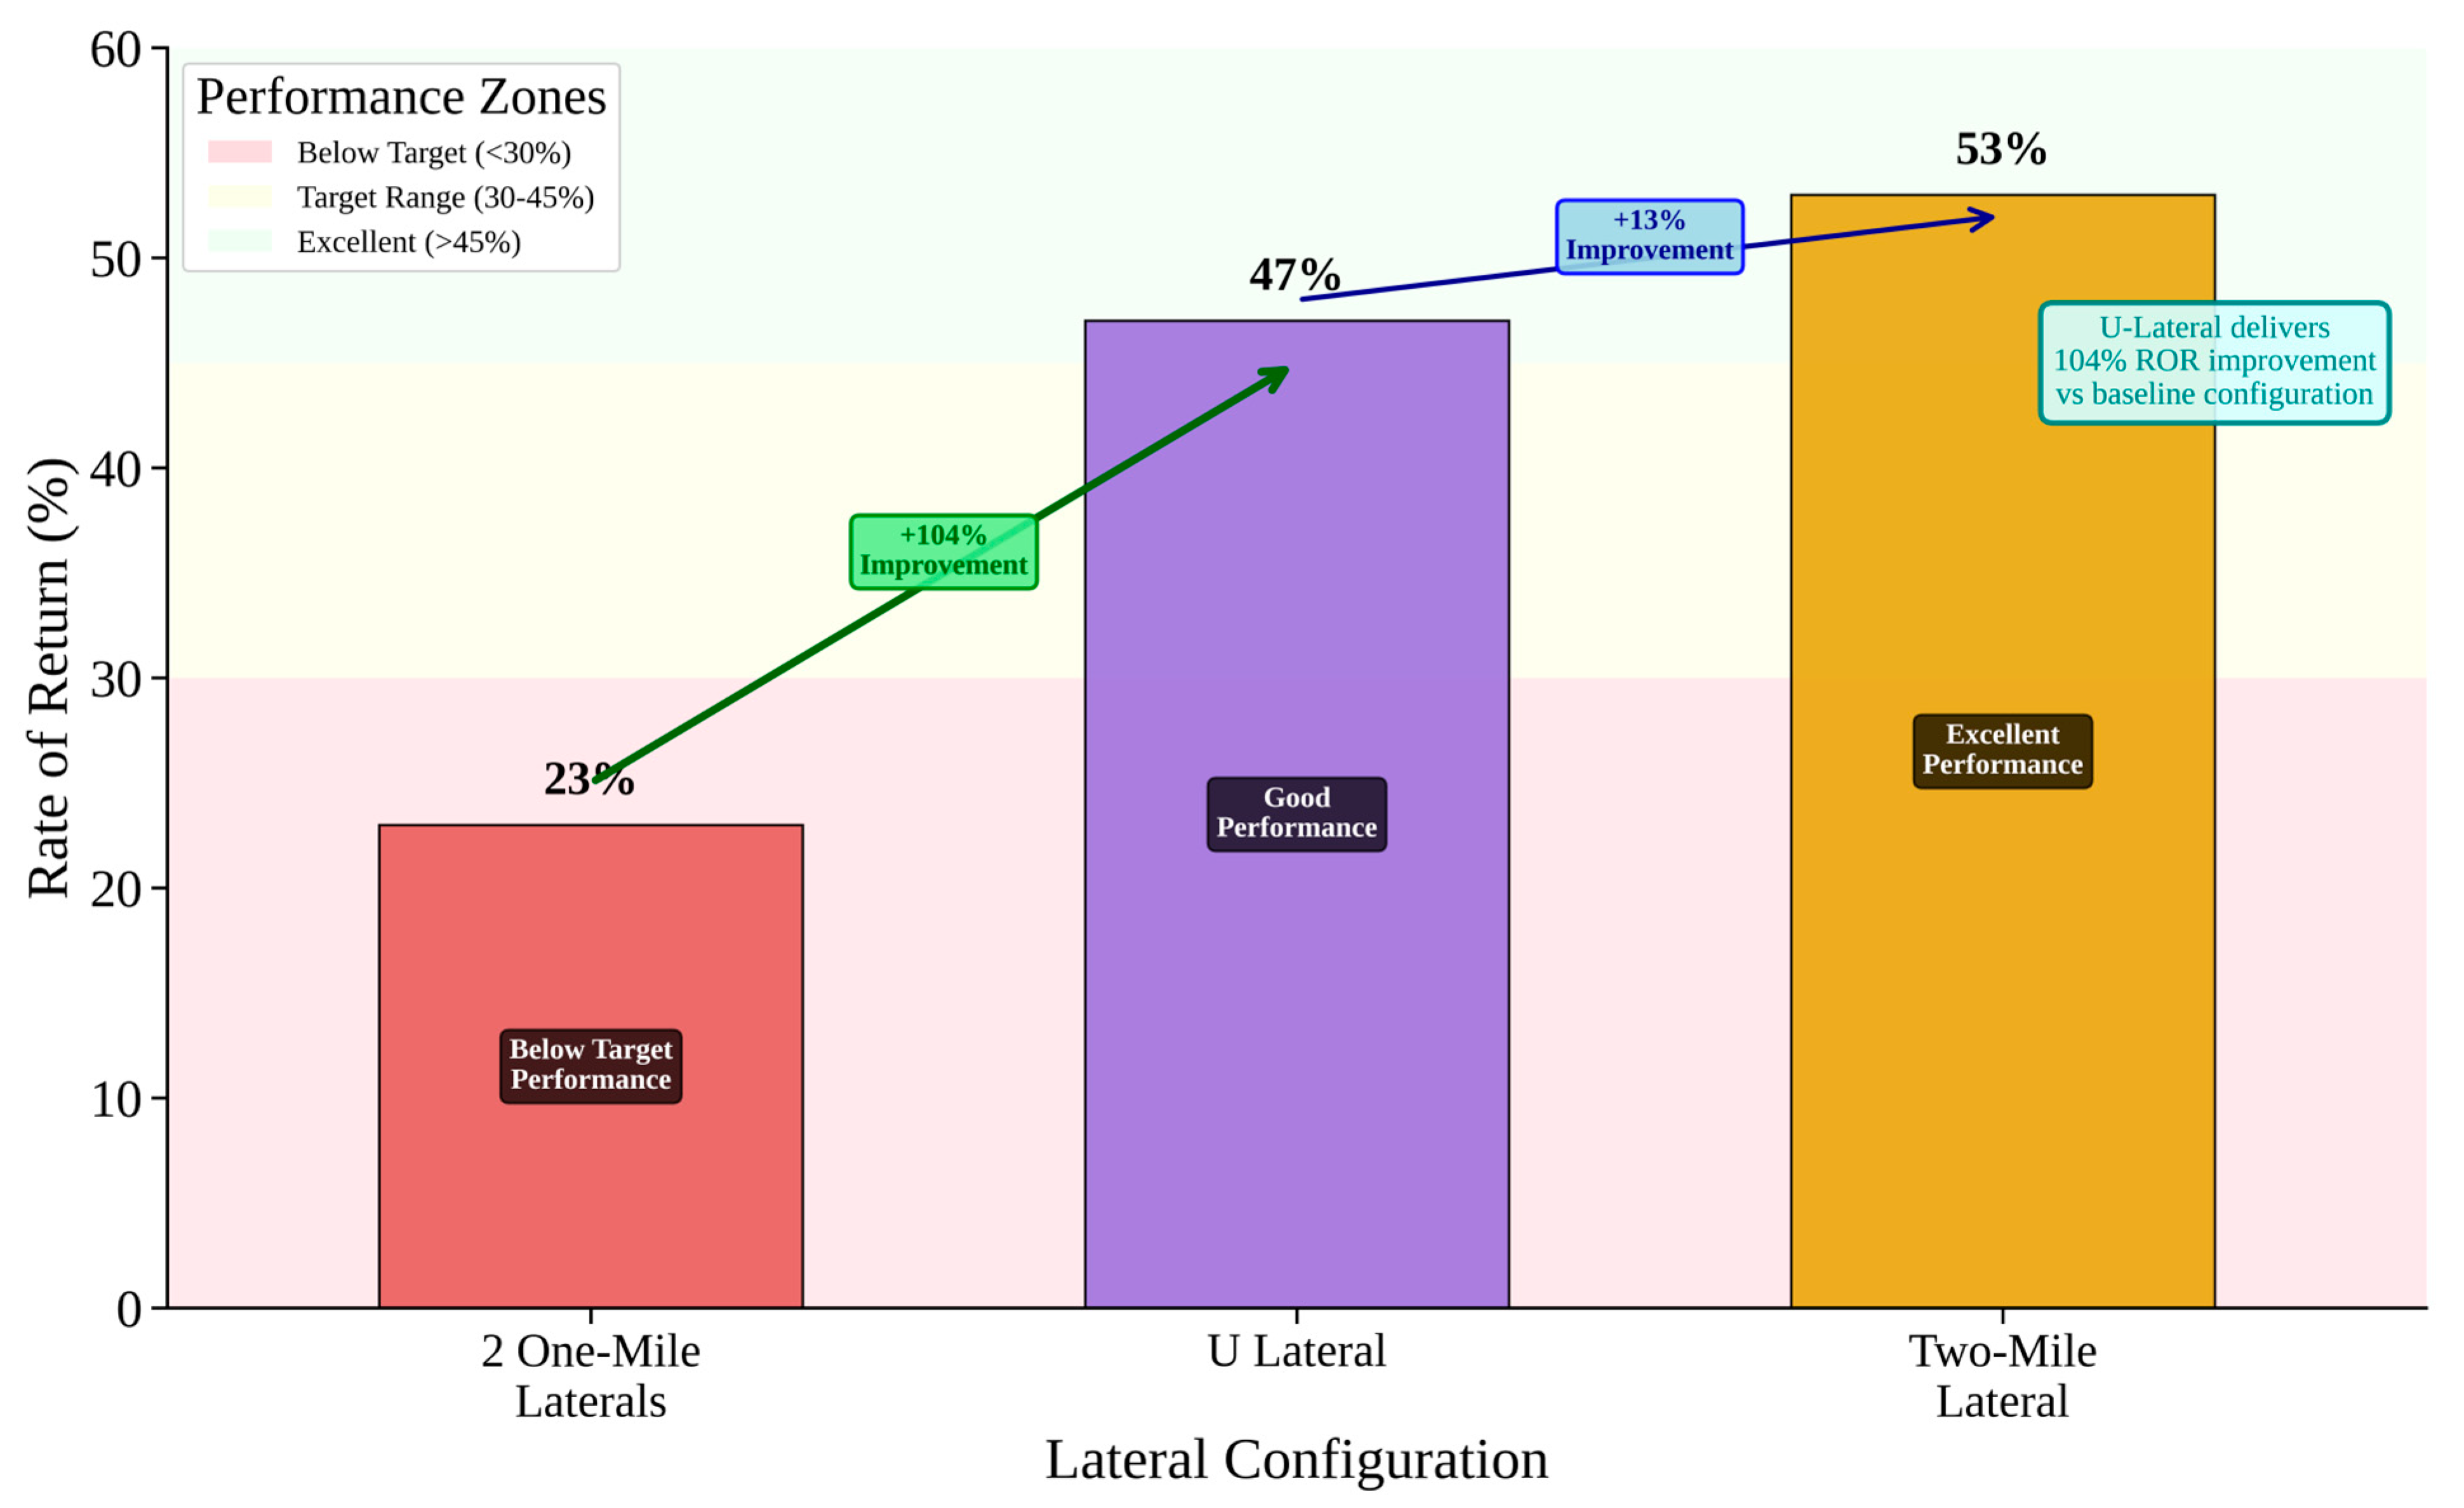
Figure 12 compares the internal rate of return (IRR) across three lateral configurations, highlighting economic performance rather than cost alone. Two separate one-mile wells yield a 23 percent IRR, whereas the U-lateral achieves a significantly higher 47 percent IRR—representing a 24-point uplift or a 104 percent relative improvement. A two-mile lateral (again, for reference) achieves a 53 percent IRR. A shaded call-out emphasizes the U-lateral’s +24 percentage-point gain over the baseline. These findings confirm that U-laterals not only save capital but also translate those cost efficiencies into substantially higher returns on investment, especially in acreage-limited plays.
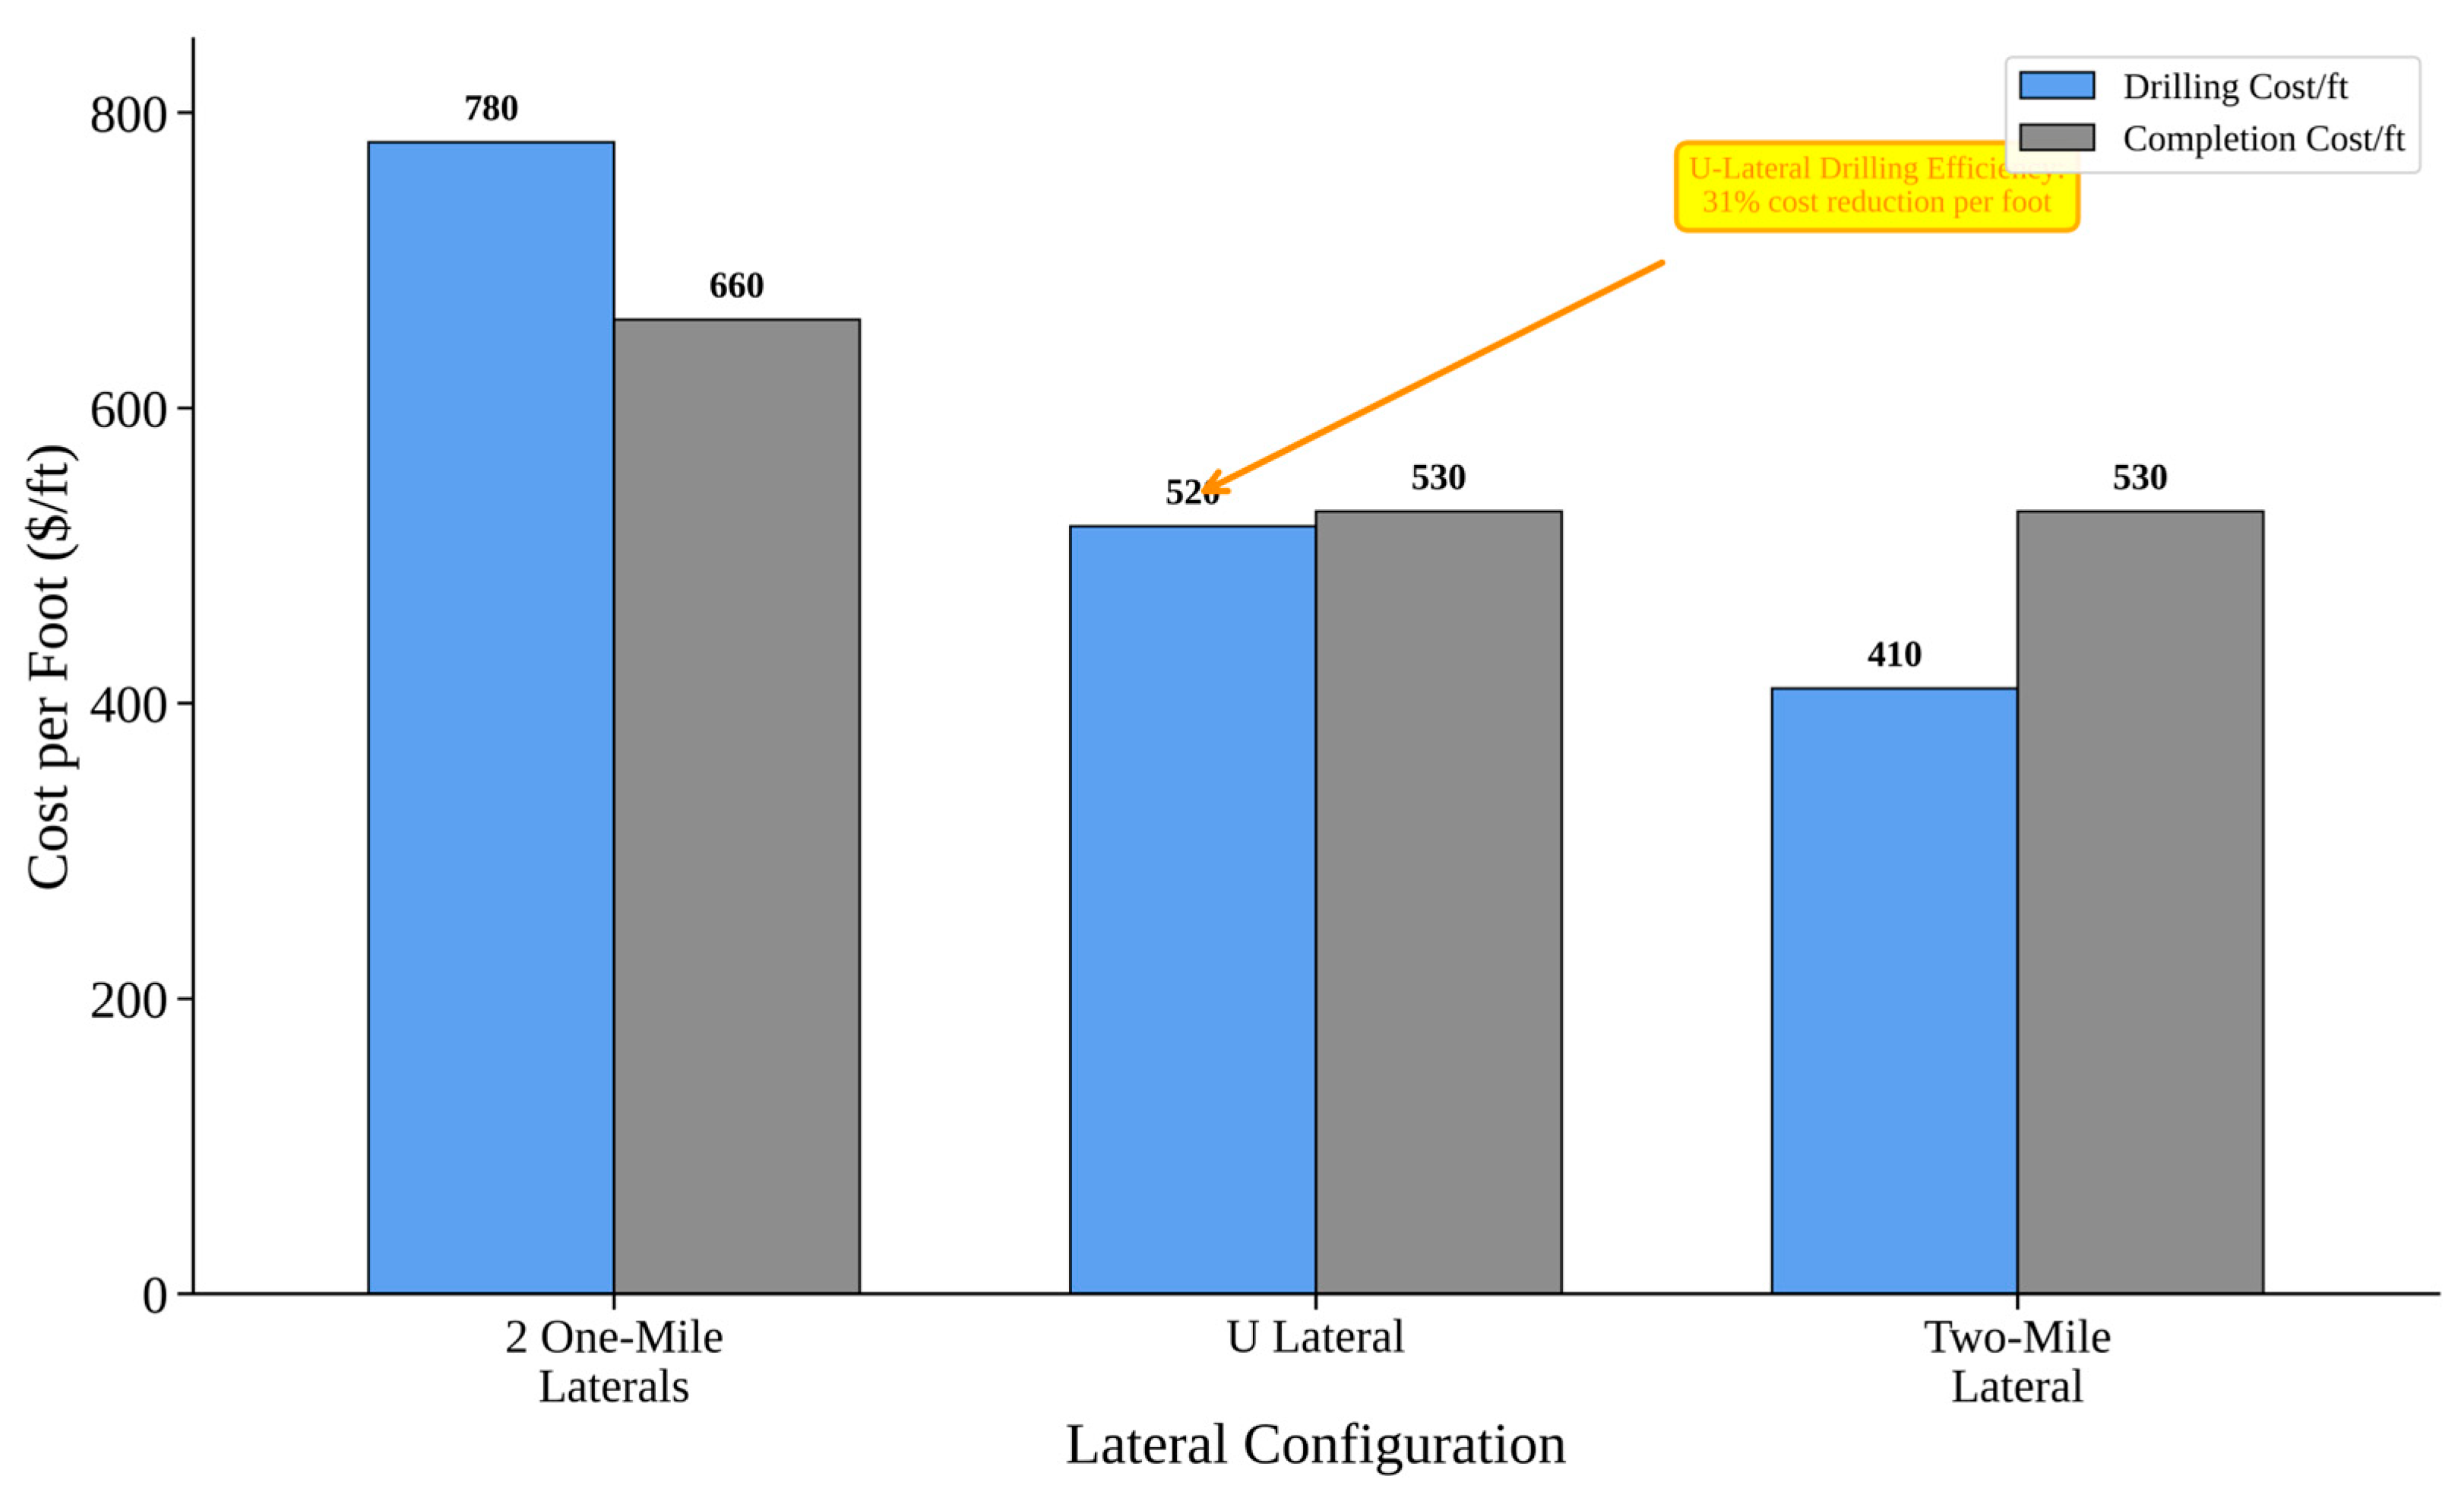
Figure 13 presents drilling and completion costs normalized by completed lateral footage, highlighting clear per-foot efficiency gains. For two one-mile laterals, combined costs average to approximately
$1439 ft (
$780 drilling +
$659 completion). The U-lateral configuration reduces total costs by about
$386 ft (to
$1053 ft), driven by an approximately 33% reduction in drilling cost per foot (
$521 vs.
$780 originally), while completion cost per foot drops slightly to ~
$532 ft. A two-mile straight lateral achieves the lowest drilling cost per foot at approximately
$411 and a slightly reduced completion cost at around
$531. A highlighted call-out emphasizes the U-lateral’s approximately 31% drilling cost per foot reduction compared to two one-mile laterals. This analysis confirms that, despite its curved geometry, the U-lateral closely matches or exceeds straight-lateral efficiency on a per-foot basis.
5. Comparative Analysis and Current Research
With several field trials and modeling studies available, U-shaped wells can now be systematically evaluated against conventional horizontal wells, particularly in terms of fracture propagation and production performance over time.
5.1. Fracture Extent and Geometry
Simulations indicate that horseshoe wells can achieve fracture networks comparable to (or even exceeding) those of two separate wells. One modeling study calibrated to the Bakken showed that U-shape laterals tend to generate longer fractures into previously undrained regions, thanks to the staged stimulation from heel to toe [
18]. As the frac job moves around the U-turn, the initial leg’s stress shadow diminishes, allowing the second leg’s fractures to grow unimpeded into virgin rock. In effect, the horseshoe layout can reduce shadowing that might occur if two parallel wells were fractured simultaneously. Field evidence from microseismic and pressure data are limited so far, but there are anecdotal reports of robust fracture growth on both sides of U-wells. For example, Shell observed no significant fracture hits between the two laterals (consistent with the spacing and unstimulated curve mitigating interference). In terms of effective fracture length, the integrated modeling by [
18] found U-well fractures reaching slightly farther on the tail end, contributing to efficient drainage comparable to two independent wells. Thus, concerns that the 180° turn or shared wellbore might stunt fracture growth have not materialized; on the contrary, the horseshoe geometry can harness stress redistribution to maximize fracture extent.
5.2. Production Performance—Observed (≤5 Years) vs. Simulated (10–30 Years)
Long-term production remains the primary measure of success for any unconventional well design. Available early production data and extended 30-year simulated forecast suggest that a horseshoe well can produce roughly equivalent oil/gas volumes as the pair of horizontals it replaces. Chesapeake, for example, reported that its U-lateral in Eagle Ford met production expectations, coming within a few percent of the area’s type curve (which was based on two separate wells). In that case, the U-well’s initial production and decline mirrored that of offset single laterals, confirming that no productivity was sacrificed by the U-turn design. To quantify this, researchers simulated 30-year recovery forecast from U-wells vs. conventional wells in identical reservoir settings. In one scenario with 1000–1200 ft lateral spacing, a single U-well delivered ~97% of the cumulative oil that two separate wells would, a gap of only ~3% [
18]. This implies that horseshoe wells can maintain production levels even in densely developed patterns, while drastically cutting the number of wellbores. The 30-year simulation comparison found that two U-shape wells vs. four horizontals had nearly identical performance in terms of total recovery. This slight difference was attributed to fracture sequencing and stress interference timing—essentially the second leg of the U-well started slightly later than a parallel well, causing a minor delay in drainage. In tighter spacing scenarios (e.g., replacing four close-spaced wells with two U-wells at 500–600 ft spacing), the model showed no difference in 10-year cumulative output between the U-wells and the four independent wells [
18]. This simulation study remains conditional and limited on their calibration windows (≤5 years of history; any divergence beyond this horizon will require future re-calibration), geomechanics (fracture growth governed by standard DFN/complex-frac modeling; anisotropy and stress evolution are simplified relative to reality), curve stimulation (base case does not perforate the bend); interference (results depend on spacing; if legs are tighter than modeled, earlier interference can increase apparent decline rates for both U-wells and conventional wells).
Field production over a few years supports these findings: Shell’s horseshoe well was part of a four-well pad that peaked at over 5000 BOE/D, with the U-well contributing as expected for its lateral length. Likewise, the refractured U-turn well by Expand (formerly Chesapeake) in Eagle Ford added about 310 Mbo in under 4 years, comparable to drilling a new horizontal in that mature reservoir.
5.3. Anticipated Long-Term Differences vs. Conventional Wells
For equal completed footage and spacing, terminal decline D∞ (the late-time exponential decline rate once boundary-dominated flow is reached; governed mainly by drained volume and external pressure support) should be similar; apparent b (the hyperbolic decline exponent, which controls the curve; sensitive to SRV complexity and interference) may be slightly lower for U-wells where aggregate SRV (stimulated rock volume) is larger and stress shadow sequencing is favorable, while tight spacing/communication can steepen early–mid decline and raise Di (the initial decline rate immediately post-IP/cleanup; driven by near-well connectivity, interference, and drawdown strategy).
5.4. Block-Scale Development with U-Shaped Wells (Spacing, Interference, Strategy)
At pad scale, a U-well is two parallel laterals on one wellhead. The two design knobs are internal leg spacing and bend placement. Keep internal spacing consistent with the pad’s standard spacing and leave the bend unperforated; avoid positioning the bend opposite the most frac-sensitive intervals of neighbors.
Interference control: Run outside-in zipper, alternate stage order across legs, rotate perforation phase, keep limited-entry tight, and insert time lags where the rock is stress-reactive; follow standard parent–child sequencing (treat outer rows first, move inward), and throttle or skip facing stages if hit indicators rise.
Pad patterns: Use edge-capture along lease boundaries and chevron layouts aligned to SHmax to preserve spacing and keep infill options open.
Development impact: U-wells hold completed footage per area while cutting pads and verticals; where spacing and sequencing are disciplined, pad-level rate and EUR per completed foot are comparable to straight-lateral programs with the expected CAPEX/logistics upside.
Surveillance: Deploy DAS/DTS on a representative well and toe/heel gauges across the bend and mid-laterals; track frac-hit signatures, cluster efficiency, and rate-normalized pressure, then adjust stage order/phase or next-row spacing based on what the diagnostics show.
6. Environmental Impact Quantification and Sustainability Assessment
This part of the review presents a comprehensive lifecycle assessment (LCA) of U-shaped well technology compared to conventional two 1-mile lateral drilling approaches in unconventional oil and gas development. The analysis evaluates environmental impacts across six lifecycle phases: drilling operations, completion activities, surface infrastructure, transportation and logistics, production operations, and end-of-life decommissioning.
Results demonstrate significant environmental benefits of U-shaped wells, including a 29.3% reduction in total carbon footprint (2210 t CO2e), 15.8% decrease in water consumption (equivalent to 10,760 barrels), and 50% reduction in surface land disturbance (4.25 acres).
Economic analysis reveals 25.9% cost savings (
$3.7 million) while maintaining equivalent production performance. The study employs LCA standards, employing a cradle-to-grave approach that encompasses all phases of well development and operation [
57], and incorporates data from multiple North American shale basins. Carbon intensity analysis shows sustained environmental benefits throughout the well lifecycle, with cumulative emissions intensity improving by 29.6% (5.0 vs. 7.1 kg CO
2e/bbl). These findings support U-shaped well technology as a sustainable approach to unconventional resource development, delivering enhanced economic performance while minimizing environmental impact. Data sources include industry operator reports, regulatory databases, the peer-reviewed literature, and established emissions factors from EPA and API guidelines [
57,
58].
6.1. Comparison Framework
The analysis evaluates two distinct drilling strategies: (1) conventional development using two separate 1-mile lateral wells with independent surface infrastructure, and (2) U-shaped well technology utilizing a single wellbore with 180-degree curved section accessing equivalent reservoir volume. Both approaches are assumed to yield similar production performance and estimated ultimate recovery, ensuring that environmental impacts are assessed based on operational efficiency rather than productivity differentials.
Conventional wells are modeled based on industry-standard practices for horizontal drilling in major North American shale basins, including Permian, Eagle Ford, Bakken, and Marcellus formations [
59,
60]. U-shaped well parameters are based on documented field applications and technical specifications from operators including Vital Energy, Chesapeake Energy, and Comstock Resources [
17,
61].
Lifecycle assessment provides a systematic framework for evaluating environmental impacts across all phases of industrial operations, from raw material extraction through end-of-life disposal [
62]. Previous LCA studies of unconventional oil and gas operations have identified drilling and completion activities as primary contributors to carbon emissions, water consumption, and land disturbance [
63,
64]. These studies provide methodological foundations for assessing U-shaped well technology but have not specifically addressed the environmental implications of consolidated drilling approaches.
6.2. Data Collection and Analysis
Environmental impact data were gathered from a combination of operator sustainability reports, state-level regulatory databases, and peer-reviewed literature focused on unconventional oil and gas operations [
62,
63,
64]; carbon emissions calculations employ Environmental Protection Agency (EPA) emissions factors for diesel fuel, natural gas, and electricity consumption, with methane emissions based on recent measurement studies [
58,
65].
Water usage data incorporate drilling fluid requirements, hydraulic fracturing volumes, and produced water management based on basin-specific studies and operator reports [
63,
64]. Land use impacts include direct surface disturbance from well pads, access road requirements, pipeline infrastructure, and waste management facilities. The economic component incorporates capital expenditures (CAPEX), operational expenses (OPEX), and project cycle times derived from industry cost databases and company-reported data.
Economic data sources include drilling and completion costs from operator 10-K filings and investor presentations from companies with documented U-shaped well experience including Vital Energy, Chesapeake Energy, and Comstock Resources covering 2019–2024. State regulatory databases including Texas Railroad Commission, North Dakota Industrial Commission, and Pennsylvania Department of Environmental Protection provided production and cost benchmarking data. Industry consulting reports from Enverus Intelligence Research and Rystad Energy supplied cost benchmarks normalized by lateral length. Commodity pricing data were sourced from NYMEX futures contracts and regional basis differentials from established price reporting agencies [
57,
65].
All economic data underwent quality control including cross-referencing between multiple sources, normalization to consistent units and time periods, and validation against published industry benchmarks. Economic analysis incorporates uncertainty through Monte Carlo simulation with key parameters including drilling cost uncertainty (±15%), completion cost uncertainty (±12%), commodity price volatility (±20%), and production performance uncertainty (±10%) based on historical variability.
6.3. Carbon Footprint Analysis
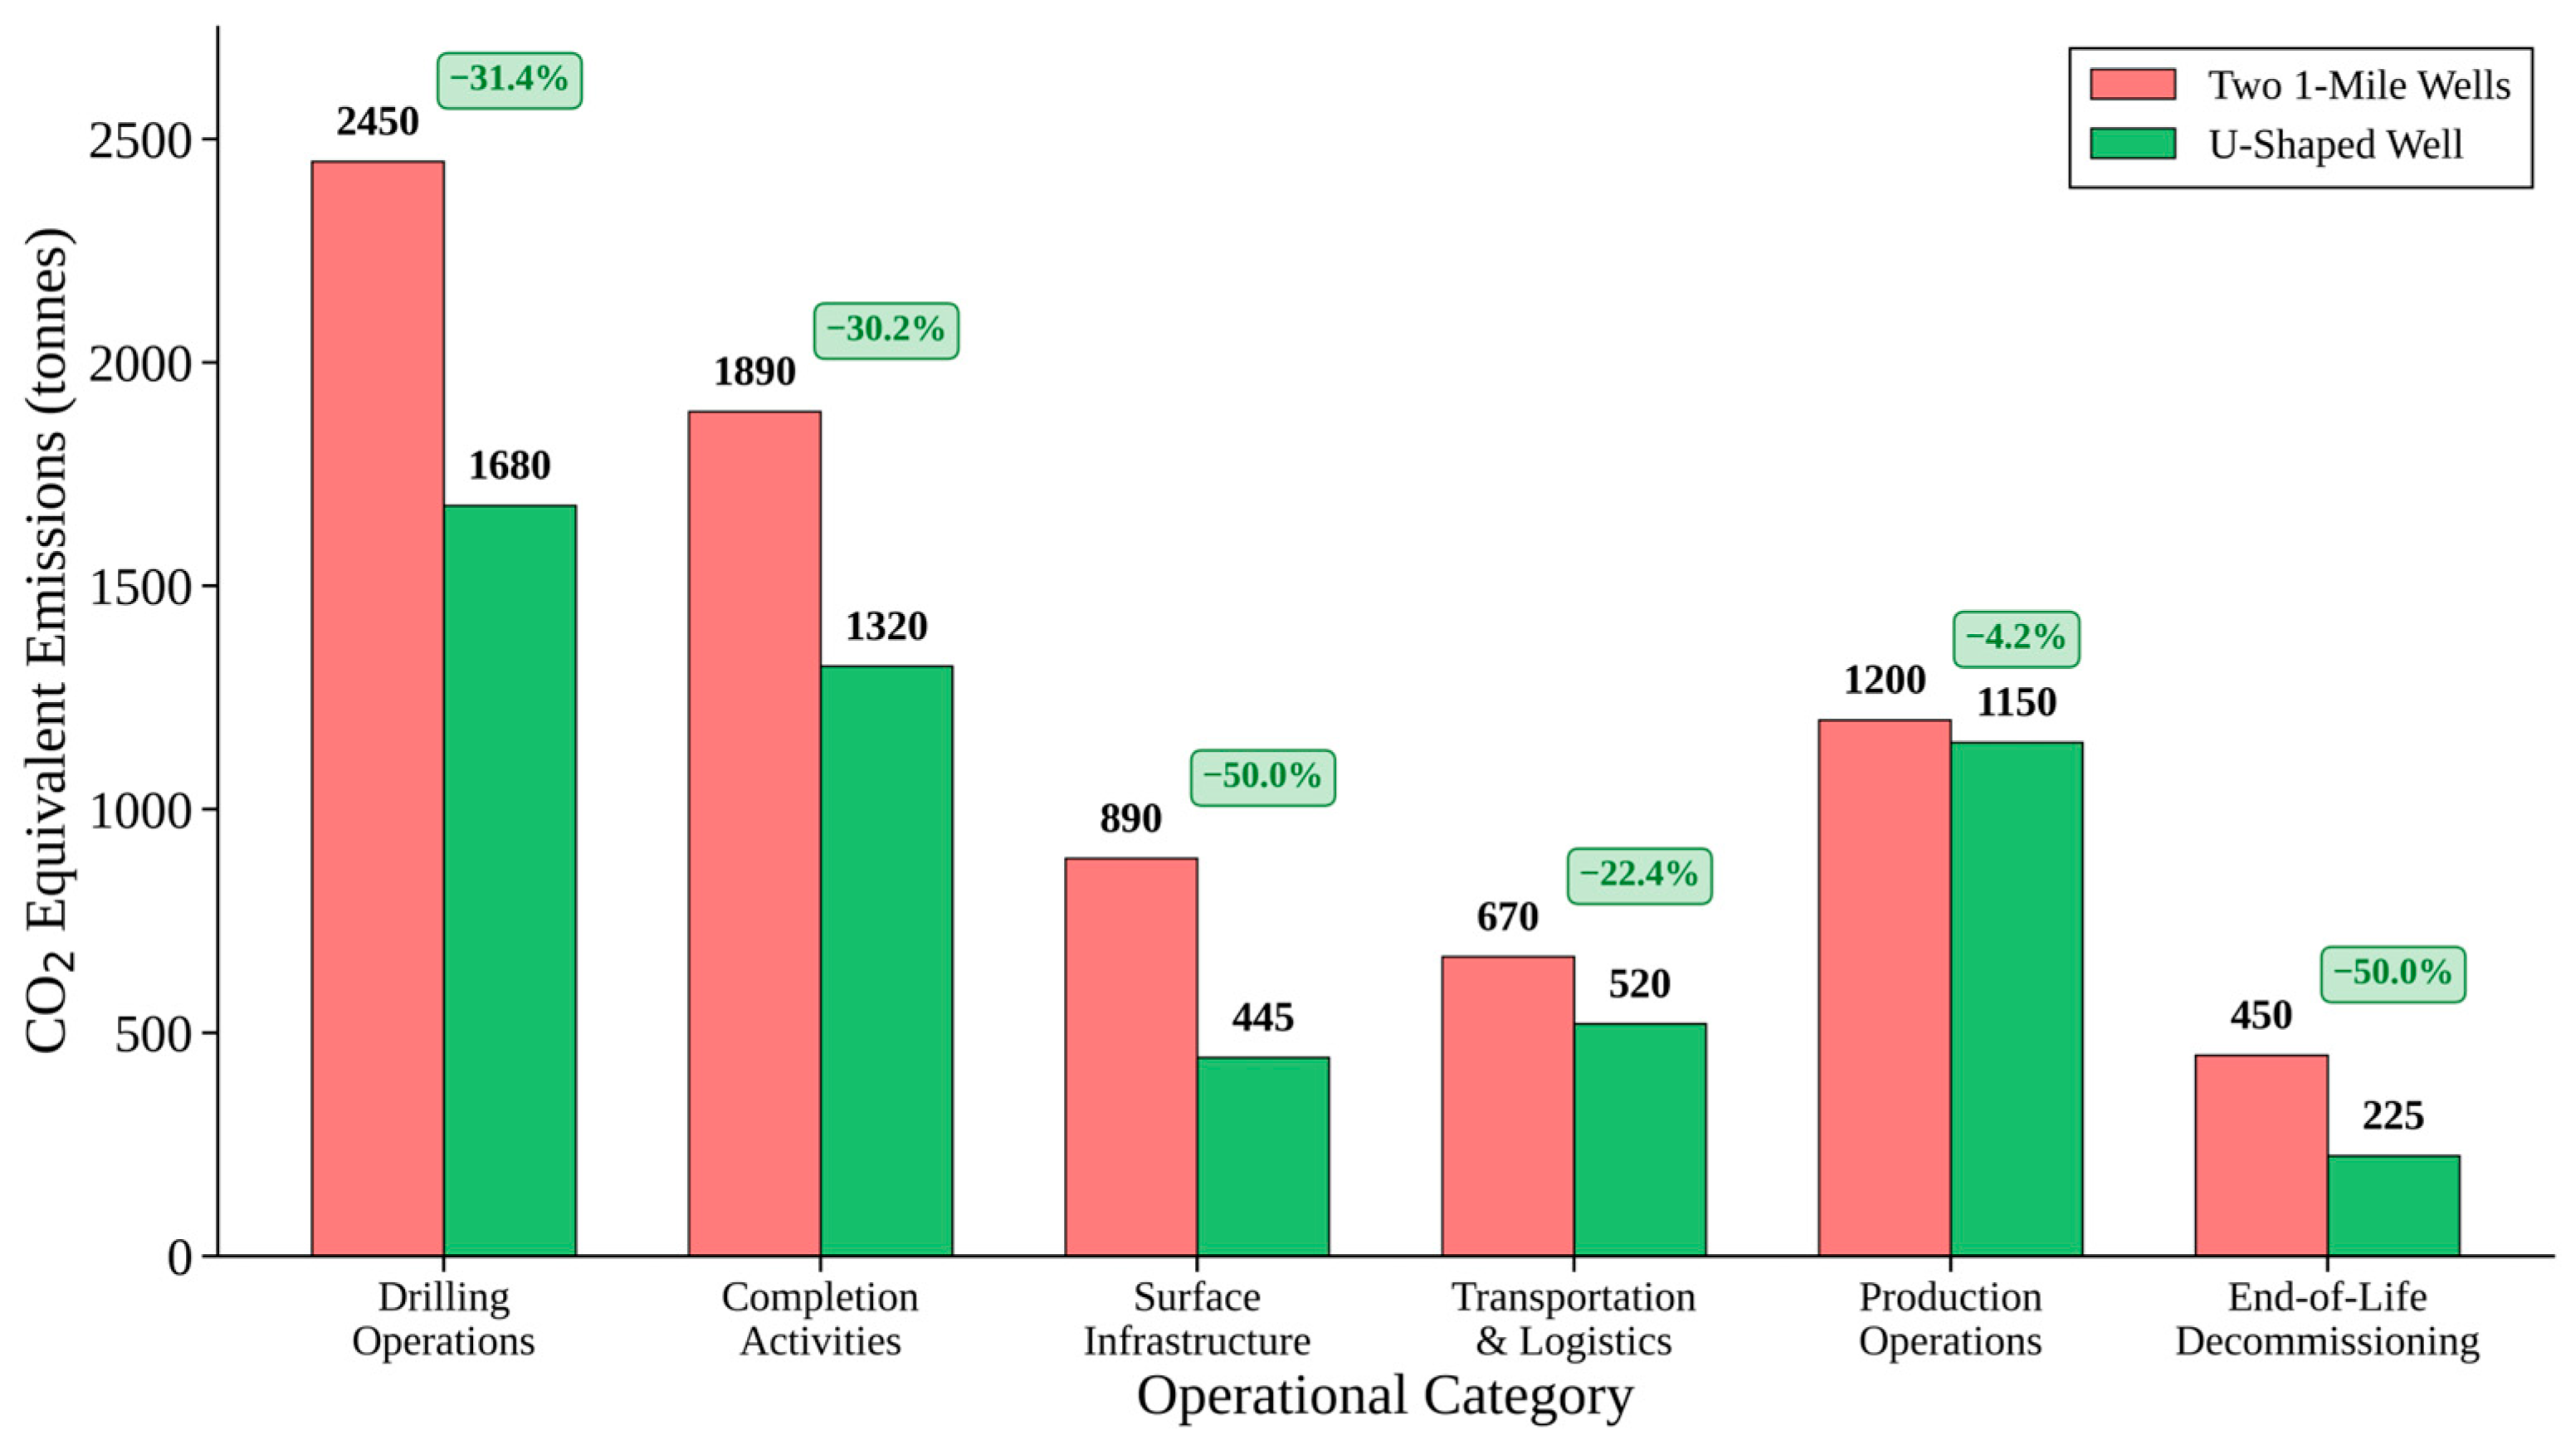
Comprehensive carbon footprint analysis reveals significant environmental benefits of U-shaped well technology across all lifecycle phases (
Figure 14). Total greenhouse gas (GHG) emissions for conventional two 1-mile wells amount to 7550 t CO
2e compared to 5340 t CO
2e for U-shaped wells, representing a 29.3% reduction equivalent to 2210 t CO
2e per project. This reduction is achieved through elimination of duplicate operations and consolidated infrastructure requirements. Drilling operations contribute the largest absolute emissions reduction (770 t CO
2e, 31.4% decrease), primarily due to elimination of duplicate vertical sections and associated diesel fuel consumption. The single vertical section in U-shaped wells reduces drilling time by approximately 30%, corresponding to proportional reductions in rig fuel consumption and associated emissions [
64]. Completion activities show substantial improvements (570 t CO
2e, 30.2% reduction) through optimized equipment utilization and reduced mobilization requirements.
Surface infrastructure demonstrates the highest percentage reduction (50.0%, 445 t CO
2e) due to elimination of duplicate facilities including separators, tanks, and electrical systems. This finding aligns with previous studies indicating that surface infrastructure represents a significant component of total project emissions [
58,
63]. Transportation and logistics show moderate improvements (22.4%, 150 t CO
2e) through reduced equipment movement and personnel transport requirements.
The correlation between cost savings demonstrated in
Figure 9 and environmental benefits shown in
Figure 14 reveals that operational efficiency improvements simultaneously deliver economic and environmental value. The
$10 million drilling and completion cost savings per well pair directly corresponds to the 29.3% carbon footprint reduction (2210 t CO
2e), demonstrating that the same operational consolidation driving cost reductions also generates proportional environmental benefits. Specifically, the drilling cost reduction in
$2.3 million correlates with 770 t CO
2e emissions reduction in drilling operations, while the
$1.3 million completion cost savings align with 570 t CO
2e reduction in completion activities.
This alignment indicates that U-shaped well technology achieves environmental improvements through operational efficiency rather than requiring additional environmental mitigation costs. The elimination of duplicate operations that generates the economic savings simultaneously produces the environmental benefits, with the single vertical section reducing both drilling costs and drilling-related emissions, while consolidated completion operations save money and prevent completion-related emissions. This demonstrates that environmental benefits are achieved as a direct result of the same efficiency improvements that drive economic performance.
6.4. Water Usage
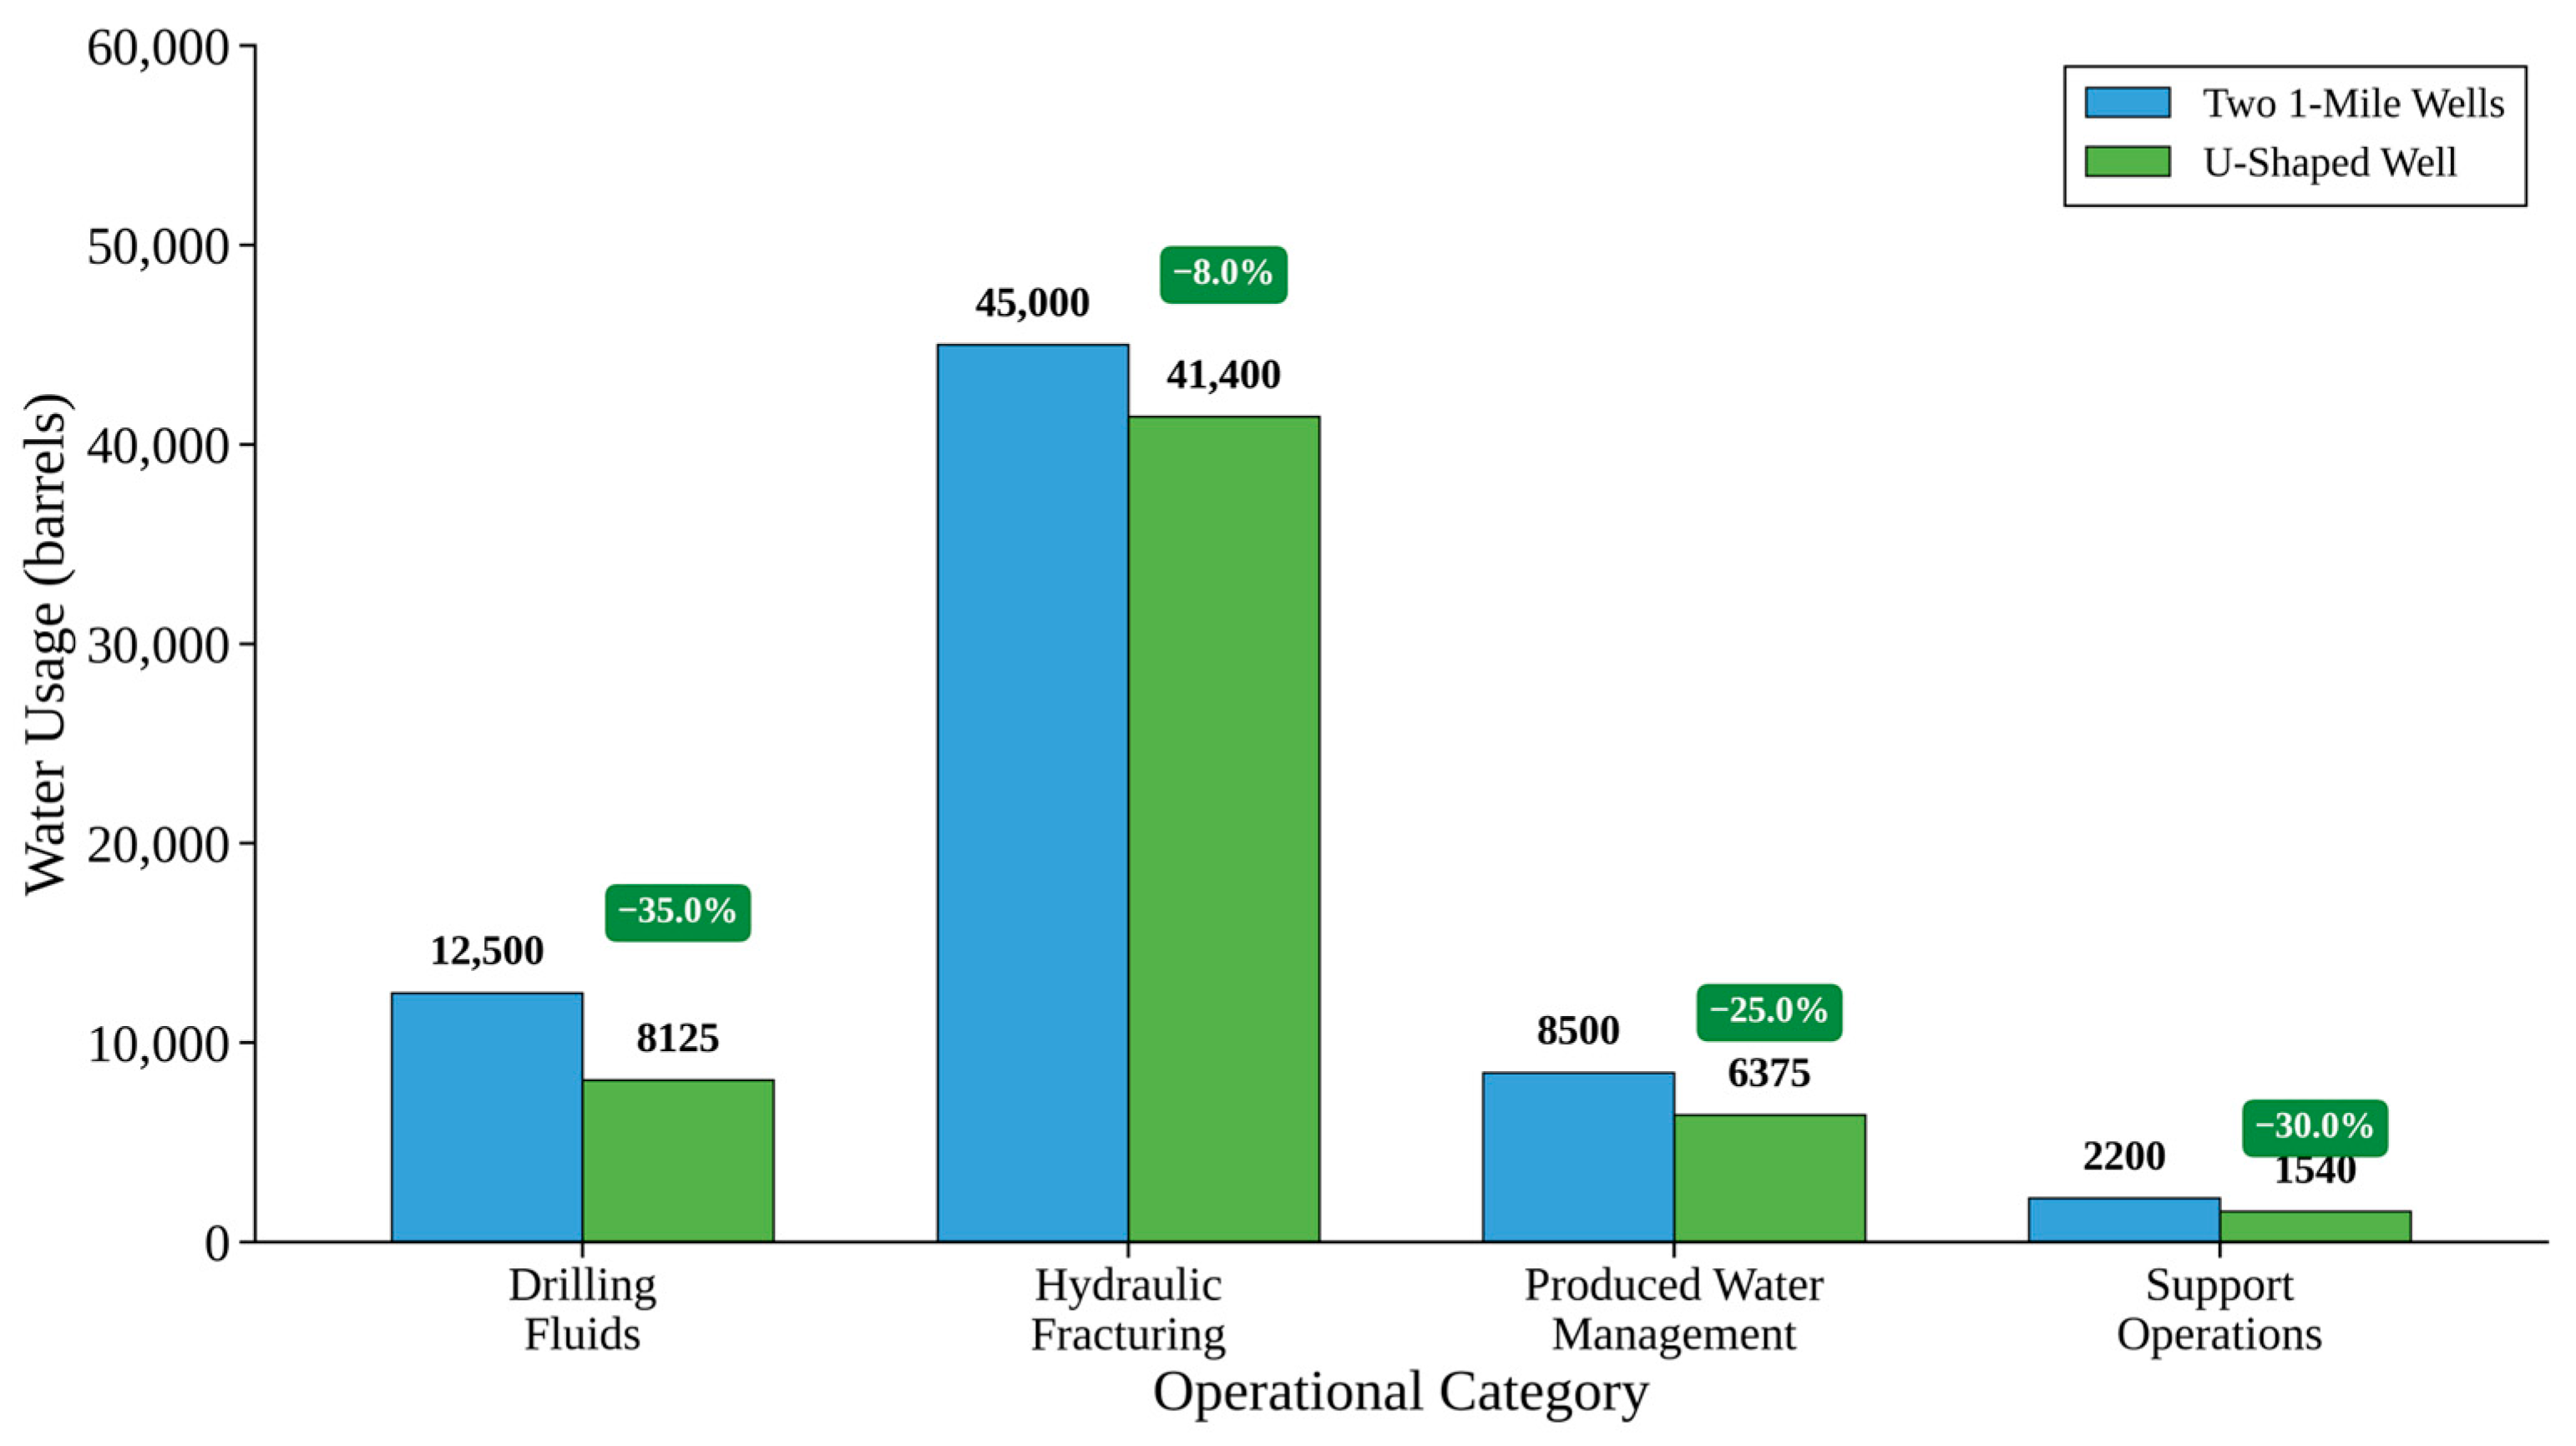
Water resource utilization analysis demonstrates notable conservation benefits across multiple operational categories (
Figure 15). Total water consumption declines from approximately 68,200 barrels for conventional wells to 57,440 barrels for U-shaped wells, representing a 15.8% reduction equivalent to 10,760 barrels saved per project. This improvement stems from operational consolidation and more efficient completion design. Drilling fluid requirements show the largest percentage reduction (35.0%, 4375 barrels) due to single vertical section eliminating duplicate mud systems and circulation volumes. This finding is consistent with established relationships between drilling footage and fluid requirements [
63]. Hydraulic fracturing shows modest reduction (8.0%, 3600 barrels) through optimized completion design and reduced equipment mobilization water usage.
6.5. Land Use Impact
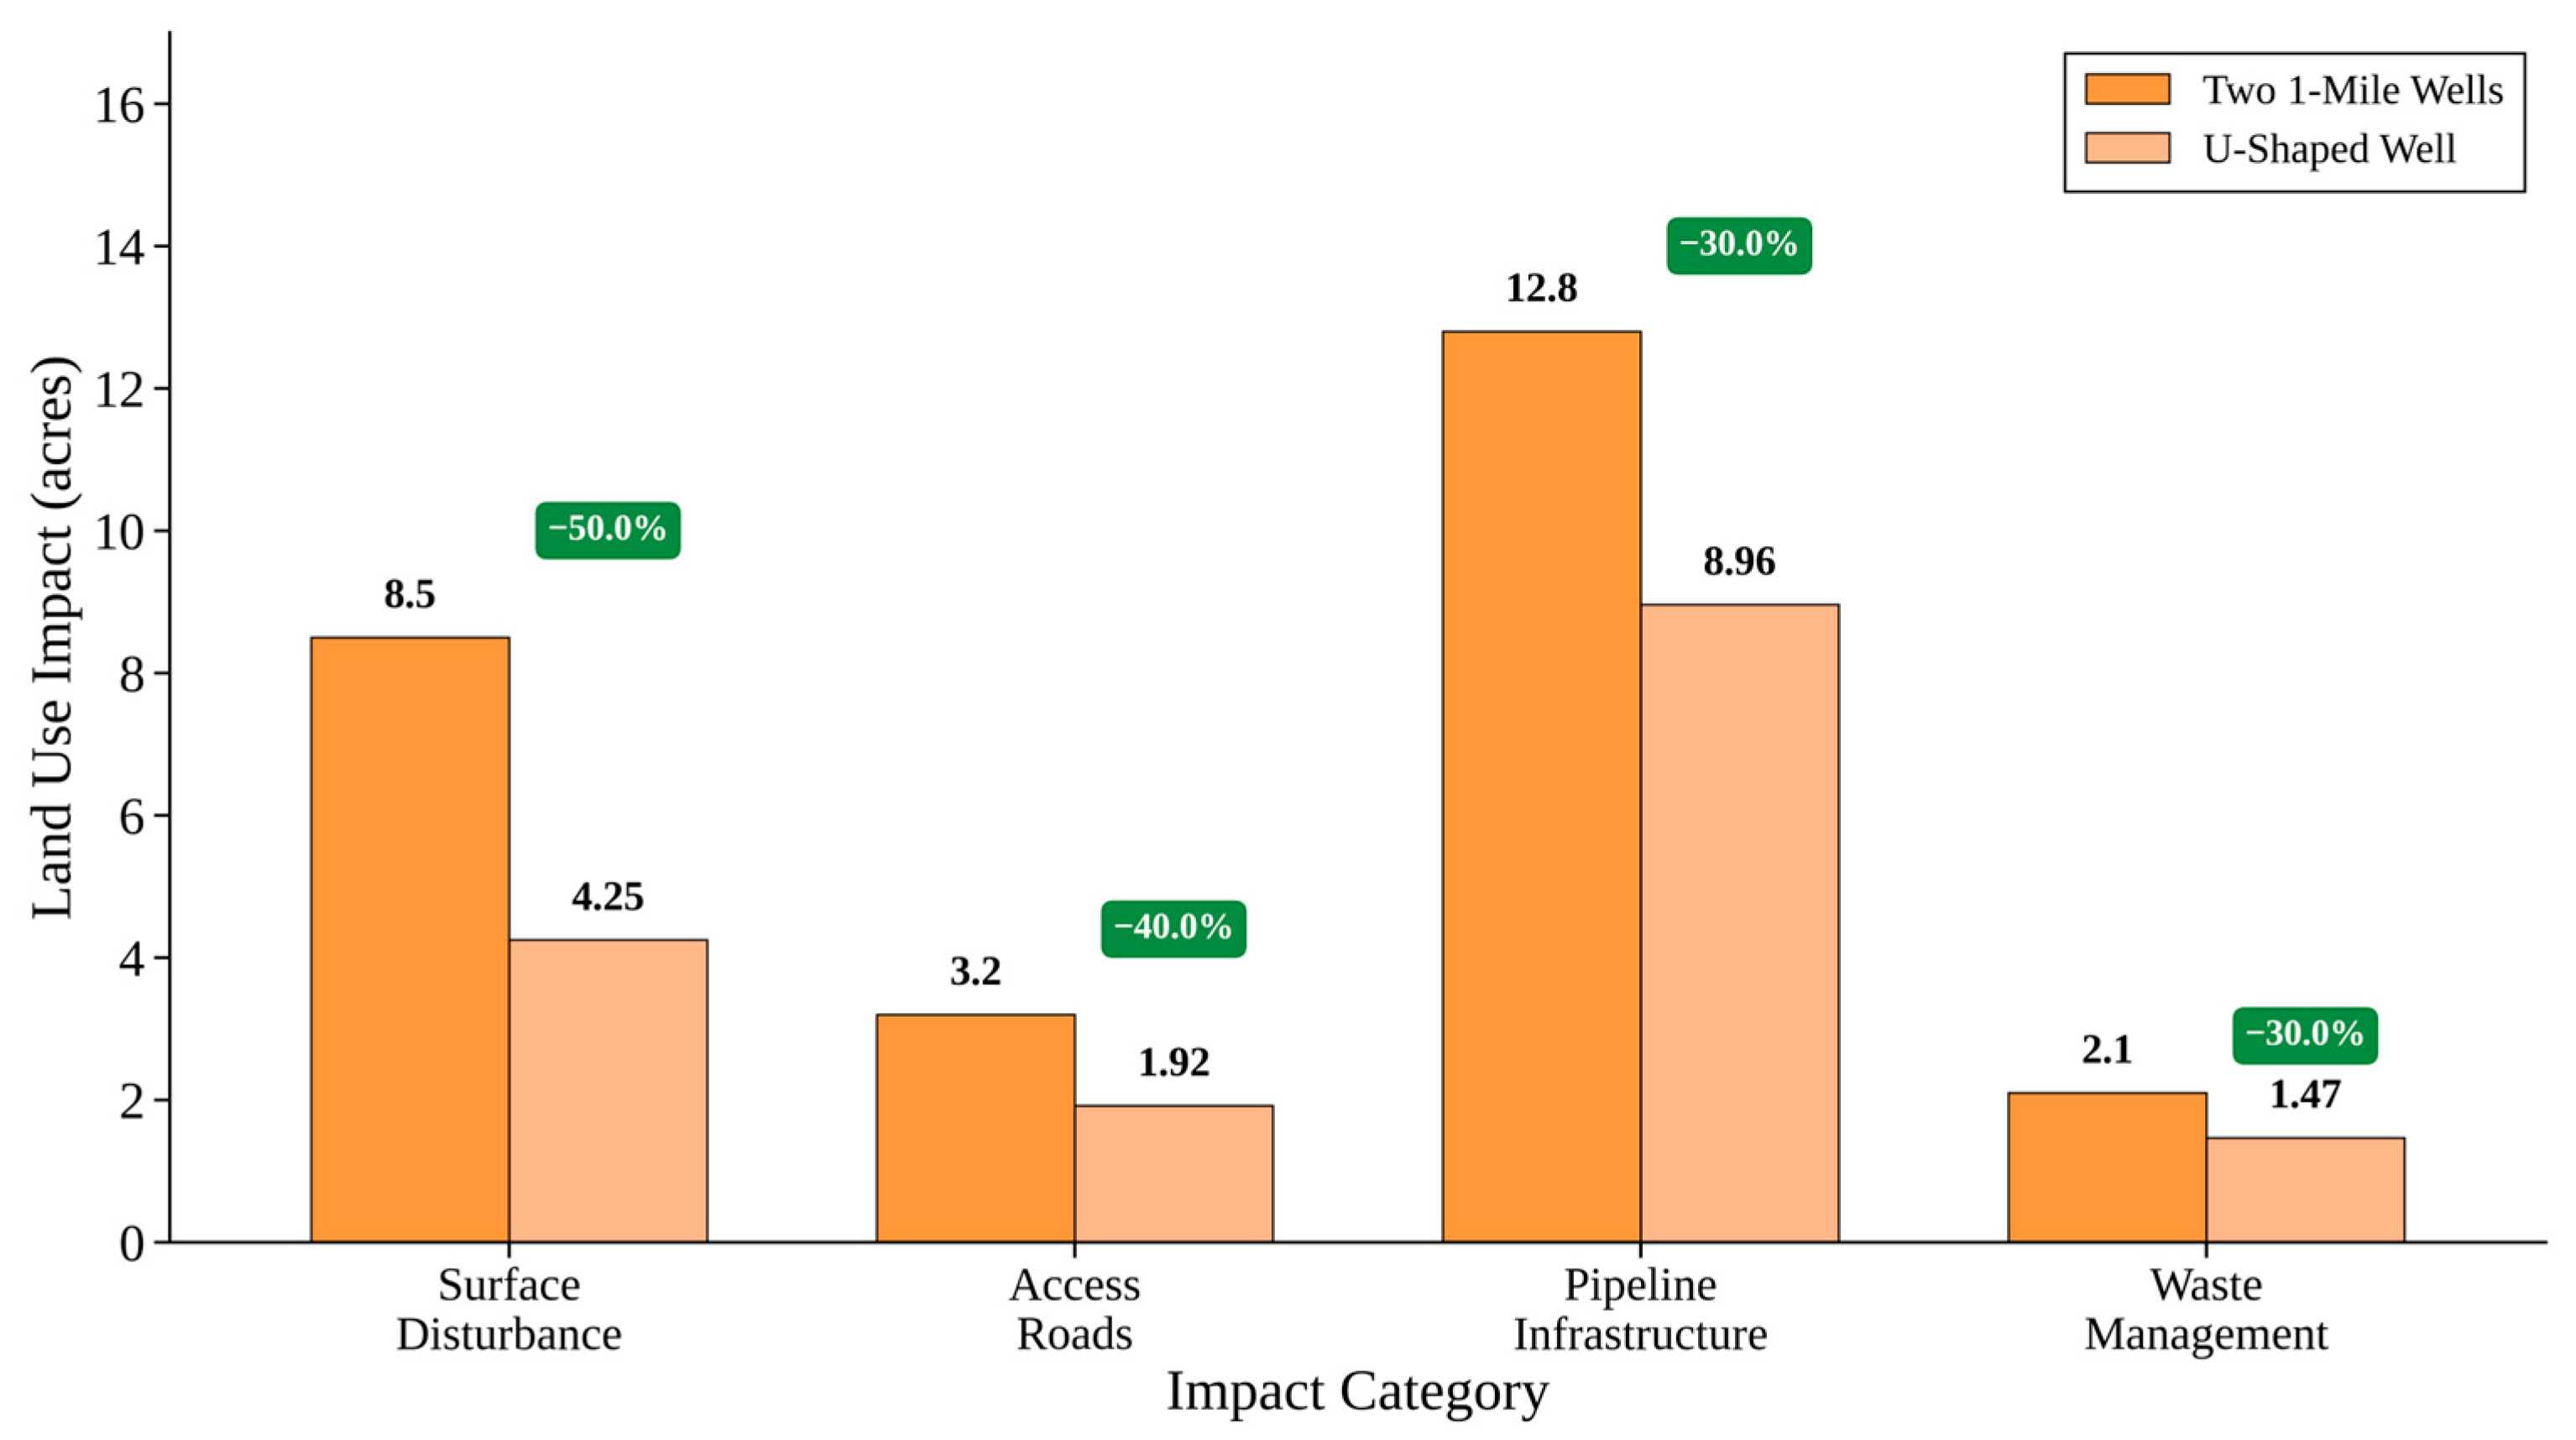
Land use impacts demonstrate substantial improvements across all categories (
Figure 16). Overall surface footprint decreases by 50% (4.25 acres saved) through elimination of duplicate well pads and consolidated operations. Access road requirements are reduced by 40% (1.28 miles) due to single-location operations, while pipeline infrastructure decreases by 30% (3.84 miles) through the simplified gathering system design. These findings are consistent with prior industry studies indicating that surface footprint represents a primary environmental concern in unconventional development [
57].
6.6. Emissions Source Analysis and Carbon Intensity
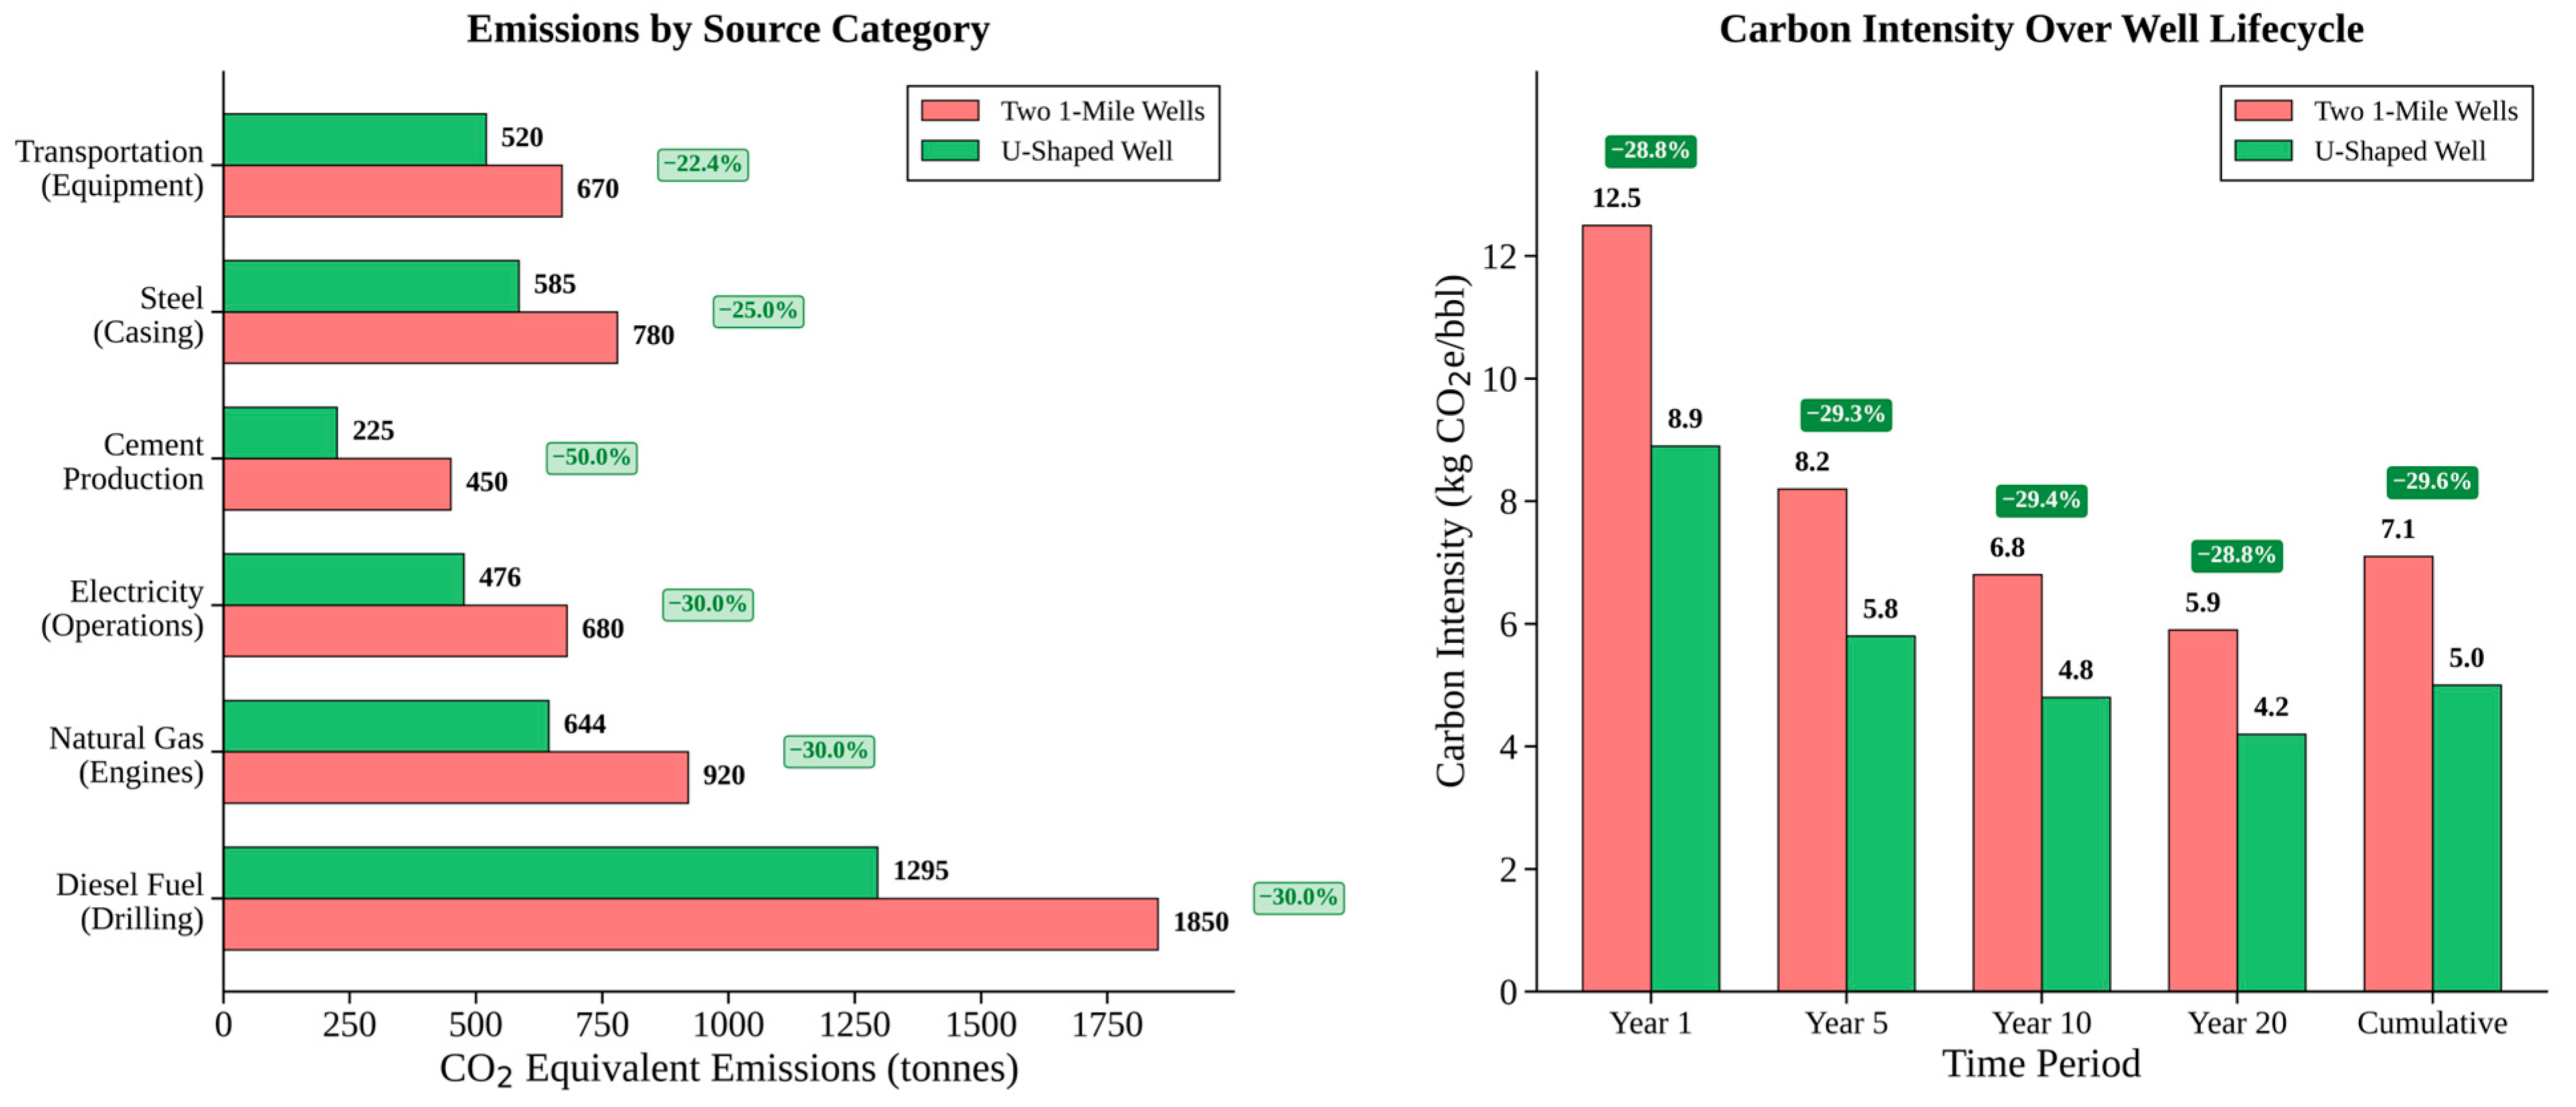
Detailed emissions source analysis identifies specific contributors to carbon footprint improvements (
Figure 17, left panel). Diesel fuel consumption represents the largest absolute reduction (555 t CO
2e) due to decreased drilling rig operation time. Natural gas engine emissions decrease by 276 t CO
2e through reduced completion equipment operation, while cement production shows 225 t CO
2e reduction due to single casing program requirements.
Carbon intensity analysis reveals sustained environmental benefits throughout the well lifecycle (
Figure 17, right panel). Year 1 intensity improves from 12.5 to 8.9 kg CO
2e/bbl (28.8% reduction), while cumulative lifecycle intensity decreases from 7.1 to 5.0 kg CO
2e/bbl (29.6% improvement). This sustained performance indicates that environmental benefits persist throughout production operations rather than being limited to construction phases.
The carbon intensity improvement exceeds total emissions reduction percentage due to slightly enhanced production efficiency in U-shaped wells through optimized completion design and reduced surface losses. This finding suggests that environmental and production benefits are synergistic rather than competing objectives [
58,
62].
6.7. Economic and Environmental Performance Integration
Economic analysis demonstrates that environmental benefits align with cost savings rather than requiring trade-offs (
Figure 18). Total project costs decrease from
$14.3 million for conventional wells to
$10.6 million for U-shaped wells, representing 25.9% savings (
$3.7 million). Capital cost reductions are achieved through elimination of duplicate equipment and infrastructure while maintaining equivalent production capacity.
Environmental performance assessment across multiple impact categories shows consistent U-shaped well advantages (
Figure 19). Carbon footprint, land disturbance, and noise pollution demonstrate the largest improvements, while water usage and waste generation show moderate benefits. Air quality and overall environmental performance indicate meaningful but smaller improvements due to similar production operations and emissions control requirements.
The integration of economic and environmental benefits strengthens the business case for adopting U-shaped well technology while addressing sustainability concerns. This alignment contrasts with many environmental technologies that require economic trade-offs, suggesting that operational efficiency improvements can simultaneously deliver environmental and economic value [
66,
67]. Notably, the overall sustainability grade improvement from C+ to A- indicates substantial advancement in environmental performance that could support enhanced stakeholder acceptance and regulatory approval processes.
Despite the clear benefits, this analysis acknowledges limitations, including uncertainties of ±10–15% in emissions and ±20% in water usage estimates due to geological, operational, and regulatory variations, as such ongoing site-specific validation and long-term environmental monitoring are crucial to confirm and refine these initial findings.
7. Gaps, Future Directions, and Implications
7.1. Research Gaps
While early results from U-shaped well deployments are promising, several important technical and operational uncertainties remain. Addressing these gaps through focused research and field validation will be essential to unlocking the full potential of horseshoe well technology.
Long-term Performance and Integrity Assessment: The most critical research gap is the limited field data over the long term—the oldest horseshoe well (Shell’s) has only about 4–5 years of production history. Long-term effects such as different decline rates (if any) or wellbore integrity issues in the curve over decades are not yet fully known. To address this limitation, accelerated aging test methodologies should be implemented including laboratory-scale wellbore integrity testing under cyclic pressure and temperature conditions simulating 20–30 years of production operations [
68]. Accelerated corrosion testing of casing materials in the curved section using electrochemical methods and high-temperature/high-pressure autoclaves can predict long-term metallurgical performance [
69]. Additionally, finite element modeling of stress concentration and fatigue accumulation in the curved wellbore section under repeated pressure cycling can provide predictive insights into long-term structural integrity [
70]. Continued monitoring of existing U-wells will be important to validate the 30-year model predictions.
Another technical gap lies in the stimulation of the curved segment. Simulations suggest that stimulating the 180° curved segment could enhance ultimate recovery, but field-proven methods for effectively treating this area are lacking. Research into oriented perforating, alternate fluid diversion, or novel completion techniques could unlock this potential. There is also ongoing work to incorporate rock anisotropy and complexity into simulations more rigorously. Additionally, proppant behavior in the 180° turn could be further studied—e.g., does proppant accumulate at the curve, and could that pose any long-term conductivity issues? So far, field reports are positive, but a detailed analysis or lab experiment on proppant transport through a curved wellbore could be valuable.
Another research needed is drillout challenges in extended curved sections. Plug drillout operations in U-shaped wells present unique difficulties. Coiled tubing friction increases significantly in curved laterals, often resembling the mechanical load of a 15,000-ft straight well. Managing plug milling through the turn while avoiding coiled tubing lockup or fatigue failure is a major operational hurdle. Innovations such as friction reducers, extended-reach CT tools, or dissolvable plug systems could reduce these risks but are not yet widely field-proven in U-turn geometries.
Moreover, long-term production from U-shaped wells will eventually rely on artificial lift, but most conventional lift systems (e.g., gas lift, gas-assisted plunger lift, jet pumps, ESPs, rod pumps) are not designed for 180° curved trajectories. Placement of lift equipment, fluid fallback control, and gas handling are particularly challenging. Field trials of lift solutions such as sidetracked ESP installations, dual injection gas lift, or annular lift from toe-to-heel are needed to determine feasible strategies and guide future lift optimization. The bend imposes multiphase hydraulic penalties (extra frictional Δp, liquid holdup/slugging), limited straight set-depth, and integrity/wear risks on rods/cables/control lines. Consequently, rod/PCP face dogleg-induced wear/buckling; plunger risks hang-ups at the bend; ESP is constrained by set-depth and cable routing and is prone to gas-lock; and single-point gas lift can mal-distribute between legs and fail to unload the far toe. Early U/W-well interventions and long U-turn case studies show operational feasibility but underscore the need for purpose-built AL designs and validation in horseshoe wells.
Lastly, more basin-specific studies (similar to the Bakken modeling) would help generalize findings. Filling these gaps through empirical data collection and high-fidelity modeling will improve confidence in horseshoe well design across all settings.
7.2. Technical Challenges and Future Outlook
While the technique is proven, it presents some technical challenges. The 180-degree turn increases torque and drag, which must be managed when running casing and completion equipment downhole. A 10,000-foot horseshoe well can create friction comparable to a 15,000-foot straight lateral. Despite these hurdles, industry leaders are confident that risks are manageable and will decrease as crews gain more experience. The benefits—cost savings, unlocking stranded acreage, and reducing the environmental footprint with fewer well pads—are driving further innovation. Looking ahead, some companies are discussing the possibility of drilling even longer wells, such as 15,000-foot horseshoes [
55].
7.3. Future Directions for Optimization
With the concept proven, the next steps involve optimizing horseshoe well design and operations. One direction is extending the lateral lengths even further. Currently, the practical limit encountered is the ability to drill out frac plugs and manage coiled tubing in long laterals. Shell noted that 20,000-ft total lateral length (two 10k laterals) may be at the edge of feasibility with today’s coiled tubing technology. Future advances like stronger coiled tubing, better friction reducers, or entirely plug-less completion techniques (e.g., dissolvable plugs or single-entry ball drop systems) could allow U-wells with 15,000+ ft laterals on each side. This would be especially useful in plays like the Permian where reservoir quality supports long laterals. Another optimization area is fracturing strategy: for example, deciding the sequence of fracturing each lateral. Should an operator complete one lateral fully before starting the second, or alternate stages between laterals to minimize instantaneous stress shadow? Some have proposed simultaneous fracturing of both legs (with separate fleets) if interference is minimal, to save time. These strategies need evaluation for their impact on fracture growth and well performance. Well spacing and patterns is another topic that can be explored in future—as horseshoe wells become more common, one could envision a development where pads drill U-wells in a chevron pattern (adjacent leases each with a U-turn reaching toward the other’s boundary); optimizing spacing between such wells (both within the U and between different U’s) will be important to avoid interference.
From a technological standpoint, further integration of real-time data and modeling could benefit U-wells. For instance, using real-time downhole telemetry while drilling the curve can inform adjustments in trajectory to maintain ideal dogleg severity and minimize damage. During fracturing, deploying diagnostics like fiber-optic sensing along the lateral could help observe how far the proppant is getting around the turn or how evenly clusters are treating between the two legs, allowing on-the-fly adjustments. Future horseshoe wells might also leverage improved junction designs if someone attempts a multi-level horseshoe (e.g., a “double-decker” U with laterals in two different stratigraphic layers). Although current U-wells avoid junctions, a hybrid could emerge combining a U-turn with a multilateral branch in another zone—new completion tools would be needed to isolate and produce such complex configurations.
7.4. Broader Implications
The implementation of horseshoe (U-shaped) wells offers a compelling strategy for maximizing hydrocarbon recovery while minimizing development cost. Economically, it offers a way to extract more hydrocarbons with fewer wells, directly reducing capital and operating expenditures per unit of production. This can extend the life of mature basins; as prime acreage is drilled out, operators can turn to smaller or oddly shaped parcels and still drill long laterals via U-turns, making previously sub-economic projects viable. It effectively increases the drilling inventory for companies without requiring land acquisitions—a notable advantage as consolidation in the shale industry leaves fewer opportunities for acreage swaps. Environmentally and socially, fewer wells mean reduced surface footprint, less traffic and noise, and potentially lower greenhouse emissions per barrel (since drilling rig and fracturing hours are reduced for the same production). For regulators and landowners, the horseshoe approach could be favorable as it concentrates operations on a single pad to drain a larger area. We may see regulatory frameworks adapt to explicitly allow U-wells across lease lines via production-sharing agreements, given the mutual benefits. Internationally, while lease constraints are less of an issue, the methodology could influence how field developers think about maximizing contact. For example, national oil companies could adopt the philosophy to use U-shaped or similar multilateral wells to minimize well count in large-scale projects, which aligns with goals of efficiency and reduced environmental impact.
