Article

Multiscale 3D CFD Modeling of CO2 Methanation over Ni/Al2O3 in a Lab-Scale Sabatier Fixed-Bed Reactor

by
Alexandru-Constantin Bozonc
,
Vlad-Cristian Sandu
*,
Alexia-Maria Buzila
and
Ana-Maria Cormos
Faculty of Chemistry and Chemical Engineering, Babes-Bolyai University, Arany Janos 11, 400028 Cluj-Napoca, Romania
*
Author to whom correspondence should be addressed.
Fuels 2025, 6(4), 79; https://doi.org/10.3390/fuels6040079
Submission received: 21 July 2025 / Revised: 21 August 2025 / Accepted: 4 October 2025 / Published: 14 October 2025

Abstract

A multiscale 3D CFD model of CO2 methanation over Ni/Al2O3 was developed in COMSOL Multiphysics 6.3 for a lab-scale isothermal fixed-bed Sabatier reactor and validated against published data. The multiscale approach integrated bulk convection–diffusion, fluid flow, and pressure distribution with intraparticle diffusion–reaction phenomena coupled with Langmuir–Hinshelwood–Hougen–Watson-based kinetics, thus solving mass-transfer limitations without empirical effectiveness factors. Model validation was carried out by (i) kinetics, (ii) reactor performance, and (iii) hydrodynamics. Simulation results showed strong diffusion-dominated species transport at the bed entrance that lessened downstream as partial pressures decreased and products accumulated, resulting in a diffusion-relieved regime near the outlet. Sensitivity studies identified 320–350 °C and up to 10 bar as favorable conditions for high CH4 yield. Additionally, slightly H2-rich feed accelerated approach to equilibrium, while lower flow rates achieved near-complete conversion within the first half of the reactor bed. Simulations were carried out in COMSOL Multiphysics 6.3 on a dual Intel Xeon Platinum 8168 (48 cores at 2.7 GHz) workstation with 512 GB RAM to solve a 12-million-element mesh. The developed framework identifies a practical operating window and quantifies the conversion–throughput trade-off with flow rate, guiding operating condition selection and providing a basis for process intensification and lab-to-pilot scale-up of CO2 methanation.

1. Introduction

Climate change has escalated to the forefront of global concern, largely due to the accumulation of anthropogenic greenhouse gases (GHGs) in the atmosphere [1]. Carbon dioxide (CO2) remains the most impactful GHG due to its high atmospheric concentration and long lifetime. Since the pre-industrial era, its concentration has steadily increased from 280 ppm to over 429 ppm in 2025 [2], exacerbating the greenhouse effect and global warming. Industrial activities, fossil fuel combustion, and energy production are the main contributors to CO2 emissions [3], prompting international efforts such as the Kyoto Protocol and the Paris Agreement to curb its rise. In response to these challenges, the combined implementation of renewable energy sources, efficient energy storage, and CO2 emission reduction are necessary to achieve a net-zero-emission scenario.
As renewable energy gains larger shares of the global supply mix [4], a solution to stabilize the variable energy production is utilizing excess renewable energy for conversion of recycled CO2 into synthetic fuels. One particularly promising power-to-gas (PtG) approach involves the hydrogenation of CO2 to synthetic methane (CH4) by the Sabatier reaction shown in Equation (1) [5].
CO 2 + 4 H 2 CH 4 + 2 H 2 O   Δ H 298 0 = 164.9   kJ / mol
The CO2 methanation process supports the integration of renewable hydrogen (H2) into the energy grid, as surplus renewable electricity can be channeled into electrolysis to produce green H2, which is then converted to synthetic CH4. Although CH4 has lower economic value than H2, the approach addresses the pressing challenges of H2 storage and distribution, as synthetic CH4 is fully compatible with existing natural-gas infrastructure [6].
In addition, the technology can make use of various sources of CO2-rich feedstock, such as biogas, syngas, or pure CO2. Integration of carbon capture and utilization (CCU) technologies enables conversion of pure captured CO2 into valuable synthetic natural gas with high efficiency [7] and economic viability heavily dependent on low electricity prices [8]. An alternative route involves direct biogas purification to raise the methane yield from anaerobic digestion of biomass. Upgrading the biogas (i.e., CH4 and CO2) to biomethane via methanation has been demonstrated [9], but actual implementation is constrained by local limits on residual H2 and carbon monoxide (CO) content for direct injection of the resulting gas into the grid [10].
The reversible, exothermic Sabatier reaction (Equation (1)) can be represented as a combination of two steps—the reverse water–gas shift (RWGS) reaction, followed by methanation of CO—shown in Equations (2) and (3), respectively. The CO2 methanation process is favored by low temperature, high pressure, and high H2/CO2 ratios to avoid coke formation [11]. Almost complete CO2 conversion occurs during the Sabatier step at ambient pressure and 200 °C for a H2/CO2 ratio of 4. Rising temperature determines a drop in the equilibrium constant for the Sabatier reaction and the endothermic RWGS reaction becomes competitive, favoring CO formation at around 450 °C. The CO2 mole fraction peaks at 550 °C, while at temperatures above 600 °C, the RWGS reaction dominates and drives further CO2 conversion, but lowers CH4 selectivity, producing more CO and H2O [12]. An additional undesirable effect of high operating temperatures represents the accelerated deactivation of the catalyst.
CO 2 + H 2 CO + H 2 O   Δ H 298 0 = + 41.2   kJ / mol
CO + 3 H 2 CH 4 + H 2 O   Δ H 298 0 = 206.1   kJ / mol
Selection of catalysts plays an essential role in the CO2 methanation process, with particular emphasis on their effects over CO2 conversion and CH4 selectivity. Catalysts are composed of an active metal phase (e.g., Co, Fe, Ni, Rh, Ru, etc.) that is coupled with a support material [13]. Among the reported active metal phases for CO2 methanation, ruthenium (Ru) ranks first in metal activity and nickel (Ni) exhibits the highest selectivity towards CH4 [6].
The current study employed a Ni catalyst supported on alumina (Ni/Al2O3), a high-surface-area support [14]. Ni-based catalysts are inexpensive, show relatively high activity and excellent selectivity towards production of CH4, and demonstrate increased stability at low temperatures [15]. The most significant disadvantage of Ni catalysts is their high sensitivity to sulfur content when upgrading biogas such that a desulfurization stage becomes mandatory to avoid catalyst deactivation [16].
Reactor design faces two major obstacles: (i) reaction exothermicity, regardless of CO2 source, and (ii) gas desulfurization for upgrading biogas or syngas. Heat removal becomes a necessity due to the strong exothermic nature of CO2 methanation [17]. The formation of hotspots within the reactor bed can accelerate deactivation of the catalyst and promote carbon buildup (i.e., coking), which may eventually clog the reactor [18]. Various designs have been investigated to minimize the effects of these issues over reactor performance, ranging from a single reactor setup to multi-reactor series. A configuration of multiple adiabatic beds with interstage cooling coupled with gas recirculation can successfully address the thermal-related challenges, although with the additional downsides of higher capital costs and process complexity [6].
Alternatively, single-pass reactors with active cooling have been investigated for their ability to improve heat removal and prevent bed hotspots. Brooks et al. [19] developed a microchannel-based Sabatier reactor with oil-based counterflow cooling, highlighting its excellent thermal control for a compact design while also demonstrating good conversion and selectivity. Sudiro et al. [20] studied methanation reactions in externally cooled tubular reactors filled with monolithic catalysts and noted optimal temperature control, achieving acceptable conversions, minimal reactor hotspots, and catalyst stability. Hervy et al. [21] conducted experimental measurements on CO2 methanation employing a gas–solid fluidized bed reactor at demonstration scale (i.e., 400 kW SNG capacity) over a wide range of operating conditions, achieving complete conversion for all studies. Their findings showed that conversion was most influenced by temperature, and thus a homogeneous temperature regime with a maximum gradient of 20 °C was required to maintain optimal catalyst activity and extended catalyst lifetime. Lefebvre et al. [22] evaluated a slurry bubble column reactor applied to CO2 methanation to identify optimal process parameters, and concluded that increasing pressure, temperature, and the H2/CO2 ratio improved overall performance, while optimal catalyst concentration was dependent on operating conditions. Actively cooled fixed-bed Sabatier reactors have also demonstrated viability provided temperature control is optimized to maintain isothermal operation, achieving CO2 conversions above 90% and 100% CH4 selectivity [23].
Modeling and simulation are indispensable tools for the design, evaluation, and optimization of Sabatier reactors, but current data are scarce in terms of mathematical modeling of isothermal fixed-bed reactors. Dannesboe et al. [24] carried out methanation experiments on a multi-tube packed-bed reactor with pressurized cooling water at 65 bar to keep the boiling point at the desired reactor temperature of 280 °C. The authors also developed a Sabatier reactor model by simulating the unit as a Gibbs-equilibrium model in Aspen Plus with calculations based on the Soave–Redlich–Kwong equation of state, which they subsequently validated experimentally. Model results indicated that methane purity was highest when operating near a stoichiometric H2/CO2 ratio of 4. Herrmann et al. [25] developed a computational fluid dynamics-based (CFD) model of a 19-tube, oil-cooled Sabatier reactor to determine heat transfer coefficients necessary for an Aspen Plus flowsheet that mapped the operating window of a lab-scale methanation plant. Despite a deviation in conversion due to simplified kinetics and implementation of intraparticle mass transfer limitations via a catalyst efficiency factor, the CFD model showed good fit when validated against experimental data. Currie et al. [23] developed a 1D model of an actively cooled packed-bed Sabatier reactor with multiple cooling tubes. The one-dimensional approach was justified by considering a minimal radial distance between compartments for the reactor geometry. Experimental proof of concept utilizing a lab-scale unit and numerical simulations confirmed design feasibility in terms of CO2 conversion, CH4 selectivity and yield.
The current work presents a model-driven evaluation of the CO2 methanation process carried out in a single isothermal fixed-bed Sabatier reactor with a Ni-based catalyst at laboratory-scale. Relative to previously published 1D/2D models on methanation, which rely on radial uniformity and plug flow assumptions, the current 3D modeling approach explicitly resolves radial–axial gradients under laminar flow and porous media flow to accurately yield local interstitial velocities and species fields in three dimensions. In addition, the 3D multiscale CFD reactor model coupled macroscale convection–diffusion effects, fluid flow and pressure fields with microscale kinetics, and intraparticle phenomena to investigate mass transfer limitations and enhance methanation performance. The model was validated using published data on (i) kinetics, (ii) reactor efficiency, and (iii) hydrodynamic behavior. In addition, multiple parametric studies were carried out to identify suitable operating conditions for improved CO2 conversion and CH4 yield. Furthermore, the validated multiscale model can serve as a framework for future scale-up studies that incorporate non-isothermal effects and focus on optimal thermal management.

2. Materials and Methods

The current work presents a model-based analysis of CH4 synthesis via the Sabatier reaction over a Ni/Al2O3 catalyst in a fixed-bed reactor configuration. A multiscale CFD model was developed in COMSOL Multiphysics 6.3 to simulate CO2 methanation at isothermal conditions, being successfully validated against experimental data from literature. The model was subsequently used to evaluate optimal operating conditions for process intensification.

2.1. Process Description

The reactor model developed in this study was validated with experimental work carried out and published by Currie et al. [23]. The laboratory-scale Sabatier reactor (Figure 1) consisted of a 0.25 m stainless steel tube with a 12 mm outer diameter, while another 6 mm outer diameter tube was placed inside the reactor to provide active cooling by compressed air. The reactor bed was filled with 62.5 g of commercial Ni/Al2O3 catalyst pellets (i.e., 12 wt% Ni) crushed and sieved to 0.7–1 mm. Reactor temperature was measured with thermocouples installed at the inlet and outlet sections of the catalytic bed. Thermal insulation was achieved with a 5 cm-thick layer of quartz wool and aluminum foil was used to decrease heat losses by radiation. Inert N2 gas was fed initially until the bed temperature reached 350 °C using heating tape connected to the flow system, then the feed was switched to a mixture of CO2–H2. After ignition occurred due to the strongly exothermic reaction, the heating tape was turned off and the reactor was operated completely autonomously without heating. The authors conducted multiple CO2 methanation experiments at various operating conditions: temperatures of 600–800 K, pressures of 1–10 bar, and velocities of 0.04–0.2 m/s. The reported results showed high CO2 conversions (i.e., up to 92%), full selectivity for CH4, and excellent reactor stability over 120 h of continuous operation.

2.2. Kinetic Model Description

Kinetic modeling of CO2 methanation plays a central role in the development and optimization of PtG systems. Given the highly exothermic and equilibrium-limited nature of the Sabatier reaction, accurate kinetic expressions are necessary for predicting reactor behavior and guiding catalyst development. A wide range of kinetic models have been proposed in the literature, ranging from empirical rate laws to detailed mechanistic expressions based on the Langmuir–Hinshelwood–Hougen–Watson (LHHW) approach. Most models assume steady-state conditions and are derived from fixed-bed reactor experiments [26].
Koschany et al. [27] developed a kinetic model for CO2 methanation based on a coprecipitated Ni/Al(O)x catalyst by considering two distinct operating regimes. The experiments were conducted in a fixed-bed reactor with an internal diameter of 4 mm. The first series of measurements considered temperatures of 180–240 °C and pressures of 1–15 bar, using 75 mg of catalyst particles with diameters of 0.15–0.20 mm. The second regime covered 250–340 °C and 1–9 bar, with 25 mg of catalyst. In both cases, the catalyst was diluted with silicon carbide (SiC) at a 1/9 ratio to minimize transport limitations. Multiple kinetic expressions were evaluated, including a power-law model incorporating inhibition effects and an LHHW expression. The latter was ultimately selected due to its ability to accurately describe reversible methanation behavior and the inhibiting influence of water, even under conditions approaching thermodynamic equilibrium. The model combines thermodynamic consistency with a manageable computational structure, making it suitable for both steady-state and transient simulations relevant to PtG processes. The adopted rate expression is reported in Equation (4). The equilibrium constant was approximated with the empirical expression in Equation (5). The rate and adsorption constants were expressed as Arrhenius and van’t Hoff types, respectively (Equations (6) and (7)). Parameter estimation was carried out by minimizing the correlation between pre-exponential factors and activation energy or adsorption enthalpy (Table 1).
R = k · p H 2 0.5 · p C O 2 0.5 · 1 p C H 4 · p H 2 O 2 p C O 2 · p H 2 4 · K e q 1 + K O H · p H 2 O p H 2 0.5 + K H 2 · p H 2 0.5 + K m i x · p C O 2 0.5
K e q = 137 · T 3.998 · exp 158.7   kJ / mol R · T
k = k 0 , r e f · exp E a R · 1 T r e f 1 T
K i = K i , 0 , r e f · exp Δ H i R · 1 T r e f 1 T
The current study focused on the CO2 methanation (i.e., Sabatier) reaction in isolation to gain a clearer understanding of its intrinsic kinetics and transport limitations under isothermal, CO2-rich conditions. Therefore, implementation of the kinetics was carried out using the LHHW rate published by Koschany et al. [27], developed for Ni/Al2O3 catalysts using data points recorded over industrial ranges of temperature and pressure, which captured product inhibition and the slow approach to equilibrium. The developed kinetic model accurately reflected trends across various H2/CO2 ratios and was validated against conversion–temperature curves, making it a consistent basis for the simulated conditions in this work for temperatures lower than 350 °C and CO2-rich feeds. Side reactions such as RWGS or CO methanation become more consequential at higher temperatures or for CO-containing feeds, and will be included in a non-isothermal, scaled-up framework planned for future work.

2.3. 3D CFD Multiscale Sabatier Reactor Model Development

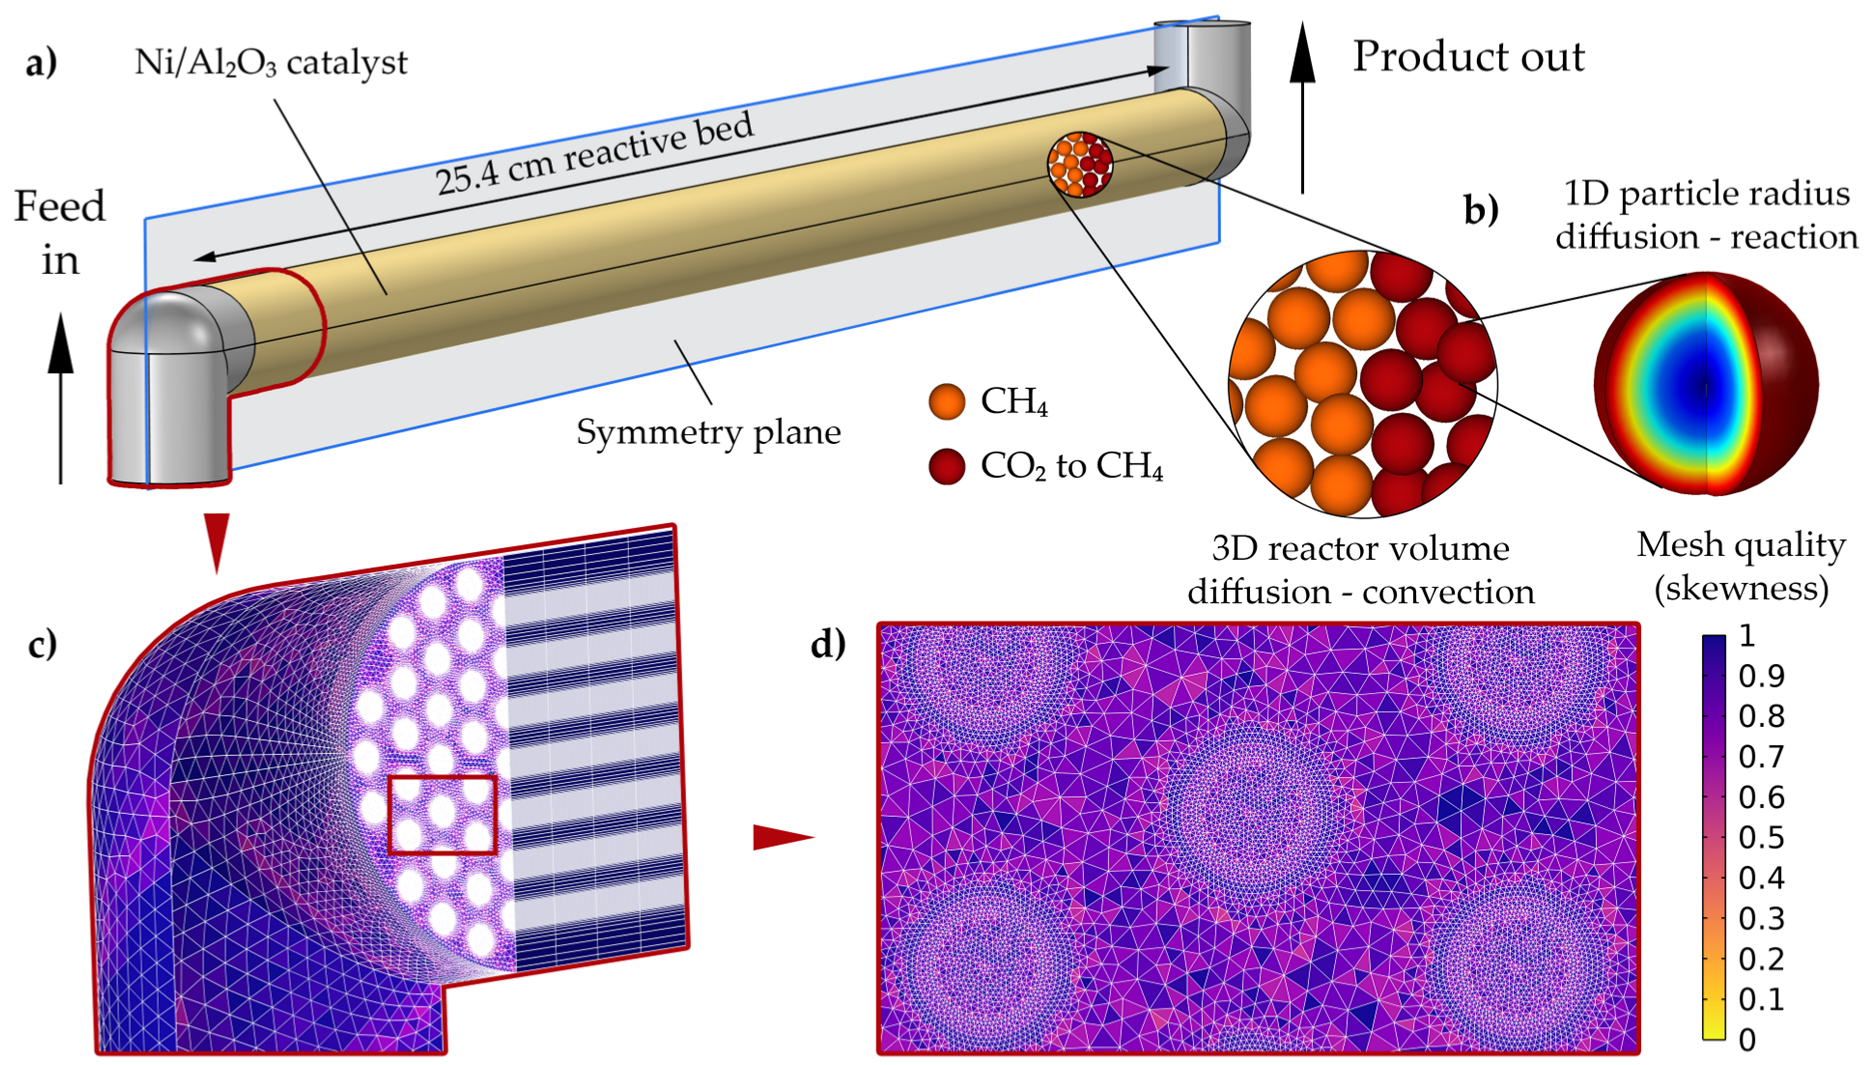
A 3D CFD multiscale model was developed, based on the experimental setup performed by Currie et al. [23] and described above, to simulate the CO2 methanation process using an air-cooled heat exchanger-type packed-bed Sabatier reactor. The modeled geometry is presented in Figure 2a, with inlet and outlet domains surrounding the catalyst bed filled with Ni/Al2O3 particles. A symmetry plane was used along the axial direction to solve the equations for only half of the entire model, thus significantly reducing computational resources and run time required. The model was implemented in COMSOL Multiphysics 6.3 and coupled bulk convection–diffusion, fluid flow, and pressure fields with intraparticle diffusion–reaction equations to capture both reactor-scale and catalyst-scale phenomena. The multiscale framework was achieved by splitting the packed bed into two interconnected domains (Figure 2b): a 3D porous media region to represent the macroscale, and a 1D normalized particle radius domain to simulate the microscale, where the validated kinetic model was implemented. The authors [23] successfully demonstrated stable isothermal operation of the experimental lab-scale reactor; therefore, the current work neglected energy balances and did not account for non-isothermal effects, but instead focused on the interdependence between species transport (i.e., both micro- and macroscales) and flow distribution. Industrial Sabatier reactors are strongly exothermic and typically exhibit thermal non-uniformity with axial–radial temperature gradients and hotspots, which shift intrinsic rates and equilibrium and affect catalyst performance (i.e., stability and deactivation) such that heat-removal options may constrain feasible operating windows. Thermal effects will be evaluated in a follow-up scale-up study. Because heat transfer effects were excluded, the experimental Sabatier reactor design was simplified when implemented into the modeling environment by removing the coolant tube, and an equivalent gas inlet diameter was calculated to maintain the packed-bed volume identical to the experimental setup. Laminar flow was assumed in the inlet and outlet reactor sections (with calculated Reynolds numbers of 267.2–801.6 for all investigated conditions), while porous media flow was simulated within the reactive bed, both distributions coupled to species transport. All simulations were solved as steady-state studies using a segregated Newton setup with GMRES for each segregated step: (i) laminar Navier–Stokes in the inlet and outlet domains and Darcy flow in the porous bed for velocity fields and relative pressure, and (ii) bulk-phase convection–diffusion coupled with the intraparticle diffusion–reaction model for species concentrations. Boundary conditions are discussed in detail in the Model Equations section.
Spatial discretization was carried out carefully by accounting for the physics simulated across the model domains, each requiring a specific level of detail. The inflow and outflow sections were meshed utilizing a combination of free triangular and tetrahedral elements with a successively finer distribution toward the packed-bed entrance (Figure 2c). The highest level of detail was applied to the inflow openings on the catalyst support plate, where the steepest velocity gradients occurred (Figure 2d). A swept mesh operation was used to generate the remaining mesh along the 3D porous bed, with an exponential growth rate at the reactive bed entrance to accurately resolve the acceleration of flow and developing concentration gradients into the porous domain. In addition, the normalized particle radius was discretized with 24 elements placed following a square root distribution.
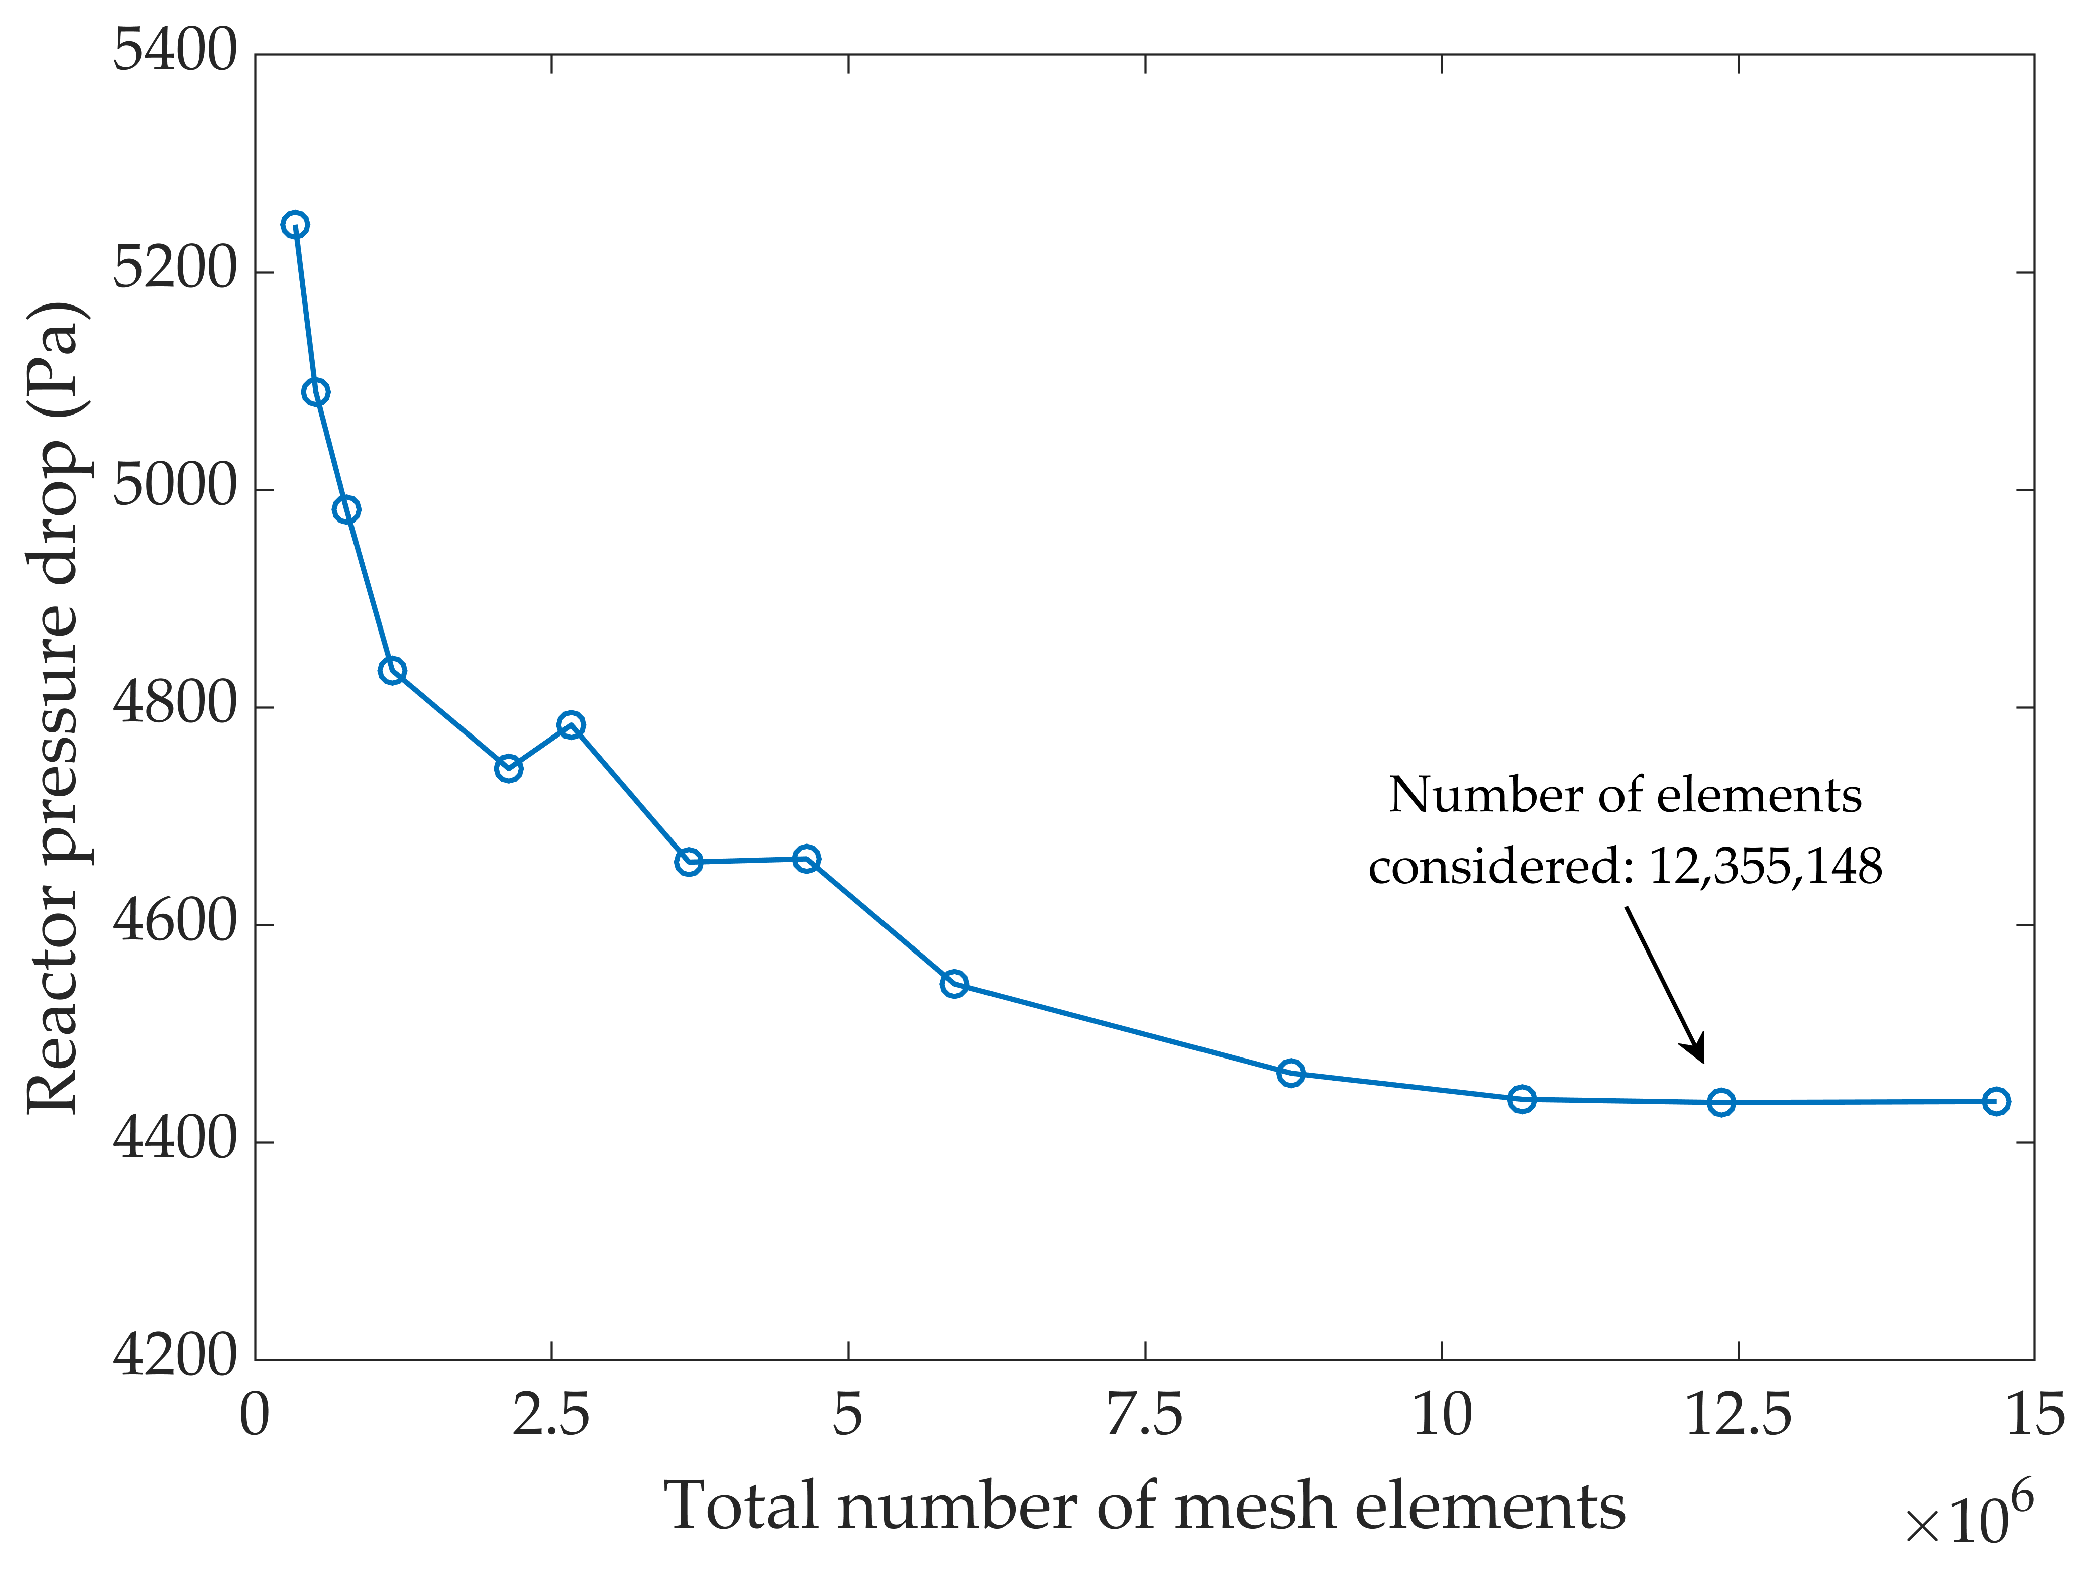
Mesh independence was achieved by successive global refinements until the reactor pressure drop vs. number of elements showed an asymptotic profile (Figure 3). Correctly resolving for pressure drop ensures correct capture of entrance jets and shear, which then fixes the velocity field and residence time. The mesh refinement process considered various grid configurations with 5,893,104, 8,730,932, 10,675,701, 12,355,148, and 14,672,903 elements, yielding relative changes in reactor pressure drop of 2.46%, 1.8%, 0.54%, 0.07% and 0.02%, respectively. The grid comprising 12,355,148 elements satisfied the independence criterion shown in Equation (8) of <0.1% (i.e., 0.06% pressure drop change at that step), while an extra refinement to 14,672,903 resulted in a relative pressure drop change of 0.02%, confirming mesh independence. All other monitored outputs (i.e., partial pressures, reaction rates, and conversion) varied negligibly (<0.1%), further confirming the grid was sufficiently refined. The final grid with 12,355,148 elements showed an average element quality in terms of mesh skewness of 0.811 and was used in all reported simulations.
ε , Δ P n = Δ P n Δ P n 1 Δ P n · 100
Alongside mesh refinement strategies, the relative tolerance was also sequentially tightened to an order of 10−5 to ensure precise model predictions, ensuring numerical accuracy consistent with the mesh-independence study. A workstation with two Intel(R) Xeon(R) Platinum 8168 CPUs (2.70 GHz) and 512 GB of RAM (DDR4 at 2666 MHz) was used to simulate the process. The complete steady-state solution of the coupled flow and species transport typically required around 6 h per simulation on the specified system.

2.3.1. Model Parameters, Operating Conditions, and Assumptions

The reactor dimensions, gas compositions, and operating conditions (Table 2) selected for model development and simulation were taken from the experimental measurements performed by Currie et al. [23]. The only exception was an adaptation of the reactor diameter, which was recalculated as an equivalent diameter that maintains the original experimental reactive bed cross section.
The main model assumptions were:
  • Stationary solid catalyst particles were spherical with identical radii.
  • Fick’s law was considered for diffusion estimation.
  • Methanation reaction occurs within the catalyst particles.
  • Isothermal operating conditions were considered.

2.3.2. Model Equations

The multiscale reactor model equations were implemented in COMSOL Multiphysics 6.3. At the macroscale, steady-state mass transport was simulated using the convection–diffusion equation for porous media (Equation (9)), incorporating molecular diffusion and axial dispersion through Equation (10). In addition, Equation (9) also included a term to establish a fluid–particle flux continuity by accounting for bed specific surface area (Equation (11)) and film resistance (Equation (12)) between the reactor bulk and catalyst particles, where the transfer coefficient was calculated based on a Sherwood number correlation (Equation (13)).
D L , i ε b · c i + u ε b · c i = J p , i · S b ε b
D L , i = 20 R e · S c + 1 2 · 2 · u · r p
S b = 3 r p · 1 ε b
J p , i = h D , i · c i c p , i
h D , i = S h · D p , i r p
Intraparticle transport was resolved along a dimensionless coordinate representing particle length and included two separate equations. Equation (14) specified the mass balance for gas components at the particle surface (i.e., normalized radius was 1). Behavior in the pellet void domain was described by Equation (15), accounting for both diffusion and chemical reaction mechanisms (i.e., reaction term solved using Equation (4)). The effective diffusivity within the porous particles was adjusted according to the Millington–Quirk relationship (Equation (16)).
1 r p · D p , e f f , i · c p , i r r = 1 = J p , i
1 r 2 · r p 2 · r r 2 · D p , e f f , i · c p , i r 0 r 1 = R p , i
D p , e f f , i = ε p 4 3 · D p , i
Laminar fluid flow in the non-porous inlet and outlet domains was solved using Navier–Stokes equations (Equation (17)), together with the continuity equation (Equation (18)), with terms corresponding to pressure and inertial and viscous forces. Within the porous media domain, the flow velocity field was governed by Darcy’s linear relation (Equation (19)), valid for low velocities.
ρ · u · u = p + μ · u + u T 2 3 · μ · u · I
ρ · u = 0
u = κ · p μ

2.4. Sensitivity Analysis Methodology

With mesh independence confirmed, model results were validated against (i) kinetic and (ii) reactor performance and (iii) hydrodynamic data. Subsequently, a series of parametric studies (shown in Table 3) were carried out to gain further insight into the methanation process.

3. Results and Discussion

3.1. Model Validation

The developed model was validated sequentially for kinetics, reactor performance, and hydrodynamics. Two statistical indicators were employed to evaluate the predictive quality of the simulations: (i) the coefficient of determination (R2), which gauges how well simulated trends reproduce experimental variation, and (ii) the root mean square error (RMSE), used to measure the absolute magnitude of residuals.

3.1.1. Kinetic Model Validation

To ensure that the developed simulation framework accurately captured the catalytic behavior under methanation conditions, the model was first validated against experimental data reported by Koschany et al. [27]. To assess the accuracy of the implemented kinetic model, CO2 conversion was examined under a range of operating conditions by varying the inlet gas composition and the total flow rate.
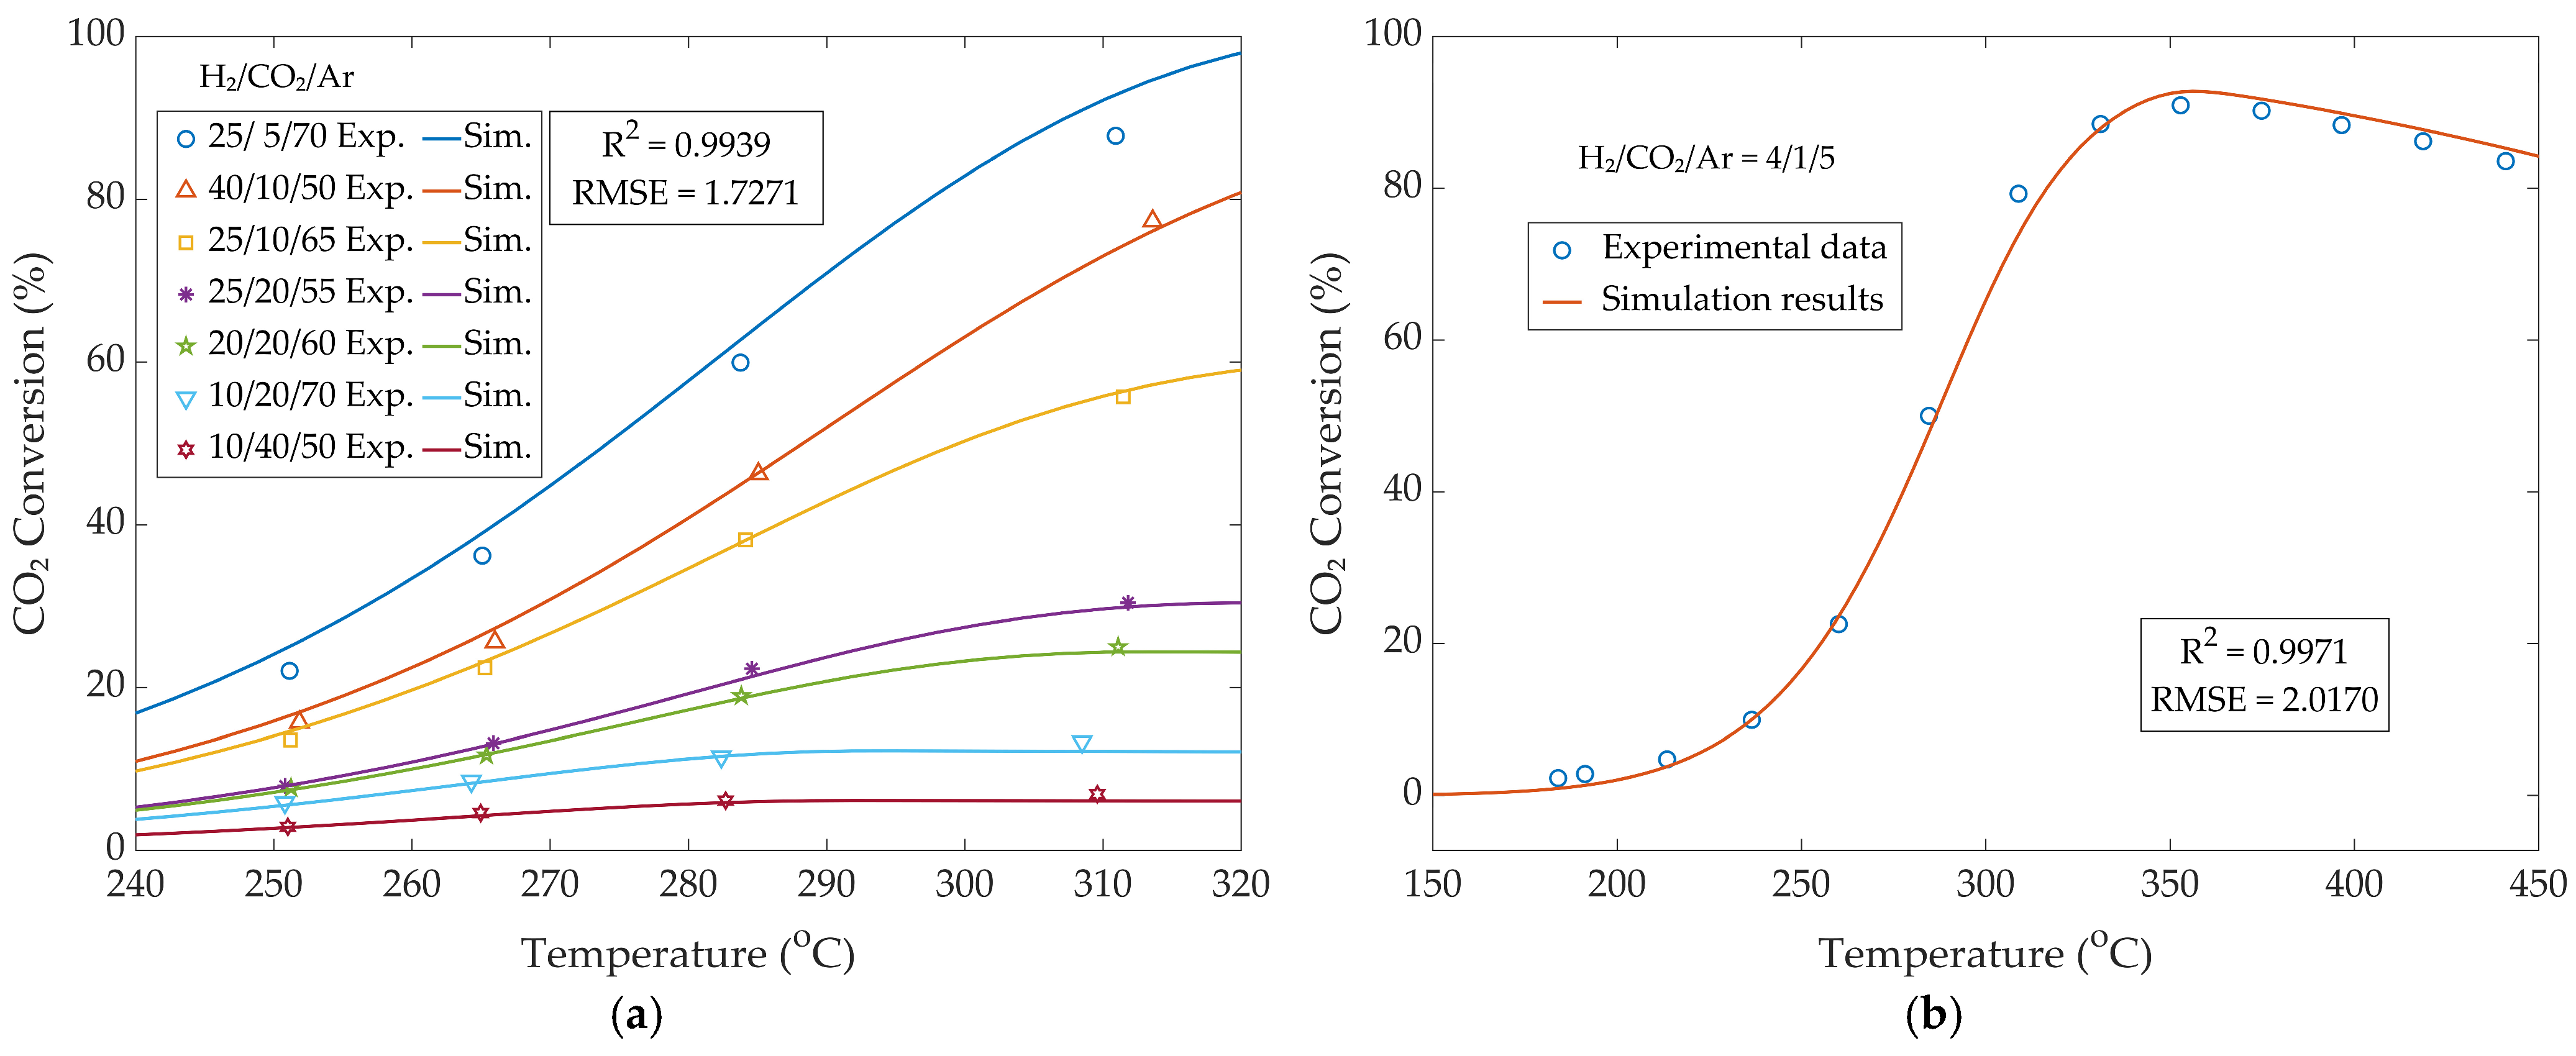
Figure 4a presents the modeled CO2 conversion as a function of temperature for different inlet gas compositions, where the volumetric ratios of H2, CO2, and Ar (used as an inert component) were systematically varied for a total of seven different ratios. These simulations were conducted under constant process conditions: a total gas flow rate of 120 N L/(h∙gcat), pressure of 6 bar, and catalyst mass of 25 mg. The simulation results demonstrated strong agreement with the experimental data reported by Koschany et al. [27], as reflected by an R2 value of 0.9939 and an RMSE of 1.7271. The statistical values indicate that the model successfully captures both the qualitative trends (i.e., predicted conversion profiles overlay with experimental data) and the quantitative behavior (i.e., based on statistical indicators) of the system over the studied temperature range.
Figure 4b displays the conversion of CO2 as temperature is varied at a gas flow rate of 150 N L/(h∙gcat), inlet gas composition of H2/CO2/Ar = 4/1/5, pressure of 8 bar, and catalyst mass of 25 mg. The simulation results again aligned closely with experimental observations, yielding an R2 value of 0.9971 and an RMSE of 2.0170, demonstrating reliability of the simulation framework in reproducing experimental outcomes even at higher flow rates. The strong statistical agreement observed across both cases confirms the accuracy of the kinetic model and supports its application for further reactor-scale simulations.

3.1.2. Reactor Model Validation—Conversion and Yield

The fixed-bed multiscale reactor model was validated by comparing the simulated molar gas compositions along the reactor length with experimental data reported by Currie et al. [23]. As shown in Figure 5, the model successfully reproduces the axial concentration profiles of the key species involved in the Sabatier reaction under the specified conditions: CO2/H2 feed ratio of 4/1, gas velocity of 0.2 m/s, pressure of 5 bar, and reactor temperature of 525 °C. The concentration of H2 decreased progressively along the reactor length as it was consumed, while CO2 was also depleted, but at a slower rate, resulting in production of CH4 that accumulated downstream. The simulated profiles aligned closely with the experimental measurements, as evidenced by an RMSE of 1.3075, confirming accurate model predictions of the coupled reaction–transport phenomena occurring within the Sabatier reactor.

3.1.3. Hydrodynamic Model Validation—Pressure Distribution

Figure 6 displays the pressure distribution profile along the axial length of the reactor. The simulation was carried out under an assumed inlet velocity boundary condition and a relative pressure outlet boundary condition, enabling estimation of the pressure drop across the packed bed based on the coupling between the Navier–Stokes and Darcy equations for the different flow regimes.
As expected, the highest pressure was recorded at the reactor inlet, where flow was introduced, and gradually decreased toward the reactor outlet, reflecting frictional losses due to viscous effects within the porous-bed medium. The total reactor pressure drop of 4436.9 Pa (Figure 6a) was sufficient to maintain a steady flow regime through the porous structure. In addition, the pressure drop recorded across the catalyst bed was 2569 Pa (Figure 6b), around 57.9% of the total pressure loss, while 42.1% was attributed to the inlet and outlet domains. Furthermore, the accuracy of the simulated pressure drop across the reactive bed was validated using an analytical approach via the well-known Ergun equation (Equation (20)). A relative error of 0.004% (Table 4) confirmed the accuracy of model-predicted pressure distribution and increased confidence in the simulated velocity profiles.
Δ P = L · 150 · μ · u d p 2 · 1 ε b 2 ε b 3 + 1.75 · ρ · u 2 d p · 1 ε b ε b 3

3.2. Multiscale 3D CFD Sabatier Reactor Model Predictions

3.2.1. Simulated Velocity Profiles

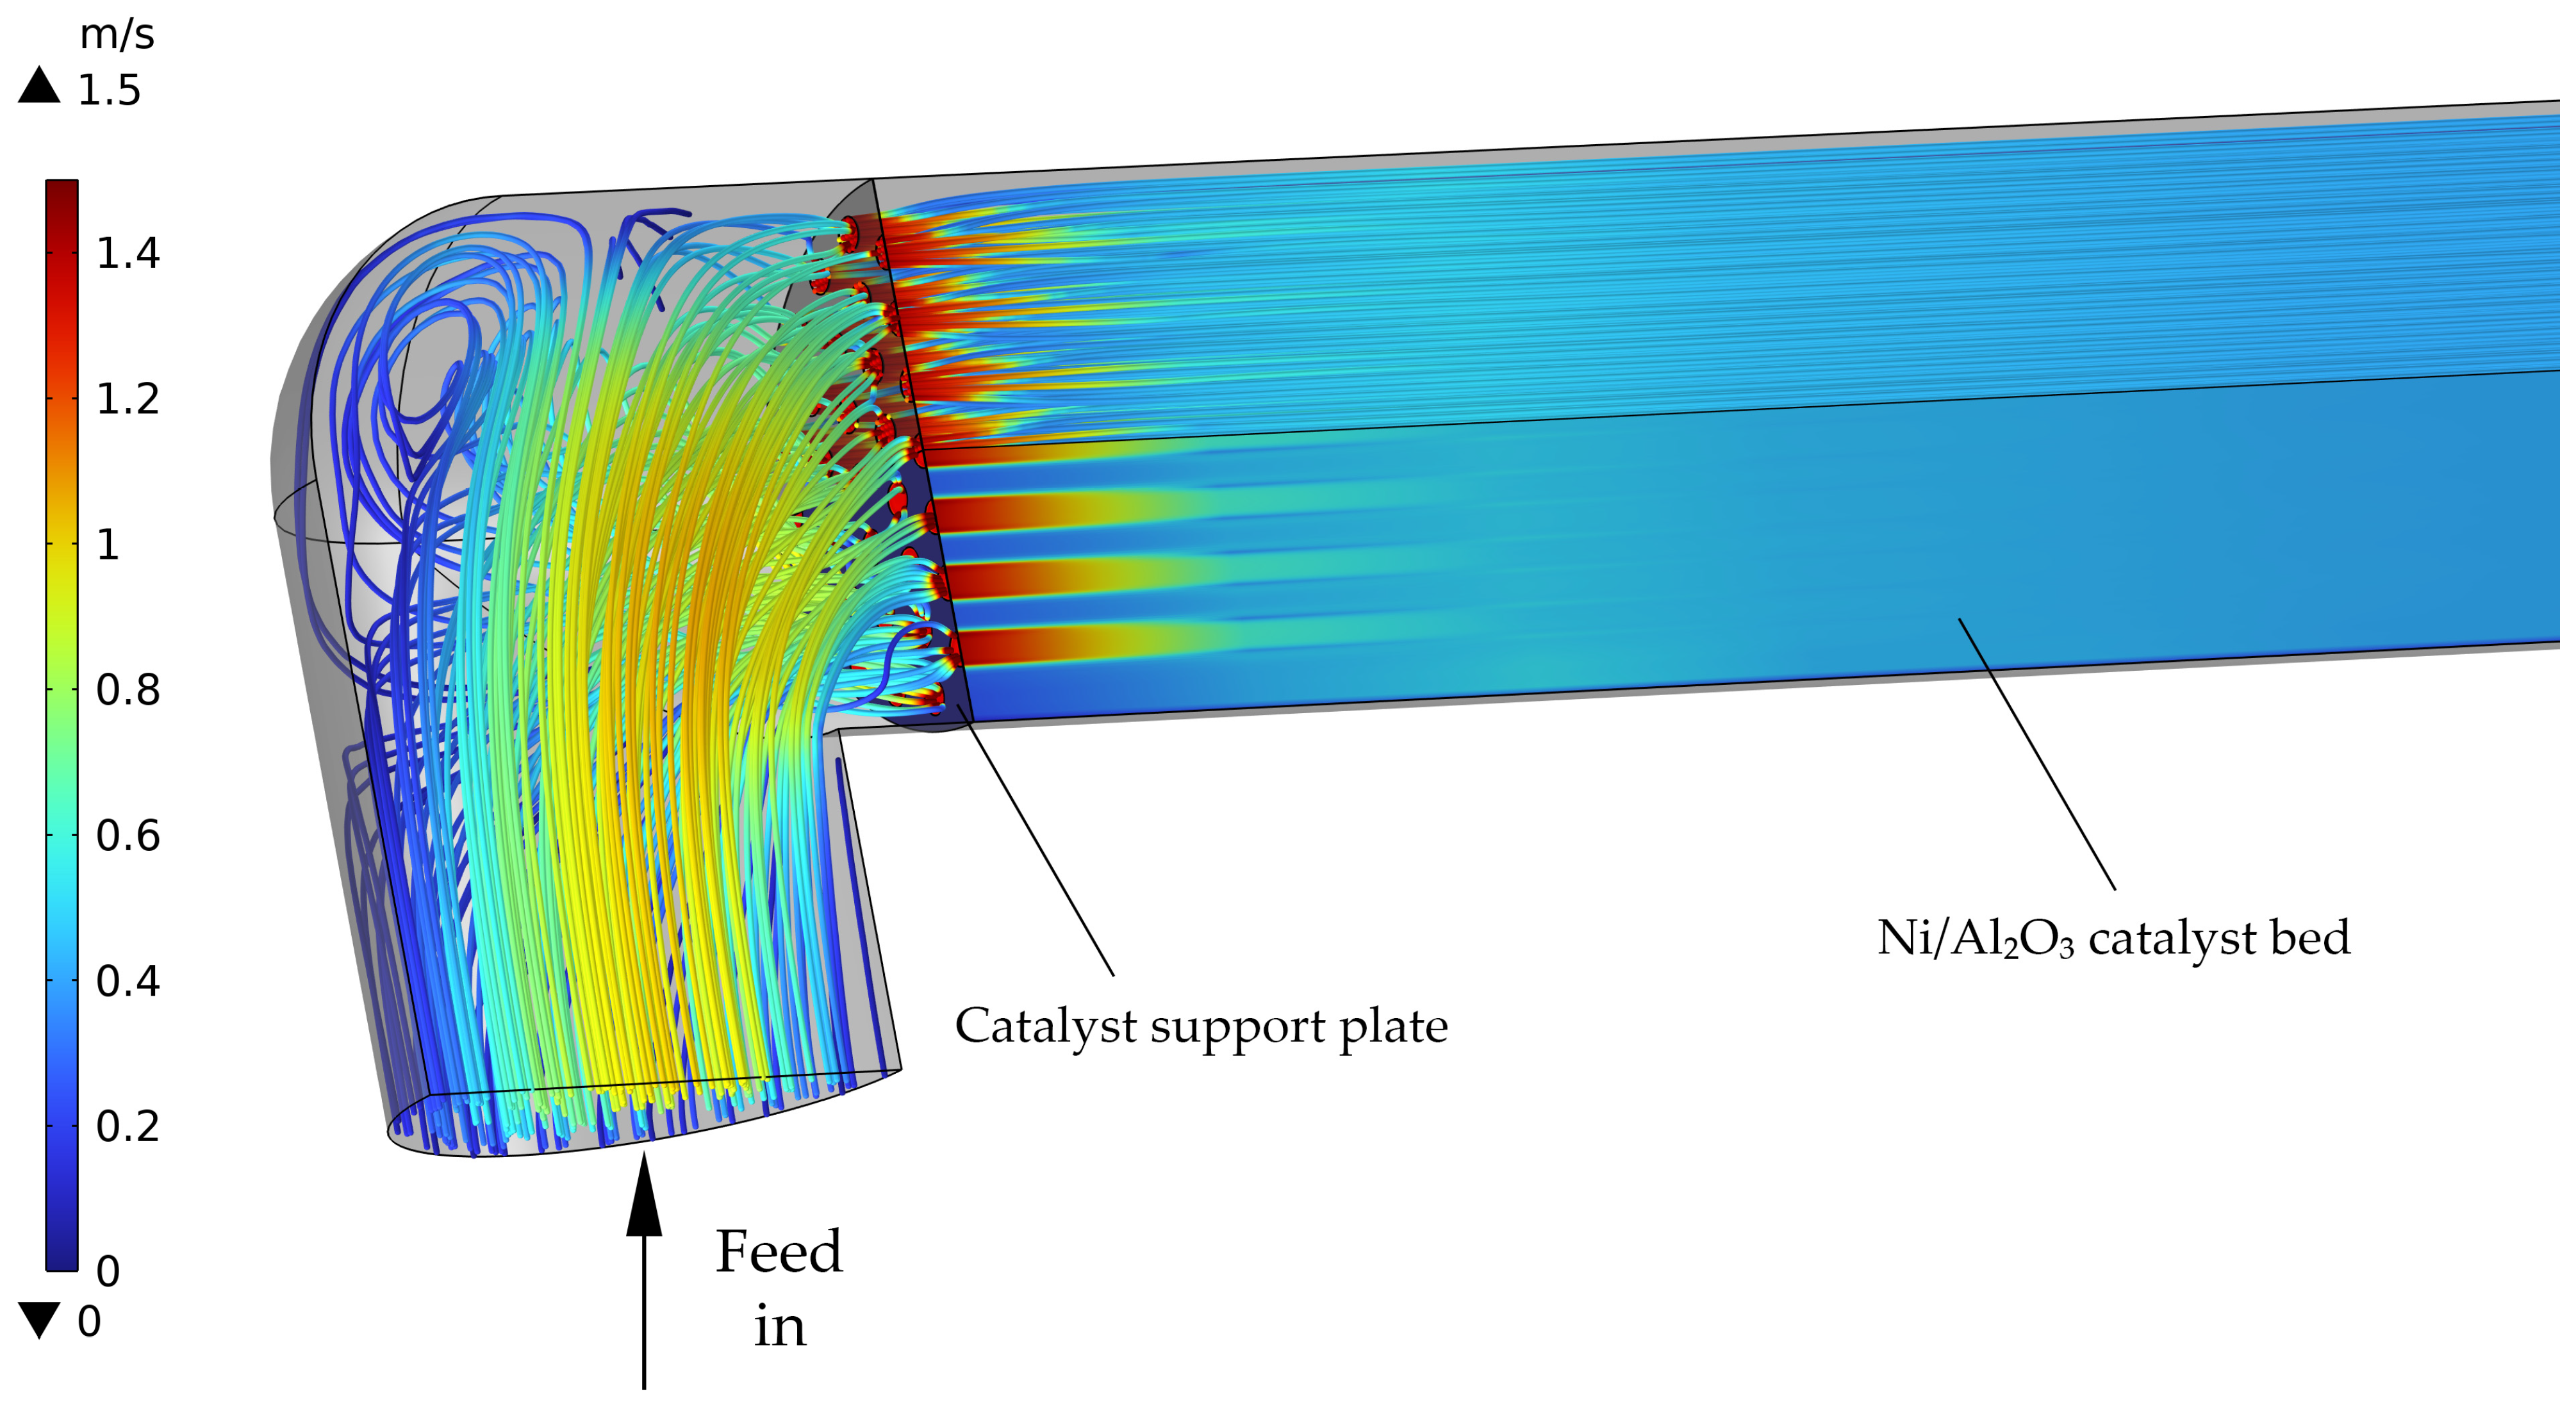
The simulated velocity field at the reactor inlet was used to investigate the hydrodynamic behavior of the system prior to entering the packed catalyst bed. As shown in Figure 7, the velocity reached a local maximum in the curved inlet section, where the flow accelerated due to geometric constriction and inertial effects. Streamlines indicated the formation of complex flow paths and recirculation zones, particularly near the inner wall of the bend. Upon exiting the curvature and entering the straight section of the reactor, the velocity profile stabilized and transitioned into a more uniform, laminar flow as the gas penetrated the fixed-bed region through the catalyst support plate openings. This behavior was consistent with Darcy-type flow through porous media, where the viscous resistance of the catalyst bed became the dominant factor governing flow behavior. As the gas advanced along the axial length of the bed, the velocity profile flattened due to the drag imposed by the porous structure, transitioning from inertia-dominated to viscosity-controlled flow. This gradual adaptation enhanced flow uniformity and contributed to consistent contact between the reactants and the catalyst. The average gas velocity further inside the catalyst bed reached around 0.5 m/s.

3.2.2. Simulated Concentration Profiles

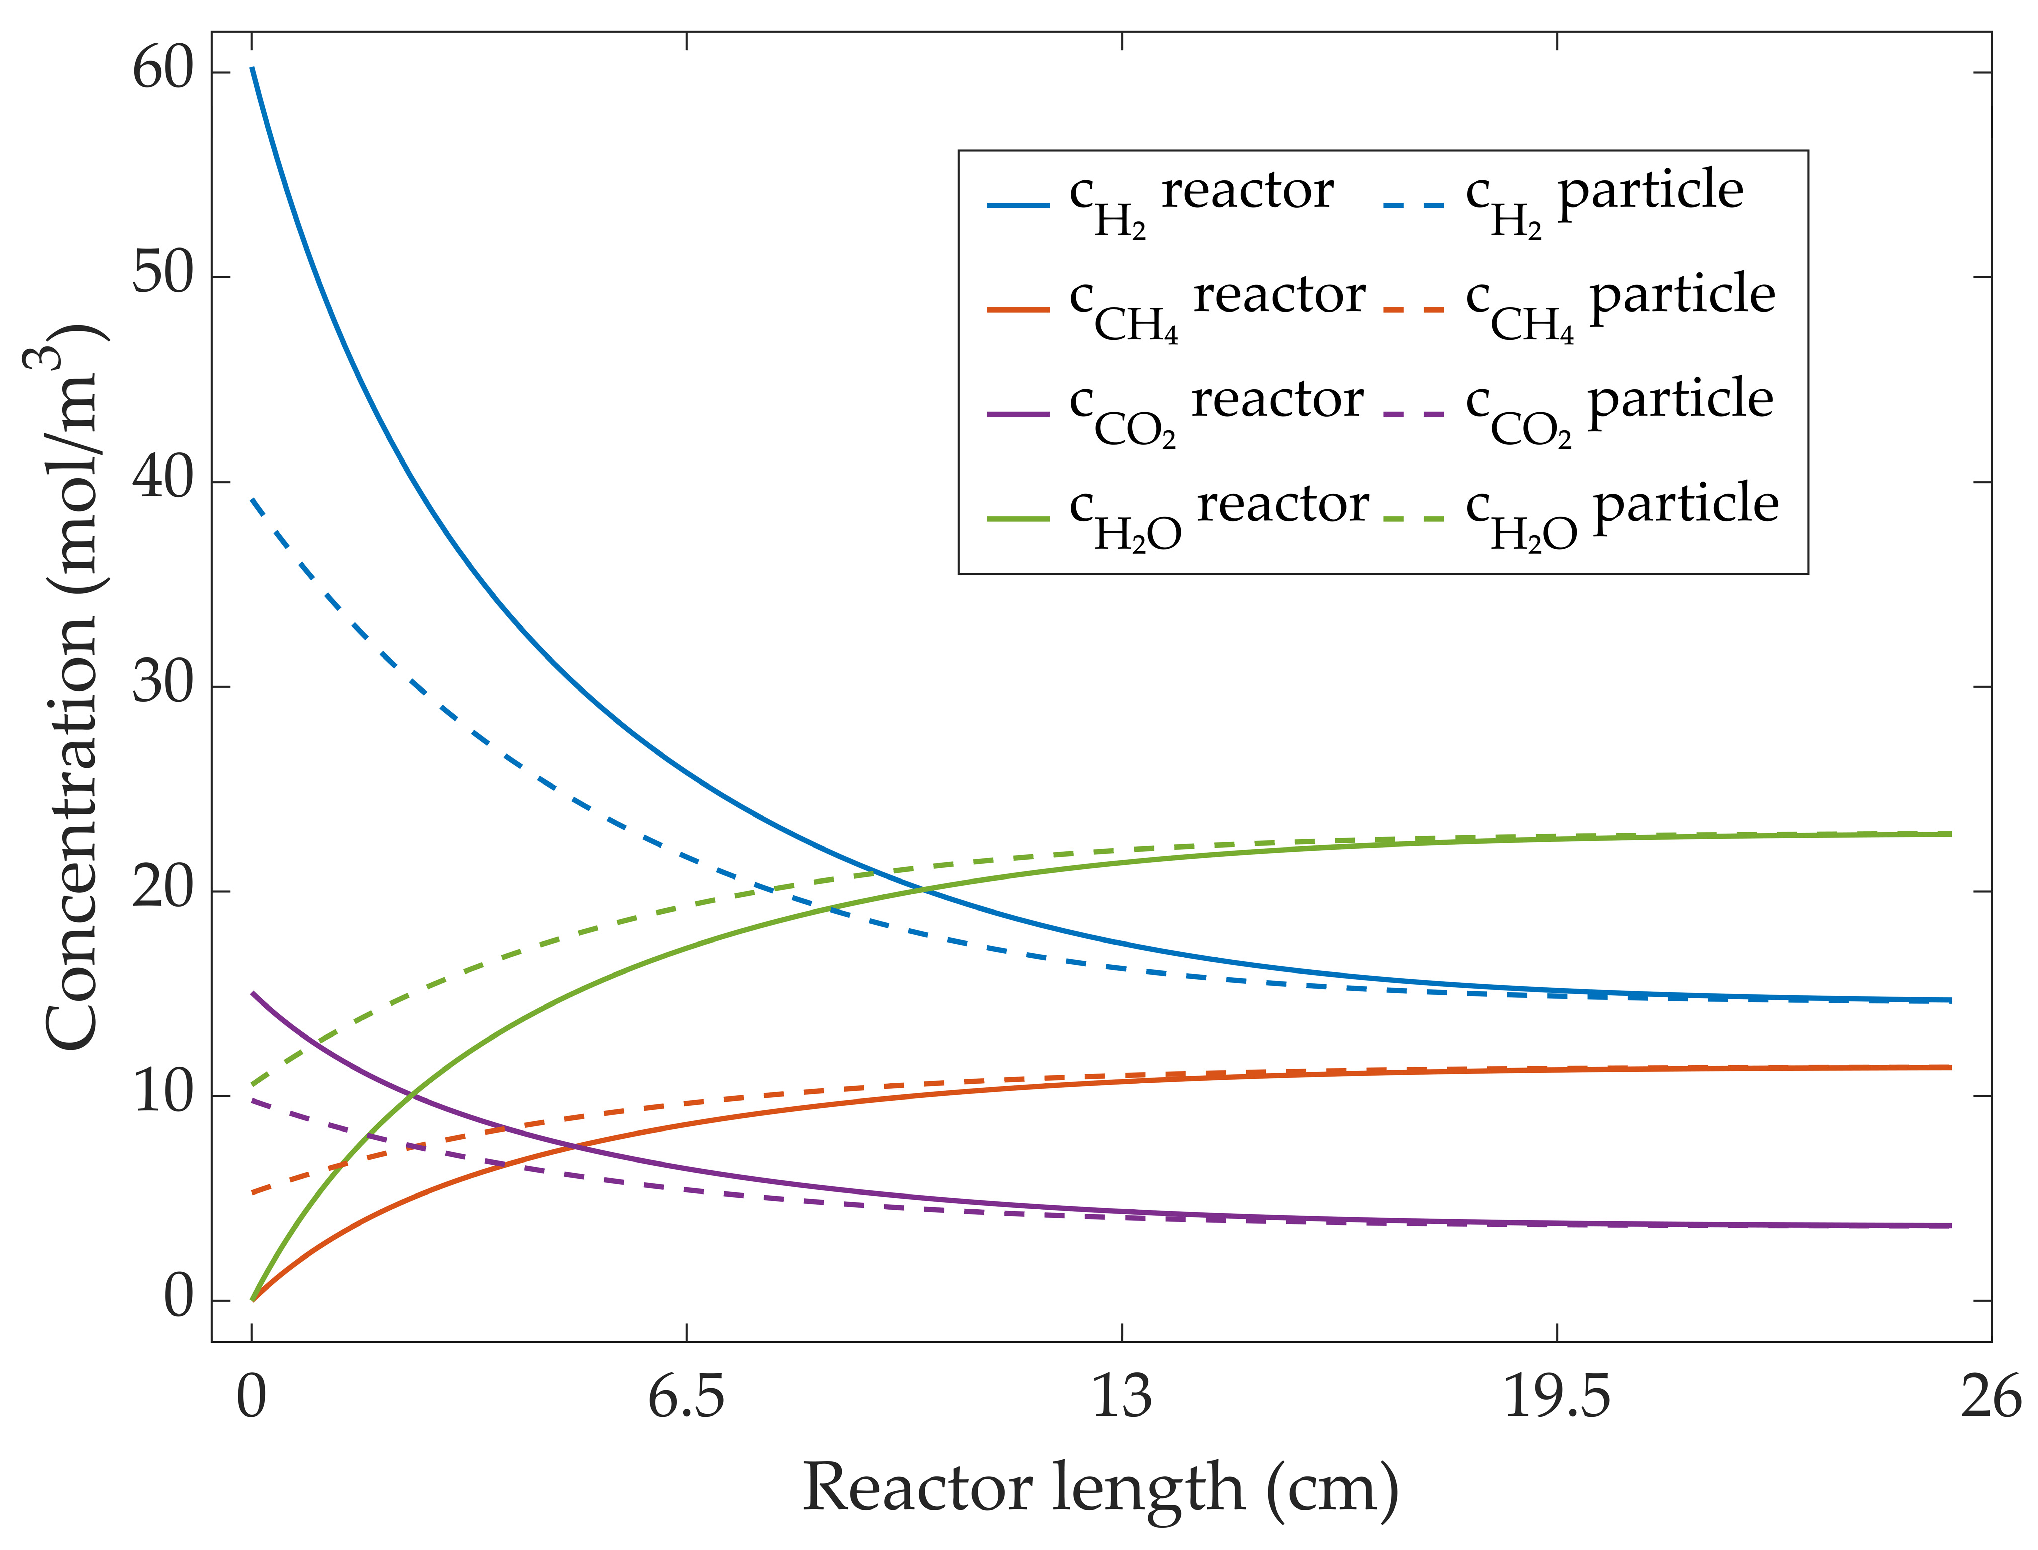
Figure 8 compares reactor bulk and particle-average concentrations of H2, CO2, CH4 and H2O along the reactive catalyst bed. The evident separation between bulk and intraparticle concentration curves near the reactor entrance highlighted mass transport limitations implemented in the model (i.e., film resistance and intraparticle diffusion). For H2 and CO2, the reactants, the particle concentration averages showed values lower than the bulk concentrations, indicating that intraparticle consumption outpaced diffusion-dominated resupply of reactant gas, creating internal concentration gradients. Conversely, the product gases showed higher intraparticle concentrations compared to the concentrations in the surrounding bulk, indicating they were being produced within the catalysts and diffused outward through the particle layers and across the film to accumulate in the reactor gas phase. Moving downstream, the gap between reactor and particle concentration profiles decreased steadily due to lower reactant partial pressures, leading to diminished reaction rates. As the profiles eventually overlapped, mass-transfer resistance became negligible, and the compositions shifted closer to the Sabatier equilibrium. Similar bulk-pellet concentration differences under high rates at the bed entrance, followed by convergence downstream as driving forces decline, have been reported by Shirsath et al. [29] in spatially resolved packed-bed methanation and pellet-scale diffusion studies, confirming that the observed profiles reflected external film and intraparticle diffusion resistances.
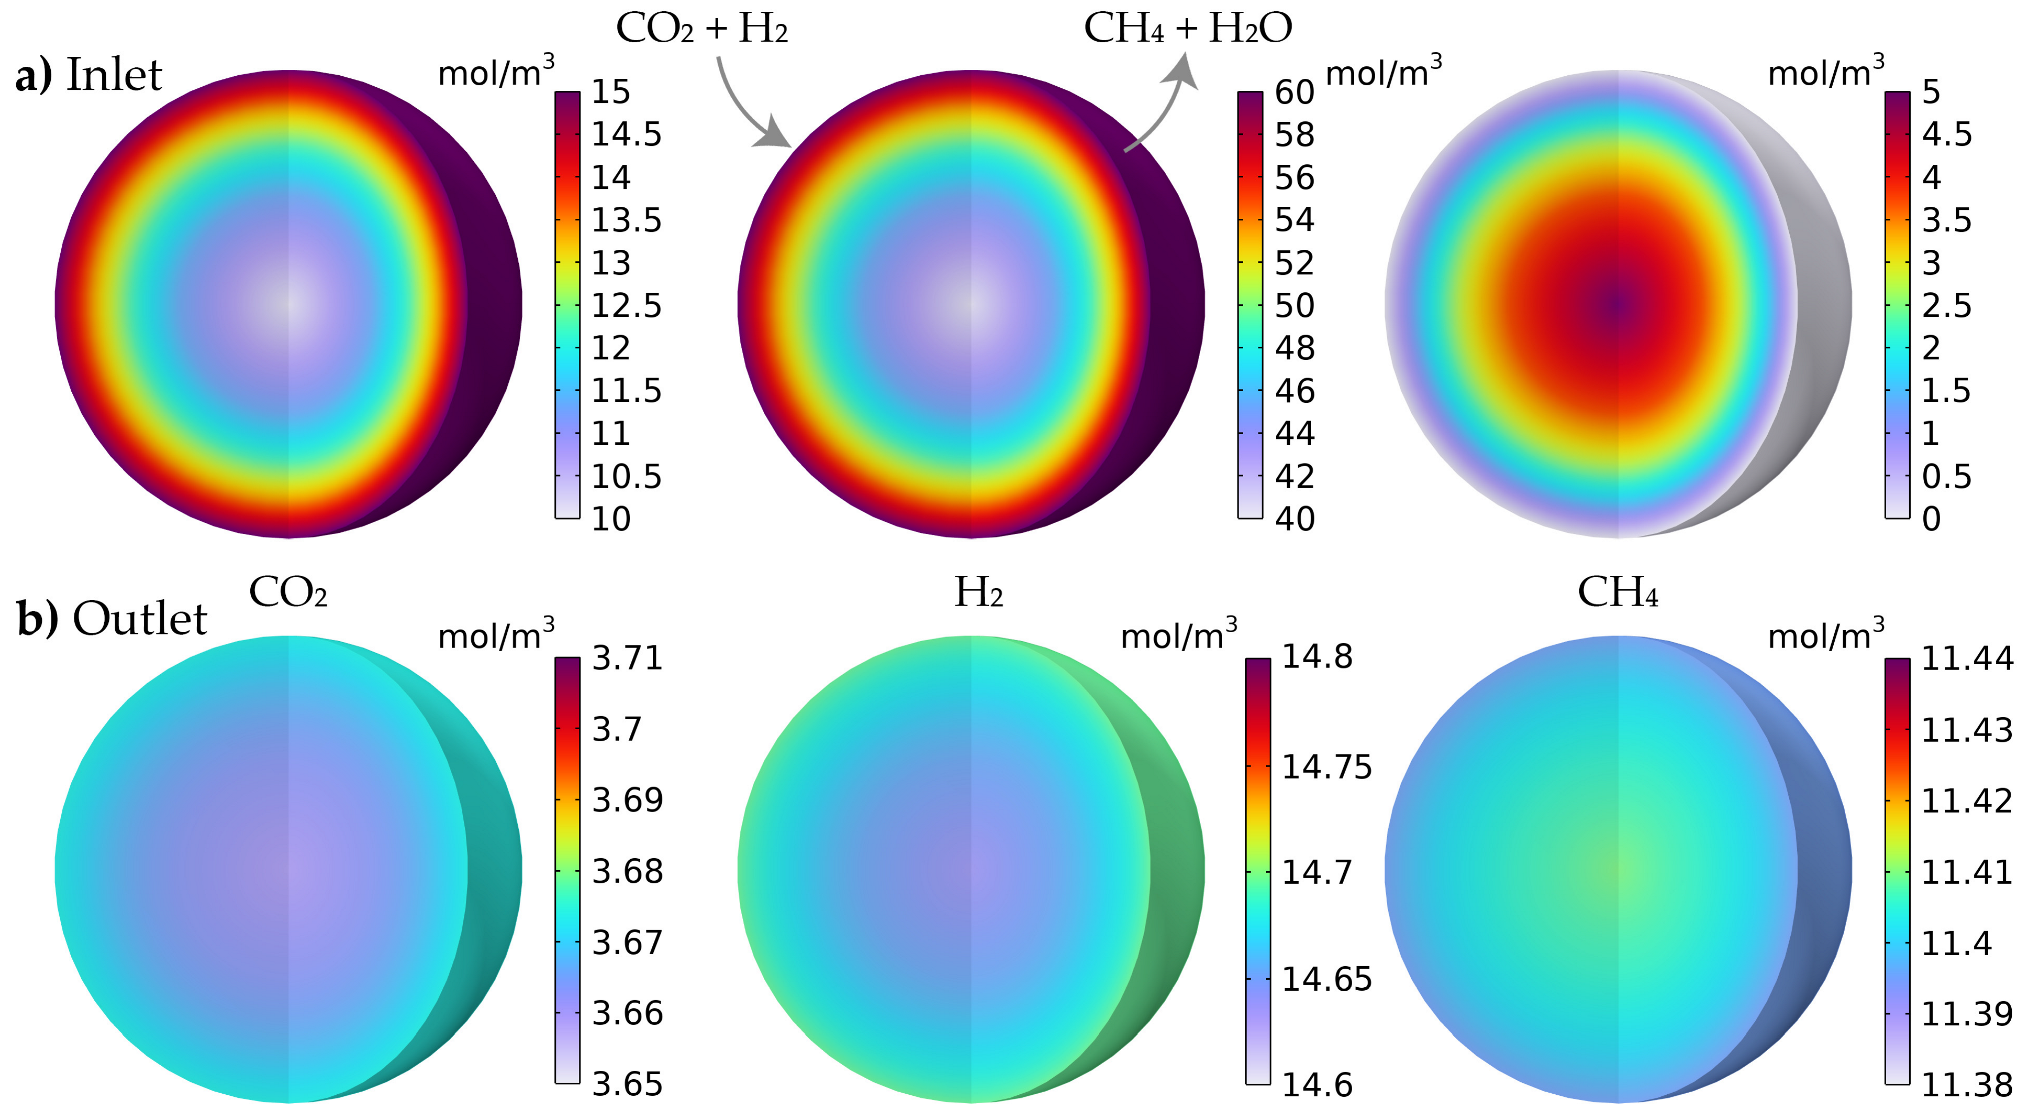
Figure 9 shows the intraparticle concentration distributions for CO2, H2 and CH4 in representative catalyst pellets located at the reactive bed entrance and exit. Near the bed inlet (Figure 9a), strong radial gradients were evident for the reactants, with the highest concentrations at the external surface that decreased toward the core, indicating that consumption inside the particles outpaced the diffusional transport rate (i.e., diffusion-affected regime). In contrast, CH4 generation within the particles exhibited a core maximum concentration and outward diffusion across the internal pore network toward the particle outer layer. At the bed outlet (Figure 9b) the intraparticle distribution showed a narrow range in the concentration gradients for all species. The lower reactant partial pressures together with product accumulation reduced the methanation reaction rates to near-equilibrium levels, indicating a diffusion-relieved regime.

3.3. Sensitivity Studies Performed

3.3.1. Temperature and Pressure Variation

Figure 10a presents a sensitivity analysis of CO2 conversion along the reactor length at six different operating temperatures under a constant pressure of 10 bar and a flow rate of 120 N L/h. Given that CO2 methanation is a highly exothermic reaction, understanding its thermal behavior is essential, as temperature influences not only the reaction kinetics but also catalyst stability and product selectivity. At lower temperatures (i.e., 260–300 °C), conversion was limited due to slower kinetics, while at higher temperatures (i.e., above 400 °C), the conversion began to decline despite the increased reaction rate. This decrease at elevated temperatures was attributed to thermodynamic limitations: since the Sabatier reaction releases heat, increasing the temperature disfavored the forward reaction and shifted the equilibrium towards the reactants. Additionally, higher temperatures may promote RWGS reactions, leading to undesired CO formation and reduced methane yield. Furthermore, in industrial settings, prolonged exposure to high temperatures could also risk catalyst deactivation [30]. As observed from the simulation results, the highest conversion, approaching 90%, was achieved at around 320 °C.
Figure 10b shows the results of a sensitivity study on the effect of pressure over CH4 yield across a range of temperatures. As pressure increased from 1 to 10 bar, the CH4 yield curve shifted slightly upwards, in line with Le Chatelier’s principle. The highest CH4 yields were achieved at 320–350 °C, confirming this temperature range as optimal under the simulated conditions, aligning with prior studies. Gao et al. [11] reported that increasing the temperature above 400 °C led to increased CO production due to the RWGS, which suppressed methane generation. Consistently, experimental measurements by Currie et al. [23] highlighted that higher bed temperatures above 360 °C led to lower CO2 conversion, indicating the importance of proper bed cooling during methanation. Wang et al. [31] noted a slight decline in CO2 conversion above 360 °C, attributing it to side reactions (i.e., steam reforming and water–gas shift/RWGS). The authors also reported long-term, stable methanation activity under these moderate-temperature conditions. Additionally, Miguel et al. [32] reported formation of coke at lower temperatures, near 250 °C, with its extent heavily tied to feed composition (i.e., H2/CO2 ratio). Furthermore, various kinetic datasets and plant observations on Ni-catalyzed CO2 methanation [26] emphasize temperature control, commonly lower than 350 °C, to sustain methanation performance and that operation at elevated temperature accelerates deactivation pathways for Ni catalysts (e.g., sintering and carbon formation), indicating that moderate temperatures provide a practical compromise between stability and activity.
The current model analyzed isothermal, steady-state, fixed-bed CO2 methanation without accounting for energy transport or catalyst deactivation, and thus the reported operating window should be interpreted as an isothermal baseline. Overall, both temperature-focused studies demonstrated that moderate temperature and elevated pressure jointly promote high conversion.

3.3.2. Flow Rate Variation

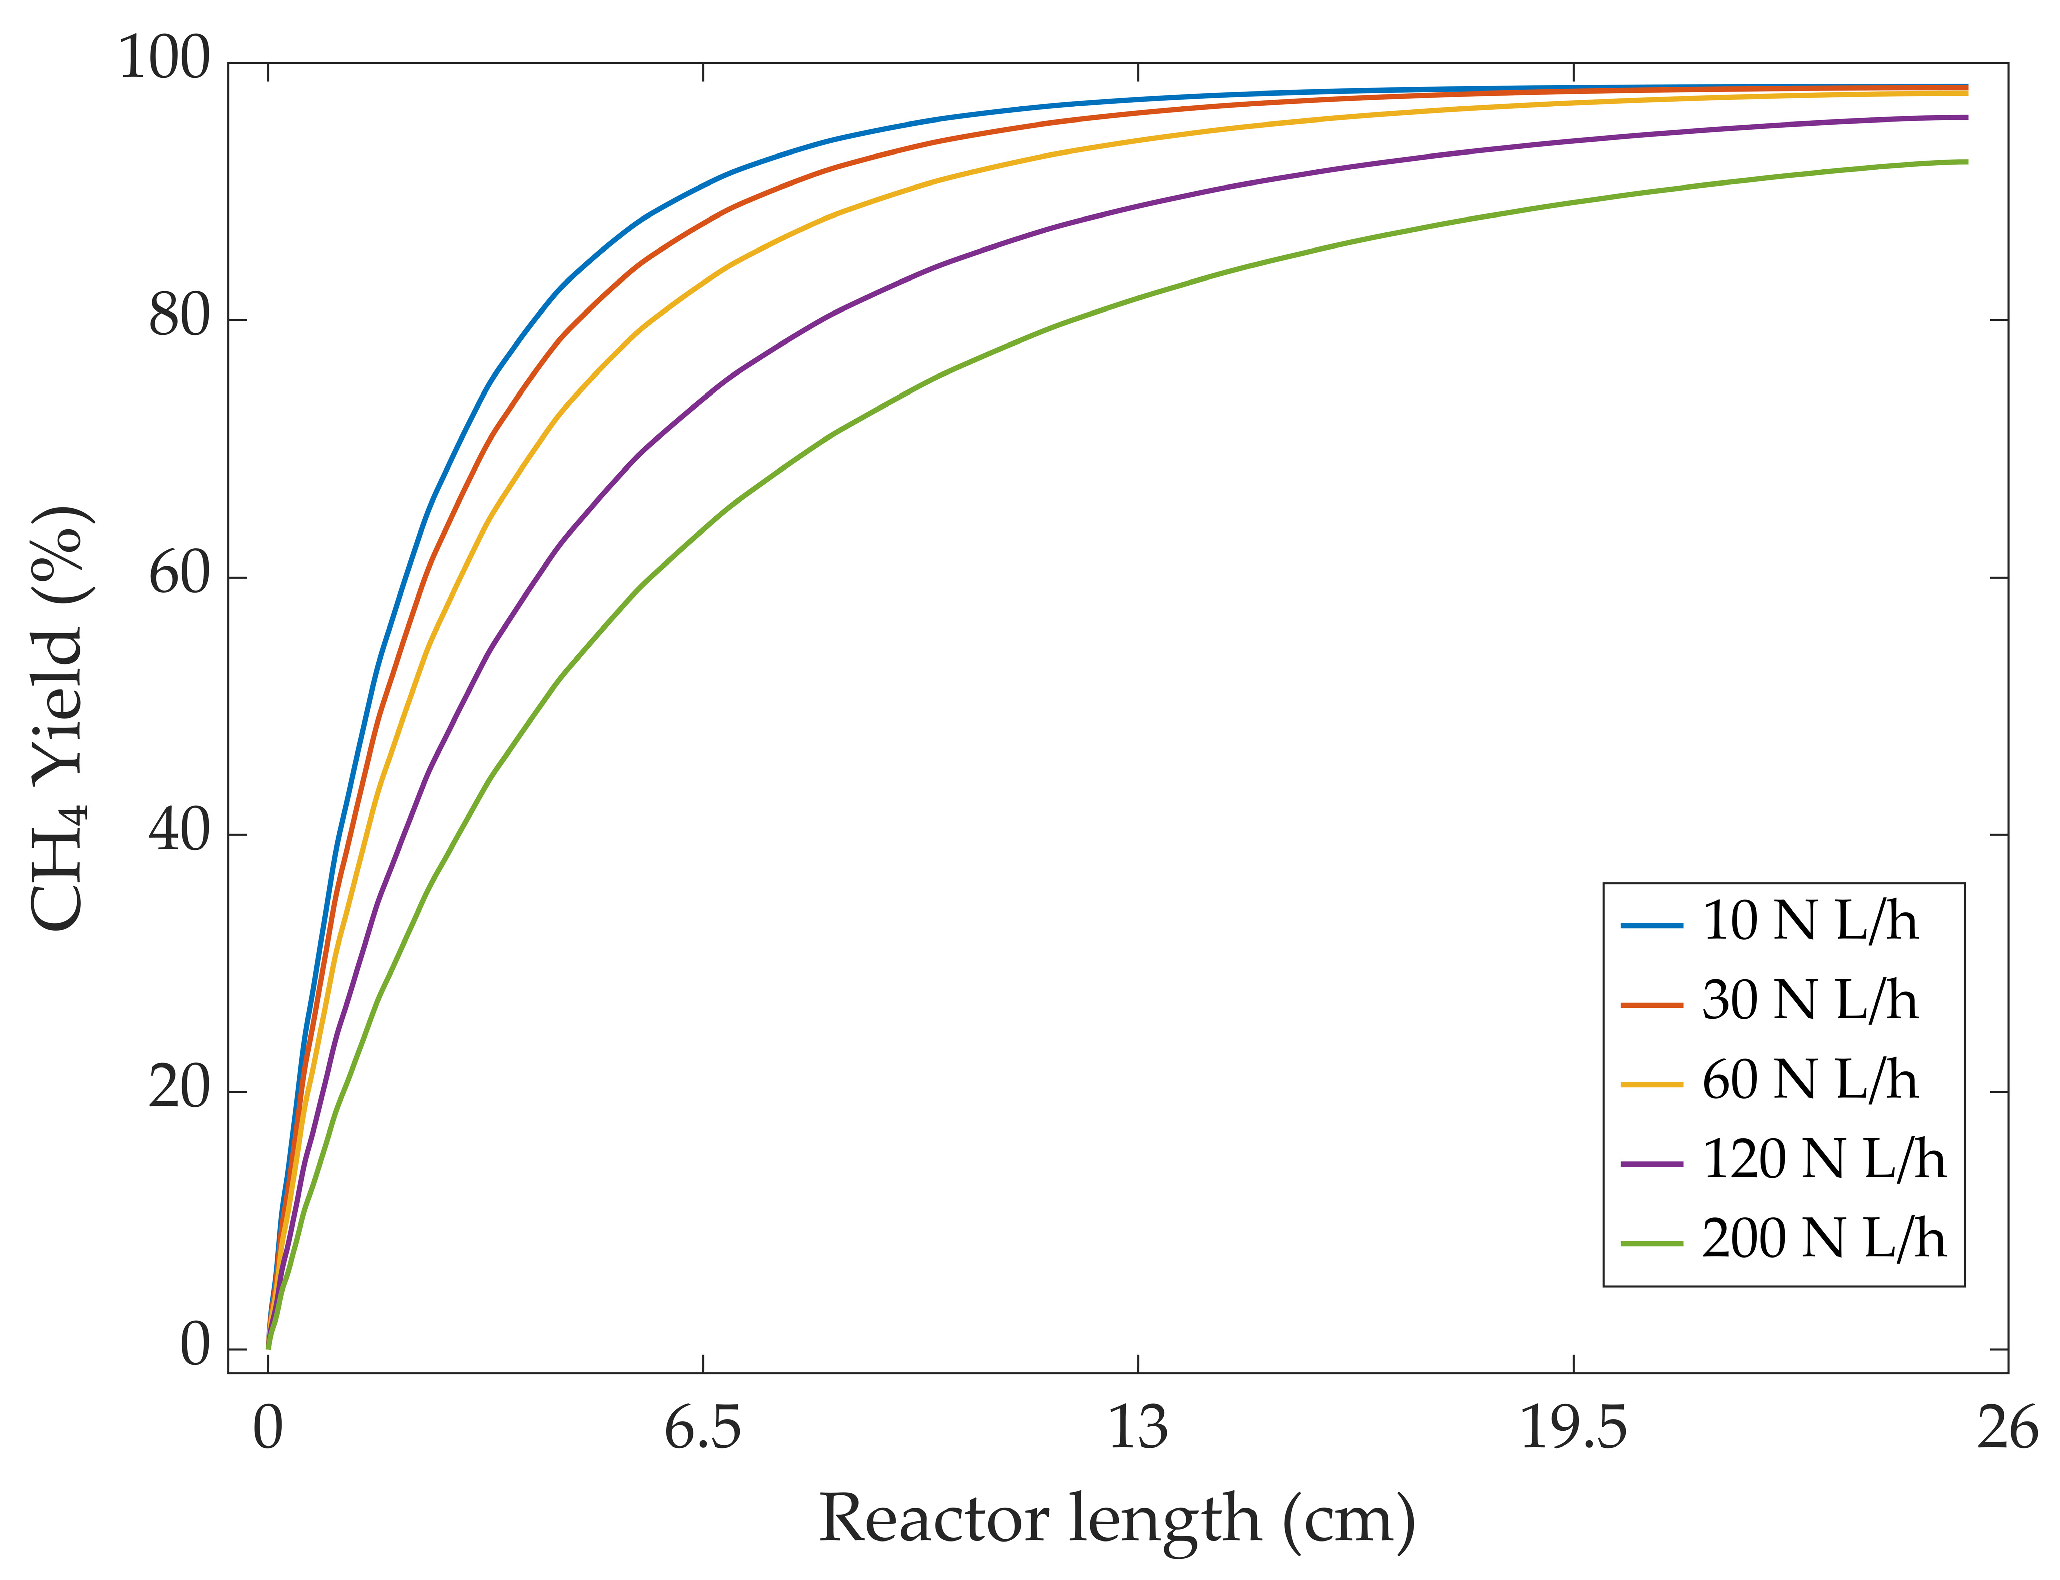
Figure 11 presents the effect of varying inlet flow rates on CH4 yield as a function of reactor length at a constant temperature of 327 °C and pressure of 10 bar. Simulation results indicated that lower flow rates (e.g., 10 N L/h) resulted in significantly higher methane yields along the reactor length, with near-complete conversion achieved within the first half of the bed. As the flow rate increased, the available residence time for the reactants to engage within the catalyst particles decreased, limiting the extent of the reaction and resulting in a reduced CH4 yield, especially in the initial section of the reactor.
This behavior reflected the inherent trade-off between reactor throughput and conversion efficiency. Lower flow rates favored higher conversion and yield due to prolonged gas–solid contact, while higher flow rates enhanced throughput at the cost of incomplete reaction. Notably, all investigated flow rates eventually approached high CH4 yield values (>85%) by the end of the reactor bed.
From an industrial scale-up perspective, a lower inlet flow increases residence time and boosts per-pass conversion and CH4 yield, but reduces specific throughput and requires a larger catalyst volume. Raising flow increases throughput per bed, but shortens residence time, so that achieving the same outlet CH4/CO2-slip target typically needs either a longer reactive bed or recycled feed, while also exhibiting higher pressure drop and associated energy costs.

3.3.3. Inlet Gas Composition Variation

Various H2/CO2 ratios (Table 3) were considered to evaluate H2-lean to H2-rich operation scenarios with foci on thermodynamics, kinetics, and industrial practice: (i) 3/2–5/2 (i.e., H2-deficient) investigated H2 limited kinetics, relevant to direct biogas upgrading and dynamic PtG operation for constrained H2 supply, (ii) 10/3 (i.e., near-stoichiometric ratio) gauged how closely to stoichiometry the process could be operated without triggering RWGS penalties, (iii) 4/1 (i.e., stoichiometric ratio) is a widely cited threshold where deposition of carbon is negligible thermodynamically and exhibits high CH4 selectivity at equilibrium, and (iv) 5/1 (i.e., mild H2 excess) tested the benefits of driving to equilibrium quicker and suppressed RWGS at the expense of H2 consumption [26]. In industrial practice, the choice of ratio may also depend on the cost and availability of H2, CO2-slip specifications, the risk of coking, reactor size–recycling cycle, and overall plant efficiency.
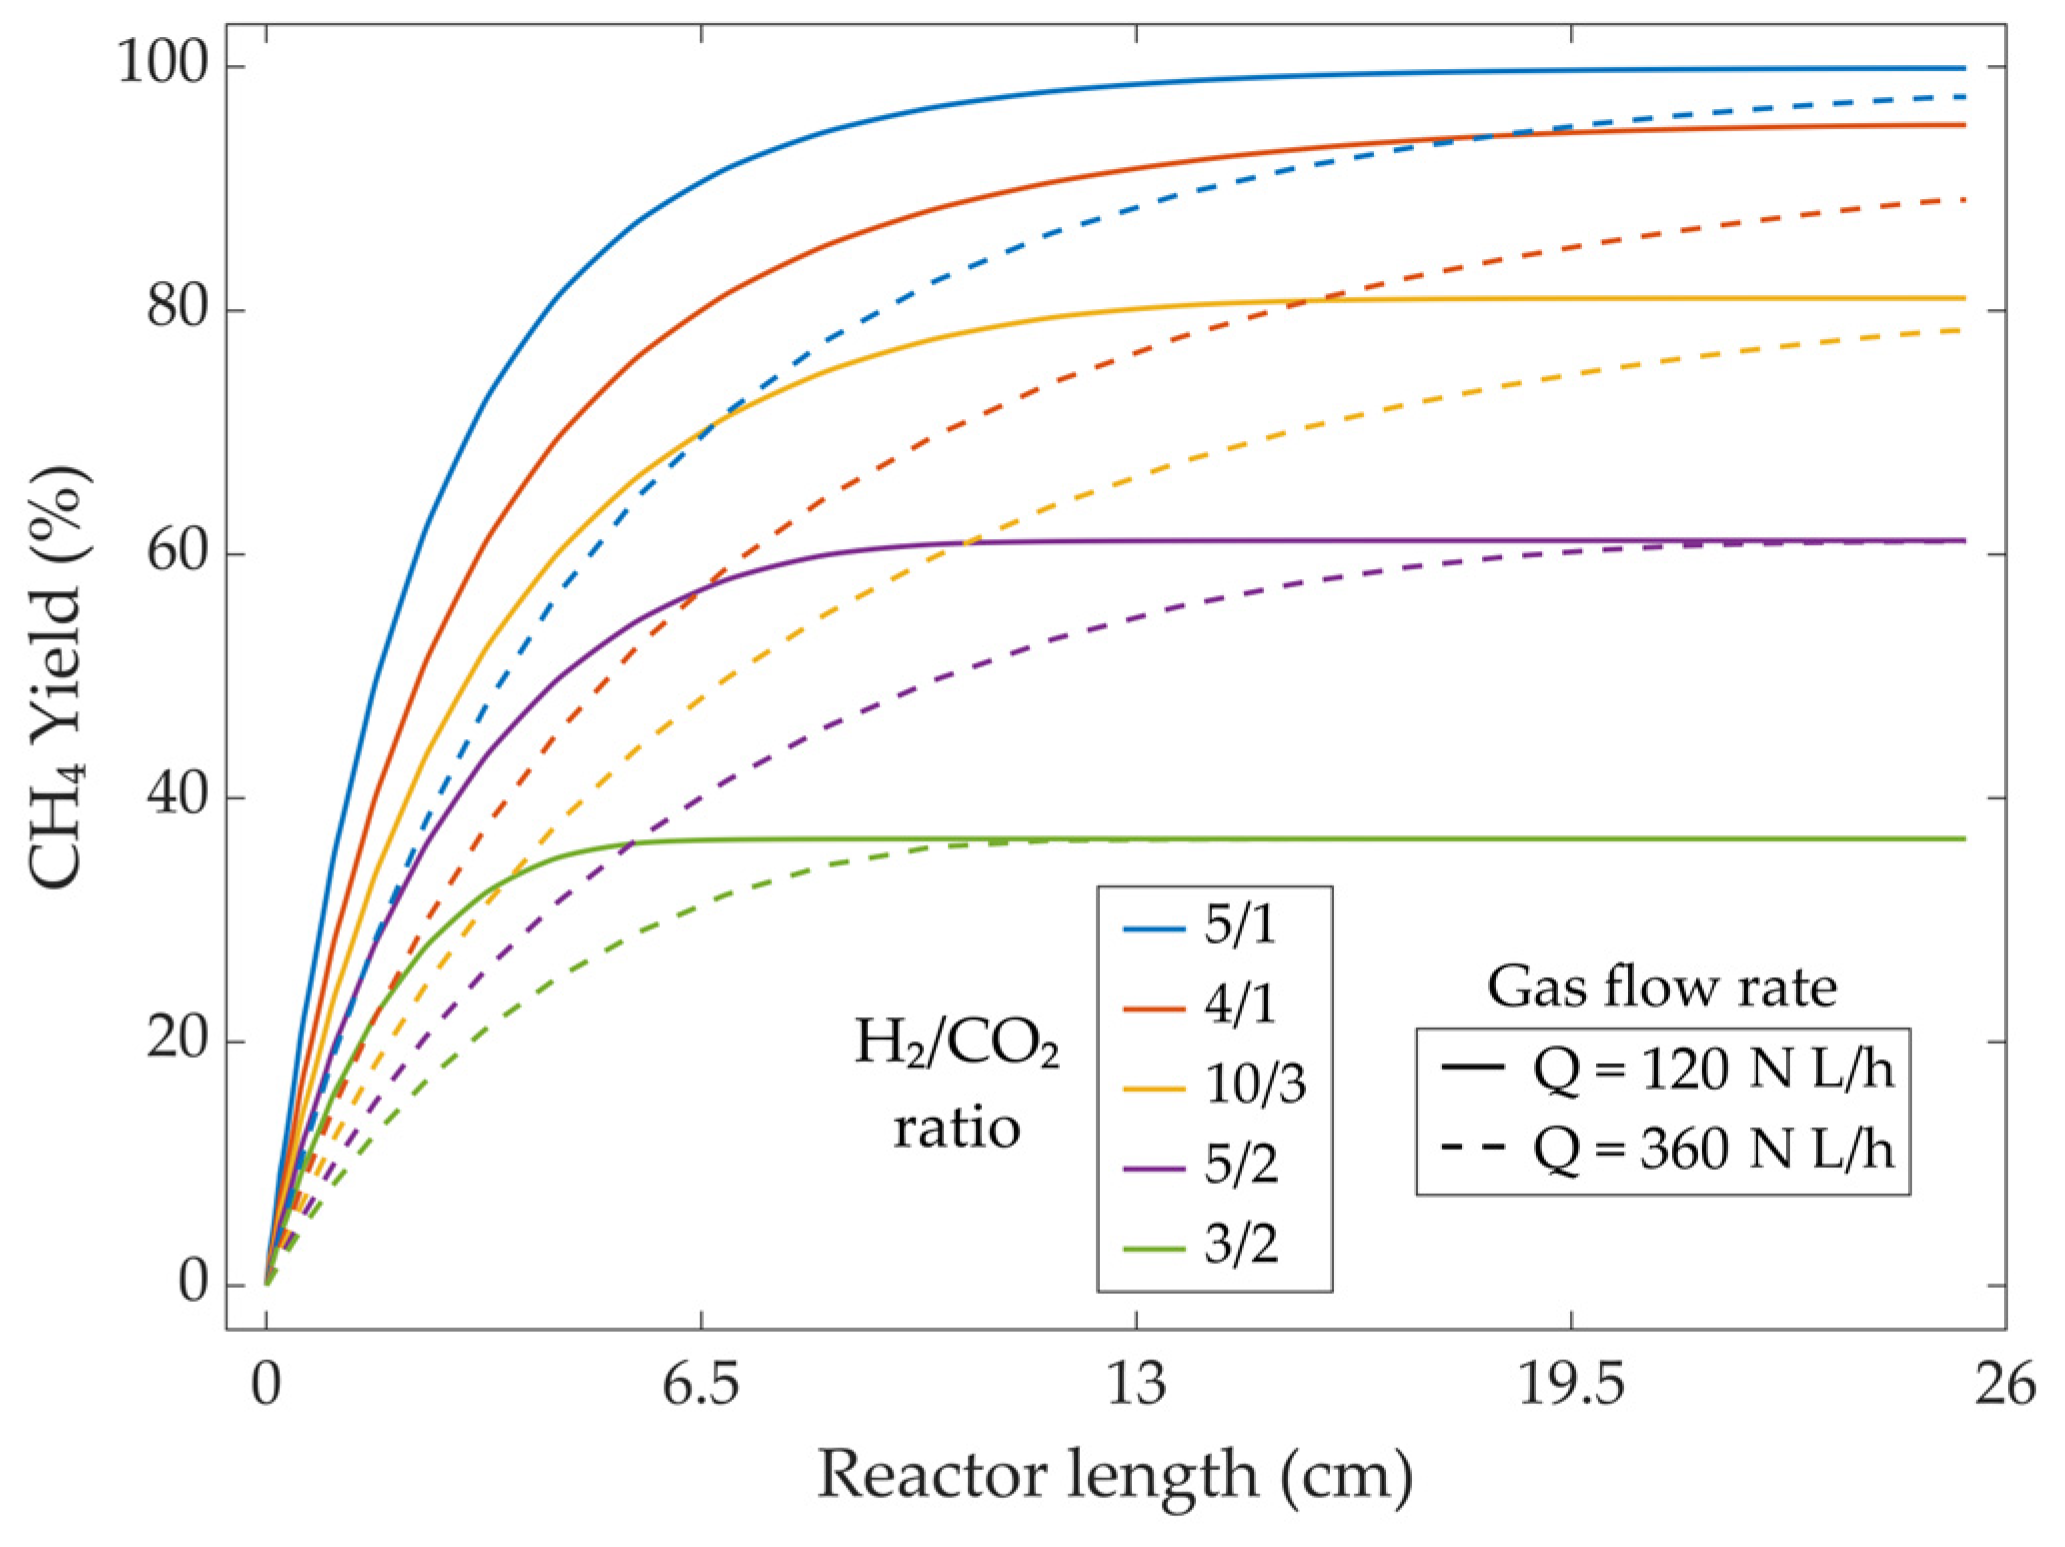
Figure 12 illustrates the influence of inlet gas composition, specifically the H2/CO2 molar ratio, on CH4 yield along the reactor length under two different flow rate conditions: 120 N L/h (solid lines) and 360 N L/h (dashed lines). The simulated results indicated that higher hydrogen availability significantly enhanced CH4 production. At a fixed flow rate of 120 N L/h, the CH4 yield increased progressively with increasing H2/CO2 ratios, reaching near-complete conversion at a ratio of 5/1. This result was in line with stoichiometric expectations (i.e., 4 moles H2 to 1 mole CO2) and thermodynamic favorability, since the additional H2 acted as an excess that drove the system closer to an equilibrium state.
Conversely, near-stoichiometric ratios (e.g., 3/2 or 5/2) resulted in lower yields due to hydrogen deficiency, which limited the extent of methanation. In addition, these conditions can promote competing reactions (e.g., RWGS), further reducing methane selectivity [30].
The effect of increased flow rate (i.e., 360 N L/h) was also evident: for all compositions, the CH4 yield was lower compared to the case at 120 N L/h. This outcome was attributed to reduced residence time, limiting the gas–solid contact necessary for full conversion, especially under less hydrogen-rich conditions.

4. Conclusions

In this study, a multiscale 3D CFD model of CO2 methanation over a Ni/Al2O3 catalyst in a lab-scale isothermal fixed-bed Sabatier reactor was developed in COMSOL Multiphysics 6.3 and validated with experimental data published in the literature. The multiscale model coupled macroscale convection–dispersion, fluid flow, and pressure fields with microscale intraparticle diffusion–reaction kinetics based on the LHHW approach to explicitly resolve transport limitations, as opposed to available models on methanation. The model was validated on: (i) kinetics–CO2 conversion profiles matched literature data (two experimental sets: R2 = 0.9939, RMSE = 1.7271 and R2 = 0.9971, RMSE = 2.0170, respectively), (ii) reactor performance–axial composition profiles matched literature data (RMSE = 1.3075), as well as (iii) hydrodynamics—the simulated bed pressure drop agreed with the Ergun correlation, confirming an accurate velocity field.
Multiscale results highlighted strong diffusion limited effects at the bed entrance based on the rates of reactant consumption and product formation. Transitioning downstream as partial pressures decreased and products accumulated, a diffusion-relieved regime was observed within the catalyst particles, indicating negligible remaining mass-transfer resistance and an approach to equilibrium.
Sensitivity studies identified an optimal temperature range of 320–350 °C for enhanced conversion, with declining values at higher temperatures due to equilibrium constraints. Additionally, simulation results indicated that elevated pressures up to 10 bar consistently increased methane yield. Furthermore, flow rate studies showed that lower values improved early-bed conversion (i.e., near-complete conversion within half the bed length) and overall conversion, whereas higher flow rate preserved throughput at the cost of delayed conversion, with all cases reaching at least >85% yield. Moreover, variation in H2/CO2 feed ratio confirmed that mildly H2-rich feeds achieved near-complete conversion, with excess H2 accelerating the approach to equilibrium.
The present work establishes a baseline via multiscale modeling for investigating coupled kinetic and transport phenomena in isothermal Sabatier reactors that can be used in guiding process intensification. Future work will extend the framework to (i) non-isothermal operation by solving gas–solid energy balances to predict catalyst hotspot formation and evaluate suitable heat removal options, (ii) larger or more complex reactor designs (e.g., multi-tubular, fluidized bed), and (iii) incorporation of catalyst deactivation kinetics (i.e., sintering and coking) to quantify performance drift under non-isothermal operation.

Author Contributions

Conceptualization, A.-M.C. and V.-C.S.; methodology, V.-C.S.; software, A.-C.B. and A.-M.B.; validation, A.-C.B. and V.-C.S.; formal analysis, A.-C.B., A.-M.B. and V.-C.S.; investigation, A.-M.B. and V.-C.S.; resources, A.-M.C.; data curation, A.-M.B.; writing—original draft preparation, A.-M.B. and V.-C.S.; writing—review and editing, A.-C.B. and V.-C.S.; visualization, A.-C.B.; supervision, V.-C.S.; project administration, A.-M.C. All authors have read and agreed to the published version of the manuscript.

Funding

This research received no external funding.

Data Availability Statement

Dataset available on request from the authors.

Conflicts of Interest

The authors declare no conflicts of interest.

Nomenclature

cBulk-phase concentration (mol/m3)
cpIntraparticle concentration (mol/m3)
DLAxial dispersion diffusion coefficient (m2/s)
DpIntraparticle diffusion coefficient (m2/s)
Dp,effEffective intraparticle diffusion coefficient (m2/s)
EaActivation energy (kJ/mol)
hDMass transfer coefficient (m/s)
ΔHReaction enthalpy (kJ/mol)
iSpecies index (-)
IIdentity tensor (-)
JpMolar flux from the free fluid into a pellet (mol/(m2·s))
kRate coefficient (mol/(bar·s·gcat))
KAdsorption constant (bar−0.5)
KeEquilibrium constant (-)
PPressure (bar)
rRadial coordinate (-)
rpCatalyst particle radius (m)
RInterparticle reaction rate in the bed (mol/(m3·s))
RpReaction rate (mol/(m3·s))
SbSpecific surface of the bed (m2/m3)
TTemperature (K)
TrefReference temperature (K)
uVelocity (m/s)
Greek symbols
εbBed porosity (i.e., void) (-)
εpParticle porosity (i.e., void) (-)
ε,∆PSuccessive-refinement relative change (%)
κPermeability (m2)
μDynamic viscosity (Pa·s)
ρDensity (kg/m3)
Abbreviations
CCUCarbon capture and utilization
CFDComputational fluid dynamics
GHGGreenhouse gas
LHHWLangmuir–Hinshelwood–Hougen–Watson
PtGPower-to-gas
RWGSReverse water–gas shift
SNGSynthetic natural gas

References

  1. IPCC. Climate Change 2023: Synthesis Report. Contribution of Working Groups I, II and III to the Sixth Assessment Report of the Intergovernmental Panel on Climate Change; IPCC: Geneva, Switzerland, 2023. [Google Scholar]
  2. NASA Carbon Dioxide|Vital Signs—Climate Change. Available online: https://climate.nasa.gov/vital-signs/carbon-dioxide/ (accessed on 25 May 2025).
  3. International Energy Agency (IEA). CO2 Emissions in 2023; IEA: Paris, France, 2024. [Google Scholar]
  4. IEA. Renewables 2024; IEA: Paris, France, 2024. [Google Scholar]
  5. Ren, J.; Lou, H.; Xu, N.; Zeng, F.; Pei, G.; Wang, Z. Methanation of CO/CO2 for Power to Methane Process: Fundamentals, Status, and Perspectives. J. Energy Chem. 2023, 80, 182–206. [Google Scholar] [CrossRef]
  6. Rönsch, S.; Schneider, J.; Matthischke, S.; Schlüter, M.; Götz, M.; Lefebvre, J.; Prabhakaran, P.; Bajohr, S. Review on Methanation—From Fundamentals to Current Projects. Fuel 2016, 166, 276–296. [Google Scholar] [CrossRef]
  7. Gao, R.; Zhang, C.; Jun, K.W.; Kim, S.K.; Park, H.G.; Zhao, T.; Wang, L.; Wan, H.; Guan, G. Green Liquid Fuel and Synthetic Natural Gas Production via CO2 Hydrogenation Combined with Reverse Water-Gas-Shift and Co-Based Fischer-Tropsch Synthesis. J. CO2 Util. 2021, 51, 101619. [Google Scholar] [CrossRef]
  8. Guilera, J.; Ramon Morante, J.; Andreu, T. Economic Viability of SNG Production from Power and CO2. Energy Convers. Manag. 2018, 162, 218–224. [Google Scholar] [CrossRef]
  9. Kirchbacher, F.; Biegger, P.; Miltner, M.; Lehner, M.; Harasek, M. A New Methanation and Membrane Based Power-to-Gas Process for the Direct Integration of Raw Biogas—Feasability and Comparison. Energy 2018, 146, 34–46. [Google Scholar] [CrossRef]
  10. Patrizio, P.; Chinese, D. The Impact of Regional Factors and New Bio-Methane Incentive Schemes on the Structure, Profitability and CO2 Balance of Biogas Plants in Italy. Renew. Energy 2016, 99, 573–583. [Google Scholar] [CrossRef]
  11. Gao, J.; Wang, Y.; Ping, Y.; Hu, D.; Xu, G.; Gu, F.; Su, F. A Thermodynamic Analysis of Methanation Reactions of Carbon Oxides for the Production of Synthetic Natural Gas. RSC Adv. 2012, 2, 2358–2368. [Google Scholar] [CrossRef]
  12. Lee, W.J.; Li, C.; Prajitno, H.; Yoo, J.; Patel, J.; Yang, Y.; Lim, S. Recent Trend in Thermal Catalytic Low Temperature CO2 Methanation: A Critical Review. Catal. Today 2021, 368, 2–19. [Google Scholar] [CrossRef]
  13. Shen, C.; Liu, M.; He, S.; Zhao, H.; Liu, C. Advances in the Studies of the Supported Ruthenium Catalysts for CO2 Methanation. Chin. J. Catal. 2024, 63, 1–15. [Google Scholar] [CrossRef]
  14. Ridzuan, N.D.M.; Shaharun, M.S.; Anawar, M.A.; Ud-Din, I. Ni-Based Catalyst for Carbon Dioxide Methanation: A Review on Performance and Progress. Catalysts 2022, 12, 469. [Google Scholar] [CrossRef]
  15. Medina, O.E.; Amell, A.A.; López, D.; Santamaría, A. Comprehensive Review of Nickel-Based Catalysts Advancements for CO2 Methanation. Renew. Sustain. Energy Rev. 2025, 207, 114926. [Google Scholar] [CrossRef]
  16. Gaikwad, R.; Villadsen, S.N.B.; Rasmussen, J.P.; Grumsen, F.B.; Nielsen, L.P.; Gildert, G.; Møller, P.; Fosbøl, P.L. Container-Sized CO2 to Methane: Design, Construction and Catalytic Tests Using Raw Biogas to Biomethane. Catalysts 2020, 10, 1428. [Google Scholar] [CrossRef]
  17. Stangeland, K.; Kalai, D.; Li, H.; Yu, Z. CO2 Methanation: The Effect of Catalysts and Reaction Conditions. Energy Procedia 2017, 105, 2022–2027. [Google Scholar]
  18. Sun, D.; Simakov, D.S.A. Thermal Management of a Sabatier Reactor for CO2 Conversion into CH4: Simulation-Based Analysis. J. CO2 Util. 2017, 21, 368–382. [Google Scholar] [CrossRef]
  19. Brooks, K.P.; Hu, J.; Zhu, H.; Kee, R.J. Methanation of Carbon Dioxide by Hydrogen Reduction Using the Sabatier Process in Microchannel Reactors. Chem. Eng. Sci. 2007, 62, 1161–1170. [Google Scholar] [CrossRef]
  20. Sudiro, M.; Bertucco, A.; Groppi, G.; Tronconi, E. Simulation of a Structured Catalytic Reactor for Exothermic Methanation Reactions Producing Synthetic Natural Gas. Comput. Aided Chem. Eng. 2010, 28, 691–696. [Google Scholar] [CrossRef]
  21. Hervy, M.; Maistrello, J.; Brito, L.; Rizand, M.; Basset, E.; Kara, Y.; Maheut, M. Power-to-Gas: CO2 Methanation in a Catalytic Fluidized Bed Reactor at Demonstration Scale, Experimental Results and Simulation. J. CO2 Util. 2021, 50, 101610. [Google Scholar] [CrossRef]
  22. Lefebvre, J.; Götz, M.; Bajohr, S.; Reimert, R.; Kolb, T. Improvement of Three-Phase Methanation Reactor Performance for Steady-State and Transient Operation. Fuel Process. Technol. 2015, 132, 83–90. [Google Scholar] [CrossRef]
  23. Currie, R.; Mottaghi-Tabar, S.; Zhuang, Y.; Simakov, D.S.A. Design of an Air-Cooled Sabatier Reactor for Thermocatalytic Hydrogenation of CO2: Experimental Proof-of-Concept and Model-Based Feasibility Analysis. Ind. Eng. Chem. Res. 2019, 58, 12964–12980. [Google Scholar] [CrossRef]
  24. Dannesboe, C.; Hansen, J.B.; Johannsen, I. Catalytic Methanation of CO2 in Biogas: Experimental Results from a Reactor at Full Scale. React. Chem. Eng. 2019, 5, 183–189. [Google Scholar] [CrossRef]
  25. Herrmann, F.; Grünewald, M.; Meijer, T.; Gardemann, U.; Feierabend, L.; Riese, J. Operating Window and Flexibility of a Lab-Scale Methanation Plant. Chem. Eng. Sci. 2022, 254, 117632. [Google Scholar] [CrossRef]
  26. Tommasi, M.; Degerli, S.N.; Ramis, G.; Rossetti, I. Advancements in CO2 Methanation: A Comprehensive Review of Catalysis, Reactor Design and Process Optimization. Chem. Eng. Res. Des. 2024, 201, 457–482. [Google Scholar] [CrossRef]
  27. Koschany, F.; Schlereth, D.; Hinrichsen, O. On the Kinetics of the Methanation of Carbon Dioxide on Coprecipitated NiAl(O)x. Appl. Catal. B 2016, 181, 504–516. [Google Scholar] [CrossRef]
  28. Ergun, S. Fluid Flow through Packed Columns. Chem. Eng. Prog. 1952, 48, 89–94. Available online: https://www.scirp.org/reference/referencespapers?referenceid=2324749 (accessed on 21 July 2025).
  29. Shirsath, A.B.; Schulte, M.L.; Kreitz, B.; Tischer, S.; Grunwaldt, J.D.; Deutschmann, O. Spatially-Resolved Investigation of CO2 Methanation over Ni/γ-Al2O3 and Ni3.2Fe/γ-Al2O3 Catalysts in a Packed-Bed Reactor. Chem. Eng. J. 2023, 469, 143847. [Google Scholar] [CrossRef]
  30. Gamal, A.; Jlassi, K.; Ahmad, Y.H.; Tang, M.; Al-Qaradawi, S.Y.; Chehimi, M.M.; Ozoemena, K.I.; Abdullah, A.M. Carbon-Supported Catalysts for Carbon Dioxide Methanation: A Review. J. CO2 Util. 2024, 85, 102881. [Google Scholar] [CrossRef]
  31. Wang, W.; Duong-Viet, C.; Ba, H.; Baaziz, W.; Tuci, G.; Caporali, S.; Nguyen-Dinh, L.; Ersen, O.; Giambastiani, G.; Pham-Huu, C. Nickel Nanoparticles Decorated Nitrogen-Doped Carbon Nanotubes (Ni/N-CNT); A Robust Catalyst for the Efficient and Selective CO2 Methanation. ACS Appl. Energy Mater. 2019, 2, 1111–1120. [Google Scholar] [CrossRef]
  32. Miguel, C.V.; Soria, M.A.; Mendes, A.; Madeira, L.M. Direct CO2 Hydrogenation to Methane or Methanol from Post-Combustion Exhaust Streams—A Thermodynamic Study. J. Nat. Gas Sci. Eng. 2015, 22, 1–8. [Google Scholar] [CrossRef]
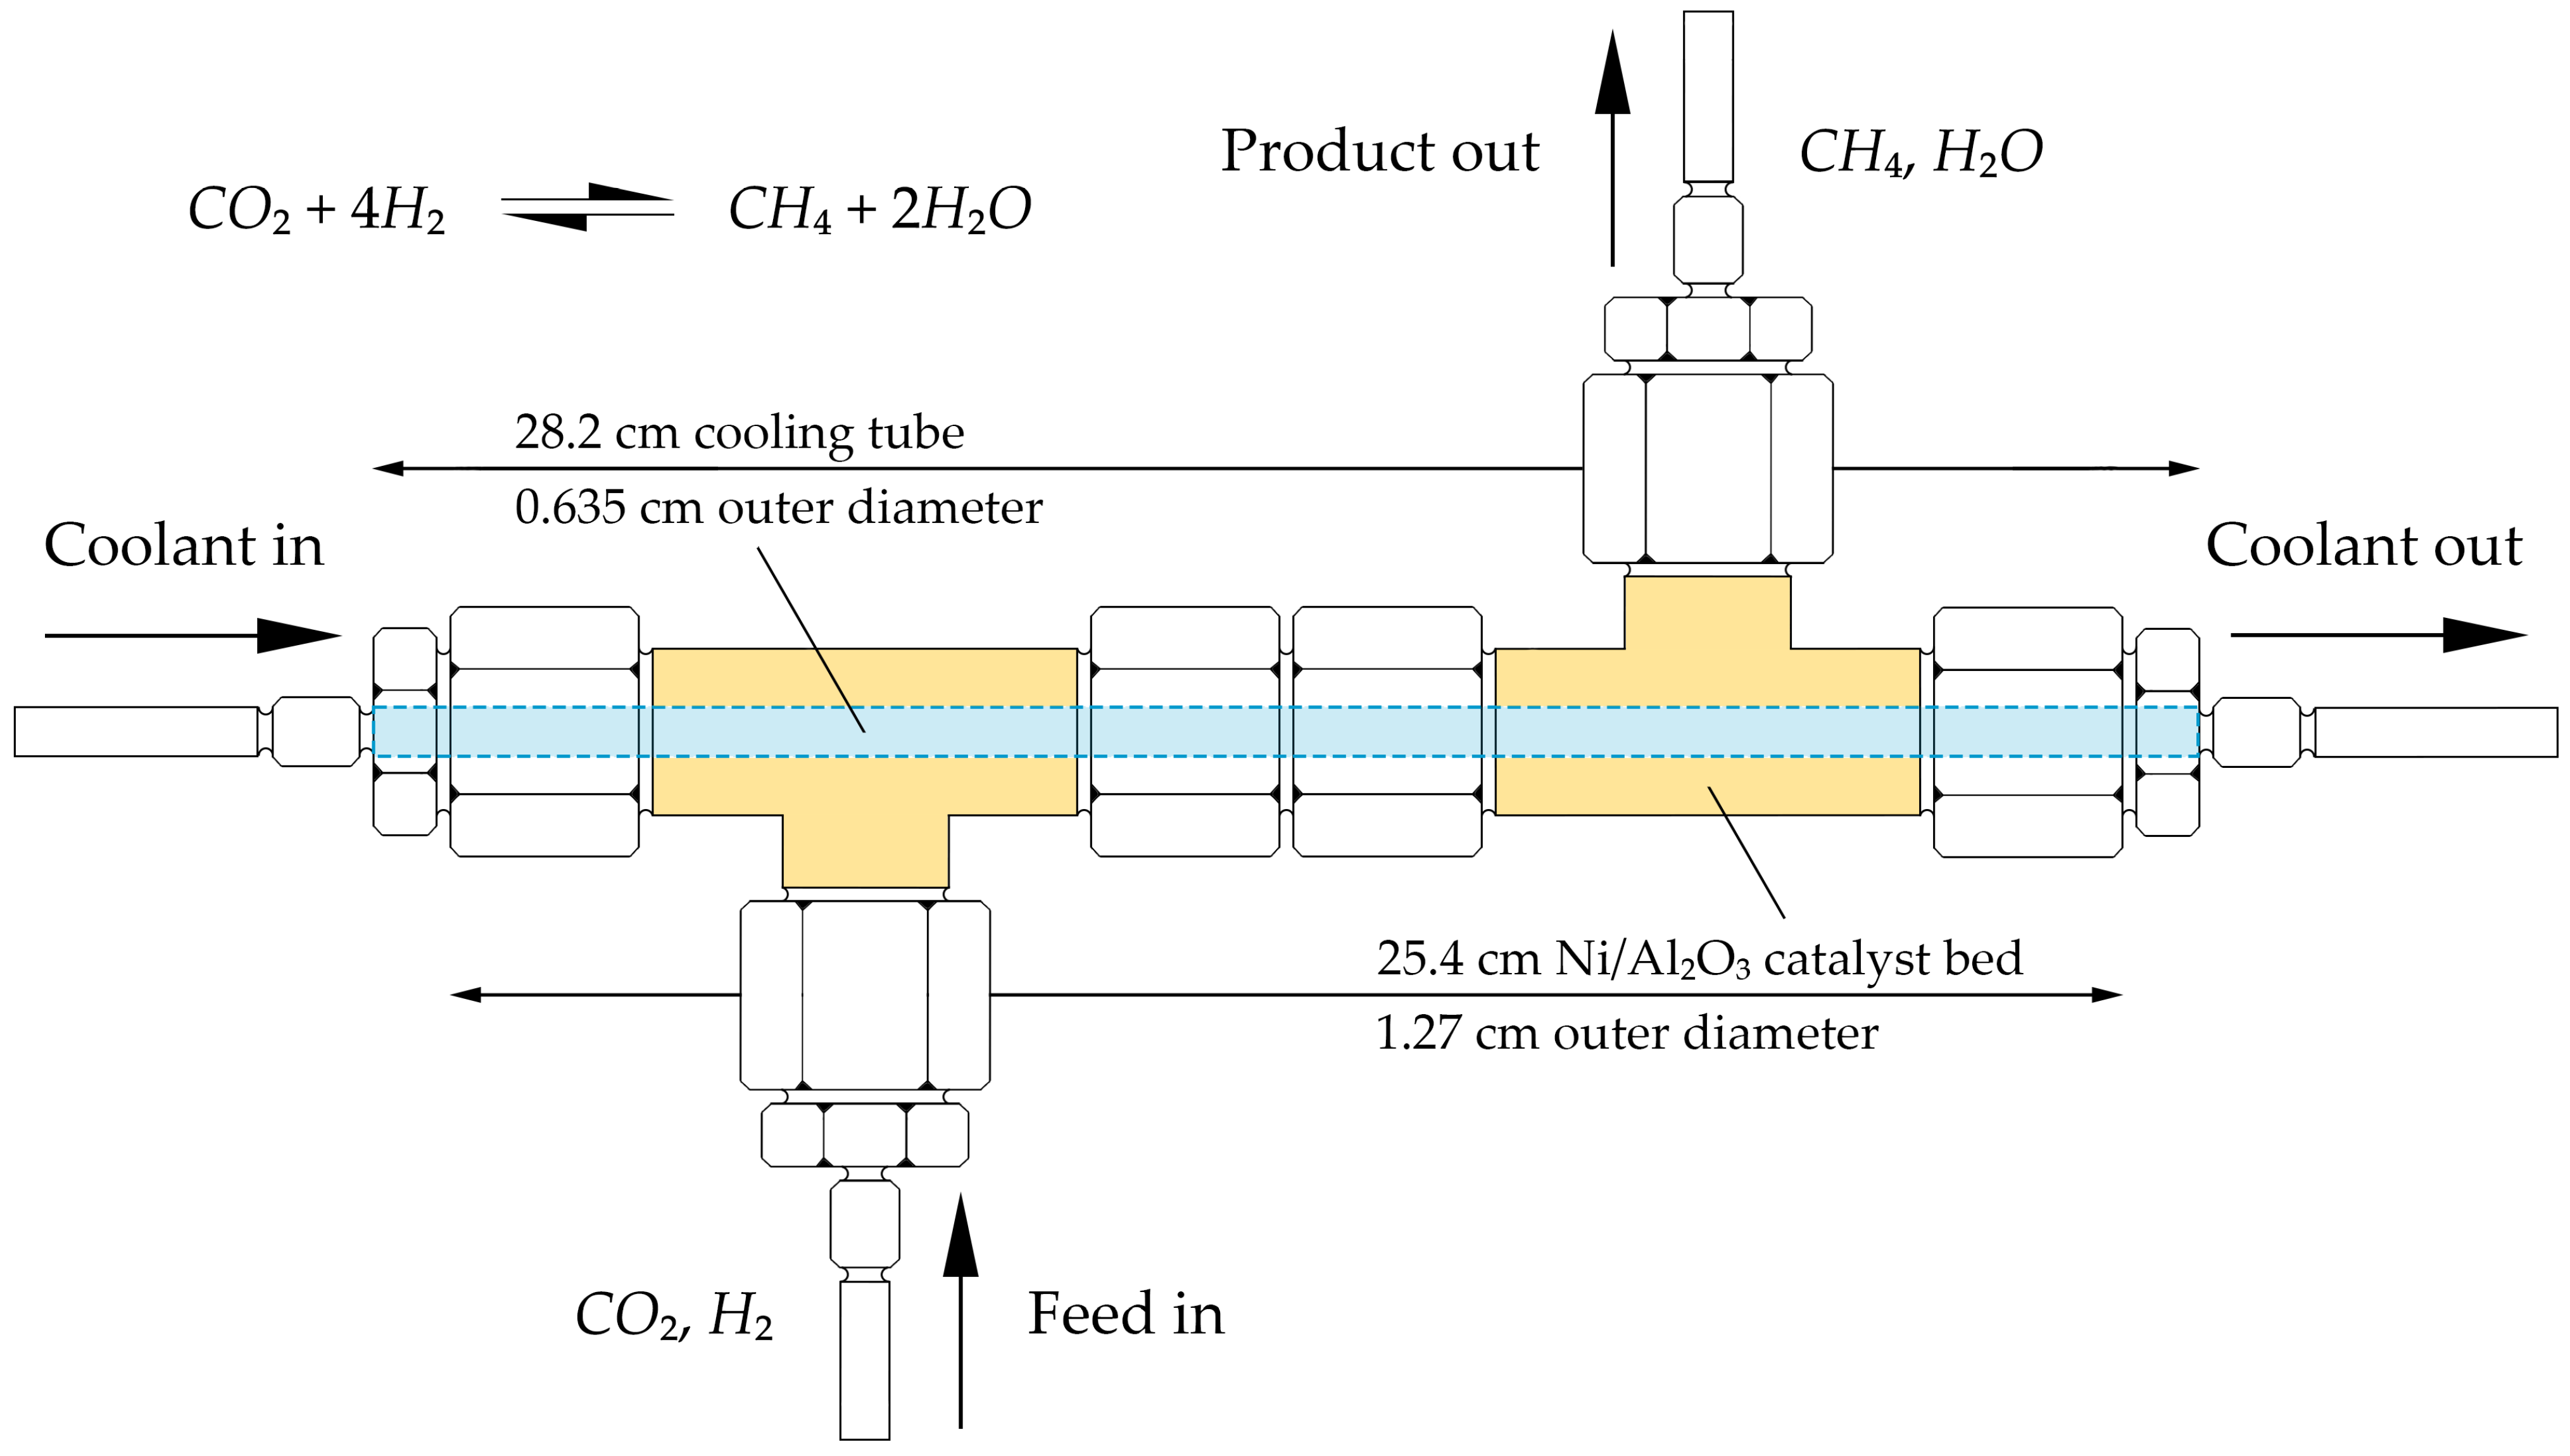
Figure 1. Schematic of the laboratory-scale Sabatier reactor adopted from Currie et al. [23] and utilized in the present modeling work.
Fuels 06 00079 g001
Figure 2. (a) Reactor model geometry; (b) multiscale approach simulating both macro- and microscale transport phenomena; (c) inlet domain mesh; (d) catalyst support plate mesh.
Fuels 06 00079 g002
Figure 3. Mesh convergence analysis indicating independence was achieved at 12,355,148 elements.
Fuels 06 00079 g003
Figure 4. Kinetic model validation with published experimental data [27]. Catalyst mass 25 mg (a): CO2 conversion vs. temperature at different gas compositions (vol%). Gas flow rate 120 N L/(h∙gcat), pressure 6 bar (R2 = 0.9939, RMSE = 1.7271). (b) CO2 conversion vs. temperature. Gas flow rate 150 N L/(h·gcat), pressure 8 bar (R2 = 0.9971, RMSE = 2.0170).
Fuels 06 00079 g004
Figure 5. Simulated and experimental [23] molar gas compositions vs. reactor length used for model validation (RMSE = 1.3075). Gas composition CO2/H2 = 4/1, gas velocity 0.2 m/s, pressure 5 bar, temperature 525 °C.
Fuels 06 00079 g005
Figure 6. Simulated pressure drop distribution profiles for the: (a) reactor; (b) catalyst bed.
Fuels 06 00079 g006
Figure 7. Simulated velocity profile at the reactor inlet section and bed entrance (i.e., catalyst support plate).
Fuels 06 00079 g007
Figure 8. Simulated concentration distribution (as absolute values) vs. reactor length.
Fuels 06 00079 g008
Figure 9. Simulated concentration distribution inside the catalyst particles located at the bed: (a) inlet; (b) outlet.
Fuels 06 00079 g009
Figure 10. Studies on temperature impact over CO2 methanation. Flow rate 120 N L/h. (a) CO2 conversion vs. reactor length at different temperatures. Pressure 10 bar; (b) CH4 yield vs. temperature at different pressures.
Fuels 06 00079 g010
Figure 11. CH4 yield vs. reactor length at various flow rate values. Temperature 327 °C, pressure 10 bar.
Fuels 06 00079 g011
Figure 12. CH4 yield vs. reactor length at different H2/CO2 inlet ratios and gas flow rates. Solid lines: Q = 120 N L/h; dashed lines: Q = 360 N L/h. Temperature 327 °C, pressure 10 bar.
Fuels 06 00079 g012
Table 1. Parameters used in the LHHW rate equation at reference temperature 555 K [27].
ParameterValueUnit
k0,555K3.46 × 10−4 ± 4.1 × 10⁻⁵mol/(bar∙s∙gcat)
Ea77.5 ± 6.9kJ/mol
KOH,555K0.5 ± 0.05bar(−0.5)
∆HOH22.4 ± 6.4kJ/mol
KH2,555K0.44 ± 0.08bar(−0.5)
∆HH2−6.2 ± 10kJ/mol
Kmix,555K0.88 ± 0.1bar(−0.5)
∆Hmix−10 ± 5.7kJ/mol
Table 2. Parameters and operating conditions used for model development and simulation.
ParameterValueParameterValue
Reactor length27.7 cmParticle porosity0.4
Bed length25.4 cmBed porosity0.5
Reactor diameter0.89 cmGas hourly space velocity5000 mL/(g∙h)
Particle diameter0.85 mmReactor temperature452 °C
Ni/Al2O3 catalyst mass62.5 gReactor pressure10 bar
Ni/Al2O3 catalyst density2352 kg/m3Ratio H2/CO24/1
Table 3. Parameters considered in sensitivity studies.
Inflow Gas Temperature (°C)Operating Pressure (bar)Flow Rate (N L/h)H2/CO2 Ratio
2601105/1
2803304/1
300106010/3
3201205/2
4002003/2
450360
Table 4. Model-predicted pressure drop vs. analytically calculated value across the packed bed.
Simulated ΔP (Pa)Analytical ΔP (Pa) [28]Relative Error (%)
2568.82568.70.004
Disclaimer/Publisher’s Note: The statements, opinions and data contained in all publications are solely those of the individual author(s) and contributor(s) and not of MDPI and/or the editor(s). MDPI and/or the editor(s) disclaim responsibility for any injury to people or property resulting from any ideas, methods, instructions or products referred to in the content.