Abstract
In this study, the impact of the electric motor size and the hybridization ratio of a Fuel Cell Electric Bus on its vehicle performance (i.e., gradeability and acceleration) and fuel consumption was investigated using the ADVISOR software. The investigation first involved a parametric analysis with different electric motor and fuel cell sizes for the dynamic performance metrics, specifically the 0–60 km/h vehicle acceleration and the maximum gradeability (%) at a constant speed of 20 km/h. The results revealed that the acceleration is most sensitive to fuel cell power. Regarding gradeability, a more complex relationship was observed: when the electric motor power was below 215 kW, gradeability remained consistently low regardless of the fuel cell size. However, for motors exceeding 215 kW, fuel cell power then became a significant influencing factor on the vehicle’s climbing capability. Subsequently, the analysis focused on the effect of the hybridization ratio, which represents the power balance between the fuel cell and the energy storage system, varied between 0 and 0.8. Results showed that increasing the hybridization ratio decreases gradeability and acceleration performance and increases total energy consumption. This trade-off is quantitatively illustrated by the results over the Central Business District (CBD) driving cycle. For instance, the pure battery-electric configuration (a hybridization ratio of 0), featuring a 296 kW battery system, recorded a gradeability of 12.4% and an acceleration time of 16.3 s, while consuming 28,916 kJ. At an intermediate hybridization ratio of 0.4 (composed of a 118.4 kW fuel cell and a 177.6 kW battery), performance remained high with a gradeability of 12.2% and an acceleration of 17.3 s, but the energy consumption increased to 43,128 kJ. Finally, in the fuel-cell-dominant configuration with a hybridization ratio of approximately 0.8 (a 236.8 kW fuel cell and a 59.2 kW battery), gradeability dropped to 8.4%, acceleration time deteriorated to 38.9 s, and total energy consumption increased further to 52,678 kJ over the CBD driving cycle.
1. Introduction
The global energy demand demonstrated a 2.2% increase in 2024, with the transportation sector being a significant contributor []. This sector’s energy consumption is largely driven by a global vehicle fleet that numbered 1.7 billion in 2023 and is estimated to hit 2.9 billion by 2050. The current prevalence of internal combustion engine (ICE) vehicles within this fleet, however, presents a critical challenge []. The combustion of fossil fuels in these vehicles is a primary source of modern air pollution and emissions, which are linked to severe health repercussions, especially among children. These impacts include impaired cognitive development, reduced IQ levels, respiratory illnesses like pneumonia, and a heightened risk of chronic diseases, disproportionately affecting children in low-income communities and thus creating an issue of environmental injustice (e.g., through a combination of proximity to transit corridors and the deployment of older, higher-emission fleets in these neighbourhoods) []. In response to these pressing concerns, a global shift towards electric vehicles (EVs) is anticipated to drive future market growth. When evaluating the operational emissions of ICE vehicles alongside the entire life cycle, both battery electric vehicles (BEVs) and fuel cell electric vehicles (FCEVs) offer a substantial potential for reducing global emissions [,].
FCEVs, a type of electric vehicle powertrain, do not generate tailpipe emissions such as carbon monoxide (CO), carbon dioxide (CO2), or nitrogen oxides (NOx) that are characteristic of ICE vehicles during operation, releasing only heat and water as byproducts. Furthermore, the structure of these vehicles is considerably simpler, quieter, and more efficient compared to their ICE counterparts []. When compared to BEVs, FCEVs offer distinct advantages, involving faster refuelling times and a longer operational range. However, the high initial purchasing cost of these vehicles, coupled with the sparse availability of a widespread hydrogen refuelling infrastructure, has constrained a substantial increase in their sales figures. As reported in the report from the Advanced Fuel Cells Technology Collaboration Programme (AFC TCP), by the conclusion of 2024, there were 97,356 FCEVs operating globally. South Korea occupies a notable position in this sector, representing 36% of the worldwide fleet. The majority of these vehicles are passenger cars, which constitute 69%, while heavy-duty trucks and buses account for 12% and 9%, respectively [].
FCEVs incorporate a hybrid powertrain design that integrates two separate power sources: a fuel cell stack and an energy storage system (ESS), which is usually a battery or a supercapacitor. The fuel cell stack functions as the main power source, supplying continuous power for ongoing operation, whereas the ESS serves as a supplementary power source, offering the transient power necessary for peak demands such as acceleration and recovering energy from regenerative braking. Additionally, the proportional sizing of these two power sources plays a crucial role in determining the vehicle’s total fuel consumption []. Consequently, the optimal sizing of these components and their corresponding power distribution strategies remain critical areas of research for facilitating the widespread adoption of FCEVs [].
This study presents a two-stage investigation into the powertrain sizing of a heavy-duty fuel cell electric bus (FCEB). The first stage consists of a broad parametric analysis to map the design space and understand the individual effects of the fuel cell and electric motor power on vehicle performance and efficiency. The second stage performs a focused analysis on the Degree of Hybridization (), examining the trade-offs between fuel consumption and charge sustainability for a fixed baseline powertrain. The evaluations were conducted using the Central Business District (CBD) driving cycle. This research aims to provide a comprehensive understanding of these competing objectives to inform the design of FCEBs for specific operational profiles. The remainder of this paper is organized as follows: Section 2 provides a literature review, Section 3 details the modelling and simulation methodology, the results are presented and discussed in Section 4, and the conclusions are given in Section 5.
2. Literature Review
A review of the existing literature reveals a significant research focus on the optimization of fuel cell passenger cars, while studies dedicated to heavy-duty vehicles such as buses and trucks have received comparatively less attention. KoteswaraRao K et al. utilized the Advanced Vehicle Simulator (ADVISOR) to model a Toyota Mirai and investigate the impact of powertrain component sizing on its fuel consumption and performance across various driving cycles. Their study identified an optimal sizing configuration, demonstrating that a simultaneous reduction in the fuel cell stack size from 114 kW to 80 kW and an increase in the number of battery modules from 37 to 75 resulted in both lower fuel consumption and enhanced gradeability. Notably, their analysis also revealed a critical tipping point: reducing the fuel cell size beyond this optimal configuration paradoxically increased fuel consumption []. Abdeldjalil et al. presented an integrated approach for component sizing and developing a new Energy Management Strategy (EMS) for FCEVs. Utilizing a Particle Swarm Optimization algorithm, their goal was to simultaneously minimize operating cost, fuel consumption, and component weight. The most significant finding emerged from their testing of different energy storage configurations. They demonstrated that incorporating a supercapacitor alongside the battery pack resulted in substantial fuel savings of 19% and 30.3% under the ARTEMIS and the New European Driving Cycle (NEDC), respectively, while also allowing for a reduction in the required maximum power of the fuel cell stack []. Focusing on the co-optimization of system design and control, Graber et al. proposed a joint sizing procedure for the fuel cell stack and battery modules, which was intrinsically linked to a novel power split strategy designed to maximize component lifetime. Their methodology demonstrated a significant reduction in the FCEV’s fuel consumption by up to 10% compared to existing strategies. Notably, the proposed approach also allows for the minimization of component sizes while simultaneously maximizing their expected lifespan, addressing a key trade-off in vehicle design []. To optimize the power split in a triple-source FCEV equipped with a fuel cell, battery, and ultracapacitor, Mounica and Obulesu proposed a hybrid power management strategy. Their approach uniquely combines an adaptive neuro-fuzzy inference system with the equivalent consumption minimization strategy (ECMS). When benchmarked against five other conventional control methods, the proposed hybrid strategy demonstrated superior performance, achieving an 8.7% reduction in hydrogen consumption []. Exploring the capabilities of an innovative powertrain architecture, Molina et al. examined the design parameters of a Fuel Cell Range-Extender (FCREx) vehicle. Through the optimization of the energy management strategy across various combinations of fuel cell output, battery size, and hydrogen storage, they evaluated the FCREx architecture against existing commercial FCEVs. Their results indicated that the range-extender setup can lead to considerable hydrogen consumption reductions, between 16.8% and 25%. Additionally, the research pinpointed an ideal design that strikes a balance between production costs and efficiency, suggesting a configuration with roughly 30 kWh of battery capacity and a fuel cell output of no less than 80 kW []. To improve both fuel economy and component longevity, Anbarasu et al. proposed an Advanced Dynamic Model Predictive Control strategy. This strategy is based on a Nonlinear Model Predictive Control (NMPC) structure that utilizes a multi-objective cost function with dynamic weights. The primary innovation is the use of a Fuzzy Cognitive Map to adaptively regulate the controller’s priorities in real-time based on driving conditions. The efficacy of this adaptive approach was demonstrated through comparative simulations in the ADVISOR environment against NMPC strategies with constant weights or fewer objectives [].
In contrast to the extensive body of literature dedicated to passenger cars, the optimization of heavy-duty vehicles, particularly FCEBs, has received comparatively less academic attention. This represents a critical research gap, as the unique operational profiles of transit buses, including frequent start–stop cycles, significant variations in passenger load, and high daily mileage, necessitate dedicated component sizing and energy management strategies that differ from those for passenger vehicles. The existing research in this domain, though limited, has provided foundational insights into various aspects of FCEB performance. For instance, Xu et al. proposed a theoretical model to elucidate the intricate relationship between powertrain component characteristics and overall vehicle performance. Their analysis quantitatively demonstrated several critical sensitivities. They found that an improvement in fuel cell efficiency from 48.3% to 55% yielded a substantial 14% reduction in fuel consumption. The study also highlighted the significant impact of the loads, noting that an increase in auxiliary power from 2 kW (without air conditioning) to 12 kW (with air conditioning) led to a 30% increase in fuel consumption. Furthermore, they mentioned that 50% increase in battery resistance caused an approximate 3.4% rise in fuel consumption []. Broatch et al. investigated various strategies for the thermal management system of a FCEB and examined their impact on fuel consumption. One of the most significant findings of their work was the observation that utilizing waste heat from the fuel cell for cabin heating could reduce fuel consumption by up to 7%. Another important finding was that during periods of high-power demand from the fuel cell, using its waste heat to preheat the batteries provided an average energy savings of 4% []. In a comparative study, Ahmadi et al. developed and evaluated diesel, diesel-hybrid, and fuel cell bus models through a comprehensive life-cycle assessment. Their findings indicate that from an environmental impact perspective, the fuel cell bus delivered the highest performance among the technologies assessed. The study also highlighted the critical role of component degradation, demonstrating that battery aging significantly impacts overall battery performance over time. One of the more intriguing results of their work relates to operational variability: an increase in passenger load was found to have the most pronounced effect on fuel consumption in the FCEB compared to its diesel and hybrid counterparts []. A notable techno-economic study by Kim et al. comparatively evaluated battery-electric and hydrogen fuel cell buses against conventional diesel buses in the context of a small to midsize city, utilizing a Total Cost of Ownership (TCO) model. For battery-electric buses, the analysis projected a significant cost reduction, with their TCO becoming 23.5% lower than diesel buses by 2030. In contrast, FCEBs were shown to have greater operational flexibility, as their longer range and similar refuelling times to diesel buses do not necessitate a critical hotspot infrastructure. However, under baseline projections, the TCO for FCEBs in 2030 was still 15.4% higher than for diesel buses. The study presented a crucial hypothetical scenario: if a regional scale-up of hydrogen infrastructure could reduce hydrogen costs to €5/kg, the FCEB’s TCO would drop to a level slightly below that of the diesel solution []. In addressing the economic challenges associated with the long-term operation of FCEBs, Jia et al. concentrated on reducing total operating expenses through the development of an innovative EMS that takes into account the degradation of essential powertrain components. The key innovation of their research was the unprecedented integration of three vital factors into a unified optimization framework: the thermal safety of lithium-ion batteries, awareness of battery degradation, and the suppression of fuel cell aging. The findings validated the efficacy of their method, revealing that the proposed strategy could decrease the battery aging rate by 34.8% and reduce total operating costs by 12.3% in comparison to a baseline strategy that overlooks thermal protection mechanisms [].
Although numerous studies concentrate on enhancing fuel efficiency in passenger fuel cell electric vehicles, there remains a deficiency in the systematic assessment of the trade-offs between essential dynamic performance indicators -namely gradeability and acceleration- and energy consumption within the framework of heavy-duty fuel cell electric buses. Therefore, this research aims to address this gap by developing a systematic sizing methodology that first explores the effects of the primary propulsion components (fuel cell and electric motor), and subsequently analyses the impact of the powertrain’s degree of hybridization on these conflicting objectives for a bus application.
3. Materials and Methods
This section describes the simulation-based approach utilized to examine the correlation between the sizing of powertrain components and the primary performance indicators of FCEB. A vehicle model was created within the ADVISOR framework, and its performance was assessed using the CBD driving cycle. The subsequent subsections provide detailed information on the vehicle model parameters, the models of the powertrain components, the criteria for performance evaluation, and the systematic analysis methodology.
3.1. Fuel Cell Electric Bus Model Development in ADVISOR
The ADVISOR is a well-recognized MATLAB/Simulink framework created by the National Renewable Energy Laboratory (NREL) for the purpose of simulating vehicle performance. Its adaptability enables researchers to develop vehicle models by either choosing from an extensive library of predefined components (including batteries, fuel cells, and wheels) or by incorporating custom-designed component models. This capability facilitates the assessment of various powertrain configurations across a diverse array of driving cycles. In addition to computing essential vehicle performance metrics such as acceleration, gradeability, and maximum speed, ADVISOR allows for a detailed examination of the system’s dynamic behaviour, enabling the analysis of time-series data from individual components, including the battery’s state of charge, the fuel converter’s operational efficiency, and the electric motor’s power output throughout the simulation period [,,].
The methodology in this study involves the simulation of the FCEB model using the ADVISOR software (version 2.0). The base model’s powertrain, featuring the specific fuel cell and battery systems under investigation, is based on our previous work []. To ensure a realistic representation of a transit bus, the physical chassis parameters were adopted from the NREL’s validated model of an Orion VI bus []. A summary of all baseline vehicle and powertrain parameters is provided in Table 1. It should be noted that the weight of the hydrogen storage system is included in the gross vehicle weight presented in Table 1, and the total storage capacity was not a limiting factor, as the analysis focuses on consumption rates over a set cycle rather than the vehicle’s total range.

Table 1.
Key Vehicle and Powertrain Parameters for the FCEB Model.
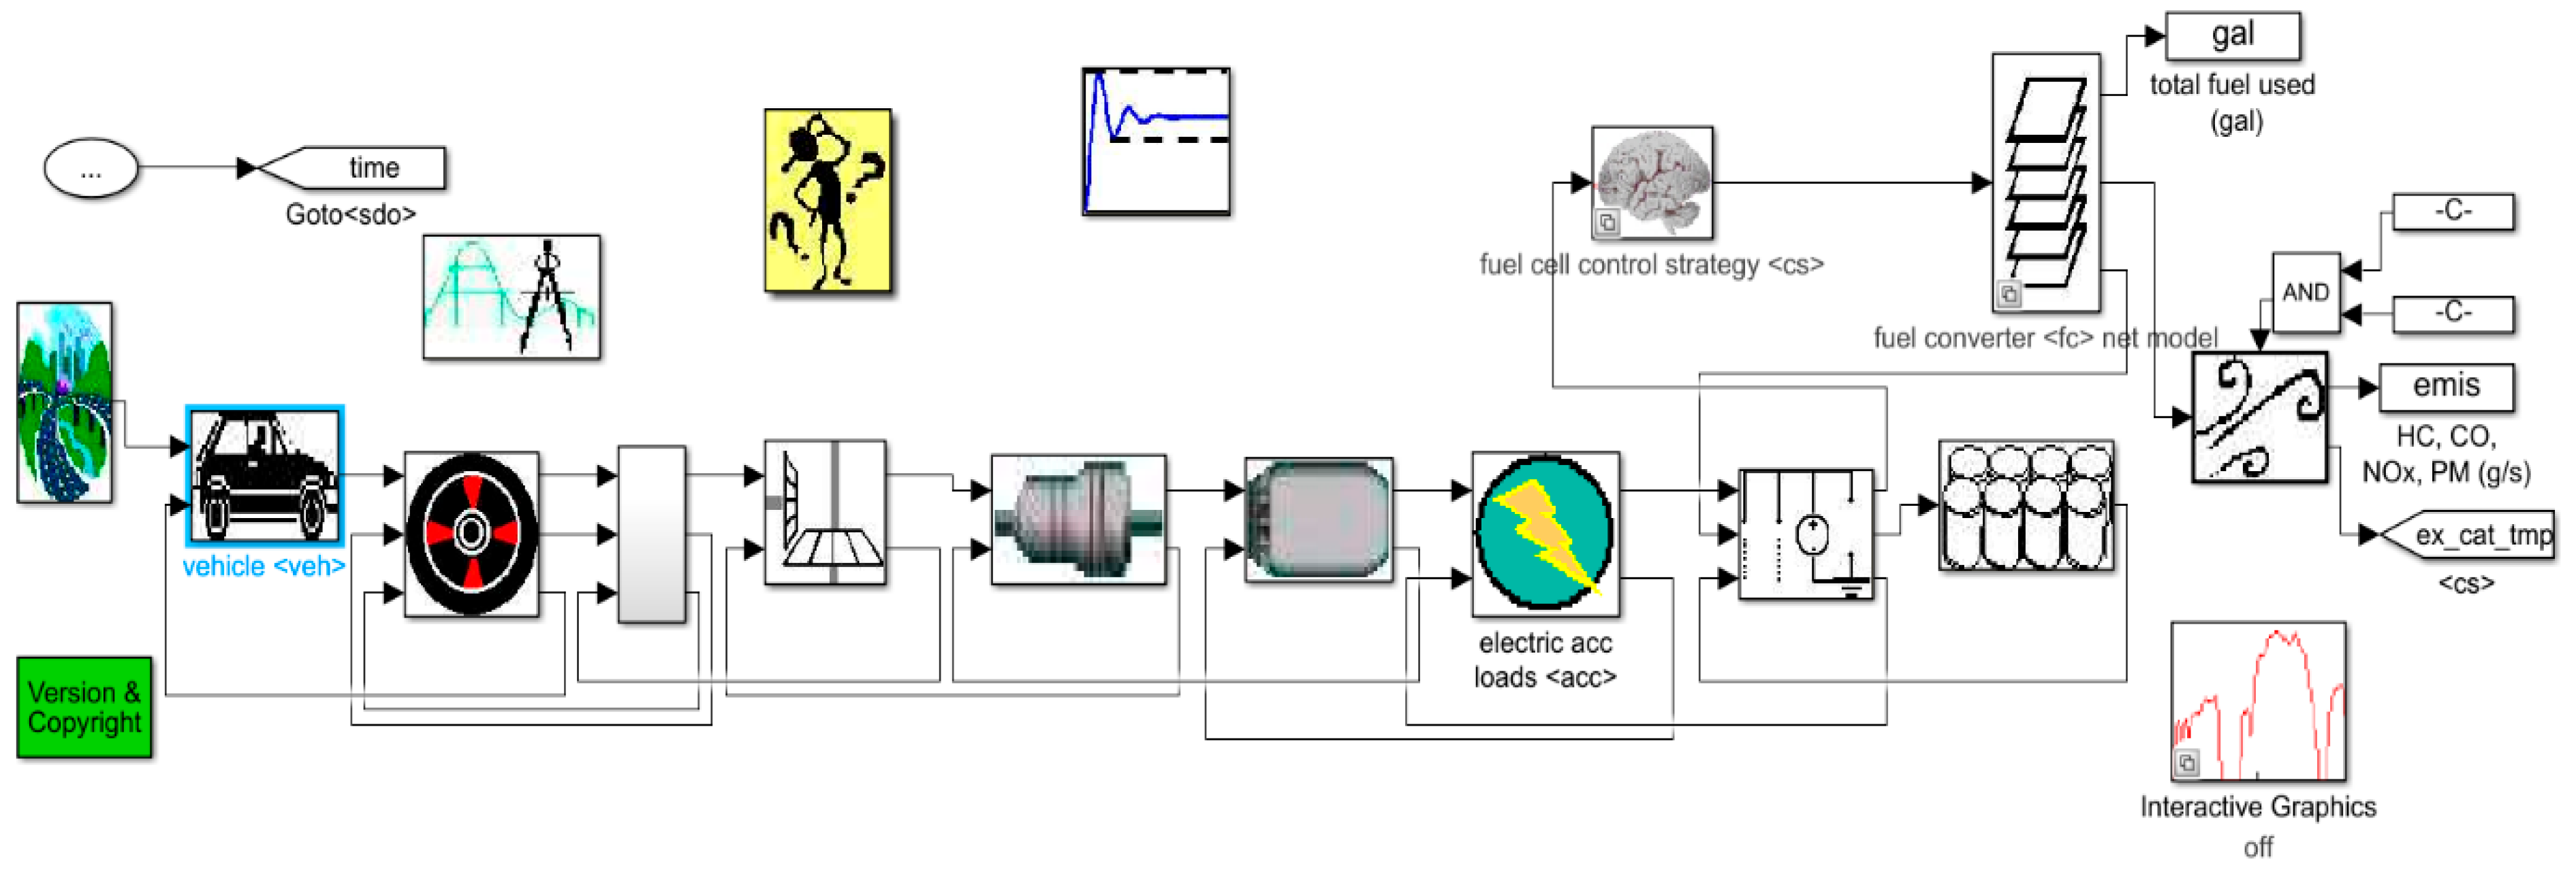
Figure 1 shows the powertrain of the FCEB. The model utilizes a backward-looking approach, where the required wheel torque to follow a specific driving cycle is calculated and propagated back to the powertrain components. As shown, the system is a FCEV integrating a fuel cell stack as the primary energy source and a battery pack as the energy storage system for peak power assistance and regenerative braking. The power split between these two sources is dictated by the EMS implemented in the ‘fuel cell control strategy’ block. The model accounts for key vehicle parameters, component efficiencies, and auxiliary loads to provide outputs such as hydrogen consumption and vehicle performance metrics.

Figure 1.
Powertrain of the modelled FCEB.
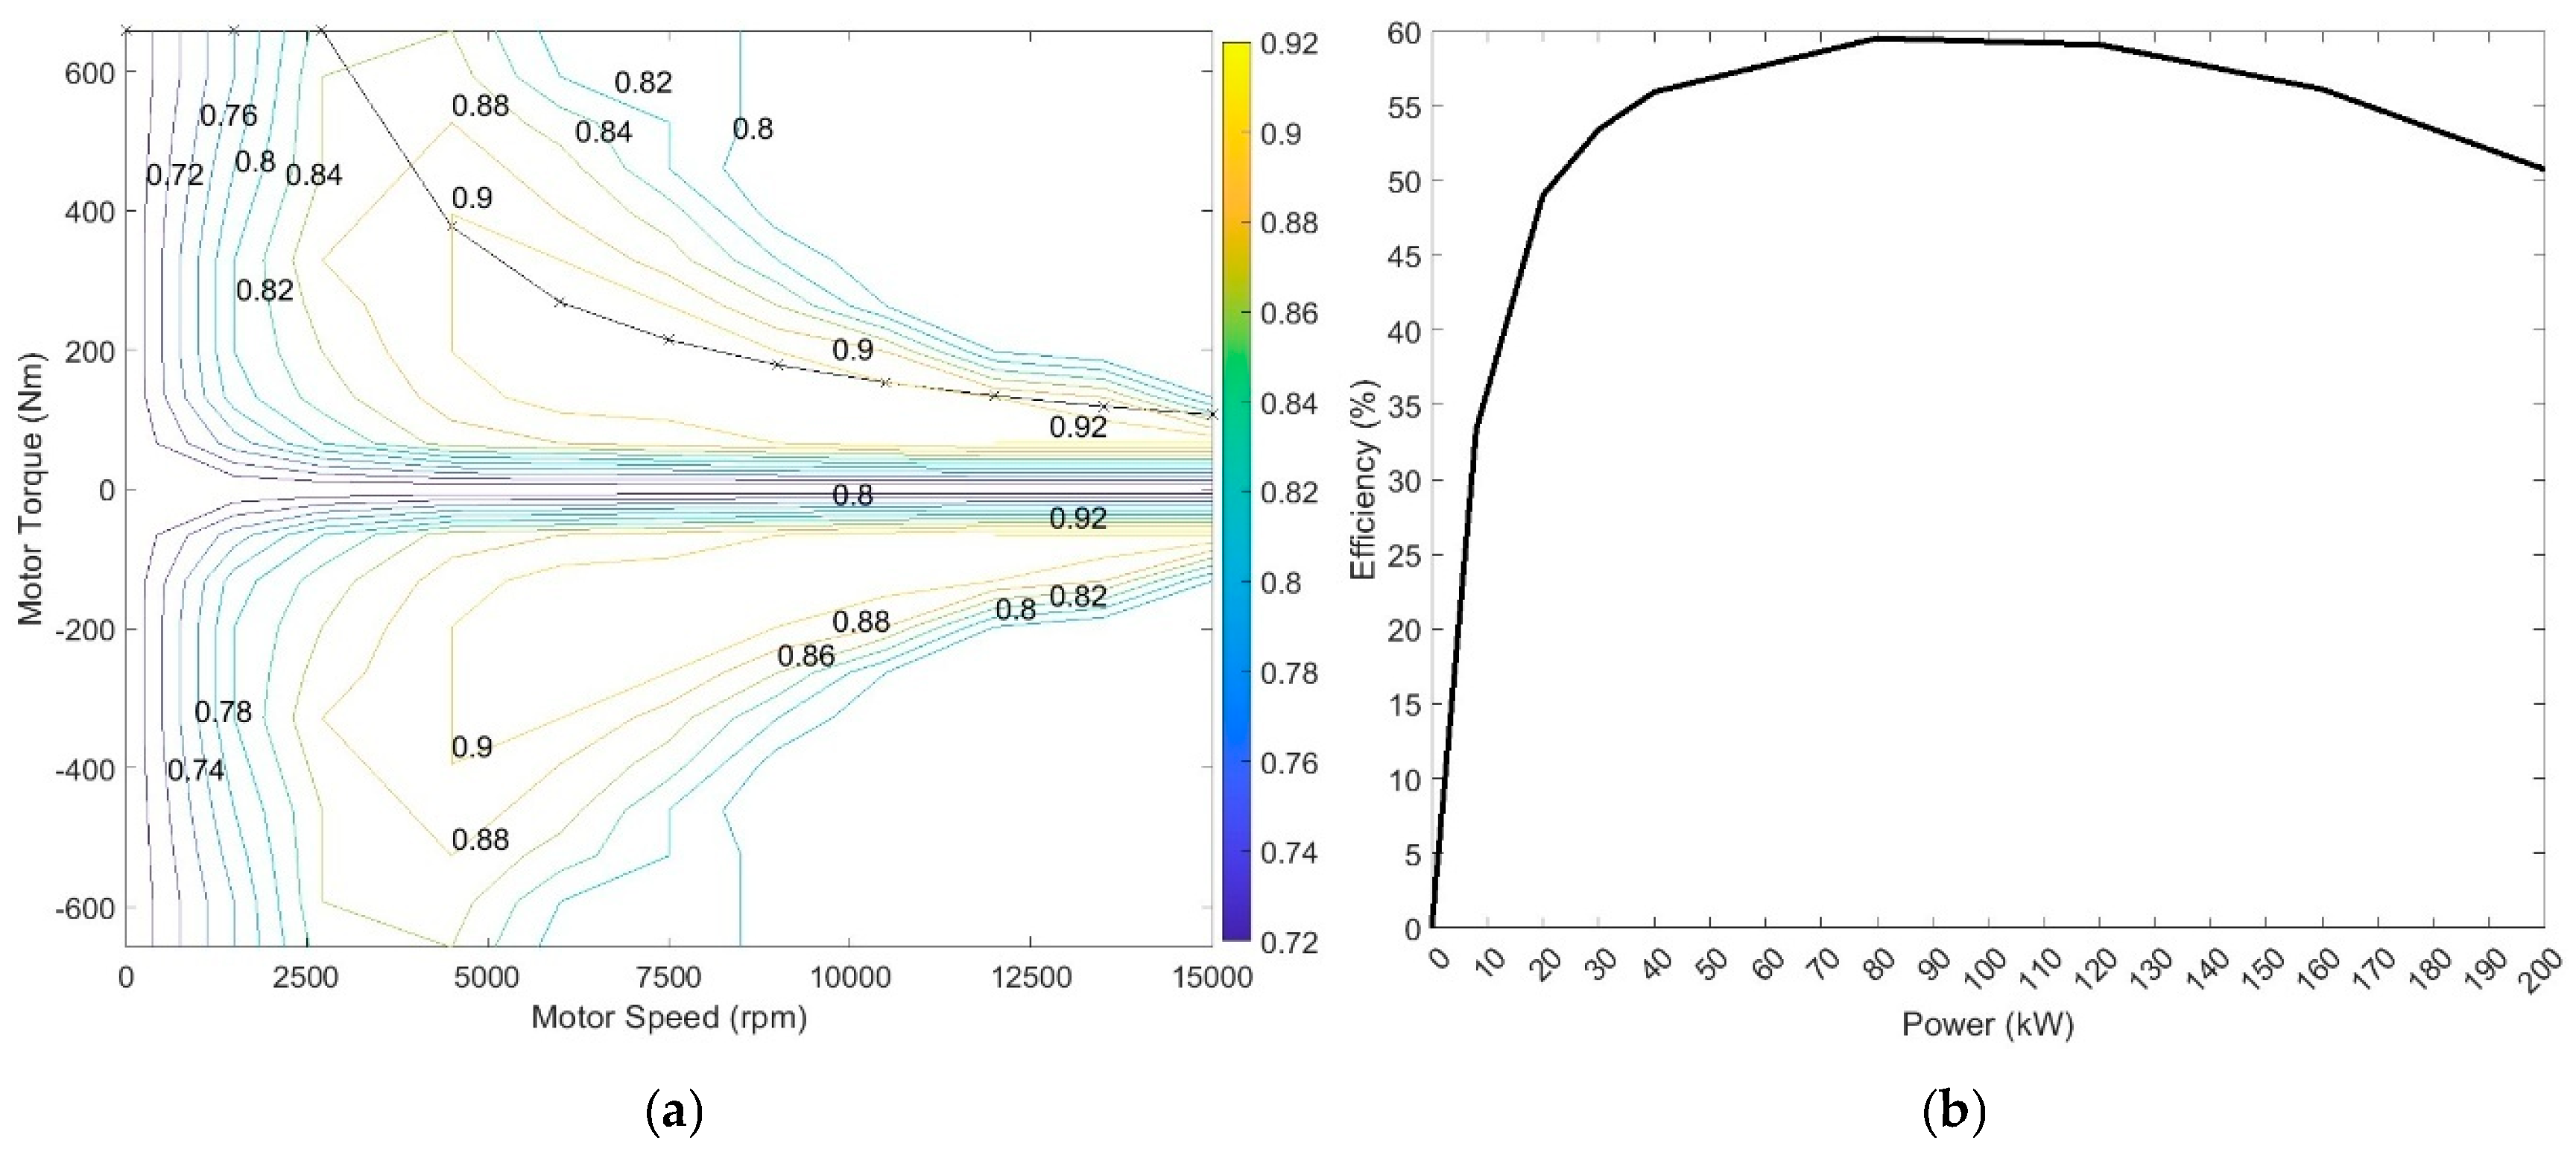
The performance of the primary powertrain components is defined by their respective efficiency characteristics within the ADVISOR model. The efficiency profile of the 187 kW AC induction motor, as a function of its speed and torque, is depicted in Figure 2a, showing a peak efficiency of approximately 92%. The 200 kW fuel cell system is characterized by its power-dependent efficiency curve, presented in Figure 2b. This curve illustrates that the fuel cell achieves its maximum efficiency of around 60% at a partial load (approx. 80 kW) and operates at lower efficiencies at very low or high power outputs. Fuel cell models exhibiting similar non-linear efficiency characteristics have been employed in comparable FCEB studies [,].

Figure 2.
Efficiency characteristics of the primary powertrain components: (a) Electric motor efficiency map; (b) Fuel cell system efficiency vs. power output.
3.2. Simulation Procedure and Evaluation Metrics
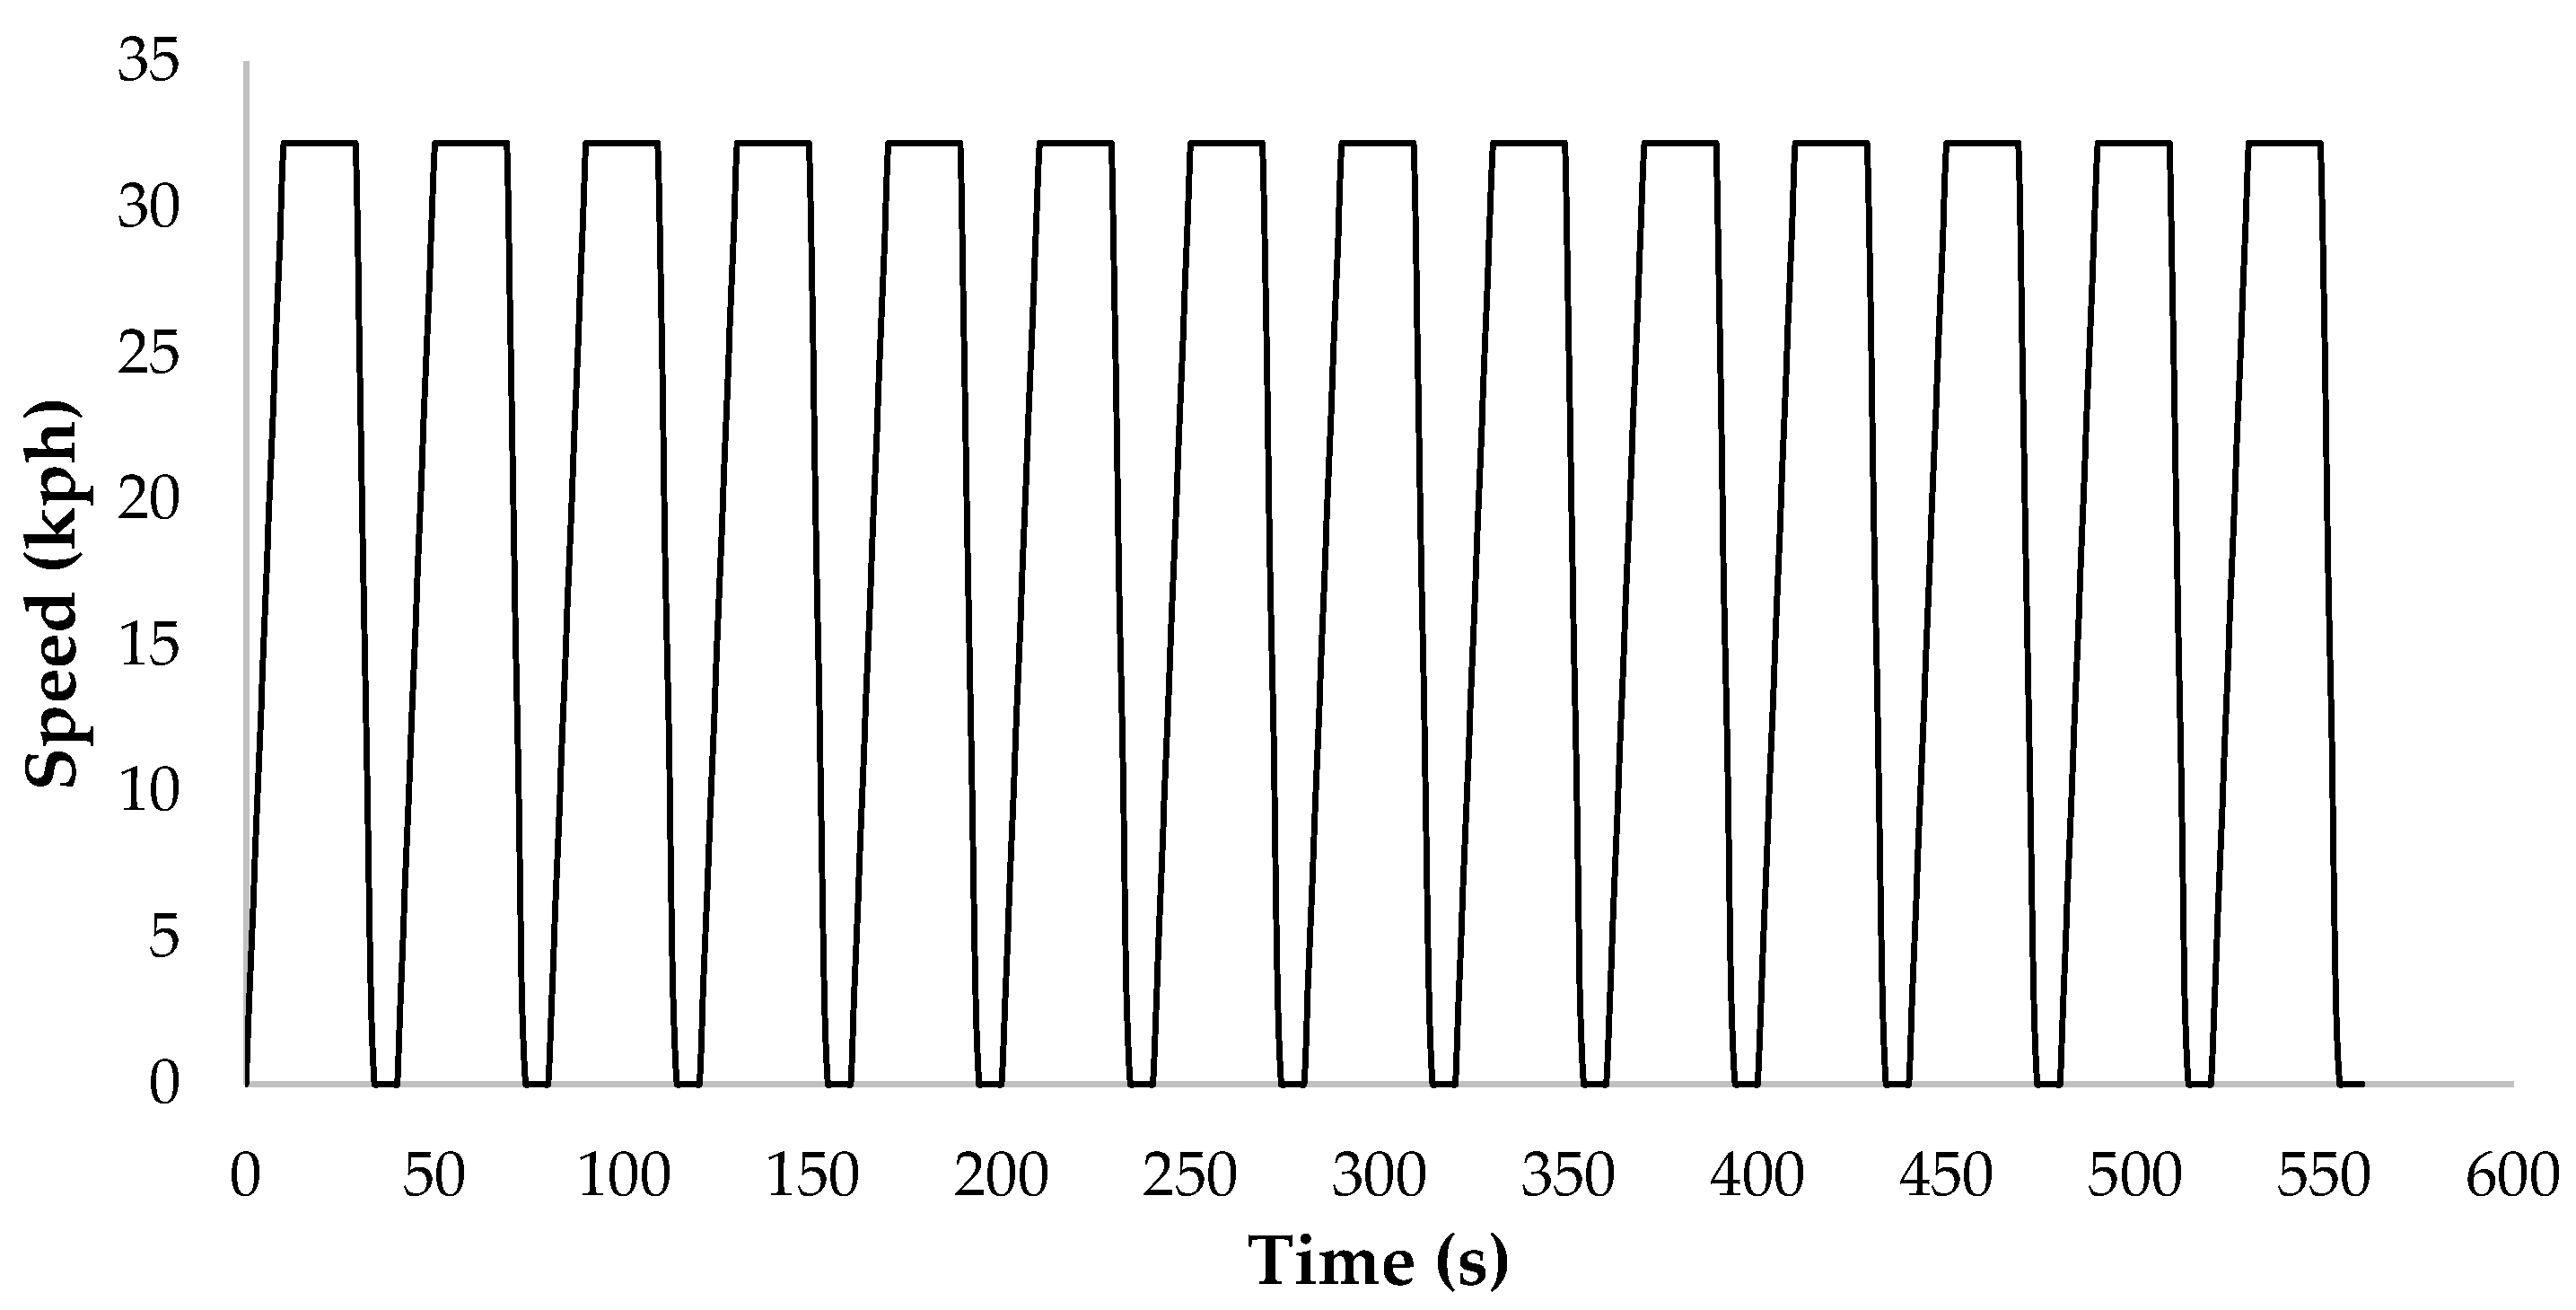
To accurately simulate the dynamic conditions of urban bus operation, the CBD driving cycle was selected for this study. This chassis dynamometer test is characterized by its composition of frequent acceleration, cruising, and deceleration phases, making it highly representative of demanding inner-city transit. The test protocol specifies a total duration of 560 s and covers a distance of 3.2 km. Due to its realistic nature, the CBD cycle is frequently employed in the literature as a standard benchmark for evaluating the performance of heavy-duty vehicles [,]. The speed-time profile of the cycle is depicted in Figure 3.

Figure 3.
The Central Business District (CBD) Driving Cycle.
Following the simulation of the FCEB model across the CBD driving cycle, the performance of the vehicle was quantitatively evaluated. This assessment was grounded in three key metrics: fuel consumption, gradeability, and acceleration performance. Concurrently with these performance metrics, a significant operational constraint was imposed on the battery’s state of charge (SOC).
Gradeability, a crucial performance metric, is defined as the steepest slope a vehicle can navigate at a specified constant speed, thereby measuring its ability to surmount inclines. Gradeability is expressed as a percentage, which corresponds to the tangent of the angle of the road’s incline . From a vehicle dynamics perspective, this maximum achievable grade is determined by the balance of forces acting on the vehicle, specifically the maximum tractive force available at the drive wheels against the total resistive forces (i.e., aerodynamic drag and rolling resistance). This physical relationship, which defines the maximum grade angle , can be expressed by the following equation []:
In these equations, the primary forces are the thrust force (), the aerodynamic drag force (), and the rolling resistance force (), all expressed in Newtons (N). The term represents the total vehicle mass (kg) and is the gravitational acceleration (9.81 m/s2). The powertrain parameters include the engine torque () and electric motor torque () in Newton-meters (Nm), as well as the dimensionless gear ratios for the motor—driveshaft (), transmission (), and differential (). Finally, represents the road incline angle and is the wheel radius (m). The aerodynamic drag force () is a function of air density (), drag coefficient (), frontal area (), and vehicle speed (), assuming zero wind speed conditions. The rolling resistance () is dependent on its coefficient (), and denotes the transmission efficiency [].
The determination of the time required for a vehicle to accelerate from a standstill to a specified target speed () presents a complex challenge, primarily due to the non-linear speed-torque characteristics inherent in the powertrain []. Fortunately, contemporary simulation platforms like ADVISOR are explicitly crafted to manage this complexity. Although a straightforward analytical solution is generally impractical, the physical relationship is dictated by the integral of the net accelerating force. This fundamental equation is expressed as:
In this equation, is the rotational inertia coefficient [].
Within the ADVISOR simulation environment, the software determines the FCEB’s fuel consumption through a step-by-step process. At each time step of the driving cycle, it first calculates the instantaneous power demand on the fuel cell. Based on this power demand, the software then interpolates the corresponding hydrogen consumption rate (in g/s) from a pre-defined efficiency map. Finally, this instantaneous rate is integrated over the cycle’s duration to yield the total mass of hydrogen consumed (in kg). This fundamental mass value serves as the basis for the final performance metrics reported in this study.
For the specific model in this study, several key parameters were defined. The on-board hydrogen storage was assumed at a pressure of 350 bar, a widely adopted standard for commercial transit buses [], with a corresponding density of 28 g/L []. For all energy equivalency calculations, the Lower Heating Values (LHV) for hydrogen and gasoline were set to 120 MJ/kg and 42.6 MJ/kg, respectively. Based on these parameters, the final fuel consumption results are presented using two distinct metrics: the primary consumption rate in kg/100 km and the comparative Gasoline Liter Equivalent (Le/100 km).
In order to quantitatively assess the various powertrain architectures examined in this research, the degree of hybridization, is presented as a fundamental descriptive parameter. This parameter delineates the ratio of power distribution between the primary energy converter and the secondary power source, acting as an essential metric for defining the design philosophy of the powertrain. In this investigation, the is computed as the ratio of the maximum power output of the fuel cell to the total maximum power of both the fuel cell and the ESS, as articulated in the following equation:
where and represent the maximum power of the fuel cell stack (kW) and the battery system (kW), respectively.
3.3. Parametric Analysis and Sizing Strategy
The investigation in this study was conducted in two distinct phases to systematically analyse the powertrain components.
Phase 1: Sizing of Fuel Cell and Electric Motor. The first phase involved a comprehensive parametric sweep to understand the influence of the primary power components. In this stage, the fuel cell power was varied from 125 kW to 200 kW, and for each fuel cell size, the electric motor power was independently varied from 187 kW to 275 kW. The objective of this phase was to map the entire design space and analyse the effects of these components on key performance indicators such as gradeability, acceleration, fuel consumption, and SOC depletion under the CBD driving cycle.
Phase 2: Analysis of the Degree of Hybridization. The second phase will focus on a detailed investigation of the . For this analysis, the baseline powertrain from our previous work [], consisting of a 200 kW fuel cell and a 187 kW electric motor, will be used as a fixed reference. The ESS size and power will be systematically varied to create different values. The aim of this phase is to specifically isolate and quantify the trade-offs between fuel economy and charge sustainability as a direct function of the hybridization ratio.
4. Results
This section presents the findings from the two-stage parametric analysis. The results are structured to first discuss the broad effects of fuel cell and electric motor sizing, followed by a focused analysis on the impact of the hybridization ratio.
4.1. The Effect of Fuel Cell and Electric Motor Sizing
The results of the initial parametric analysis, which examined the effects of varying fuel cell and electric motor power, are presented in Table 2. In the subsequent discussion, the following abbreviations are used for the key performance indicators: electric motor power (), gradeability at 20 km/h (), 0–60 km/h acceleration time () in seconds, fuel consumption in gasoline liter equivalent (), hydrogen consumption (), and SOC depletion (). The primary metric is the , expressed in kg/100 km, and , is also reported in Le/100 km. This equivalency is calculated based on the LHV of hydrogen (120 MJ/kg) and gasoline (32 MJ/kg), as previously detailed. In these simulations, was set to 96 kW, as in the base study [].

Table 2.
Performance Metrics of the FCEB for Various Fuel Cell and Electric Motor Sizing Configurations.
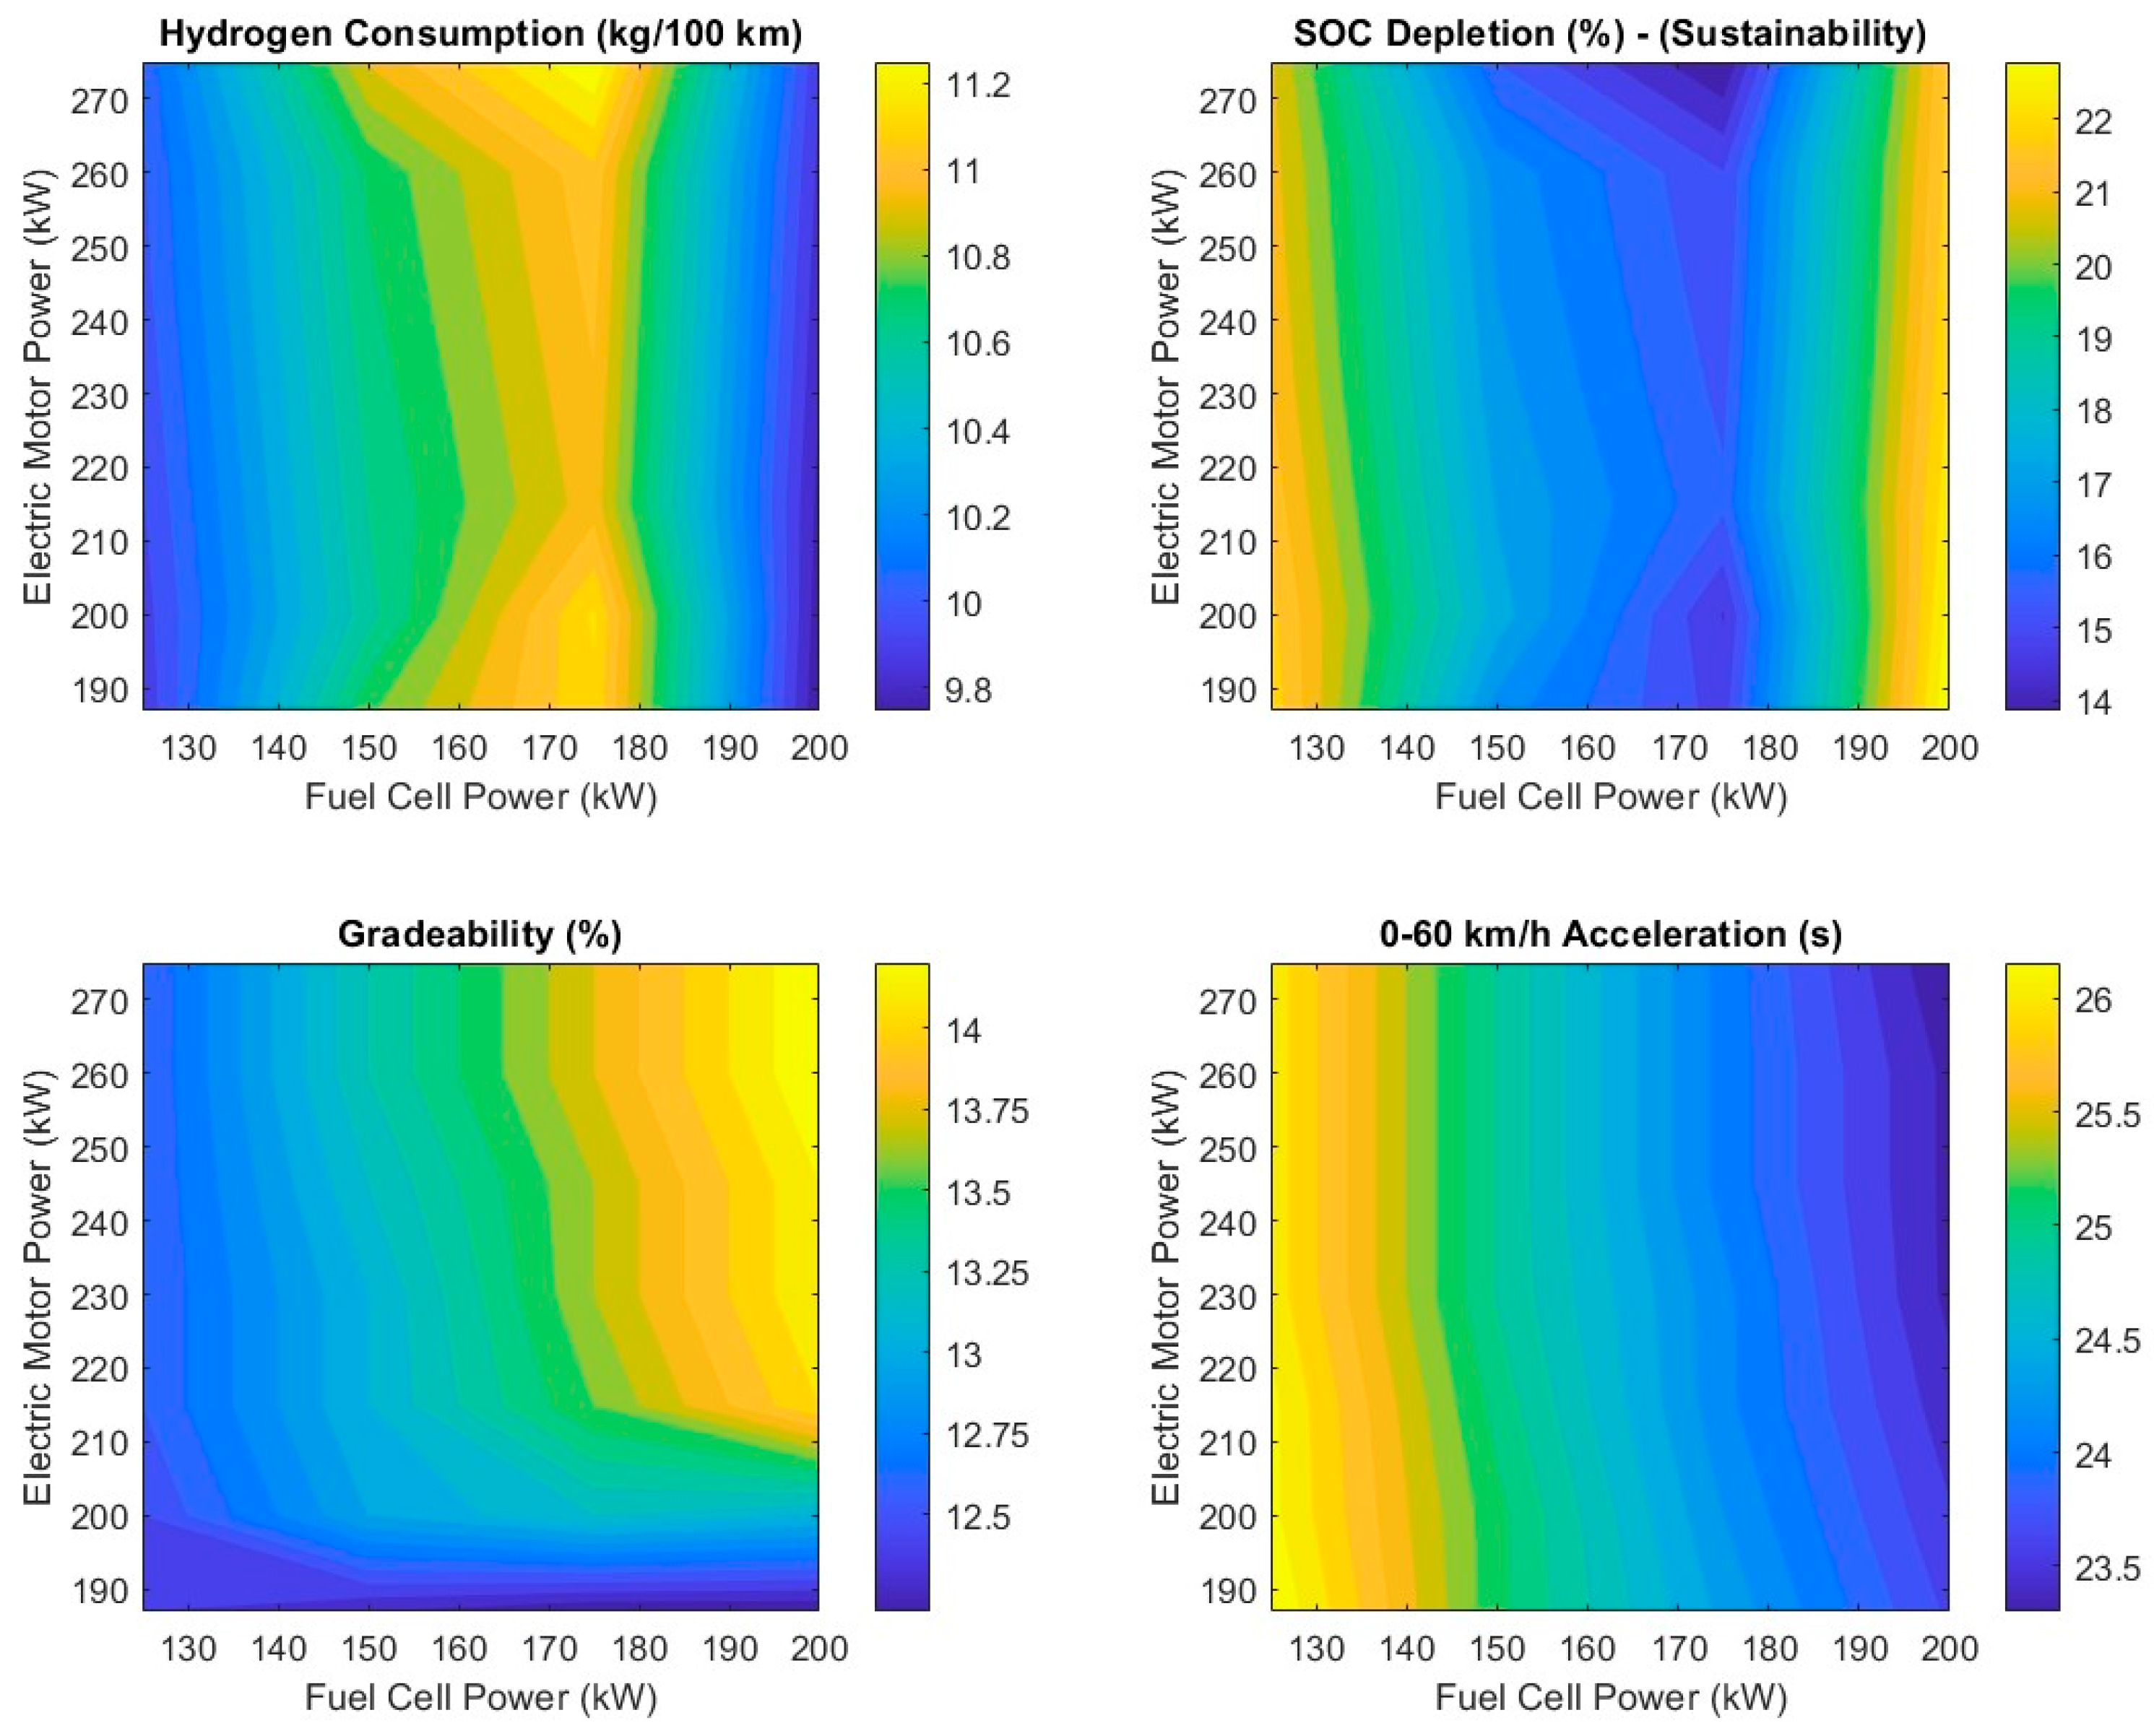
When Table 2 and Figure 4 are examined together, an interesting distribution of fuel economy is observed. First, the lowest hydrogen consumption was recorded as 9.75 kg /100 km in the configuration featuring a 187 kW electric motor and a 200 kW fuel cell, which corresponds to the baseline model from our previous study. The highest hydrogen consumption was measured as 11.32 kg /100 km in the configuration with a 175 kW fuel cell and a 275 kW electric motor.

Figure 4.
Contour plots illustrating the effect of fuel cell and electric motor sizing on key performance indicators.
The size of the fuel cell had a much more significant impact on fuel consumption compared to the electric motor. While increasing the electric motor size for a given fuel cell size did not lead to a significant change in fuel consumption, increasing the fuel cell size at a constant electric motor size led to considerable changes. The predicted hydrogen consumption values are consistent with those previously published in the literature for similar vehicle applications [,].
When is examined, an inverse relationship with fuel consumption is observed. In configurations where hydrogen consumption is low, battery usage is higher, leading to greater . This behavior is related to the EMS. For instance, in configuration 22 from Table 2, which has the lowest fuel consumption, the SOC depletion is concurrently at its highest value, measured at 23.23%. As the fuel cell power was reduced to 175 kW, the improved significantly, reaching its minimum value of 13.86% in the 175 kW fuel cell/275 kW electric motor configuration. However, further reducing the fuel cell power to 125 kW resulted in a degradation of sustainability, with values increasing again to over 21%.
An analysis of the vehicle’s gradeability, which is calculated at a constant speed of 20 km/h, reveals a non-linear relationship where the electric motor’s influence becomes significant only above a certain power threshold. This is visually evident in the corresponding contour plot in Figure 4. For electric motor power ratings below approximately 215 kW, the contour lines are nearly horizontal and concentrated in the lower performance region, indicating that gradeability remains consistently low, around 12–13%, regardless of the fuel cell power. However, a distinct performance improvement is observed once the electric motor power surpasses 215 kW. In this higher power region, the fuel cell becomes the primary determinant of gradeability, with performance increasing along the y-axis.
The numerical data in Table 2 quantifies this performance threshold: for instance, with a 200 kW fuel cell, increasing the motor power from 187 kW to 215 kW yields a substantial improvement in gradeability from 12.2% to 14.1%. The highest gradeability of 14.3% is achieved with a 200 kW fuel cell with a 260 kW and 275 kW electric motor configurations. This finding suggests that a minimum threshold of electric motor power is required to effectively overcome the vehicle’s base resistive forces on an incline, after which further increases in power provide additional, albeit diminishing, performance benefits.
An examination of the 0–60 km/h data reveals that the fuel cell size has a significantly more important impact on acceleration performance compared to the electric motor. The highest acceleration performance was observed at 23.3 s with the 200 kW fuel cell and 275 kW electric motor configuration, whereas the slowest acceleration was calculated as 26.3 s with the smallest components, namely the 125 kW fuel cell and 187 kW electric motor.
4.2. The Effect of the Hybridization Ratio on Efficiency and Sustainability
The findings from the simulation analysis measure the influence of the powertrain’s on essential vehicle performance and efficiency indicators. This study was conducted using ten unique powertrain configurations, each characterized by a particular value. In this hybridization analysis, the overall combined power of the powertrain () was maintained at a constant value of 296 kW. This figure was chosen to correspond with the total power of the baseline configuration (200 kW Fuel Cell and 96 kW ESS) utilized in the initial parametric analysis and our previous research []. The was then systematically adjusted from 0 to 0.8 in order to assess the complete range of powertrain architectures. The specific power ratings for both the fuel cell and battery for each values were subsequently computed based on this fixed total power.
Table 3 provides a detailed account of the power ratings associated with the fuel cell stack and the battery pack for each configuration. A minor deviation from a perfect 50/50 power split is noted for the ≈ 0.5 configuration; this is a result of the discrete 1.6 kW sizing of each battery module and the constraint to maintain a total system power of 296 kW, leading to a 148.8 kW FC/147.2 kW ESS power distribution.

Table 3.
Powertrain Configurations for Each Hybridization Ratio.
Figure 5 provides a comparative examination of five essential metrics across ten different , highlighting the critical trade-offs between vehicle performance, energy usage, and the SOC of the battery. The grouped bar chart facilitates a straightforward visual evaluation of the progression of these indicators as the powertrain transitions from a battery-dominant to a fuel-cell-dominant architecture.

Figure 5.
Performance and Consumption Metrics vs. Hybridization Ratio.
An in-depth examination of the dynamic performance metrics reveals a clear non-linear relationship with the hybridization ratio. The 0–60 km/h acceleration time remains exceptionally stable in the low-to-mid range, hovering between 16.3 s (at = 0) and 18.5 s (at = 0.5). However, a distinct performance degradation threshold is crossed beyond a of 0.5. The acceleration time increases moderately to 21.1 s at = 0.6 and then deteriorates sharply in subsequent configurations, culminating in a peak time of 38.9 s at = 0.8. This degradation occurs because the powertrain becomes increasingly reliant on the slower-responding fuel cell for the high transient power required during acceleration, as the peak power contribution from the diminishing battery becomes insufficient.
A similar pattern of sustained performance followed by a sudden collapse is observed for gradeability. The vehicle maintains a consistent and high gradeability of approximately 12.2% to 12.4% across almost all scenarios, before plummeting to 8.4% in the final configuration ( = 0.8), indicating its inability to handle high, continuous loads with a minimally sized battery.
The total energy consumed, which represents the net energy drawn from the onboard sources, steadily rises from 2.89 × 10⁴ kJ in the pure electric mode to 5.27 × 10⁴ kJ at = 0.8. This signifies that configurations with a greater reliance on the fuel cell are inherently less efficient in converting stored fuel energy into motion for this specific driving cycle. The H2 consumption follows a similar, albeit more varied, trajectory. It begins at 5.68 kg/100 km ( = 0.1) and reaches its maximum of 13.47 kg/100 km ( = 0.8), with a notable dip in consumption at the = 0.675 point relative to its neighbours.
The SOC drop provides the critical context for sustainability and reveals a complex, non-linear pattern across the tested hybridization ratios. The most significant levels of battery depletion are observed at two distinct and seemingly contradictory points: in the pure-electric mode ( = 0), the SOC drops by 23.0%, and at a high hybridization ratio of = 0.675, the battery experiences its largest depletion with a 23.2% drop. Conversely, the most charge-sustaining configurations are found at = 0.6 and = 0.8, with minimal SOC drops of 6.7% and 5.0%, respectively.
The observed non-linear SOC drop arises from the interplay between the thermostat control strategy and the varying sizes of the powertrain components. This EMS operates as a power-follower within a predefined SOC window, determining how the propulsion demand is shared between the fuel cell and the battery. A plausible explanation for the complex trend seen in Figure 5 involves the critical distinction between the battery’s energy capacity (kWh) and its instantaneous power capacity (kW).
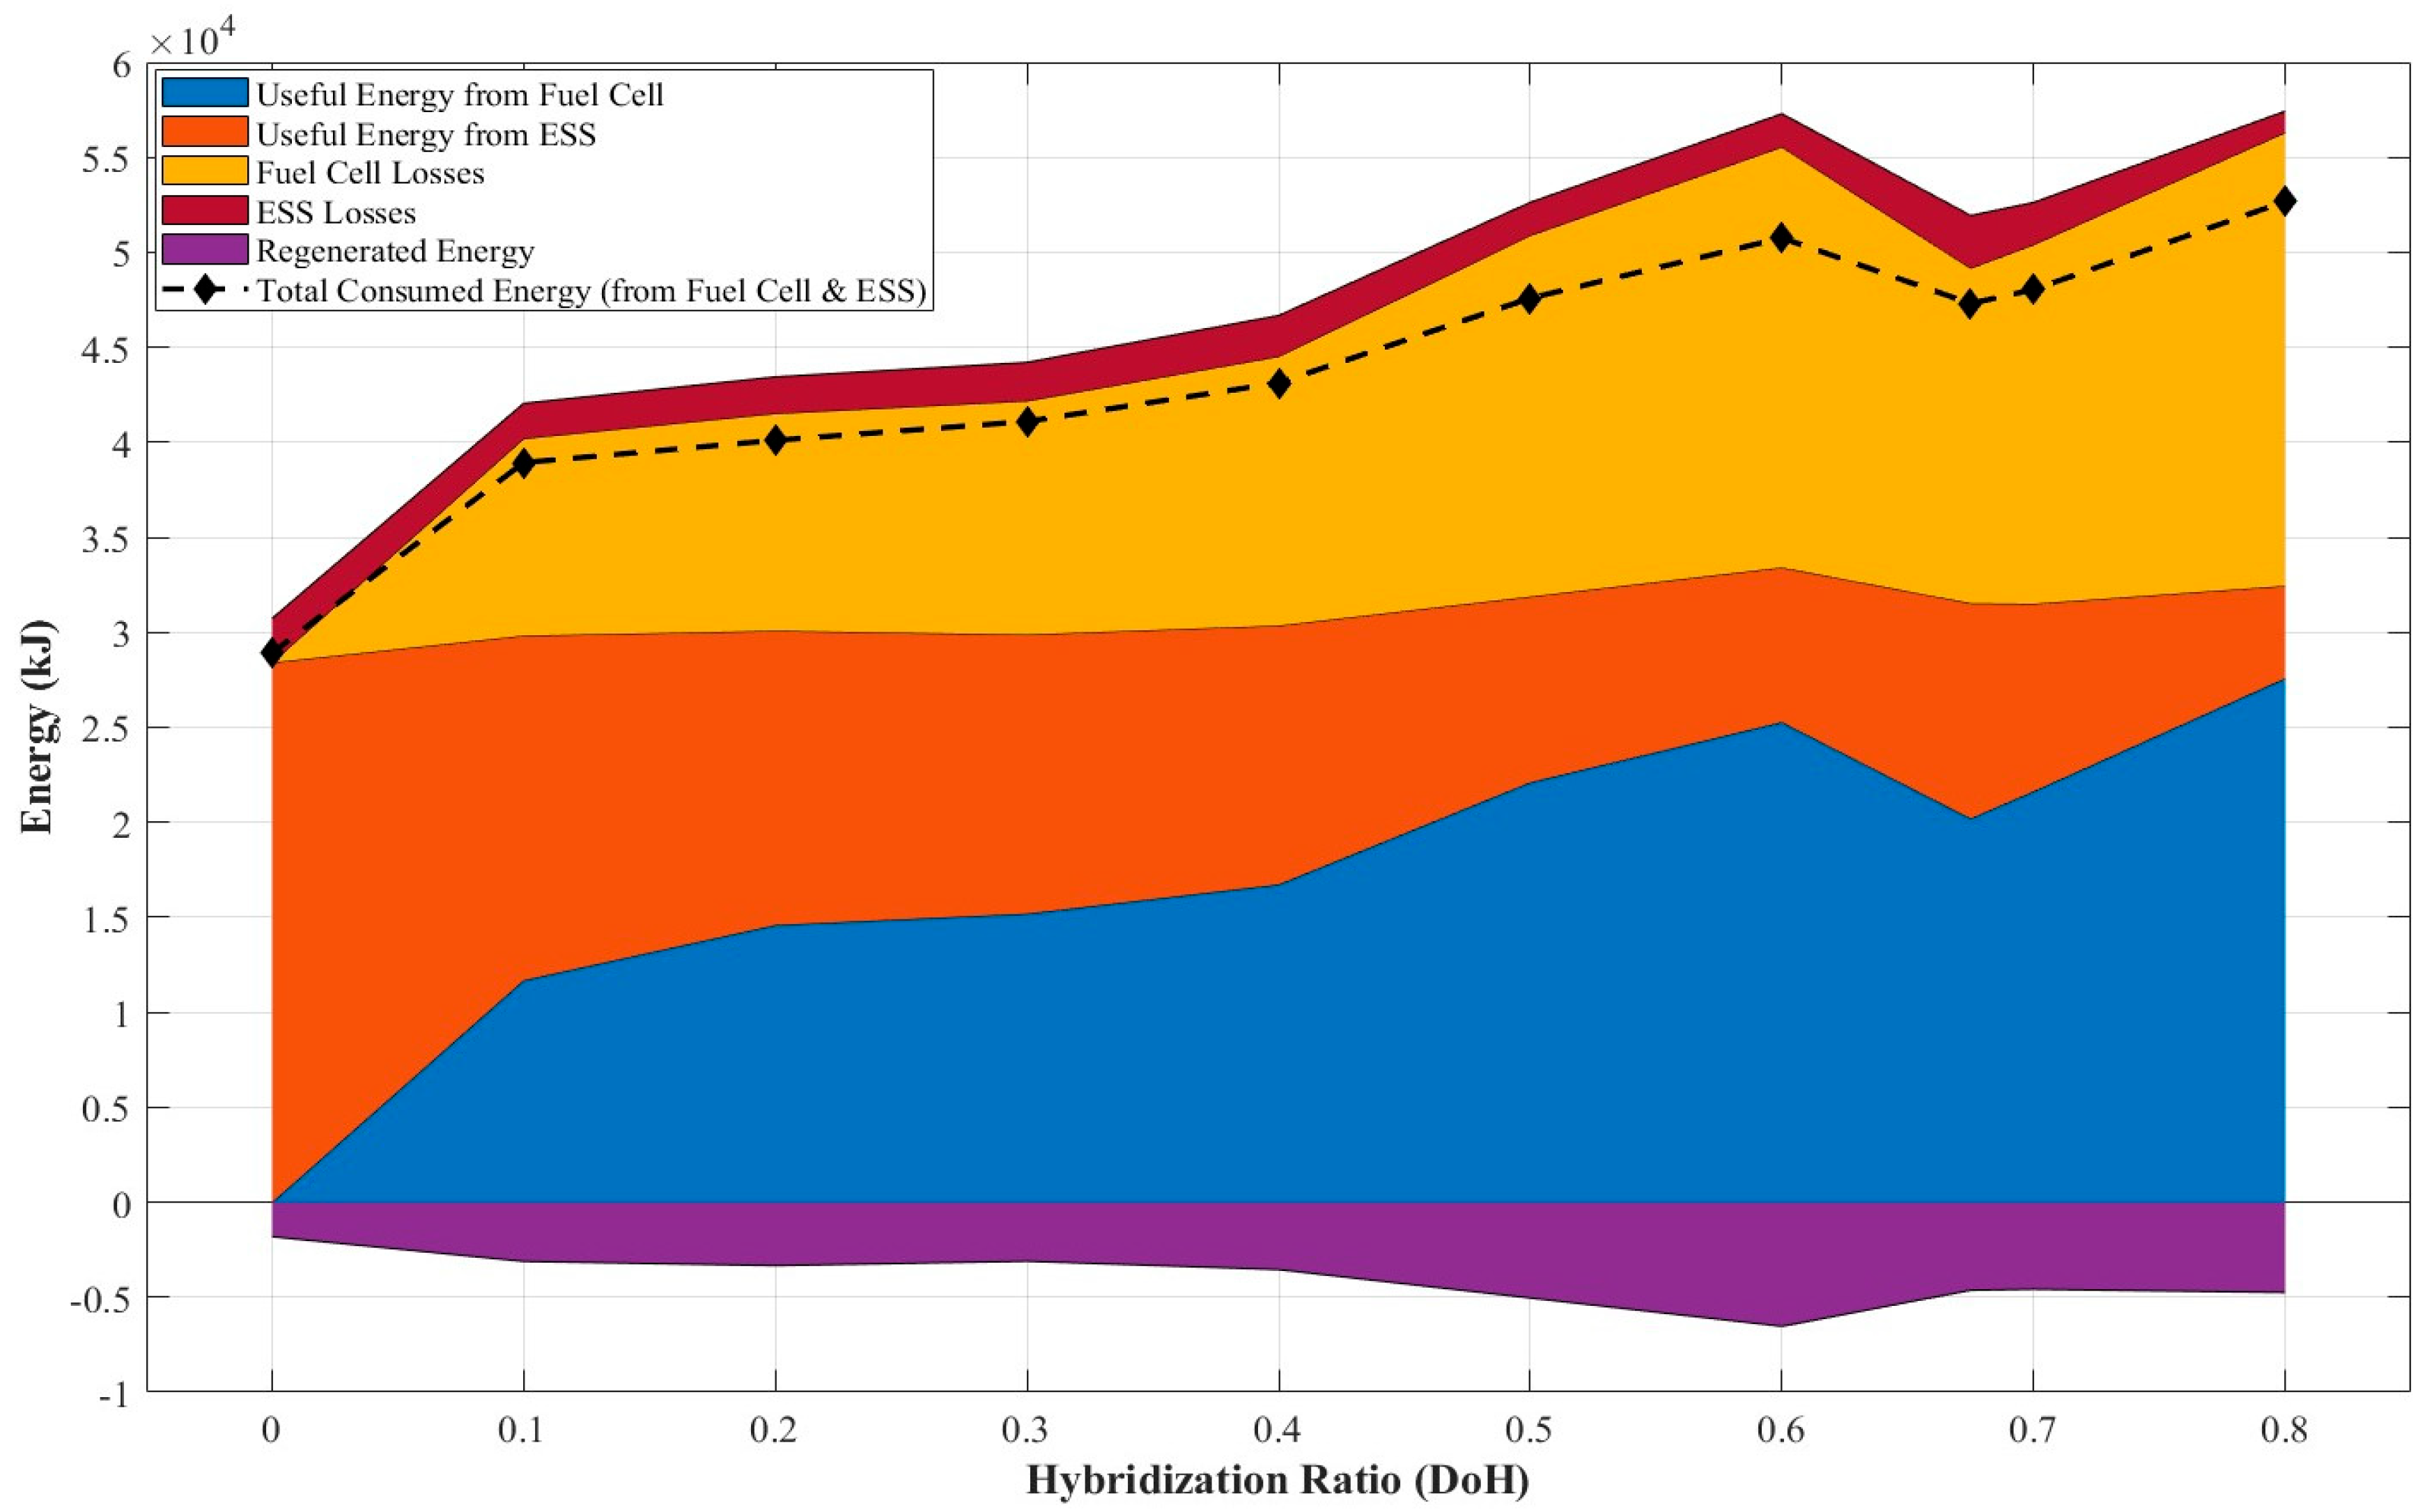
The data in Figure 6 indicates that captured regenerative energy increases up to a of 0.6, despite the battery’s decreasing size. This suggests that in this range, the battery may be operating at a lower average SOC due to the frequent acceleration demands of the CBD cycle, which would enhance its charge acceptance efficiency. However, this trend reverses sharply after a of 0.6. The pronounced SOC drop at = 0.675 can be attributed to the battery’s instantaneous power capacity becoming the primary constraint, making it unable to absorb the high-power regenerative pulses from braking events. At the other extreme, the minimal SOC decline observed for the fuel-cell-dominant = 0.8 configuration is a consequence of two factors: the EMS assigning the battery a minimal role in propulsion, and the vehicle’s reduced performance, limiting the total energy drawn from the powertrain.

Figure 6.
Comprehensive Energy Analysis vs. Hybridization Ratio for CBD Cycle.
As can be seen in Figure 6, the most prominent trend observed is the general increase in the total consumed energy (dashed line) as the increases. Although a minor dip is present between a of 0.6 and 0.7, the overall trajectory clearly indicates that systems with a higher reliance on the fuel cell require more primary energy to complete the driving cycle.
This trend is explained by the shifting contribution of the powertrain components. As expected, with a higher , the energy supplied by the fuel cell increases. Conversely, the useful energy delivered by the battery (orange area) diminishes significantly at higher values. A more detailed look at the secondary energy flows reveals that ESS losses remain relatively constant. This, combined with the significant energy recaptured through regeneration (purple area), strongly suggests that the battery energy pathway is more efficient than the fuel cell route for the given driving cycle.
5. Conclusions
This study provided a systematic analysis of the competing objectives in FCEB powertrain design, quantifying the trade-offs between dynamic performance (gradeability and acceleration) and energy consumption across a wide range of component sizes and hybridization ratios. The investigation focused on the impact of electric motor, fuel cell, and battery sizing on these metrics for a FCEB. The analysis was conducted using the ADVISOR software over the CBD driving cycle. The methodology involved a two-stage investigation: first, a parametric analysis of 28 combinations was performed, with fuel cell sizes ranging from 125 kW to 200 kW and electric motor sizes ranging from 187 kW to 275 kW. Subsequently, a hybridization study was conducted to analyse vehicle performance and total energy consumption across ten distinct hybridization ratios, with ranging from 0 (pure electric) to 0.8 (fuel-cell-dominant). The main conclusions derived from this comprehensive analysis are as follows:
- The initial parametric analysis revealed that the fuel cell power rating is the most significant factor influencing overall hydrogen consumption, whereas the impact of the electric motor size is comparatively minor.
- Furthermore, the primary performance metrics are governed by different components: acceleration performance was found to be predominantly dictated by the fuel cell’s power, while gradeability is critically dependent on the electric motor’s power, but only after the motor exceeds a power threshold of approximately 215 kW.
- The analysis demonstrates a clear degradation in dynamic performance as the powertrain shifts towards a fuel-cell-dominant architecture. While the pure-electric configuration ( = 0) and the mid-hybrid configuration ( = 0.4) both maintain high performance with acceleration times of 16.3 s and 17.3 s, respectively, the high-hybrid configuration (≈ 0.8) suffers a severe performance collapse, with acceleration time deteriorating to 38.9 s.
- Conversely, energy consumption rises significantly with increased . The total energy required to complete the CBD cycle increases from 28,916 kJ at = 0 to 43,128 kJ at = 0.4 and reaches 52,678 kJ at the ≈ 0.8 configuration.
- Gradeability remains high for both the = 0 (12.4%) and = 0.4 (12.2%) configurations but collapses to 8.4% at ≈ 0.8. In terms of sustainability, the SOC depletion is high for both the = 0 (23.0%) and = 0.4 (16.2%) cases, whereas the ≈ 0.8 case is the most charge-sustaining of the three, with a drop of only 5.0%.
- The energy recovered through regenerative braking was not constant but instead showed a general increasing trend as the hybridization ratio increased, rising from 1819 kJ in the pure-electric mode to a peak of 6537 kJ at a of approximately 0.6.
It is crucial to recognize that this research was carried out under controlled conditions to separate the impacts of powertrain sizing. Real-world operational variations, including changing passenger loads, the implementation of climate control systems, and differing traffic patterns, were excluded from the parameters of this analysis. These elements are recognized to have a substantial effect on energy consumption and may affect the ideal level of hybridization. Consequently, although the essential trade-offs identified in this study are still applicable, the quantitative findings should be understood in light of these assumptions, and additional research is required to investigate these influences.
Future research will extend this investigation by integrating models for component aging and comprehensive thermal management to improve the accuracy of simulations. Additionally, to overcome the constraints of the current study’s focus, future studies will explore the effects of real-world operational variations, including changing passenger loads and climate control usage, on fuel consumption and energy management. The analysis will further broaden to encompass a variety of driving profiles (such as suburban and mixed routes) to evaluate the reliability of the fuel economy results. Lastly, the scope will also be widened to incorporate an initial life-cycle cost analysis, which will complement the discussions on energy and performance trade-offs.
Author Contributions
Conceptualization, A.F.K. and S.P.; methodology, A.F.K., S.P. and G.A.; software, A.F.K.; validation, S.P., M.P. and G.A.; formal analysis, M.P. and N.M.; investigation, A.F.K. and N.M.; resources, A.F.K. and G.A.; data curation, M.P. and N.M.; writing—original draft preparation, A.F.K.; writing—review and editing, S.P., M.P. and N.M.; visualization, A.F.K.; supervision, S.P. and G.A. All authors have read and agreed to the published version of the manuscript.
Funding
This research received no external funding.
Data Availability Statement
The raw data supporting the conclusions of this article will be made available by the authors on request.
Acknowledgments
Ahmet Fatih Kaya thanks the Ministry of National Education of Türkiye for funding the PhD at the University of Modena and Reggio Emilia.
Conflicts of Interest
The authors declare no conflicts of interest.
References
- IEA—International Energy Agency. Global Energy Review 2025; International Energy Agency: Paris, France, 2025. [Google Scholar]
- Organization of the Petroleum Exporting Countries. World Oil Outlook 2050; Organization of the Petroleum Exporting Countries: Vienna, Austria, 2024. [Google Scholar]
- Perera, F. Pollution from Fossil-Fuel Combustion Is the Leading Environmental Threat to Global Pediatric Health and Equity: Solutions Exist. Int. J. Environ. Res. Public Health 2018, 15, 16. [Google Scholar] [CrossRef]
- De Wolf, D.; Smeers, Y. Comparison of Battery Electric Vehicles and Fuel Cell Vehicles. World Electr. Veh. J. 2023, 14, 262. [Google Scholar] [CrossRef]
- Xia, X.; Li, P. A Review of the Life Cycle Assessment of Electric Vehicles: Considering the Influence of Batteries. Sci. Total Environ. 2022, 814, 152870. [Google Scholar] [CrossRef] [PubMed]
- Mekhilef, S.; Saidur, R.; Safari, A. Comparative Study of Different Fuel Cell Technologies. Renew. Sustain. Energy Rev. 2012, 16, 981–989. [Google Scholar] [CrossRef]
- The Technology Collaboration Programme on Advanced Fuel Cells (AFC TCP). Annual Report 2024; International Energy Agency: Paris, France, 2024. [Google Scholar]
- Xu, L.; Mueller, C.D.; Li, J.; Ouyang, M.; Hu, Z. Multi-Objective Component Sizing Based on Optimal Energy Management Strategy of Fuel Cell Electric Vehicles. Appl. Energy 2015, 157, 664–674. [Google Scholar] [CrossRef]
- Madadi, M.H.; Chitsaz, I. Improving Fuel Efficiency and Durability in Fuel Cell Vehicles through Component Sizing and Power Distribution Management. Int. J. Hydrogen Energy 2024, 71, 661–673. [Google Scholar] [CrossRef]
- Venkata KoteswaraRao, K.; Naga Srinivasulu, G.; Ramesh Rahul, J.; Velisala, V. Optimal Component Sizing and Performance of Fuel Cell—Battery Powered Vehicle over World Harmonized and New European Driving Cycles. Energy Convers. Manag. 2024, 300, 117992. [Google Scholar] [CrossRef]
- Abdeldjalil, D.; Negrou, B.; Youssef, T.; Samy, M.M. Incorporating the Best Sizing and a New Energy Management Approach into the Fuel Cell Hybrid Electric Vehicle Design. Energy Environ. 2023, 36, 616–637. [Google Scholar] [CrossRef]
- Graber, G.; Calderaro, V.; Galdi, V. Two-Stage Optimization Method for Sizing Stack and Battery Modules of a Fuel Cell Vehicle Based on a Power Split Control. Electronics 2022, 11, 361. [Google Scholar] [CrossRef]
- Mounica, V.; Obulesu, Y.P. Hybrid Power Management Strategy with Fuel Cell, Battery, and Supercapacitor for Fuel Economy in Hybrid Electric Vehicle Application. Energies 2022, 15, 4185. [Google Scholar] [CrossRef]
- Molina, S.; Novella, R.; Pla, B.; Lopez-Juarez, M. Optimization and Sizing of a Fuel Cell Range Extender Vehicle for Passenger Car Applications in Driving Cycle Conditions. Appl. Energy 2021, 285, 116469. [Google Scholar] [CrossRef]
- Anbarasu, A.; Dinh, T.Q.; Sengupta, S. Novel Enhancement of Energy Management in Fuel Cell Hybrid Electric Vehicle by an Advanced Dynamic Model Predictive Control. Energy Convers. Manag. 2022, 267, 115883. [Google Scholar] [CrossRef]
- Xu, L.; Ouyang, M.; Li, J.; Yang, F.; Lu, L.; Hua, J. Optimal Sizing of Plug-in Fuel Cell Electric Vehicles Using Models of Vehicle Performance and System Cost. Appl. Energy 2013, 103, 477–487. [Google Scholar] [CrossRef]
- Broatch, A.; Olmeda, P.; Margot, X.; Aceros, S. Different Strategies in an Integrated Thermal Management System of a Fuel Cell Electric Bus under Real Driving Cycles in Winter. Energy Convers. Manag. 2023, 288, 117137. [Google Scholar] [CrossRef]
- Ahmadi, P.; Raeesi, M.; Changizian, S.; Teimouri, A.; Khoshnevisan, A. Lifecycle Assessment of Diesel, Diesel-Electric and Hydrogen Fuel Cell Transit Buses with Fuel Cell Degradation and Battery Aging Using Machine Learning Techniques. Energy 2022, 259, 125003. [Google Scholar] [CrossRef]
- Kim, H.; Hartmann, N.; Zeller, M.; Luise, R.; Soylu, T. Comparative Tco Analysis of Battery Electric and Hydrogen Fuel Cell Buses for Public Transport System in Small to Midsize Cities. Energies 2021, 14, 4384. [Google Scholar] [CrossRef]
- Jia, C.; Zhou, J.; He, H.; Li, J.; Wei, Z.; Li, K.; Shi, M. A Novel Energy Management Strategy for Hybrid Electric Bus with Fuel Cell Health and Battery Thermal- and Health-Constrained Awareness. Energy 2023, 271, 127105. [Google Scholar] [CrossRef]
- Kaya, A.F.; Puglia, M.; Morselli, N.; Allesina, G.; Pedrazzi, S. Fuel Consumption of Diesel, Natural Gas, Hybrid, Full Electric and Hydrogen Fuel Cells Based Buses: A Simulated Comparison Using Standard Road Cycles and Gradeability Tests. Fuel 2025, 401, 135938. [Google Scholar] [CrossRef]
- O’Keefe, M.P.; Vertin, K. An Analysis of Hybrid Electric Propulsion Systems for Transit Buses; Technical Report; National Renewable Energy Laboratory: Golden, CO, USA, 2002. [Google Scholar]
- Zhang, G.; Chen, W.; Li, Q. Modeling, Optimization and Control of a FC/Battery Hybrid Locomotive Based on ADVISOR. Int. J. Hydrogen Energy 2017, 42, 18568–18583. [Google Scholar] [CrossRef]
- Brown, J.C.; Eichenberg, D.J.; Thompson, W.K. Baseline Testing of the Hybrid Electric Transit Bus; NASA Lewis Research Center: Cleveland, OH, USA, 1999. [Google Scholar]
- Gao, Y.; Rahman, K.M.; Ehsani, M. Parametric Design of the Drive Train of an Electrically Peaking Hybrid (ELPH) Vehicle. J. Passeng. CARS Part 1 1997, 106, 498–503. [Google Scholar]
- Dispenza, G.; Sergi, F.; Napoli, G.; Randazzo, N.; Di Novo, S.; Micari, S.; Antonucci, V.; Andaloro, L. Development of a Solar Powered Hydrogen Fueling Station in Smart Cities Applications. Int. J. Hydrogen Energy 2017, 42, 27884–27893. [Google Scholar] [CrossRef]
- Ni, M. An Overview of Hydrogen Storage Technologies. Energy Explor. Exploit. 2006, 24, 197–209. [Google Scholar] [CrossRef]
- Šimunović, J.; Pivac, I.; Barbir, F. Techno-Economic Assessment of Hydrogen Refueling Station: A Case Study in Croatia. Int. J. Hydrogen Energy 2022, 47, 24155–24168. [Google Scholar] [CrossRef]
- Zhang, G.; Zhang, J.; Xie, T. A Solution to Renewable Hydrogen Economy for Fuel Cell Buses—A Case Study for Zhangjiakou in North China. Int. J. Hydrogen Energy 2020, 45, 14603–14613. [Google Scholar] [CrossRef]
Disclaimer/Publisher’s Note: The statements, opinions and data contained in all publications are solely those of the individual author(s) and contributor(s) and not of MDPI and/or the editor(s). MDPI and/or the editor(s) disclaim responsibility for any injury to people or property resulting from any ideas, methods, instructions or products referred to in the content. |
© 2025 by the authors. Licensee MDPI, Basel, Switzerland. This article is an open access article distributed under the terms and conditions of the Creative Commons Attribution (CC BY) license (https://creativecommons.org/licenses/by/4.0/).