Article

A Prudent Approach to Reduce CO2 Emissions While Enhancing Oil Recovery

Petroleum Department, Colorado School of Mines, Golden, CO 80401, USA
*
Author to whom correspondence should be addressed.
Fuels 2025, 6(4), 75; https://doi.org/10.3390/fuels6040075
Submission received: 30 July 2025 / Revised: 25 August 2025 / Accepted: 17 September 2025 / Published: 2 October 2025

Abstract

Emissions of carbon dioxide (CO2) resulting from steam-driven enhanced oil recovery (EOR) operations present an environmental challenge as well as an opportunity to further enhance oil recovery. Using numerical simulations with realistic input data from field and laboratory measurements, we demonstrate a prudent approach to reduce CO2 emissions by capturing CO2 from steam generators of a steam-driven enhanced oil recovery (EOR) project and injecting it in a nearby oil field to improve oil recovery in this neighboring field. The proposed use of CO2 as a water-alternating-CO2 (WAG-CO2) EOR project in a small, 144-acre, sector of a target limestone reservoir would yield 42% incremental EOR oil while sequestering CO2 with a net utilization ratio (NUR) of 3100 standard cubic feet CO2 per stock tank barrel (SCF/STB) of EOR oil in a single five-spot pattern consisting of a central producer and four surrounding injectors. This EOR application sequesters 135,000, 165,000, and 213,000 metric tons of CO2 in five, ten, and twenty years in the single five spot pattern (i.e., our sector target), respectively. As a related matter, the CO2 emissions from nearby steam oil recovery project consisting of ten 58-ton steam/hr boilers amounts to 119,000 metric tons of CO2 per year with an estimated social cost of USD 440 million over 20 years. Upscaling the results from the single five-spot pattern to a four-pattern field scale increases the sequestered amount of CO2 by a factor of 4 without recycling and to 11 with recycling produced CO2 from the EOR project. Furthermore, the numerical model indicates that initiating CO2 injection earlier at higher residual oil saturations improves EOR efficiency while somewhat decreases sequestration per incremental EOR barrel. The most significant conclusion is that the proposed venture is an economically viable EOR idea in addition to being an effective sequestration project. Other sources of CO2 emissions in oil fields and nearby refineries or power generators may also be considered for similar projects.

1. Introduction

1.1. Climate Impact of CO2 Emissions

The greenhouse effect concept was developed by Svante Arrhenius [1], based on the fundamentals of atmospheric chemistry and the interpretation of its changes. The greenhouse effect is caused by gases in the atmosphere, which capture and absorb energy, leading to the warming of the Earth [2]. The global warming potential (GWP) serves as a benchmark with which to quantify the energy absorbed by one ton of emitted gas relative to that for one ton of CO2 over a specified period. Methane (CH4) is an additional contributor to the greenhouse with an estimated GWP of 27–30 over a century, with a greater value over a 20-year period [3]. Among GHGs, CO2 is the dominant contributor to anthropogenic climate change due to its high concentration, long atmospheric residence time, and continuous emissions from fossil fuel combustion and industrial activities. In 2022, emissions from coal- and petroleum-powered power plants in the United States totaled approximately 17.0 trillion cubic feet (TCF) of CO2, while natural gas power plants and ethanol plants contributed 14.0 TCF and 1.0 TCF, respectively [4]. In addition, gas flaring remains a significant source of emissions in oil-producing regions. According to the World Bank Global Gas Flaring Tracker Report (2023) [5], flaring released 4.91 TCF of CO2 globally in 2022—a reduction from 5.0 TCF in 2021 and 5.3 TCF in 2019 [3,5]. Despite these recent improvements in gas flaring mitigation, the oil and gas industry continue to account for a substantial portion of global emissions. The International Energy Agency [6] estimates that the sector is responsible for 15% of global energy-related CO2 emissions and 9% of total anthropogenic GHG emissions. These figures underscore the urgent need for emission reduction strategies within the hydrocarbon sector, particularly in upstream operations where CO2 output from facilities such as steam boilers remains high.
The social cost of carbon (SCC) measures the monetized value of the damage to society caused by incremental metric tons of CO2 emissions and is a key metric informing climate policy. Used by governments and other decision makers in cost–benefit analysis for over a decade, SCC estimates draw on climate science, economics, demography, and other disciplines [7]. The SCC is determined by integrated assessment models that account for variations in atmospheric CO2 levels, alterations in temperature and precipitation, effects on agriculture, human health, and economic damages from such climate effects [8]. The recent SCC estimates of some greenhouse gases are as follows:
  • CO2: USD 185 per metric ton [9], while previously, this was estimated to be approximately USD 54.
  • CH4: USD 2275 per metric ton [10].
  • N2O: USD 25,850 per metric ton [10].

1.2. Technical Background of EOR-CO2

A significant portion of the global hydrocarbon reserves is found in carbonate reservoirs, characterized by lower porosity, natural fracturing, and mixed wettability [11]. The presence of high permeability in fractures may impact enhanced oil recovery in these reservoirs due to the premature breakthrough of the injected EOR agent. Conversely, CO2 injection has served as a significant application for enhanced oil recovery in carbonate reservoirs across the U.S. since the 1980s [12]. Manrique et al. [13] forecasted that CO2 flooding is likely to become the predominant enhanced oil recovery method in carbonate reservoirs with low matrix permeability across the U.S. The effectiveness of CO2 flooding has shown significant success in mature and water-flooded carbonate reservoirs [13].
The miscible CO2 flood enhances oil recovery by injecting CO2 at or above the minimum miscibility pressure (MMP). Dissolution of CO2 into the oil phase reduces resistance to oil flow due to volume expansion and a decrease in viscosity [14]. The miscibility of CO2 with oil contributes to a reduction in interfacial tension, thereby improving the mobility of oil [15]. This phenomenon holds significant relevance in the residual saturation zones, and the experimental section study will support such a statement. Chen et al. [16] showed that confinement substantially alters vapor–liquid–liquid equilibria, thereby affecting minimum miscibility pressure (MMP) and storage efficiency of CO2 in shale reservoirs. Yang et al. [17] presented an extended Peng–Robinson EOS to analyze confined fluid phase behavior, noting significant deviations in phase boundaries of unconventional reservoir fluids relative to bulk systems. These findings highlight the necessity of incorporating nanoscale phase behavior into MMP prediction frameworks.
The technique of injecting alternating cycles of water and CO2 into the reservoir is known as water-alternating-CO2 (WAG-CO2). Alongside minimizing the necessary CO2 volume, a significant benefit of WAG-CO2 is its ability to assist in mobility control in higher-conductivity areas, thereby prolonging the lifespan of CO2 projects and enhancing oil recovery. Currently, WAG-CO2 is applied in over 90% of CO2 flooding projects globally [18]. A numerical study of CO2 injection into aquifers [19] demonstrated two primary advantages, long term sequestration of CO2 and enhanced oil recovery, due to gradual release of CO2, which decreases oil viscosity and improves mobility ratio.

1.3. Reservoir Properties Relevent to CO2 EOR

Screening criteria for EOR techniques have been developed based on the reservoir and oil characteristics of successful EOR projects globally [20]. Steam flooding is the preeminent EOR technique. Chemical flooding has been diminishing; nonetheless, polymers and gels are effectively utilized for enhancing sweep efficiency and achieving water shutdown. Only the activity of CO2 floods has seen a steady increase.
In terms of reservoir properties, CO2 flooding is particularly advantageous in reservoirs with light to medium oils with an API gravity greater than 22° and a viscosity less than 10 cP. Sandstone and carbonate reservoirs with oil saturation above 20% and ensuring sufficient injectivity are good candidates for CO2 flooding. The depth and pressure must facilitate operation above the minimum miscibility pressure (MMP). The feasible depth for miscible CO2 increases with increasing oil density (Table 1). The ranges of the reservoir and fluid properties for the current projects are 27–44° API, 0.3–6 cP, and 15–70% oil saturation. At shallower depth of 1800 feet the reservoirs generally do not pass screening criteria for both miscible and immiscible CO2 using supercritical CO2. Additional limitations may be imposed by the availability of reliable, economical sources of CO2 along with premature gas breakthrough (often managed by improving mobility control by WAG-CO2).

1.4. Carbon Capture and Utilization (CCUS)

Geologic storage of CO2 is a pragmatic approach for the oil and gas industry to support initiatives aimed at decreasing greenhouse gas emissions. Combining CO2 sequestration with enhanced oil recovery (EOR) is an added benefit to offset some of the costs of carbon capture and storage (CCS) and is one of the most promising applications of the carbon capture, utilization, and storage (CCUS) concept. In traditional CO2-EOR applications, where CO2 represents a cost factor, a reduced CO2 usage per barrel of incremental oil, known as the utilization ratio (UR), serves as a critical criterion for feasibility. The net utilization ratio (NUR) given below is the amount of purchased CO2 (in MSCF) used per barrel of incremental oil (in STB) extracted [21]:
N U R = C O 2   ( p u r c h a s e d ) I n c r e m e n t a l   o i l   ( p r o d u c e d )
The gross utilization ratio (GUR) given below is the total injected volume of CO2 (MSCF), including purchased and recycled (recovered and re-injected) quantities, per barrel of incremental oil produced (STB) [21]:
G U R = C O 2   ( i n j e c t e d ) I n c r e m e n t a l   o i l   ( p r o d u c e d )
The inclusion of recycled volumes of CO2 in the gross utilization ratio (GUR) results in a higher value compared to the net utilization ratio (NUR). In contrast with the ultimate oil recovery factor (URF) which is used as a measure of EOR efficiency, the retention capacity (RC), defined is the proportion of injected CO2 that remains unrecovered [22]. This equation serves as a measure of sequestration efficiency:
R C = 100 × C O 2   i n j e c t e d C O 2   ( p r o d u c e d ) C O 2   i n j e c t e d %
Although the definitions of the utilization ratios (UR) and retention capacity (RC) are inherently interconnected ( R C = N U R / G U R ), the UR relates primarily to the cost associated with each barrel of oil recovered through the EOR, whereas the retention capacity (RC) serves as a metric for evaluating the achievement of sequestration objectives within a CO2-EOR project. A study by Kazemi and Davis in 2021 [3] utilized CO2-EOR technology to analyze the historical performance of many main sectors in the Permian Basin. Historical investigations indicated that the CO2 net utilization ratio (NUR) ranged from 6000 SCF/STB to a gross utilization ratio (GUR) of 12,000 SCF/STB. This indicates that about half of the CO2 used in the EOR process was sequestered by the EOR process.
The Weyburn project, supported by the IEA in 2015 [23], serves as a practical validation of the CCUS concept. Primary recovery from the Weyburn field was first followed by water flooding and, subsequently, CO2-EOR. The CO2 was transported to the field through a pipeline from a facility located in North Dakota. CO2-EOR commenced in October 2000, featuring over 80 EOR patterns and continuous enhancements throughout the implementation. The Weyburn project effectively stored 30 million tons of CO2, with a continuous annual storage rate of 2 million tons. It is estimated to have the capacity to permanently store 55 million tons (1.05 TCF) of CO2 [24]. The net utilization ratio (NUR) stands at 4.18 MSCF/STB [3]. The objective of the project is to achieve the permanent storage of all injected CO2 through the recycling of the produced CO2 [25].

1.5. Sequestration of CO2

As for the sequestration of CO2, trapping mechanisms can be categorized into four types: structural, residual, solubility, and mineral traps. Geochemical trapping encompasses all trapping mechanisms except for structural trapping mechanisms. Upon injection, carbon dioxide will engage in geochemical interactions with the rock and fluid. Geochemical trapping involves many interactions between the injected carbon dioxide and the existing fluid, ultimately resulting in long-term storage inside the geological formation. The reactions are as follows:
  • Solubility trapping: this occurs when the dissolution of carbon dioxide in brine water is facilitated by increased acidity and adsorption onto clay minerals.
  • Mineral trapping: the precipitation of carbon dioxide as a mineral phase.
  • Relative permeability hysteresis: two-phase relative permeability relationship (CO2 and brine).
The structural trap mechanism physically retains CO2 within a permeable and porous rock formation, which is enclosed by impermeable barriers such as cap rocks and seals. The phrase “residual trap” denotes the condition in which CO2 is trapped within pores because of capillary pressure. Hysteresis may affect CO2 capillary trapping, making it more difficult to forecast the amount of CO2 to be immobilized within the reservoir [26]. Solubility trapping does not exist as a distinct phase but instead occurs when CO2 dissolves in the formation of water. This will disregard the buoyancy effect of CO2, resulting in no additional upward movement.
The mineral trapping mechanism implies the process whereby the dissolved CO2 interacts with metal ions in subsurface rocks, leading to the creation of stable carbonate minerals [27]. The mineral trapping mechanism is regarded as the most stable because it facilitates the formation of stable carbonate minerals via carbon mineralization [28].
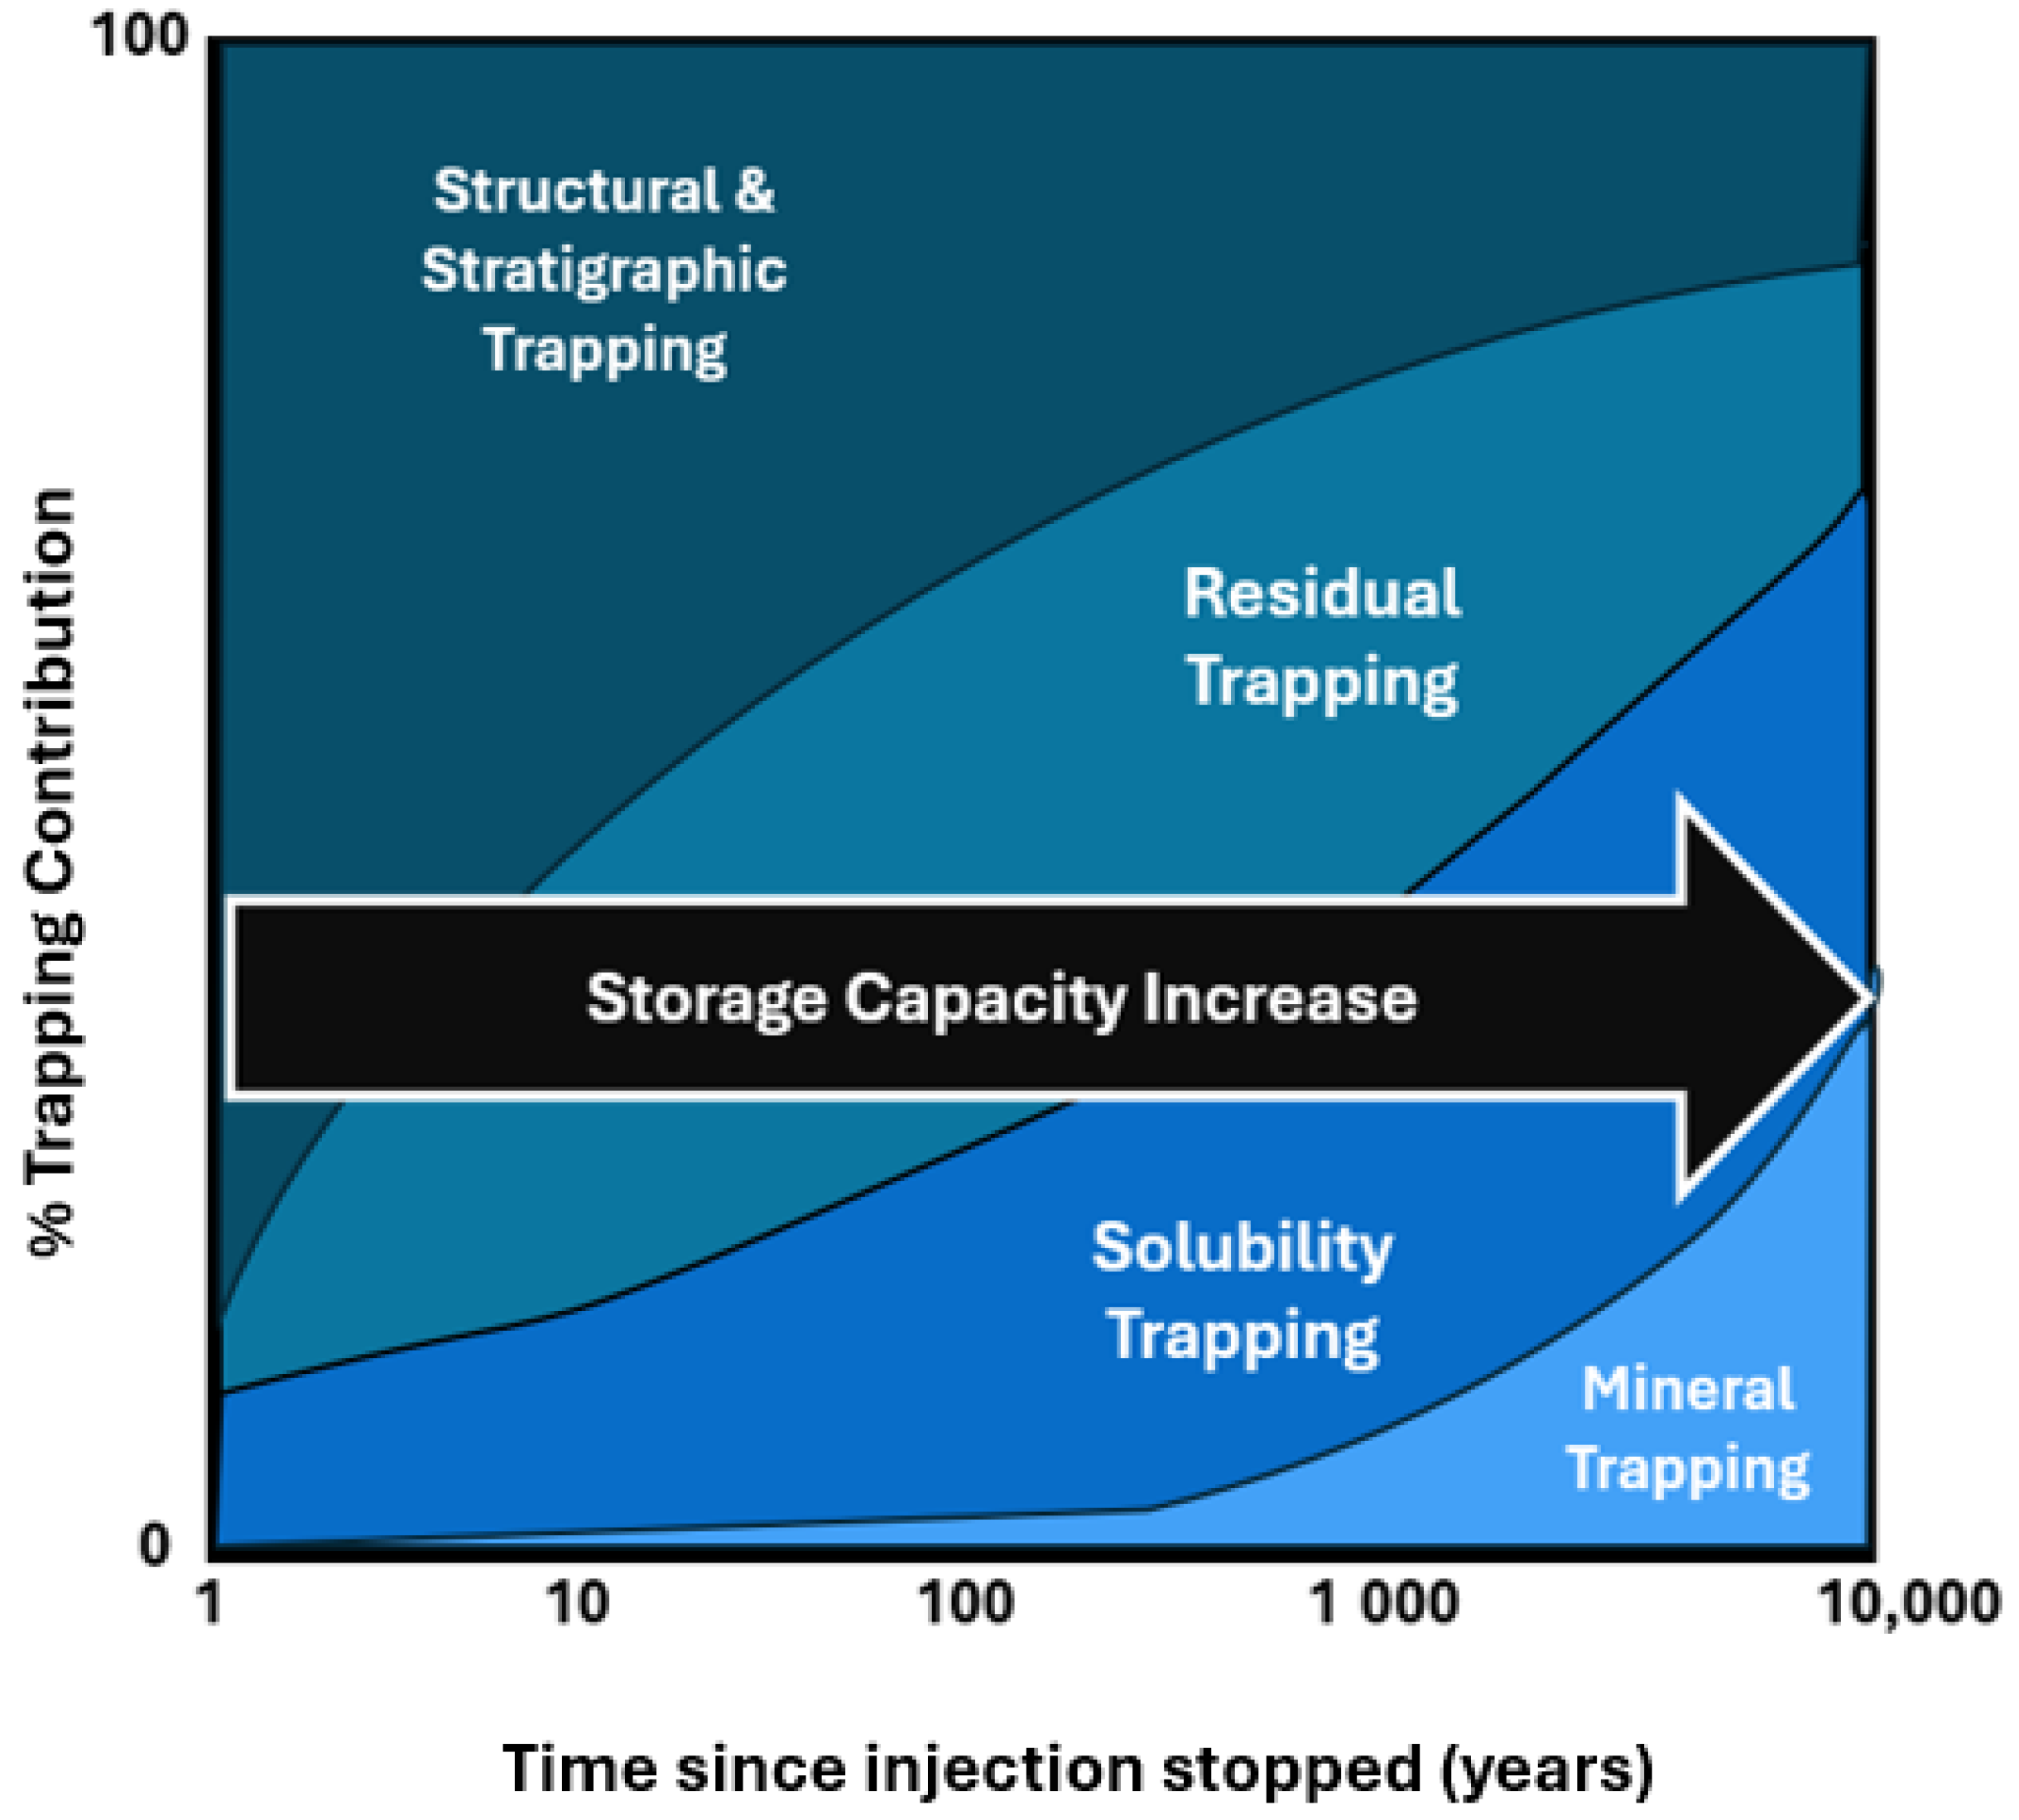
The CO2 trapping mechanism predominantly starts with structural and stratigraphic trapping, with some contribution from solubility trapping and relative permeability hysteresis. In extended timeframes, certain aspects play more significant roles in the retention of CO2, such as solubility, relative permeability hysteresis, and, eventually, mineral trapping, which also contributes to storage security [29]. Figure 1 illustrates the efficiency of the CO2 trapping mechanisms over time.

1.6. Objective of Study

This study aims to demonstrate the EOR potential, sequestration efficiency, and environmental benefits of WAG-CO2 projects in carbonate reservoirs by numerical simulations with realistic field and laboratory data. The source of the CO2 is assumed to be emissions from a nearby steam-driven EOR project, but the concept can be applied to emissions from other oil-field operations, refineries, or power generators. We demonstrate that oil-field CO2 emissions can be reduced or eliminated by prudent approaches, which create both economic and environmental value.
Based on reservoir engineering analysis, CO2 from steam boilers can be used to produce a substantial amount of additional oil from a nearby light oil carbonate reservoir. A commercial simulator was used to build a compositional model of a sector of the target limestone reservoir, which met the EOR screening criteria for miscible CO2 flooding. The EOR and sequestration efficacies were quantified in terms of the CO2 utilization ratios (UR) and retention capacity (RC). The interaction of CO2 with carbonate rock frame was not included as it is a longer-term effect than the timeframe of interest of this study. To support the numerical assumptions, a summary of a laboratory experiment is presented, aimed at evaluating wettability alteration and enhanced oil mobilization resulting from carbon dioxide (CO2) in a limestone reservoir. Contact angle and interfacial tension (IFT) measurements were conducted using a Drop Shape Analyzer (DSA-100) under reservoir conditions.

2. Methodology

A compositional numerical model of a sector area of a limestone reservoir—meeting enhanced oil recovery (EOR) screening criteria for miscible CO2 flooding—was developed using the CMG-GEM simulator (Computer Modelling Group, Version 2023) [31]. Prior to simulation, fluid characterization and equation-of-state tuning were conducted using CMG-WinProp (Computer Modelling Group, Version 2023) [32].
The compositional model incorporates complex fluid flow and CO2 retention mechanisms, including wettability alteration, miscibility, aqueous solubility of CO2, residual oil saturation, injected pore volume tracking, and the water-alternating-gas (WAG) injection scheme. EOR and sequestration efficiencies are evaluated through key metrics such as the CO2 utilization ratio, retention capacity, and sensitivity to both reservoir and operational parameters.

2.1. Overview

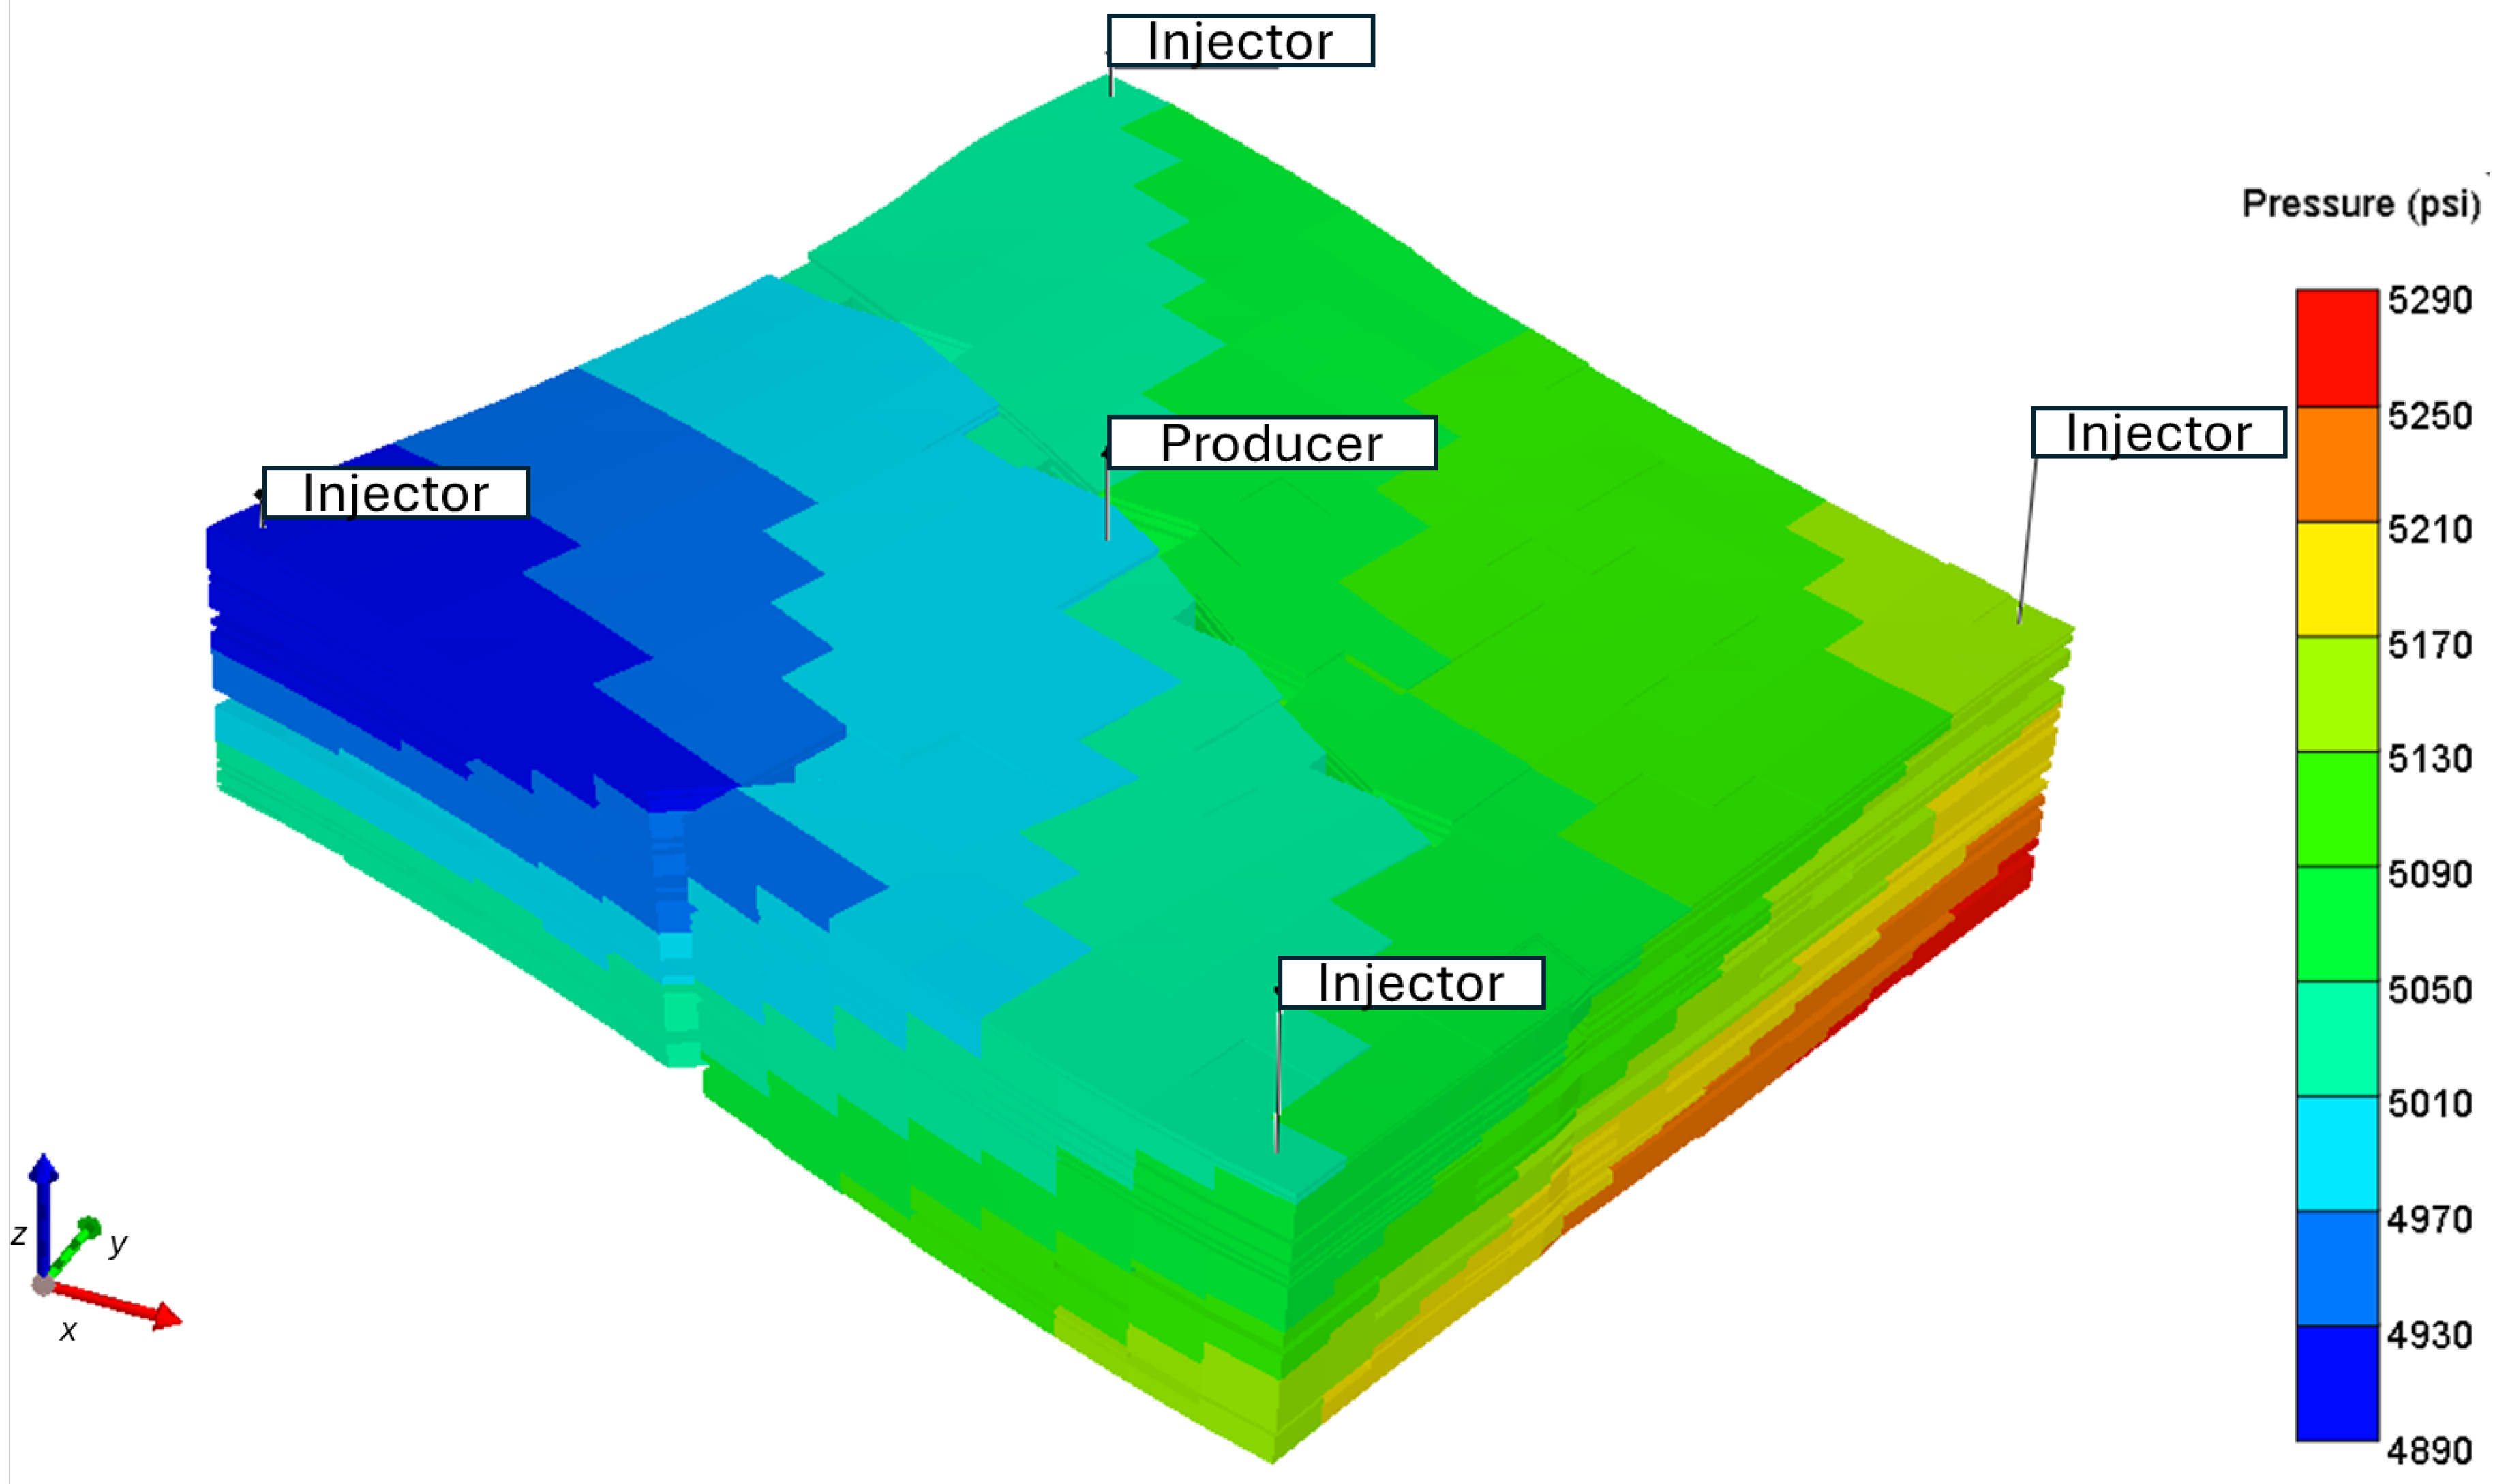
A single five-spot pattern is used to simulate the EOR/CCUS application for a limestone reservoir at a depth of 13,000 ft containing a light, 38° API oil. Such depth ensures pressure and temperature that are favorable for miscibility and storage efficiency. The facies are dominated by a clean limestone (calcite), which is suitable for CO2 EOR injection, and an open strike-slip fault constitutes heterogeneity. The negligible vertical and horizontal permeability of the overlying and underlying formations ensure containment and no cap-rock leakage. The model’s general details are shown in Table 2. A sector, 144 acres in size, is used where the four injectors are placed on the corner of the model, and the producer is centered as shown in Figure 2. The injector to producer distance is 1773 ft. The oil in place is 8 MMSTB, with a Hydrocarbon Pore Volume (HCPV) of 66 MMSTB.
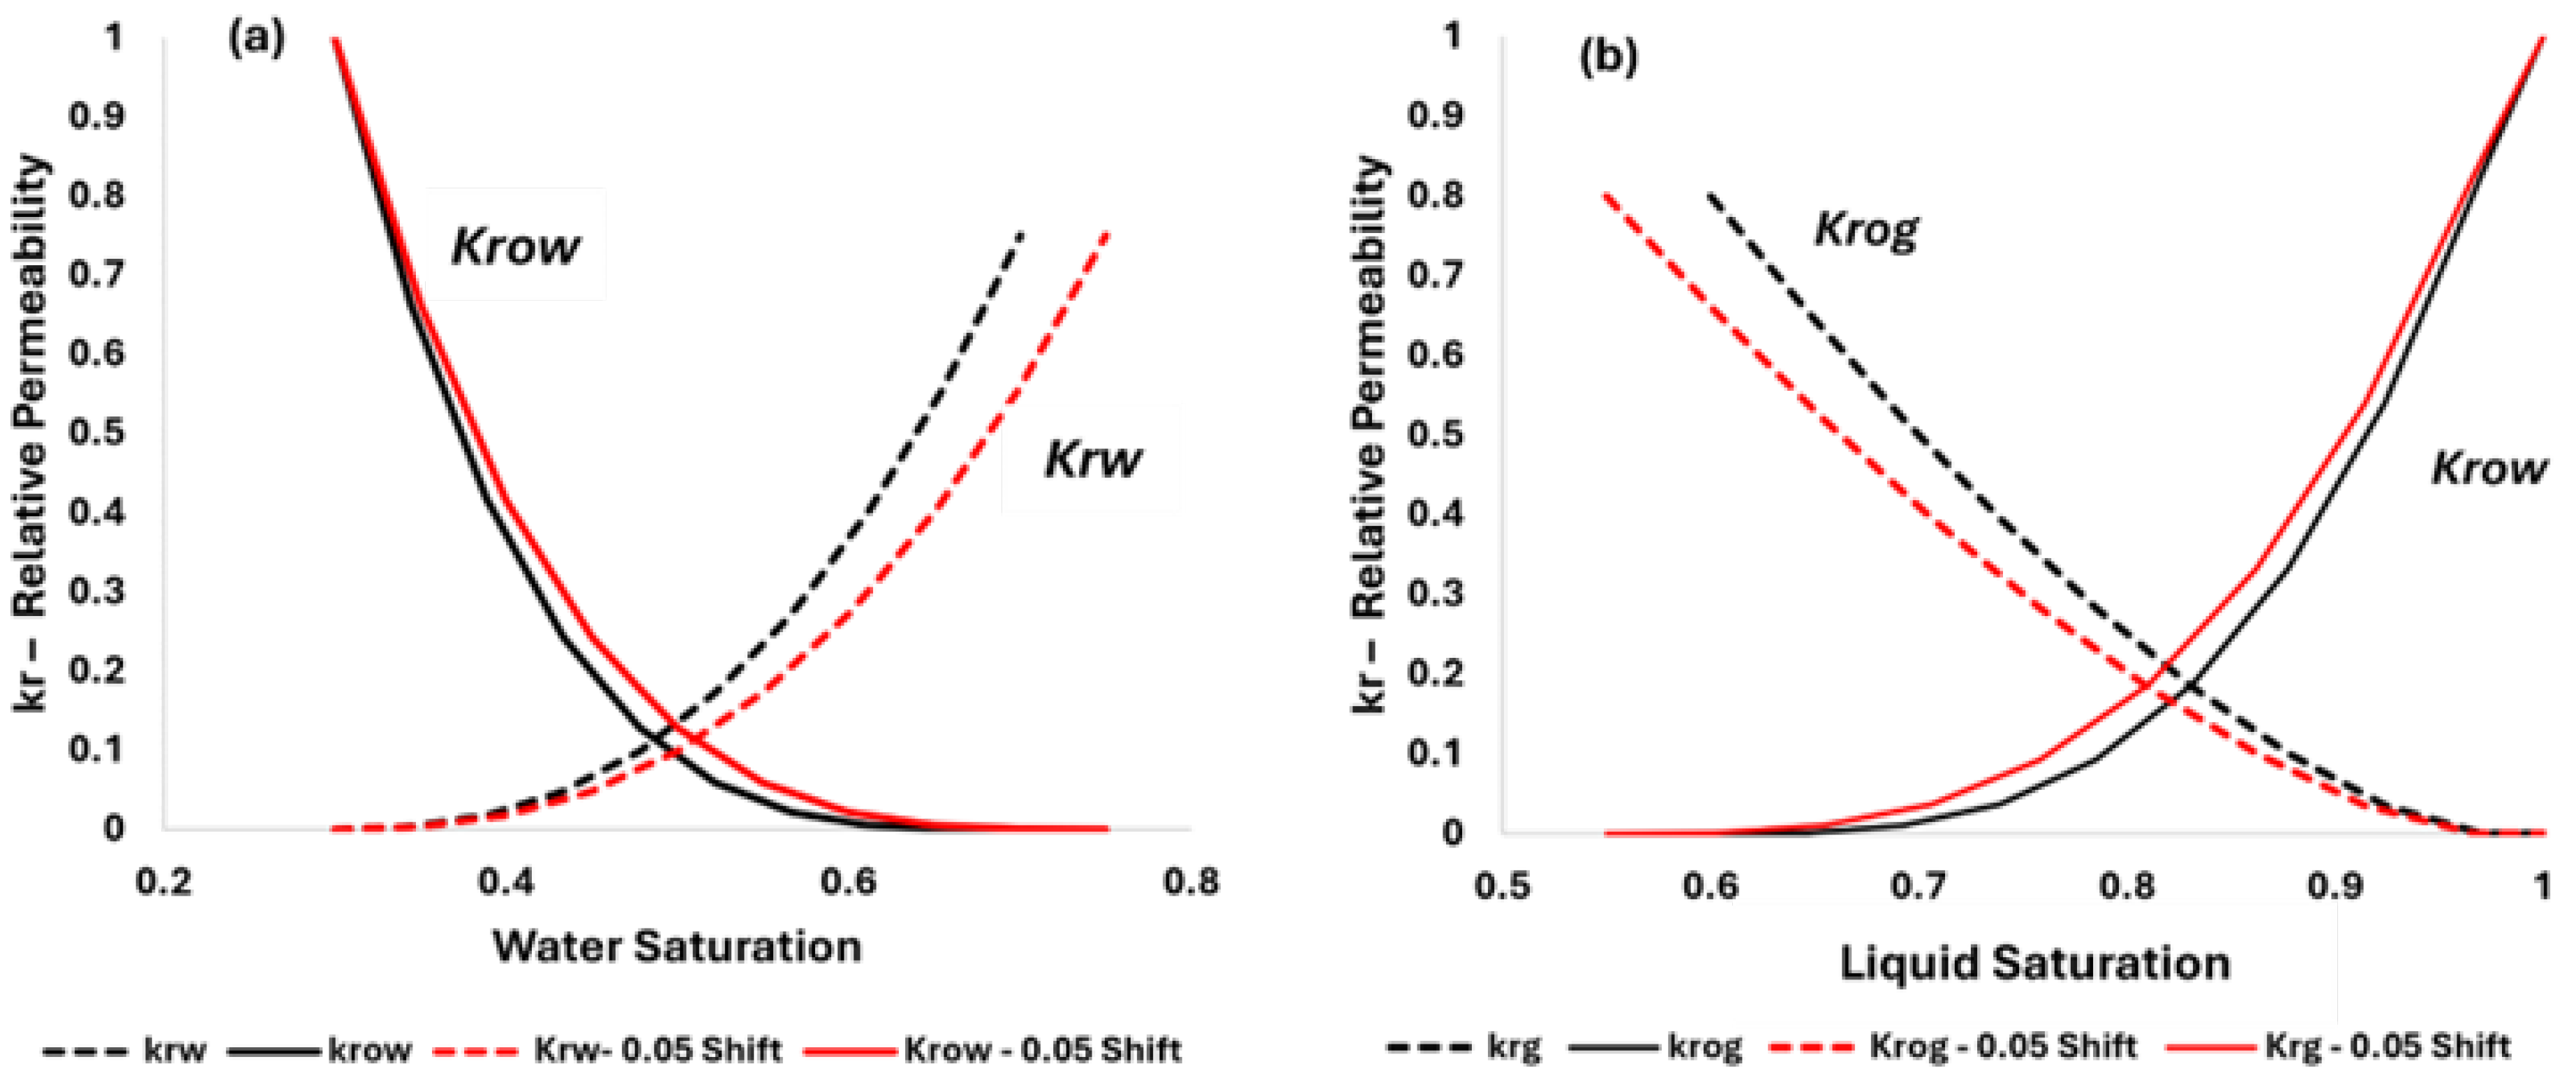
The relative permeability relations shown in Figure 3 assumed a mixed-wet system (30% for both residual oil and irreducible water saturations). The following figure illustrates the impact of the CO2 effect on relative permeability endpoints for oil–water and liquid–gas systems. The residual oil saturation is assumed to drop from the original 30% to 25% when CO2 concentration exceeds 50%. Relative permeability curves are comparable to those presented by Alam et al. [19] with small variations attributed to differences in rock characteristics.

2.2. CO2 Emission Source

This project considers the potential of eliminating a significant portion of the CO2 emitted from the boilers used in a steam-injection EOR project in a heavy oil reservoir. Considering that the capacity of a single steam boiler is 58 tons/h [33] and a total of 10 boilers are used, the CO2 emission from the thermal EOR project amounts to 119,000 and 2,370,000 metric tons per year and over a project period of 20 years, respectively.
By the recent SCC estimate of USD 185 per metric ton [9], this translates to a minimum social cost of carbon of USD 440 million for the proposed emission source over a 20-year period. Using this large CO2 source to increase hydrocarbon recovery in a nearby oil field can offer an effective means of eliminating CO2 from the atmosphere while improving the economics of the capture and sequestration process.
A typical example of thermal oil recovery with steam boilers is the oil field located in Kern County, California. Thermal recovery is the predominant enhanced oil recovery method in California, accounting for 96.5% of thermal applications in the United States [34]. The capacity of steam boilers utilized for thermal applications in the United States begins at 127,500 lb/h [33]. This is equal to 58 tons every hour. Another example is Petrofac, which created one of the largest projects in the Middle East, aiming for heavy oil production via steam flooding in the lower Fars Formation in Kuwait. Towering steam generators are utilized to supply the requisite steam for injection during heavy oil production [35].

2.3. Fluid Characterization

A compositional model is used to assess the performances of improved oil recovery (IOR) and EOR techniques in a 5-spot pattern. To quantify the EOR and sequestration efficiencies, the CO2 utilization ratio (UR), CO2 retention capacity (RC), and recovery factors (RF) will be used. The technical evaluations assume the availability of a sufficient amount of CO2 at a favorable price as well as incentive structures to make project economics viable.
The reservoir fluid is characterized by fitting the available PVT data using the Peng–Robinson (PR) equation of state (EOS) [36] with available PVT data, along with regression techniques to fit the data. The solubility of CO2 in the aqueous phase and in oil will be validated later in this section to ensure reasonable input. The viscosity and specific gravity of the fluid are 0.5 cP and 38° API, respectively. The component lumping of fluid composition shown in Table 3 is used to match the PVT data. The additional PVT properties are provided in Table 4.
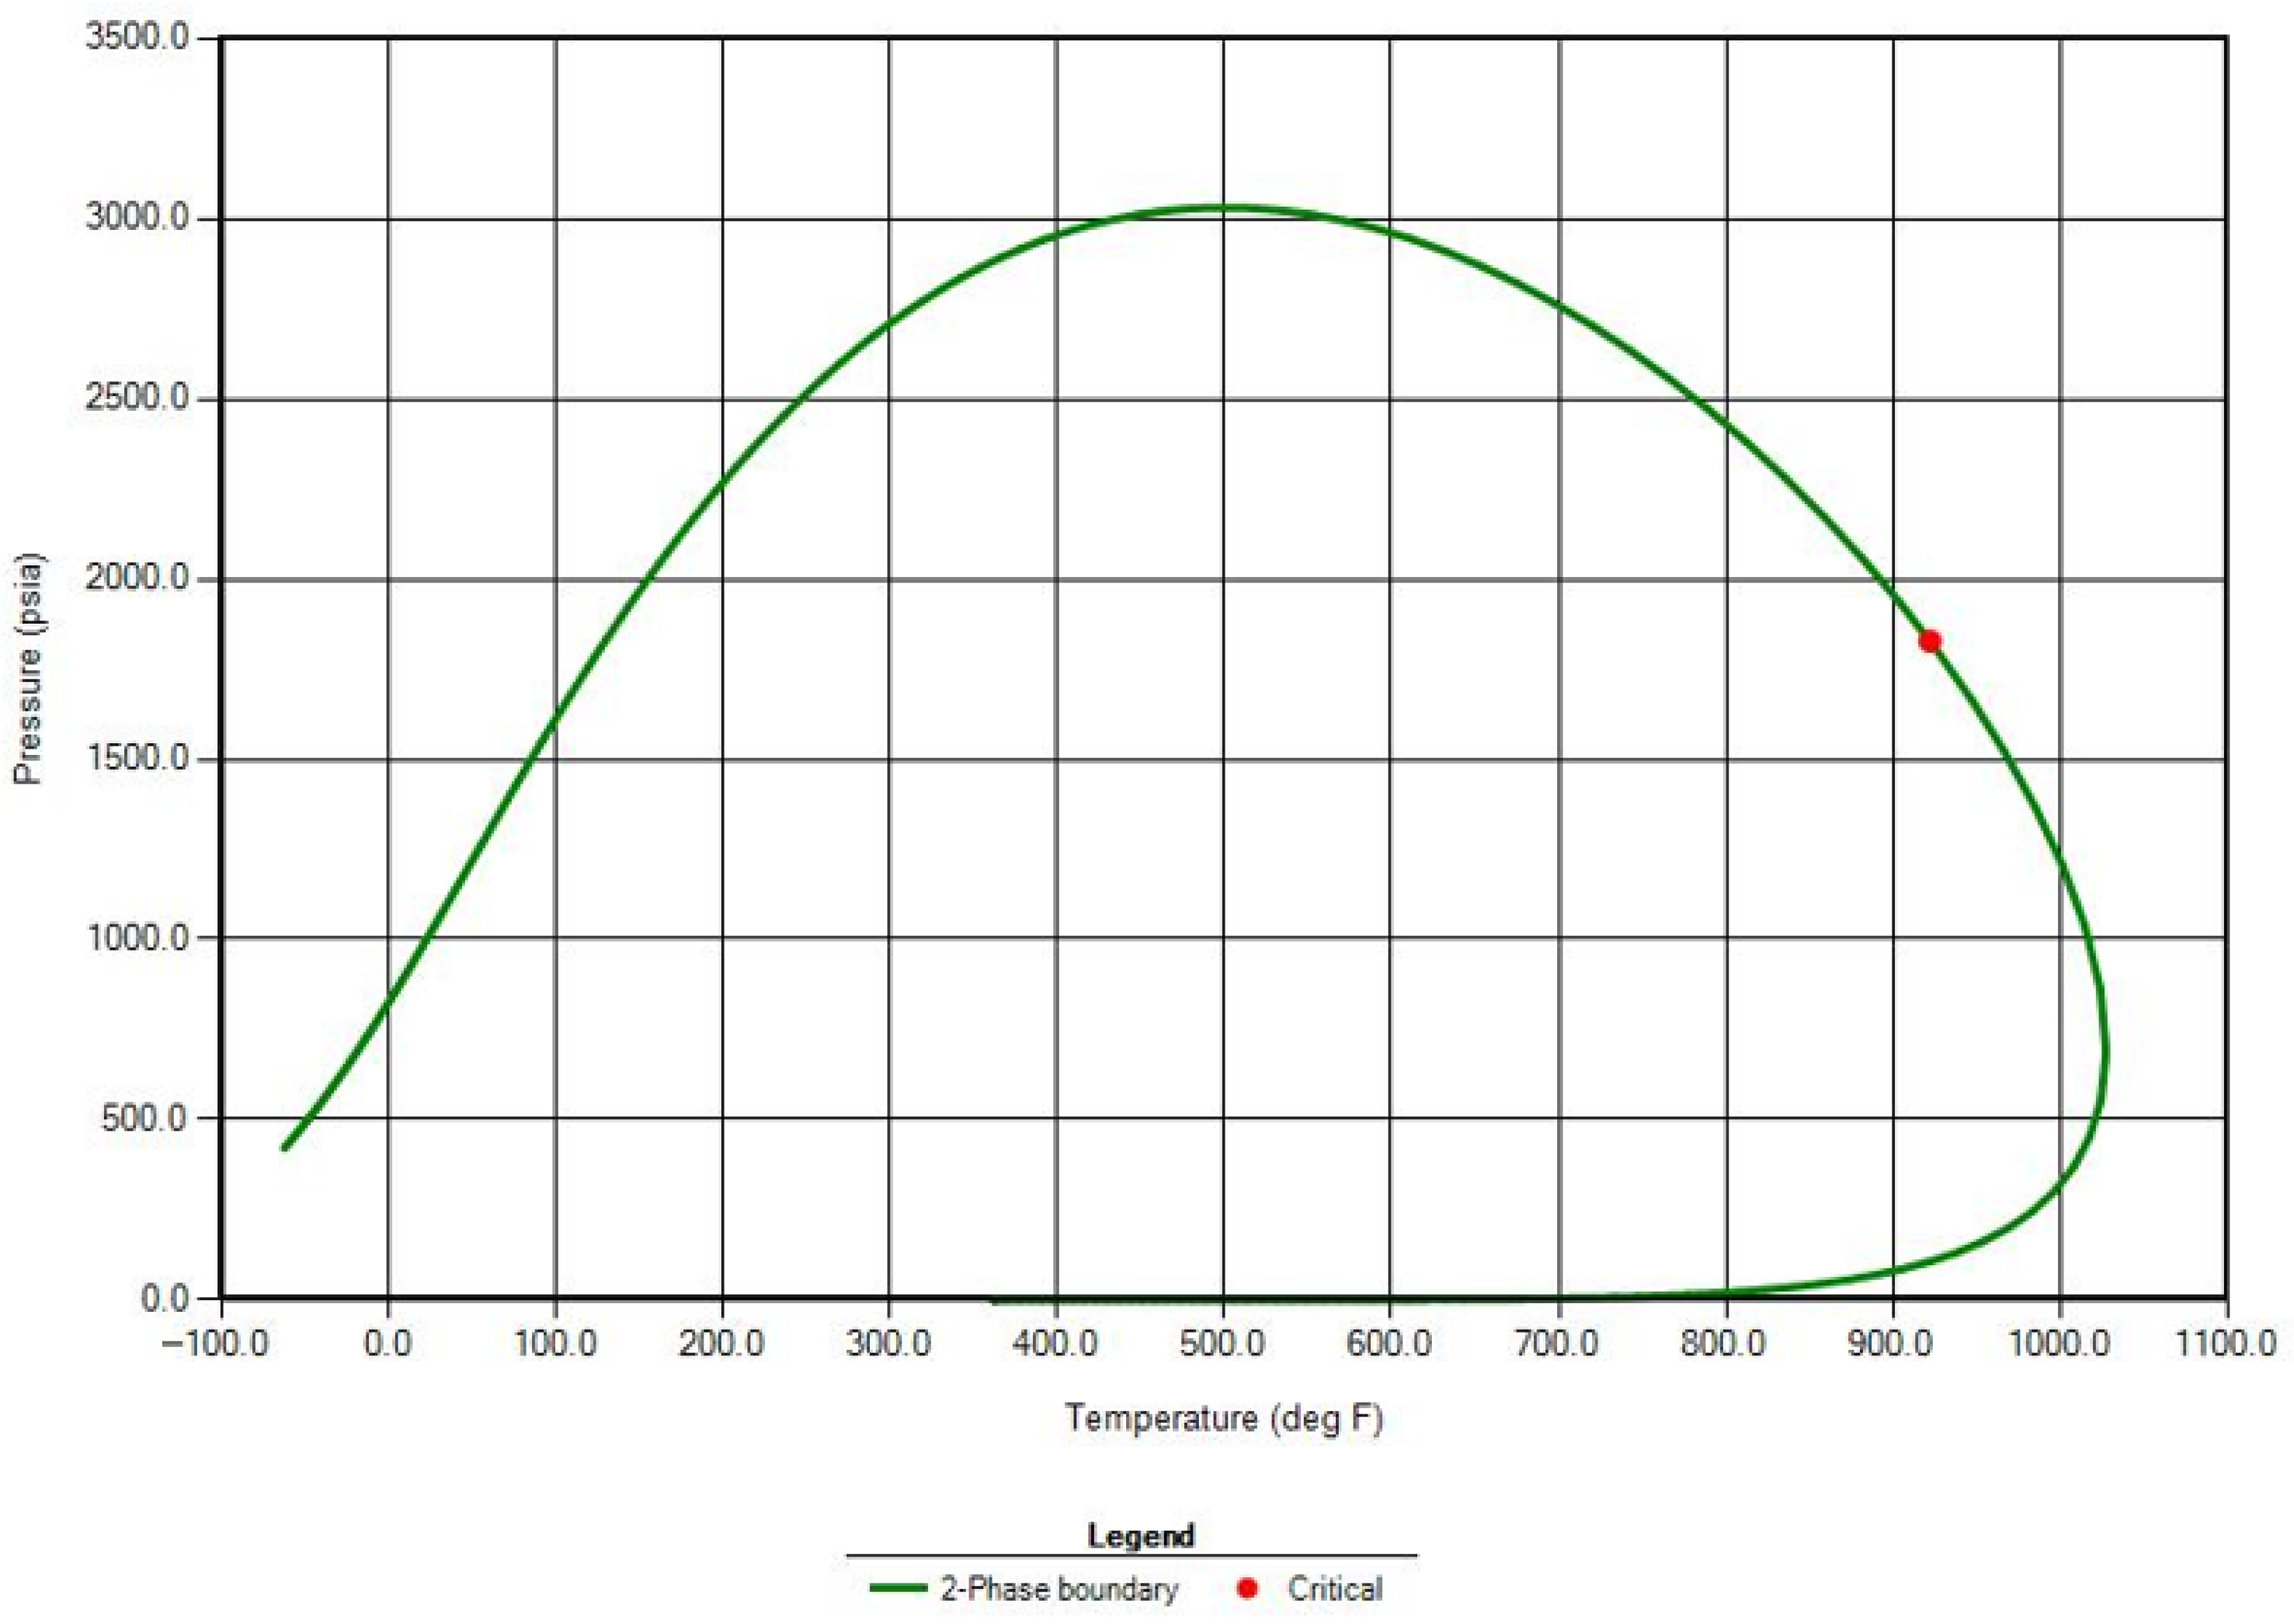
Fluid characterization and equation-of-state (EOS) tuning were conducted in CMG-WinProp, Version 2023 [32] to generate the compositional input required for simulation. WinProp is a tool to align the equation-of-state (EOS) parameters with laboratory data and produce phase behavior predictions for compositional reservoir simulation [32]. Regression was performed to match saturation pressure, constant composition expansion (CCE), differential liberation, and viscosity data using the Peng–Robinson EOS. Greater weight factors were applied to saturation pressure and key fluid properties such as critical pressure and temperature, acentric factor, and the molecular weight of heavy pseudo-components. An example of the general phase behavior of the tuned fluid system generated in WinProp is shown in Figure 4.
The minimum miscibility pressure (MMP) was calculated numerically via the multiple mixing cell method and verified by comparison to published correlations. The multiple mixing cell method divides the reservoir into segments with different compositions and generates key tie-lines for displacement [37]. The MMP to achieve multiple contact miscibility was calculated as 3680 psi by the multiple mixing cell method, and a phase envelope similar to that in Figure 4. This estimate of the MMP is in reasonable agreement with the empirical estimate of 3630 psia by Dindoruk Correlation [38] for pure CO2 injection.

2.4. Aqueous and Oil Solubility of CO2

The solubility of CO2 is influenced by temperature, salinity, and pressure. The findings from Duan and Sun (2003) [39] indicate that the CO2 solubility in 1 mol aqueous NaCl solution is 1.1129 mol/kg (140 SCF/STB), while in 1 mol aqueous CaCl2 solution and pure water, this value is 0.94 mol/kg (120 SCF/STB) and 1.3088 mol/kg (164 SCF/STB), respectively. The experimental work of Wang et al. (2024) [40] showed that CO2 solubility in live formations is less than that in dead water under reservoir conditions due to brine salinity. For example, the CO2 solubility in distilled water is 1.4 mol/kg (190 SCF/STB) at 6000 psia [40].
Figure 5 shows two trends of CO2 aqueous solubility versus pressure from an experimental data set [39] and Harvey correlation [31]. The correlation estimate of CO2 aqueous solubility was optimistic in comparison to the experimental range and literature data. The experimental range selected for this study was 1 m aqueous salinity = 50,000 ppm. For the correlation that was used in the CMG simulator, Henry’s constant under reservoir conditions (5000 psia and 240 °F) was calculated as 179,763   p s i a m o l e   f r a c t i o n , which results in 203 SCF/STB once embedded in the Krichevsky–Kasarnovsky equation [41]. The Harvey correlation [31] was initially used in the numerical model to calculate the CO2 solubility with temperature dependency. Therefore, the experimental range corresponding to the reservoir conditions in this work, 143 SCF/STB. This range was used for the CO2 aqueous solubility and embedded in the numerical model.
As for the CO2 solubility in oil, the CMG-Gems simulator numerically calculated the CO2–oil mole fraction as 0.6. The experimental data (106 data points) compiled by Emera [42], on the other hand, showed increasing solubility with pressure. Interpolating for the reservoir condition (5000 psia = 34 MPa, 240 °F = 116 °C) led to an approximately 0.63 mole fraction (solubility), which was reasonably aligned with the estimation of the simulator (CMG-Gems).

2.5. Case Scenarios

This study considers multiple recovery mechanisms: waterflooding, continuous miscible CO2 flooding, and WAG-CO2. In the WAG scenario, the cycle comprised one year of water injection followed by one year of CO2 flooding. All scenarios were evaluated over a forecast duration of 20 years, with an annual injection rate of 5% HCPV; further details are shown in Table 5.
Injected HCPV ranges are taken from practical applications [38]. The producer constraint is based on the MMP, and the injected HCPV matches reservoir conditions. The injector pressure is controlled to ensure that the pressure gradient does not exceed 0.55 psi/ft, preventing fractures.
This study focuses on a carbonate limestone reservoir over a 20-year EOR-forecast-timeframe. Mineral interaction and trapping play important roles in the long term; however, this numerical study is not long enough to account for mineralization but will account for solubility trapping and residual trapping.

3. Results

3.1. Simulation Results

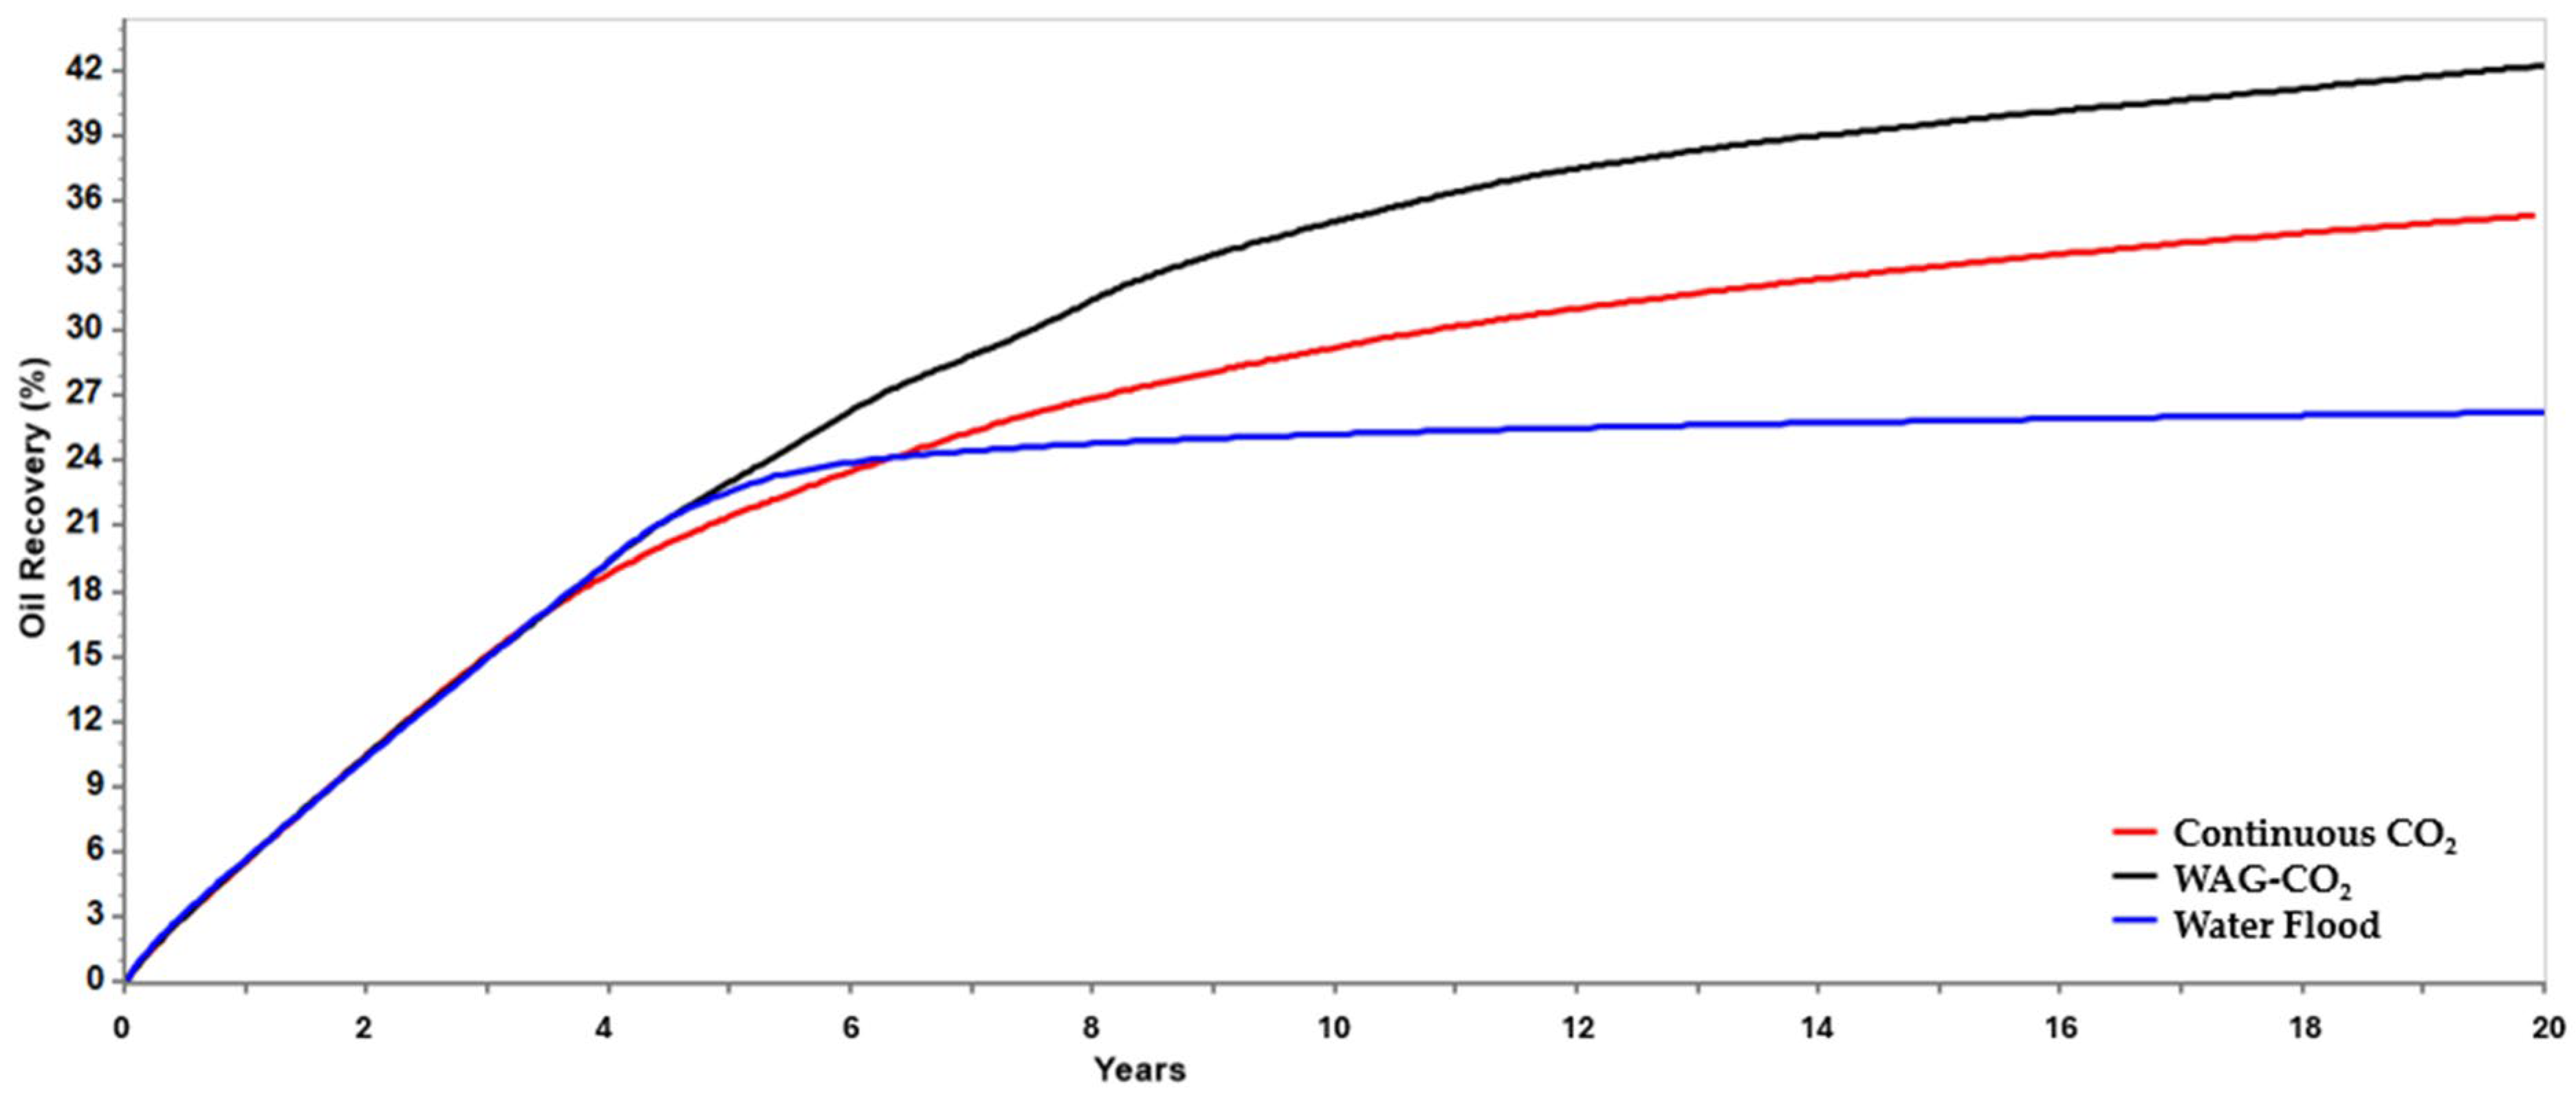
The results shown in Figure 6 reveal that WAG-CO2 achieves the highest RF among all IOR/EOR techniques. WAG-CO2 attains 42% oil recovery in comparison to 35% recovery in continuous CO2 injection. The comparison of the injected HCPVs indicates that WAG-CO2 necessitates significantly smaller volumes (0.5 HCPV) of CO2 compared to that (1 HCPV) in continuous CO2 injection. Although this may be beneficial for EOR efficiency, as will be discussed later in this section, low CO2 use may not be desirable for CO2 sequestration. Moreover, the treatment and disposal of generated water during the WAG-CO2 process may provide economic, logistical, and environmental issues. The recovery factor for waterflooding in the same case was at 25% and will be used as a reference point for the utilization ratio (UR) calculations.
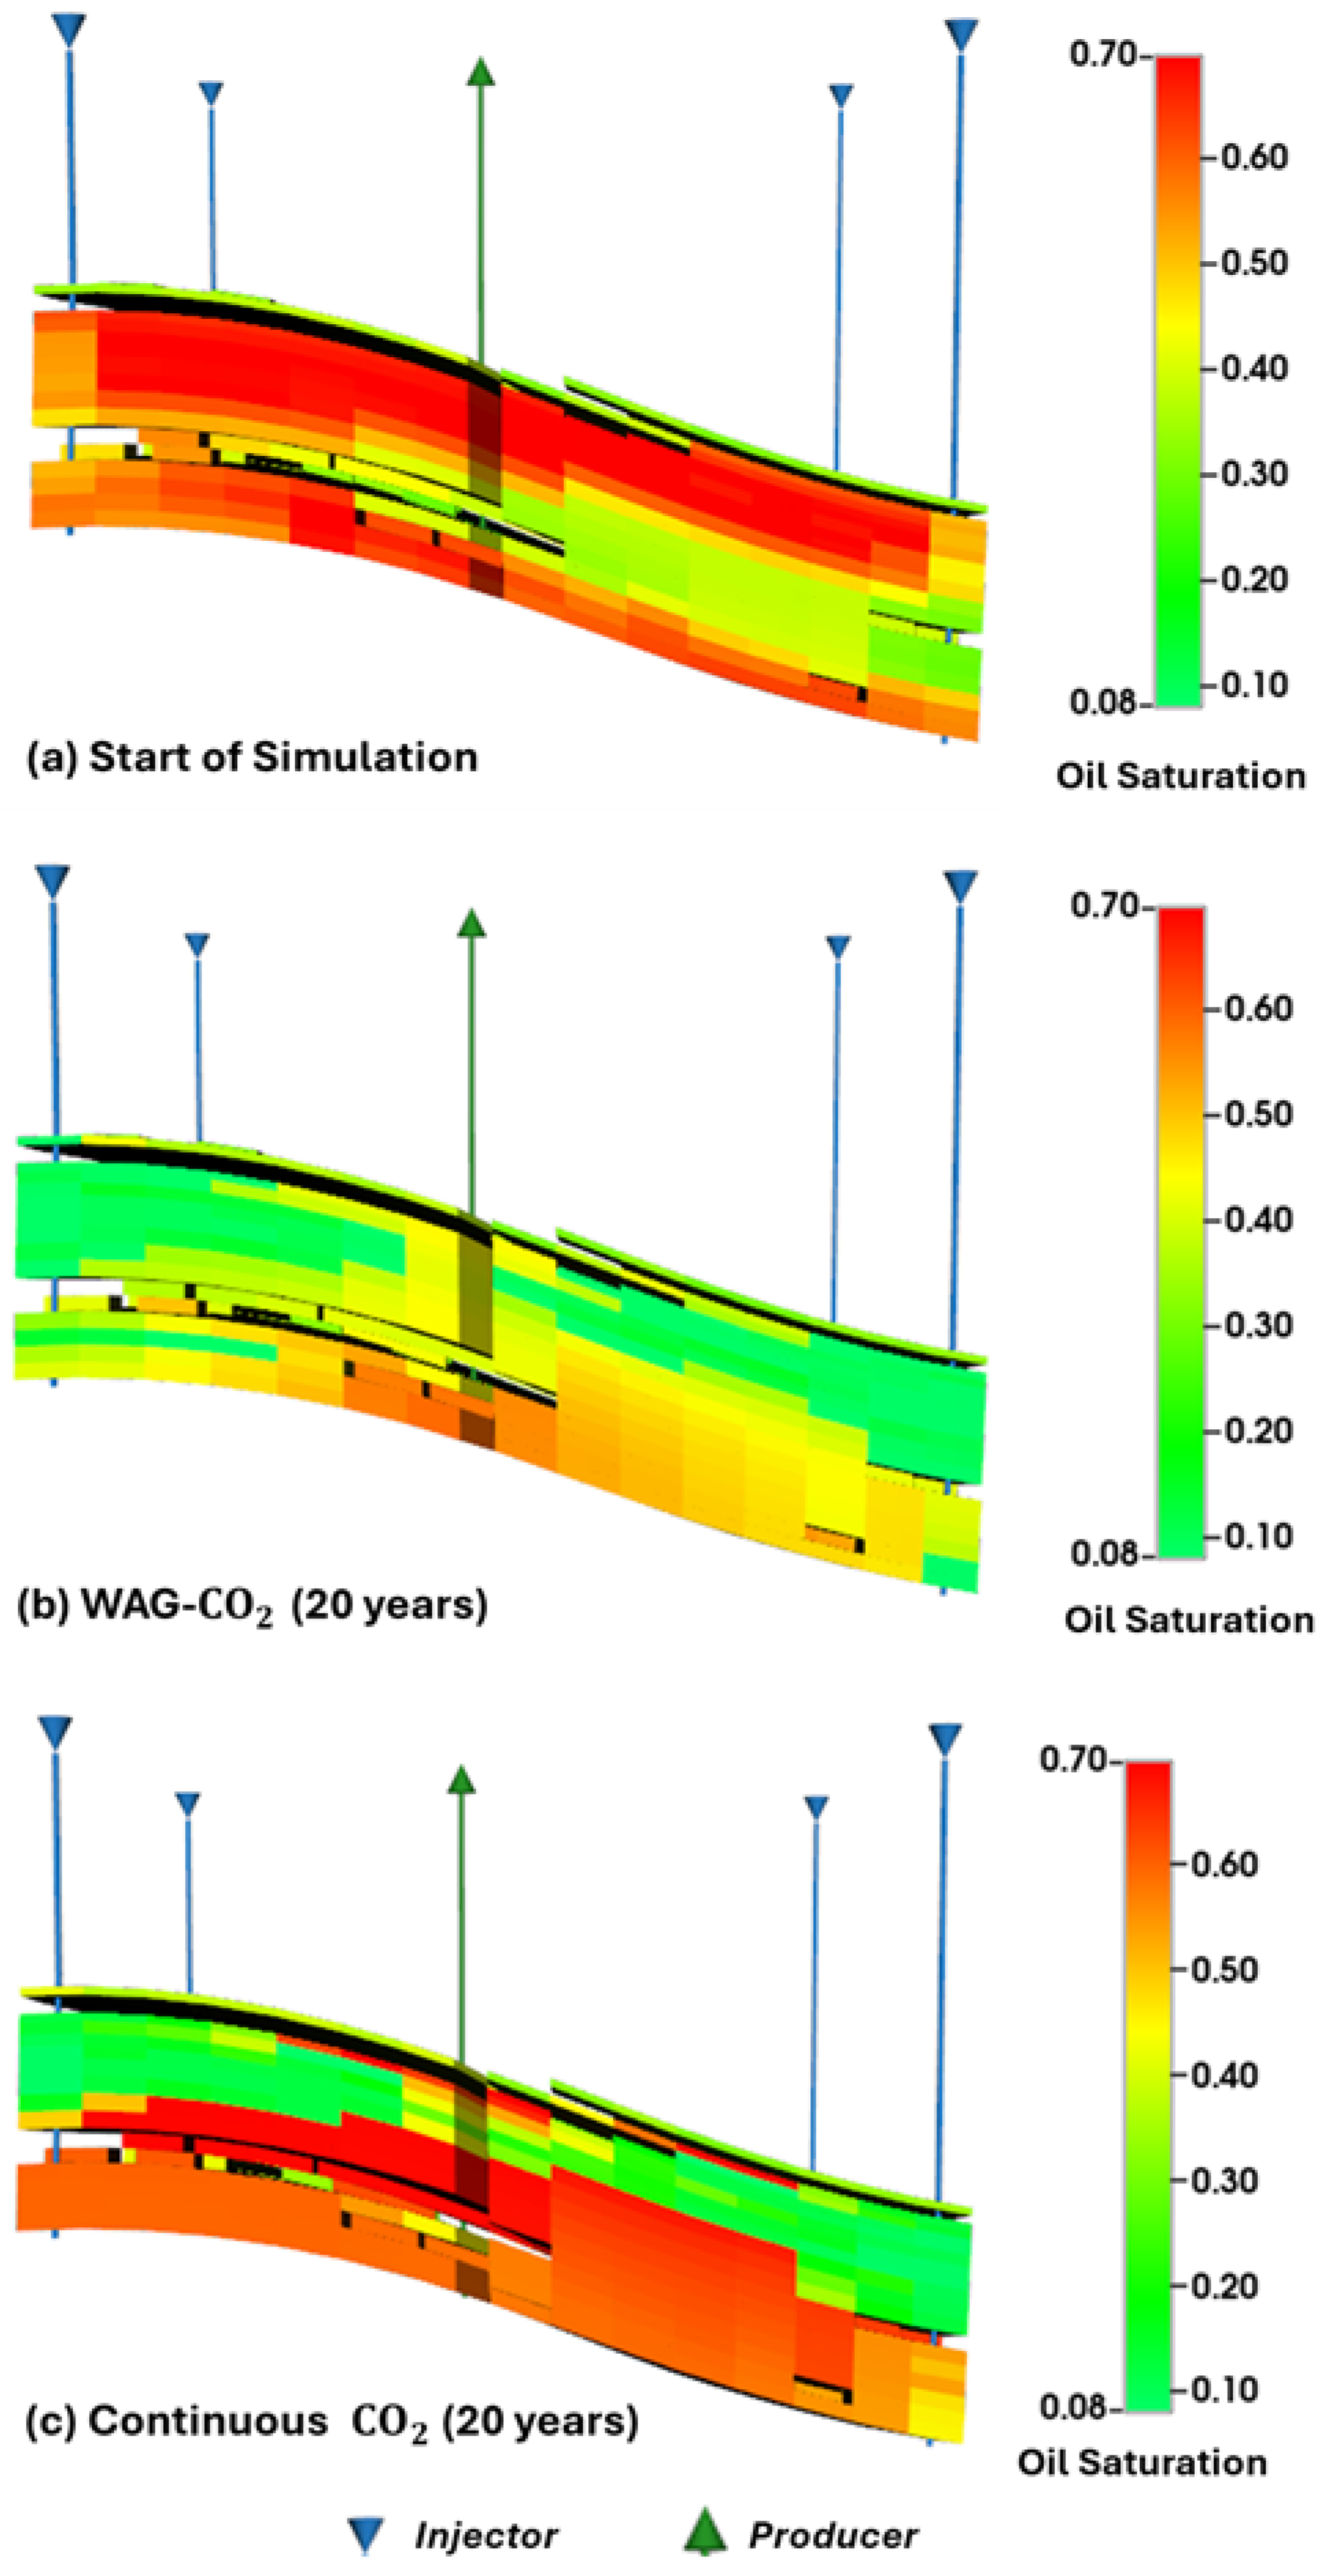
The pilot cross-sections in Figure 7 show the sweep and displacement efficiencies of the WAG-CO2 and continuous CO2 injection scenarios. WAG-CO2 injection outperforms continuous CO2 injection in enhancing oil recovery by better mobility control, effectively contacting unswept zones and improving microscopic displacement [43]. Alternating water and gas injection enhances the mobility of the gas phase, resulting in an improved mobility ratio.
At equivalent timepoint, continuous CO2 injection shows higher levels of CO2 gravity override, which leads to less effective oil displacement (oil saturation is reduced in the higher section of the targeted formation, but significant quantities of oil are left behind in the lower section). In the WAG-CO2 case, a better-defined oil bank is observed, and less gravity override provides better sweep and displacement efficiencies. This indicates that the displacement of the oil bank caused by the WAG-CO2 process provides better sweep efficiency with negligible gravity override in comparison to continuous CO2 flood.

3.2. CO2 Utilization Efficiency Metrics

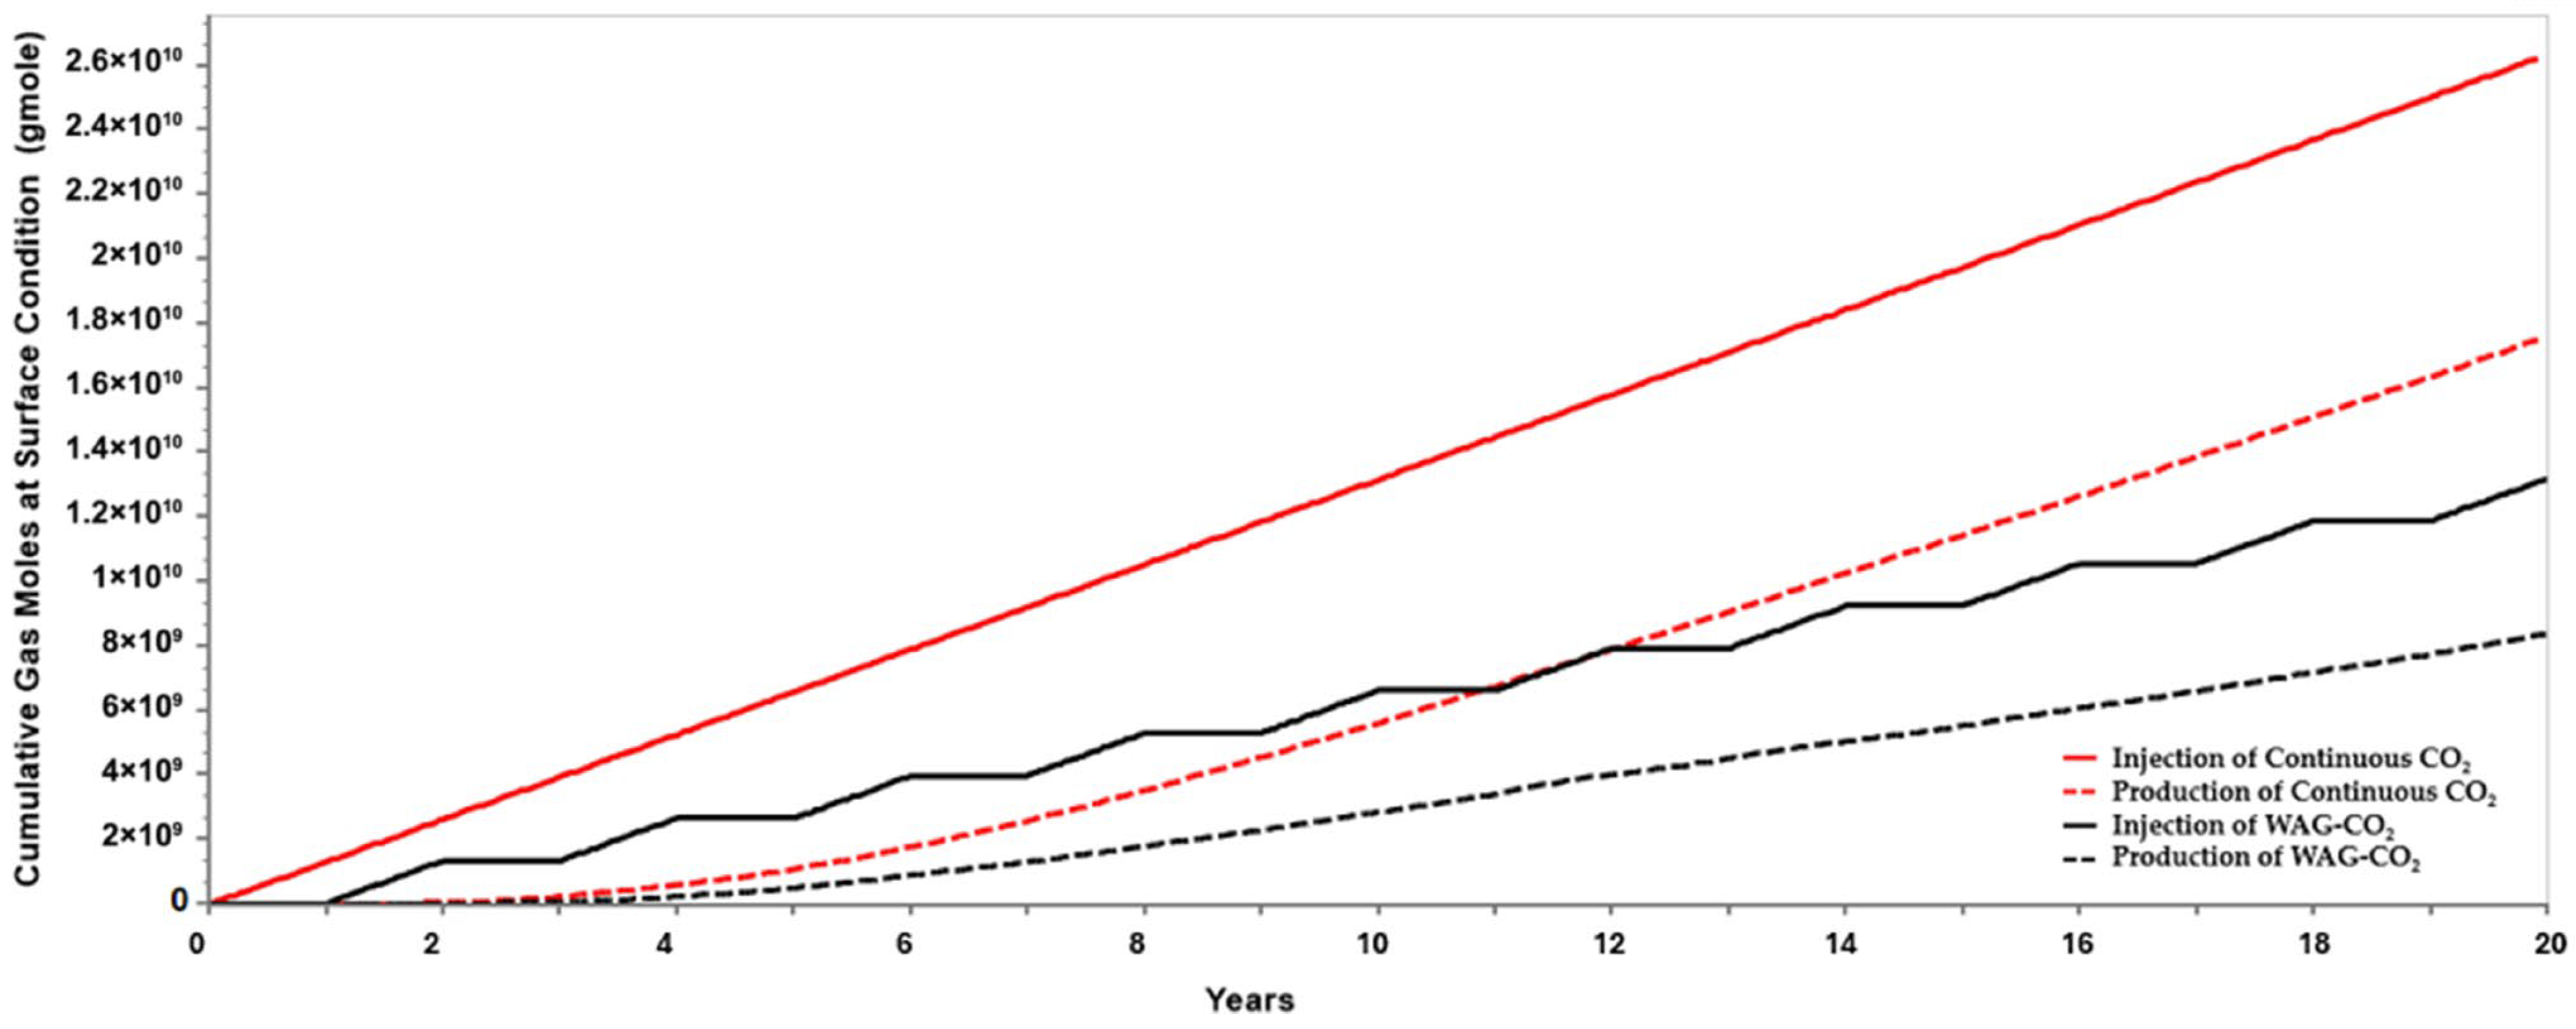
Figure 8 demonstrates the cumulative CO2 injected and produced under surface conditions for both the WAG-CO2 and continuous CO2 injection scenarios. These production and injection volumes have been used in the calculation of the net utilization ratio (NUR), gross utilization ratio (GUR), and retention capacity (RC) shown in Table 6. The results in Table 6 indicate that high incremental recoveries and good EOR efficiencies quantified by the low net utilization ratio (NUR) and gross utilization ratio (GUR) values do not necessarily align with the CO2 sequestration goals quantified by the retention capacity (RC). WAG-CO2 has the highest incremental RF (42%) of the EOR scenarios, as well as a net utilization ratio (NUR) and gross utilization ratio (GUR) of 3.1 MSCF/STB and 8.32 MSCF/STB, respectively. The RF of WAG-CO2 is considerably higher than that for continuous CO2 (35%), and the net utilization ratio (NUR) and gross utilization ratio (GUR)are significantly lower than those for continuous CO2 (9.6 MSCF/STB and 29 MSCF/STB, respectively). These results should be attributed to the aqueous solubility of CO2 and the improved displacement efficiency of WAG-CO2.
The retention capacities (RCs) are very close, with a slight advantage in f WAG-CO2 vs. continuous CO2 injection (36% vs. 33%). However, because of the lower volumes of CO2 used in the WAG-CO2 process, the actual amount of sequestered CO2 is less than that for the continuous CO2 injection case (WAG-CO2 produced 75% more oil than continuous CO2 injection, but continuous CO2 injection sequestered 83% more CO2 than the WAG-CO2).
Produced and recycled quantities of CO2 decrease the net utilization ratio (NUR) and are considered beneficial for the economics of CO2-EOR projects (although the high post-processing cost of the produced fluids may hamper the benefits). However, from the sequestration perspective, higher produced CO2 indicates less retention of CO2 (lower retention capacity (RC)) and a poor sequestration performance. Table 6 shows the summary of the EOR vs. sequestration results of the case studies.
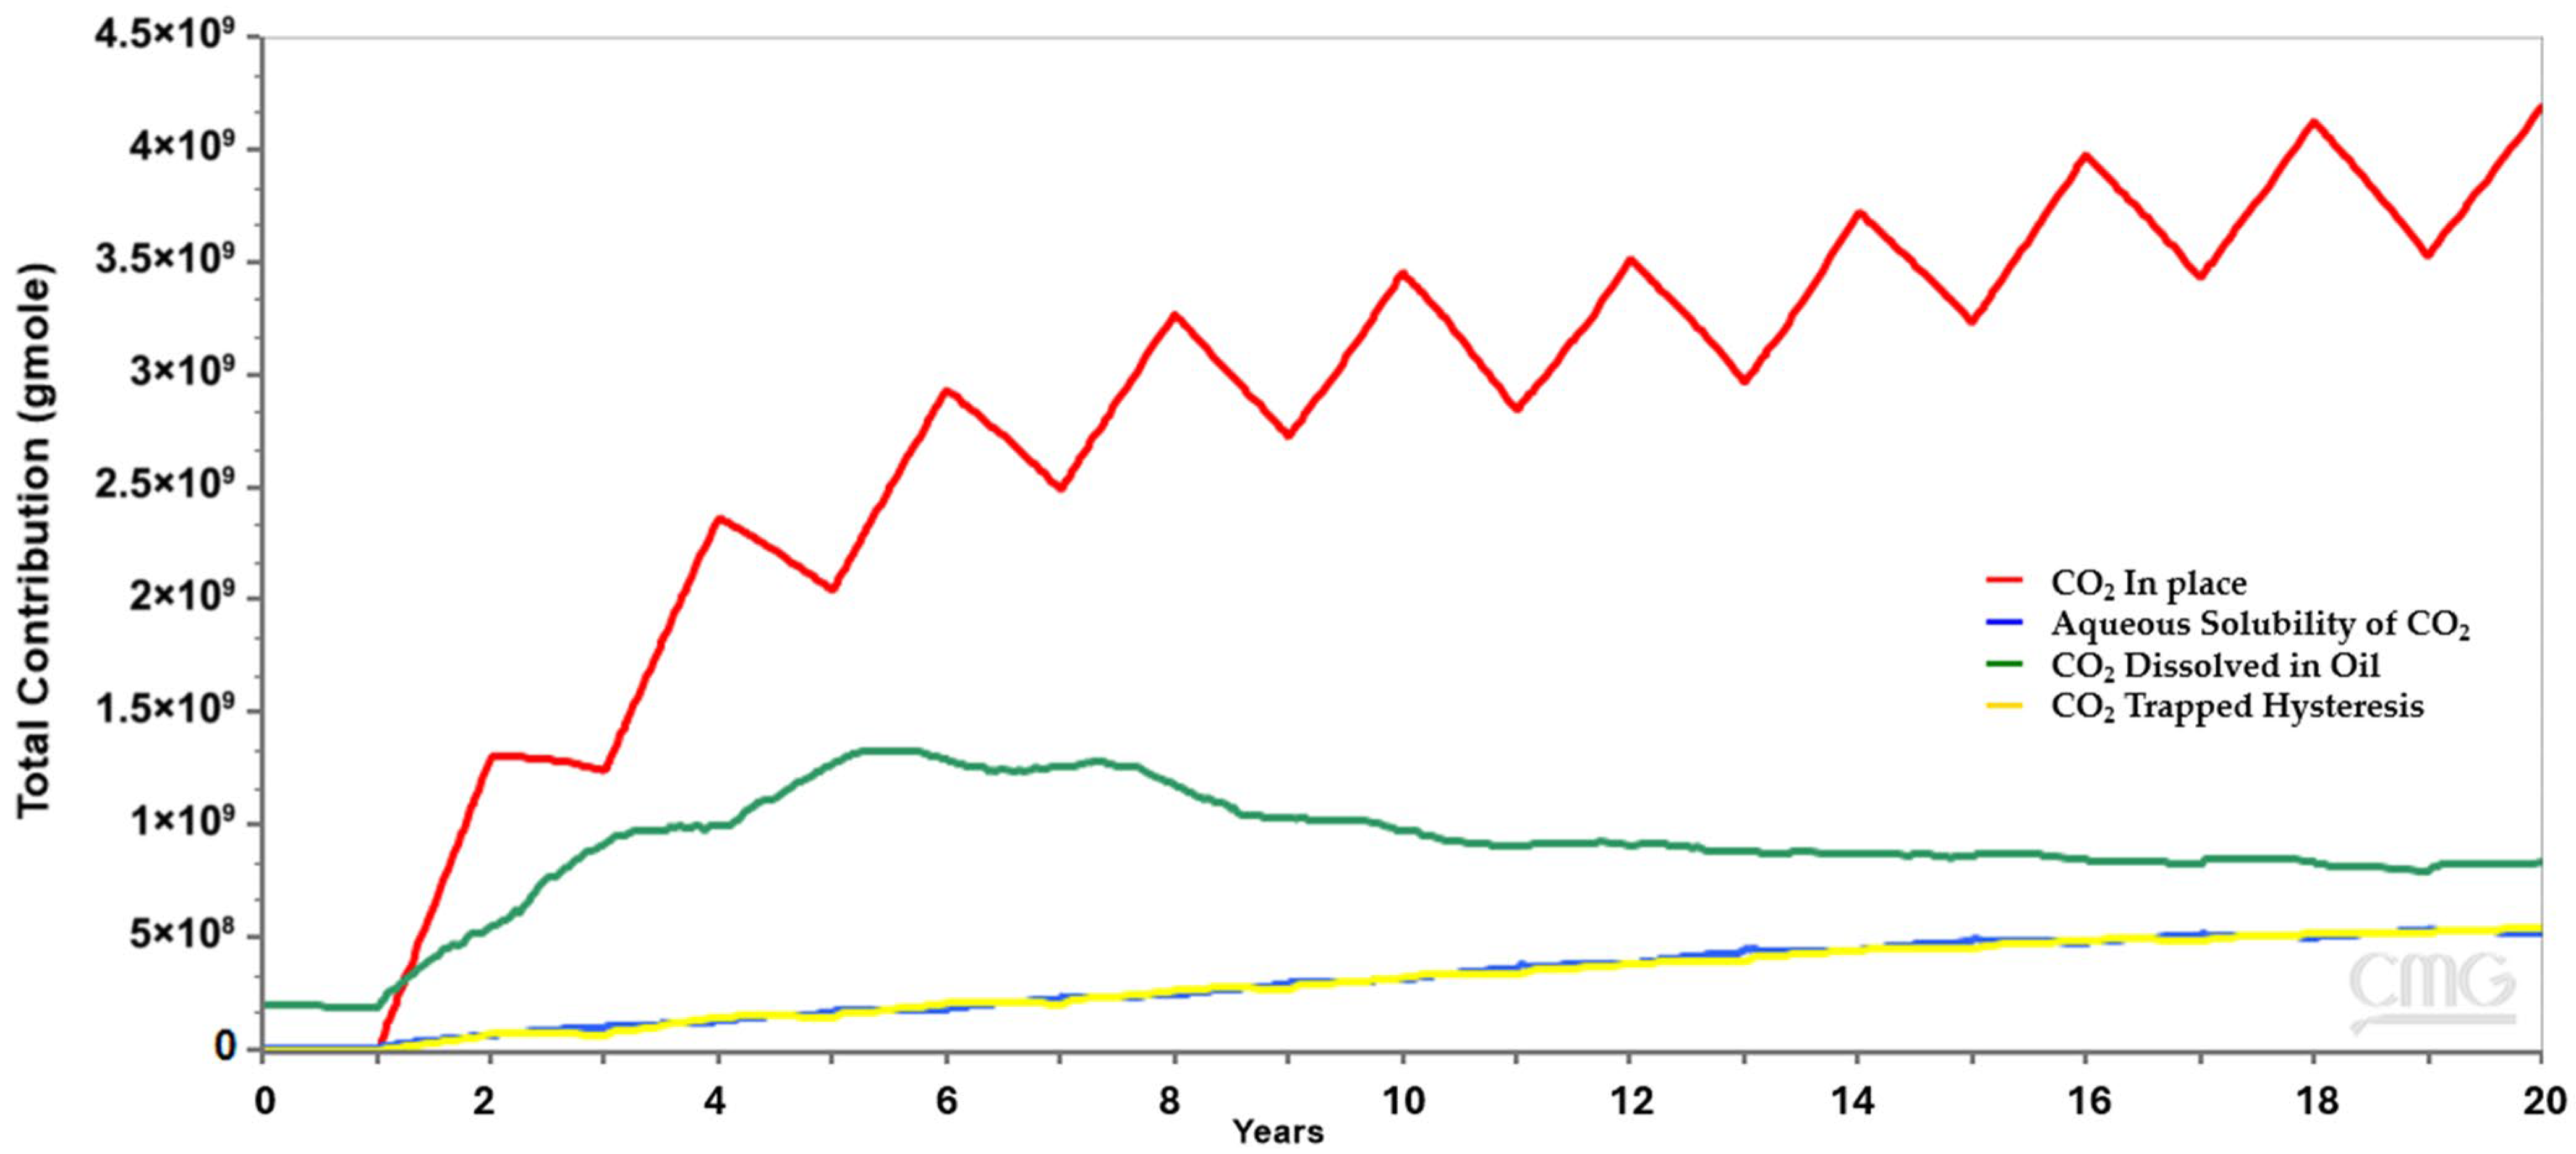
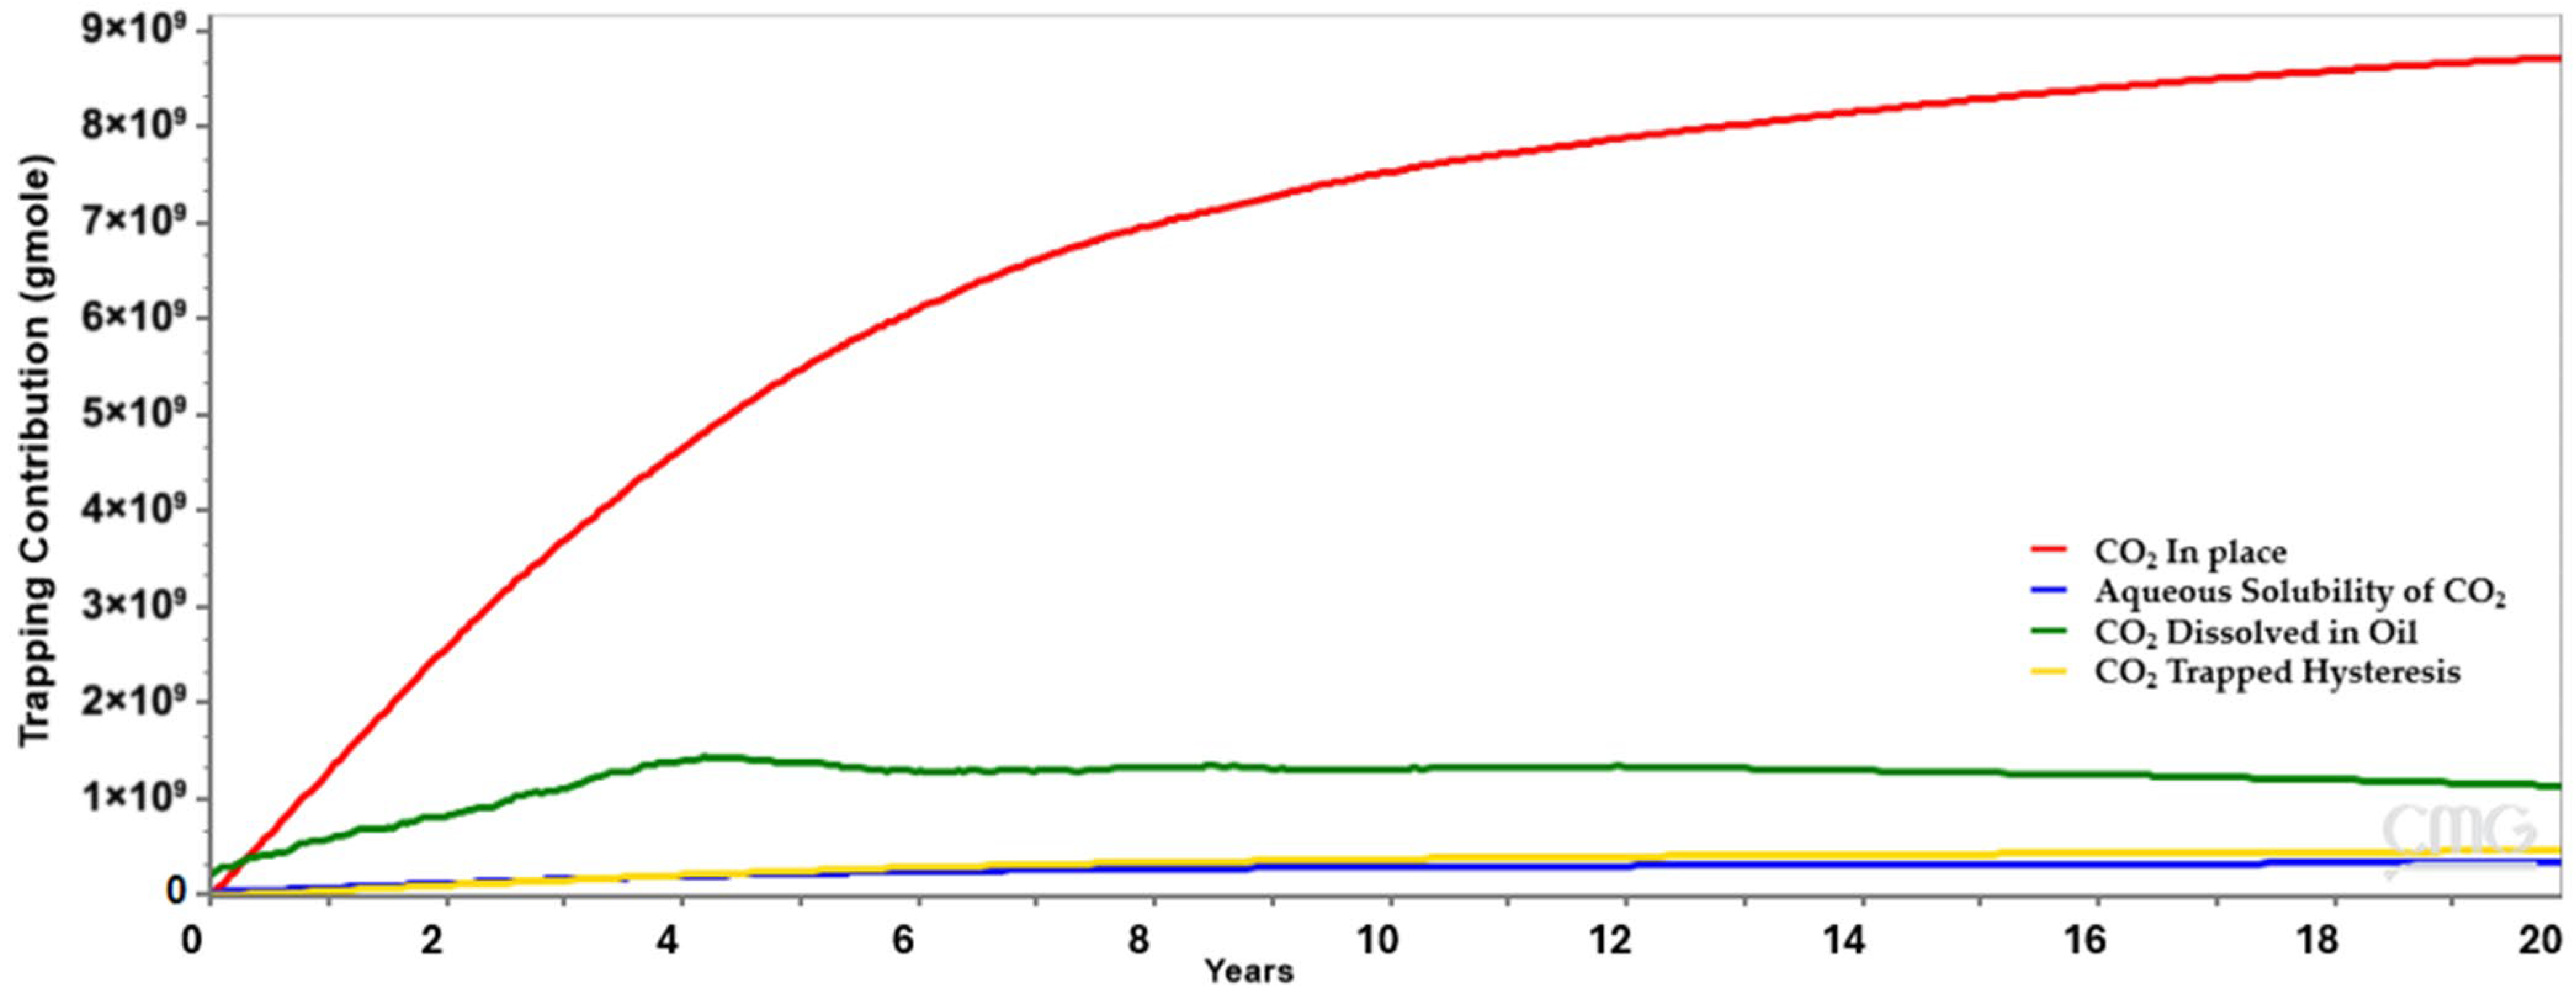
Table 7 provides the quantities and percentages of CO2 retained in the reservoir by various mechanisms during the CO2-WAG and continuous CO2 project. For CO2-WAG, the aqueous solubility of CO2 contributed 22.5% in comparison to 4.2% in continuous CO2. This shows the importance of aqueous solubility in the efficient utilization of CO2, as well as that of a higher recovery factor. Solubility in oil contributed 15.2% for WAG-CO2 in comparison to 13.4% in continuous CO2. Relative permeability hysteresis contributed 14.6% for WAG-CO2 in comparison to 6.1% in continuous CO2, indicating the effect of relative permeability hysteresis in sequestration efficiency. The remaining CO2 in the reservoir (47.7% for CO2-WAG and 76.3% for continuous CO2) is in the free gas phase. Figure 9 and Figure 10 show the quantities of CO2 stored in moles during the simulated timeframe of this study. The reduction in the amount of CO2 dissolved in oil is mainly due to less oil remaining in the swept region. The remaining CO2 is either trapped by hysteresis or in the aqueous phase.

3.3. Social Cost of Carbon Estimates

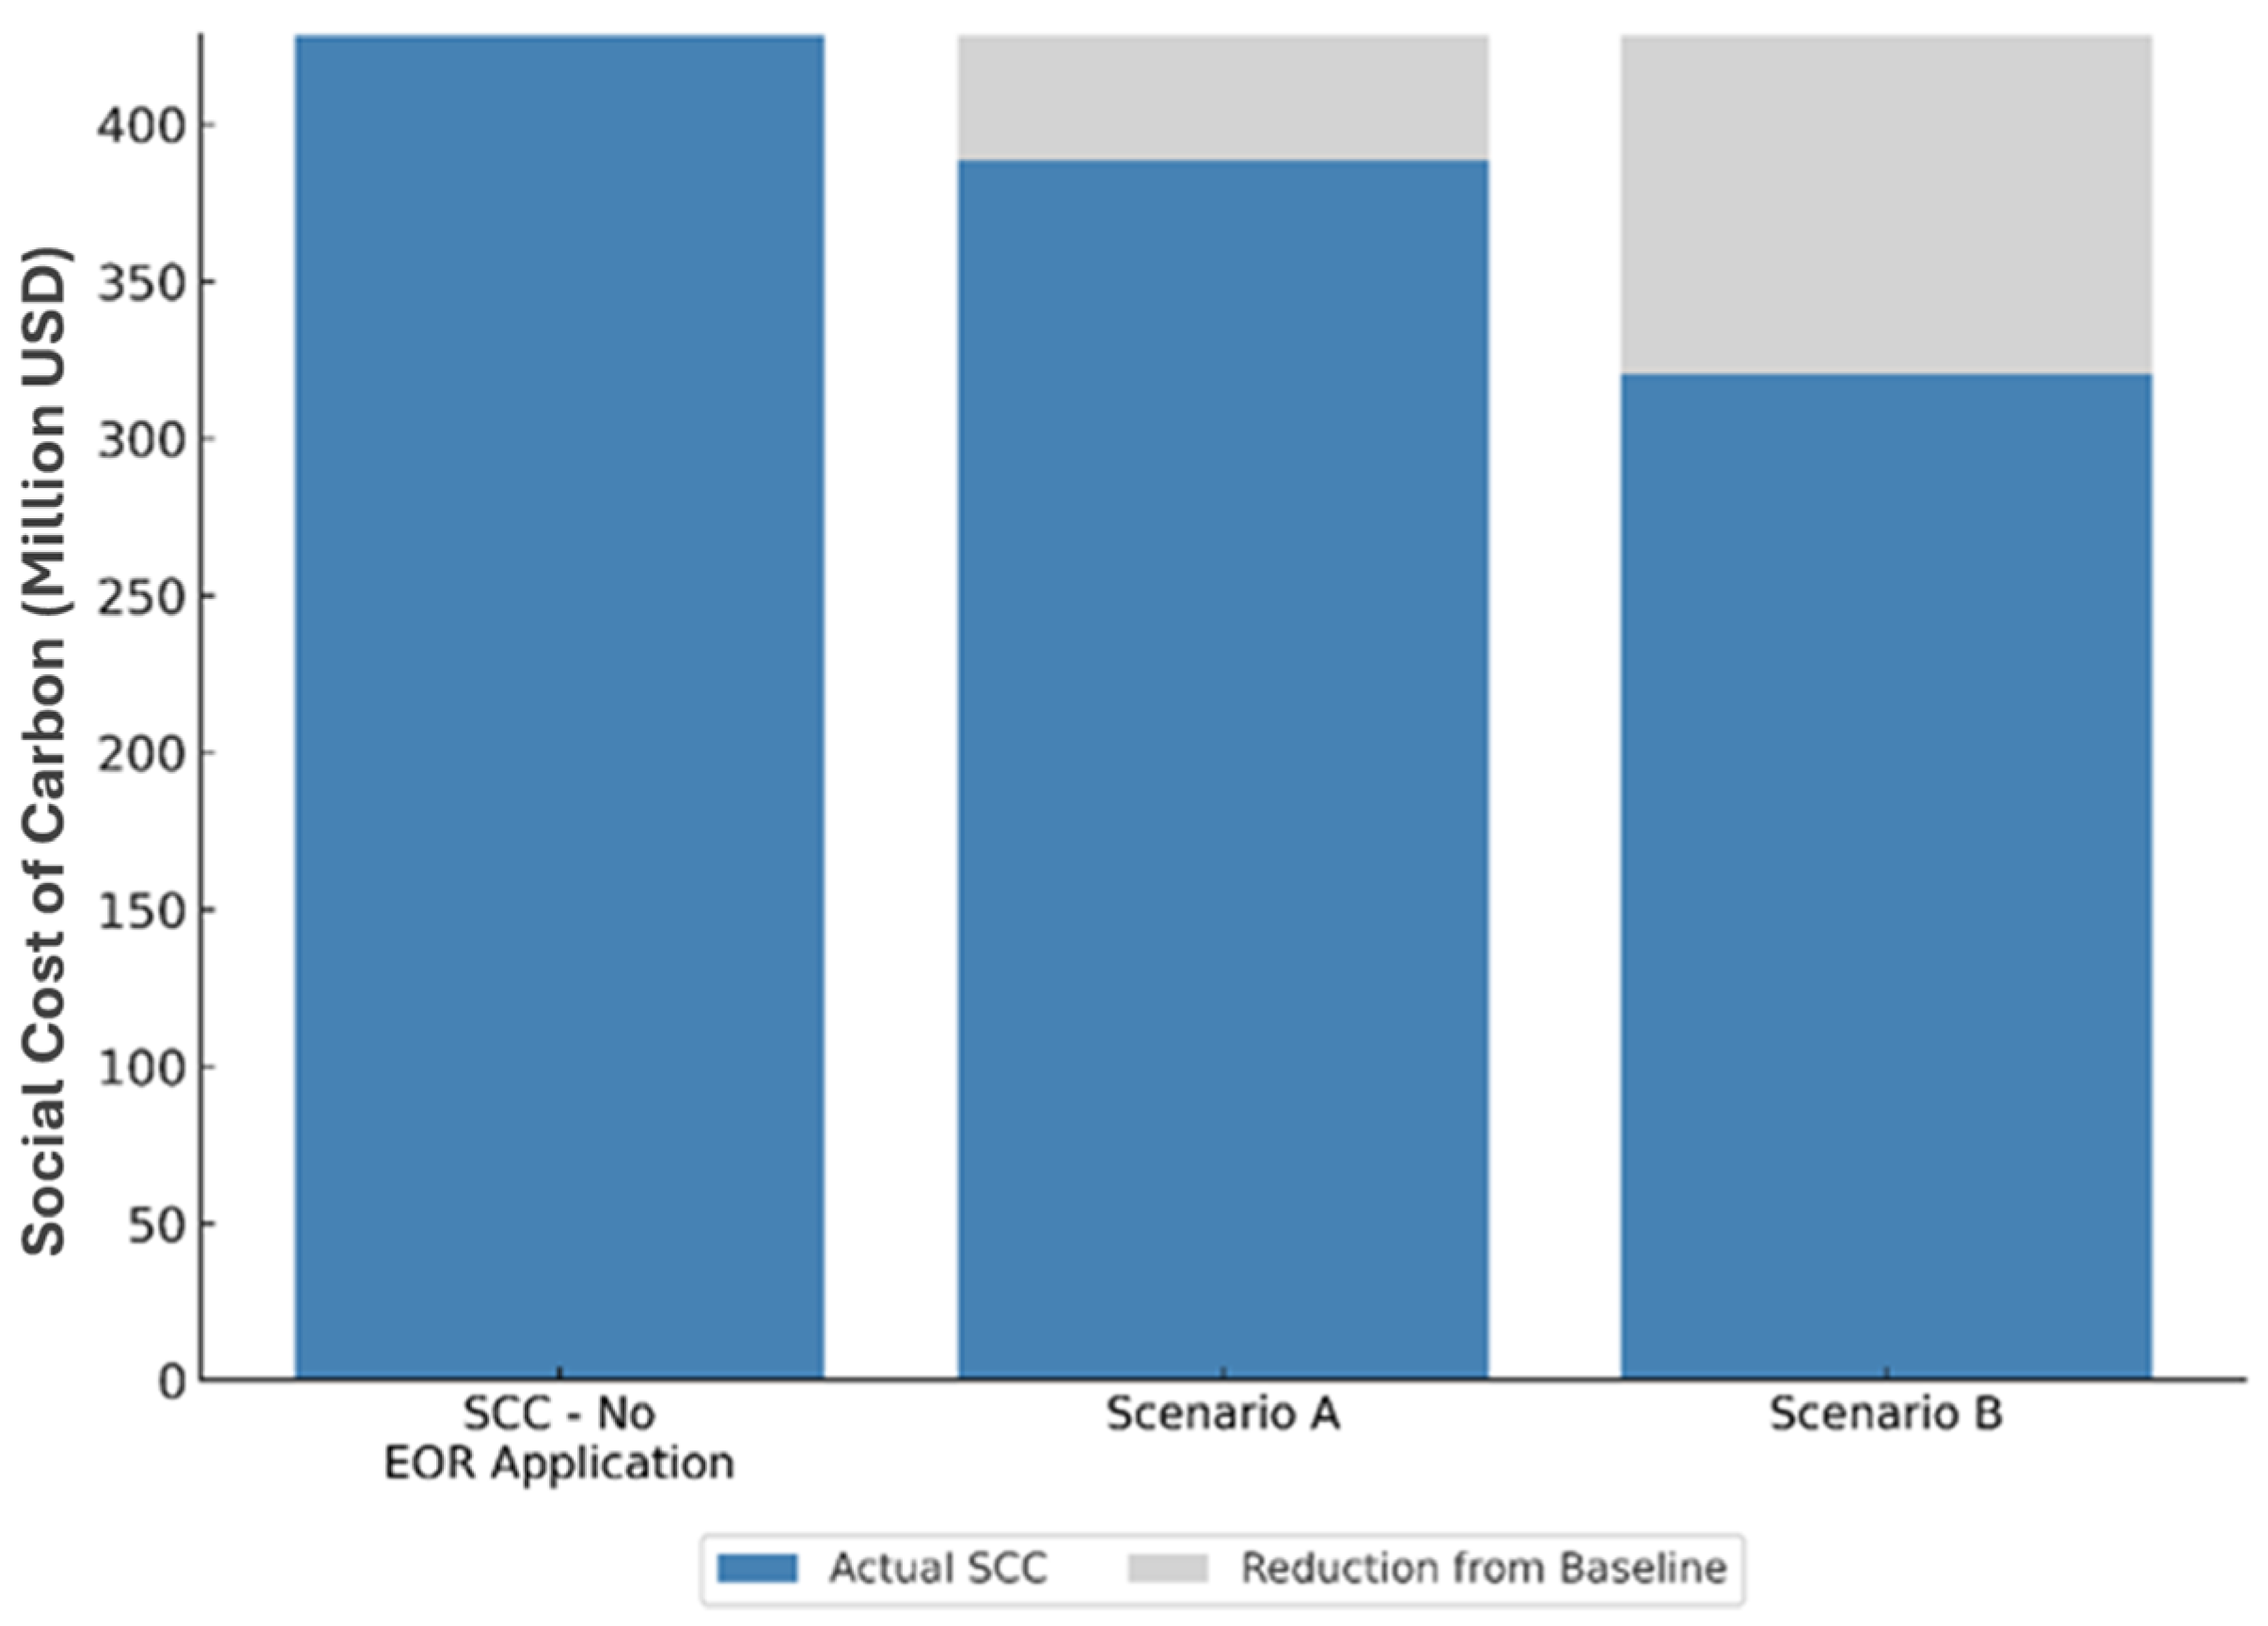
As discussed above, the estimated CO2 emission from the thermal EOR project amounts to 2,380,000 metric tons over a project period of 20 years. Using the recent SCC estimate of USD 185 per metric ton of CO2 translates to USD 440 million SCC in 20-year period. Table 8 shows the injected, produced, and remaining CO2 quantities for a single, five-spot, WAG-CO2 project in 20 years (The injected CO2 quantity corresponds to 1 HCPV required for a single five-spot pattern regardless of the total emissions available for capturing.)
For the validation of the beneficial elimination of emissions, SCC estimates will be calculated for one five-spot pattern. We assume that 2,380,000 metric tons of CO2 emissions were captured. As a base case, we consider the release of the entire emissions in the atmosphere with an estimated SCC of USD 440 million. Then, we consider two scenarios where some of these emissions have been sequestered in a single, five-spot pattern in the reservoir during the 20-year WAG-CO2 application:
Scenario A: No recycling of the CO2 produced with oil. This is the case simulated in this work and summarized in Table 8. At the end of the project, 213,000 metric tons of CO2 is retained in a single five-spot pattern in the reservoir.
SCC = (2,380,000 metric tons of total CO2 emissions captured − 213,000 metric tons of CO2 remaining in reservoir) × USD 185/metric ton = USD 400 million.
Scenario B: Produced CO2 is completely recycled in the subsequent injection periods. This case is inspired by the Weyburn project, where the objective is to permanently store all injected CO2 through recycling [25]. For the 20-year project, all 581,000 metric tons of injected CO2 is assumed to be eventually stored in the reservoir through recycling and utilization.
SCC = (2,380,000 metric tons of total CO2 emissions captured − 518,000 metric tons of CO2 remaining in reservoir + recycled/utilized) × USD 185/metric ton = USD 332 million
Figure 11 demonstrates the SCC estimates for the base case (no sequestration) and two sequestration scenarios through EOR application. Scenario A shows a reduction in SCC by USD 40 million (10%) in comparison to the base case (no sequestration). Scenario B provides an SCC reduction of USD 108 million (24%) compared to the base. (It is important to emphasize that a single pattern utilizes only 8–23% of the captured emissions, this example demonstrates the significant potential of a full-field application to reduce the SCC of a nearby oil-field project.). With Scenario A quantities of CO2 being retained, an expansion of 11 pattern is expected while Scenario B has an expansion factor of 4 as all CO2 injected is permanently stored by recycling.

3.4. Sensitivity Analysis of WAG-CO2

Based on its superior EOR performance, we investigated the sensitivity of WAG-CO2 to residual oil saturation, injected pore volumes of CO2 (for fixed water injection of 5% HCPV annually), and WAG-CO2 ratio. The results are presented in Table 9 for the base, high, and low cases (the base case is the scenario considered in Section 3 above). The EOR and sequestration efficiencies are quantified in terms of the incremental oil production, CO2 utilization ratios, and retention capacity.
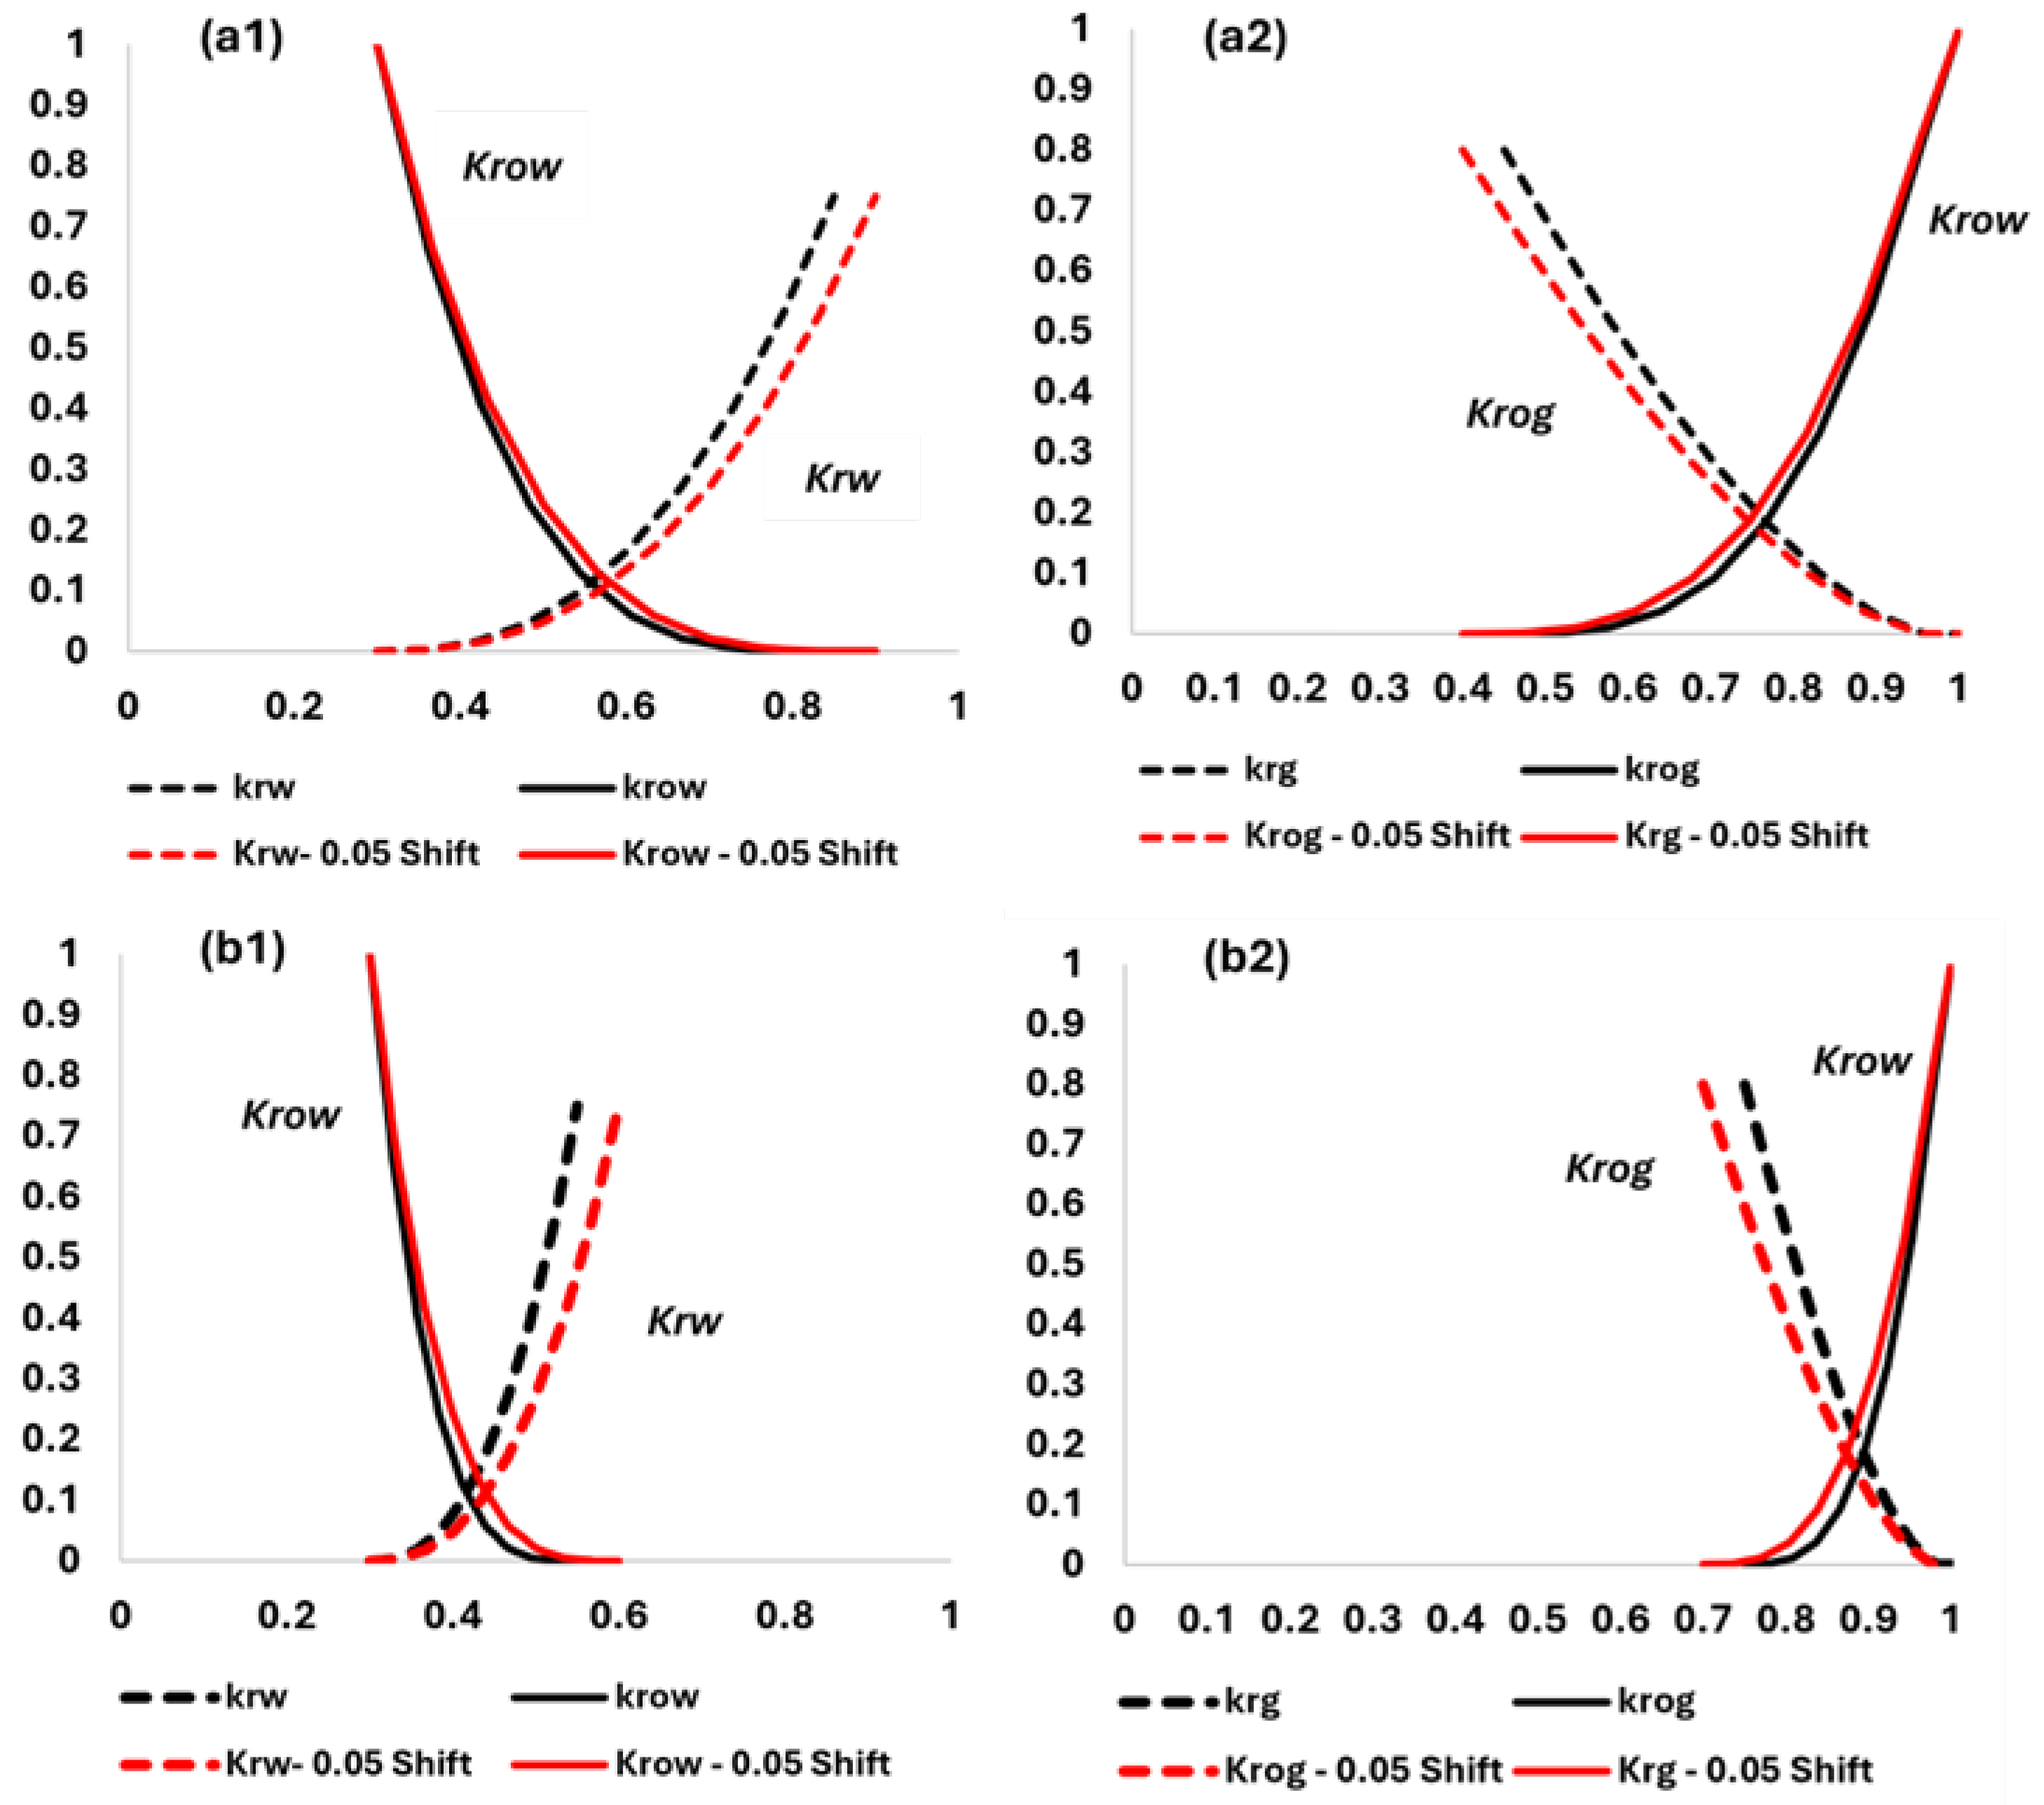
Residual oil saturation plays an important role in the CO2 EOR and sequestration application. The relative permeability curves for two residual oil saturations, 0.15 and 0.45, are used as endpoints of the residual oil saturation and are compared with the base case residual oil saturation of 0.3, as shown in Figure 12. This aims to correlate the effect of applying WAG-CO2 at high and low residual oil saturation levels on EOR and sequestration efficiencies. In the simulations, when the CO2 concentration exceeded 50%, the residual oil saturation was reduced to 5% and the relative permeability curves were adjusted accordingly.
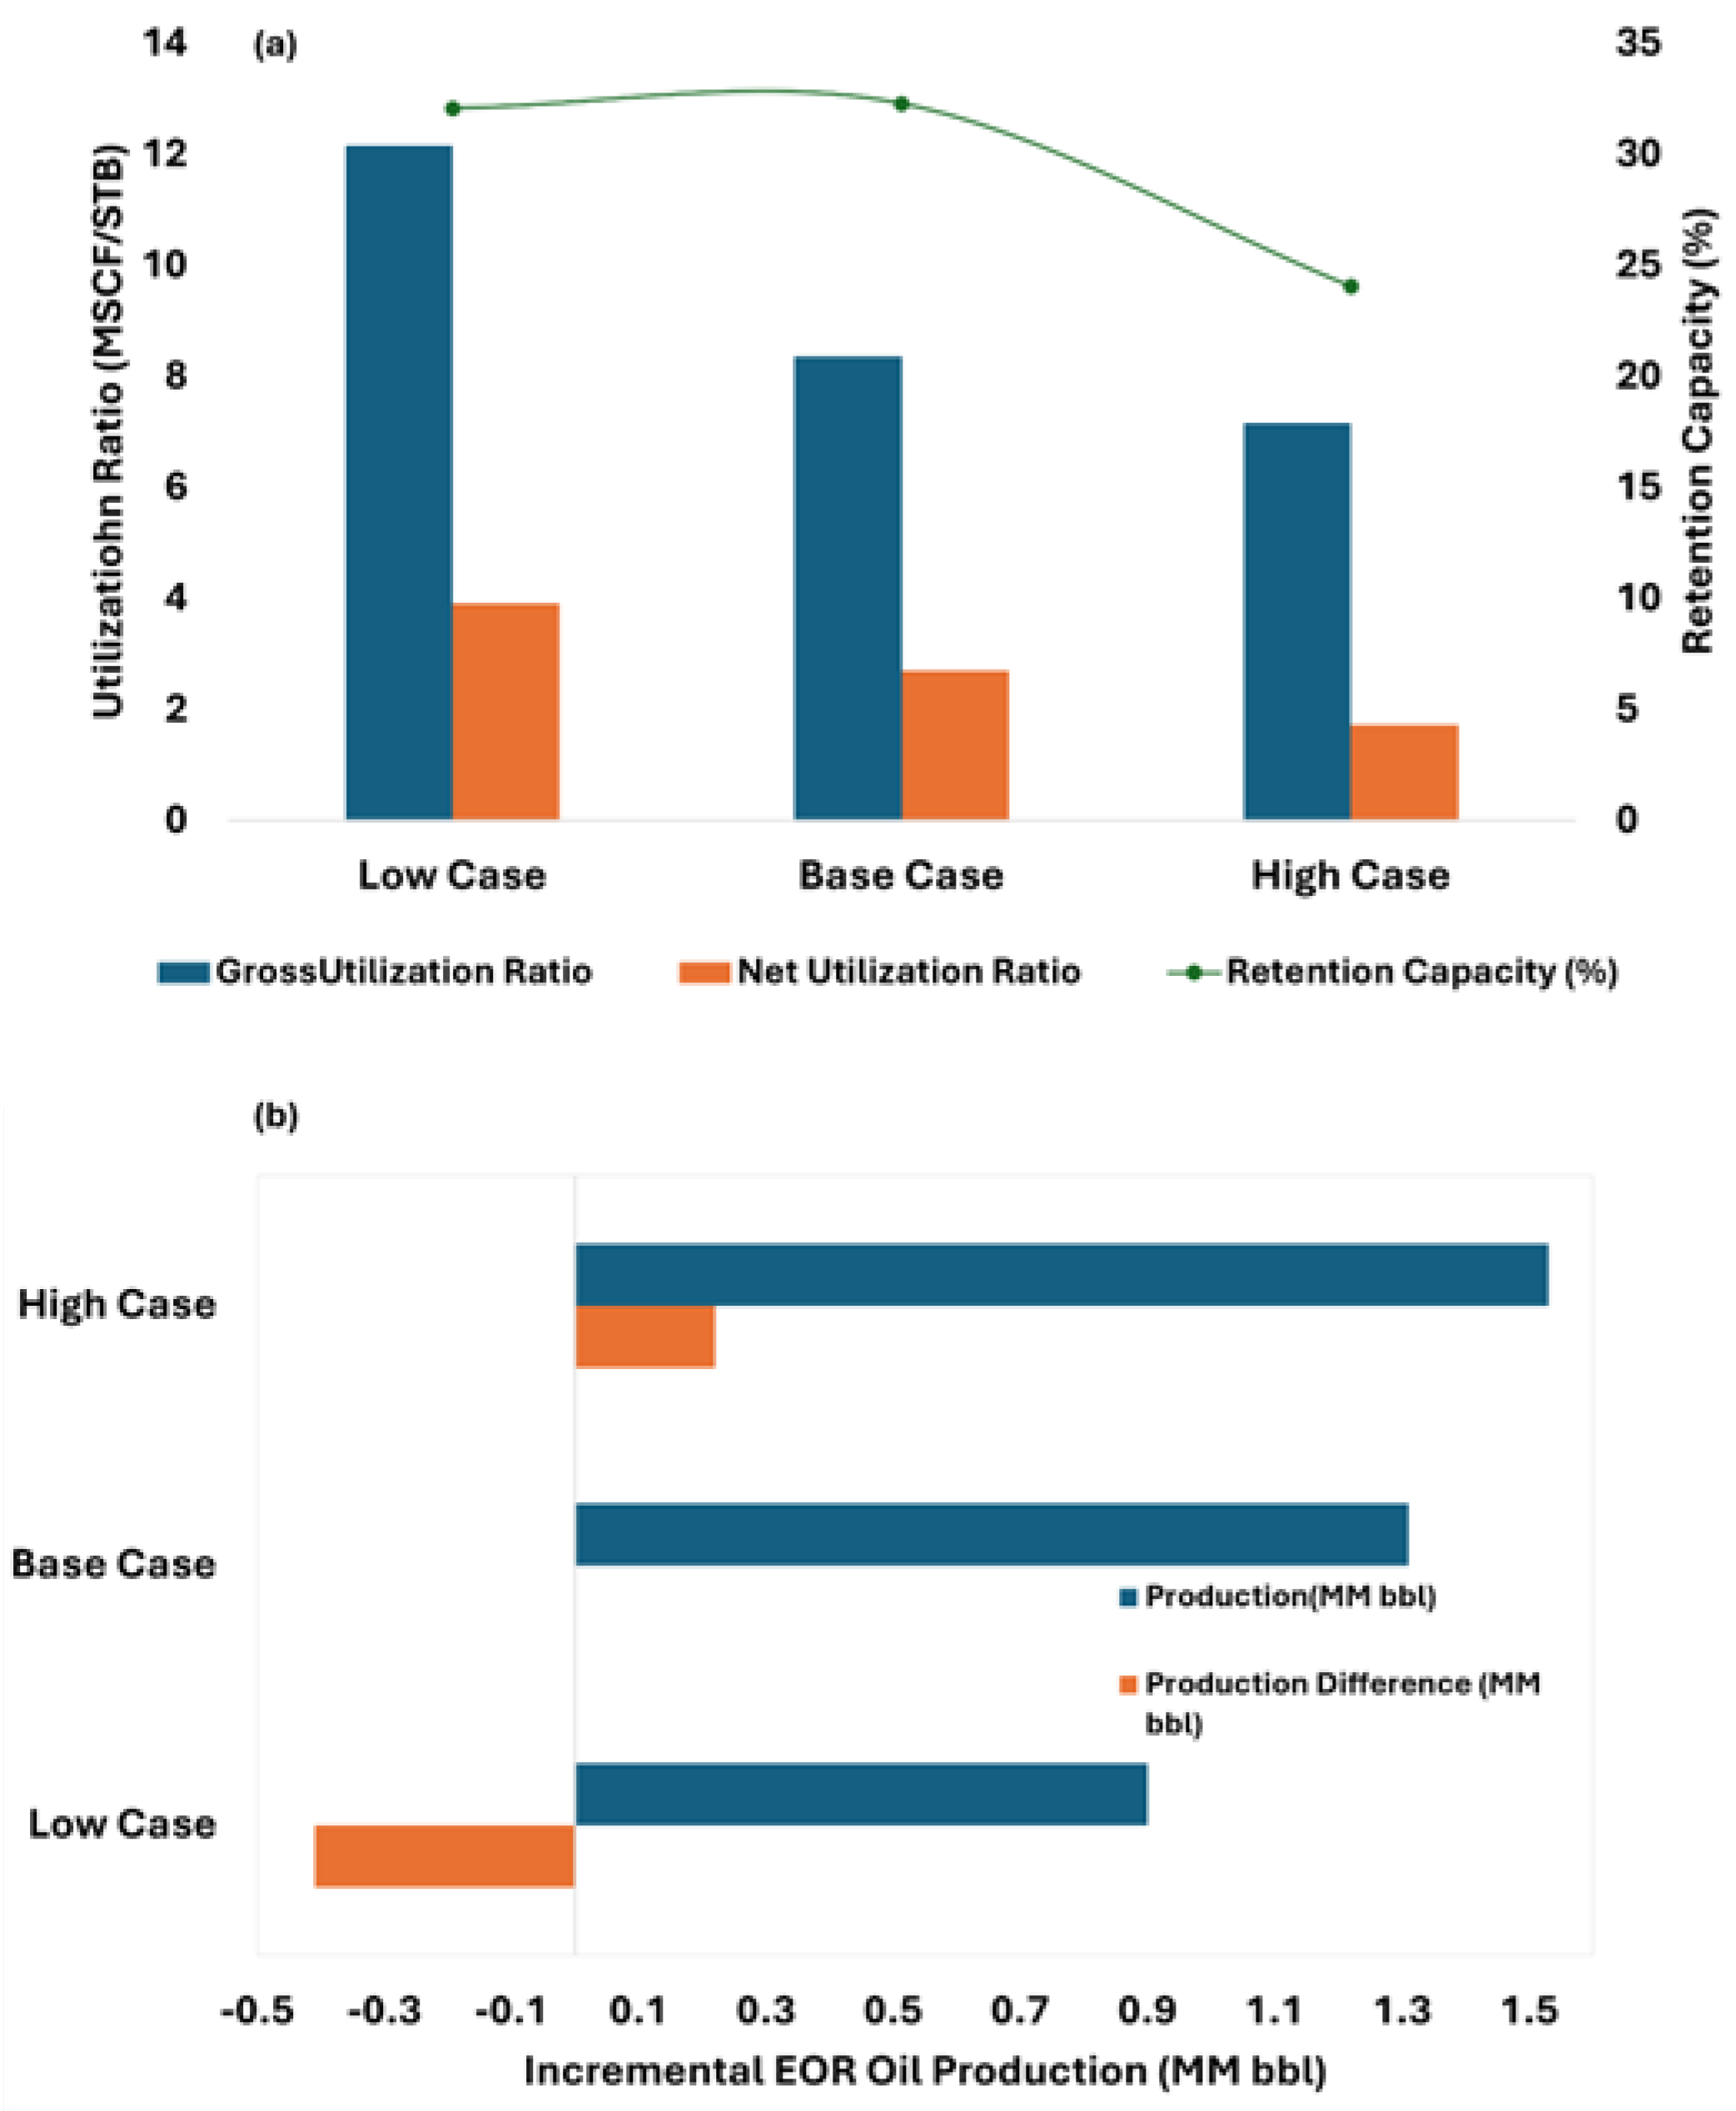
Figure 13 shows the sensitivity to residual oil saturation. At high residual oil saturation levels, CO2 displaces more oil, leading to efficient CO2 usage (gross utilization ratio (GUR) = 7.15 MSCF/STB and net utilization ratio (NUR) = 1.9 MSCF/STB). At low residual oil saturation levels, the displacement efficiency becomes smaller, and the CO2 gross utilization ratio (GUR) increase to 12.15 MSCF/STB and 4.0 MSCF/STB net utilization ratio (NUR), respectively. This is reflected in the retention capacity (RC), which is lowered from 32% for the low residual oil saturation case to 26% for the high residual oil saturation case. High residual oil saturation, i.e., 45% Sor, provides more incremental barrels as shown on Figure 13. while low residual oil saturation (15% Sor) causes a drop in the EOR efficiency by 30% from the base case).
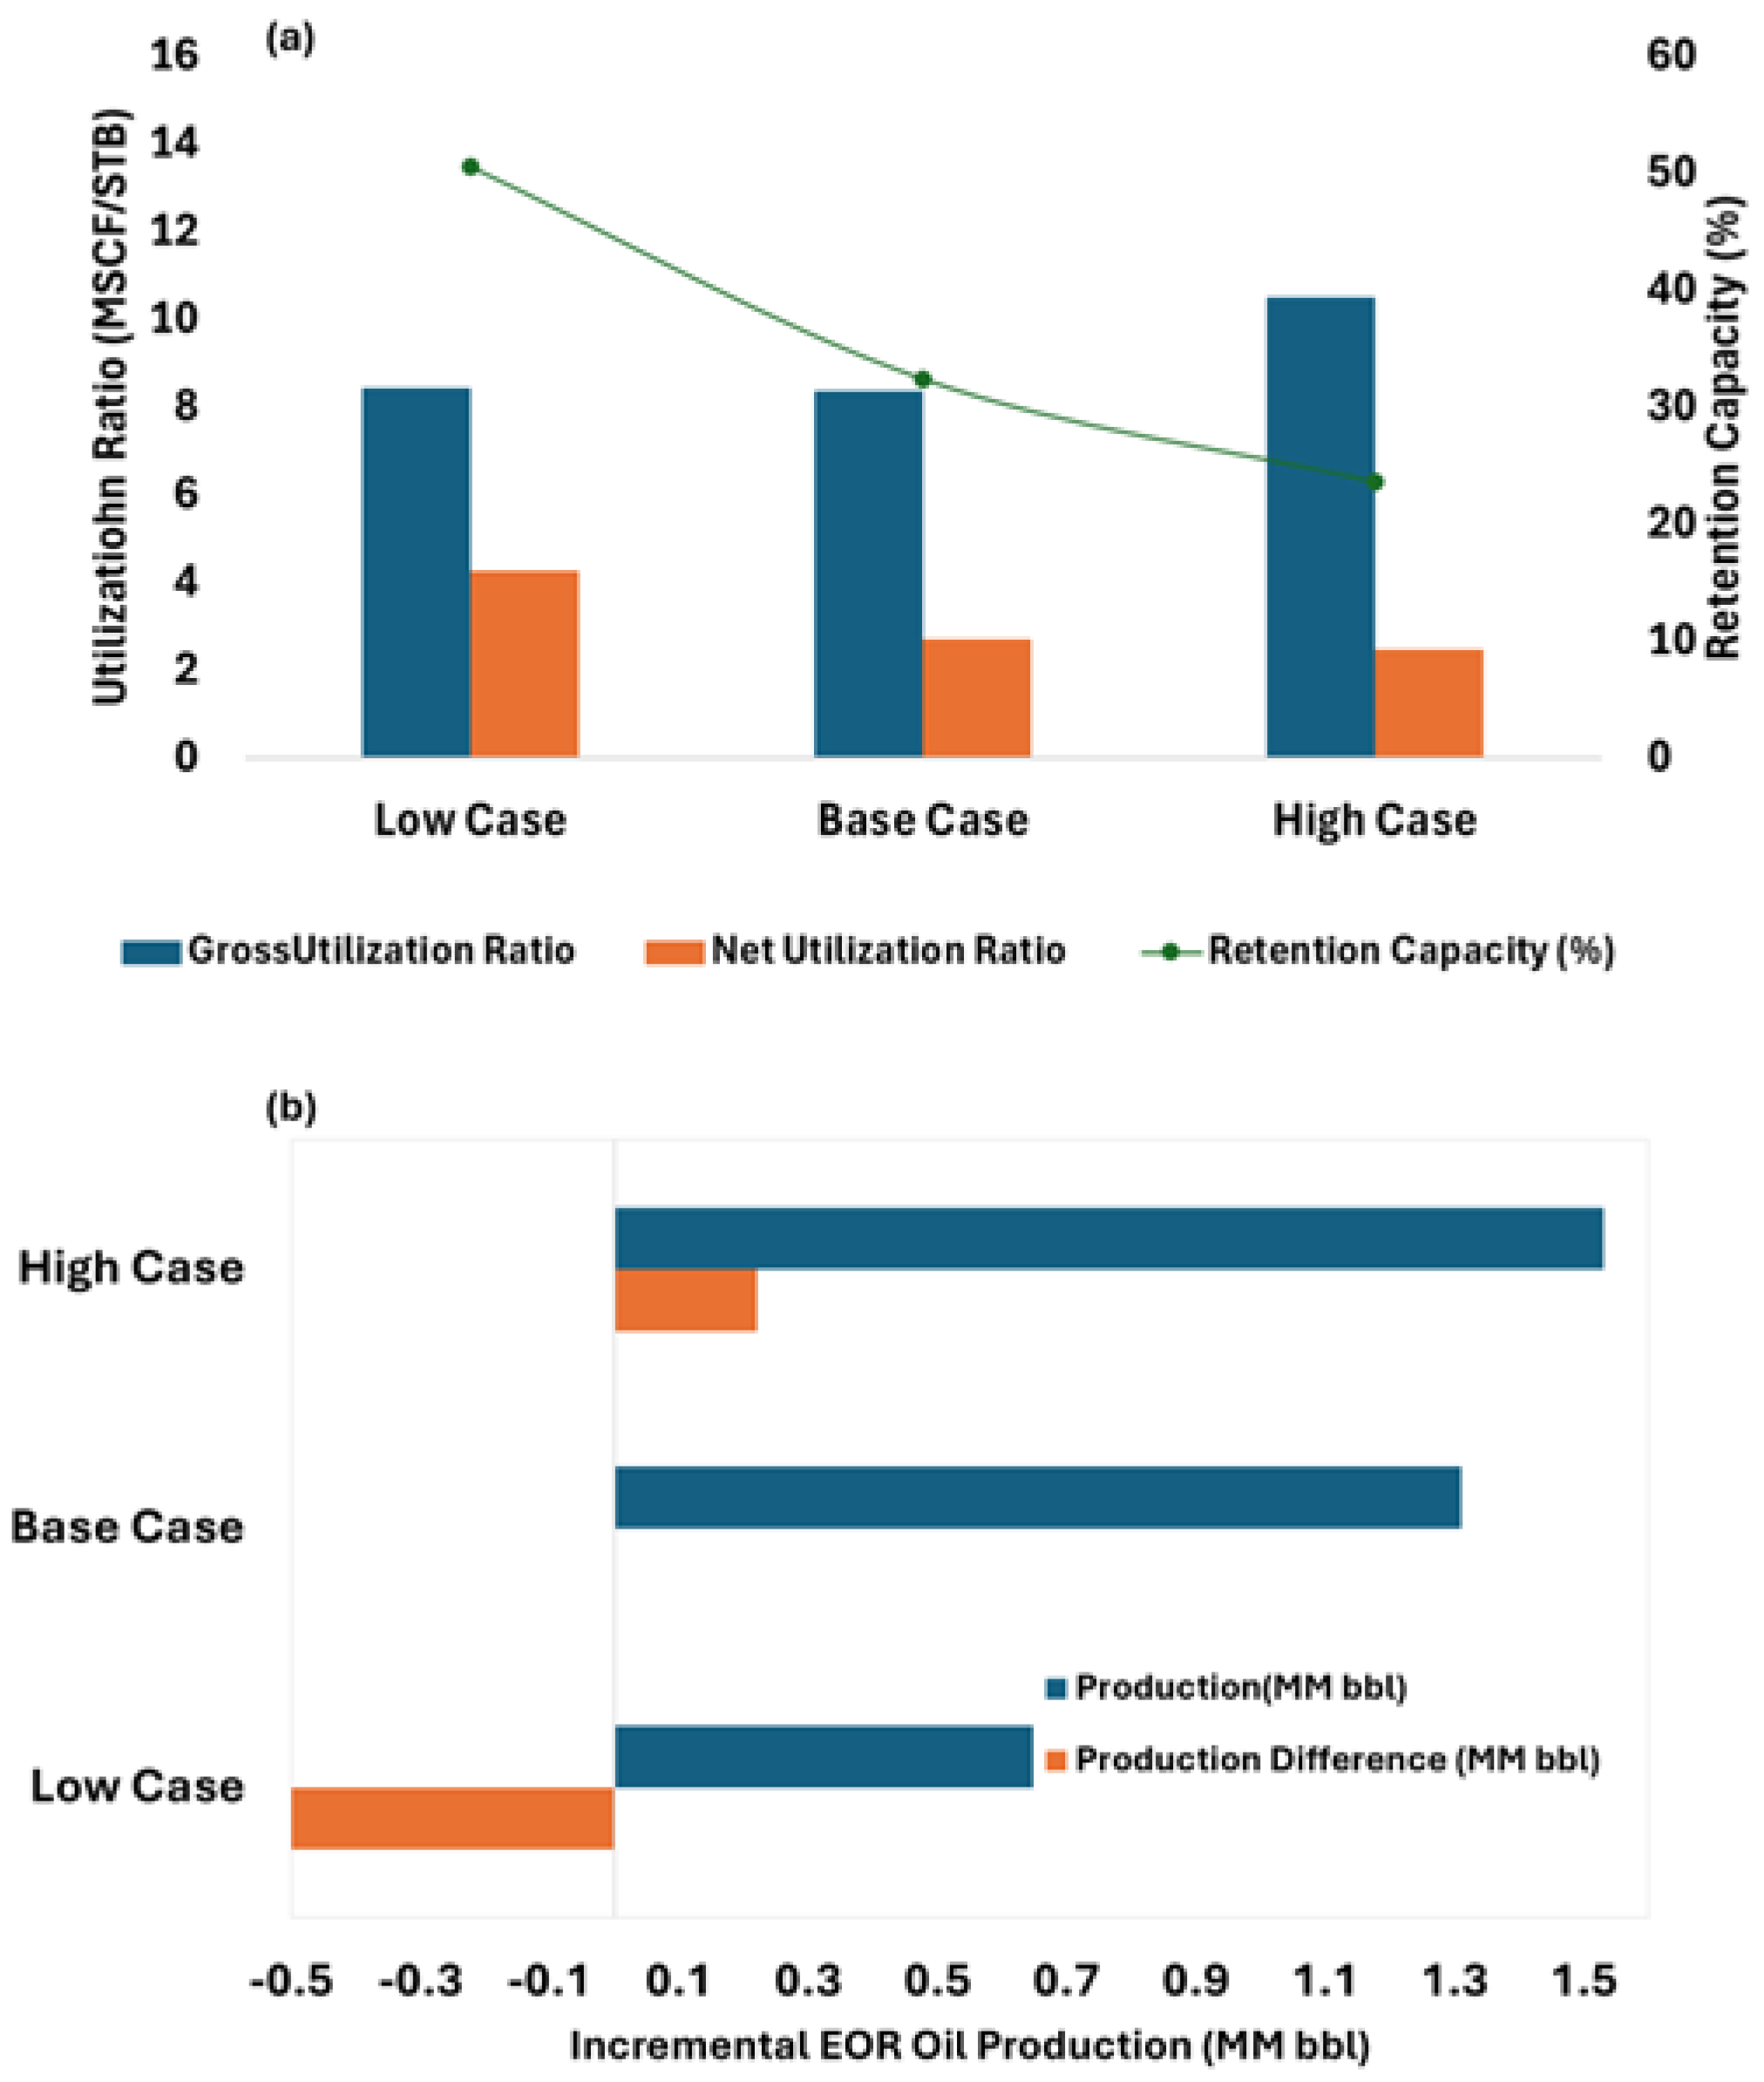
Figure 14 shows the comparisons of the sequestration and EOR efficiencies of 0.5 and 2 HCPV CO2 injections (2.5% and 10% HCPV injection of CO2 per year, respectively) to the base case (5% HCPV injection of CO2 per year). A higher HCPV injection of CO2 leads to a higher gross utilization ratio (GUR) and lower retention capacity (RC). The continuous injection of CO2 may lead to early CO2 breakthrough and overriding, which results in less efficiency in retaining CO2. Figure 15 shows the vertical cross-section of the reservoir for the three scenarios. Better displacement is observed in the 1 and 2 HCPV CO2 injections in comparison to the 0.5 HCPV injection in the base case. The displacement efficiency is the best for the 2 HCPV injection but may not be feasible due to the large quantities of CO2 to be injected.
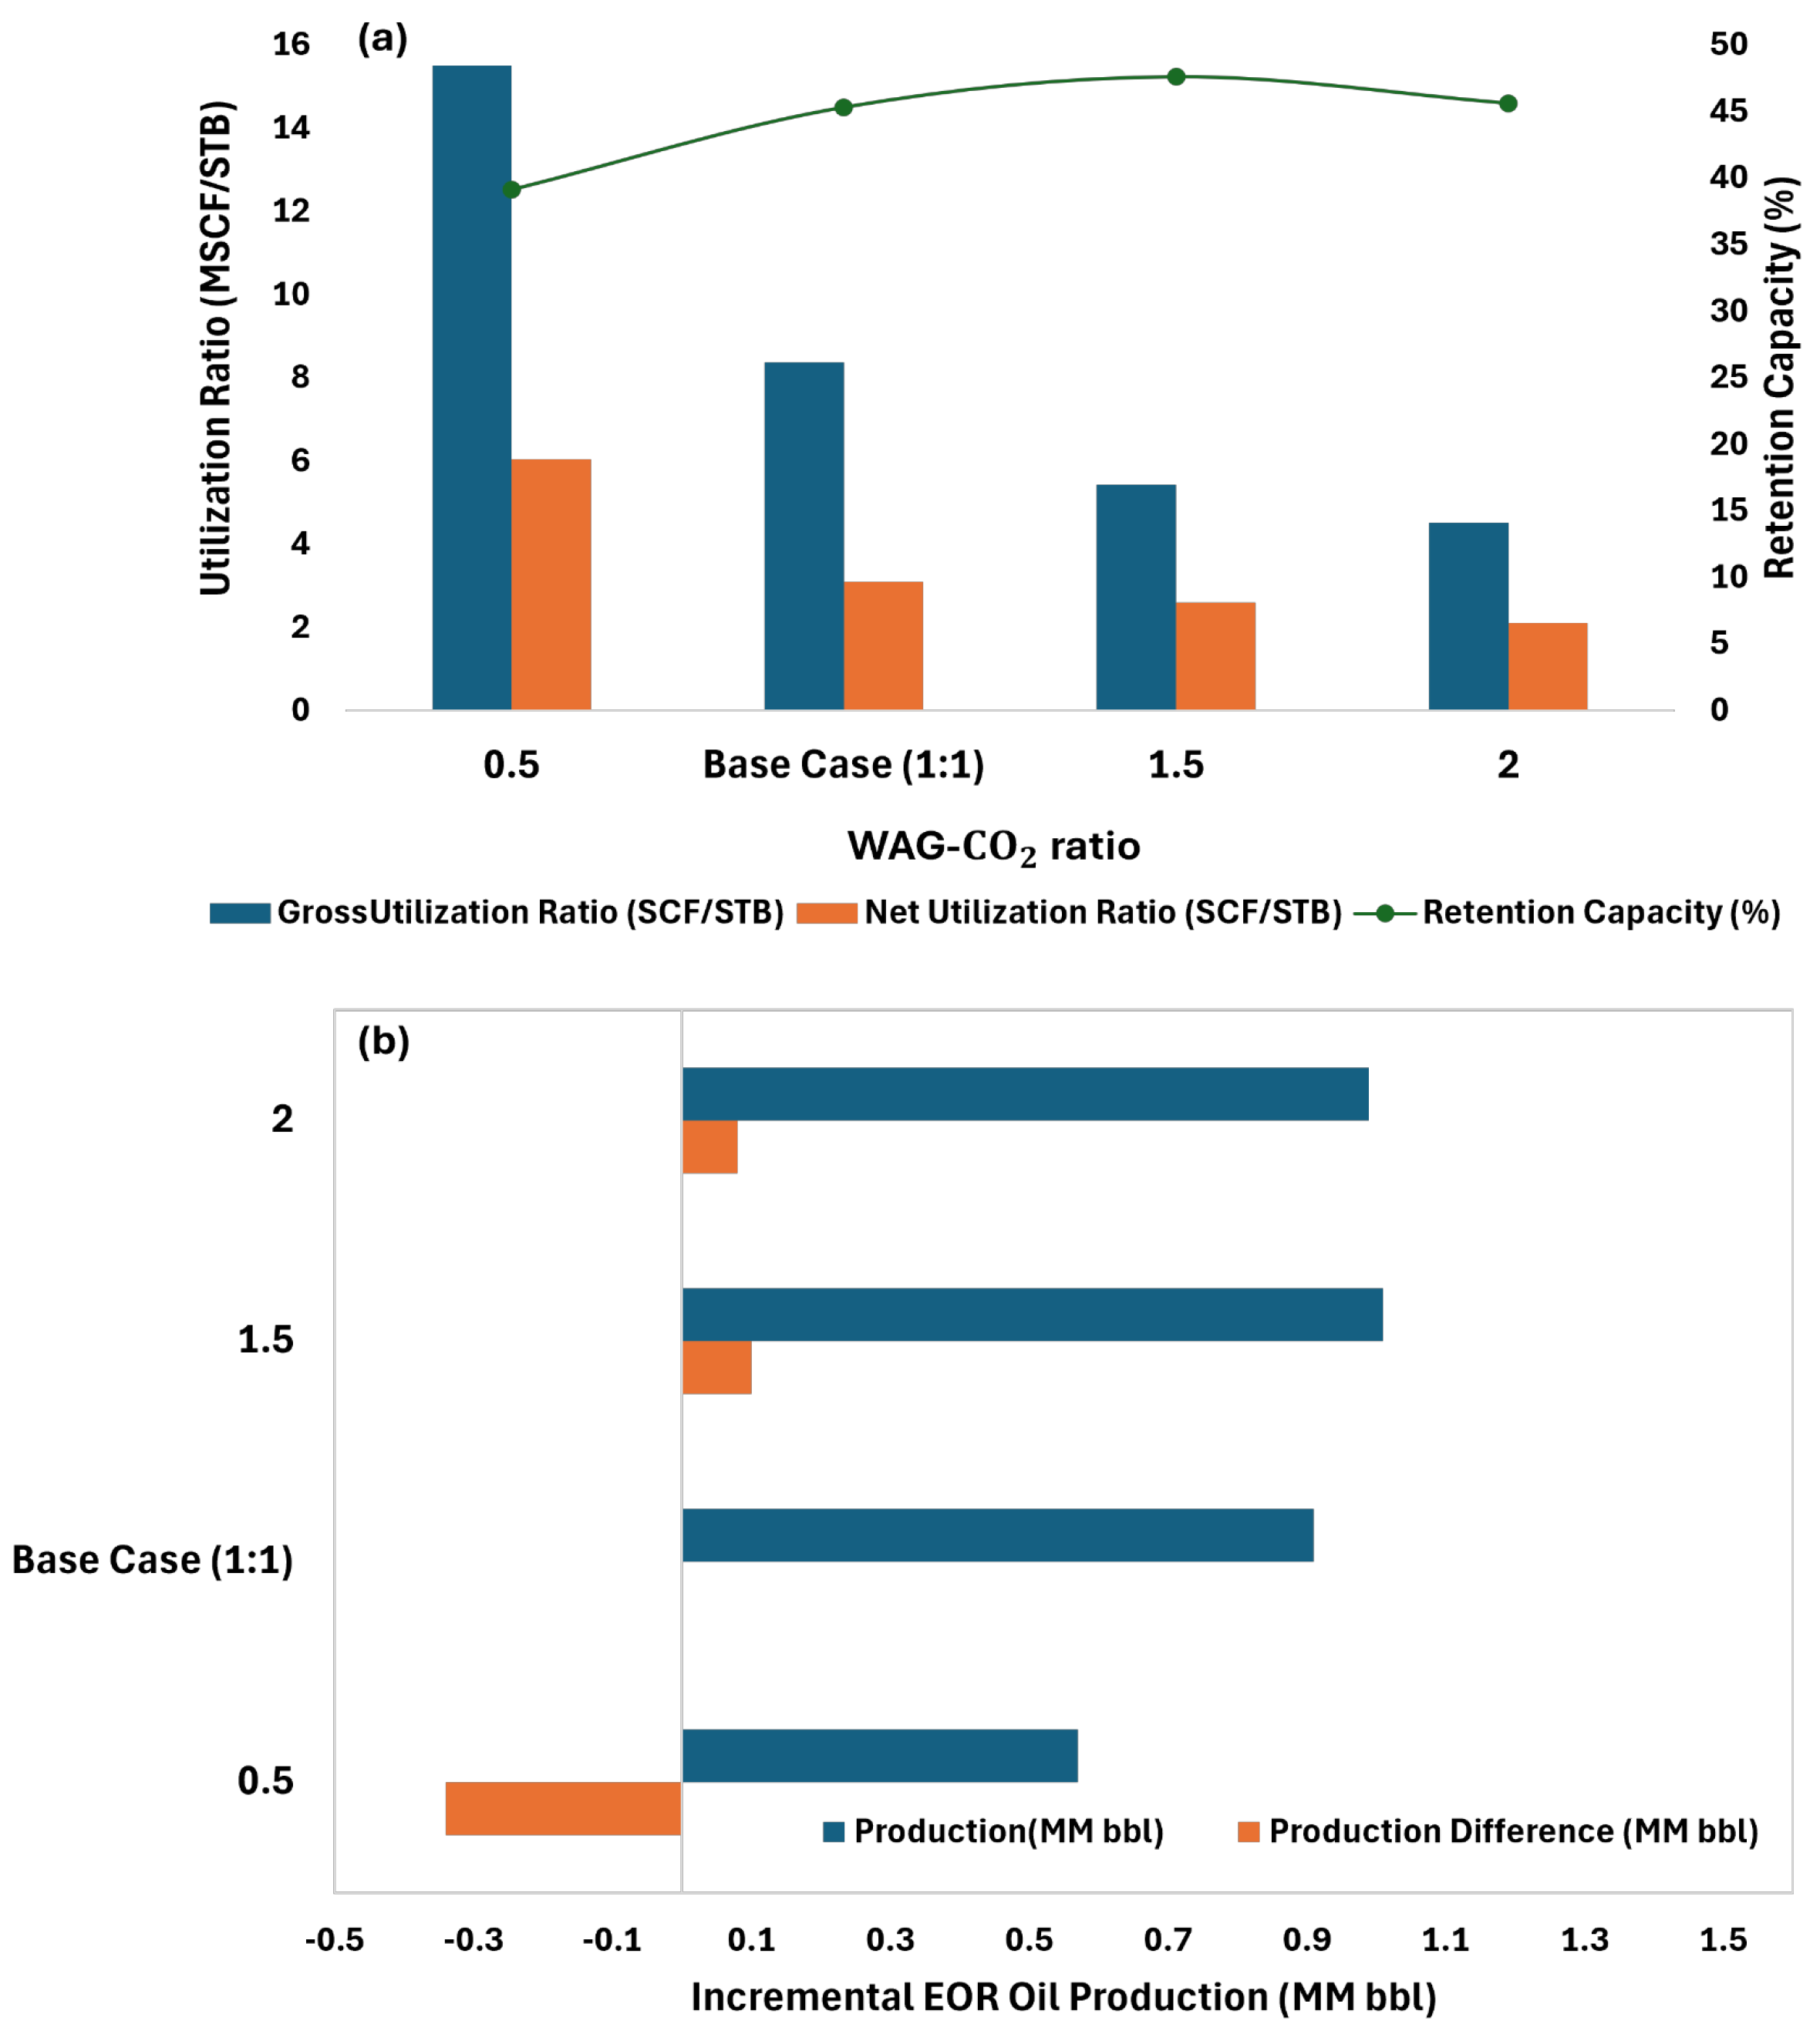
Another important factor to be analyzed is the WAG-CO2 ratio. We consider a range of WAG-CO2 ratio from 0.5 to 2 (Table 9) and present the results in Figure 16. It is shown that increasing the WAG-CO2 ratio lowers the utilization ratio (increases the EOR efficiency). Retention capacity is also increased by increasing the WAG-CO2 ratio due to the solubility of CO2 in the aqueous phase. In general, the higher WAG-CO2 ratio, the better the incremental production. The WAG-CO2 ratio with 1.5 HCPV injection generates the highest incremental oil production with an acceptable sequestration performance (comparable to that of the remaining simulated cases).

3.5. Wettability Alteration: Experimental Supporting Evidence

This section will provide experimental evidence to support the relative-permeability endpoint adjustments to account for the wettability alteration in the numerical model (justification for Figure 3). The experiment was conducted to determine the wettability alteration caused by carbon dioxide injections via reduction in contact angle and interfacial tension leading to more water wet conditions.
Wettability alteration was investigated with brine and carbonated brine surrounding phases (1 m aqueous salinity = 50,000 ppm), with a limestone core disk. During the experiments, contact angle and interfacial tension (IFT) measurements were conducted.
Details of the experiments and additional fluid system measurements will be presented in a subsequent publication with the results of the numerical model quantifying the effect on the EOR and sequestration performances. This section is solely added here to indicate that we have experimentally verified the relative-permeability endpoint adjustment to include the wettability alteration effect of CO2 in numerical modeling.
The permeability of Indiana limestone ranges from 15 to 50 millidarcy, and porosity is around 15%, which can be a benchmark for numerical model reservoir properties. The mineralogy of Indiana limestone has been assessed using XRD by [44], revealing that it predominantly consists of calcite, which serves as an excellent analog for the numerical analysis undertaken in this study. The cores were provided by Surtek Inc. (Golden, CO, USA) and were aged with a Synthetic Crude Oil system with a viscosity of 0.54 cP. The synthetic crude oil consists of n-Pentane (18.8%), n-Octane (49%), n-Decane (32%), and naphthenic acid (0.2%). The experiments were conducted at high pressure (5000 psia) and high temperature (240 °F) to mimic case considered in the numerical model.
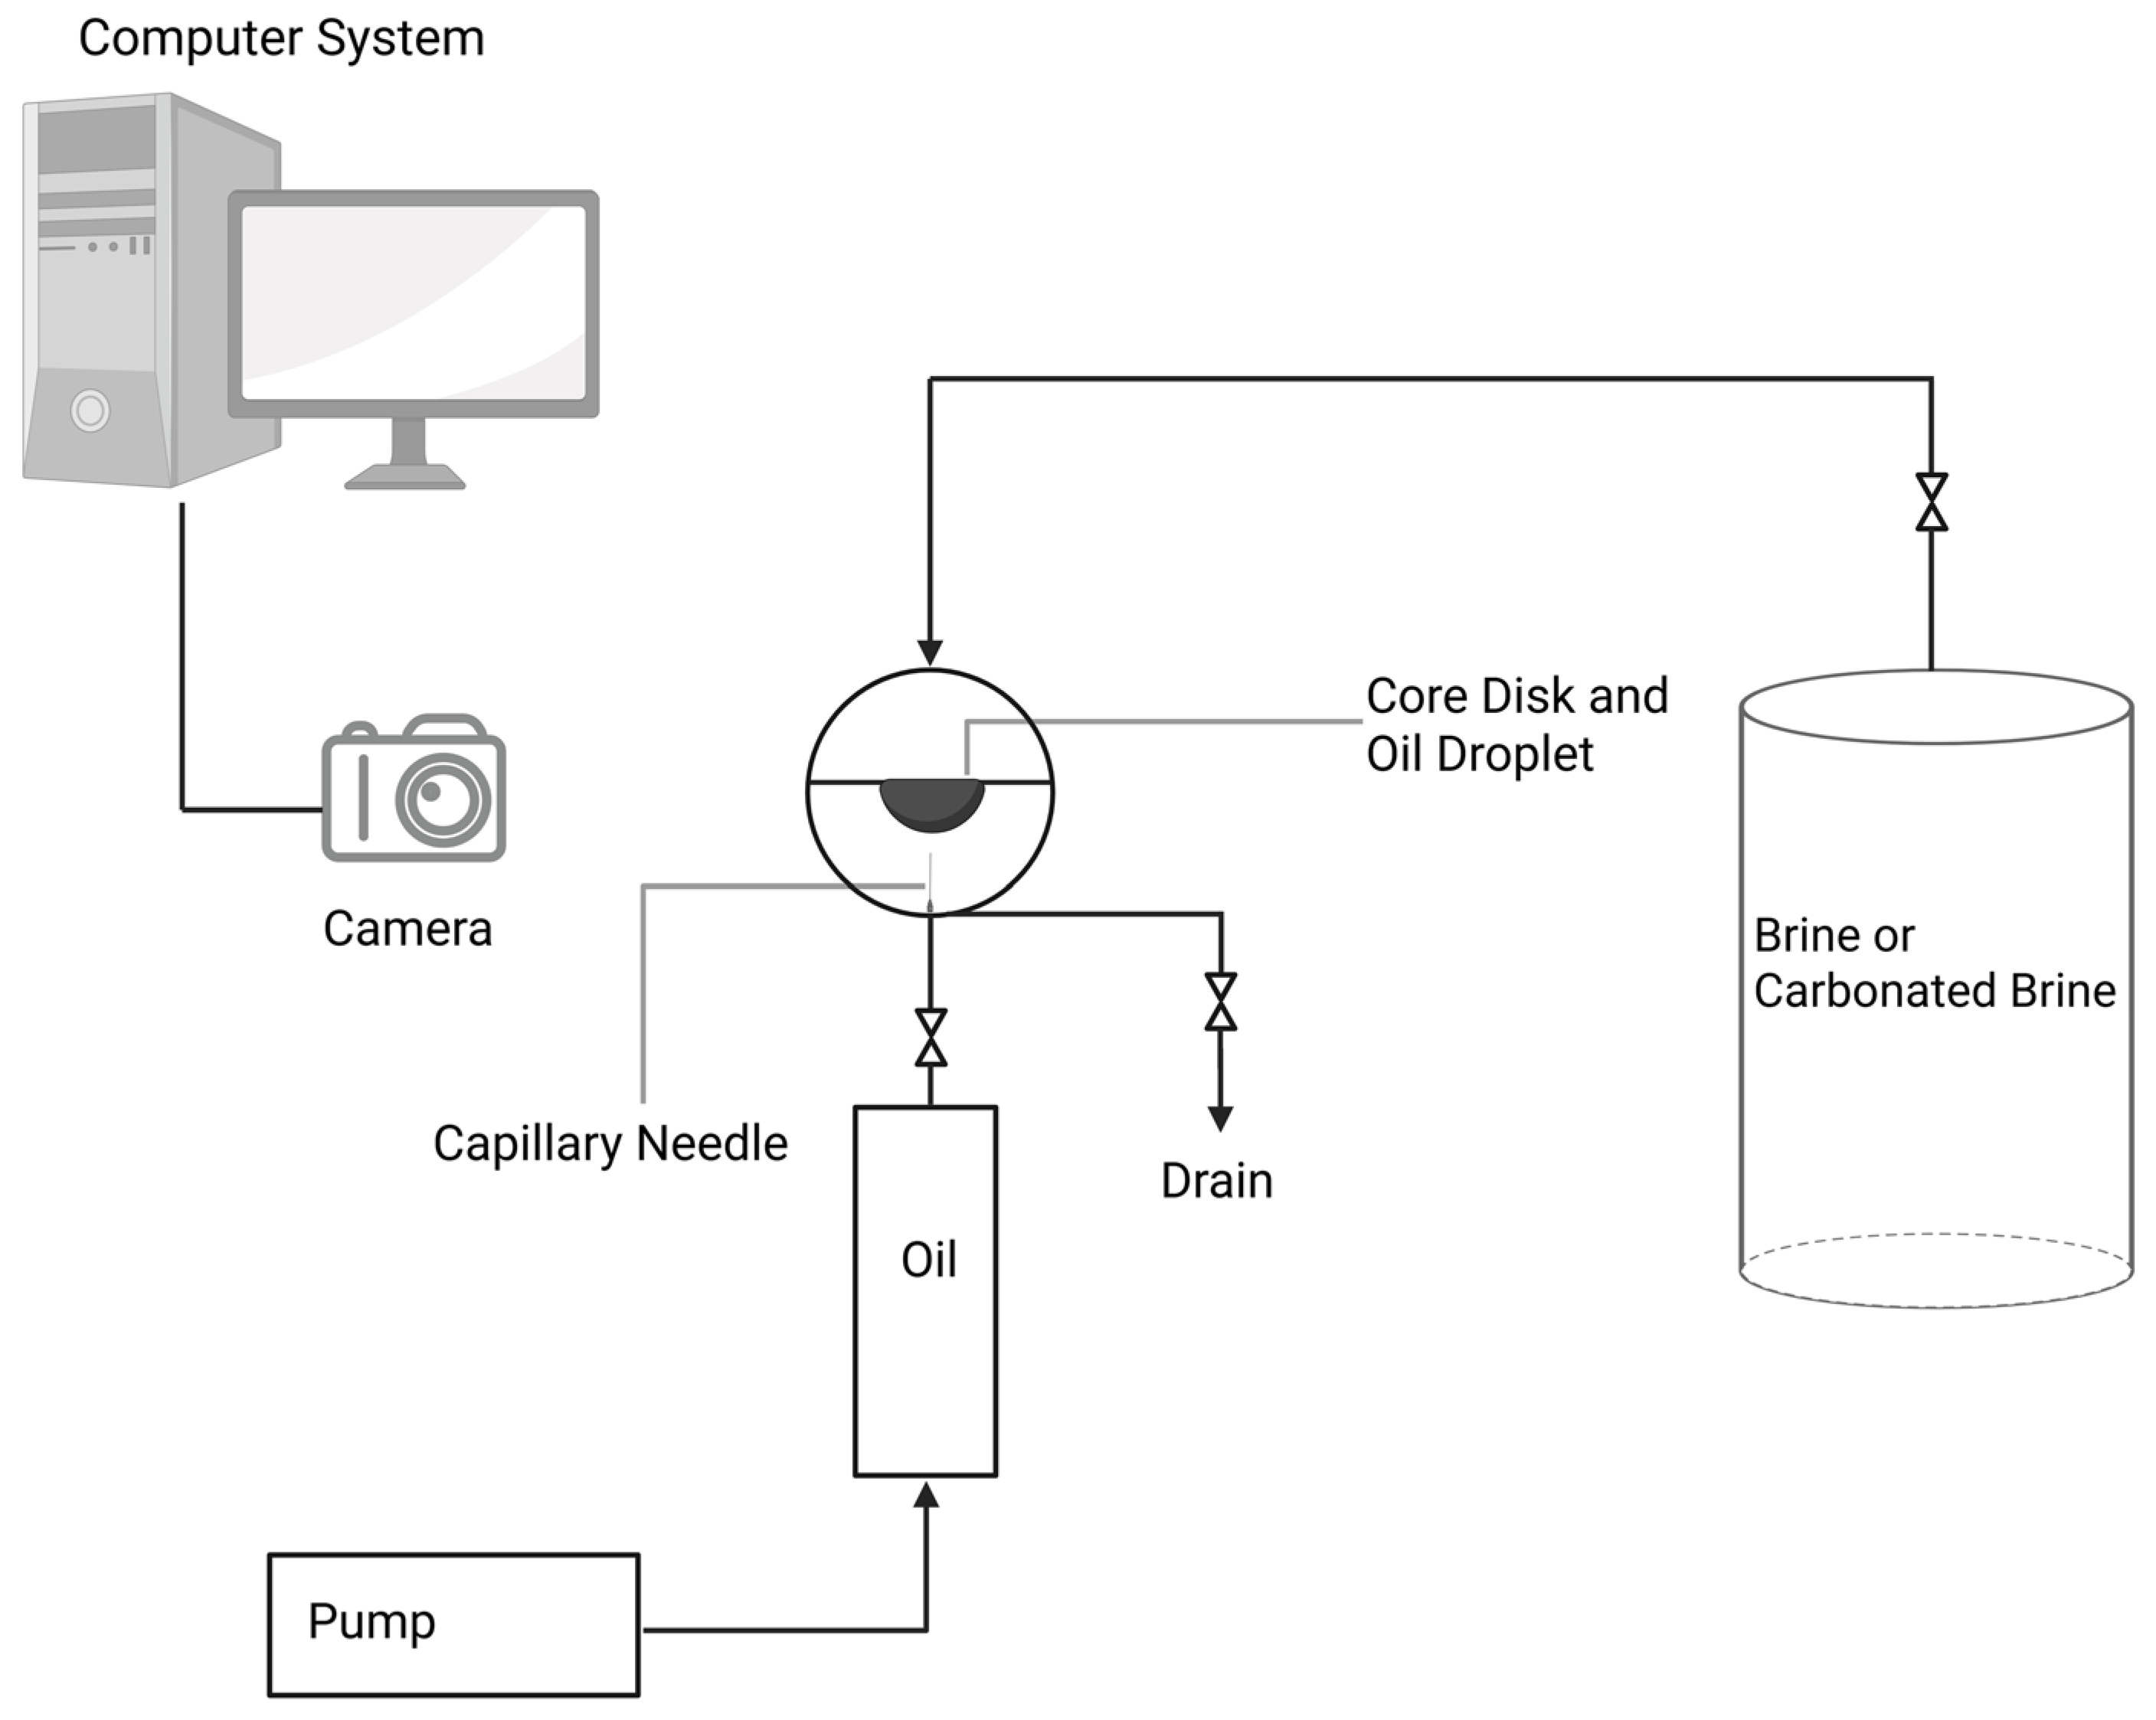
The Drop Shape Analyzer was used to capture the shape of the drop using a high-precision camera. A contact angle accuracy of 0.1 degrees and the captive droplet method are used. The measurement for interfacial tension was achieved using the pendant drop method. The schematic of the experiment is shown in Figure 17.
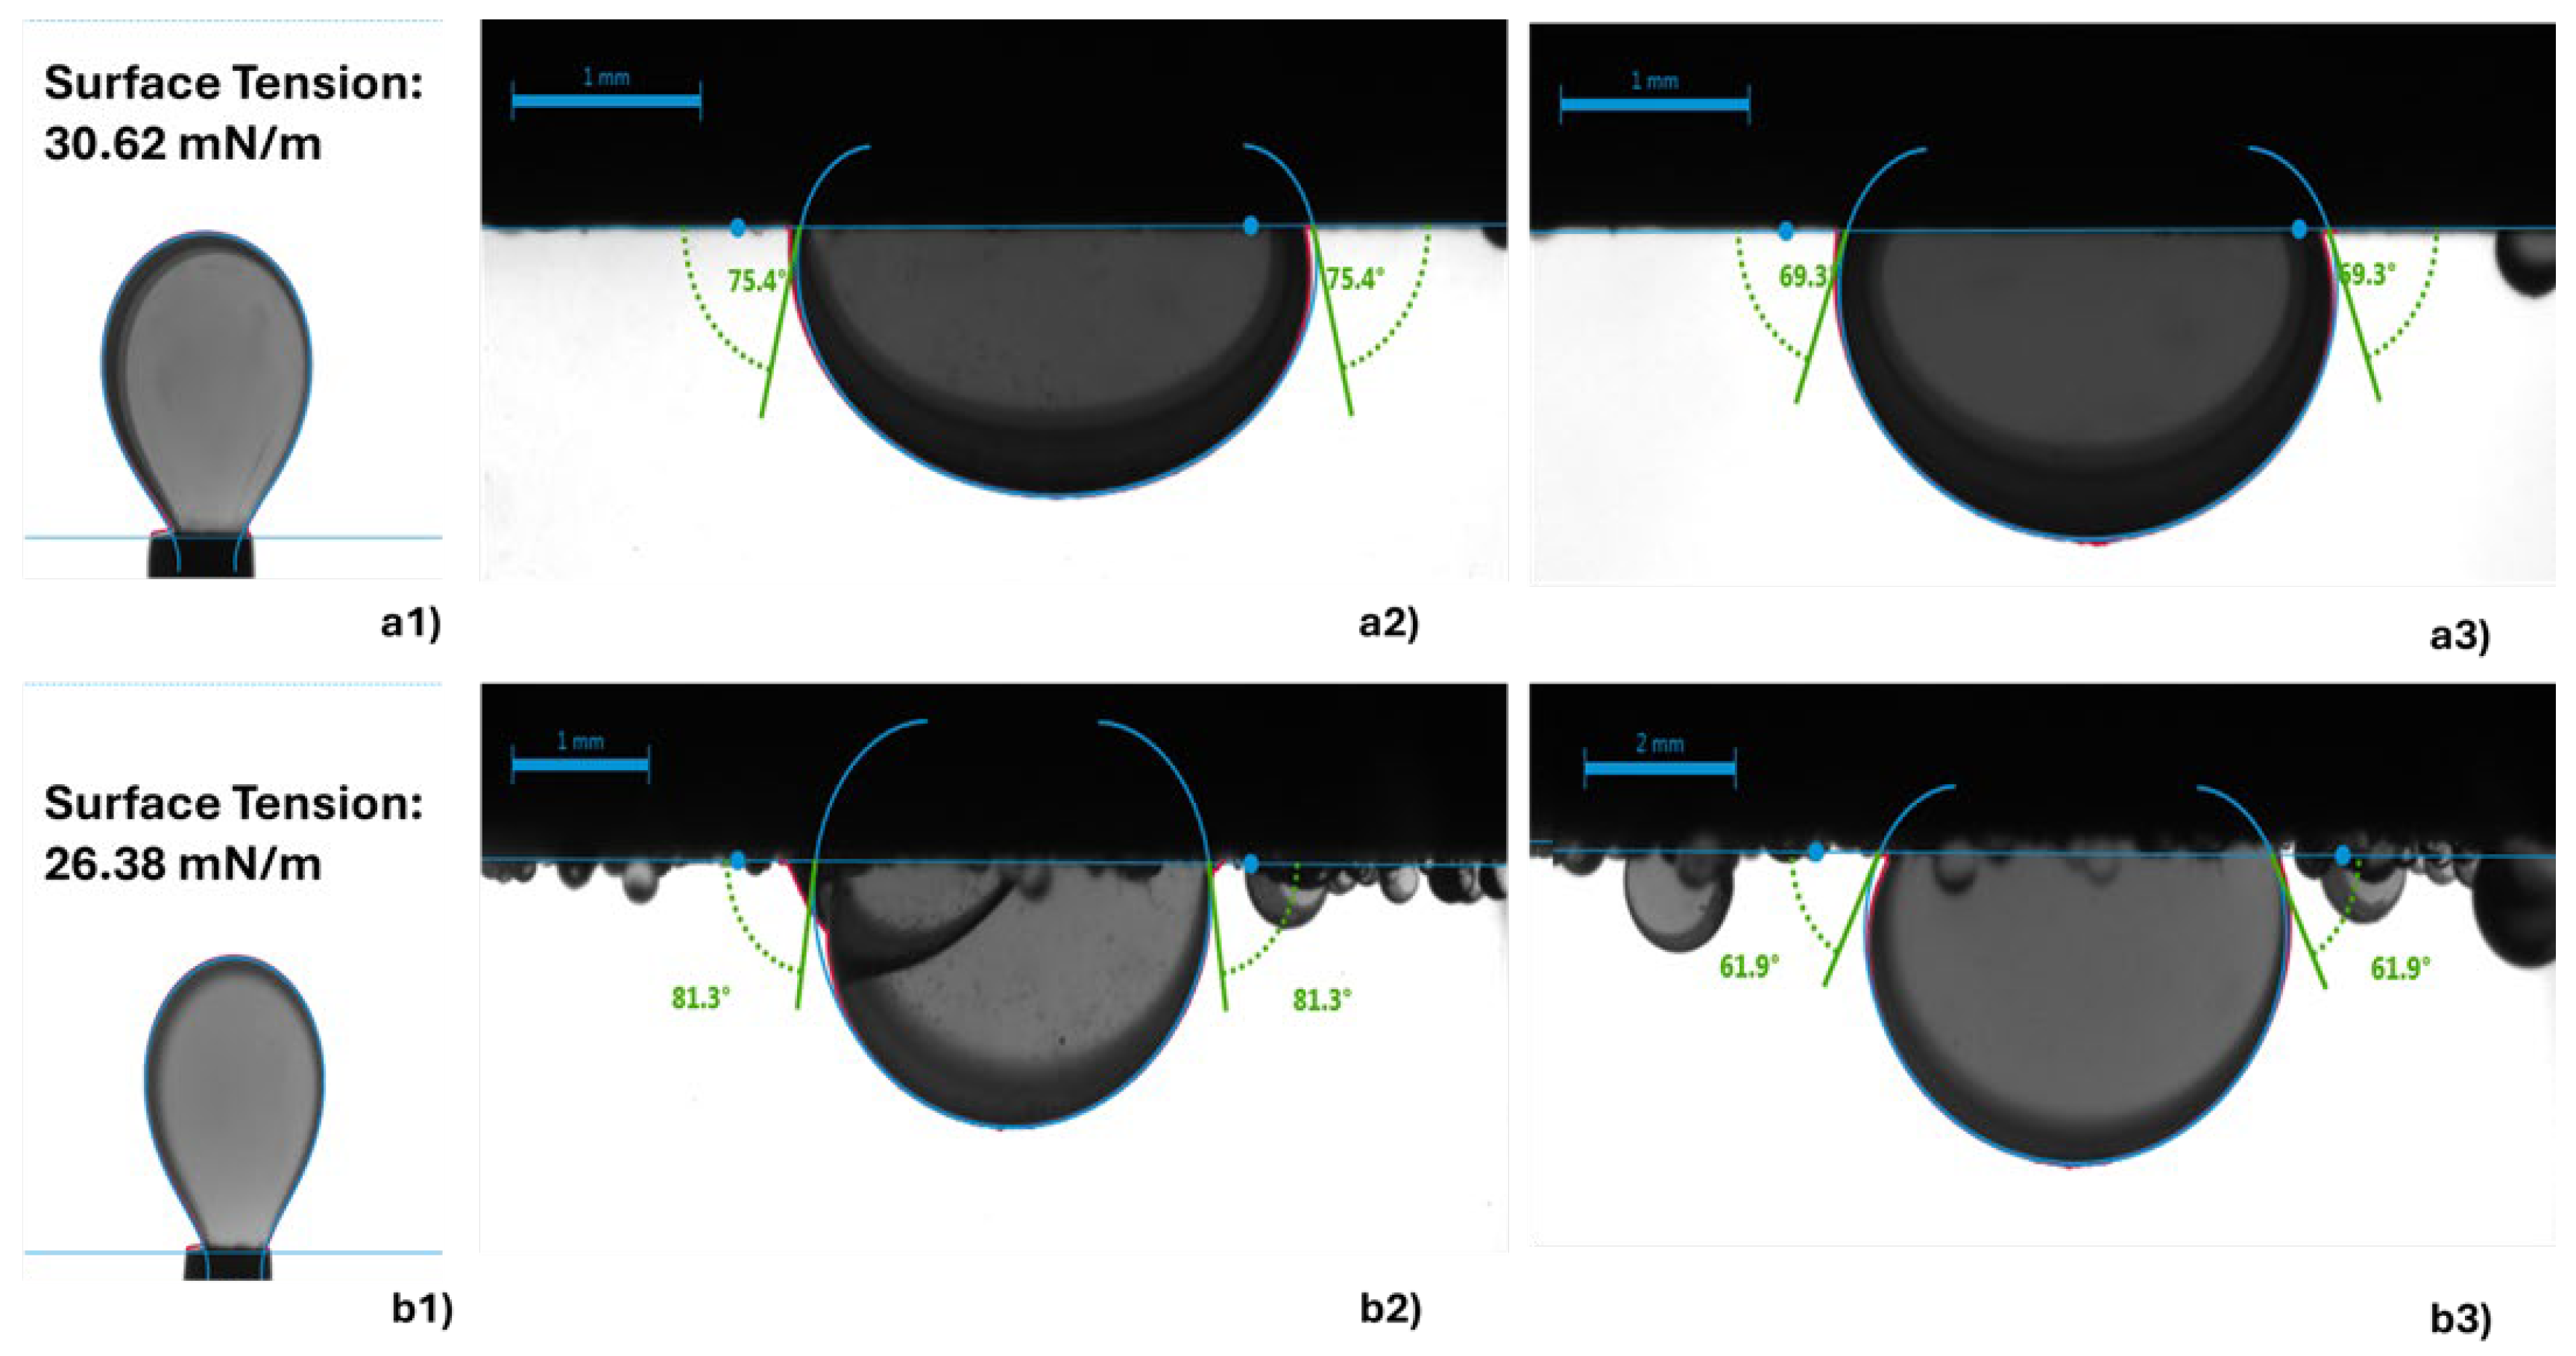
Some sample images recorded during the experiments are shown in Figure 18, where the IFT is measured under reservoir conditions, and the contact angle is measured under both ambient and reservoir conditions. Table 10 and Table 11 demonstrate the results of contact angle measurement and interfacial tension with the replicates and mean standard deviation. Carbonated brine lowered the IFT by 3.65 dynes/cm in comparison to brine reduction. Carbonated brine lowered contact angle by 16° (the reduction in the contact angle in brine system was 6.7° reduction) in the limestone core, leading to a reduction in oil wetness and improvement in oil recovery. The results support and validate the reduction in the residual oil saturation endpoints caused by the wettability alteration shown in Figure 3.

4. Discussion

The simulation results reveal that the WAG-CO2 injection scenario in a small sector of a target limestone reservoir achieved a recovery factor (RF) of 42%, outperforming the continuous CO2 injection scenario which attained 35% (Figure 6). This improvement is attributed to enhanced sweep efficiency and reduced gravity override in the WAG-CO2 case, as evidenced by saturation profiles (Figure 7) showing more uniform displacement and better oil bank formation. Further alignment with our results is provided by the numerical simulation study conducted by Jia et al. [46], who evaluated a CO2-carbonated water–alternating–gas (WAG-CO2) injection process using data from the Weyburn field, a well-characterized carbonate reservoir. Their simulation revealed a 6.7% improvement in oil recovery compared to continuous CO2 injection and a 6.7% increase in CO2 storage capacity when the carbonated water concentration was increased from 0 to 1.2 mol/L. Additionally, it was stated that sweep efficiency was improved especially in the lower layers of the reservoir, due to reduced gravity override and better mobility control mechanisms that directly align with our simulation findings in the WAG-CO2 scenario. The use of Weyburn field parameters adds credibility and real-field relevance to their observations.
Experimental evidence [47] strongly supports our simulation findings regarding the benefits of WAG-CO2 injection in carbonate reservoirs. Core-flood experiments demonstrated that WAG-CO2 achieves the highest oil recovery compared to continuous gas or water flooding, with approximately 30% improvement over waterfloods and 15% over continuous gas injection which is consistent with our simulation.
The simulation results demonstrated a net CO2 utilization ratio (NUR) of 3.2 MSCF/STB and a gross utilization ratio (GUR) of 8.3 MSCF/STB for the WAG-CO2 scenario within a small 5-spot sector model. These values are encouraging when benchmarked against real field data from the Sacroc Unit and Salt Creek Field, both of which are limestone and part of the Canyon Reef Formation in Texas. These mature CO2-EOR projects have reported net utilization ratio (NUR) values ranging from 5 to 10 MSCF/STB and gross utilization ratio (GUR) values between 10 and 15 MSCF/STB [18]. Some publications [48] reported gross utilization ratios of 7.4–27.0 M SCF/STB and net utilization ratios of 2.4–12.6 M SCF/STB for conventional reservoirs which align with our results.
Further supporting the superior performance of the WAG strategy in CO2 sequestration were a numerical study conducted in the Cuu Long Basin of Vietnam [49]. Their findings confirmed that WAG-CO2 significantly improved both residual and solubility trapping compared to continuous CO2 injection.
As per the SCC estimation, two scenarios were evaluated to assess the potential cost savings associated with the integration of EOR and sequestration. Scenario A demonstrated a reduction of approximately USD 40 million (10%) in the Social Cost of Carbon (SCC), while Scenario B indicated a more substantial reduction of USD 108 million (24%), both relative to the total volume of captured CO2 emissions. These estimations are based on a single five-spot sector model utilizing only 8–23% of the total captured CO2. Expanding the implementation to multiple injection patterns across the reservoir could potentially amplify these benefits by increasing storage capacity, lowering the SCC, and enhancing the economic feasibility through additional oil production revenues. The CO2 emissions from the source amount to 119,000 metric tons per year. This would amount to 135,000, 165,000, and 213,000 metric tons of sequestered CO2 in five, ten, and twenty years, respectively, in a single five-spot pattern. For a full-field application, the sequestered CO2 would increase by a factor of 4 to 11 based on the CO2 recycling mechanism and the number of patterns.
From the economic viability standpoint, the CCUS project proposed by our study is similar to the Weyburn Field project in terms of the basic properties with even closer proximity to the emissions source which reduces the transport cost. The cost of the Weyburn field project to store CO2 is USD 20.04 per ton of CO2 [50] as compared to USD 125 to USD 335 per ton from the direct air capture (DAC) process [51]. The target limestone reservoir sector that was simulated in this study uses 119,000 tons of CO2/year, leading to an annual cost of USD 2,383,000 with an assumed crude oil price of USD 63.32/barrel [52] (37,650 barrels of oil production is required annually to cover the cost of the project). Thus, this cost is minimal when compared to the total income from the sale of the incremental oil from the proposed EOR project. According to Kwak and Kim [53], the CO2 purchase is the largest cost in the early phase of the CO2 EOR operation (they considered a range of CO2 price between USD 12/t and USD 32/t). These observations signify the importance of using captured CO2 for the economic viability of the CO2-EOR project.
The sensitivity analysis conducted on residual oil saturation (Sor) in this study aligns with established trends reported in the literature. As illustrated in Figure 13a, scenarios with lower Sor resulted in significantly higher gross and net CO2 utilization ratios (GUR and NUR), indicating that more CO2 was required per barrel of oil produced due to the limited remaining mobile oil. These outcomes are consistent with the findings of Ren and Duncan [54], who demonstrated through numerical simulation that increasing initial Sor leads to reduced CO2 utilization ratios and improved oil production efficiency in a five-spot WAG-CO2 pattern. Regarding the HCPV injection sensitivity analysis, results indicate that reducing the CO2 injection below the base HCPV value leads to a significant decline in oil recovery—up to 50% less production—rendering it suboptimal from an EOR standpoint. Conversely, increasing the injection to 2.0 HCPV enhances cumulative oil recovery by approximately 220,000 barrels, representing a 16% improvement over the base case. However, such a high injection volume may present economic and operational challenges, particularly due to increased CO2 recycling demands. Based on the observed trends, an optimal injection range appears to lie between 1.0 and 1.5 HCPV, balancing enhanced oil recovery and long-term sequestration objectives.
The wettability alteration induced by WAG-CO2 injection plays a pivotal role in enhancing oil recovery and CO2 trapping efficiency in carbonate formations. Under WAG-CO2, reservoir rocks tend to shift toward a more water-wet state, which promotes increased capillary trapping of CO2 and amplifies relative permeability hysteresis. Morrow [55] emphasized that alterations in wettability, as evidenced by variations in interfacial tension (IFT) and contact angle, significantly affect capillary pressure, film stability, and, ultimately, oil recovery. Increased water-wetness, shown by reduced contact angles, typically improves displacement efficiency, especially in carbonate systems.
5. Conclusions

This study demonstrates a holistic approach to assessing and quantifying the beneficial effects of implementing WAG-CO2 floods in appropriate carbonate fields by capturing CO2 from nearby sources, such as steam injection boilers in heavy-oil fields as in this study. The modeling results indicate that such a venture is an economically viable EOR idea, in addition to potentially sequestering substantial amounts of CO2 emissions from steam injection projects. A single five-spot pattern reduced the social cost of carbon by 10–24% (USD 40–108 million), where additional patterns expansion in reservoir will optimistically have effect on the SCC along with additional sequestration and incremental oil recovery. Laboratory experiments support the viability of the proposed numerical assumption by proving wettability alteration by reduction in contact angle and interfacial tension under carbonated brine.
The numerical simulation results indicate the following:
  • WAG-CO2 flooding yields 42% EOR oil while sequestering 8300 SCF/STB gross utilization ratio (GUR) and 3100 SCF/STB net utilization ratio (NUR). In contrast, continuous CO2 injection yields 34% EOR oil and sequesters 29,000 SCF/STB gross utilization ratio (GUR) and 9600 SCF/STB net utilization ratio (NUR).
  • WAG-CO2 net utilization ratio (NUR) of 3.2 MSCF/STB and gross utilization ratio (GUR) of 8.3 MSCF/STB—values compare favorably to field analogs.
  • A possibility of a 10–24% reduction in the SCC (USD 40–108 million) of a single five-spot pattern. An expansion of patterns would further reduce the SCC and enable more substantial sequestration of emissions.
  • Aqueous solubility plays an important role in retention capacities, where efficient utilization levels are higher in CO2-WAG than in continuous CO2 (22.5% of CO2 retained in WAG-CO2 in comparison to 4.2% in continuous CO2).
  • Initiating CO2 injection at higher residual oil saturations improves EOR efficiency but causes a decrease in the sequestration efficiency (7150 SCF/STB gross utilization ratio (GUR) in comparison to 8300 SCF/STB and 1900 SCF/STB net utilization ratio (NUR) in comparison to 3100 SCF/STB).
  • Increasing the CO2 injections to 2 HCPV at 10% annually in comparison to the proposed 1 HCPV at 5% annually may not be feasible due to the associated post-production and recycling costs and the limited additional EOR benefits.
  • An experimental study indicated that carbonated brine lowered both the IFT (4.24 dynes/cm reduction) and contact angle (14.1° reduction in comparison to 6.1° reduction) in limestone core in comparison to brine systems, leading to a more water wet state. The results support and validate wettability alteration effect of CO2 as a surrounding phase.
  • The findings support the growing viability of WAG-CO2 injection as a dual benefit in maximizing oil recovery and achieving meaningful CO2 sequestration, thereby contributing to both energy security and climate goals. This study offers valuable insights into pilot pattern design, enhanced oil recovery implementation, sequestration impacts, and the social cost of carbon (SCC).
  • Future work should include full-field expansion with multiple WAG-CO2 patterns, evaluation of CO2 recycling efficiency, and comprehensive economic and risk analyses to support scalable deployment.

Author Contributions

Conceptualization, M.A.-G.; Methodology, M.A.-G.; Software, M.A.-G.; Validation, M.A.-G.; Formal Analysis, M.A.-G.; Writing—Original Draft Preparation, M.A.-G.; Writing—Review and Editing, E.O., H.K. and M.A.-G.; Supervision, E.O. and H.K. All authors have read and agreed to the published version of the manuscript.

Funding

This work has been performed as a part of Mr. Mohammad Al-Ghnemi’s PhD research at Colorado School of Mines and will be included in his PhD dissertation. Mr. Al-Ghnemi’s PhD studies have been sponsored by Kuwait Petroleum Corporate (KPC)−Kuwait Oil Company (KOC).

Data Availability Statement

The original contributions presented in the study are included in the article/Appendix A, further inquiries can be directed to the corresponding author.

Acknowledgments

The authors would like to thank Surtek Inc. for providing the cores and aging one batch of the cores (Section 3.5 of this study).

Conflicts of Interest

The authors declare no conflicts of interest.

Appendix A

Conversions from oil-field units used in this study to consistent, SI units are shown in Appendix A.
Table A1. Conversion from oil-field to SI unit.
QuantityField UnitSI UnitConversion
Pressurepsi (psia)kPa (MPa)1 psi = 6.894 76 kPa
Pressure gradientpsi/ftkPa/m 1 psi/ft = 22.620 6 kPa/m
Temperature°F°C°C = (°F − 32) × 5/9
Lengthftm1 ft = 0.304 8 m
Areaacrem21 acre = 4 046.86 4 m2
VolumeSTB (bbl)m31 STB = 0.159 m3
Flow rateSTB/dm3/d1 STB/d = 0.1589 m3/d
Gas volumeSCFm31 SCF = 0.0283 m3
Gas flowSCF/dm3/d1 SCF/d = 0.28316 m3/d
Masslbkg1 lb = 0.4535 kg
Mass ratelb/hkg/hmultiply by 0.453 592 37
PermeabilitymDm21 mD = 9.869 × 10⁻¹⁶ m2
ViscositycPmPa·s1 cP = 1 mPa·s
Densityg/cm3kg/m31 g/cm3 = 1 000 kg/m3
Oil gravity°APISG, ρSG60°F = 141.5/(API + 131.5)
Gas–oil ratio (utilization, solubility)SCF/STBm3/m31 SCF/STB = 0.178 m3/m3
Amountgmolemol1 gmol ≡ 1 mol
Interfacial tensiondyne/cmmN/m1 dyne/cm = 1 mN/m

References

  1. Arrhenius, S. On the influence of carbonic acid in the air upon the temperature of the ground. Philos. Mag. J. Sci. 1896, 41, 237–276. [Google Scholar] [CrossRef]
  2. U.S. Environmental Protection Agency. Causes of Climate Change; EPA: Washington, DC, USA, 2023. Available online: https://www.epa.gov/climatechange-science/causes-climate-change (accessed on 7 July 2025).
  3. Hossein, K.; Davis, T. Energy transition: A reservoir engineering perspective. First Break 2021, 39, 73–78. [Google Scholar] [CrossRef]
  4. U.S. Energy Information Administration. U.S. Energy-Related Carbon Dioxide Emissions, 2022; EIA: Washington, DC, USA, 2023. Available online: https://www.eia.gov/environment/emissions/carbon/ (accessed on 7 July 2025).
  5. World Bank. Global Gas Flaring Tracker; World Bank: Washington, DC, USA, 2023. [Google Scholar]
  6. International Energy Agency. Emissions from Oil and Gas Operations in Net Zero Transitions A World Energy Outlook Special Report on the Oil and Gas Industry and COP28; IEA: Paris, France, 2023; Available online: www.iea.org (accessed on 6 March 2024).
  7. Rennert, K.; Errickson, F.; Prest, B.C.; Rennels, L.; Newell, R.G.; Pizer, W.; Kingdon, C.; Wingenroth, J.; Cooke, R.; Parthum, B.; et al. Comprehensive evidence implies a higher social cost of CO2. Nature 2022, 610, 687–692. [Google Scholar] [CrossRef] [PubMed]
  8. Stanford University. Stanford Professors Explain the Social Cost of Carbon and Its Importance in Climate Policy; Stanford News: Redwood City, CA, USA, 2021; Available online: https://news.stanford.edu/stories/2021/06/professors-explain-social-cost-carbon (accessed on 18 January 2025).
  9. Resources for the Future. Social Cost of Carbon More Than Triple the Current Federal Estimate, New Study Finds; Resources for the Future: Washington, DC, USA, 2022. [Google Scholar]
  10. Bureau of Ocean Energy Management. Social Cost of Carbon and Royalty Rate Policy Considerations; U.S. Department of the Interior: Washington, DC, USA, 2022. Available online: https://www.boem.gov/sites/default/files/documents/oil-gas-energy/energy-economics/2022_1212_SCC%20and%20Royalty%20Rate%20Paper.pdf (accessed on 12 November 2024).
  11. Fitch, P.J.R. Heterogeneity in the Petrophysical Properties of Carbonate Reservoirs. Ph.D. Thesis, The University of Leicester, Leicester, UK, 2010. [Google Scholar]
  12. Moritis, G. EOR Continues to Unlock Oil Resources. Oil Gas J. 2004, 102, 45–65. [Google Scholar]
  13. Manrique, E.J.; Muci, V.E.; Gurfinkel, M.E. EOR Field Experiences in Carbonate Reservoirs in the United States. SPE Reserv. Eval. Eng. 2007, 10, 667–686. [Google Scholar] [CrossRef]
  14. Dandekar, A.Y.; Kokal, S.L.; Maerefat, M. CO2-enhanced oil recovery (CO2-EOR): A review of the key parameters, modeling, and field applications. Energy Fuels 2015, 29, 4339–4361. [Google Scholar]
  15. Taber, J.J.; Martin, F.D.; Seright, R.S. EOR Screening Criteria Revisited—Part 1: Introduction to Screening Criteria and Enhanced Recovery Field Projects. SPE Reserv. Eng. 1997, 12, 189–198. [Google Scholar] [CrossRef]
  16. Chen, Z.; Li, R.; Du, Y.; Ma, S.; Zhang, X.; Shi, J. Effect of confinement on the vapor–liquid–liquid three-phase equilibrium during CO2 utilization and sequestration in shale reservoirs. Adv. Geo-Energy Res. 2025, 16, 199–210. [Google Scholar] [CrossRef]
  17. Yang, G.; Fan, Z.; Li, X. Determination of confined fluid phase behavior using extended Peng–Robinson equation of state. Chem. Eng. J. 2019, 378, 122032. [Google Scholar] [CrossRef]
  18. Merchant, D. Enhanced oil recovery–the history of CO2 conventional wag injection techniques developed from lab in the 1950’s to 2017. In Proceedings of the Carbon Management Technology Conference (CMTC), Houston, TX, USA, 17–20 July 2017. [Google Scholar]
  19. Alam, M.N.; Al Kobaisi, M.; Pourafshary, P. Dual Benefits of Enhanced Oil Recovery and CO2 Sequestration: The Impact of CO2 Injection Approach on Oil Recovery. Front. Energy Res. 2022, 10, 877212. [Google Scholar] [CrossRef]
  20. Taber, J.J.; Martin, F.D.; Seright, R.S. EOR Screening Criteria Revisited—Part 2: Applications and Impact of Oil Prices. SPE Reserv. Eng. 1997, 12, 199–206. [Google Scholar] [CrossRef]
  21. Ning, Y.; Tura, A. Economic and Operational Investigation of CO2 Sequestration through Enhanced Oil Recovery in Unconventional Reservoirs in Colorado, USA. Geoenergy Sci. Eng. 2023, 226, 211820. [Google Scholar] [CrossRef]
  22. Melzer, L.S. Carbon Dioxide Enhanced Oil Recovery (CO2 EOR): Factors Involved in Adding Carbon Capture, Utilization and Storage (CCUS) to Enhanced Oil Recovery. In Proceedings of the CO2 Consultant and Annual CO2 Flooding Conference Director, Midland, TX, USA, February 2012. [Google Scholar]
  23. IEA. Storing CO2 Through Enhanced Oil Recovery; IEA: Paris, France, 2015. [Google Scholar]
  24. Majer, A.; Sroneman, B.; Vikalo, V. Weyburn Unit Extending the Horizon. In Proceedings of the 24th Annual CO2 & ROZ Conference, Midland, TX, USA, 15–17 May 2018. [Google Scholar]
  25. Benson, S.M.; Gasperikova, E.; Hoversten, G.M. Monitoring protocols and life-cycle costs for geologic storage of carbon dioxide. In Proceedings of the 7th International Conference on Greenhouse Gas Control Technologies (GHGT-7), Vancouver, BC, Canada, 5–9 September 2005. [Google Scholar]
  26. Bachu, S.; Bonijoly, D.; Bradshaw, J.; Burruss, R.; Holloway, S.; Christensen, N.P.; Mathiassen, O.M. CO2 storage capacity estimation: Methodology and gaps. Int. J. Greenh. Gas Control 2007, 1, 430–443. [Google Scholar]
  27. Miri, R. Effects of CO2-Brine-Rock Interactions on CO2 Injectivity-Implications for CCS; University of Oslo: Oslo, Norway, 2015. [Google Scholar]
  28. Gunter, W.D.; Perkins, E.H.; McCann, T.J. Aquifer disposal of CO2-rich gases: Reaction design for added capacity. Energy Convers. Manag. 1993, 34, 941–948. [Google Scholar] [CrossRef]
  29. Cooper, C. A technical basis for carbon dioxide storage. Energy Procedia 2009, 1, 1727–1733. [Google Scholar] [CrossRef]
  30. Snæbjörnsdóttir, S.Ó.; Sigfússon, B.; Marieni, C.; Goldberg, D.; Gislason, S.R.; Oelkers, E.H. Carbon dioxide storage through mineral carbonation. Nat. Rev. Earth Environ. 2020, 1, 90–102. [Google Scholar] [CrossRef]
  31. Computer Modelling Group Ltd. GEM User Manual (Version 2023): Solubility Model for Aqueous Phase—Harvey Correlation; Computer Modelling Group Ltd.: Calgary, AB, Canada, 2023. [Google Scholar]
  32. Computer Modelling Group Ltd. CMG WinProp User Manual (Version 2023); Computer Software Manual; Computer Modelling Group Ltd.: Calgary, AB, Canada, 2023. [Google Scholar]
  33. Nationwide Boiler Inc. Steamlines. 2019. Available online: https://www.nationwideboiler.com/pdfs/steamlines/steamlines_december_2019.pdf (accessed on 17 May 2024).
  34. California Energy Commission. 2020-11 Petroleum Watch. 2020. Available online: https://www.energy.ca.gov/sites/default/files/2020-12/2020-11%20Petroleum%20Watch_ADA.pdf (accessed on 17 May 2024).
  35. Petrofac. Lower Fars Heavy Oil Development Project. 2024. Available online: https://www.petrofac.com/petrofacts/lower-fars/ (accessed on 17 May 2024).
  36. Peng, D.Y.; Robinson, D.B. A New Two-Constant Equation of State. Ind. Eng. Chem. Fundam. 1976, 15, 59–64. [Google Scholar] [CrossRef]
  37. Ahmadi, K.; Johns, R.T. Multiple Mixing-Cell Method for MMP Calculations. SPE J. 2011, 16, 733–742. [Google Scholar] [CrossRef]
  38. Yuan, H.; Johns, R.T.; Egwuenu, A.M.; Dindoruk, B. Improved MMP Correlations for CO2 Floods Using Analytical Gasflooding Theory. SPE Reserv. Eval. Eng. 2005, 8, 418–425. [Google Scholar] [CrossRef]
  39. Duan, Z.; Sun, R. An improved model calculating CO2 solubility in pure water and aqueous NaCl solutions from 273 to 533 K and from 0 to 2000 bar. Chem. Geol. 2003, 193, 257–271. [Google Scholar] [CrossRef]
  40. Wang, J.; Ehlig-Economides, C. Salinity effect on CO2 solubility in live formation water under reservoir conditions. In Proceedings of the SPWLA Annual Logging Symposium, Lake Conroe, TX, USA, 10–14 June 2023. [Google Scholar]
  41. Danesh, A. PVT and Phase Behavior of Petroleum Reservoir Fluids; Elsevier: Amsterdam, The Netherlands, 1998; p. 116. [Google Scholar]
  42. Emera, M.K.; Sarma, H.K. Genetic Algorithm (GA)-based correlations offer more reliable prediction of CO2-oil physical properties. In Proceedings of the Canadian International Petroleum Conference, Calgary, AB, Canada, 7–9 June 2005. [Google Scholar]
  43. Christensen, J.R.; Stenby, E.H.; Skauge, A. Review of WAG Field Experience. SPE Res. Eval. Eng. 2001, 4, 97–106. [Google Scholar] [CrossRef]
  44. Tagavifar, M.; Sharma, H.; Wang, D.; Jang, S.H.; Pope, G.A. Alkaline/Surfactant/Polymer Flooding with Sodium Hydroxide in Indiana Limestone: Analysis of Water/Rock Interactions and Surfactant Adsorption. SPE J. 2018, 23, 2279–2301. [Google Scholar] [CrossRef]
  45. Alghnemi, M. Created with BioRender.com. Available online: https://biorender.com/vz0gmyc (accessed on 23 August 2025).
  46. Ji, M.; Kwon, S.; Choi, S.; Kim, M.; Choi, B.; Min, B. Numerical Investigation of CO2 Carbonated Water Alternating Gas on Enhanced Oil Recovery and Geological Carbon Storage. J. CO2 Utilization 2023, 74, 102544. [Google Scholar] [CrossRef]
  47. Zhao, C.; Song, Z.; Yao, Y.; Li, Y.; Liu, Q.; Qi, M.; Hou, J.; Xu, L.; Han, B.; Song, L. Effect of Water-Alternating-Gas Injection on Gas and Water Production Control in Carbonate Reservoirs. In Proceedings of the Carbon Management Technology Conference (CMTC), Houston, TX, USA, 15–18 July 2019. CMTC-558862-MS. [Google Scholar]
  48. Lake, L.W.; Lotfollahi, M.; Bryant, S.L. CO2 enhanced oil recovery experience and its messages for CO2 storage. In Science of Carbon Storage in Deep Saline Formations; Elsevier: Amsterdam, The Netherlands, 2019; pp. 15–31. [Google Scholar] [CrossRef]
  49. Vo Thanh, H.; Sugai, Y.; Nguele, R.; Sasaki, K. Robust optimization of CO2 sequestration through a water alternating gas process under geological uncertainties in Cuu Long Basin, Vietnam. J. Nat. Gas Sci. Eng. 2020, 76, 103208. [Google Scholar] [CrossRef]
  50. Torp, T.A.; Brown, K.R. CO2 Underground Storage Costs as Experienced at Sleipner and Weyburn. In Greenhouse Gas Control Technologies 7; Elsevier Science Ltd.: Oxford, UK, 2005; pp. 531–538. [Google Scholar]
  51. International Energy Agency. Direct Air Capture 2022: Executive Summary; IEA: Paris, France, 2022; Available online: https://www.iea.org/reports/direct-air-capture-2022/executive-summary (accessed on 23 August 2025).
  52. OilPrice.com. Available online: https://oilprice.com/ (accessed on 20 August 2025).
  53. Kwak, D.-H.; Kim, J.-K. Techno-Economic Evaluation of CO2 Enhanced Oil Recovery (EOR) with the Optimization of CO2 Supply. Int. J. Greenh. Gas Control 2017, 58, 169–184. [Google Scholar] [CrossRef]
  54. Ren, B.; Duncan, I.J. Maximizing oil production from water alternating gas (CO2) injection into residual oil zones: The impact of oil saturation and heterogeneity. Energy 2021, 222, 119915. [Google Scholar] [CrossRef]
  55. Morrow, N.R. Wettability and Its Effect on Oil Recovery. JPT J. Pet. Technol. 1990, 42, 1476–1484. [Google Scholar] [CrossRef]
Figure 1. Trapping mechanism over time related to CO2 injection [30].
Fuels 06 00075 g001
Figure 2. Five-spot pattern showing well location and pressure (psia) distribution (CMG).
Fuels 06 00075 g002
Figure 3. Relative permeability curves for the (a) oil–water system and (b) liquid–gas system. The curves illustrate the impact of the wettability shift on relative permeability endpoints. krw: water relative permeability; kro: oil relative permeability; krg: gas relative permeability.
Fuels 06 00075 g003
Figure 4. Phase envelope of the fluid sample (CMG).
Fuels 06 00075 g004
Figure 5. Aqueous CO2 solubility versus pressure (experimental and correlation).
Fuels 06 00075 g005
Figure 6. Oil recovery factor (CMG).
Fuels 06 00075 g006
Figure 7. Vertical cross-sections showing oil saturation distribution from CMG simulation: (a) Start of simulation, (b) WAG–CO2 injection after 20 years, and (c) Continuous CO2 injection after 20 years.
Fuels 06 00075 g007
Figure 8. Cumulative produced and injected CO2 (gmole) at SC (CMG).
Fuels 06 00075 g008
Figure 9. Cumulative produced and injected CO2 (g-mol) under surface conditions for WAG-CO2 (CMG).
Fuels 06 00075 g009
Figure 10. Cumulative produced and injected CO2 (g-mol) under surface conditions for continuous CO2 (CMG).
Fuels 06 00075 g010
Figure 11. SCC estimates for the proposed scenarios.
Fuels 06 00075 g011
Figure 12. Relative permeability curves low and high and low residual oil saturation. (a1,a2): Low Residual Oil Saturation. (b1,b2): High Residual Oil Saturation. The curves illustrate the impact of wettability shift on relative permeability endpoints. krw: water relative permeability; kro: oil relative permeability; krg: gas relative permeability.
Fuels 06 00075 g012
Figure 13. Sensitivities to residual oil saturation. (a) Sequestration; (b) EOR.
Fuels 06 00075 g013
Figure 14. EOR and sequestration efficiencies as a function of injected HCPVs of CO2: (a) Sequestration; (b) EOR.
Fuels 06 00075 g014
Figure 15. Cross-section of oil saturation of the HCPV CO2 injection case (a) Low Case (b) Base Case (c) High Case (CMG).
Fuels 06 00075 g015
Figure 16. EOR and sequestration efficiencies as a function of WAG-CO2 Ratio: (a) Sequestration; (b) EOR.
Fuels 06 00075 g016
Figure 17. Schematic of experiment setup [45].
Fuels 06 00075 g017
Figure 18. Results of experiments: (a1) IFT under reservoir conditions in brine system; (a2) contact angle under ambient conditions in brine system; (a3) contact angle under reservoir conditions in brine system; (b1) IFT under reservoir conditions of carbonated brine; (b2) contact angle under ambient conditions in carbonated brine; (b3) contact angle under reservoir conditions in carbonated brine.
Fuels 06 00075 g018
Table 1. Oil gravity vs. depth ranges of reservoirs favorable for miscible CO2 applications [20].
Gravity Range (° API)Depth Range (ft)
40 2500
32–39.9 2800
28–31.9 3300
22–27.9 4000
Table 2. Reservoir properties assumed in the model.
PropertiesDescription
Grid8-point 2D grid and 11-point 3D grid
Size of grid(160 ft, 140 ft, 5 ft)
Blocks of grid(16 i × 18 j × 40 k)
Porosity modelSingle and assumed to be 15%
Pilot5-spot pattern—144 acres
Distance between injector and producer1773 ft
Horizontal permeability18 mD
Average vertical permeability/horizontal permeability (kv/kh)0.8
Reservoir temperature240 °F
Reservoir pressure5000 psia
Bubble point pressure2200 psia
AquiferNo
Table 3. Mole percentage of fluid sample.
ComponentMole %
CO20.02
CH40.3
C2H60.1
C3H80.1
NC40.05
NC50.04
FC60.03
FC7+0.36
Table 4. PVT properties of fluid sample.
Assumed Reservoir Properties
Viscosity at Initial Condition0.5 cP
Viscosity at Bubble Point (Pb)0.3 cP
Reservoir Oil Density at Initial Condition0.7 g/cm3
Reservoir Oil Density at Pb0.65 g/cm3
Oil Formation Volume Factor (Bo) at Initial Condition1.5
Bo at Bubble Point1.6
Table 5. Case scenarios.
Case StudyCO2 HCPVWater HCPVInjection SC (Per Pattern)Producer PressureInjection Pressure
Water Flood--11600 STB/day3500 psia (min)7500 psia (max)
Continuous CO2 Flood1--3 MM SCF/day
WAG-CO2 Flood0.50.5Water: 1600 STB/day
CO2: 3 MM SCF/day
Table 6. Net utilization ratio (NUR), Gross utilization ratio (GUR), and Retention capacity (RC) for the continuous CO2 and WAG-CO2 scenarios.
Sequestration FactorEOR Factor
Case GUR MSCF/STB NUR MSCF/STB RC (%)Incremental Oil Production Above Water Flood (STB)Cumulative Recovery Factor (%)
CO2 Flood299.6330.75 MM35
WAG-CO28.33.1361.31 MM42
Table 7. CO2 retention by mechanism for both WAG-CO2 and continuous CO2 scenario.
WAG-CO2Continuous CO2
Quantity (SCF)% of Total Retained CO2Quantity (SCF)% of Total Retained CO2
Total Remaining CO2 in Reservoir2970 MM SCF 6850 MM SCF
CO2 in Aqueous Phase670 MM SCF22.5%291 MM SCF4.2%
CO2 Dissolved in Oil450 MM SCF15.2%915 MM SCF13.4%
CO2 Trapped by Hysteresis435 MM SCF14.6%415 MM SCF6.1%
Free CO2 as Gas Phase1415 MM SCF47.7%5229 MM SCF76.3%
Table 8. Injected, produced, and remaining quantities of CO2 for a single, five-spot pattern in 20 years (simulation timeframe).
Cumulative Quantity (MMSCF of CO2)Cumulative Quantity (Metric Tons of CO2)
CO2 injected10,450581,000
CO2 produced6610367,000
CO2 remaining in reservoir3827213,000
Table 9. Sensitivity analysis.
Factor EvaluatedBase CaseHigh CaseLow Case
Residual Oil Saturation0.30.450.15
HCPV Injection (CO2)120.5
WAG-CO2 Ratio1:12:10.5:1
Table 10. Contact angle measurements under ambient and reservoir conditions for various fluid systems. Values are reported as mean ± standard deviation. CV: coefficient of variation; n: number of replicates. Contact angle reduction is calculated as the difference between ambient and reservoir means.
Fluid SystemSurrounding PhaseContact Angle Under Ambient Conditions CV ReplicatesContact Angle Under Reservoir Conditions CV ReplicatesContact Angle Reduction
°%n°%n°
Synthetic Crude oil SystemBrine System75.6 ± 0.2010.27368.9 ± 0.590.7736.7
Carbonated Brine System78.9 ± 2.43.04362.9 ± 1.732.75316
Table 11. Interfacial tension (IFT) measurements for various fluid systems under ambient and reservoir conditions. Values are presented as mean ± standard deviation. CV: coefficient of variation; n: number of replicates. IFT reduction is calculated as the difference between ambient and reservoir mean values.
Fluid SystemSurrounding PhaseIFT Under Ambient ConditionsCVReplicatesIFT Under Reservoir
Conditions
CVReplicates
[dynes/cm]%n[dynes/cm]%n
Synthetic Fluid with Naphthenic AcidBrine System34.1 ± 0.692330.78 ± 0.61.953
Carbonated Brine System29.35 ± 0.5541.8827.13 ± 0.511.884
Disclaimer/Publisher’s Note: The statements, opinions and data contained in all publications are solely those of the individual author(s) and contributor(s) and not of MDPI and/or the editor(s). MDPI and/or the editor(s) disclaim responsibility for any injury to people or property resulting from any ideas, methods, instructions or products referred to in the content.