Article

Opportunities for Emission Reduction in the Transformation of Petroleum Refining

by
Emilio Seijo-Bestilleiro
1,
Ignacio Arias-Fernández
1,
Diego Carro-López
2 and
Manuel Naveiro
1,*
1
Energy Engineering Research Group, University Institute of Maritime Studies, Nautical Sciences and Marine Engineering Department, ETSNM, University of A Coruña, Paseo de Ronda 51, 15011 A Coruña, Spain
2
Center for Technological Innovation in Construction and Civil Engineering, School of Civil Engineering, University of A Coruña, 15011 A Coruña, Spain
*
Author to whom correspondence should be addressed.
Fuels 2025, 6(3), 66; https://doi.org/10.3390/fuels6030066
Submission received: 21 May 2025 / Revised: 1 September 2025 / Accepted: 2 September 2025 / Published: 13 September 2025

Abstract

Crude oil accounts for approximately 40% of global energy consumption, and the refining sector is a major contributor to greenhouse gas (GHG) emissions, particularly through the production of hard-to-abate fuels such as aviation fuel and fuel oil. This study disaggregates the refinery into its key process units to identify decarbonization opportunities along the entire production chain. Units are categorized into combustion-based processes—including crude and vacuum distillation, hydrogen production, coking, and fluid catalytic cracking—and non-combustion processes, which exhibit lower emission intensities. The analysis reveals that GHG emissions can be reduced by up to 60% with currently available technologies, without requiring major structural changes. Electrification, residual heat recovery, renewable hydrogen for desulfurization, and process optimization through digital twins are identified as priority measures, many of which are also economically viable in the short term. However, achieving full decarbonization and alignment with net-zero targets will require the deployment of carbon capture technologies. These results highlight the significant potential for emission reduction in refineries and reinforce their strategic role in enabling the transition toward low-carbon fuels.

1. Introduction

World energy demand is growing continuously [1], which is inherently accompanied by an increase in greenhouse gas (GHG) emissions. Despite ongoing global efforts to implement mitigation measures, the process of decoupling energy production from emissions remains slow and challenging [2].
Oil currently accounts for 40% of the global energy consumed [3] and plays a pivotal role in modern societies. Crucially, certain products derived from crude oil, such as aviation fuel, heavy fuel oil for cargo ships, various plastics, and gasoline/diesel, currently lack substitutes available in sufficient quantities [4]. This underscores the continued reliance on the oil industry in the short to medium term.
Although the 28th Conference Of the Parties (COP28) climate Summit [5] reached an agreement advocating a transition away from fossil fuels, multiple estimates suggest that oil exploitation will persist at least until 2040 [6]. This projected continuity, alongside the imperative for simultaneous reduction in use, highlights the critical challenge of developing replacement technologies and achieving effective decarbonization strategies to limit climate change.
In response, different countries and organizations have established ambitious five-year milestones aiming for net-zero emissions by 2050 [7]. The European Union, for example, has outlined its “target 55” package, including obligations for carbon-neutral short-haul flights by 2030 [8] and targets for zero-emission aircraft by 2035, alongside the transformation of heavy-duty vehicles by 2040. This global trend towards transforming all production processes [9] implies profound transformations across all industrial sectors.
This context of industrial change is marked by significant technological uncertainty [10]. Replacement technologies for critical fuels like heavy fuel oil for ships [11], diesel for trucks [12], and kerosene for airplanes [13] are still in early stages of development. Within this landscape, traditional refining facilities are expected to operate for several more decades, presenting an opportunity to actively contribute to the energy transition through initiatives like synthetic fuel production or carbon sequestration.
The core operation of oil refining—the distillation of crude oil fractions [14]—is inherently energy-intensive. This process consumes between 15% and 20% of the total energy expended in the entire oil production chain, from exploration to distribution [15,16]. Specifically, the refining segment accounts for approximately 5% of global GHG emissions [17], making a detailed analysis of its processes crucial for identifying effective emission reduction and elimination opportunities to achieve net-zero targets.
Refineries are fundamentally structured around a distillation tower that enables the fractionation of crude oil [18]. From this foundational unit, various other units [19] are progressively incorporated to adapt the process to market demands and regulatory frameworks. For instance, the octane number of gasoline must be adjusted to meet product specifications, necessitating a platforming unit [20]. Similarly, environmental regulations on sulfur compounds mandate the use of hydrodesulfurization units to transform diesel and ensure compliance [21].
To address the decarbonization challenge in the oil industry and its refining products, several strategies are being advanced. One primary approach involves modifying current refining processes to minimize operational emissions, such as through electrification [22]. Another alternative with substantial potential is the sequestration and capture of CO2 [23], which could reduce current refinery emissions by up to 6% and potentially increase to 43% in the coming years with advancements in oxycombustion and post-combustion technology [24]. Furthermore, improving efficiency through digital tools like Artificial Intelligence (AI) and Digital Twin (DT) [25,26] offers another significant avenue for process enhancement.
Alternative approaches also focus on substituting oil with feedstocks that result in no net emissions. Biofuels [27], derived from biological sources, present limitations concerning the volume required to meet current demand and their impact on land use. Similarly, synthetic fuels [28] represent another pathway, produced by reacting hydrogen with carbon sourced from CO2 capture. While this process can utilize hydrogen from electrolysis, it is currently associated with high energy consumption.
While previous studies provide valuable insights into specific processes, such as crude oil distillation or isolated carbon capture opportunities, a comprehensive, unit-by-unit analysis of the entire refinery ecosystem is still needed to map viable decarbonization pathways. Recent techno-economic assessments underscore that a portfolio of integrated strategies is essential for significant emission reductions across the diverse and complex operations of a modern refinery [29]. Indeed, general analyses assessing the global refining cycle from oil wells to gas station delivery exist [30], and some works specifically examine large CO2 emitters for carbon capture and sequestration [16]. Others delve into individual processes, such as crude towers, hydrogen production [31], or desulfurization [32]. However, a deep analysis that systematically examines all significant emission-generating processes across the complete refinery, as intended by this research, is notably absent in published works, which tend to focus on independent units (see references in Section 3).
This study aims to address this critical gap by providing a systematic review of opportunities for decarbonization within the complete oil refining cycle. By separating the refinery into individual processes and categorizing units by their emission sources (combustion vs. non-combustion), we identify specific avenues for improvement across the production chain. This detailed analysis examines how technologies such as optimized heat exchange systems, renewable H2 contribution, and the implementation of digital tools can substantially reduce GHG emissions. Once these susceptible processes are identified, their economic implications are considered, allowing for viable, general recommendations for industrial-level decarbonization. The decarbonization of processes can stem from both large facilities and new technologies, alongside significant benefits from incremental improvements.

2. Typology of Refineries

Crude oils are complex mixtures of hydrocarbons ranging from highly volatile simple substances to complex waxes and asphaltic compounds that cannot be distilled [33] with different molecular weights and structures and small amounts of salts, sulfur, oxygen, nitrogen, vanadium and other elements [34].
This complex mixture that we know of as oil is processed in refineries which, depending on the composition of the crude oil, requires a different treatment. This is why they can be associated with 4 different groups depending on the process units they contain. Each of them presents a different level of complexity when treating the different reagents [35].
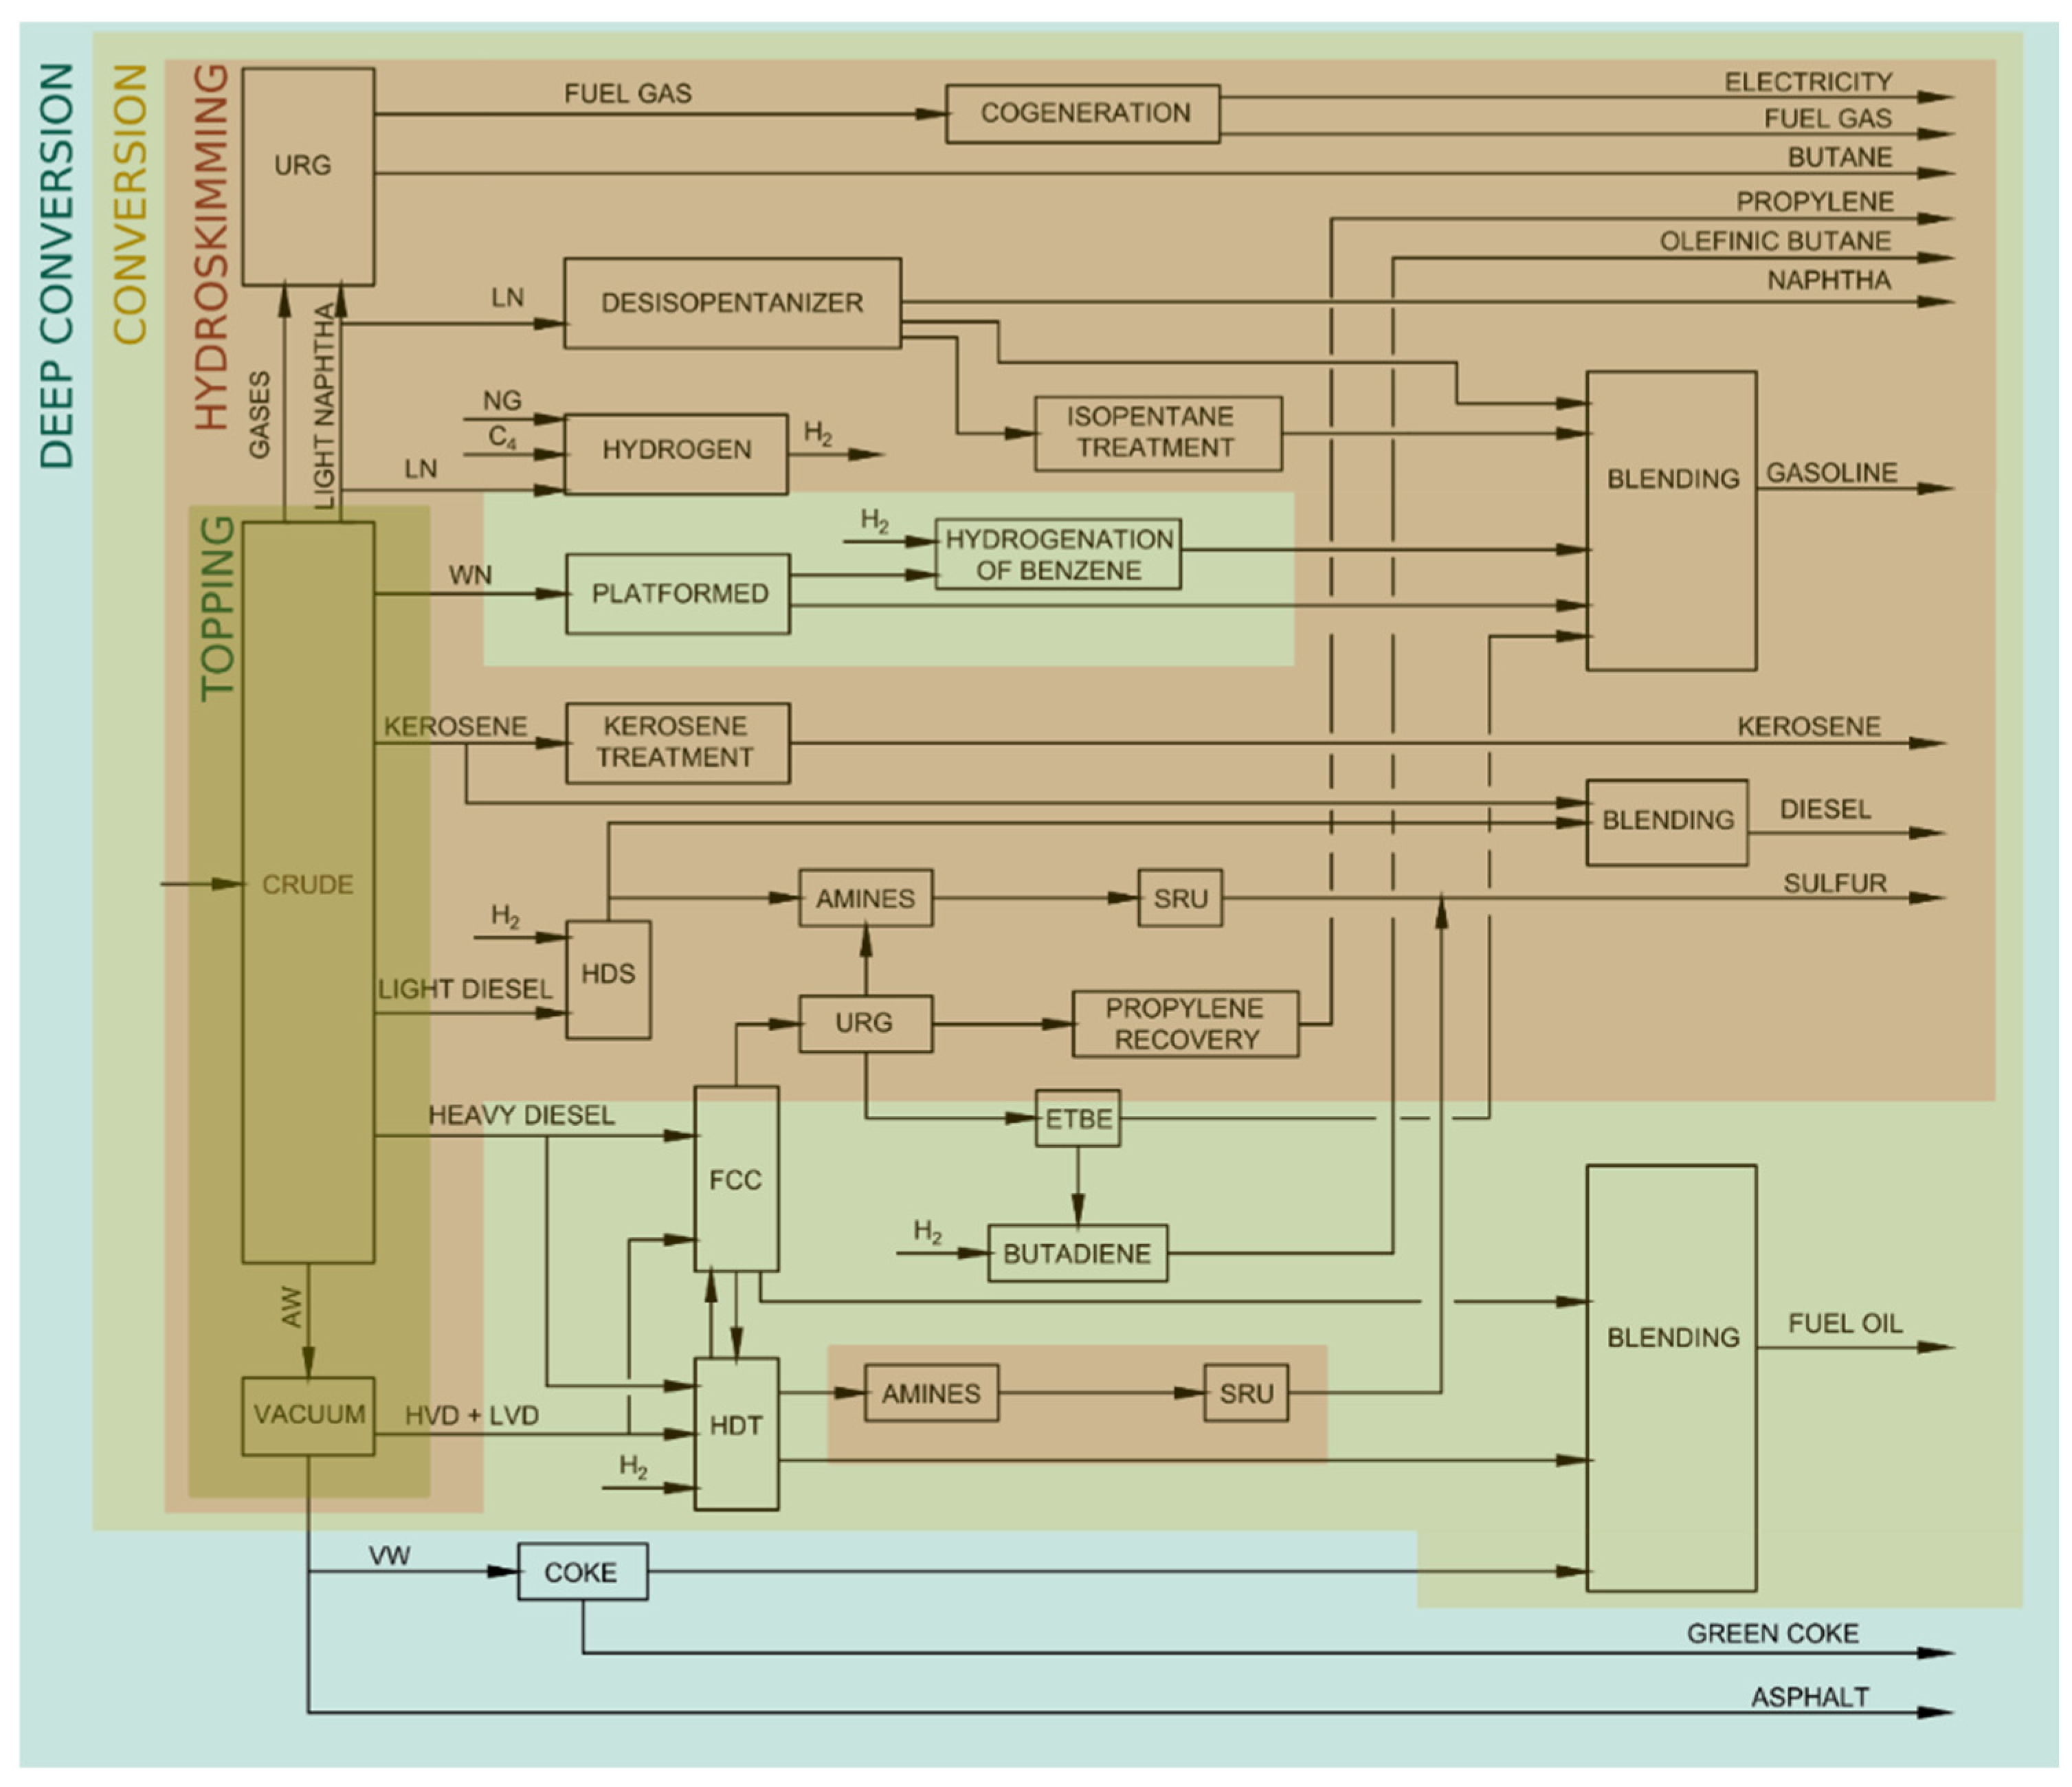
Four types are shown in Figure 1; each category of refinery presents specific characteristics increasing in complexity, for this reason each type includes all the characteristic processes of the previous typologies.
Thus, topping refineries [36,37], where the crude is fractionated, are included in hydro skimming [38], which adds the correct sulfur control. In turn, these hydro skimming refineries are included in conversion refineries [36,37], which feature processes to improve blending and optimize products. All these technologies reach their peak of development and complexity in deep conversion refineries [39].
There are two additional types of refineries with different degrees of technological development. The first is the biofuel plant [40] which can use different biological raw materials such as cereals, organic waste or even cultivated algae [41,42]. On the other hand, there are synthetic fuels [43,44], which generally combine CO2 and hydrogen for their production. There are several approaches to this technology; firstly, synthetic fuels like the current ones can be produced: gasoline, diesel and kerosene, which avoids renewing the means of transport. On the other hand, there are alternative reactions with promising capabilities that produce e-methane and e-methanol.
The addition of synthetic and biofuels may generate new classifications of refineries. Currently many plants for the new technologies are small and are not linked to conventional oil refineries despite their important similarities [45,46]. If these technologies grow in scale to meet the energy needs of society, it is foreseeable that they will be incorporated into existing refineries or that new ad hoc plants will be built to meet these new developments. This will depend on the evolution of the market incentives and the degree of technological development achieved.
A refinery can be divided into numerous process units. Figure 2 shows, according to the type of refinery, all the units that make up each of them. Topping refineries are the simplest as they only include primary distillate units, such as crude and vacuum units [47]. Increasing the level of complexity and complying with anti-pollution regulations, we find hydro skimming refineries [38], which, having the basic topping units, include gas oil and gasoline treatment units in the process, such as Hydrodesulfurization (HDS), Amines, Sulfur recovery unit (SRU), Kerosene Treatment, Reforming, Benzene hydrogenation, Desisopentanizer, Isopentane treatment, and the Gas recovery unit (URG).
Moving on to Figure 2, we find the conversion refineries [48] which, including the previously mentioned units, increase the complexity of the refinery by providing units such as Fluid catalytic cracking (FCC), Hydrotreating (HDT), Butadiene, and Propylene Recovery. In the processes of these units, gasoil fractions are transformed into light refining streams that are added to gasolines, thus increasing their yield.
Finally, in the more complex refineries called deep conversion refineries [39] all the processes described above are carried out and the Coker unit is added. In this way, the refinery can operate with zero fuel oil production, being able to give greater value to products that would otherwise be marketed at a lower price.

3. Identification of Units with Decarbonizing Potential

A modern refinery has a significant number of production and transformation units. In the world there are about 839 refineries [17] processing 88.5 Mb/day [30], which are responsible for 5% of GHG emissions. IEA forecasts [49] indicate that the demand for refined products will be reduced by 75% between 2020 and 2050. To offset these residual emissions in 2050, a CCS (carbon capture and sequestration) scenario is envisaged.
Analyzing the distribution of refineries by continents, the most advanced plants are those in the Americas, followed by those in Asia and Europe, which share a similar level of development [14]. Another group with more limited technology would be South America and Russia, and lastly, with less technological development, African refineries [50]. There is a general tendency to implement more advanced technologies such as hydro skimming and deep conversion [51] in order to meet environmental and production quality requirements.
Each refinery presents differences in terms of which units are present [37]. Although in all typologies there are many common units with the capacity to be transformed to reduce their emissions. Specifically, it has been identified that the units with the greatest potential are those that have some energy input in their process, either in furnaces or burners that normally use fuel gas or natural gas [47].
There is an opportunity to change these processes and greatly reduce CO2 emissions for refining operations [37]. It is also important to identify how process adaptations can be made, i.e., whether CO2 sequestration solutions are feasible [52,53], whether electrification is applicable [53], or whether external H2 supply can be achieved [54]; or more generally, whether the performance of a process can be optimized with digital tools [26].
In this section the most common units in today’s refineries are presented one by one to identify decarbonization opportunities. If these units, which represent the core of the process, are changed, the overall emissions of the entire refining process will be strongly reduced. Next, each of the possible actions aimed at decarbonizing the refining process are identified and discussed.

3.1. Units with Combustion

3.1.1. Crude Oil Unit and Vacuum Unit

The crudes extracted from the different oil regions are very diverse in composition, so the refining process is very different; in some cases it is simple, but in many others, it requires sophisticated equipment and instrumentation [55].
In any case, to achieve the separation of the different products that make up the crude oil, it is necessary to carry out a first distillation process that is performed in two in-line units, the crude oil unit, and the vacuum unit. In the crude unit (Figure 3), an atmospheric distillation is carried out in which the temperature is increased, and the different products are condensed at different heights in the plates. There is a bottom fraction that can be separated again in the vacuum unit, which is a distillation very similar to the previous one, but with vacuum conditions in the distillation tower. These two units working together allow for a large part of the oil compounds to be separated by density, which are then treated in subsequent units to make a correct composition adjustment [56].
The crude oil stored in tanks (1) is circulated through heat exchangers (2) to raise its temperature by taking advantage of the residual heat from outgoing product streams and then introduced into the desalter (3). In this way, any salts it may contain are eliminated. On leaving the desalter, the crude oil needs to be further heated to 350 °C in a furnace (4) and then sent to the distillation tower (5) [57].
In the tower (5), the crude oil is stratified according to density and the different products are extracted [55]. At the upper part, or top (6), the gas is extracted, which will later be condensed in air coolers (7) and sent to a tank (8) and from there to the gas unit (9).
In the different plates that belong to the tower, we obtain kerosene (10), diesel (11) and HGO (heavy gas oil) (12) and in all of them, we have a stripper in which, through a controlled steam injection (13), we adjust the products to the flash and distillation specifications. Kerosene output is sent (13) to Kerosene Treatment unit to sweeten it by removing hydrogen sulfide. The diesel is sent (14) to HDS for desulfurization and the HGO is sent (15) to HDT for desulfurization as well. The treatment of these products is performed eminently to meet environmental requirements and anti-pollution measures [55].
The bottom of the tower also receives a steam injection (16) to help better separate the bottom product from the HGO. The bottom product is referred to as atmospheric residue and is sent (17) in-line to the vacuum unit for further distillation.
The vacuum unit [56] operates in a similar way to the crude unit; it has a preheating train (18), furnace (19) and tower (20) for distillation, but the tower works in this case at negative pressure to favor distillation. To obtain the vacuum, ejectors (21) with steam (22) are used, which subsequently condense (23) the gases and accumulate in a two-phase vessel (24). The gas part (25) is sent to burn in the furnace and the liquid part (26) is sent to an acid water treatment plant.
The first extraction (27) of the tower [58] corresponds to LVGO (light vacuum gas oil) and the second (28) to HVGO (heavy vacuum gas oil). Both streams have refluxes (29) to the tower to control intermediate temperatures of the plates and pass through exchange trains (30) to transfer heat with the load to be more efficient in the process. Finally, they merge into a single process stream (31) that is sent to tanks for further desulfurization [59].
On the lower plate we have the slop wax (32), which only refluxes to the tower and has 2 functions:
  • Establish an optimum tower cooling temperature at the reflux point.
  • Eliminate with this reflux the heavy metals that may rise to the upper plates.
Finally, at the bottom of the tower we inject stripping steam (33) and extract (34) the VR (vacuum residue) [60]. This residue has two possible uses depending on the specified demand:
Asphalt: Depending on kiln temperature and tower pressure.
Coke loading.

3.1.2. Platform

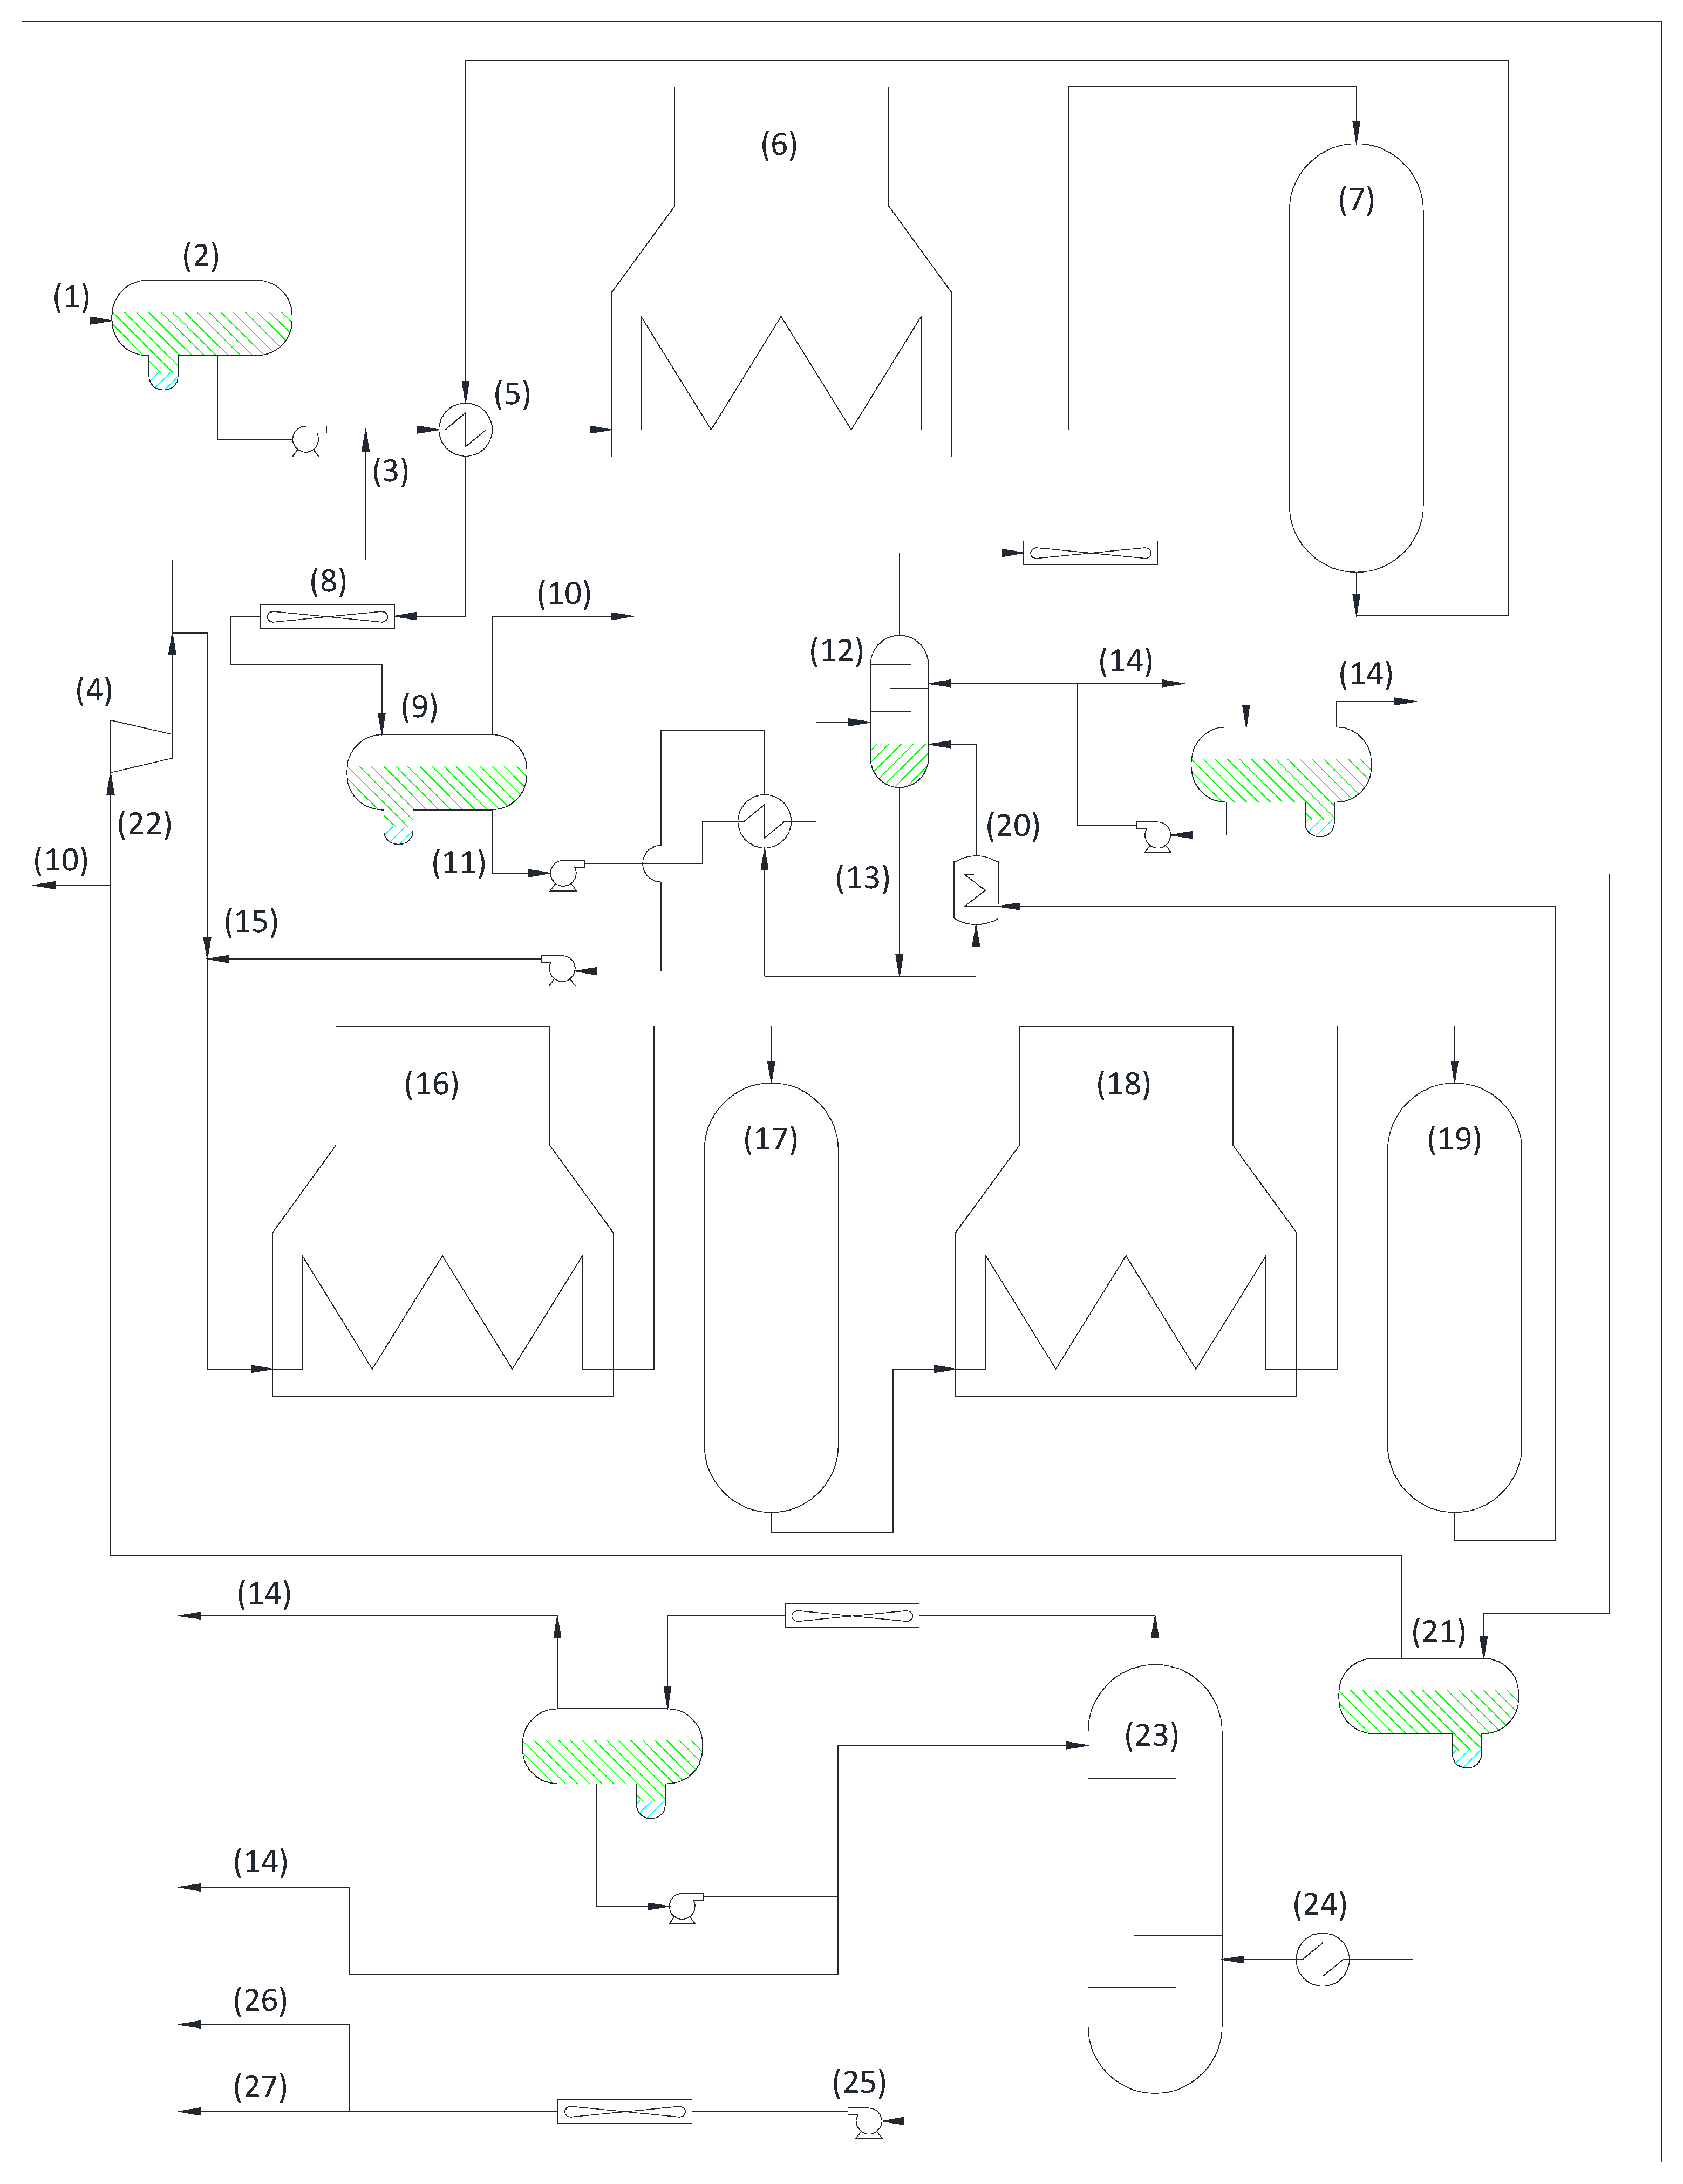
The platform unit is loaded with naphtha from the crude oil unit. This naphtha contains sulfur and is low octane, so it is essential to adjust these parameters to meet both environmental and process specifications in order to obtain a marketable product [49]. Figure 4 shows schematically the process flow of the platforming unit:
The platforming unit is separated into 2 sections: Unifiner and Platforming [61]. In unifiner the sulfur content in the naphtha is removed. For this purpose, the (20) naphtha (1) is received in a container (2) and is sent together with an injection of H2 (3) from the unit’s own compressor (4) to a preheating train (5) and to a furnace (6), where it will reach the necessary temperature for the subsequent reaction in the reactor (7) [62].
At the reactor outlet, the naphtha-H2 mixture passes through an air cooler, (8) and the two-phase mixture is collected in a high-pressure vessel (9). The gas zone in the vessel is sent to the fuel gas collector (10) for utilization.
The liquid part (11) is sent to a stripper (12) where we will obtain water-free desulfurized naphtha at the bottom (13), and at the top of the stripper we will obtain gas that will be sent for reuse as LPG (Liquified petrol gas) to the gas unit (14) in gaseous and liquid form.
The platform section [63] receives the desulfurized naphtha, and to adjust the octane number, it needs an injection of H2 (15) at the beginning of the unit coming from the compressor (4). This mixture of desulfurized naphtha and H2 is passed through a furnace (16) and subsequently a reactor (17), another furnace (18) again and another reactor (19). In this way the adjustment of the octane number of 100% of the naphtha is achieved [62].
At the outlet of the second reactor (19), energy is used to heat the stripper by means of a reboiler (20).
As a final part of the platforming process, the naphtha is sent to an accumulator (21) in which the gas zone corresponding to H2 is separated and sent to the suction (22) of the compressor and the surplus to the FG manifold (10), while the liquid part is removed from the bottom and sent to a stabilizing tower (23).
The reformed naphtha (adjusted octane rating) mixed with LPG enters the stabilizer and thanks to previous preheating in a steam exchanger (24), a separation takes place, removing gases through the top that will be sent to the gas unit in liquid (14) and gaseous state (14).
The bottom of the stabilizer is sent by pump (25) as a direct load to benzene (a unit specially designed to de-benzene naphtha) (26) or directly to the storage tank for further reprocessing (27).
The bottom of the stabilizer is sent by pump (25) as a direct load to benzene (a unit specially designed to remove benzene naphtha) (26) or directly to the storage tank for further reprocessing (27) [64].

3.1.3. Hydrogen

The hydrogen unit produces hydrogen to feed many units that require this gas for their desulfurization processes, such as HDT, HDS, Benzene and, to a lesser extent, the Platformed unit [65].
Without hydrogen, sulfur-free products could not be marketed as required by regulations, nor comply with SO2 emissions, which are becoming more and more restrictive.
The desulfurization reaction that is achieved in all the processes is (1):
S + H2 → H2S
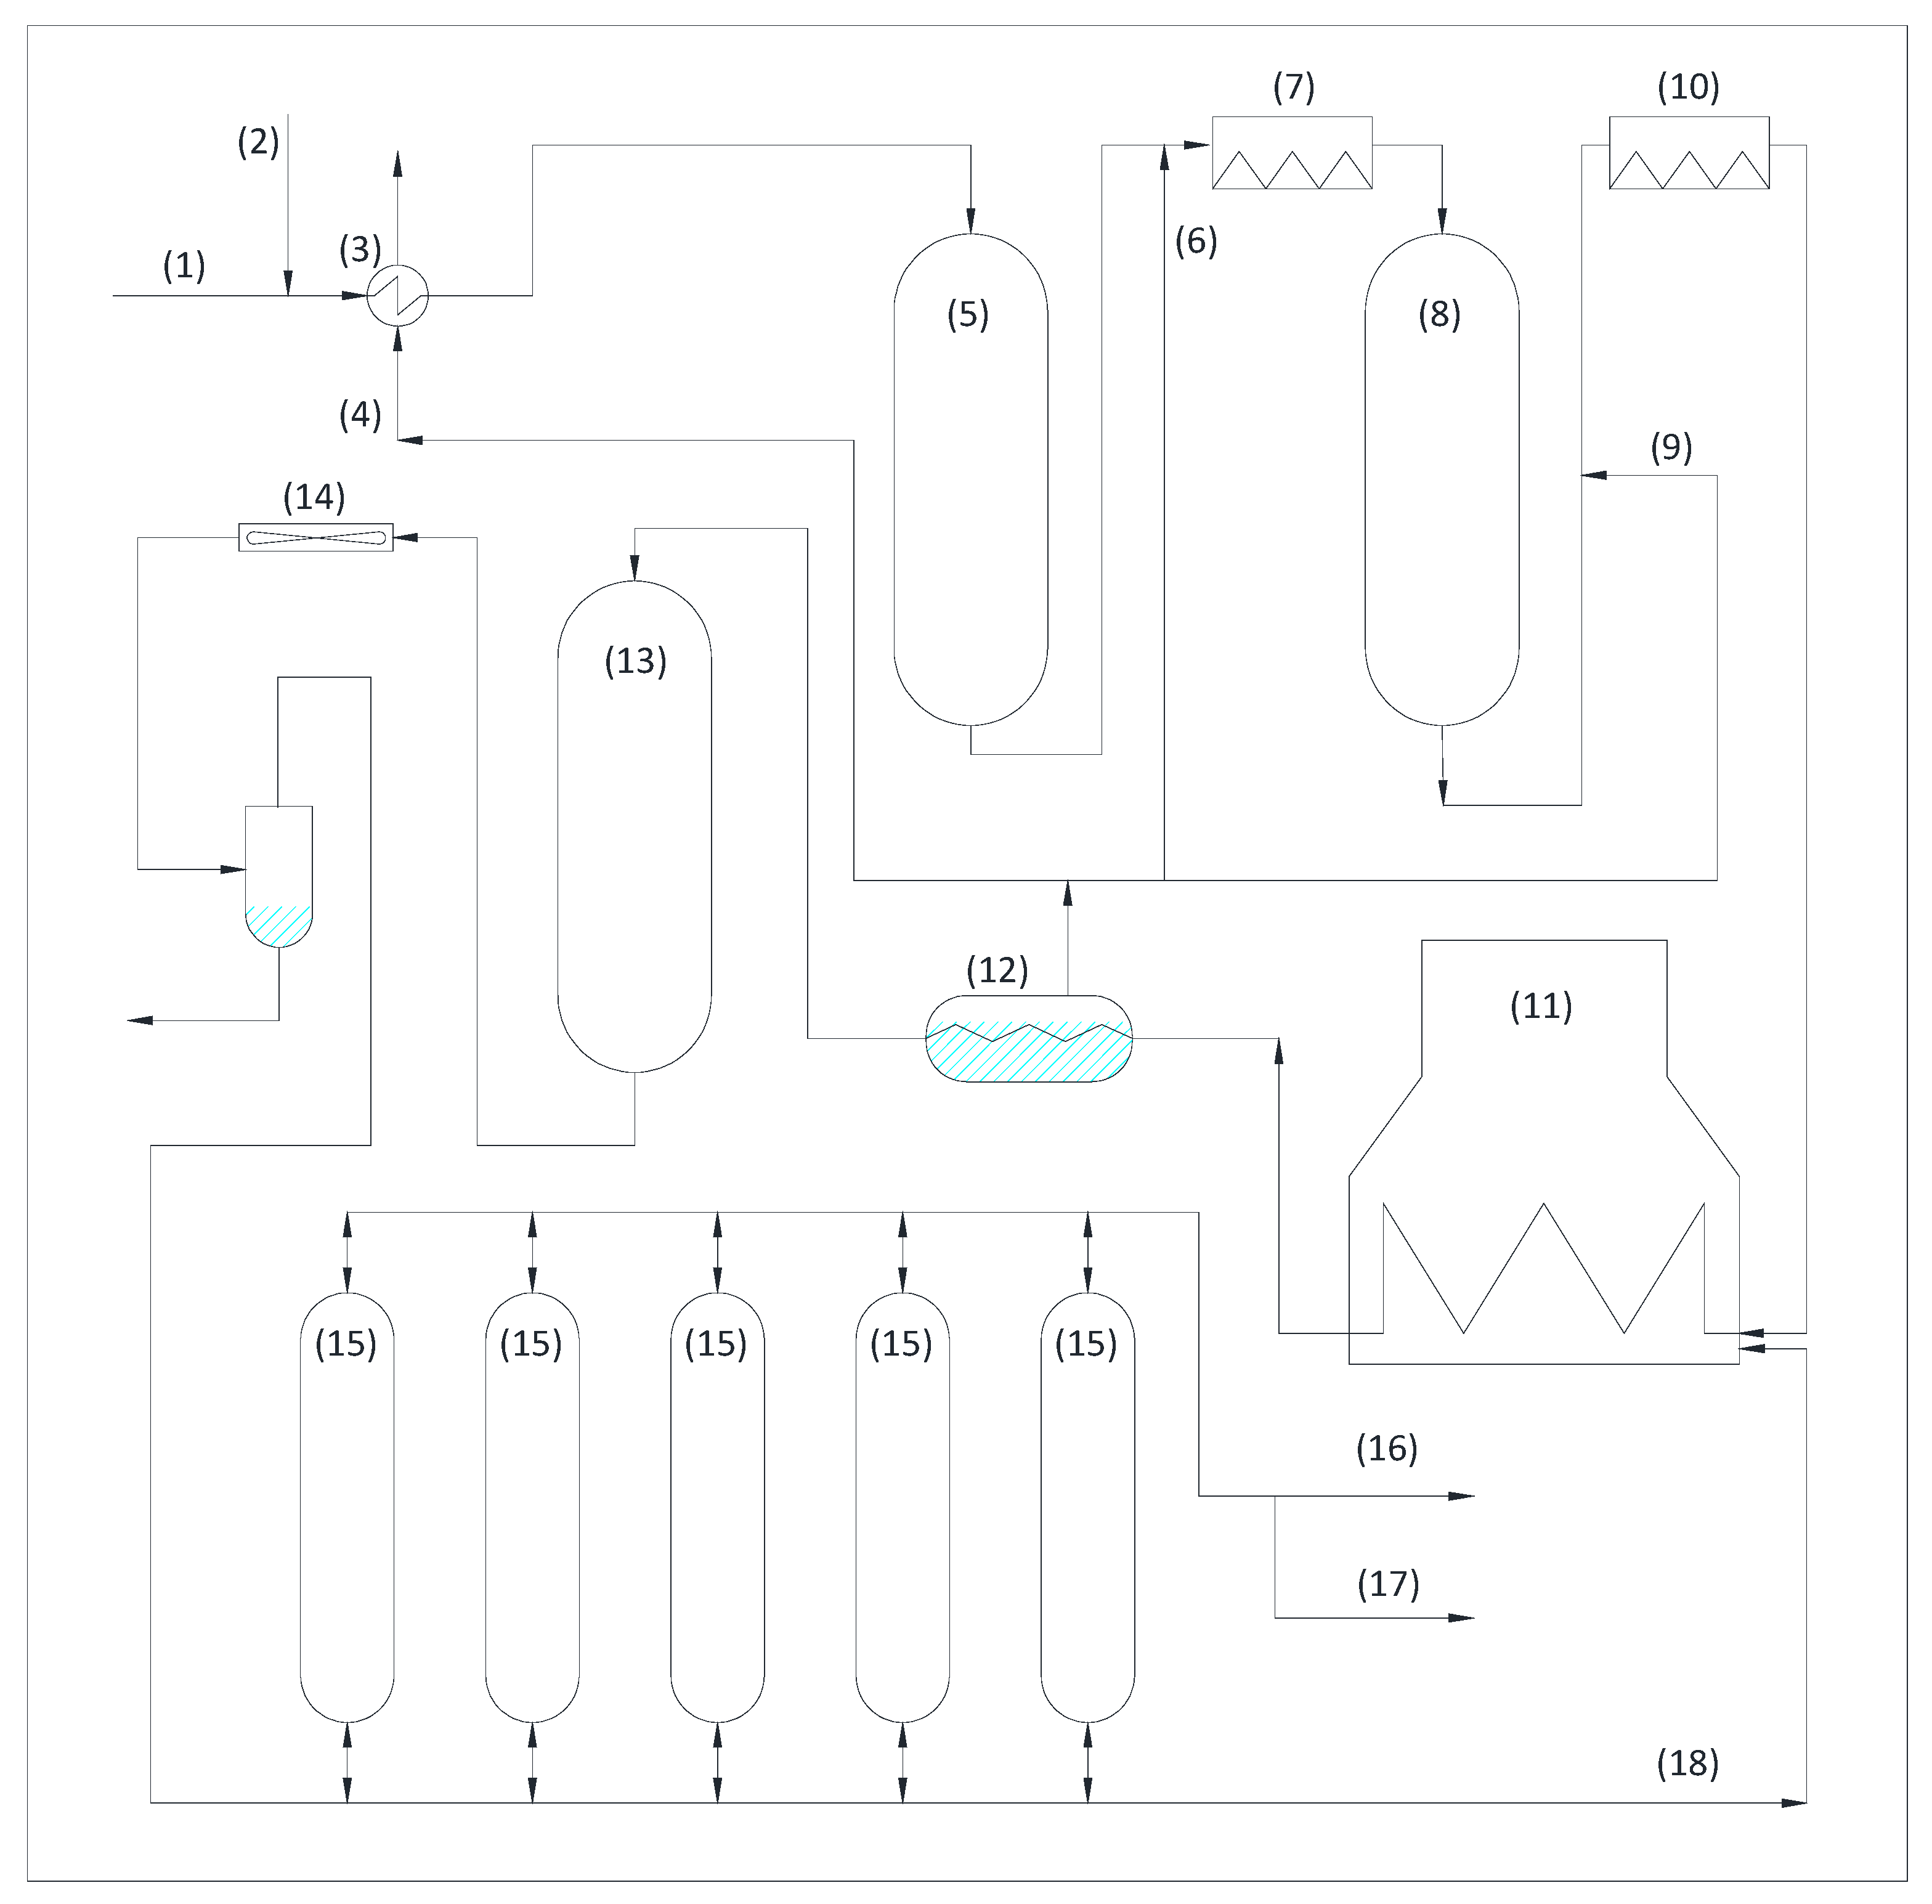
There are different ways to produce hydrogen, but when the consumption is high, the most used technology is steaming reforming [66], and it is obtained from a combination of steam and temperature applied to NG (natural gas). The corresponding flow diagram is shown in Figure 5.
The unit receives natural gas (NG) (1) and a controlled stream of H2 (2), which are mixed and preheated in an exchanger (3) with steam (4) from a boiler (12) inside the unit itself. The mixture is then sent to a reactor (5) to desulfurize the NG thanks to the contribution of H2 mentioned above [65].
At the outlet of the desulfurization reactor, (6) steam is injected into the prereforming and the mixture (7) is heated with the furnace exhaust fumes to 450 °C in order to enter in the prereforming reactor (8) under the appropriate conditions. Here the following reactions take place [66]:
CnHm + nH2O → nCO + (n + m/2) H2 − Q (Endothermic)
CO + 3H2 → CH4 + H2O + Q (Exothermic)
CO + H2O → CO2 + H2 + Q (Exothermic)
At the reactor outlet we inject steam again (9) and heat the mixture again (10). This mixture enters the furnace (11) through which the flow passes through different tubes with catalyst and ends up transforming practically all the NG into H2 and CO2. At the exit of the furnace, we take advantage of the temperature of the load to produce steam in the boiler (12) and then we pass the mixture through a converter (13) from CO to CO2 to produce more H2 according to the reaction [66]:
CO + H2O → CO2 + H2 + Q (Exothermic)
Finally we obtain a mixture called synthesis gas [65] which must be cooled to 30 °C in air coolers (14) and then sent to the PSA (Pressure Swing Adsorption) (15) where, by adsorption, H2 is separated from the rest, sending the H2 to the collector (16) when it is in specification and to the flare collector (17) when it is not, and the CO (18) is to be burned in the furnace to recover its energy.

3.1.4. Hydrodesulfurization

The restrictive environmental requirements regarding the emission of hydrogen sulfide (H2S) in combustion engines make it necessary to pre-treat diesel before it is marketed. For this, it is essential to have a unit such as the HDS (hydro desulfurization) unit [67], where it is eliminated in the form of acid gas and sent to the SRU treatment plant. Figure 6 shows the flow diagram of the unit.
Diesel (1) from crude oil enters the accumulator tank (2) and then H2 (3) is injected before passing through the heat exchangers (4) and furnace (5). It leaves the furnace at 300 °C and enters the reactor (6) consisting of a mixture of cobalt (Co), nickel (Ni), molybdenum (Mo) and the output is sent to a high temperature separator (7), where we obtain a two-phase mixture. The gas phase is sent to an air cooler (8) to condense a large part of the gas in a low temperature accumulator (9) [68]. The liquid phase part of the high (7) and low (9) temperature vessels is sent to a new low-pressure accumulator (10).
The gaseous outlet of the low temperature accumulator (9) is sent to the absorber (11) where the gases are introduced [69] at the bottom and washed with a diethanolamine (DEA) shower (12). The scrubbed gas is sent to a decanter (13) and then enters the [69] acid gas collector from which the SRU (14) is fed. This vessel has a pump (15) that recirculates the DEA to the stripper (11) and joins the minimum continuous supply (12) in line.
The common low-pressure separator (10) is composed of liquid and gas phase. The liquid phase (16) is sent to the stripper (17) to separate the desulfurized fraction from the non-desulfurized fraction. The bottom part, desulfurized diesel, is sent to tanks (18) and another part is circulated through a small furnace (19) to provide the necessary energy to the stripper to separate the light fraction from the diesel.
The gaseous fraction [67] of the stripper (17) is sent to an air cooler (20) to be condensed in an accumulator (21) and the liquid fraction is sent to tanks (22) for mixing and as reflux (23) from the stripper to control the head temperature of the tower. The gaseous fraction from the accumulator is sent to a coalescer (24) from which a compressor (25) draws and sends the gas. This gas goes together with the outlet gas from the low-pressure separator (10) to an air cooler (26), and then the liquid–gas mixture to an accumulator (27), where the gas is sent to be washed in a countercurrent tower (28) with DEA inlet (29) and outlet (30). Thus, obtaining gas free of hydrogen sulfide and being able to be sent to the fuel gas network (31) for its utilization.
The liquid phase (32), which is minimal, from the accumulator (27) is sent back to the stripper (17) for recovery.

3.1.5. Coke

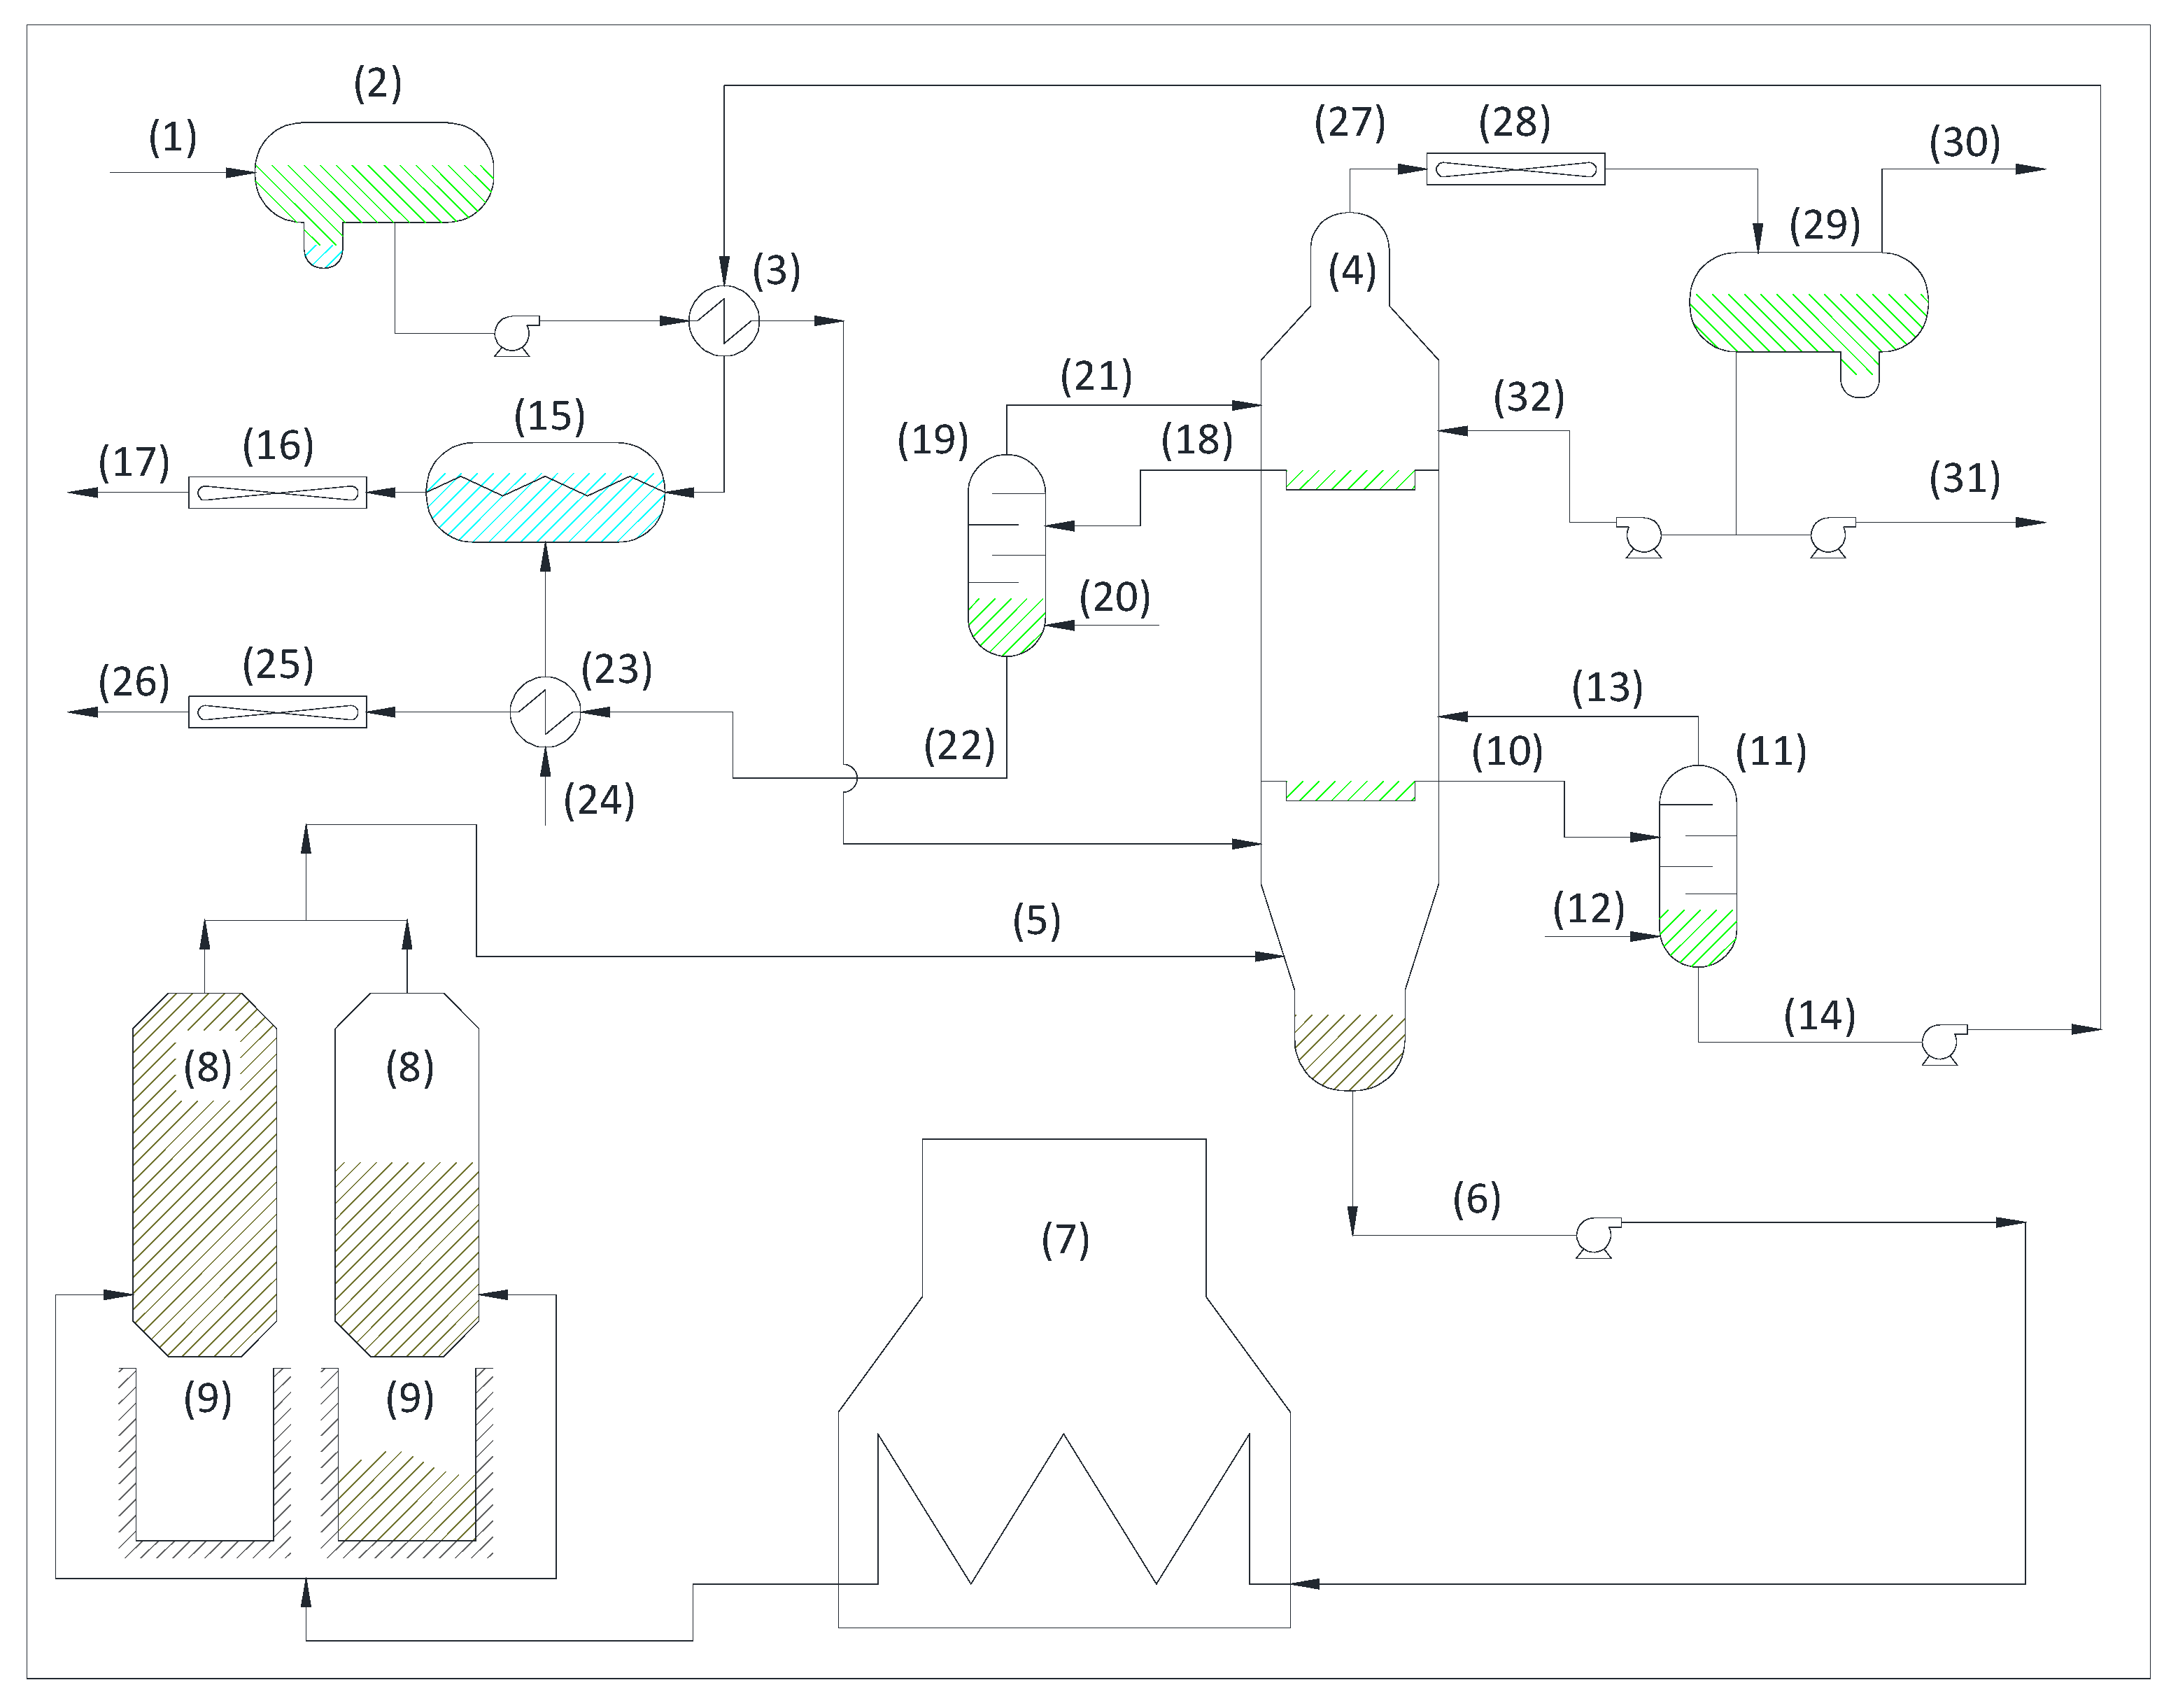
The coke unit [70] processes atmospheric residue from the crude unit, vacuum residue from the vacuum unit and decanted oil from the FCC unit as feedstock. Figure 7 shows schematically the process diagram of the coke unit.
The load (1) enters the accumulator (2) and is sent by pump through an exchange train (3) to the fractionator (4), which also receives (5) a small part of the recycle coming from the coke chambers [71].
The bottom outlet product (6) from the fractionator is sent to a furnace (7) where it reaches a temperature close to 500 °C and then it enters one of the chambers (8), where there are compromise conditions between residence time, pressure, and temperature for the formation of coke and light vapors. In this way, in one chamber the decoking takes place while the other chamber is being filled. The vapors (5) from the chambers [72] are sent to the fractionator, (4) are recycled and are washed inside the fractionator and go up the tower. Part of the vapors will condense during their ascent and will be extracted as part of the different products, and those that do not condense will exit through the top in the form of gas.
The emptying of the chambers requires that once the coking cycle has passed, the chamber must be perforated with a drill bit for subsequent emptying into a pit (9) below.
Above the washing zone [73], the Heavy Gas Oil (HGO) (10) is extracted and sent to a stripper (11) to which steam (12) is injected and the upper part (13) is sent to the fractionator again, and the liquid lower part (14) is pumped to the load preheating exchange train (3) and subsequently used to generate steam in a boiler (15) thanks to the heat it still possesses. In this way [73], energy is optimized. On leaving the boiler, it passes through air coolers (16) that cools the HGO before it is sent to the final tank (17).
In an upper plate of the fractionator [74], we obtain the output of light gas oil (LGO) (18) and it is also sent to a stripper (19) in which steam (20) is injected and thus drag the light product back (21) towards the fractionator. The liquid part (22) of the stripper is sent to an exchange (23) to preheat the boiler water (24) that will be sent to the steam generating boiler (15) mentioned above. Once the water is preheated, the waste heat from the LGO is dissipated in air coolers (25) and sent (26) to storage tanks for further processing.
Through the upper part of the fractionator [72], the gas (27) is sent to cool to heat coolers (28) for condensation and subsequent accumulation in the buffer vessel (29). The gas from the accumulator (30) and a part of the liquid (31) are sent to the gas unit, while another liquid part is sent as reflux (32) to the fractionator to control the tower top pressure and temperature.

3.1.6. Fluid Catalytic Cracking

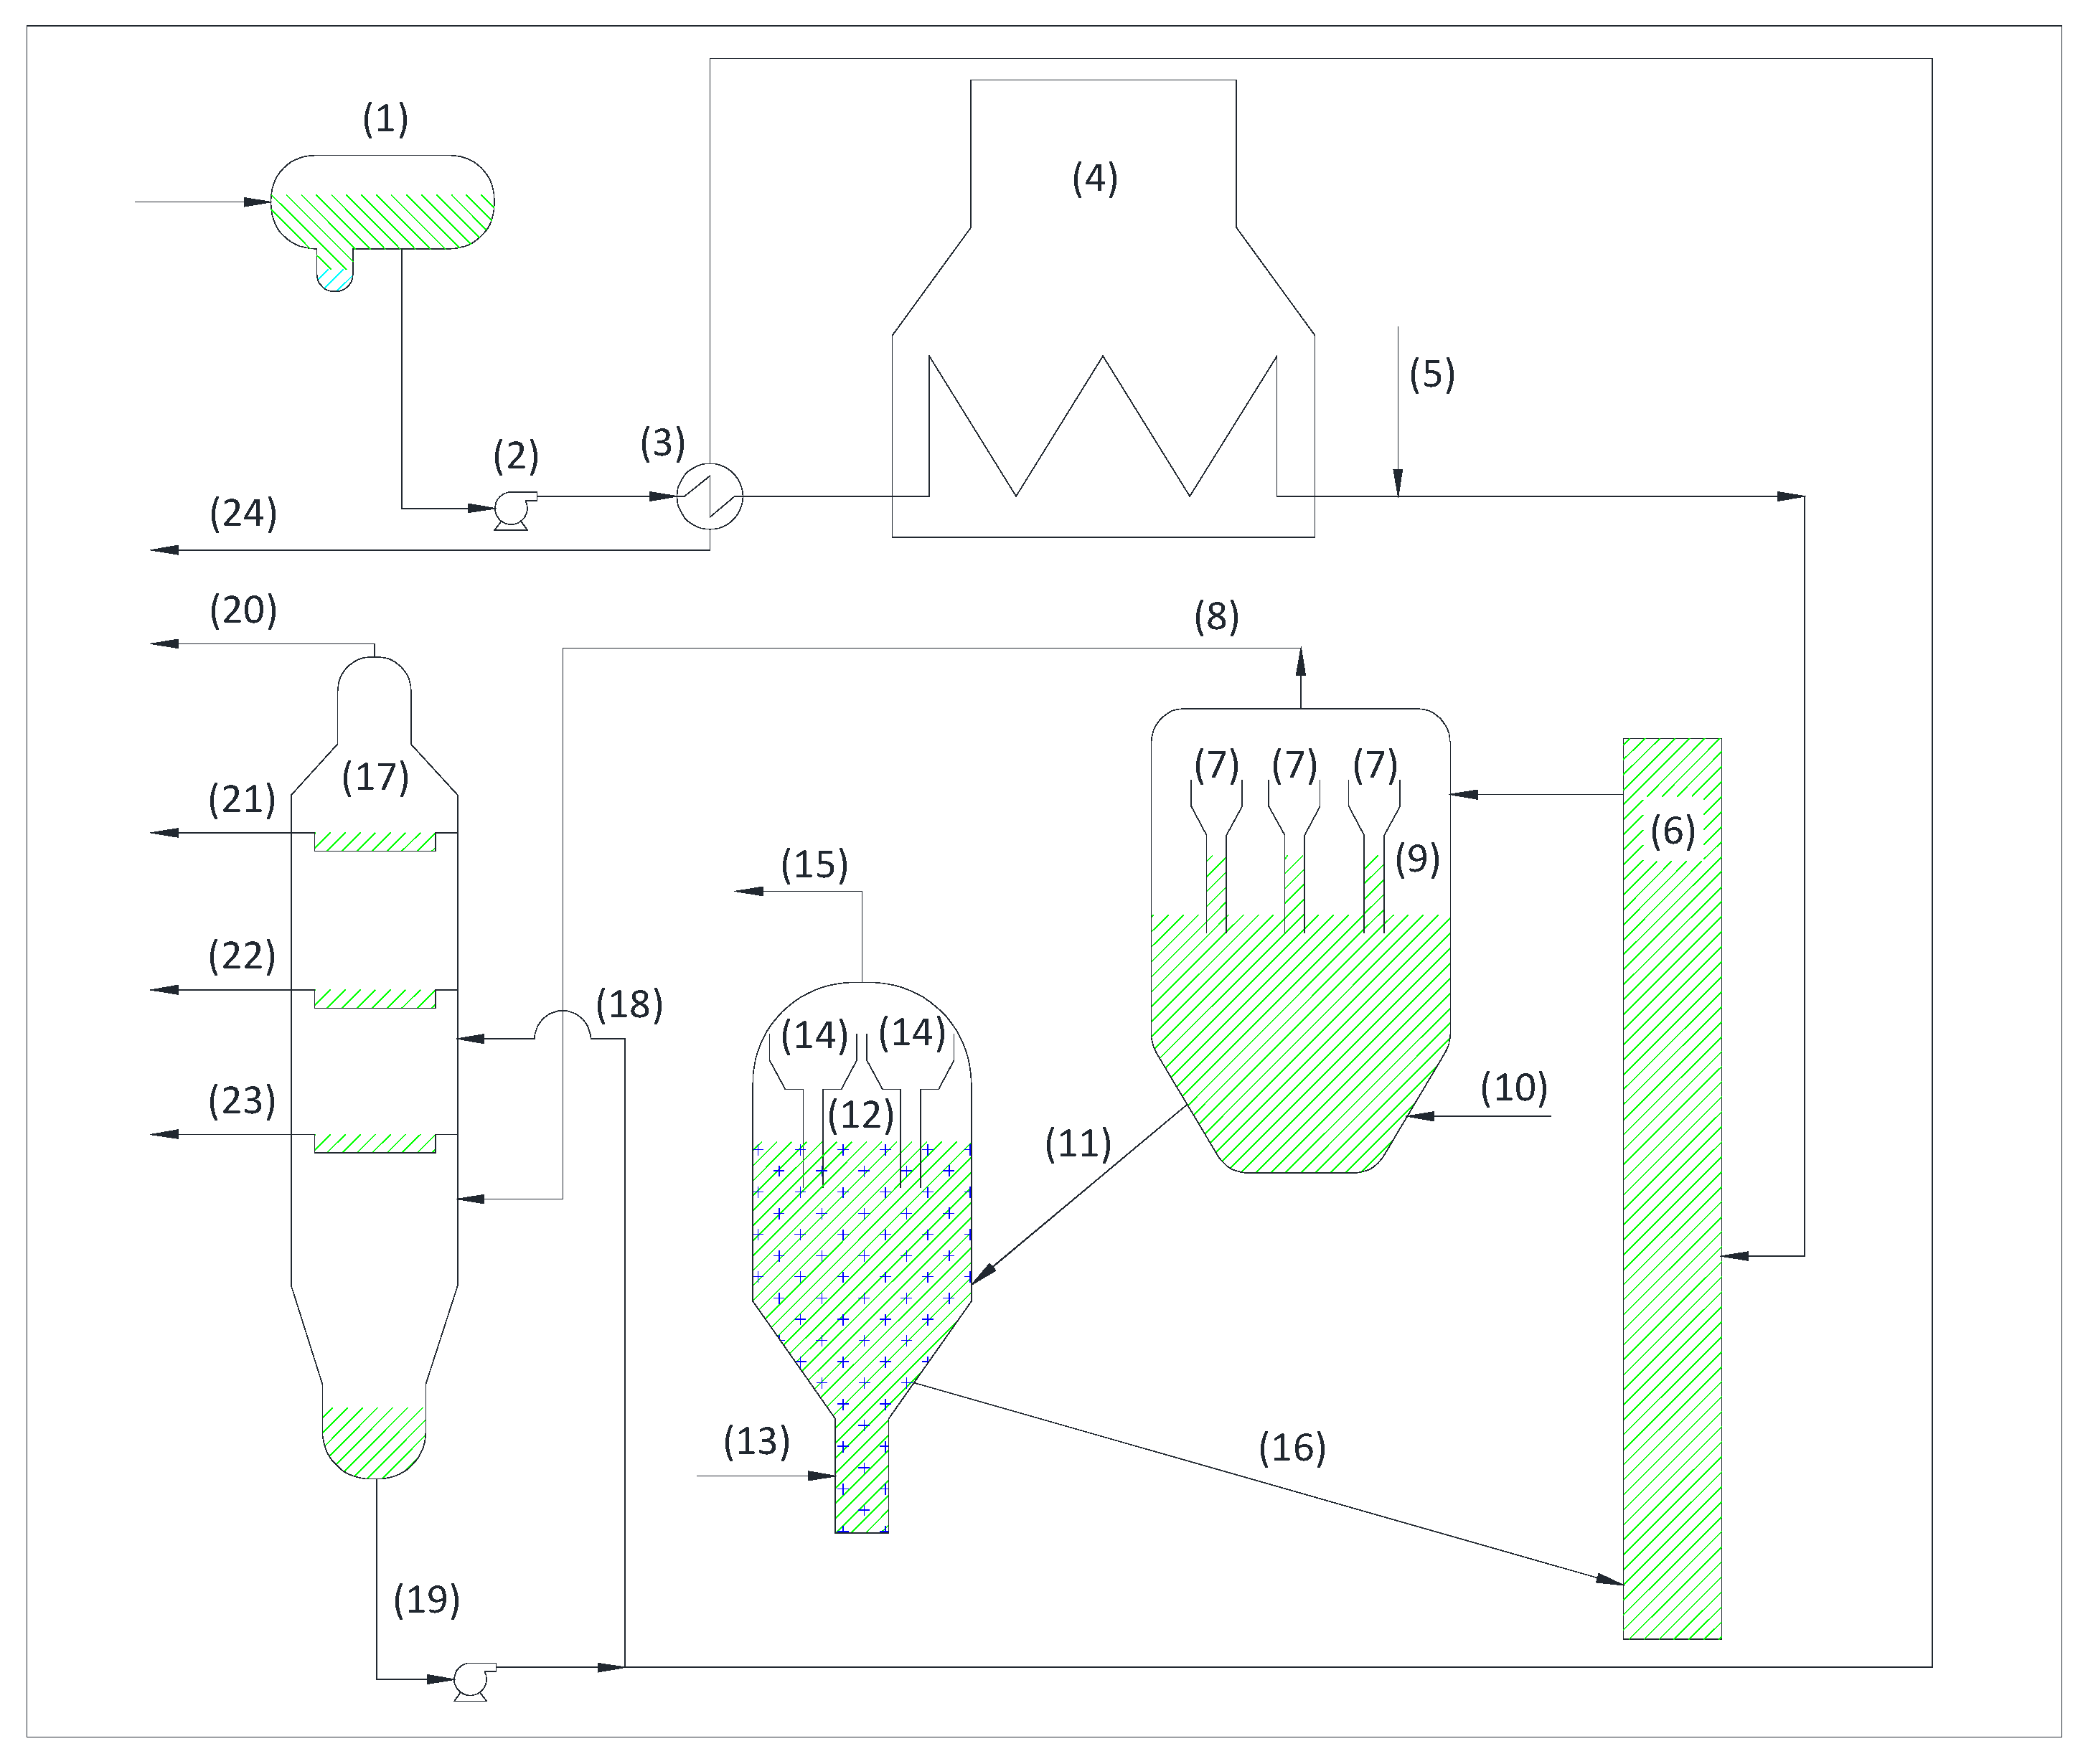
The Fluid Catalytic Cracking (FCC) unit is the unit responsible for converting diesel into lighter hydrocarbons [75] that are used as valuable transportation fuels [76]. In the process, long hydrocarbon chains are broken into shorter chains by catalytic cracking [77], for which HGO and LGO are circulated from the crude oil unit. This mixture is processed by increasing pressure and temperature to achieve the transformation. Figure 8 shows the diagram of the FCC unit.
The load is received in a buffer tank (1) and is pumped by pumps (2) to an exchange train (3) where it is preheated with the heat coming out of the fractionator and subsequently reaches the temperature required for subsequent cracking in a furnace [78] (4).
The load, once at temperature, is injected with dispersion steam (5) and enters the riser [79] (6), which is simply a pipe which the mixture rises through it, where evaporation and contact between load-catalyst (cracking) takes place. The upper part of the riser ends in cyclones (7) where the separation between the hydrocarbon vapors and catalyst takes place, thus avoiding the recracking of naphtha to the catalyst lighter products. The vapors exit through the top (8) and the spent catalyst flows to the bottom of the stripper (9) for regeneration.
In the lower zone of the stripper, steam (10) is injected to promote the circulation of the catalyst through the stripper and to release the hydrocarbons that may arrive entrained with the catalyst. This current also exists through the stop outlet (8) mentioned above.
The spent catalyst exits (11) from the stripping section and passes to the regenerator (12) to which air (13) is supplied in a controlled manner to burn the carbon entrained in the catalyst and thus regenerate it.
The combustion gases from the catalyst carbon (flue gas) circulate towards the top of the regenerator [79] where the cyclones [80] (14) are located to separate the flue gas and catalyst. The flue gas leaving the top of the regenerator (15) will be used to move an expansion turbine coupled to a generator, thus producing electrical energy.
In the lower part of the regenerator, the regenerated catalyst [81] (16) is obtained and sent to the riser (6), initiating a new cycle.
The products coming out of the stripper (8) are sent to the fractionator (17) to separate them and improve the utilization of the plant’s products.
In the fractionator [82], we have a mixture of hydrocarbon vapors and steam, so these vapors rise and cool with a reflux current (18) from the bottom (19). Thus, in descending order, we obtain the different products which are: LPG (20) and unstabilized naphtha (21) which is sent to the gas unit for treatment, light gas oil (22) which is sent to the HDS unit, heavy gas oil (23) which is sent to the HDT unit, and decanted-oil (19), the latter being sent to tanks (24) to be used as Fuel Oil diluent.

3.1.7. Hydrotreating

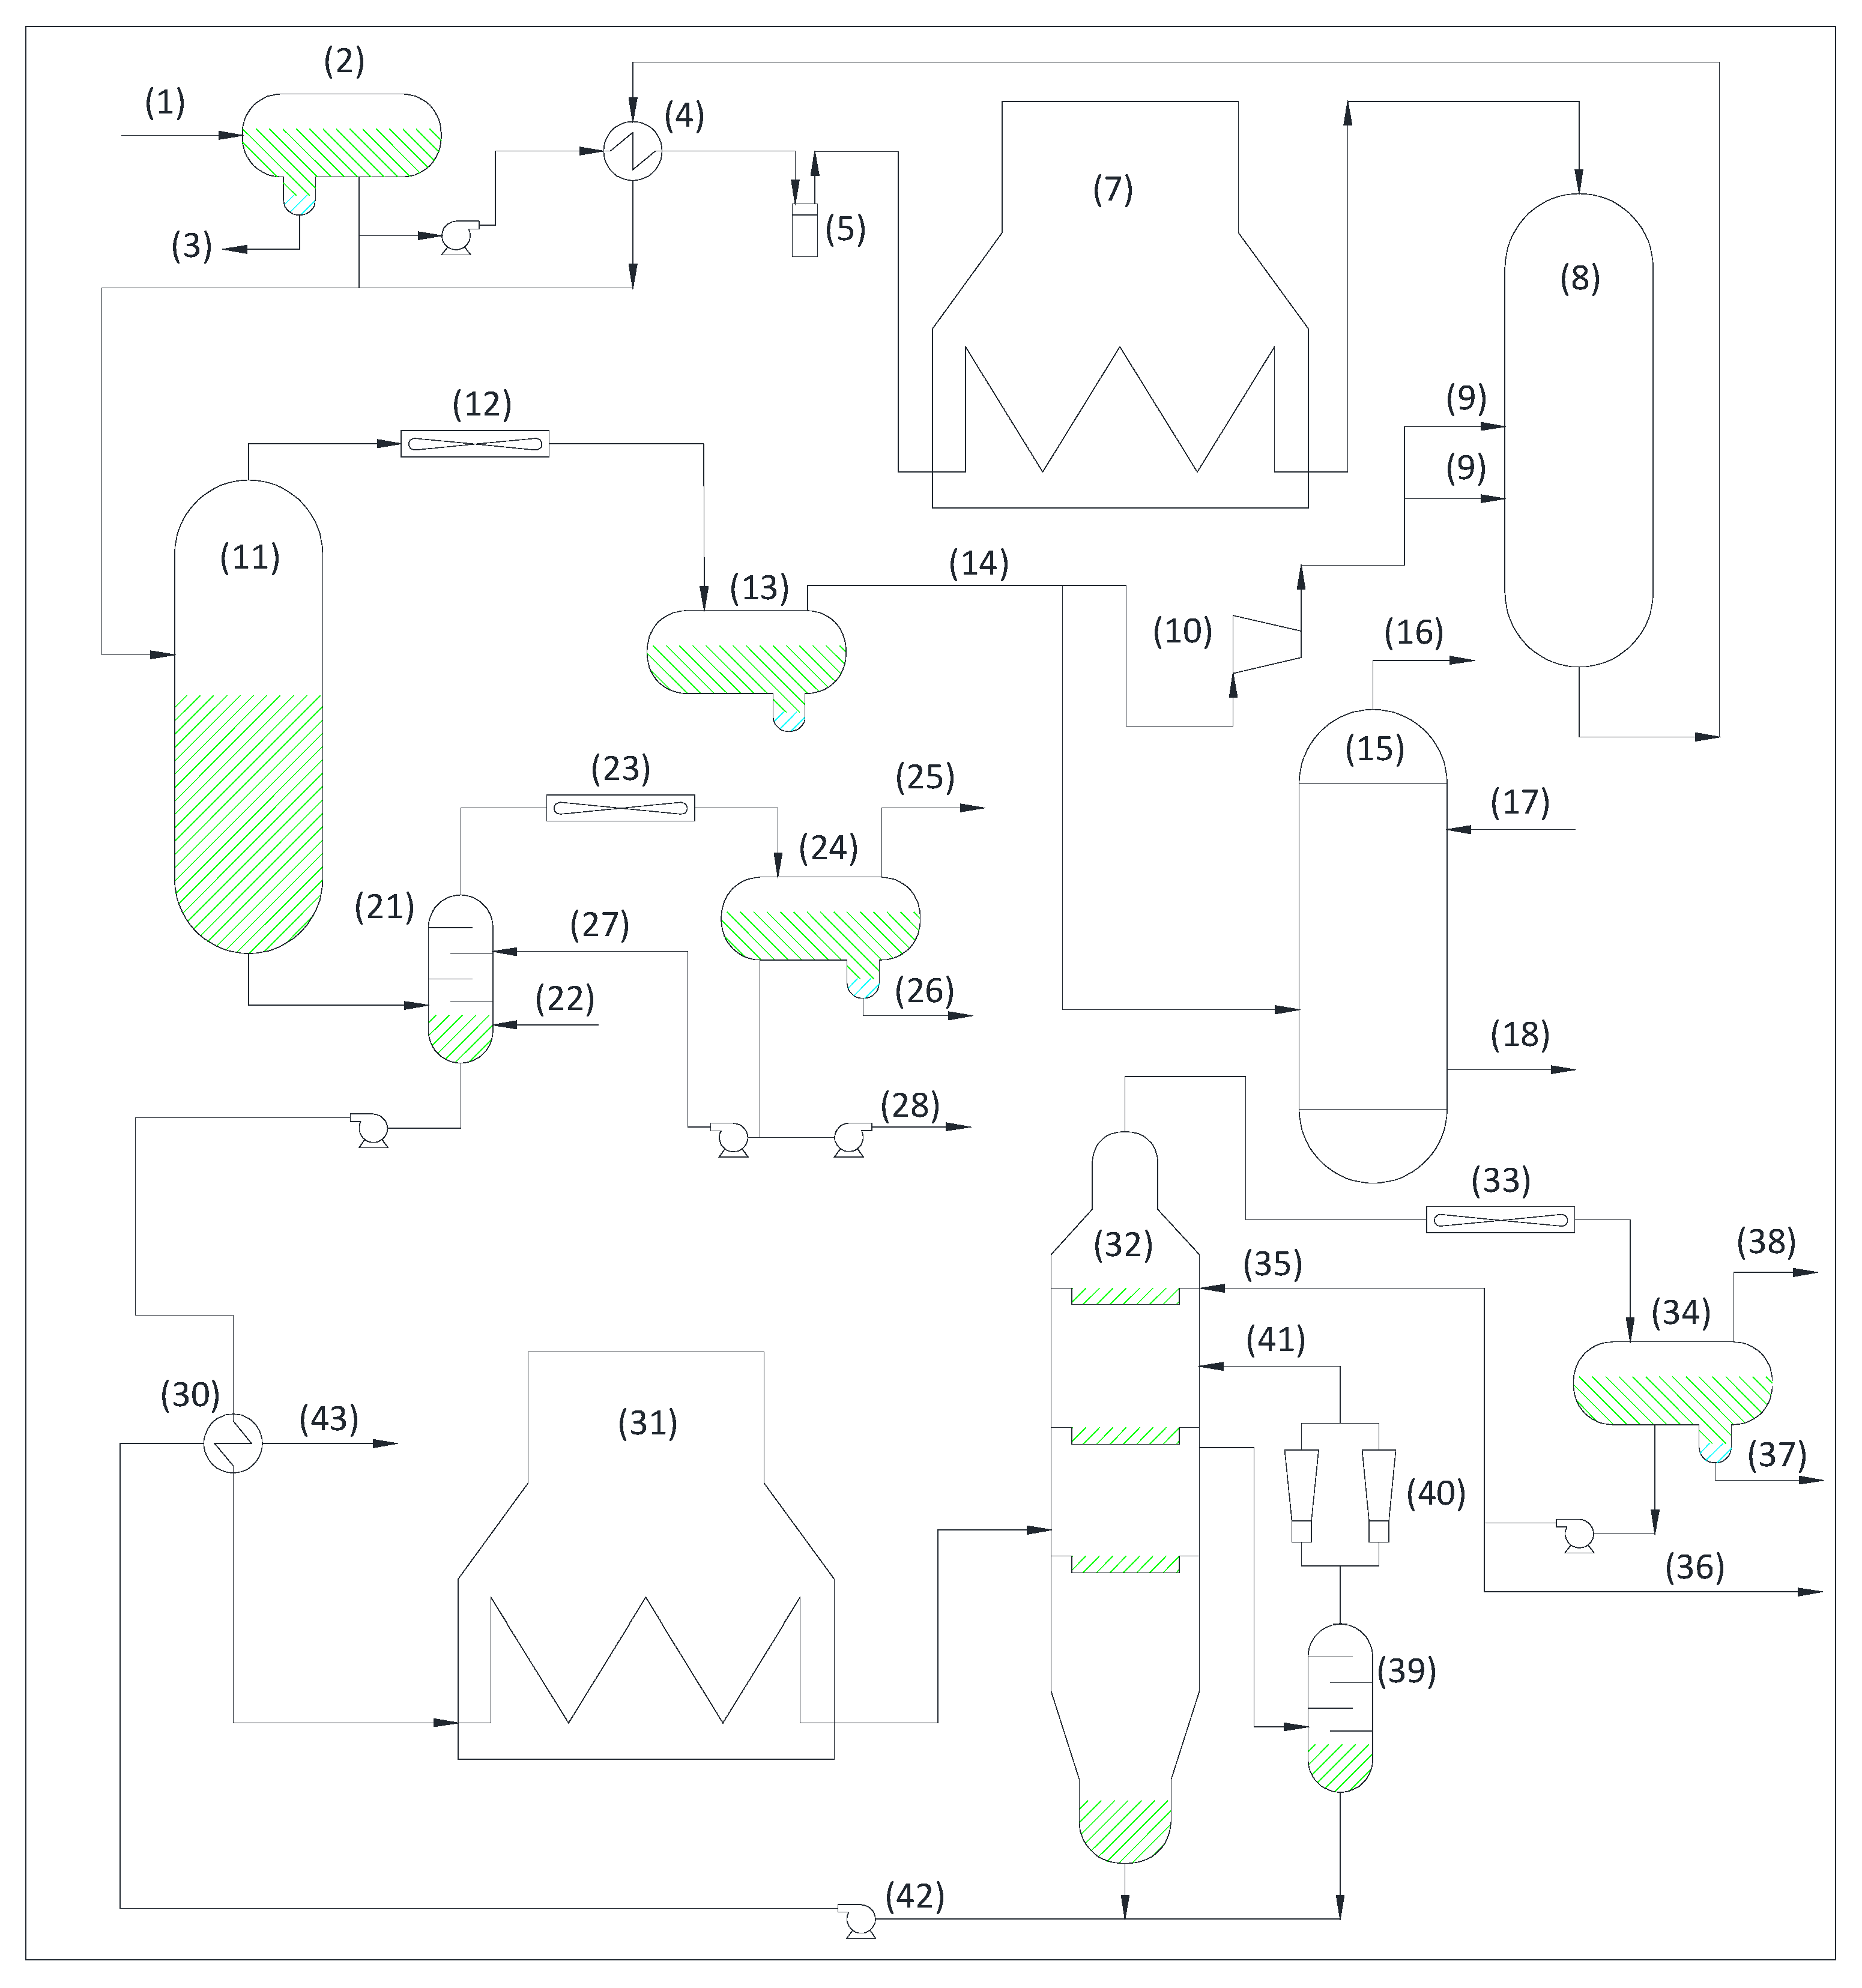
In the HDT unit (Figure 9) the aim is to hydrogenate [83] sulfur, nitrogen and oxygen compounds and eliminate metals that may be contained in the gas oils processed by the plant, thus reducing their pollutant load, and obtaining products that comply with environmental legislation.
The feedstock (1) to the hydro transformer unit [68] of heavy and light gas oils is made from vacuum distillation units and crude oil, which is sent to a buffer tank (2) where any possible moisture carry-over is decanted and emptied (3) into the acid water system for reprocessing.
The outlet of the buffer tank is pumped and passes through a heat exchange system (4) and a filter (5) to optimize energy and purify impurities [61]. At the filter outlet, the recycle gas (6) necessary for desulfurization is supplied and the process continues towards the furnace-reactor [84] (7), where we obtain the energy necessary for the subsequent conversion in the reactor (8), which is arranged in different beds, where desulfurization, denitrification, saturation of aromatics and hydrocracking will take place. These reactions are exothermic, so it is necessary to have a recycle gas (9), injected at different heights of the reactor to avoid temperature deviations in the reactor.
At the reactor outlet [36], the heat is transferred to the exchange train (4) mentioned above and then passes to a hot separator (11) where the gas part is sent to condense to some air coolers (12) and accumulate it in a new buffer vessel. (13). In said vessel, the gas zone (14) is sent to the recycling compressor (10) and to be washed with DEA in the absorber (15), sending the resulting gas to the FG circuit (16). The lean DEA inlet (17) is from the upper part and the rich DEA outlet (18) from the lower part.
The outlet (19) at the bottom of the stopper vessel (13) meets the liquid outlet (20) from the hot separator (11) and is sent to the stripper (21). This feed [69] to the stripper still contains hydrogen sulfide to a lesser extent, but it must be removed, for which purpose steam is injected (22) at the bottom, thus causing the light to rise up the tower and exit at the top.
The buffer exhaust gases are sent to condense in air coolers (23) and then decanted in the buffer accumulator (24), in which a liquid–gas mixture remains. The gaseous part is sent (25) to the gas unit for processing. The water accumulated in the buffer vessel (24) as a result of steam addition in the stripper, is sent to acid water treatment (26).
The liquid part of the buffer accumulator [61] that is not water is sent as a reflux stream (27) to the stripper (21) and another part is sent (28) as naphtha to the gas’s unit.
The bottom (29) of the stripper is pumped to an atmospheric distillation tower (32) after passing through a heat exchange system (30) (with tower bottom) and a furnace (31). The furnace outlet temperature is around 380 °C and this is necessary for proper subsequent distillation in the tower [69].
The load enters the tower (32) through the intermediate zone [85] and there is a pressure drop at the tower inlet, caused by the pressure differential between tower and pump drive. The tower operates at 0.4 bar while the stripper bottom outlet pump (29) drives at 15 bars. In this way, the light particles rise and exit through the top in the form of gas. This gas passes through air coolers (33) to condense and ends up decanting in an accumulator (34) in which the liquid and gas phases coexist [68]. The liquid part is sent as reflux (35) from the top to the tower and the rest (36) as naphtha to storage tanks. The decanted water in the buffer accumulator boot (34) is sent (37) to the acid water treatment system.
The gas side of the buffer accumulator (34) is directed to the flare system (38). The deliveries should be kept to a minimum as practically all the naphtha will condense in the air coolers (33).
In the intermediate zone of the distillation tower (32), diesel oil is extracted towards a lateral stripper (39) that works at low pressure thanks to steam ejectors (40) that cause a pressure drop in the stripper, causing the light oil to rise (41) towards the top and continue the circuit mentioned above. The bottom of the tower (42) together with the bottom of the stripper is sent through heat exchangers (30) to help optimize energy efficiency before being sent to storage tanks (43) such as Vacuum Gas Oil (VGO) [85].

3.1.8. Identification of Decarbonization Potential in Combustion Units

The units described above have in common the existence of furnaces, so they work at high temperatures and with large total emissions, mainly CO2 [86]. The decarbonizing potential is therefore very high, and it is essential to be able to reduce or even eliminate these emissions. Table 1 shows the Summary of the decarbonization potential in units with combustion and reflects different possible points of action to mitigate emissions:
The table shows that the main decarbonizing potential [15,23] comes from the electrification of the processes analyzed, with the crude oil unit and vacuum unit standing out in this regard. The processes with the highest degree of complexity have been identified: Hydrogen and FCC units. These units with catalytic processes also present capacity for improvement linked to new catalysts [87]. In addition, different processes have been identified, such as exhaust gas treatment and heat transfer, which could allow a significant reduction in CO2 emissions, with the possibility that this gas could be captured a posteriori [88]. Another action that could result in these benefits is the implementation of a digital twin, which would be able to analyze the process and optimize energy consumption.
It should also be noted that several of these units can use hydrogen from renewable sources, which has a great impact on reducing the carbon footprint of the process in global terms [89].

3.2. Non-Combustion Units:

3.2.1. Identification of Decarbonization

There are many units that are eminently catalytic in nature and have low or even zero gas consumption. However, certain elements with decarbonizing potential can also be identified in each of the units:
GASES: This unit [90] mainly receives the outgoing gaseous stream from the crude oil cap composed eminently of propane, butane and light gases; it subsequently compresses it in different stages to convert it into LPG (liquefied petroleum gas) and is used to feed the furnaces of the different units that consume it. The surplus is marketed mainly in the form of propane or butane.
ETBE: ethyl tert-butyl ether. This unit [91] adjusts the octane rating of gasoline to meet the product specification without the need for heat input.
DEISOPENTANIZER: In this unit, isopentane is extracted [90] from the light naphtha received from the crude unit. This isopentane is used for gasoline blending [92]. This unit consumes steam to achieve distillation in a tower, and this involves a large amount of energy.
ISOPENTANE TREATMENT: This unit [93] processes the naphtha coming out of the upper part of the deisopentanizer unit and the purpose is [94] to eliminate the hydrogen sulfide and mercaptans that may be contained in the naphtha in order to adapt the final product to the characteristics required by the anti-pollution directives.
AMINES: The amine unit [94] is an in-line DEA washing treatment unit. This DEA is enriched (DEA rich) of hydrogen sulfide in the HDT and HDS units and the aim is to extract this hydrogen sulfide obtaining a stream of acid gas to be sent to the SRU for treatment. The resulting DEA is referred to as a poor DEA [95].
PROPYLENE: The propylene unit [96] receives all the olefinic propane fraction coming from the gas unit. This olefinic propane is nothing more than a mixture between propane and propylene plus other small fractions, mainly ethane, ethylene and propadiene. Propylene is marketed for the production of plastics and its purity is very important. Therefore, as a general rule, the more [97] the propylene tower contains, the higher the purity of the product and, therefore, the higher the market value.
KEROSENE TREATMENT: The kerosene treatment unit receives kerosene from the crude oil unit and the purpose is [98,99] to convert corrosive compounds such as sulfur into non-corrosive and stable compounds such as disulfides, thus obtaining a sweetened final product.
BENZENE: In the benzene hydrogenation unit, the aim is to reduce the benzene content [100] in the naphtha coming from the platform unit to 0.6% by volume. Current regulations prevent the commercialization of naphtha with benzene, so this unit is necessary to adjust this compound in naphtha [101].
SRU: Sulfur recovery unit. The SRU [102] seeks to minimize SO2 emissions from the refinery to the atmosphere by treating H2S [103] hydrogen sulfide gas from the HDS and HDT units and obtaining as a product waste gas with lower SO2 and liquid elemental sulfur content. A series of burners and reactors operating in line are used for this process.

3.2.2. Identification of Decarbonization Potential in Non-Combustion Units

All these units produce significant energy consumption, especially those that consume steam. Table 2 below identifies decarbonization possibilities in relation to each of the units analyzed.
In the table we can see how, as in the units with furnace, the greatest challenge to decarbonize the process is electrification, highlighting the effect on the process in the Amines unit [94]. In these units, exhaust gases do not exist or are of low quantity, so their treatment or capture is not relevant. As for the contribution of renewable H2, only the Benzene unit [104,105] would consume a small amount. The major improvement capabilities are focused on the catalytic processes and the optimization of heat exchanges. It should be noted that the implementation of a digital twin [89] could favor the optimization of the plant operating parameters.
In order to provide a clear overview of the main technological pathways and strategies to improve energy efficiency and reduce CO2 emissions in oil refining processes, Table 3 summarizes the key methods analyzed in this study. These include traditional improvements such as electrification and heat integration, as well as emerging solutions like renewable hydrogen use, advanced combustion technologies, carbon capture and storage, and the integration of biofuels and synthetic fuels.

4. Analysis of Possible Actions for Decarbonization

The decarbonizing potential in refineries is a determining factor when setting new emission reduction milestones in the refining industry for the coming years. To this end, it is necessary to differentiate the most relevant points in terms of tons of CO2 emitted into the atmosphere by each process unit. CO2 (Carbon Dioxide) is the primary GHG (Greenhouse Gas) emitted by oil refineries, accounting for around 98% of their total emissions. If refineries operated as usual, global refineries would cumulatively emit 16.5 Gt during 2020–2030 [76]. Recent studies also highlight the importance of regionally tailored mitigation scenarios, such as those developed for the Chinese refining sector, which combine life-cycle analysis and process-level modeling to propose optimized emission reduction pathways under different policy contexts (Zhao et al., 2023) [106].

4.1. Improvement Proposals for Decarbonization

The balance of CO2 emissions in the refineries has its greatest contribution in the emissions caused by the combustion of NG in the furnaces [107]. Chemical emissions from catalytic units such as H2 are also very relevant. There is an additional focus of emissions that corresponds to the production of electricity and steam, necessary for many secondary processes of the units. All these processes have a wide margin for improvement in order to implement new technologies that would result in a reduction in emissions, such as electrification or CO2 capture [108].
One of the largest consumers of low-grade energy in a refinery corresponds to the heating of lines and reboilers using steam. If that energy input were provided by electric resistances, the overall CO2 impact would be significantly reduced [109].
Another strategy to follow for reducing emissions would be to try to integrate renewable energy sources. Refineries can invest in different wind farms and thus obtain clean electricity to power various equipment without affecting fuel production [110].
One of the measures with the greatest impact and easy implementation would be the installation of high efficiency electric motors with variable speed drives. Another relevant issue would be the detailed study of electricity production and waste heat utilization. The ideal scenario would be an autonomous production of 100% renewable electricity. With the possibility of hydrogen production by electrolysis, which would replace the production by natural gas reforming, which implies high emissions. It should be remembered that this hydrogen is used for desulfurization in the HDT unit [48,61] and HDS [68,69].
Another important focus of action would be the furnaces [111], which should use air preheaters, and as far as possible implement oxycombustion, improving performance and reducing pollutant emissions, specifically NOx by eliminating nitrogen from the reaction.
The presence of sulfur in the reagents forces the refinery to have units for its removal [110,111] due to the consequences on corrosion and SOx pollutant emissions. These processes have much room for improvement through the use of high-performance catalysts, such as the installation of a SuperClaus reactor in SRUs.
Low-temperature waste heat utilization systems can also be implemented in multiple units by implementing organic Rankine cycle (ORC) cycles [112]. This is especially relevant in catalytic units, as the use of air coolants could be avoided, increasing the performance of the unit.
The end result of most of the processes involves the emission of exhaust gases, which are mainly CO2, NOx and SOx. Currently, CO2 is emitted into the atmosphere and NOx and SOx, since they cannot be emitted, are disposed of in specific units. If the capture of these exhaust gases is envisaged, they could be separated from the stream using electron beams and ammonia [113]. This change implies profound transformations of the SRU, HDT, HDS and the hydrogen generation unit. If diesel production is eliminated, some of them could even be eliminated.
In the digital age, the use of software is very important. It allows for process simulations at a lower cost, but with the drawback that it requires time and the refinement of algorithms to improve performance [114].
To achieve greater efficiency, the use of the DT (Digital Twin) is also being introduced, which allows knowledge of the plant, simulation of the process and interpretation of results. Artificial intelligence tools are gaining special relevance in this process. There are currently two DT models, which are the Process Twin and the Product Twin [25,26].
The Process twin replicates process activities by simulating them in a virtual environment but obtaining the data from the process plant itself in real time, thus being able to estimate possible deviations thanks to the replication of all the problems that appear and are recorded [115,116].
The Product twin generates a non-real physical process whose purpose is to improve economic performance. It provides the necessary tools for decision making with a commercial vision [89,115].
The implementation of digital technologies, particularly DT and Artificial Intelligence (AI), is transforming refinery operations beyond traditional simulation. These tools enable real-time monitoring and predictive maintenance, leading to substantial energy savings and reduced operational costs [117]. Specifically, AI-driven models can optimize complex processes like distillation and catalytic cracking by predicting optimal operating conditions, thereby improving overall energy efficiency and reducing associated emissions.
These types of technological implementations in refineries provide valuable information for the decarbonization process. For example, they can identify energy losses, improve efficiency, optimize operating costs and support investment planning. These tools are crucial to accompany other initiatives such as renewable H2 production [116,117], CO2 capture and storage [52,118], and even biofuel production.

4.2. Emission Reductions and Economic Implications

For emission reduction, it is important to understand the impact of using renewable hydrogen as a substitute for hydrogen produced from fossil fuels. To that end, there are software-based studies that economically quantify this impact by generating learning curves through well-known models [118].
Any modification of the refining process with the improvements proposed in Section 4.1 has implications on the balance of emissions and important economic impacts.
Assessing the economic viability of decarbonization projects is complex, as it involves balancing high initial capital expenditures with long-term operational savings and regulatory compliance. Studies comparing various emission reduction technologies, such as carbon capture versus electrification, often highlight that the most cost-effective strategies typically involve a portfolio approach combining process optimization with targeted investments [119]. These analyses are crucial for guiding refinery management decisions, ensuring that decarbonization efforts are both environmentally effective and economically sustainable.
Analyzing, for example, the work by Ahadni et al. and Al-Qahtani et al. [76], a typical Arab light crude oil refinery processing a crude load of 12,000 kt/year is presented showing current CO2 emissions and various emission reduction scenarios. This information is broken down by the process unit, including also an economic estimate of the costs of implementing the technology for CO2 reduction. Table 4 shows the cost of reducing CO2 emissions by 20%, 40% and 60%.
From Table 4 we can deduce that with an investment of approximately 7% of the operating cost, CO2 emissions could be reduced by 60%. This figure is encouraging for the future, since with a clearly limited investment a strong improvement in terms of emissions is achieved.
Table 5 shows a more detailed breakdown of CO2 emission reductions by process unit:
As can be seen in the table, the units with the greatest impact on global emissions reduction are firstly the crude oil unit, which accounts for almost half of the emissions. And then, a second group with emissions in the range 12–18% corresponding to platformed, HDS and HDT.

5. Conclusions

The world is undergoing a profound transformation to achieve zero net emissions in the near future. All industrial sectors are involved in this transformation. This study first analyzes in detail the existing units in today’s refineries, from the most rudimentary to the most advanced. This sector’s goals for achieving decarbonization are focused on two methods, on the one hand, biofuels, and on the other hand, synthetic fuels. As a result of this analysis, the following conclusions have been reached regarding the possible decarbonization of the oil refining sector:
The most advanced technology corresponds to the Deep conversion refinery type, which encompasses all refining processes. When analyzing all the units, a clear division stands out in terms of emissions: units with combustion versus units without combustion.
The combustion units with the greatest impact on emissions are crude oil and vacuum, hydrogen, coke and FCC. As for the units without combustion, they do not present significant impacts, although they are not emission-free.
The possible technological substitutions that allow refining with low emissions are also analyzed. High efficiency electric motors, use of residual heat, renewable H2 for desulfurization and, finally, optimization capabilities through digital twin are highlighted.
The systematic analysis presented here confirms that while the refining industry faces significant decarbonization challenges, a combination of available technologies offers substantial opportunities for immediate impact. Our findings highlight that focusing on electrification, residual heat recovery, and the utilization of renewable H2 for desulfurization provides the most significant reduction pathways in high-impact units (Crude/Vacuum, Hydrogen, FCC). Furthermore, the implementation of digital twins and AI tools provides essential optimization capabilities, ensuring operational efficiency and cost control during this transition. Critically, the economic analysis indicates that achieving up to a 60% reduction in CO2 emissions is feasible with a modest increase in operational costs, making these decarbonization efforts economically attractive in the short term.
Producing a strong reduction in emissions from the refining process is feasible with current technology without profound transformations. If a zero net emissions scenario is envisaged, CO2 capture is essential. It is also worth noting that, in the current context of incentives and penalties, many of the improvement proposals are economically profitable.

Author Contributions

Conceptualization, E.S.-B. and I.A.-F.; validation, D.C.-L. and M.N. formal analysis, E.S.-B.; writing—original draft preparation, E.S.-B.; writing—review and editing, E.S.-B., I.A.-F. and D.C.-L.; supervision, I.A.-F., D.C.-L. and M.N. All authors have read and agreed to the published version of the manuscript.

Funding

This research received no external funding.

Data Availability Statement

Dataset available in request from the authors.

Conflicts of Interest

The authors declare no conflict of interest.

References

  1. Lo Piano, S.; Smith, S.T. Energy demand and its temporal flexibility: Approaches, criticalities and ways forward. Renew. Sustain. Energy Rev. 2022, 160, 112249. [Google Scholar] [CrossRef]
  2. Hourcade, J.-C.; Johnson, F.X.; Pachauri, S.; Simpson, N.P.; Singh, C.; Thomas, A.; Totin, E. Synthesis report of the IPCC Sixth Assessment Report (AR6). In Proceedings of the Fifty-Eight Session of the IPCC, Interlaken, Switzerland, 13–17 March 2023; Intergovernmental Panel on Climate Change: Geneva, Switzerland, 2023. [Google Scholar]
  3. IEA. The Oil and Gas Industry in Energy Transitions; OECD Publishing: Paris, France, 2020. [Google Scholar] [CrossRef]
  4. Bill, C. 2017 Outlook for Energy: A View to 2040; Exxon Mobil: Irving, TX, USA, 2017. [Google Scholar]
  5. World Climate Action Summit and High-Level Segment at COP 28. Available online: https://unfccc.int/cop28/high-level (accessed on 25 February 2024).
  6. Total Energy Supply Outlook by Fuel and Scenario, 2000–2040. 2019. Available online: https://www.iea.org/data-and-statistics/charts/total-energy-supply-outlook-by-fuel-and-scenario-2000-2040 (accessed on 25 February 2024).
  7. Amado, M.; Poggi, F. Net-Zero Energy City Planning. In Sustainable Energy Transition for Cities; Elsevier: Amsterdam, The Netherlans, 2022; pp. 141–194. [Google Scholar] [CrossRef]
  8. Tribunal de Cuentas Europeo. Informe Especial Objetivosclimáticos y Energéticos de la UE; Tribunal de Cuentas Europeo: Luxembourg, 2023. [Google Scholar]
  9. Cordero-Lanzac, T.; Ramirez, A.; Navajas, A.; Gevers, L.; Brunialti, S.; Gandía, L.M.; Aguayo, A.T.; Sarathi, S.M.; Gascon, J. A techno-economic and life cycle assessment for the production of green methanol from CO2: Catalyst and process bottlenecks. J. Energy Chem. 2022, 68, 255–266. [Google Scholar] [CrossRef]
  10. Solakivi, T.; Paimander, A.; Ojala, L. Cost competitiveness of alternative maritime fuels in the new regulatory framework. Transp. Res. D Transp. Environ. 2022, 113, 103500. [Google Scholar] [CrossRef]
  11. Benajes, J.; García, A.; Monsalve-Serrano, J.; Martínez-Boggio, S. Potential of using OMEx as substitute of diesel in the dual-fuel combustion mode to reduce the global CO2 emissions. Transp. Eng. 2020, 1, 100001. [Google Scholar] [CrossRef]
  12. Khalifa, R.; Alherbawi, M.; Elomri, A.; Al-Ansari, T. Optimization of Biofuel and Kerosene Fuel Blends to Support Sustainable Aviation. Comput. Aided Chem. Eng. 2022, 51, 85–90. [Google Scholar] [CrossRef]
  13. Colelli, L.; Segneri, V.; Bassano, C.; Vilardi, G. E-fuels, technical and economic analysis of the production of synthetic kerosene precursor as sustainable aviation fuel. Energy Convers. Manag. 2023, 288, 117165. [Google Scholar] [CrossRef]
  14. Elías, G.-H.; Xicoténcatl, L.-A.; Humberto, B.-Á.; Rodolfo, S.-E. Refinación de petróleo y suimpactoeconómico-tecnológico para la producción de gasolinas en México al 2030. Ing. Investig. Tecnol. 2013, 14, 475–487. [Google Scholar] [CrossRef]
  15. Elías, G.-H.; Humberto, B.-Á.; Rodolfo, S.-E.; Xicoténcatl, L.-A.; Claudia, G.-L.; Pablo, S.-Á. Consumo de energía y emisiones de bióxido de carbono del sector refinación de petróleo en México de 2015 a 2030. Ing. Investig. Tecnol. 2015, 16, 503–513. [Google Scholar] [CrossRef][Green Version]
  16. Szklo, A.; Schaeffer, R. Fuel specification, energy consumption and CO2 emission in oil refineries. Energy 2007, 32, 1075–1092. [Google Scholar] [CrossRef]
  17. Ma, S.; Lei, T.; Meng, J.; Liang, X.; Guan, D. Global oil refining’s contribution to greenhouse gas emissions from 2000 to 2021. Innovation 2023, 4, 100361. [Google Scholar] [CrossRef]
  18. Parkash, S. Refinery Distillation. In Refining Processes Handbook; Elsevier: Amsterdam, The Netherlands, 2003; pp. 1–28. [Google Scholar] [CrossRef]
  19. Fraser, S. Distillation in Refining. In Distillation; Elsevier: Amsterdam, The Netherlands, 2014; pp. 155–190. [Google Scholar] [CrossRef]
  20. Lois, E.; Keating, E.L.; Gupta, A.K. Fuels. In Encyclopedia of Physical Science and Technology; Elsevier: Amsterdam, The Netherlands, 2003; pp. 275–314. [Google Scholar] [CrossRef]
  21. Doble, M.; Kumar, A. Biodesulfurization. In Biotreatment of Industrial Effluents; Elsevier: Amsterdam, The Netherlands, 2005; pp. 255–265. [Google Scholar] [CrossRef]
  22. Sahl ABin Orosz, Á.; How, B.S.; Friedler, F.; Teng, S.Y. Electrification of oil refineries through multi-objective multi-period graph-theoretical planning: A crude distillation unit case study. J. Clean. Prod. 2024, 434, 140179. [Google Scholar] [CrossRef]
  23. van Straelen, J.; Geuzebroek, F.; Goodchild, N.; Protopapas, G.; Mahony, L. CO2 capture for refineries, a practical approach. Int. J. Greenh. Gas Control 2010, 4, 316–320. [Google Scholar] [CrossRef]
  24. Chan, W.N.; Walter, A.; Sugiyama, M.I.; Borges, G.C. Assessment of CO2 Emission Mitigation for a Brazilian Oil Refinery. Braz. J. Chem. Eng. 2016, 33, 835–850. [Google Scholar] [CrossRef]
  25. Cameron, D.B.; Waaler, A.; Komulainen, T.M. Oil and Gas digital twins after twenty years. How can they be made sustainable, maintainable and useful? In Proceedings of the 59th Conference on Simulation and Modelling (SIMS 59), Oslo, Norway, 26–28 September 2018; pp. 9–16. [Google Scholar] [CrossRef]
  26. Raj, P.; Surianarayanan, C. Digital twin: The industry use cases. In Advances in Computers; Elsevier: Amsterdam, The Netherlands, 2020; pp. 285–320. [Google Scholar] [CrossRef]
  27. Giwa, T.; Akbari, M.; Kumar, A. Techno-economic assessment of an integrated biorefinery producing bio-oil, ethanol, and hydrogen. Fuel 2023, 332, 126022. [Google Scholar] [CrossRef]
  28. Hänggi, S.; Elbert, P.; Bütler, T.; Cabalzar, U.; Teske, S.; Bach, C.; Onder, C. A review of synthetic fuels for passenger vehicles. Energy Rep. 2019, 5, 555–569. [Google Scholar] [CrossRef]
  29. Zhao, Y.; Ma, X.; Zhang, Y.; Chen, G. Decarbonization pathways for the petroleum refining industry: A techno-economic assessment. J. Clean. Prod. 2023, 412, 137351. [Google Scholar] [CrossRef]
  30. Wang, Z.; Li, S.; Jin, Z.; Li, Z.; Liu, Q.; Zhang, K. Oil and gas pathway to net-zero: Review and outlook. Energy Strategy Rev. 2023, 45, 101048. [Google Scholar] [CrossRef]
  31. Pivac, I.; Šimunović, J.; Barbir, F.; Nižetić, S. Reduction of greenhouse gases emissions by use of hydrogen produced in a refinery by water electrolysis. Energy 2024, 296, 131157. [Google Scholar] [CrossRef]
  32. Boniek, D.; Figueiredo, D.; dos Santos, A.F.B.; de Resende Stoianoff, M.A. Biodesulfurization: A mini review about the immediate search for the future technology. Clean Technol. Environ. Policy 2015, 17, 29–37. [Google Scholar] [CrossRef]
  33. Available online: https://www.miteco.gob.es/es/costas/temas/proteccion-medio-marino/plan-ribera/contaminacion-marina-accidental/petroleo_y_comportamiento.aspx#:~:text=Al%20hablar%20de%20petr%C3%B3leo%20hay,que%20no%20se%20pueden%20destilar (accessed on 16 March 2024).
  34. Barker, C. Chapter 2 Origin, Composition and Properties of Petroleum. In Developments in Petroleum Science; Elsevier B.V.: Amsterdam, The Netherlands, 1985; pp. 11–45. [Google Scholar] [CrossRef]
  35. Hussain, N. Types and Configurations of Petroleum Oil Refineries. 2022. Available online: https://thepetrosolutions.com/types-configurations-petroleum-oil-refineries/ (accessed on 26 February 2024).
  36. Fahim, M.A.; Alsahhaf, T.A.; Elkilani, A. Hydroconversion. In Fundamentals of Petroleum Refining; Elsevier: Amsterdam, The Netherlands, 2010; pp. 153–198. [Google Scholar] [CrossRef]
  37. Farhan Hussain, R.; Mokhtari, A.; Ghalambor, A.; Amini Salehi, M. Smart downstream sector of O&G industry. In IoT for Smart Operations in the Oil and Gas Industry; Elsevier: Amsterdam, The Netherlands, 2023; pp. 105–131. [Google Scholar] [CrossRef]
  38. Suganuma, S.; Katada, N. Innovation of catalytic technology for upgrading of crude oil in petroleum refinery. Fuel Process. Technol. 2020, 208, 106518. [Google Scholar] [CrossRef]
  39. Al-Samhan, M.; Al-Fadhli, J.; Al-Otaibi, A.M.; Al-Attar, F.; Bouresli, R.; Rana, M.S. Prospects of refinery switching from conventional to integrated: An opportunity for sustainable investment in the petrochemical industry. Fuel 2022, 310, 122161. [Google Scholar] [CrossRef]
  40. Rodionova, M.V.; Poudyal, R.S.; Tiwari, I.; Voloshin, R.A.; Zharmukhamedov, S.K.; Nam, H.G.; Zayadan, B.K.; Bruce, B.D.; Hou, H.J.; Allakhverdiev, S.I. Biofuel production: Challenges and opportunities. Int. J. Hydrogen Energy 2017, 42, 8450–8461. [Google Scholar] [CrossRef]
  41. Liang, Y.; Kashdan, T.; Sterner, C.; Dombrowski, L.; Petrick, I.; Kröger, M.; Hofer, R. Algal Biorefineries. In Industrial Biorefineries & White Biotechnology; Elsevier: Amsterdam, The Netherlands, 2015; pp. 35–90. [Google Scholar] [CrossRef]
  42. Goria, K.; Singh, H.M.; Singh, A.; Kothari, R.; Tyagi, V.V. Insights into biohydrogen production from algal biomass: Challenges, recent advancements and future directions. Int. J. Hydrogen Energy 2024, 52, 127–151. [Google Scholar] [CrossRef]
  43. Berta, C.C. Ecocombustibles y Combustibles Sintéticos y Supapel Ante el Panorama Actual 2023; Ministerio de Defensa de España: Madrid, Spain, 2023. [Google Scholar]
  44. Willauer, H.D.; Hardy, D.R. Synthetic Fuel Development. In Future Energy; Elsevier: Amsterdam, The Netherlands, 2020; pp. 561–580. [Google Scholar] [CrossRef]
  45. Ridjan, I.; Mathiesen, B.V.; Connolly, D.; Duić, N. The feasibility of synthetic fuels in renewable energy systems. Energy 2013, 57, 76–84. [Google Scholar] [CrossRef]
  46. Suppes, G.J.; Storvick, T.S. Energy and Sustainability. In Sustainable Power Technologies and Infrastructure; Academic Press: Cambridge, MA, USA, 2016; pp. 75–119. [Google Scholar] [CrossRef]
  47. Fahim, M.A.; Alsahhaf, T.A.; Elkilani, A. Crude Distillation. In Fundamentals of Petroleum Refining; Elsevier: Amsterdam, The Netherlands, 2010; pp. 69–93. [Google Scholar] [CrossRef]
  48. Fahim, M.A.; Alsahhaf, T.A.; Elkilani, A. Catalytic Reforming and Isomerization. In Fundamentals of Petroleum Refining; Elsevier: Amsterdam, The Netherlands, 2010; pp. 95–122. [Google Scholar] [CrossRef]
  49. IEA International Energy Agency. Net Zero by 2050 A Roadmap for the Global Energy Sector. 2021. Available online: https://iea.blob.core.windows.net/assets/deebef5d-0c34-4539-9d0c-10b13d840027/NetZeroby2050-ARoadmapfortheGlobalEnergySector_CORR.pdf (accessed on 16 March 2024).
  50. Herman, B. A case of multinational oligopoly in poor countries: Oil refinery investment in East Africa. J. Dev. Econ. 1975, 2, 121–143. [Google Scholar] [CrossRef]
  51. Manfroni, M.; Bukkens, S.G.F.; Giampietro, M. The declining performance of the oil sector: Implications for global climate change mitigation. Appl. Energy 2021, 298, 117210. [Google Scholar] [CrossRef]
  52. Pires, J.C.M.; Da Cunha Gonçalves, A.L. (Eds.) Bioenergy with Carbon Capture and Storage; Elsevier: Amsterdam, The Netherlands, 2019. [Google Scholar] [CrossRef]
  53. Boucheikhchoukh, A.; Berger, V.; Swartz, C.L.E.; Deza, A.; Nguyen, A.; Jaffer, S. Multiperiod refinery optimization for mitigating the impact of process unit shutdowns. Comput. Chem. Eng. 2022, 164, 107873. [Google Scholar] [CrossRef]
  54. McCay, M.H.; Shafiee, S. Hydrogen. In Future Energy; Elsevier: Amsterdam, The Netherlands, 2020; pp. 475–493. [Google Scholar] [CrossRef]
  55. Gary, J.H.; Handwerk, G.E.; Kaiser, M.J.; Geddes, D. Petroleum Refining: Technology and Economics, 5th ed.; CRC Press: Boca Raton, FL, USA, 2007. [Google Scholar] [CrossRef]
  56. Eser, S. Atmospheric and Vacuum Distillation Units. Available online: https://courses.ems.psu.edu/fsc432/content/atmospheric-and-vacuum-distillation-units (accessed on 16 March 2024).
  57. Moran, S. Distillation Columns and Towers. In Process Plant Layout; Elsevier: Amsterdam, The Netherlands, 2017; pp. 325–338. [Google Scholar] [CrossRef]
  58. Luyben, W.L. Optimum vacuum distillation pressure. Chem. Eng. Process. -Process Intensif. 2022, 171, 108630. [Google Scholar] [CrossRef]
  59. Li, X.; Cui, C.; Sun, J. Enhanced product quality in lubricant type vacuum distillation unit by implementing dividing wall column. Chem. Eng. Process. -Process Intensif. 2018, 123, 1–11. [Google Scholar] [CrossRef]
  60. Amini, A.; Imaninasab, R. Investigating the effectiveness of Vacuum Tower Bottoms for Asphalt Rubber Binder based on performance properties and statistical analysis. J. Clean. Prod. 2018, 171, 1101–1110. [Google Scholar] [CrossRef]
  61. Cheremisinoff, N.P.; Rosenfeld, P. The petroleum industry. In Handbook of Pollution Prevention and Cleaner Production—Best Practices in The Petroleum Industry; Elsevier: Amsterdam, The Netherlands, 2009; pp. 1–97. [Google Scholar] [CrossRef]
  62. Rahimpour, M.R.; Jafari, M.; Iranshahi, D. Progress in catalytic naphtha reforming process: A review. Appl. Energy 2013, 109, 79–93. [Google Scholar] [CrossRef]
  63. Fink, J. Processes. In Guide to the Practical Use of Chemicals in Refineries and Pipelines; Elsevier: Amsterdam, The Netherlands, 2016; pp. 185–223. [Google Scholar] [CrossRef]
  64. Ancheyta-Juárez, J.; Villafuerte-Macías, E. Experimental validation of a kinetic model for naphtha reforming. Stud. Surf. Sci. Catal. 2001, 133, 615–618. [Google Scholar] [CrossRef]
  65. da Rosa, A.V.; Ordóñez, J.C. Hydrogen Production. In Fundamentals of Renewable Energy Processes; Elsevier: Amsterdam, The Netherlands, 2022; pp. 419–470. [Google Scholar] [CrossRef]
  66. Iulianelli, A.; Liguori, S.; Wilcox, J.; Basile, A. Advances on methane steam reforming to produce hydrogen through membrane reactors technology: A review. Catal. Rev. 2016, 58, 1–35. [Google Scholar] [CrossRef]
  67. Lødeng, R.; Hannevold, L.; Bergem, H.; Stöcker, M. Catalytic Hydrotreatment of Bio-Oils for High-Quality Fuel Production. In The Role of Catalysis for the Sustainable Production of Bio-Fuels and Bio-Chemicals; Elsevier: Amsterdam, The Netherlands, 2013; pp. 351–396. [Google Scholar] [CrossRef]
  68. Cheremisinoff, N.P.; Rosenfeld, P.; Davletshin, A.R. Refineries. In Responsible Care; Gulf Publishing Company: Houston, TX, USA, 2008; pp. 236–316. [Google Scholar] [CrossRef]
  69. Parkash, S. Distillate Hydrotreating. In Refining Processes Handbook; Elsevier: Amsterdam, The Netherlands, 2003; pp. 29–61. [Google Scholar] [CrossRef]
  70. Miller, B. Introduction. In Fossil Fuel Emissions Control Technologies; Butterworth-Heinemann: Oxford, UK, 2015; pp. 1–45. [Google Scholar] [CrossRef]
  71. Errera, M.R.; Milanez, L.F. Thermodynamic analysis of a coke dry quenching unit. Energy Convers. Manag. 2000, 41, 109–127. [Google Scholar] [CrossRef]
  72. Alvarado, J.G.; Delgado Linares, J.G.; Medina, H.R. Rol de la Química Orgánica en losprocesos de conversión de hidrocarburos. Educ. Química 2015, 26, 288–298. [Google Scholar] [CrossRef]
  73. Boateng, A.A. Rotary Kiln Petroleum Coke Calcination Process: Some Design Considerations. In Rotary Kilns; Butterworth-Heinemann: Oxford, UK, 2016; pp. 265–290. [Google Scholar] [CrossRef]
  74. Tiwari, H.P.; Saxena, V.K. Industrial perspective of the cokemaking technologies. In New Trends in Coal Conversion: Combustion, Gasification, Emissions, and Coking; Woodhead Publishing: Cambridge, UK, 2019; pp. 203–246. [Google Scholar] [CrossRef]
  75. Speight, J.G. Refining Chemistry and Fouling Potential. In Fouling in Refineries; Elsevier: Amsterdam, The Netherlands, 2015; pp. 65–86. [Google Scholar] [CrossRef]
  76. Alnahdi, A.; Elkamel, A.; Shaik, M.A.; Al-Sobhi, S.A.; Erenay, F.S. Optimal Production Planning and Pollution Control in Petroleum Refineries Using Mathematical Programming and Dispersion Models. Sustainability 2019, 11, 3771. [Google Scholar] [CrossRef]
  77. Rodríguez, E.; Gutiérrez, A.; Palos, R.; Vela, F.J.; Azkoiti, M.J.; Arandes, J.M.; Bilbao, J. Co-cracking of high-density polyethylene (HDPE) and vacuum gasoil (VGO) under refinery conditions. Chem. Eng. J. 2020, 382, 122602. [Google Scholar] [CrossRef]
  78. Mujtaba, I.M.; John, Y.M.; Yusuf, A.Z.; Patel, R. Crude to chemicals: The conventional FCC unit still relevant. In Modelling of Chemical Process Systems; Elsevier: Amsterdam, The Netherlands, 2023; pp. 251–267. [Google Scholar] [CrossRef]
  79. Selalame, T.W.; Patel, R.; Mujtaba, I.M.; John, Y.M. A Review of Modelling of the FCC Unit—Part I: The Riser. Energies 2022, 15, 308. [Google Scholar] [CrossRef]
  80. Li, Z.; Lu, C.-X. FCC riser quick separation system: A review. Pet. Sci. 2016, 13, 776–781. [Google Scholar] [CrossRef]
  81. Rigutto, M.S.; van Veen, R.; Huve, L. Zeolites in Hydrocarbon Processing. In Studies in Surface Science and Catalysis; Elsevier: Amsterdam, The Netherlands, 2007; pp. 855–913, XXIII–XXVI. [Google Scholar] [CrossRef]
  82. Selalame, T.W.; Patel, R.; Mujtaba, I.M.; John, Y.M. A Review of Modelling of the FCC Unit—Part II: The Regenerator. Energies 2022, 15, 388. [Google Scholar] [CrossRef]
  83. Ortega, E. An Overview of Hydrotreating. 2021. Available online: https://www.aiche.org/sites/default/files/cep/20211029.pdf (accessed on 16 March 2024).
  84. Rodríguez, E.; Félix, G.; Ancheyta, J.; Trejo, F. Modeling of hydrotreating catalyst deactivation for heavy oil hydrocarbons. Fuel 2018, 225, 118–133. [Google Scholar] [CrossRef]
  85. Speight, J.G. Hydrocarbons from crude oil. In Handbook of Industrial Hydrocarbon Processes; Gulf Professional Publishing: Houston, TX, USA, 2020; pp. 95–142. [Google Scholar] [CrossRef]
  86. Yoro, K.O.; Daramola, M.O. CO2 emission sources, greenhouse gases, and the global warming effect. In Advances in Carbon Capture: Methods, Technologies and Applications; Woodhead Publishing: Cambridge, UK, 2020; pp. 3–28. [Google Scholar] [CrossRef]
  87. Delgado-Linares, J.G.; Delgado-Linares, G.A.; Mercado-Ojeda, R.A. Balances de masa y energía simplificados, aplicados a un proceso de craqueo catalítico de petróleo. Educ. Química 2009, 20, 456–460. [Google Scholar] [CrossRef]
  88. Nazerifard, R.; Mohammadpourfard, M.; Heris, S.Z. Optimization of the integrated ORC and carbon capture units coupled to the refinery furnace with the RSM-BBD method. J. CO2 Util. 2022, 66, 102289. [Google Scholar] [CrossRef]
  89. Sircar, A.; Nair, A.; Bist, N.; Yadav, K. Digital twin in hydrocarbon industry. Pet. Res. 2023, 8, 270–278. [Google Scholar] [CrossRef]
  90. Gary, J.H. Petroleum Refining. In Encyclopedia of Physical Science and Technology; Academic Press: Cambridge, MA, USA, 2003; pp. 741–761. [Google Scholar] [CrossRef]
  91. Yee, K.F.; Mohamed, A.R.; Tan, S.H. A review on the evolution of ethyl tert-butyl ether (ETBE) and its future prospects. Renew. Sustain. Energy Rev. 2013, 22, 604–620. [Google Scholar] [CrossRef]
  92. Ketabchi, E.; Mechleri, E.; Gu, S.; Arellano-Garcia, H. Modelling and Optimisation Approach of an Integrated Oil Refinery and a Petrochemical Plant. Comput. Aided Chem. Eng. 2018, 44, 1081–1086. [Google Scholar] [CrossRef]
  93. Treblig, B.; Garcia, G. Technical Description Unit of Isopentane; SSRN: Rochester, NY, USA, 2012. [Google Scholar]
  94. Speight, J.G. Gas cleaning processes. In Natural Gas; Elsevier: Amsterdam, The Netherlands, 2019; pp. 277–324. [Google Scholar] [CrossRef]
  95. Stewart, M.I. Gas Sweetening. In Surface Production Operations; Elsevier: Amsterdam, The Netherlands, 2014; pp. 433–539. [Google Scholar] [CrossRef]
  96. Bai, S.; Sridhar, S.; Khan, A.A. Recovery of propylene from refinery off-gas using metal incorporated ethylcellulose membranes. J. Membr. Sci. 2000, 174, 67–79. [Google Scholar] [CrossRef]
  97. Balogun, M.L.; Khan, W.U.; Shaikh, M.N.; Adamu, S.; Arjah, A.S.; Al-Bogami, S.A.; Al-Ghamdi, S.; Hossain, M.M. Redox MoO3/CaMnO3 catalysts for chemical-looping oxidative dehydrogenation of propane: A greener approach of propylene production. Appl. Catal. A Gen. 2023, 655, 119087. [Google Scholar] [CrossRef]
  98. Deraz, N.M.; Alarifi, A.; Shaban, S.A. Removal of sulfur from commercial kerosene using nanocrystalline NiFe2O4 based sorbents. J. Saudi Chem. Soc. 2010, 14, 357–362. [Google Scholar] [CrossRef]
  99. Rezvanpour, A.; Roostaazad, R.; Hesampour, M.; Nyström, M.; Ghotbi, C. Effective factors in the treatment of kerosene–water emulsion by using UF membranes. J. Hazard. Mater. 2009, 161, 1216–1224. [Google Scholar] [CrossRef]
  100. Bissett, J.R.; Rouanet, Y.; Thivnd, J.-M. Reduction of Benzene in Gasoline. U.S. Patent 5,099,543A, 5 March 1991. [Google Scholar]
  101. Process to Reduce the Benzene Content of Gasoline. Google Patents 1977.
  102. Mokhatab, S.; Poe, W.A. Sulfur Recovery and Handling. In Handbook of Natural Gas Transmission and Processing; Elsevier: Amsterdam, The Netherlands, 2012; pp. 291–316. [Google Scholar] [CrossRef]
  103. Kohl, A.L.; Nielsen, R.B. Sulfur Recovery Processes. In Gas Purification; Elsevier: Amsterdam, The Netherlands, 1997; pp. 670–730. [Google Scholar] [CrossRef]
  104. Reduce Benzene Content. WO Patent 2013028215A1, 19 August 2011.
  105. Low Benzene Content Gasoline Producing Process. U.S. Patent 4,209,383A, 3 November 1977.
  106. Zhao, S.; Song, Q.; Zhao, D.; Wang, Y. Identifying the spatiotemporal carbon footprint of the petroleum refining industry and its mitigation potential in China. Energy 2023, 284, 129240. [Google Scholar] [CrossRef]
  107. Madugula, A.C.S.; Sachde, D.; Hovorka, S.D.; Meckel, T.A.; Benson, T.J. Estimation of CO2 emissions from petroleum refineries based on the total operable capacity for carbon capture applications. Chem. Eng. J. Adv. 2021, 8, 100162. [Google Scholar] [CrossRef]
  108. Gailani, A.; Cooper, S.; Allen, S.; Pimm, A.; Taylor, P.; Gross, R. Assessing the potential of decarbonization options for industrial sectors. Joule 2024, 8, 576–603. [Google Scholar] [CrossRef]
  109. Chattopadhyay, S.; Karthikeyan, K.; Gandhi, R.; Grossmann, I.E.; Torres, A.I. Optimal Retrofit of Carbon Capture and Electrification Technologies in Oil Refineries for Reducing Direct CO2 Emissions. Ind. Eng. Chem. Res. 2025, 64, 10131–10147. [Google Scholar] [CrossRef]
  110. Popoola, L.T.; Nwogbu, C.C.; Taura, U.; Asmara, Y.P.; Nwobodo, L.O.; Agbo, A.O. Future prospects towards attaining zero-emission of greenhouse gases from crude oil refinery plants. In Cleaner Waste Systems; Elsevier: Amsterdam, The Netherlands, 2005. [Google Scholar] [CrossRef]
  111. Feliu-Batlle, V.; Rivas-Perez, R. Control of the temperature in a petroleum refinery heating furnace based on a robust modified Smith predictor. ISA Trans. 2021, 112, 251–270. [Google Scholar] [CrossRef]
  112. Yu, H.; Feng, X.; Wang, Y.; Biegler, L.T.; Eason, J. A systematic method to customize an efficient organic Rankine cycle (ORC) to recover waste heat in refineries. Appl. Energy 2016, 179, 302–315. [Google Scholar] [CrossRef]
  113. de Maigret, J.; Viesi, D.; Mahbub, M.S.; Testi, M.; Cuonzo, M.; Thellufsen, J.Z. A Multi-Objective Optimization Approach in Defining the Decarbonization Strategy of a Refinery; Elsevier: Amsterdam, The Netherlands, 2022. [Google Scholar] [CrossRef]
  114. Bárkányi, Á.; Chován, T.; Németh, S.; Abonyi, J. Modelling for Digital Twins—Potential Role of Surrogate Models. Processes 2021, 9, 476. [Google Scholar] [CrossRef]
  115. Melesse, T.Y.; Pasquale, V.; Di Riemma, S. Digital Twin Models in Industrial Operations: A Systematic Literature Review. Procedia Manuf. 2020, 42, 267–272. [Google Scholar] [CrossRef]
  116. Zhang, J.; Li, Y.; Wang, Q. Digital twin and AI applications for sustainable operation optimization in the refining industry. Chem. Eng. J. 2024, 478, 147819. [Google Scholar]
  117. Pour, N. Economics and policy of bioenergy with carbon capture and storage. In Bioenergy with Carbon Capture and Storage; Elsevier: Amsterdam, The Netherlands, 2019; pp. 257–271. [Google Scholar] [CrossRef]
  118. Revinova, S.; Lazanyuk, I.; Ratner, S.; Gomonov, K. Forecasting Development of Green Hydrogen Production Technologies Using Component-Based Learning Curves. Energies 2023, 16, 4338. [Google Scholar] [CrossRef]
  119. Song, Y.; Han, S.; Kim, J. Economic analysis of decarbonization investments in refinery systems focusing on carbon pricing and operational flexibility. Appl. Energy 2023, 345, 121345. [Google Scholar]
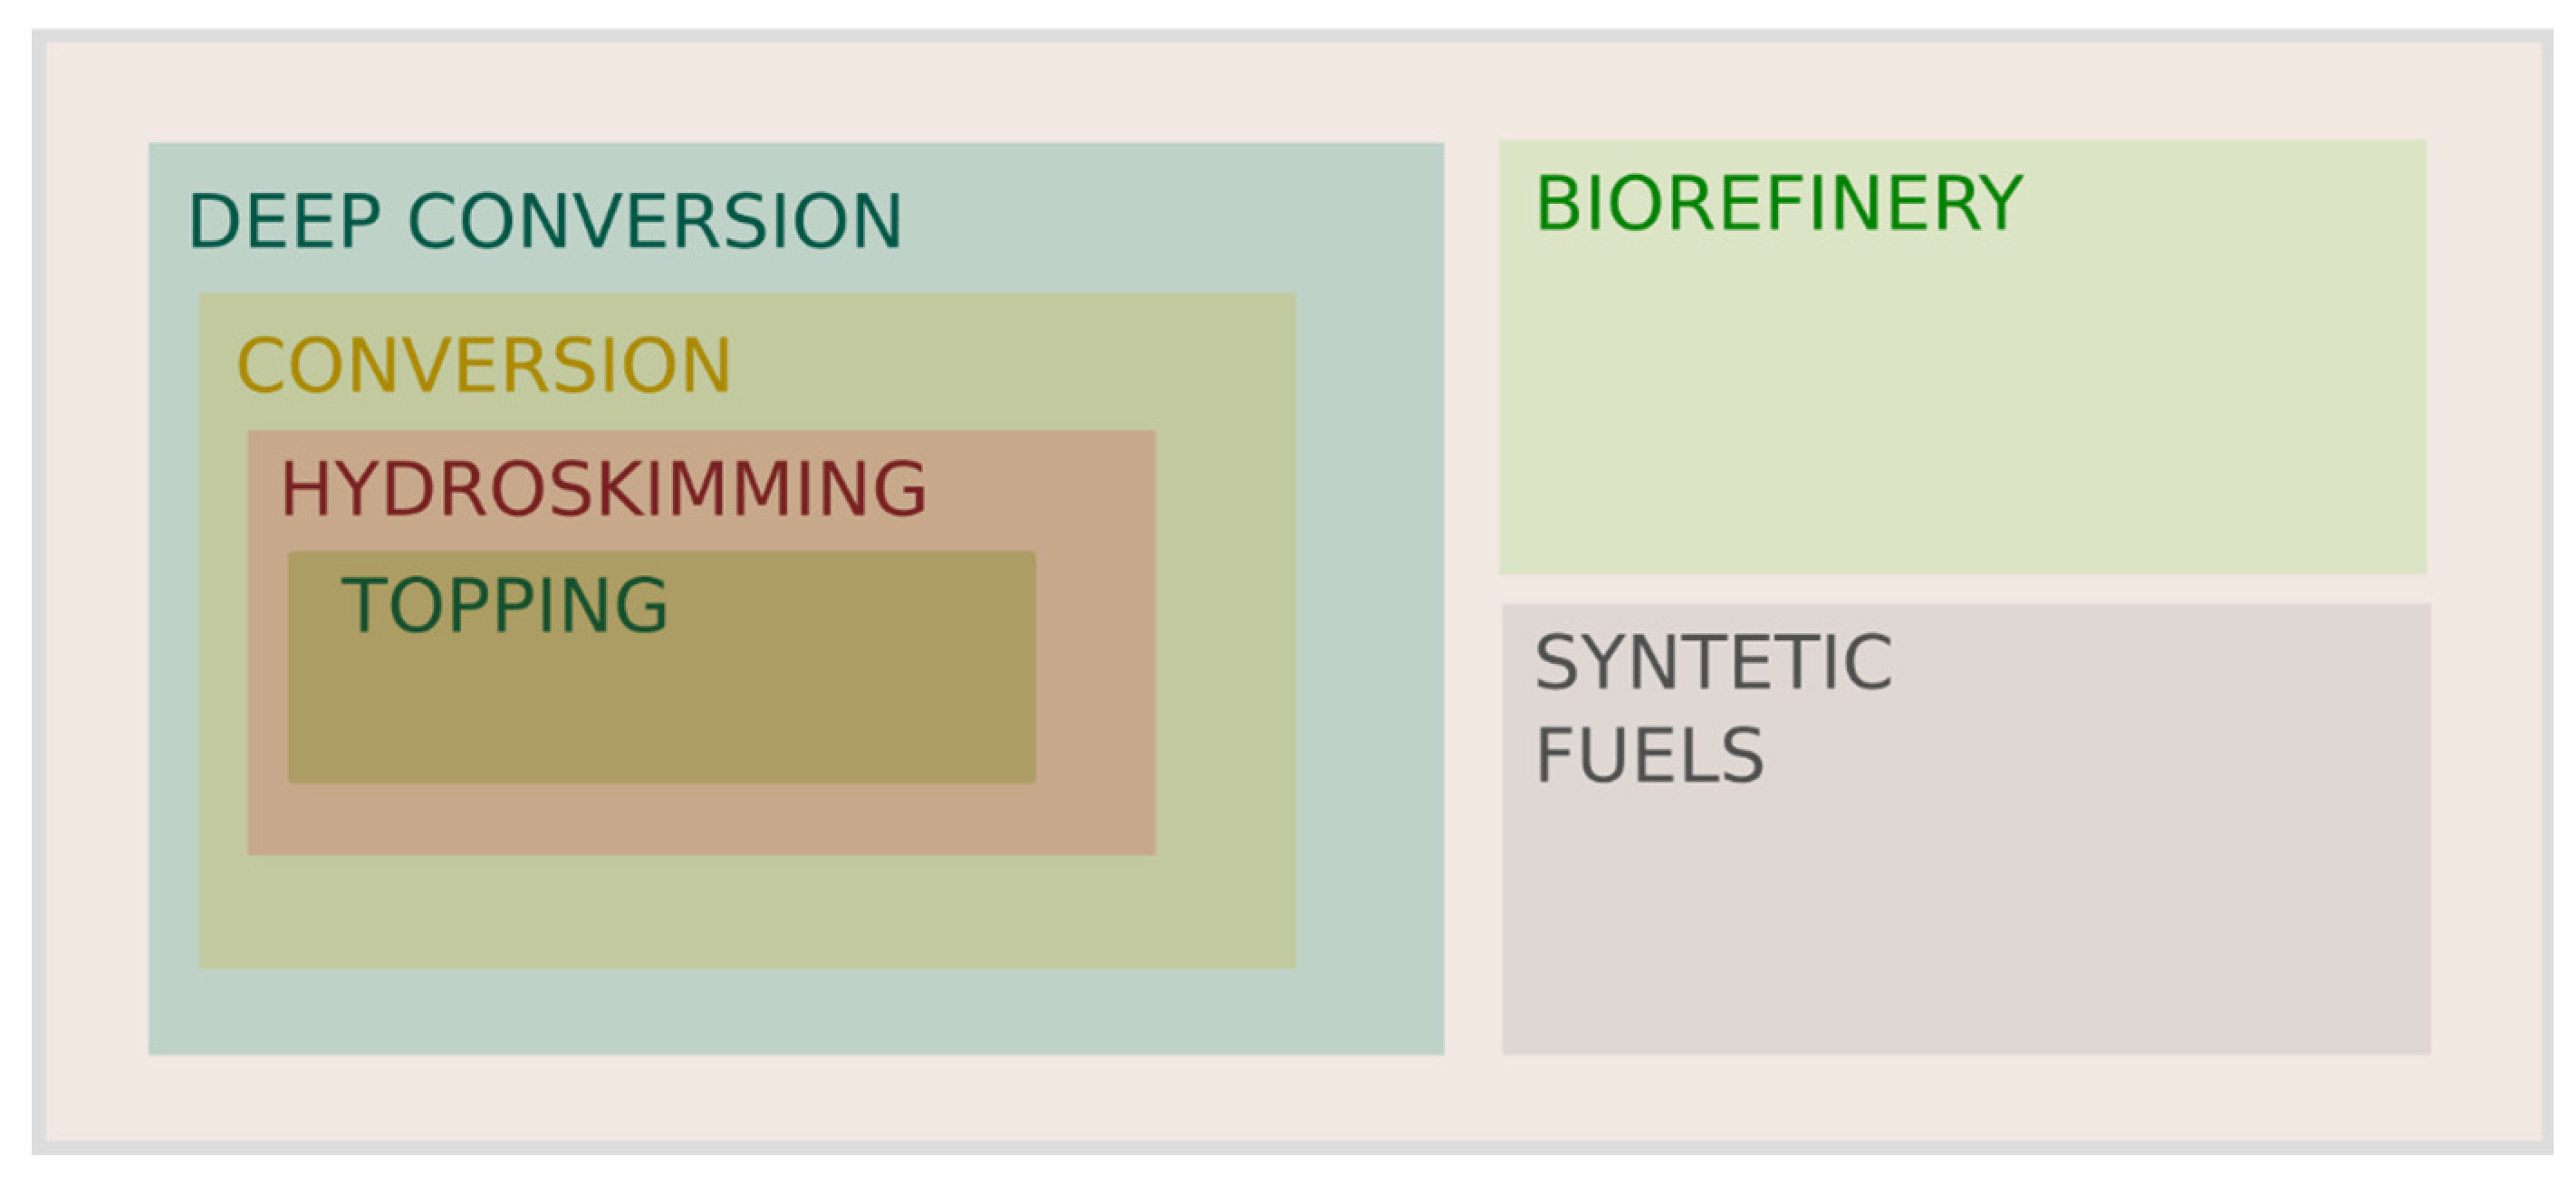
Figure 1. Types of refineries.
Fuels 06 00066 g001
Figure 2. Unit Flow according to refinery typology.
Fuels 06 00066 g002
Figure 3. Crude oil and Vacuum units the propulsion.
Fuels 06 00066 g003
Figure 4. Platform unit.
Fuels 06 00066 g004
Figure 5. Hydrogen unit.
Fuels 06 00066 g005
Figure 6. HDS unit.
Figure 6. HDS unit.
Fuels 06 00066 g006
Figure 7. Coke unit.
Fuels 06 00066 g007
Figure 8. FCC unit.
Figure 8. FCC unit.
Fuels 06 00066 g008
Figure 9. HDT unit.
Figure 9. HDT unit.
Fuels 06 00066 g009
Table 1. Summary of decarbonization potential in units with combustion.
Electrification of the ProcessGas Treatment of ExhaustComplexity of the ProcessContribution H2 RenewableCatalysts ImprovedHeat Exchange System OptimizedDigital Twin
Crude and vacuum✓✓✓✓✓✓ ✓✓✓✓✓✓
Platforming✓✓ ✓✓✓✓✓✓
Hydrogen✓✓✓✓✓✓✓✓✓✓✓✓
HDS✓✓✓✓
Coke✓✓✓✓✓✓
FCC✓✓✓✓✓✓✓
HDT✓✓✓✓
Note: work by the author.
Table 2. Decarbonization possibilities in different refining units.
Electrification of the ProcessTreatment of Gases from ExhaustComplexity of the ProcessContribution H2 RenewableCatalysts ImprovedHeat Exchange System OptimizedDigital Twin
Gases✓✓
ETBE ✓✓✓✓
Desisopentanizer
Isopentane
Amines✓✓✓ ✓✓✓ ✓✓✓✓✓
Propylene ✓✓
Kerosene ✓✓
Benzene✓✓ ✓✓✓✓✓✓✓
SRU✓✓✓✓ ✓✓✓✓
Note: work by the author.
Table 3. Summary of main methods to improve energy efficiency and reduce emissions in refining units.
Method/StrategyDescriptionApplicability/UnitsBenefitsChallenges/Notes
ElectrificationReplacement of fossil fuel combustion with electric-powered systemsFurnaces, reboilers, heating linesSignificant CO2 reductionHigh investment, grid dependency, technical complexity
Treatment and Capture of Exhaust GasesTechnologies to capture or treat CO2, NOx, SOx emissionsFCC, SRU, HDT, HDSReduces emissions and pollutantsRequires process redesign, cost intensive
Catalysts ImprovementUse of advanced, high-performance catalystsHDS, HDT, SRUImproves conversion efficiencyDevelopment time and cost
Heat Exchange OptimizationIntegration of heat recovery systems and low-temp waste heat utilizationMost units, especially catalyticReduces fuel consumption and emissionsDesign complexity
Renewable Hydrogen UseSubstitution of fossil H2 with renewable-produced H2HDS, HDT, hydrogen generation unitsLowers carbon footprintRequires renewable H2 availability and infrastructure
Digital Twin and AI ToolsProcess simulation and optimization through virtual replicas and AIEntire refineryOperational efficiency, energy savingsAlgorithm refinement, data requirements
Advanced Combustion TechnologiesUse of oxy-combustion, air preheatingFurnacesLower NOx emissions, better efficiencyProcess modification needed
Biofuels and Synthetic FuelsIntegration or production of low-carbon fuelsFuel blending, some refining processesPotential for net-zero fuelsMarket and supply chain integration
Carbon Capture and Storage (CCS)Capture and geological storage of CO2Large emission sourcesEssential for zero net emissions scenarioHigh CAPEX/OPEX, regulatory framework
Renewable Energy IntegrationUse of on-site or purchased renewable electricityElectrified unitsReduces indirect emissionsRequires energy management and investment
Table 4. Cost of CO2 emission reductions (data from [81]).
Investment Scenarios
Base CaseInvestment for 20% reduction CO2Investment for 40% reduction CO2Investment for 60% reduction CO2
Total emission (kt CO2/year)13421088807531.5
Cost (M$/year)3.2953.3383.3793.515
Increase in annual cost (%)0.01.32.66.7
Total emission/Cost0.410.320.240.15
Table 5. CO2 emissions reduction per process unit (data from [81]).
% Emissions
Base Case
Emissions Base Case (kt/Year)Simulation of Emission Reductions in Units (kt/Year)
20%40%60%
Crude46.8627531376193
Platformed12.316513010750
FCC1.52017138
HDS1520115912462
HDT18242184137162
kerosene6.3846347.456
Disclaimer/Publisher’s Note: The statements, opinions and data contained in all publications are solely those of the individual author(s) and contributor(s) and not of MDPI and/or the editor(s). MDPI and/or the editor(s) disclaim responsibility for any injury to people or property resulting from any ideas, methods, instructions or products referred to in the content.