Article

A Geothermal-Driven Zero-Emission Poly-Generation Energy System for Power and Green Hydrogen Production: Exergetic Analysis, Impact of Operating Conditions, and Optimization

1
Laboratory of Applied Thermodynamic, National School of Engineers of Gabes, University of Gabes, LR18ES33, Omar Ibn El Khattab Street, Gabes 6029, Tunisia
2
Laboratoire de Modélisation Mécanique, Energétique et Matériaux, Institut Supérieur des Techniques Appliquées (ISTA-Kinshasa), Avenue Aérodrome N°3930, Commune de Barumbu, Kinshasa BP 6593, Democratic Republic of the Congo
3
Institute of Reactive Flows and Diagnostics, Technical University of Darmstadt, 64287 Darmstadt, Germany
4
Institute of Energy and Powerplant Technology, Technical University of Darmstadt, 64287 Darmstadt, Germany
5
Laboratory of Modeling Mechanical, Energy Materials (LM2EM), National School of Engineers of Gabes, University of Gabes, Omar Ibn El Khattab Street, Gabes 6029, Tunisia
*
Author to whom correspondence should be addressed.
Fuels 2025, 6(3), 65; https://doi.org/10.3390/fuels6030065
Submission received: 14 April 2025 / Revised: 8 July 2025 / Accepted: 25 July 2025 / Published: 28 August 2025
(This article belongs to the Special Issue Sustainability Assessment of Renewable Fuels Production)

Abstract

Since the hydrogen-production process is not yet fully efficient, this paper proposes a poly-generation system that is driven by a geothermal energy source and utilizes a combined Kalina/organic Rankine cycle coupled with an electrolyzer unit to produce, simultaneously, power and green hydrogen in an efficient way. A comprehensive thermodynamic analysis and an exergetic evaluation are carried out to assess the effect of key system parameters (geothermal temperature, high pressure, ammonia–water concentration ratio, and terminal thermal difference) on the performance of concurrent production of power and green hydrogen. Thereby, two configurations are investigated with/without the separation of turbines. The optimal ammonia mass fraction of the basic solution in KC is identified, which leads to an overall optimal system performance in terms of exergy efficiency and green hydrogen production rate. In both configurations, the optimal evaluation is made possible by conducting a genetic algorithm optimization. The simulation results without/with the separation of turbines demonstrate the potential of the suggested cycle combination and emphasize its effectiveness and efficiency. Exemplary, for the case without the separation of turbines, it turns out that the combination of ammonia–water and MD2M provides the best performance with net power of 1470 kW, energy efficiency of 0.1184, and exergy efficiency of 0.1258 while producing a significant green hydrogen amount of 620.17 kg/day. Finally, an economic study allows to determine the total investment and payback time of $3,342,000 and 5.37 years, respectively. The levelized cost of hydrogen (LCOH) for the proposed system is estimated at 3.007 USD/kg H2, aligning well with values reported in the literature.

1. Introduction

As cleaner alternatives to traditional fossil fuels are highly demanded, hydrogen is emerging as one of the most important energy solutions for the 21st century, capable of meeting future energy needs, with the potential to meet 18% of global energy needs by 2050 [1,2]. When produced from renewable energy sources, hydrogen is a zero-emission fuel [3] and then a promising zero-emission fuel candidate in decarbonizing the economy, along with key sectors such as transportation, energy generation, and manufacturing [1,2,3,4]. Considering that the combustion properties of hydrogen are extremely different from those of fossil fuels in terms of flammability limits, the flame-propagating speed, ignition delay, etc., various studies investigating the combustion of hydrogen or of fossil fuel with H2 additions are now being extensively carried out to elucidate the capabilities and challenges in engineering applications earlier [5,6,7]. Next, it should be mentioned that hydrogen presents potential for distributed heating, energy storage, and e-fuel generation [1,2,3,4,5,6,7,8,9,10]. However, the hydrogen production process is not yet fully efficient as it is apparent in Table 1. Such an inefficiency impacts the overall sustainability and cost-effectiveness of hydrogen as an energy source.
In fact, a wide range of resources is available for hydrogen production, mainly fossil-based and renewable energy sources [2,3,4,5,6,7,8]. For various manufacturing processes, hydrogen color coding is conventionally used to link it to the energy source utilized for its production [5] (see Table 1). Focusing on green hydrogen, besides well-known classical production methods and their challenges [3,4,5], various poly-generation systems have been proposed in the literature, as shown in Table 1. Recent technological advances have made it possible to improve their efficiency, reduce their costs, and increase their scalability. Today, the cost of green hydrogen has dropped significantly, making it competitive with blue hydrogen [5]. Nevertheless, it is still urgent to further enhance the efficiency of such systems for sustainable environmental protection and to simultaneously reduce consumption.
Taking advantage of the generation of electricity, the Kalina cycle has proven its worth, especially when used with an ammonia–water mixture as a working fluid for its variable-temperature phase change, which offers a better temperature match in heat exchangers than pure working fluids. In this respect, Aravindan and Praveen Kumar [6] have investigated the integration of an autonomous cycle using municipal solid waste and solar thermal energy to power a solid oxide electrolyzer for hydrogen production. This system uses solar energy and is based on the utilization of an organic Rankine cycle (ORC) and a Kalina cycle. A comparative analysis showed that the ORC outperformed the Kalina cycle by 16% in thermal efficiency. Multi-objective optimization showed that the ORC achieved thermal efficiency of 15.5%, an exergy efficiency of 12.9%, and a total investment cost of $130,833, compared to 6.23%, 7.37%, and $135,235, respectively, for the Kalina cycle. Baral and Šebo [7] validated the analysis of a hybrid system combining solar photovoltaic (PV) energy with storage and wind turbines in a promising approach. The study highlighted the possibility of integrating solar thermal energy with an organic Rankine cycle (ORC) to recover waste heat for hydrogen production. Hassan et al. [8] have proposed a precise methodology for comparing wind and solar solutions for the large-scale production of green hydrogen. Their study took into account the impact of zero carbon emissions due to the integration of renewable energy-based processes. The results show that the optimal electrolyzer capacity can be combined with a 1.5 MW wind power plant and a 2.0 MW solar photovoltaic plant. The cost of producing green hydrogen on a large-scale ranges from $6.33/kg to $8.87/kg, depending on whether wind or solar power is used.
While many studies contrast the Kalina cycle with the organic Rankine cycle (ORC), others explore cascade systems combining these two cycles. Several research activities are underway to optimize the production of electricity and green hydrogen based on cogeneration or poly-generation systems combining these cycles. Karthikeyan and Kumar [9] proposed a system for the simultaneous production of refrigeration, electricity, and green hydrogen. This study, carried out in a city located in a cold region, showed high production rates: 220 kW for electricity and 1.9 kg/h for hydrogen. However, the energy efficiency was relatively low at only 13.6%. Elrhoul et al. [10] simulated and compared the performance of conventional and dual-pressure organic Rankine cycles separately coupled to solid oxide electrolysis. The results show that the dual-pressure cycle produces 14.79% more energy than the conventional ORC, improving the energy input to the solid oxide electrolyzer. Hydrogen production reaches 34.47 kg/h, compared with 31.14 kg/h for conventional ORC. Moreover, integrating the dual-pressure cycle into a hydrogen production plant has reduced costs and improved system efficiency by making full use of available waste heat. See also [11,12,13].
The Kalina cycle has been also used to produce green energy from renewable sources based on geothermal energy. Alirahmi et al. [14] developed a multi-generation system integrating an organic Rankine cycle, a polymer electrolyte membrane electrolyzer, and a lithium/bromide absorption refrigeration cycle. After multi-objective simulation and optimization using the NSGA-II algorithm, the results showed an optimal exergy efficiency of 37.85% and a production cost of 15.09 USD/h. Hai et al. [15] investigated the efficient use of waste heat from a double flash expansion geothermal cycle in a system combining a Kalina cycle and a thermoelectric generator. Waste heat from the Kalina cycle is recovered by a LiCl-H2O absorption chiller. Hydrogen is produced using the electricity generated by the Kalina cycle and the power output of the high-pressure turbine of the double flash expansion cycle, which feeds an electrolysis unit. The study reports an exergy efficiency of 35.58%, a unit product cost of $9.512/GJ, and a payback time of 0.418 years.
Madhesh et al. [16] have designed a cascade system using a hybrid solar-biogas heat source. The system integrates power generation via a Kalina cycle and an organic Rankine cycle, a dual evaporator vapor compression cooling system, and a solid oxide electrolyzer. Results show that this system achieves an energy utilization rate of 0.76, an exergy efficiency of 21.56%, and a total cost of $58,677. Further studies have been conducted along these lines. Abdelmajid Saoud et al. [17] optimized a system integrating an organic Rankine cycle and a single-effect double-lift absorption cycle, with the addition of a solar power plant. The final result from this analysis showed an improvement in the heat recovery potential by 22.22%. See also [18,19].
In the recent literature, three main classes of coupling have been especially suggested up to now (see in Table 1). These may be referred to as single mode (SiM) (i.e., a Kalina cycle is coupled to a PEM and then compared to organic Rankine cycle coupled to a PEM), the cascade coupling/mode (CaM) (i.e., the Kalina cycle and organic Rankine cycle are cascaded to a PEM), and the combined coupling/mode (CoM) (i.e., the Kalina cycle and organic Rankine cycle are combined and then coupled to a PEM). In all of these studies, only the reference [20] included KC and ORC coupled to PEME, RT, and PTC to generate electricity and hydrogen by using a solar energy source. It enables net power production of 1957 kW and hydrogen production of 1 Kg/h.
Furthermore, it appears, in this case, that (1) the effect of operating conditions has nowhere been comprehensively investigated. (2) How an optimal ammonia mass fraction of the basic solution leads to an overall optimal system performance in terms of exergetic efficiency and in regards to the green hydrogen production rate is still open. (3) The impact of the working fluid on the production of both electricity and green hydrogen is not yet fully clarified in this context in order to optimize the system. (4) For a cogeneration strategy, the influence of the separation of turbines on the performance of the combined KC/ORC coupling mode has not yet been properly quantified with respect to the production rate of green hydrogen.
In this respect, the present work uses data from the geothermal resources across the Democratic Republic of Congo to drive a zero-emission poly-generation energy system for simultaneous power and green hydrogen production. The suggested system integrates a combined ORC-KC mode (CoM) coupled to a proton exchange membrane (PEM) electrolyzer. Thereby, various operating conditions of the system are considered. They include the geothermal temperature and high pressure, as well as the terminal temperature difference and different concentration ratios of the working ammonia–water mixture. On this basis, a comprehensive thermodynamic analysis and an exergetic evaluation will be carried out to assess the effect of key system parameters on the performance of concurrent production of power and green hydrogen. One of the final objectives is to identify the optimal ammonia mass fraction of the basic solution that leads to an overall optimal system performance not only in terms of exergetic efficiency but also in regard to the green hydrogen production rate. Such an optimization task will be performed by means of a genetic algorithm optimization. Furthermore, the reference temperature will be finally adjusted to the optimal temperature obtained to demonstrate how this will lead to an increase in energy efficiency and hydrogen production and a decrease in the total exergy destruction rate in both operating configurations, with/without the separation of turbines.
Subsequent to this introduction, the Democratic Republic of Congo (DRC) geothermal potential is shortly outlined in Section 2. In Section 3, the system under study is described, and it is modeled in Section 4. The optimization algorithm is detailed in Section 5. All the results obtained are presented and discussed in Section 6. The essential findings are summarized in Section 7.
Table 1. Brief literature review on hydrogen production from various energy sources. Color coding is usually used to categorize hydrogen with respect to the energy source used for its production [5]. Green hydrogen is produced using renewable energy sources such as solar, wind, or geothermal energy. Grey and brown/black hydrogen when it is produced by methane steam reforming and gasification, respectively, and once combined with carbon capture and storage, blue hydrogen is produced. Pink hydrogen is generated through electrolysis powered by nuclear energy. Turquoise hydrogen is produced through the pyrolysis of methane, with solid carbon as a by-product. Yellow hydrogen is newly used for hydrogen, made through electrolysis using solar power, while white hydrogen is a naturally occurring, geological hydrogen found in underground deposits and created through fracking.
Authors/YearCogenerationEnergy SourcesWorking FluidsNet Power and Hydrogen Production
Yilmaz et al. [21] (2024)Geothermal cycle + ORC + PEME + OD (SiM)
(Green hydrogen, freshwater, and heat)
GeothermalOrganic fluid + water2046 kW; 0.002367 kg/s
Sabbaghi and Sefid [22] (2024)ORC + PEME (SiM)
(Electricity and green hydrogen)
GeothermalCarbon dioxide3.99 lit/s
Hajabdollahi et al. [23] (2023)Reverse osmosis desalination + ORC + PEME (SiM)
(Electricity, heating, hydrogen, and freshwater)
GeothermalOrganic fluid1556.2 kW; 0.42 m3/day
Wenqiang Li et al. [24] (2024)Double-flash cycle + PEME + PTC (SiM)
(Electricity and hydrogen)
GeothermalWater25.48 kg/h
Arslan et al. [25] (2024)Geothermal Power Plant (AFJES) + PEME (SiM)
(Electricity and hydrogen)
GeothermalWater4132 kW; 150 kg/s
Kun Li et al. [26] (2022)Flash-binary geothermal cycle + ERC + (KC + ERC) + PEME (SiM)
(Electricity, hydrogen, cooling, and freshwater)
GeothermalWater + Ammonia–water782 kW; 0.181 kg/h
Almutairi et al. [27] (2021)Flash-binary geothermal cycle + ORC + PEME (SiM)
(Electricity and hydrogen)
GeothermalOrganic fluid + Water128.16 kW; 0.39626 kg/h
Gao et al. [28] (2024)Steam-methanol reforming + KC + Flash-binary geothermal cycle (SiM)
(Electricity, hydrogen, and freshwater)
Geothermal–SolarAmmonia–water215.9 kW; 0.0224 kg/s
Shubo Zhang et al. [18] (2023)Parabolic trough solar collectors (PTSC) + KC + PEME + ARC (SiM)
(Electricity, hydrogen, and hot water)
Geothermal, biomass, SolarAmmonia–water3.71 MW; 11.42 kg/h
Laleh et al. [19] (2023)Brayton cycle + ORC + RC (CoM)
(Electricity and hydrogen)
BiomassLNG, Organic fluid, Water10 MW; 0.66 kg/s
Wang et al. [29] (2022)RC + PEME + Solid oxide electrolyzer (SOE) + Multi-effect desalination (MED) (SiM)
(Electricity, hydrogen, and freshwater)
BiomassWater1735 kW; 9880 kg/h
Karthikeyan et al. [30] (2024)Heat pump + ORC + PEME (SiM)
(Electricity, hydrogen, and heat)
Biomass–SolarOrganic fluid815 kW; 3 kg/h
Sharifishourabi et al. [31] (2025)KC + Alkaline electrolyzer + Refrigeration cycle (SiM)
(Electricity, hydrogen, cooling and heat)
Biomass–WindAmmonia–water5.38 kg/h
Forootan et al. [32] (2024)ORC + PEME + Brayton cycle + Multi-effect distillation (SiM)
(Electricity, oxygen, hydrogen, hot water and freshwater)
SolarOrganic fluid133 MW; 201.6 kg/h
Bamisile et al. [33] (2020)2 RC + PEME + SE-ARC + DE-ARC + PTC (SiM)
(Electricity, hydrogen, hot water, and freshwater)
SolarWater1027 kW; 0.9785 kg/h
Lykas et al. [34] (2023)ORC + PEME (SiM)
(Electricity and hydrogen)
SolarOrganic fluid24 kW; 0.205 kg/h
Mansir [11] (2024)Brayton cycle + PVT + KC + PEME (SiM)
(Electricity and hydrogen)
SolarCarbon dioxide +NH3H2O33,585 kW; 16.90 kg/day
Colakoglu and Durmayaz [12] (2022)Solar-tower + Brayton cycle + RC + KC (SiM)
(Electricity and hydrogen)
SolarOrganic fluid +NH3H2O1478 kW; 22.48 kg/h
Sharifishourabi et al. [20] (2024)RC + PEME + ORC + PTC + KC (CoM)
(Electricity and hydrogen)
SolarOrganic fluid +NH3H2O1957 kW; 1 kg/h
Effatpanah et al. [13] (2023)advanced alkaline electrolyzer (AAE) system + ORC + ARC + CPV/T system (SiM)
(Electricity, hydrogen, and cooling)
Solar–WindLiBr-H2O and organic fluid315 kW; 1.012 kg/s
Gargari et al. [35] (2018)Gas Turbine-Modular Helium Reactor (GT-MHR) and a biogas steam reforming (BSR) (SiM)
(Electricity and hydrogen)
BiogasMethane and carbon dioxide260.13 MW; 0.217 kg/s

2. Geothermal Potential in the DRC

The Democratic Republic of Congo, located in Central Africa, has considerable geothermal potential, but it is largely unknown and not yet evaluated. As part of the East African Rift region, characterized by recent deformation and volcanic activity, the DRC’s geological and tectonic history has been marked by various events that have fostered the development of a fracture system conducive to the circulation of hydrothermal fluids. This system has led to the emergence of geothermal springs in most of the country’s interior provinces, such as North Kivu, South Kivu, and Maniema, as well as in the south, formerly Katanga [36].
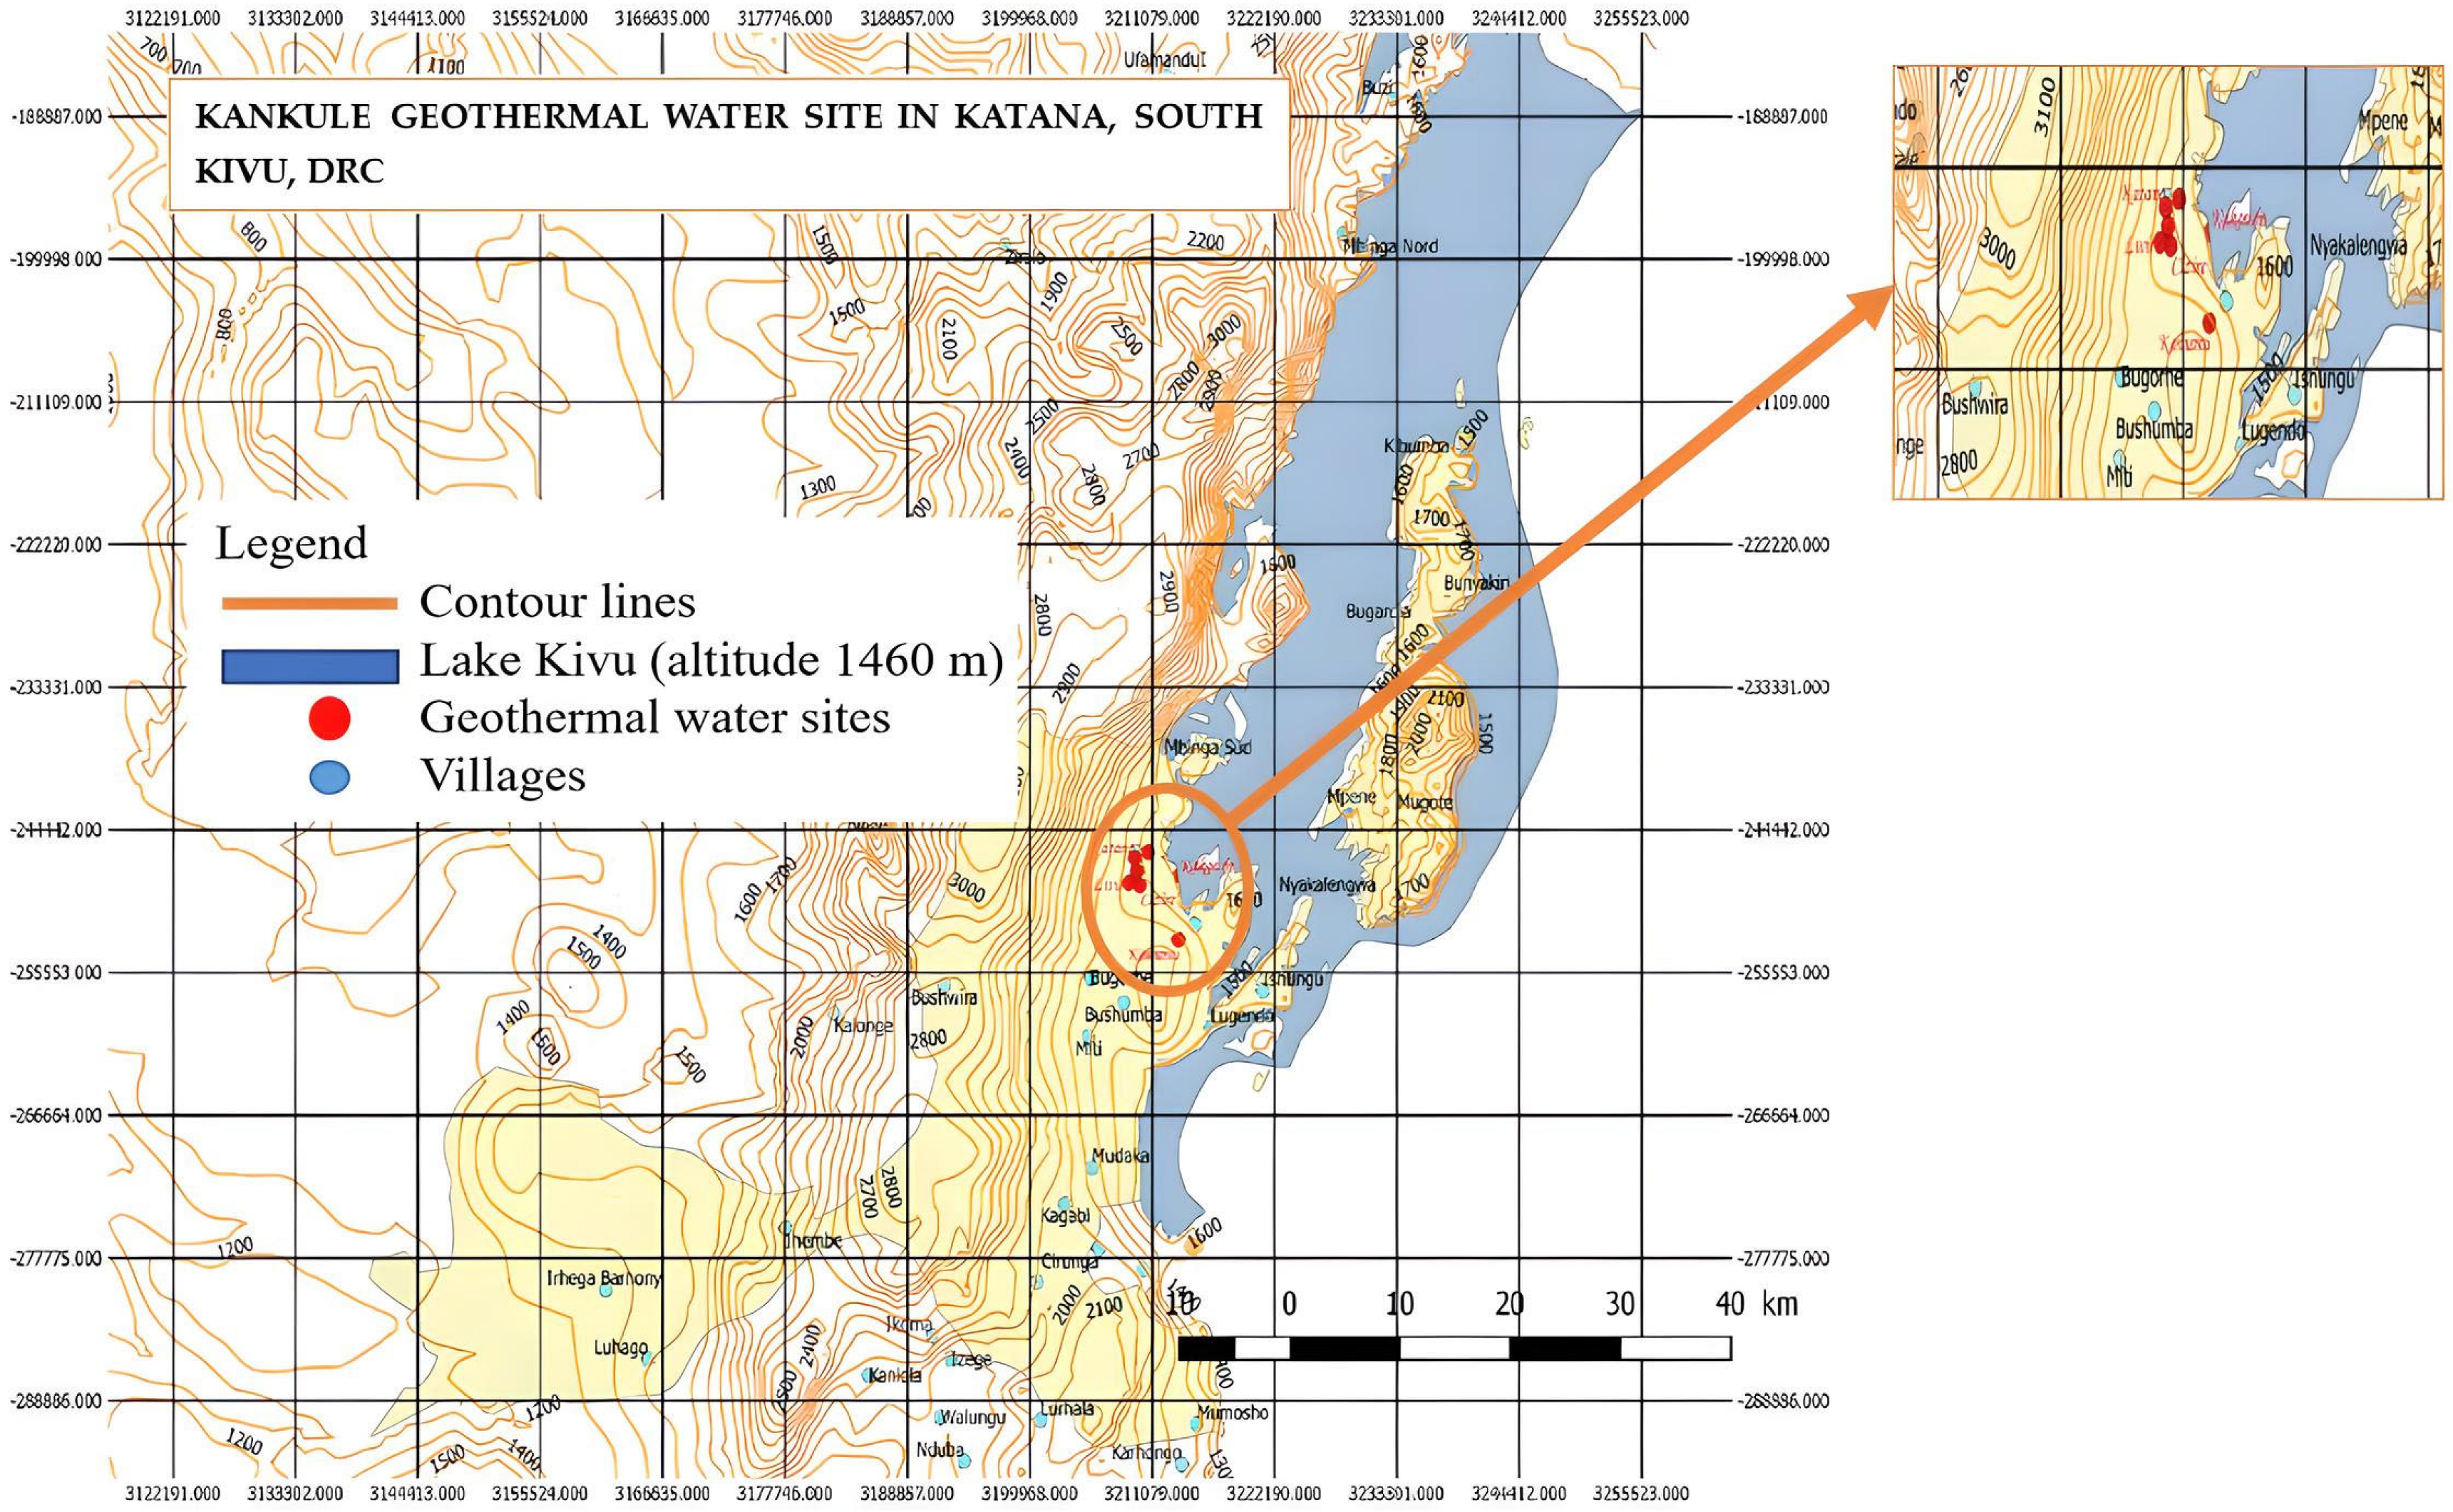
Given that the exploitation of these sources could catalyze the DRC’s economic development through geothermal projects, various studies are being carried out to explore the possibilities of using these geothermal resources to generate electricity [25]. For the first time, a geothermal power plant was erected in the former Katanga province, at the Kiabukwa site, in 1953, capable of generating 0.2 MW at a temperature of 91 °C [36,37]. Figure 1 shows several identified geothermal sites; some have not yet been studied in depth. Mulenda Adelin et al. [38] presented a perspective on a site at Kankule, located between the Bidagarha and Lwiro rivers, which flow from the Kahuzi forest, and situated in the Kahuzi Biega national park in South Kivu province. This site could produce up to 13 MW, including 2.1 MW in gross electrical output, with a maximum temperature of 203 °C. Table 2 provides a brief overview of potential geothermal sites by well temperature and depth.
In [38], some temperatures at the Kankule site as a function of depth are reported, all fed by the same source rock:
  • 90 °C corresponds to 1019.21 m.
  • 100 °C corresponds to 1231.54 m
  • 195 °C corresponds to 3333.66 m.
For the present analysis in this paper, geothermal energy data from the Kankule site in the DRC are selected for use.
Figure 1. Geolocation of the site of the geothermal water of Kankule in Katana, South Kivu, DRC (modified from [38]).
Fuels 06 00065 g001

3. System Description

3.1. Configurations Under Study
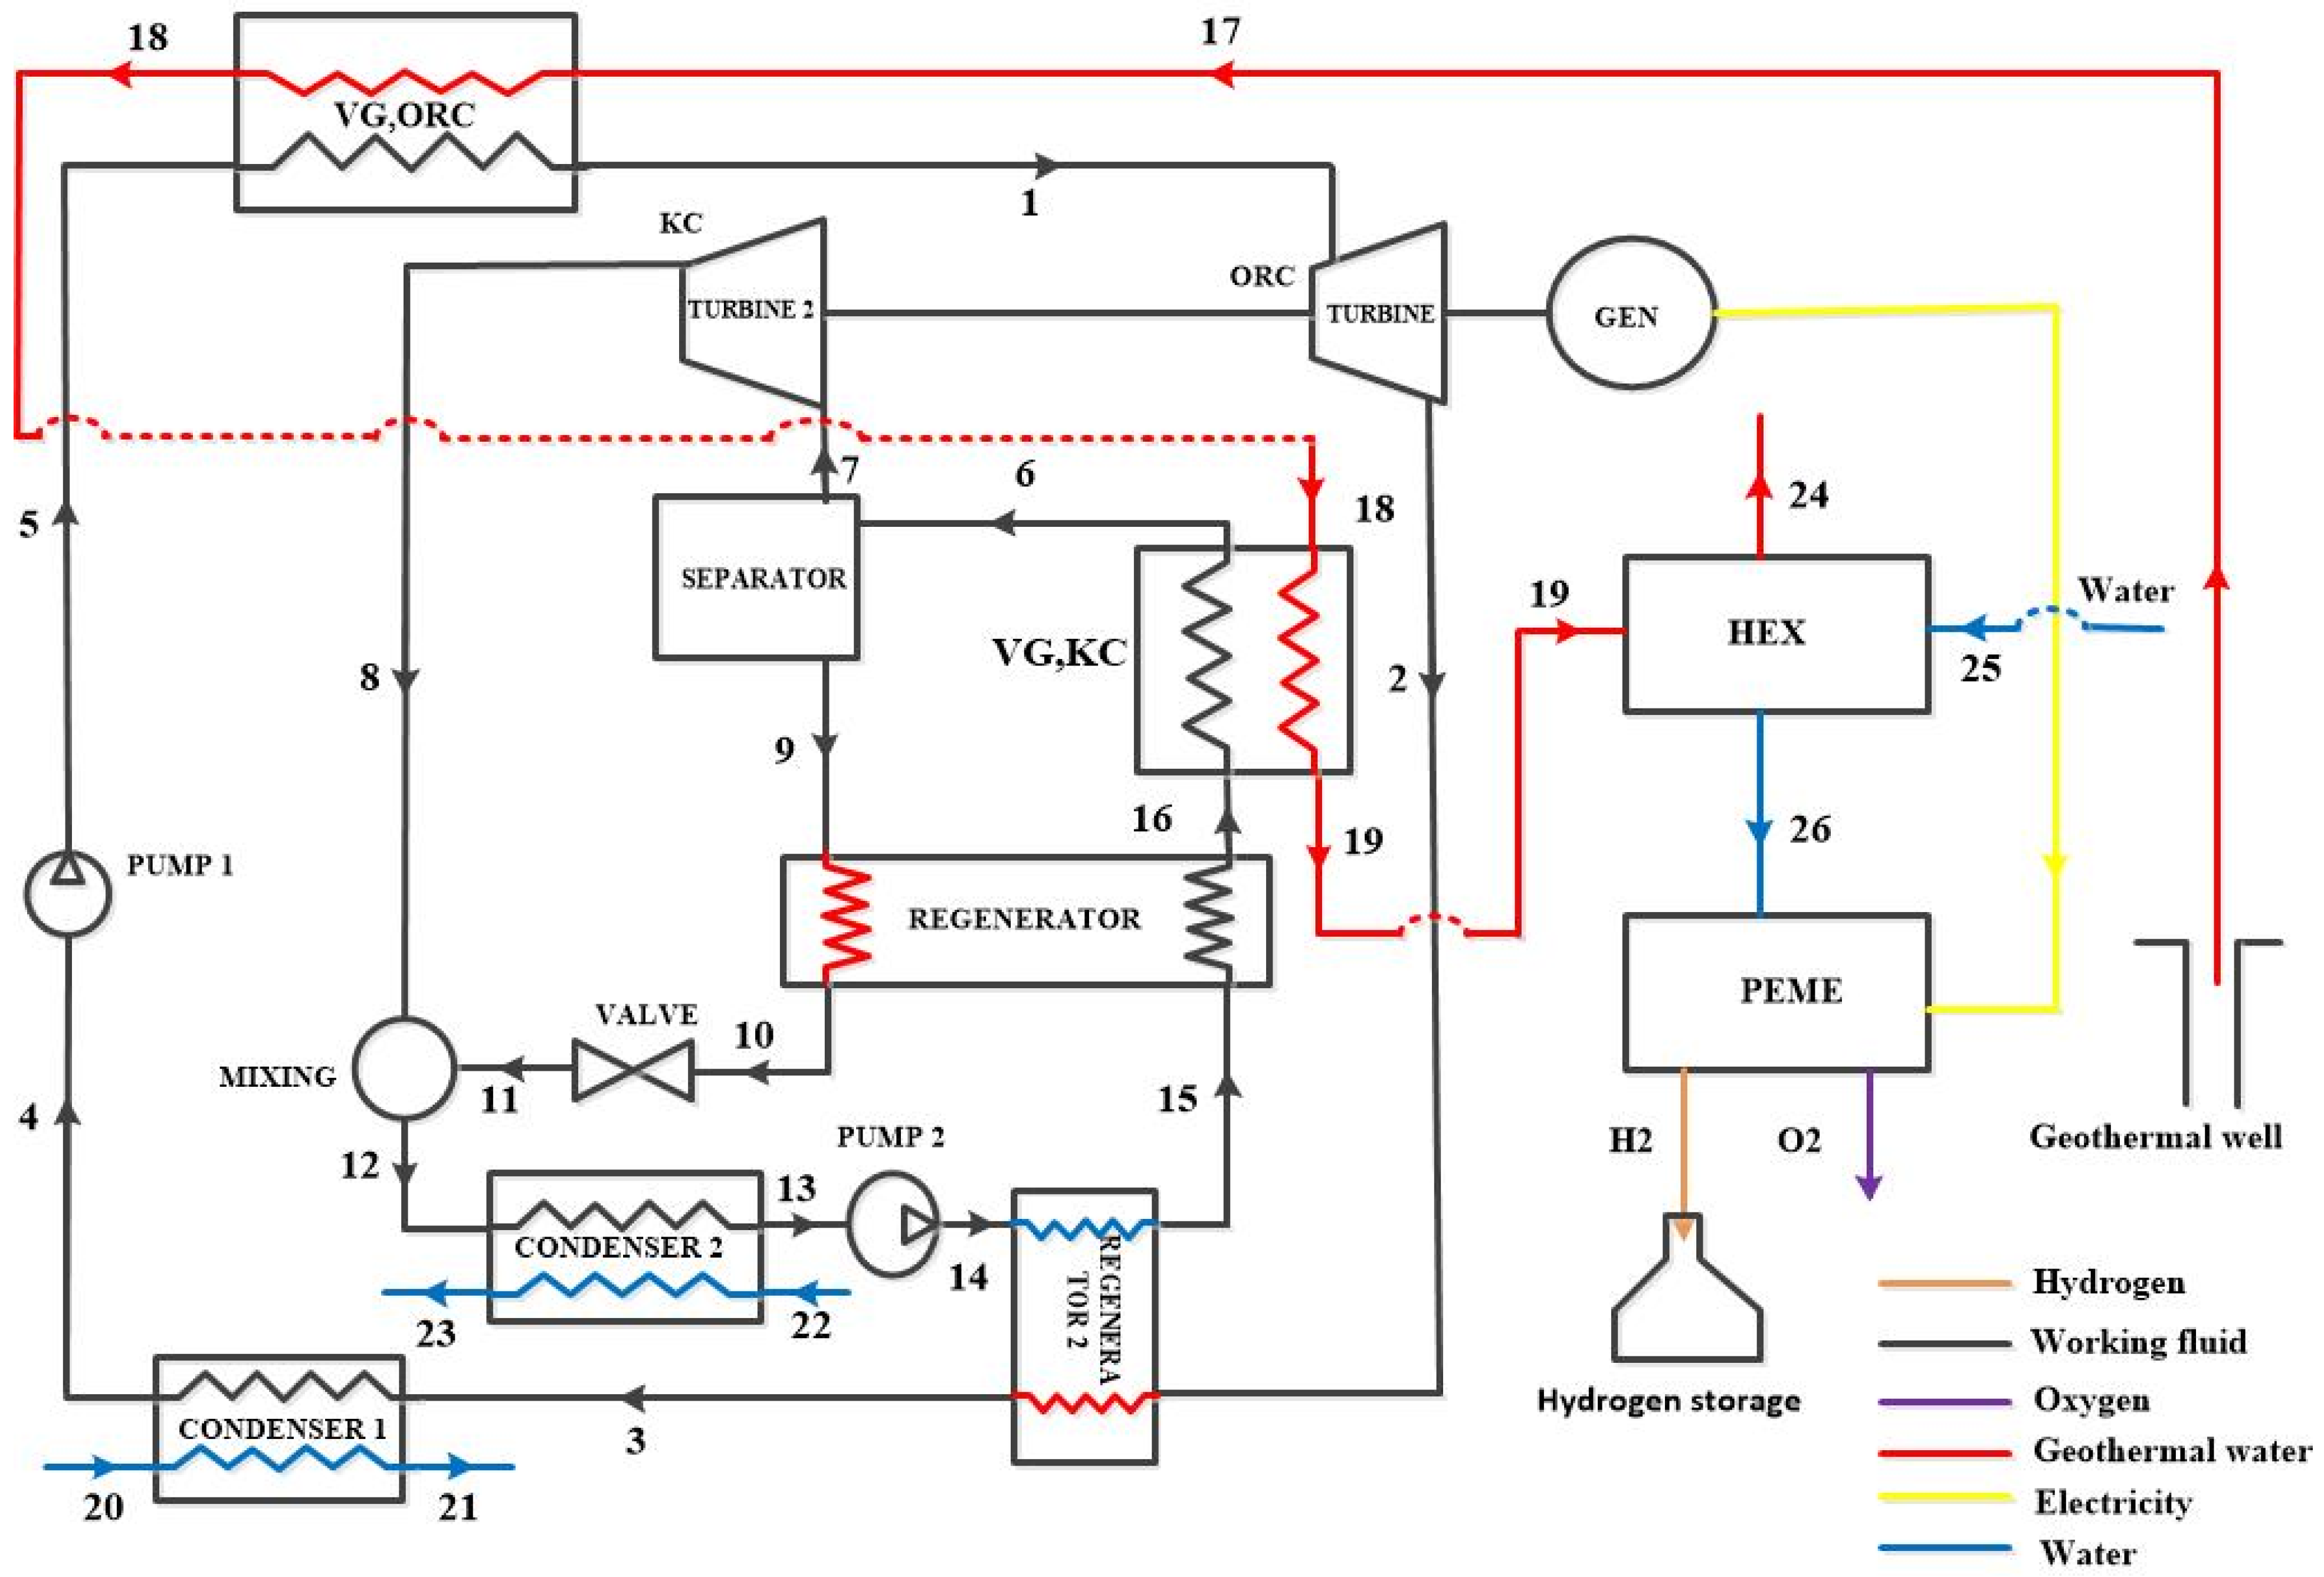
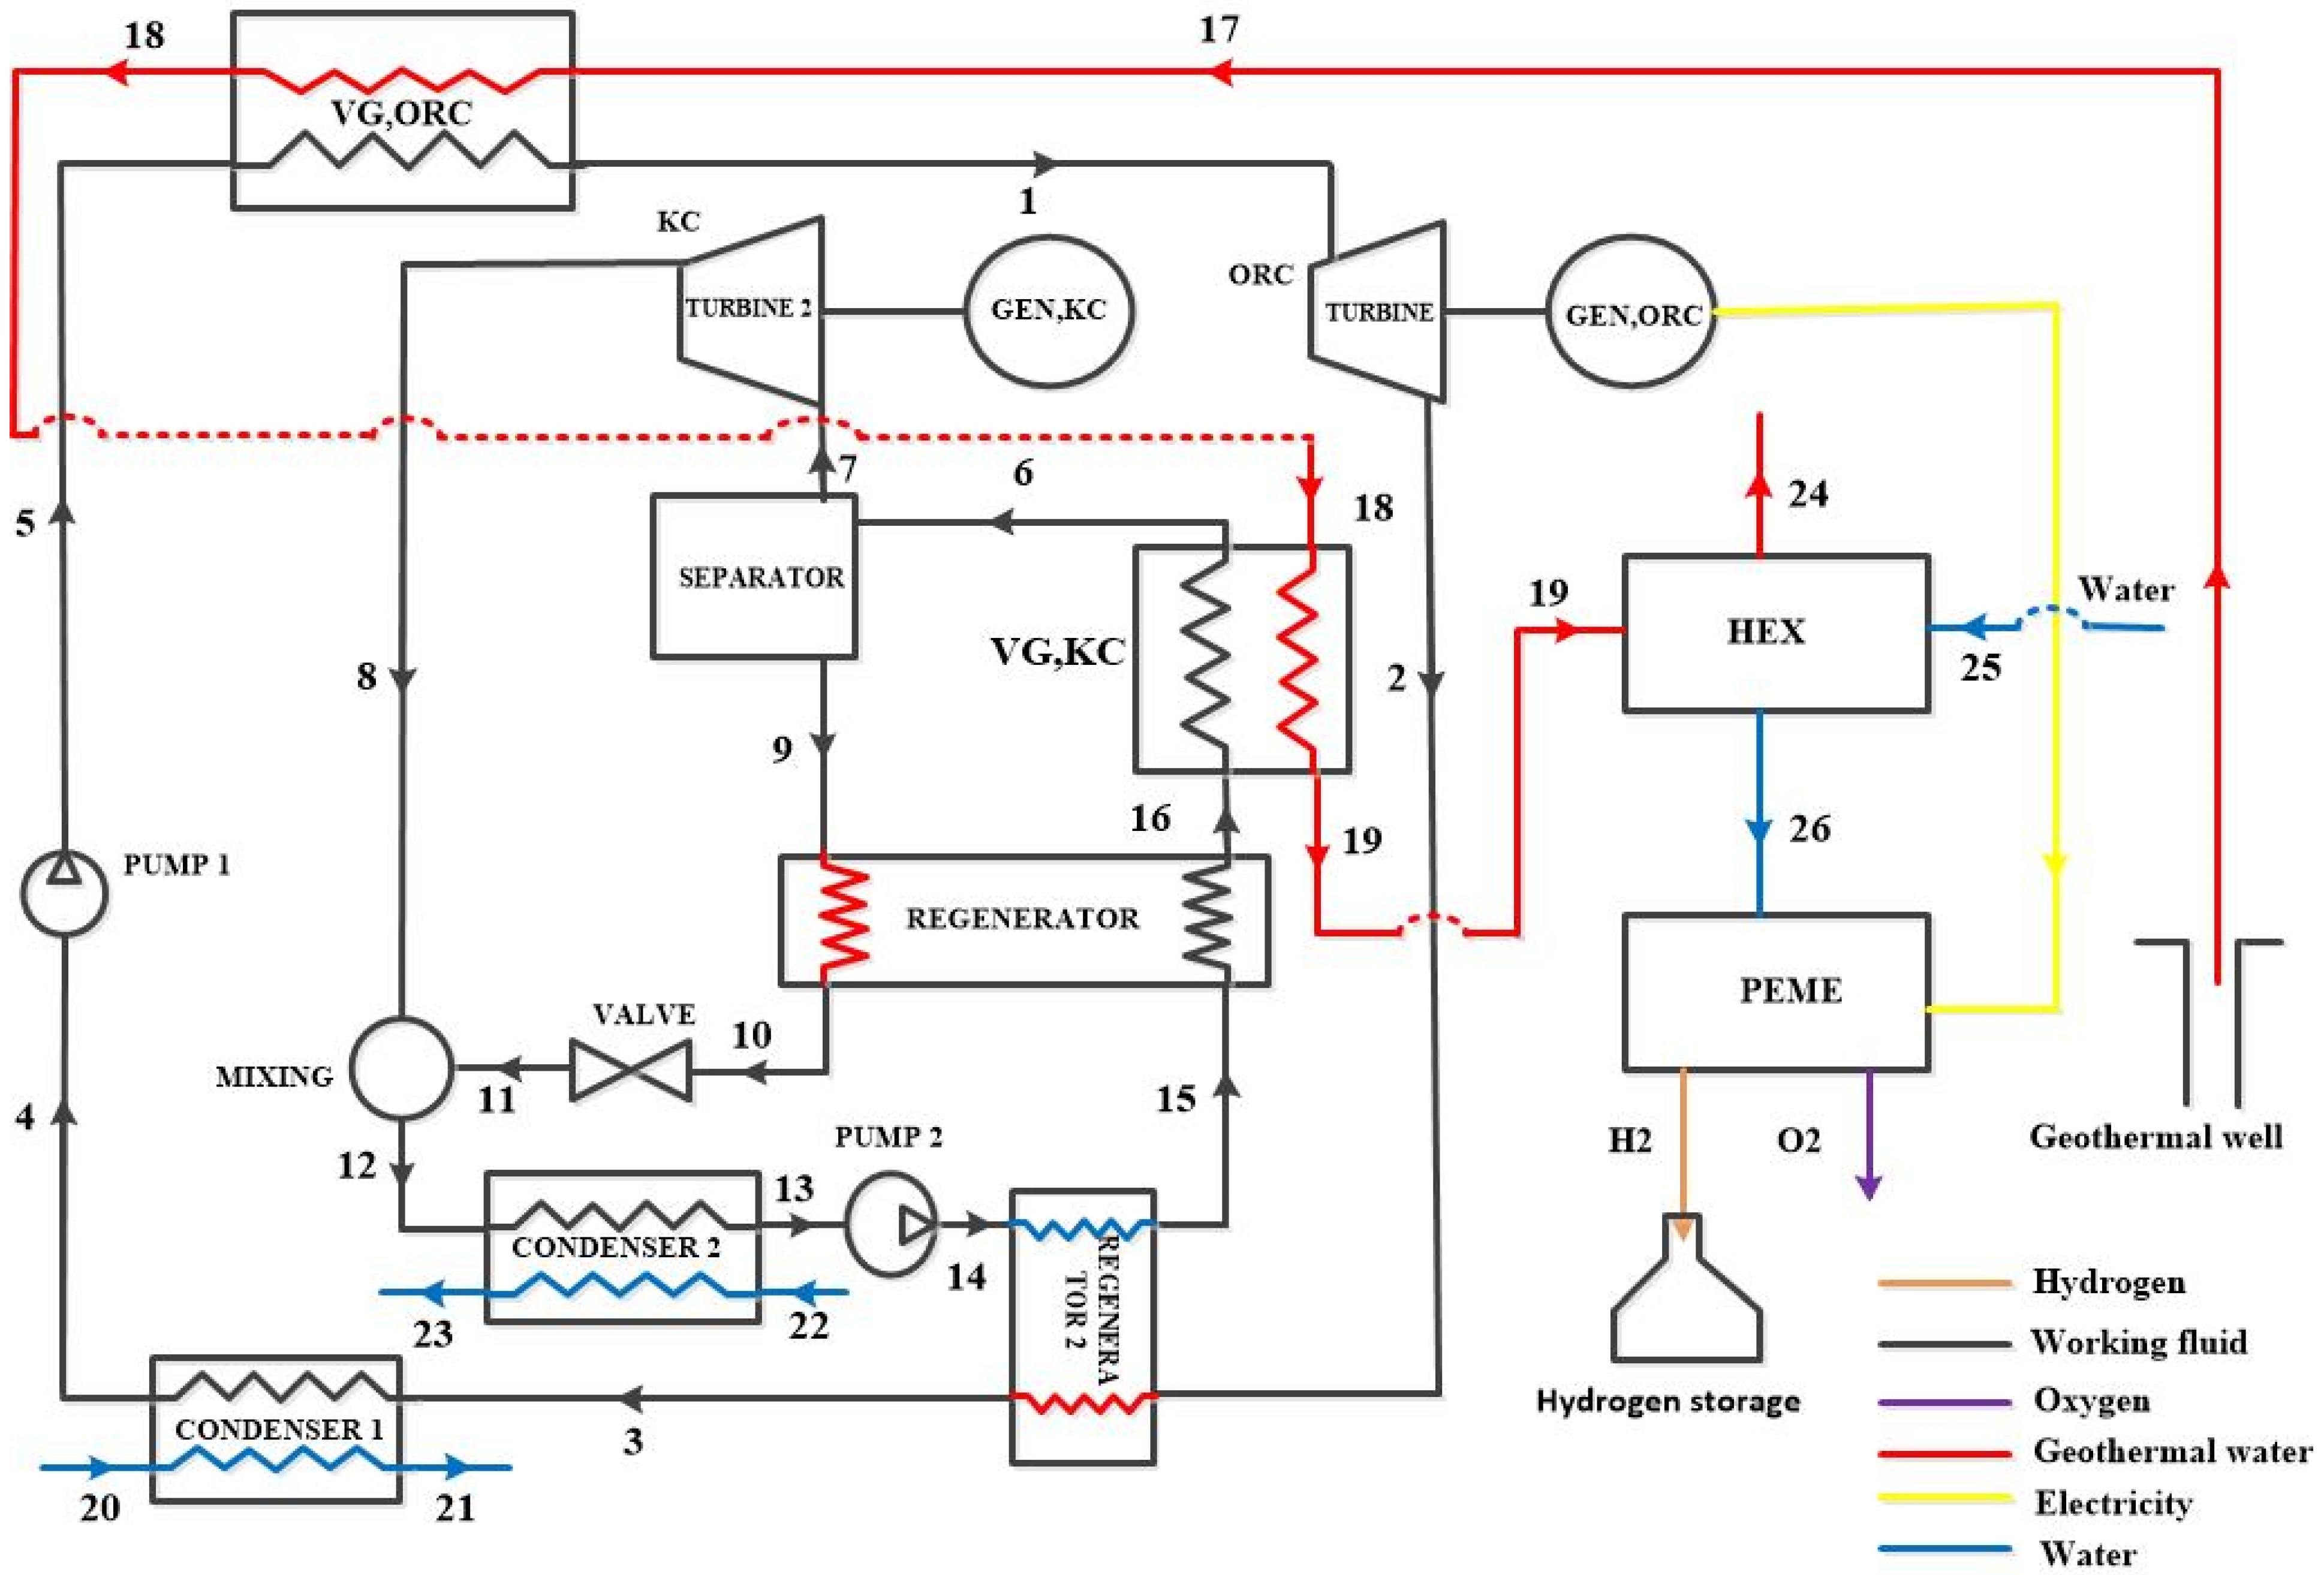
To produce both power and green hydrogen in an efficient way, the suggested system is composed by a combined ORC-KC mode coupled to a proton exchange membrane (PEM) electrolyzer, as displayed in Figure 2. The organic Rankine cycle (ORC) essentially consists of a vapor generator (VG, ORC), a turbine, a regenerator (REGENERATOR 2), a condenser (CONDENSER 1), and a pump (PUMP 1). The Kalina cycle (KC) mainly includes principally a vapor generator (VG, KC), a separator, a turbine (TURBINE 2), a regenerator (REGENERATOR 1), a mixer, an expansion valve, a condenser (CONDENSER 2), and a pump (PUMP 2). The hydrogen-production section comprises a proton exchange membrane electrolyzer (PEME) and a heat exchanger (HEX). In the ORC cycle, the organic fluid is pumped at point (4) to the vapor generator (VG, ORC) where it is vaporized before entering the ORC turbine at point (1) for expansion. On leaving the turbine (point 2), it transfers part of its thermal energy to the ammonia–water mixture in regenerator 2, thus improving the fluid temperature between points (14) and (15). After passing through the regenerator, the organic fluid is condensed in condenser 1 (point 3) before the cycle is repeated. In the Kalina cycle, the ammonia–water mixture is pumped from point (13) to point (14), heated in regenerator 2, and then further heated in regenerator 1 before being partially evaporated in the vapor generator (VG, KC). At the outlet of this generator (point 6), the mixture is sent to a separator where it is divided into two streams: the vapor phase rich in ammonia expands in the KC turbine to produce energy before returning to the mixer, while the liquid phase gives off heat in regenerator 1 before being expanded by a valve. The two streams are then recombined in the mixer before being condensed in condenser 2, continuing the cycle. The geothermal water, after passing through the VG, KC (point 19), is sent to a heat exchanger where it transfers its heat to the incoming water at point (25). This preheated water is then sent to the electrolyzer at point (26). In this first configuration (Figure 2), the electricity produced by the combined cycle also powers the electrolyzer, which produces green hydrogen and oxygen at its output.
In the second configuration in which the turbines are separated, Figure 3 represents the case in which the OR and Kalina cycles are used in a way that the power generated by the KC turbine is used for electricity production (KC-GEN), while the power generated by the ORC cycle is used for hydrogen production.
Figure 2. A poly-generation system consisting of a Kalina and organic Rankine combined cycles and driven by a geothermal energy source from the DRC.
Fuels 06 00065 g002
Figure 3. A poly-generation system with separate turbines (turbine ORC for hydrogen production and turbine KC for electricity production).
Fuels 06 00065 g003

3.2. Working Fluid Selection

In both configurations, the choice of working fluid is an essential element in the analysis of a thermodynamic system, since the chosen fluid must have specific thermo-physical properties essential to improve the system performance. The principle of the Kalina cycle is based on the use of a mixture that provides a progressive evaporation temperature and improves system performance. In this study, the working fluid selected for the Kalina cycle is the ammonia–water mixture, an azeotropic fluid. This mixture is particularly suitable for single-phase heat sources such as geothermal heat, biomass heat, and industrial waste heat [39].
Experimental studies have been conducted to evaluate the corrosion resistance of various materials in this environment, particularly at elevated temperatures. The results demonstrated that several grades of stainless steel, as well as titanium, exhibit good corrosion resistance under these conditions [40]. Additionally, experimental tests identified several effective chemical protection strategies against corrosion. Cerium nitrate, in particular, proved to be a promising inhibitor owing to its ability to form a protective layer on the surface of materials, considerably reducing corrosion [41]. Experiments with potassium dichromate also produced interesting results [42].When combined with materials such as Inconel 625 and stainless steel 316, these approaches demonstrated excellent corrosion resistance, offering reliable solutions for aggressive environments [43].
For the organic Rankine cycle, the selection of working fluids is based on two main environmental criteria: ozone depletion potential (ODP) and global warming potential (GWP) [44]. These criteria are supplemented based on safety considerations, including non-flammability and chemical stability. Five working fluids were selected for this study: R152a, R236fa, MD2M, isobutane, and isobutene. Table 3 summarizes some of their properties. Öksel and Koç [45] analyzed a combined KC and ORC cascade system using an ammonia–water mixture and other organic fluids. They concluded that the combination of KC and ORC could be used effectively to recover waste heat. This conclusion attests to the compatibility of the ammonia–water mixture and organic fluid.

4. Modeling System

4.1. Assumptions

The analysis of these configurations is carried out using appropriate codes developed within the EES software (version 10) based on following assumptions:
  • The model operates under steady-state conditions;
  • Pressure drops in all piping are neglected;
  • The vapor at the turbine inlet is considered to be in a state of dry saturation;
  • It is assumed that the fluid leaving the condensers is saturated;
  • Flow through throttle valves are isenthalpic.
In addition to the stated assumptions, Table 4 lists other thermodynamic input parameters that must be identified to evaluate the performance of this model.

4.2. Proton Exchange Membrane Electrolyzer (PEME)

The energy produced by the combined ORC–KC system is applied to the PEM electrolyzer to produce green hydrogen. In a water electrolyzer, hydrogen is produced via a chemical reaction, as shown in Equation (1). This reaction takes place at the anode and cathode of the PEM. Equations (2) and (3) represent these reactions. Equation (4) determines the energy required for these reactions.
H 2 O H 2 + 1 2 O 2
H 2 O 1 2 O 2 + 2 H + + 2 e
2 H + + 2 e H 2
G = H T S
where G represents the change in the Gibb’s free energy, G. In this study, it is assumed that the system temperature remains constant during the electrolysis process.
The following equation can be used to determine the molar flow rate of hydrogen production [47]:
m ˙ H 2 = J 2 F
where J and F are the faraday constant and the current density, respectively.
The power required by the electrolyzer to operate is expressed as follows [43,44]:
W ˙ P E M E = W ˙ n e t = J · V  
V = V O + V a c t , a + V a c t , c + V o h m
where V , V O ,   V a c t , a ,   V a c t , c , and V o h m represent the overpotential, reversible potential, cathode and anode overpotential, and ohmic overpotential, respectively. Based on the equations given in the literature, the quantities can be modeled [48,49,50,51]. The thermal efficiency of PEME can be calculated as follows [47]:
η P E M E = m ˙ H 2 · L H V m ˙ 26 h 26 + W ˙ P E M E

4.3. Organic Rankine Cycle (ORC) and Kalina Cycle (KC) Modeling

4.3.1. Energy Modeling

The energy analysis of the system can be expressed in the general form of steady-state mass and energy equations [52]:
m ˙ i n = m ˙ o u t
m ˙ i n x i n = m ˙ o u t x o u t
Q ˙ W ˙ = m ˙ i n h i n m ˙ o u t h o u t
where m ˙ is mass flow rate, x ammonia mass fraction, Q ˙ is the heat rate, W ˙ is work, and h is the specific enthalpy.

4.3.2. Exergy Modeling

Based on the second law of thermodynamics, the concept of exergy refers to the potential or availability of energy to perform work. In simple terms, it is the maximum useful work that can be extracted from a system relative to a defined reference state [53]. This shows that exergy is a more refined interpretation of energy. Exergy consists of four elements: chemical, kinetic, physical, and potential. Under the assumptions of this study, the effects of chemical, kinetic, and potential exergy are considered negligible.
According to this Equation (12), the exergy rate E ˙ x is obtained by multiplying the mass flow by the exergy value [52]:
E ˙ x = m   ˙ [ ( h h 0 ) T 0 ( s s 0 ) ]
The exergy balance equation of a system can be formulated as follows [52]:
E x ˙ Q + i n m ˙ i n e x i n = o u t m ˙ o u t e x o u t E x ˙ W + E x ˙ D
where E x ˙ W , E x ˙ D , and E x ˙ Q are the work, exergy destruction, and rate of heat transfer, respectively. Other expressions used in the above equation can defined as follows [54]:
E x ˙ D = T 0 S ˙ g e n
where T 0 and S ˙ g e n are the reference temperature and entropy generation, respectively.
Finally, the thermal, exergetic, and overall efficiency are expressed by the following [55,56]:
η t h = W ˙ n e t Q ˙ i n
Q ˙ i n = Q ˙ v g , o r c + Q ˙ v g , k c
η e x = W ˙ n e t E ˙ i n
E ˙ i n = E ˙ V G , O R C + E ˙ V G , K C
η s y s t = W ˙ n e t + m ˙ H 2 · L H V Q ˙ i n + Q ˙ H E X
The remaining thermodynamic modeling equations are summarized in Table 5.

4.4. Economic Modeling

When conducting a study of systems, economic modeling can be used to calculate certain economic parameters, such as the total investment cost (TIC) and discounted payback time (DPT). Table 6 shows the Z k ($) equations used for each component. The equations should therefore be updated to the current year by using the chemical engineering plant cost (CEPCI). For this study, the year 2024 is chosen as the desired update year for all costs.
The sum of the discounted purchase costs of all system components gives the equipment cost Z e q , which is derived from Equation (20) as in [59,60].
Z e q = Z k
where Z k is the cost of investment of each component. For heat exchangers, the component cost is obtained as follows:
Z k = Z R , k ( A k A R ) 0.6
Z k , 2024 = Z k ( C o s t   i n d e x 2019 C o s t   i n d e x 2000 )
where Z R , k and A R are the heat exchanger reference cost and area, respectively, and their values are given in [59]. A k is the heat transfer surface area of a heat exchanger and is defined as follows:
Q k = U k A k   L M T D k
Here, Q k represents the heat quantity of the component, and U k represents the heat transfer coefficient of the component, as given in [59,60]. LMTD corresponds to the logarithmic mean temperature difference and is defined by the following equation:
L M T D k = [ T h , i n T c , o u t ] [ T h , o u t T c , i n ] l n [ T h , i n T c , o u t ] [ T h , o u t T c , i n ]
The cost of PEME can be expressed as follows [50,51,52,53,54,55,56,57,58,59,60,61]:
Z P E M E = 1000 W P E M E
In terms of equipment costs, there are three remaining expenses, namely Z c i v i l (cost of civil construction), Z c o n t i n (cost of contingency), and Z e n g (cost of engineering and supervision). They are expressed as follows [59]:
Z c i v i l = 0.2 Z e q
Z c o n t i n = 0.15 Z e q
Z e n g = 0.15 ( Z c i v i l + Z c o n t i n + Z e q )
The following formulas are used to determine the TIC and the annual cost rate (ACR):
T I C = Z e n g + Z c i v i l + Z c o n t i n + Z e q
A C R = T I C C R F + A O M C
The levelized cost of hydrogen production (LCOH) is defined as follows [62]:
L C O H = A C R m ˙ H 2 3600 7500
where C R F refers to the capital recovery factor and ϕ represents the maintenance factor. C R F is obtained in terms of interest rate (i) and the life cycle ( N ) of the system:
C R F = i ( 1 + i ) N ( 1 + i ) N 1
Here, N is the lifetime, and the values of i, ϕ , and N are 0.15, 0.06, and 20, respectively [53,60].
The other economic parameters, discounted payback time (DPT), annual operating and maintenance cost (AOMC), and annual cash flow from energy production (AEPCF), can be modeled according to [59].

5. Optimization

In the analysis of thermal systems, the aim of optimization is generally to maximize both thermal and exergy efficiency, in accordance with the laws of thermodynamics. This optimization can be carried out using a variety of methods, depending on the precise objectives to be achieved. In this study, the genetic algorithm (GA) was selected for its relevance. This approach is based on heuristic numerical search methods that reproduce the principles of naturel selection in biological evolution [63]. Furthermore, the genetic algorithm method is the most comprehensive and robust optimization method used in the EES software [64].
Various steps are implemented to optimize this operation: initialization, ability assignment, crossover, and mutation. The whole process is aimed at optimizing (i.e., maximizing) particular objectives as a function of the selected design variables [65]. Thermal efficiency and exergy efficiency are the objective function in this study. GA optimization parameters and decision variables are presented in Table 7 and Table 8, respectively. The single-objective optimization model for thermodynamic performance can be described as follows:
m a x ( η t h   o r   η e x ) = f ( P h i g h , T s o u r c e , T T D , x b a s i c )

6. Results and Discussion

6.1. Validation Model

In order to confirm the accuracy of the results obtained from the thermodynamic simulation of the system under study (Figure 2), an appropriate code has been created using the Engineering Equation Solver (EES) software for a comparison with results obtained from the literature. Three cases were selected from the literature, and each case is simulated under the same operating conditions. The thermodynamic simulation results are presented and compared in Table 9, Table 10 and Table 11 between the current work and references [67], for the ORC system, the KC system, and the PEME system, respectively. It appears in Table 9 and Table 10 that simulation results are close to those reported in the literature.

6.2. Thermodynamic Results

The simulation of the proposed system was performed using EES software according to the input parameters presented in Table 3. As part of this simulation, the impact of critical operating conditions (such as high pressure, geothermal source temperature, ammonia basic concentration, and terminal temperature difference) on the thermodynamic performance of the system was evaluated in this section. This includes elements such as net power, hydrogen production, and energy and exergy efficiency. In this study, the oxygen production rate is not taken into account, following the approach of Lykas et al. [34]. In some studies, a separator is integrated at the oxygen outlet to separate the pure oxygen from water. The latter is then reinjected into the PEME water supply circuit as described by Ghaebi et al. [69] and Akrami et al. [70]. An integrated solid oxide fuel cell and gas turbine combined with a biogas reforming cycle for the cogeneration of power and hydrogen was reported by Soleymani et al. [71] who considered a PEME water supply.

6.2.1. Overall Thermodynamic Evaluation Results

Table 12 presents the results obtained after simulating the different working fluid combinations (ammonia–water + organic fluid). It shows that the ammonia–water + MD2M combination gives the best performance compared to the other combinations. On this basis, all the remaining results are presented only for the ammonia–water + MD2M combination. Table 13 summarizes the results obtained after simulation for this combination It also includes the results of an economic study which allows us to determine the total investment and payback time of $3,342,000 and 5.37 years, respectively.
The levelized cost of hydrogen (LCOH) for the proposed system is estimated at 3.007 USD/kg H2, aligning well with values reported in the literature. For instance, Kasuyoka [72] reported an LCOH ranging from 3.3 to 5.01 USD/kg H2 for hydrogen production from geothermal sources. Similarly, Hamlehdar et al. [73] found that for ORC and Kalina cycle systems utilizing geothermal energy, the LCOH varied between 2.0 and 7.0 USD/kg H2.
With respect to the thermodynamic properties for each state of the system for different working fluids, Table A1, Table A2, Table A3, Table A4 and Table A5 in Appendix A present the results of these properties in different system states for NH3H2O–isobutane, NH3H2O–isobutene, NH3H2O–R236fa, NH3H2O–MD2M, and NH3H2O–R152fa, respectively.

6.2.2. Effect of Operating Conditions on Thermodynamic Quantities and Exergetic Analysis

This section analyzes the impact of the proposed system’s key operating conditions (high pressure, geothermal temperature, ammonia concentration, and terminal temperature difference) on the system performance (net power, hydrogen production, thermal efficiency, and exergy efficiency) and explains the physical mechanisms underlying the results (Figure 4, Figure 5, Figure 6, Figure 7, Figure 8, Figure 9 and Figure 10).
Increasing the geothermal temperature improves the net power, hydrogen production, energy efficiency, and exergy efficiency. This is due to an increase in the mass flow rate of the rich solution in the separator and in the VG, KC and an increase in the enthalpy drop in the turbines as the source temperature increases. At low inlet temperatures, the rate of increase in heat absorbed by the system is less than the rate of increase in net power. At high inlet temperatures, however, this trend is reversed, resulting in an increase in thermal and exergy efficiency up to a threshold temperature.
An increase in the ammonia concentration (X_basic) leads to an increase in the power extracted by the turbine, resulting in an increase in the net power of the system. This improvement is mainly due to the increase in mass flow through the separator, which promotes increased ammonia vapor production. This increase in mass flow also contributes to improved hydrogen production. However, the results show that the rate of increase in net power is higher than the rate of increase in heat absorbed by the system. As a result, thermal and exergy efficiency reach a maximum for an optimal value of X_basic and then decrease. It should be noted that the variation in the ammonia concentration does not directly affect the turbine of the ORC cycle. Since the total power of the system is equal to the sum of the power of the two turbines, an increase in the power produced by the KC turbine leads to an improvement in the net power and an increase in hydrogen production.
As the high pressure increases, the mass flow of the working fluids decreases. At the same time, the enthalpy in the turbines decreases. The combined effect of these two effects is that net power increases and then decreases. Since hydrogen production is related to net power, it also increases. Energy and exergy efficiencies continue to increase until a certain pressure is reached. This is due to the nonlinear behavior of the sliding temperature profiles of the mixtures during evaporation in the vapor generator (VG, KC) at a given pressure. As highlighted by Mergner and Weimer [39], this phenomenon influences the exergy losses associated with heat transfer.
An increase in the TTD decreases the temperature of the vapor generator, thus reducing the input enthalpy and mass flow into the turbine, which leads to a reduction in the power produced by the turbine, which in turn reduces the net power, hydrogen production, and thermal and exergy efficiencies of the system.

6.2.3. Effect of Geothermal Temperature on the System Performance
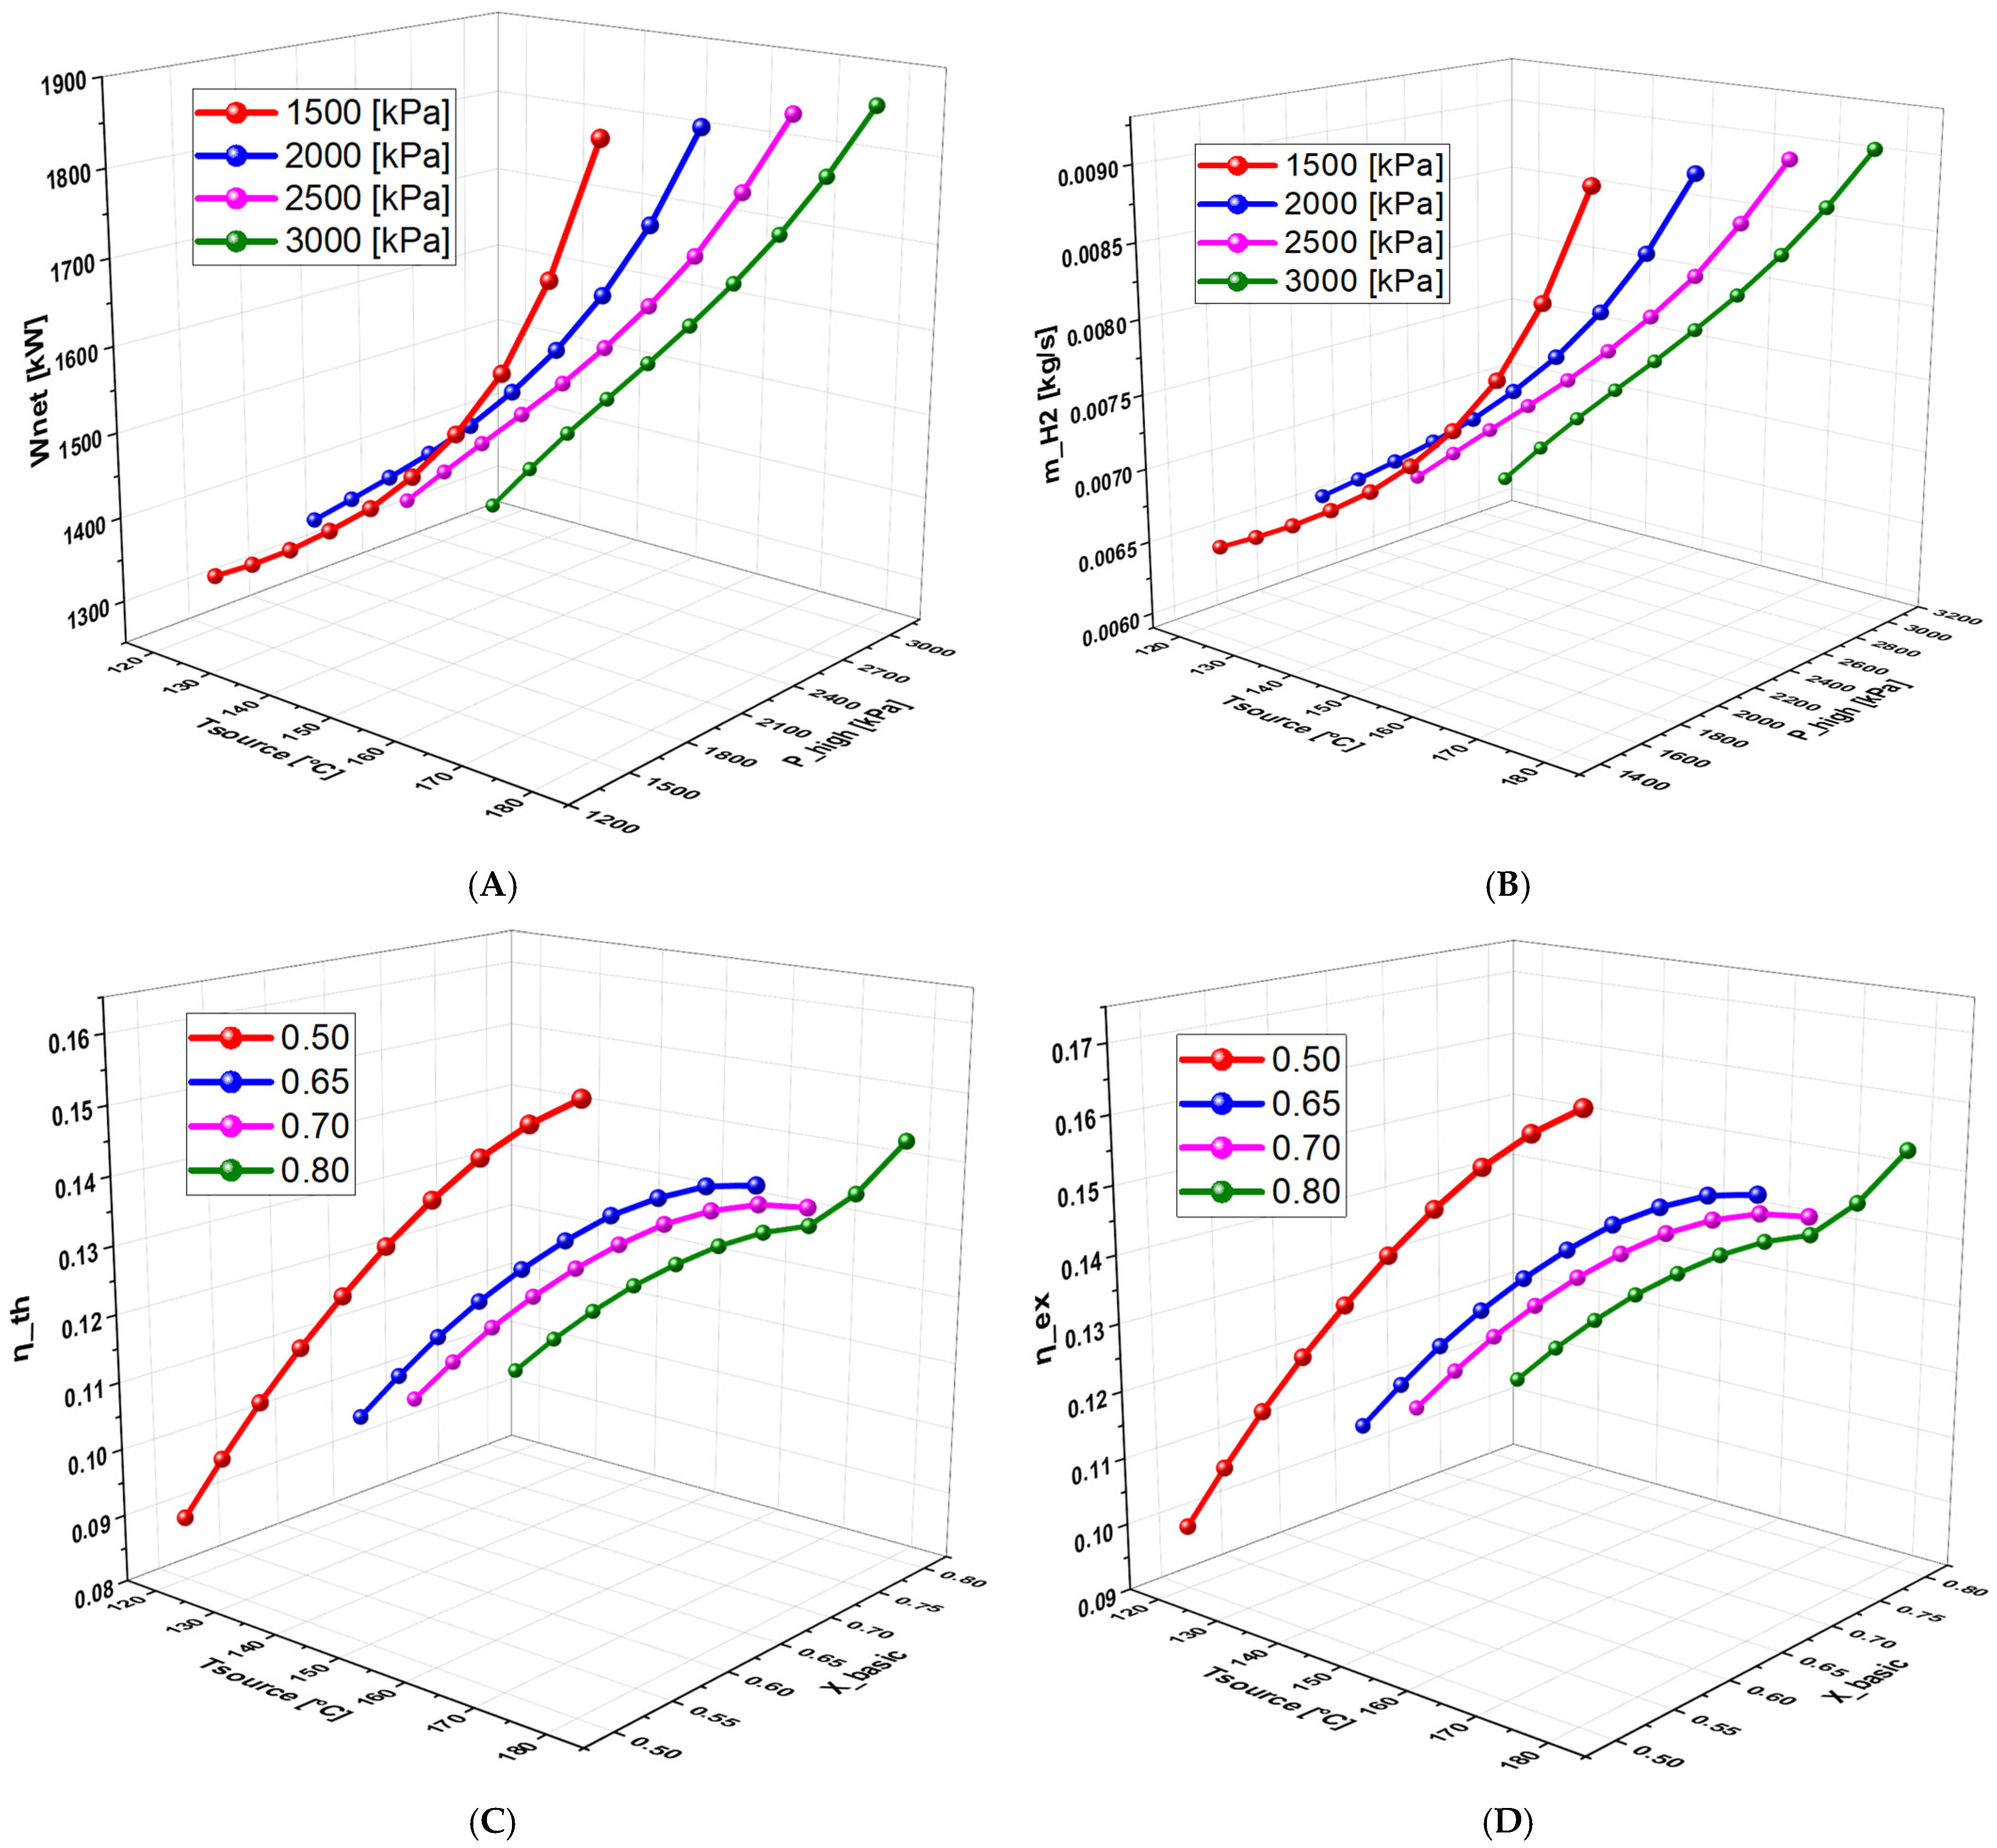
Figure 4 illustrates the effect of the geothermal source temperature (Tsource) on system performance for a terminal temperature difference (TTD) maintained at 10 °C. Figure 4A,B show the evolution of net power (Wnet) and hydrogen production (ṁ_H2) as a function of T_source, respectively, for different values of high pressure. It is clear that increasing the geothermal temperature leads to a simultaneous improvement in net power and hydrogen production. The maximum power is obtained at a pressure of 1500 kPa, with a net power of 1895 kW and hydrogen production of 0.009221 kg/s (796.694 kg/day). Figure 4C,D depict the energy and exergy efficiencies as a function of Tsource for different ammonia concentrations of the NH3-H2O mixture in the coupled ammonia–water/organic fluid combination. These efficiencies also increase with temperature. A mass concentration of 0.50 gives the best results in terms of efficiency. This can be well understood by knowing first that the concentration of ammonia in the working fluid influences the pressure and temperature at which the ammonia evaporates. Second, the latent heat absorbed during evaporation is directly related to the amount of ammonia vaporized and the enthalpy of vaporization. Third, the concentration of ammonia also affects the heat transfer characteristics of the heat exchangers involved. Thus, carefully selecting the ammonia concentration allows for a balance among the evaporation temperature, latent heat absorbed, and heat exchange quality with the source, finally resulting in higher system performance and efficiency.
Figure 4. Effect of geothermal temperature on (A) net power, (B) hydrogen production, (C) thermal efficiency, and (D)exergy efficiency.
Fuels 06 00065 g004

6.2.4. Effect of High Pressure on System Performance
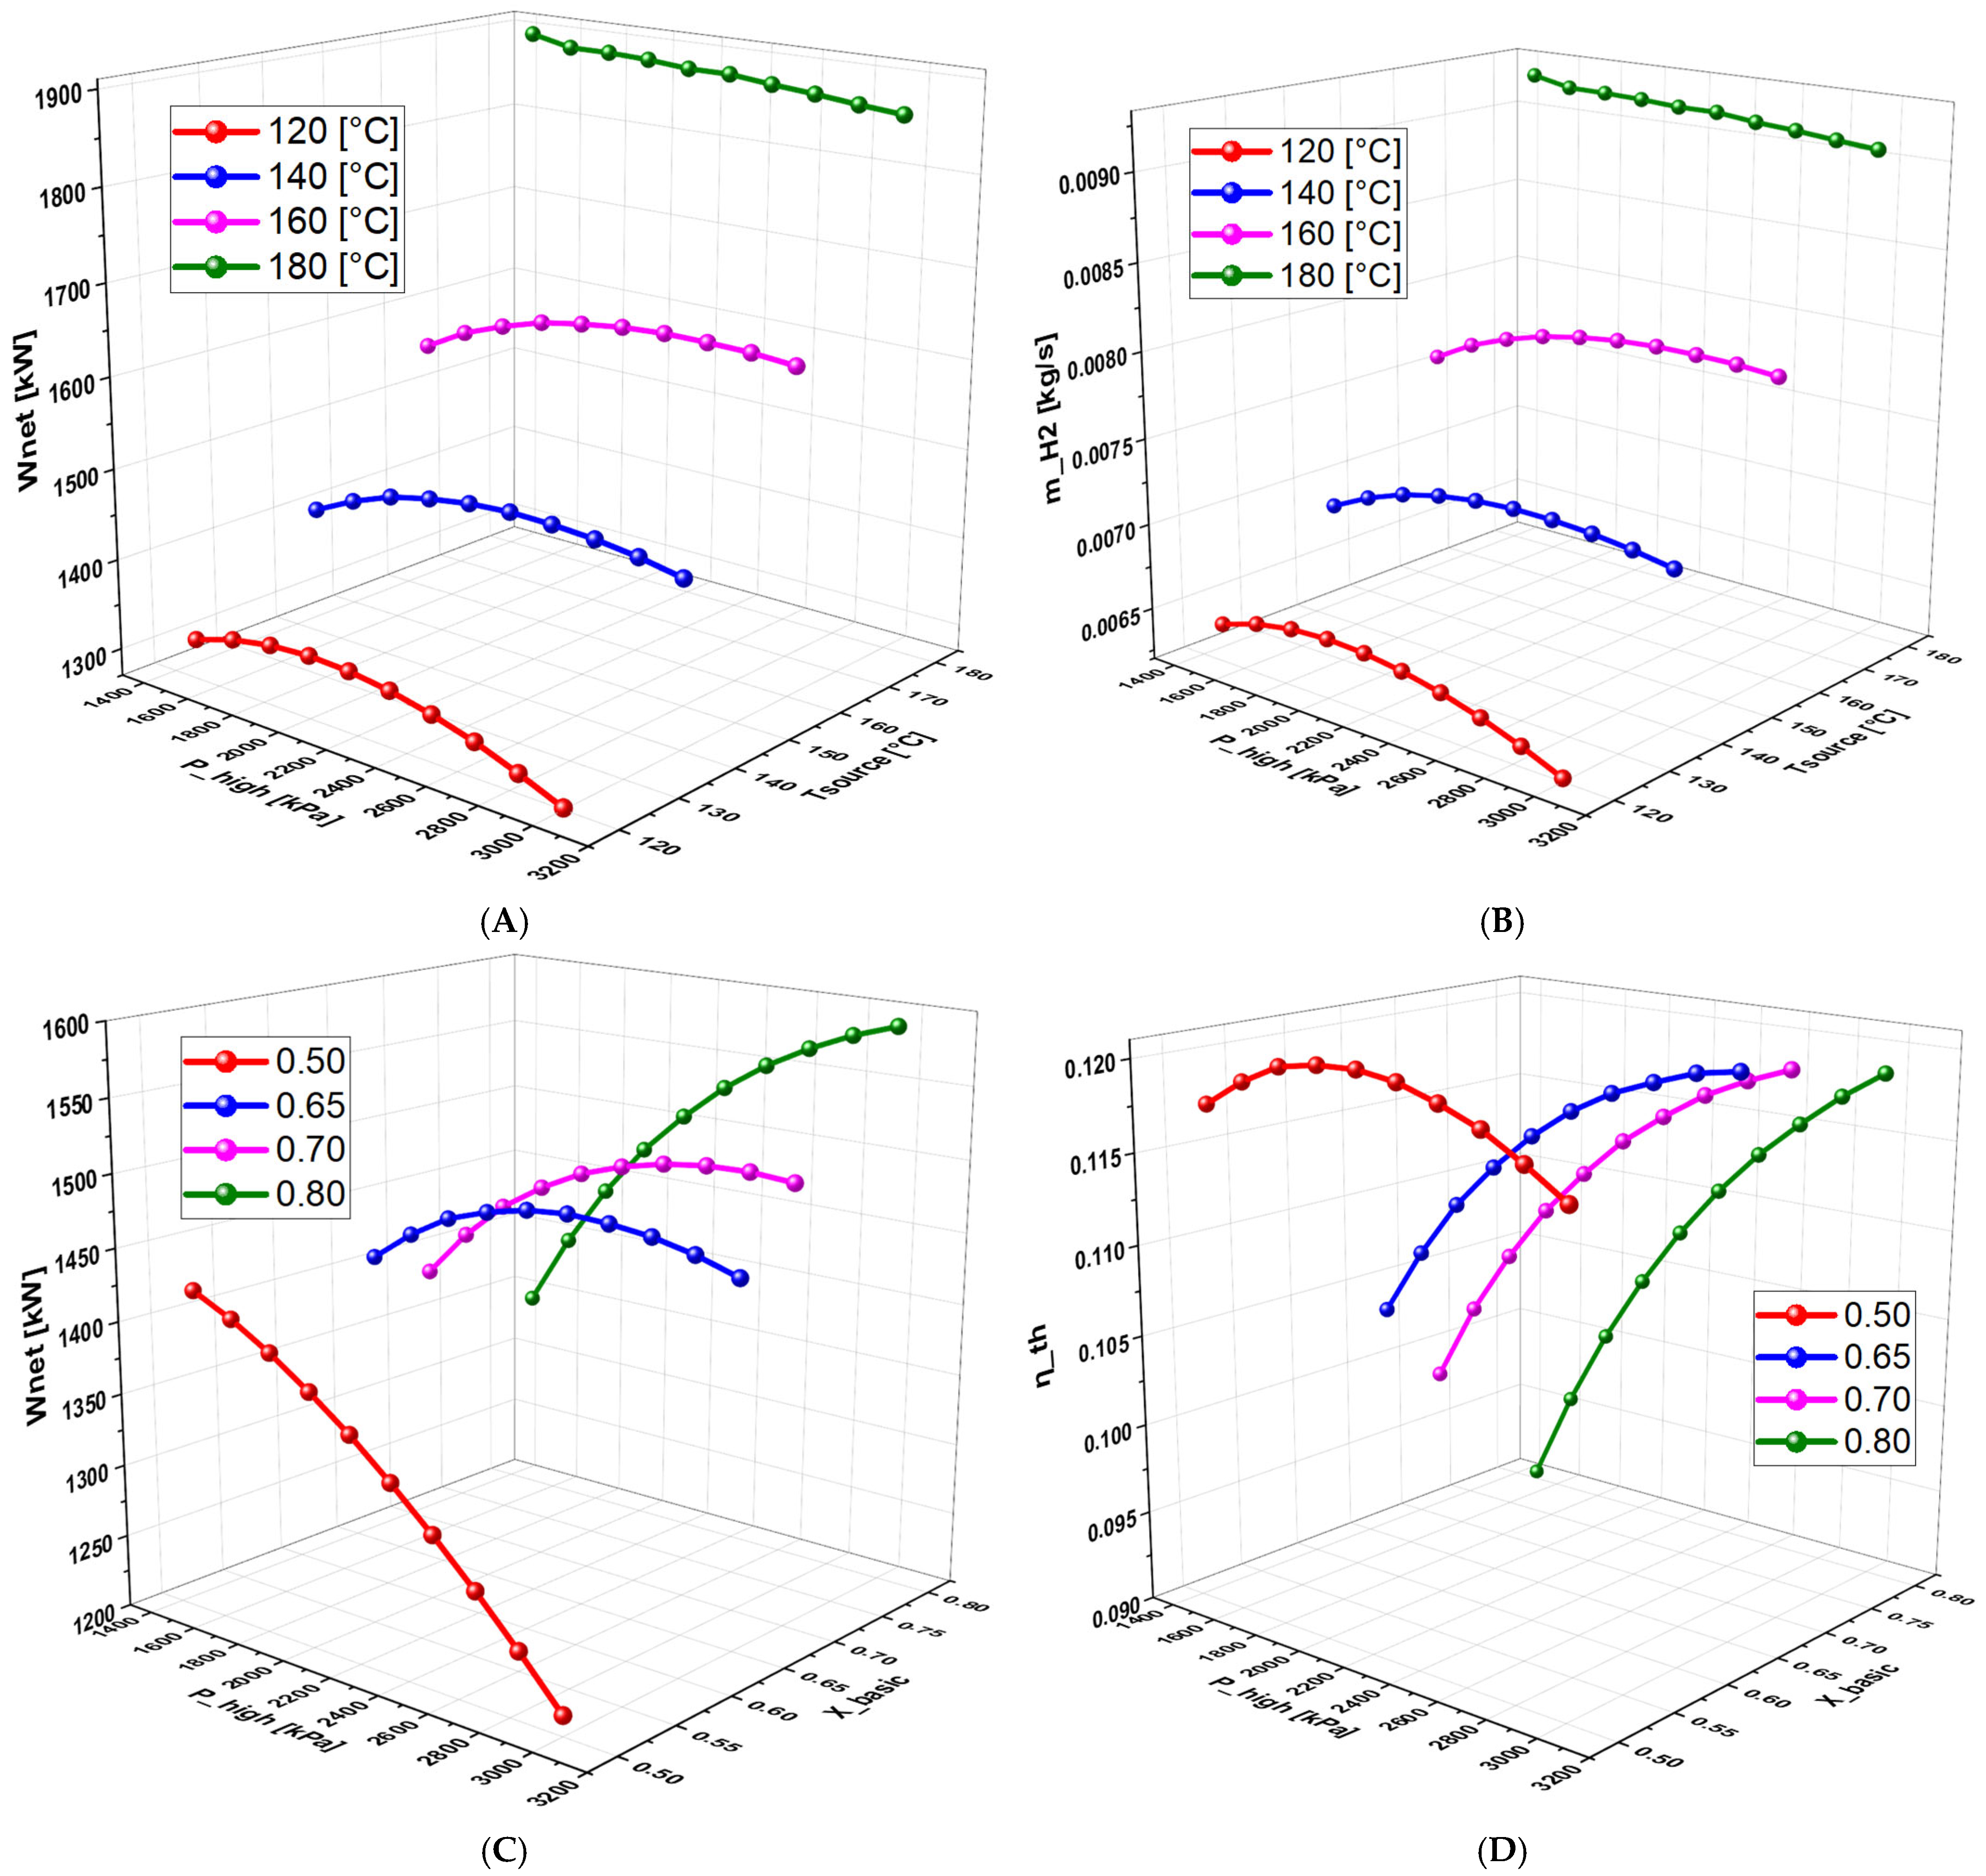
Figure 5 examines the effect of high pressure (P_high) on the system performance, again with TTD fixed at 10 °C. Figure 5A–C illustrate the variations in net power and hydrogen production rates as a function of high pressure for different geothermal temperatures and base mixture concentrations. There is an initial increase in these values up to an optimum pressure threshold, beyond which performance decreases. The best performance is obtained at a geothermal temperature of 180 °C (Figure 5A,B). Figure 5C shows that the maximum net power is obtained at a base concentration of 0.80. This figure also shows that the energy efficiency follows a similar trend: it increases with pressure to a maximum and then decreases. Optimum energy efficiency is achieved at a concentration of 0.65.
Figure 5. Effect of high pressure on (A) net power, (B) hydrogen production, (C) net power, and (D) thermal efficiency.
Fuels 06 00065 g005

6.2.5. Effect of Basic Concentration on the System Performance
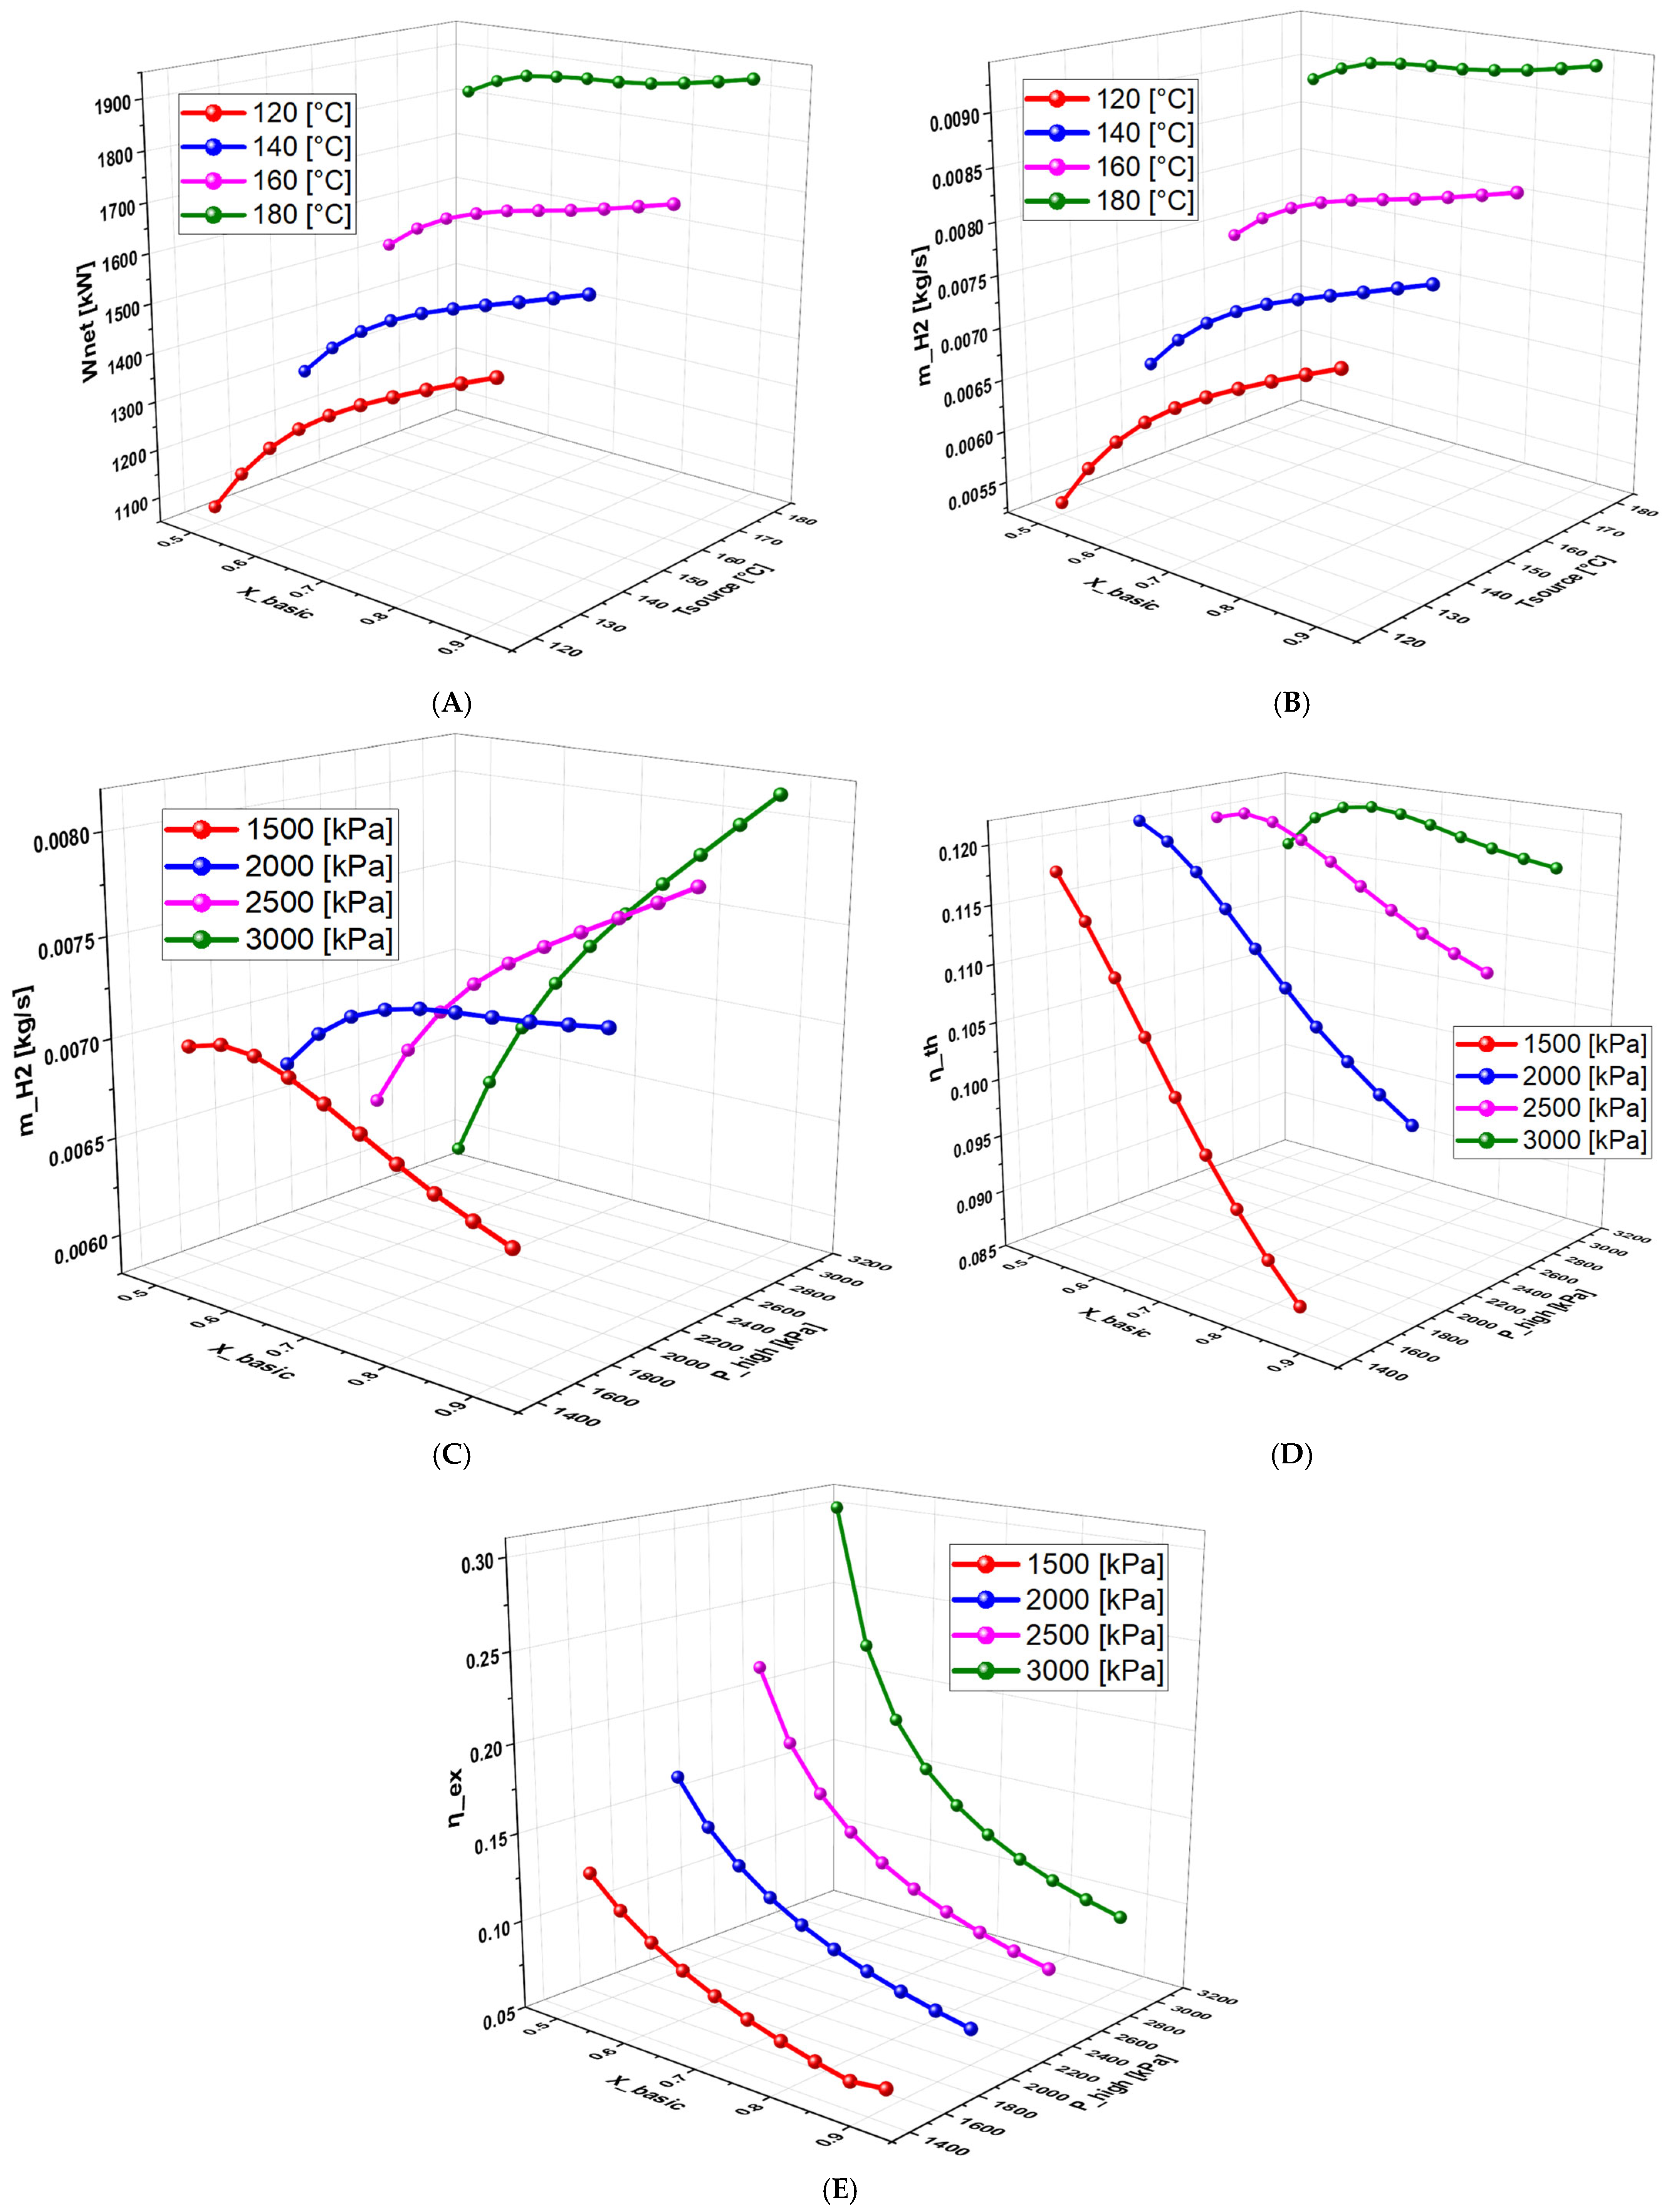
Figure 6 analyzes the effect of the basic concentration (X_basic) on system performance at a constant TTD of 10 °C. Figure 6A–C indicate that increasing the base concentration leads to an increase in net power and hydrogen production, especially for a geothermal temperature of 180 °C and a base concentration of 0.8. In this case, the maximum power reaches 1921 kW and 0.009343 kg/s (807.235 kg/day), respectively. Figure 6C also shows clearly that for pressures above 2000 kPa, hydrogen production continues to increase with the basic concentration. However, below this threshold, it reaches a maximum before decreasing. Figure 6D,E illustrate a decrease in energy and exergy efficiencies with increasing base concentrations for all pressures tested. The best efficiencies are obtained at a high pressure of 3000 kPa.
Figure 6. Effect of basic concentration on (A) net power, (B) hydrogen production, (C) hydrogen production, (D) thermal efficiency, and (E) exergy efficiency.
Fuels 06 00065 g006

6.2.6. Effect of Terminal Temperature Difference (TTD) on the System Performance
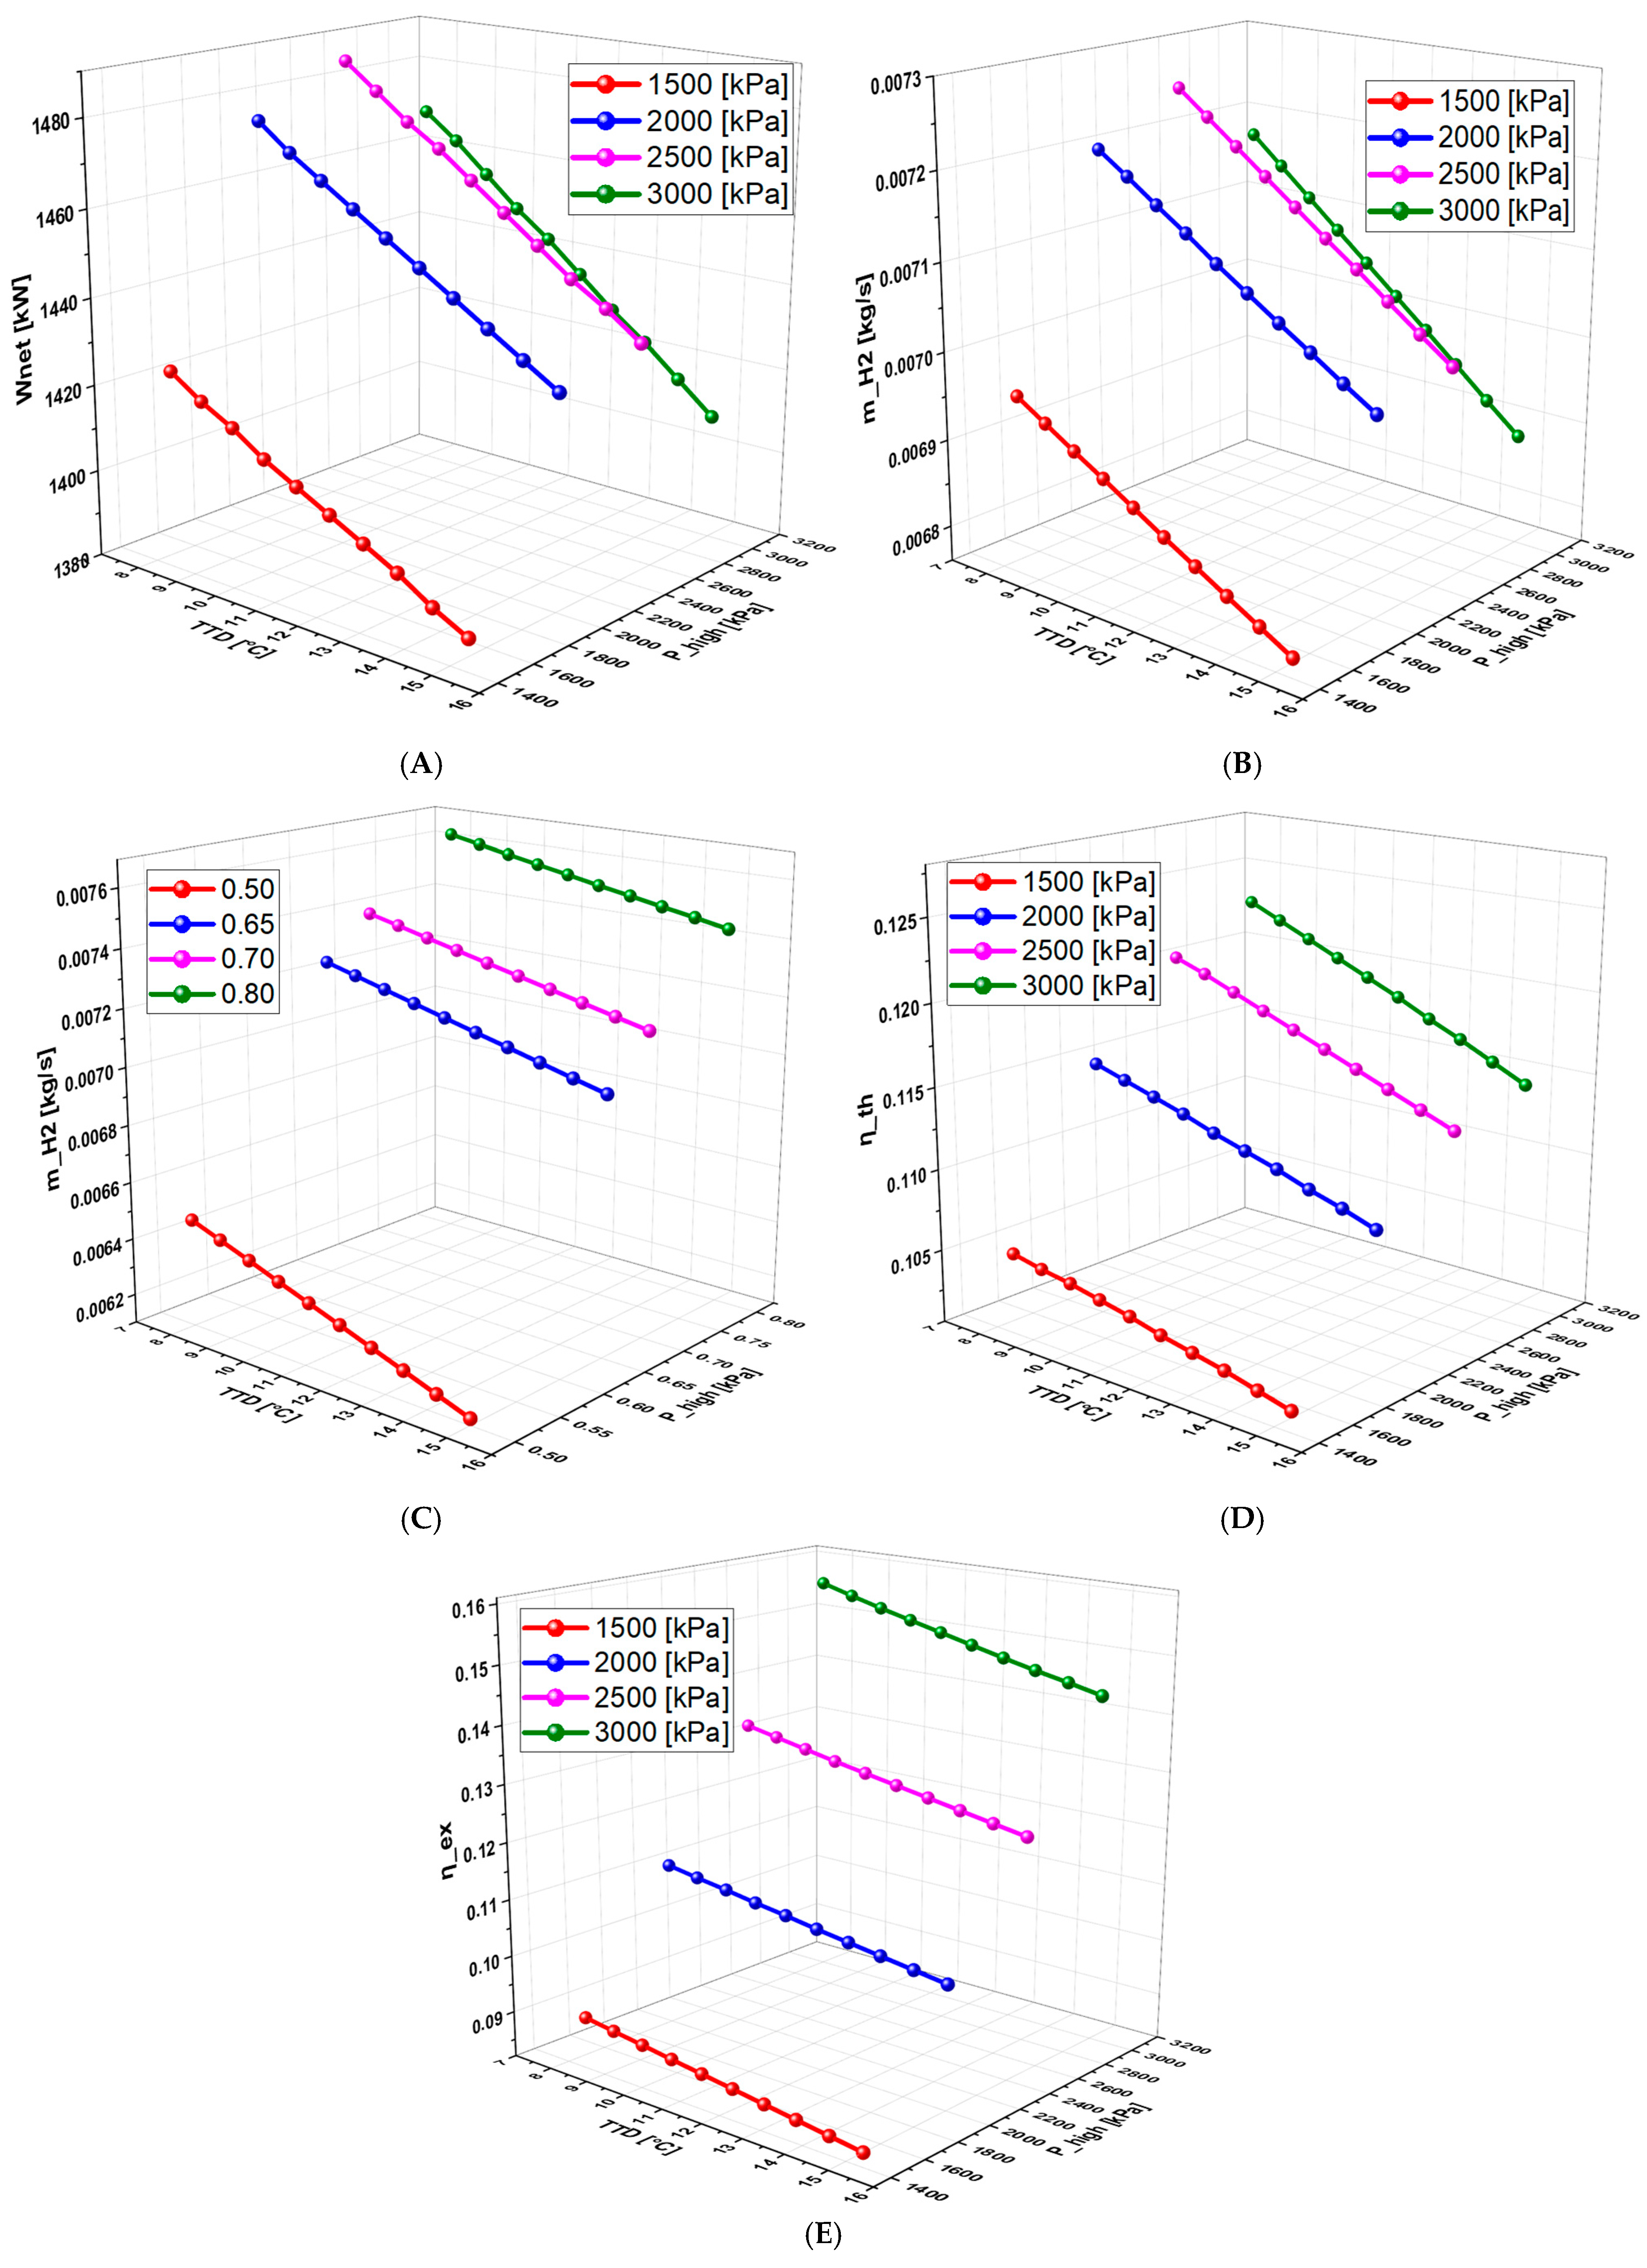
Figure 7 examines the effect of varying the TTD on system performance. Figure 7A–C make clear that increasing the TTD causes a decrease in net power, hydrogen production, and energy and exergy efficiencies. The best performance is observed at a pressure of 2500 kPa (Figure 7A,B). Figure 7C shows that hydrogen production remains optimal for a base concentration of 0.8, while Figure 7D,E indicate that 3000 kPa is the most favorable pressure in terms of efficiency.
Figure 7. Effect of terminal temperature difference on (A) net power, (B) hydrogen production, (C) hydrogen production, (D) thermal efficiency, and (E) exergy efficiency.
Fuels 06 00065 g007

6.3. Optimization Results

Optimization results were obtained using the genetic algorithm parameters detailed in Table 7 and the decision variables defined in Table 8. These results indicate an optimal range of decision variables for the combination of the ammonia–water mixture with the five organic fluids. The optimization shows that the optimal source temperature is between 179.4 and 180 °C, while the optimal pressure is between 2968 and 3000 kPa. The terminal temperature difference (TTD) is between 8 and 9 °C, and the optimal ammonia concentration is between 0.50 and 0.51. Among the different combinations analyzed, the ammonia–water + R152a mix offers the best performance with a net power of 2004 kW and hydrogen production of 0.009742 kg/s (841.708 kg/day), outperforming the other combinations. It is closely followed by ammonia–water + MD2M. The results obtained after the optimization are summarized in Table 14a,b.
These tables compare the results of the proposed system before and after optimization using the ammonia–water + R152a combination at a geothermal temperature of 180 °C. The results of optimizing this combination showed a significant improvement in system performance of 7.16% for net power, 7.08% for hydrogen production, 21% for energy efficiency, 25.56% for exergy efficiency, and 20.67% for overall system efficiency. However, the total investment cost increased by 3.15%.

6.4. Effect of the Separation of Turbines on the System Performance

In line with the data in Table 4 and Figure 3, this section presents the simulation results for the ORC (organic Rankine cycle) and KC (Kalina cycle) cycles separately. The power generated by the KC turbine is used for electricity production, while the power generated by the ORC cycle is used for hydrogen production in PEME (Figure 12). Figure 8, Figure 9 and Figure 10 focus especially on the effects of three key parameters (geothermal temperature, high pressure, and TTD) on the net power, hydrogen production, and overall system efficiency.

6.4.1. Effect of Geothermal Temperature on the System Performance (With Separate Turbines)
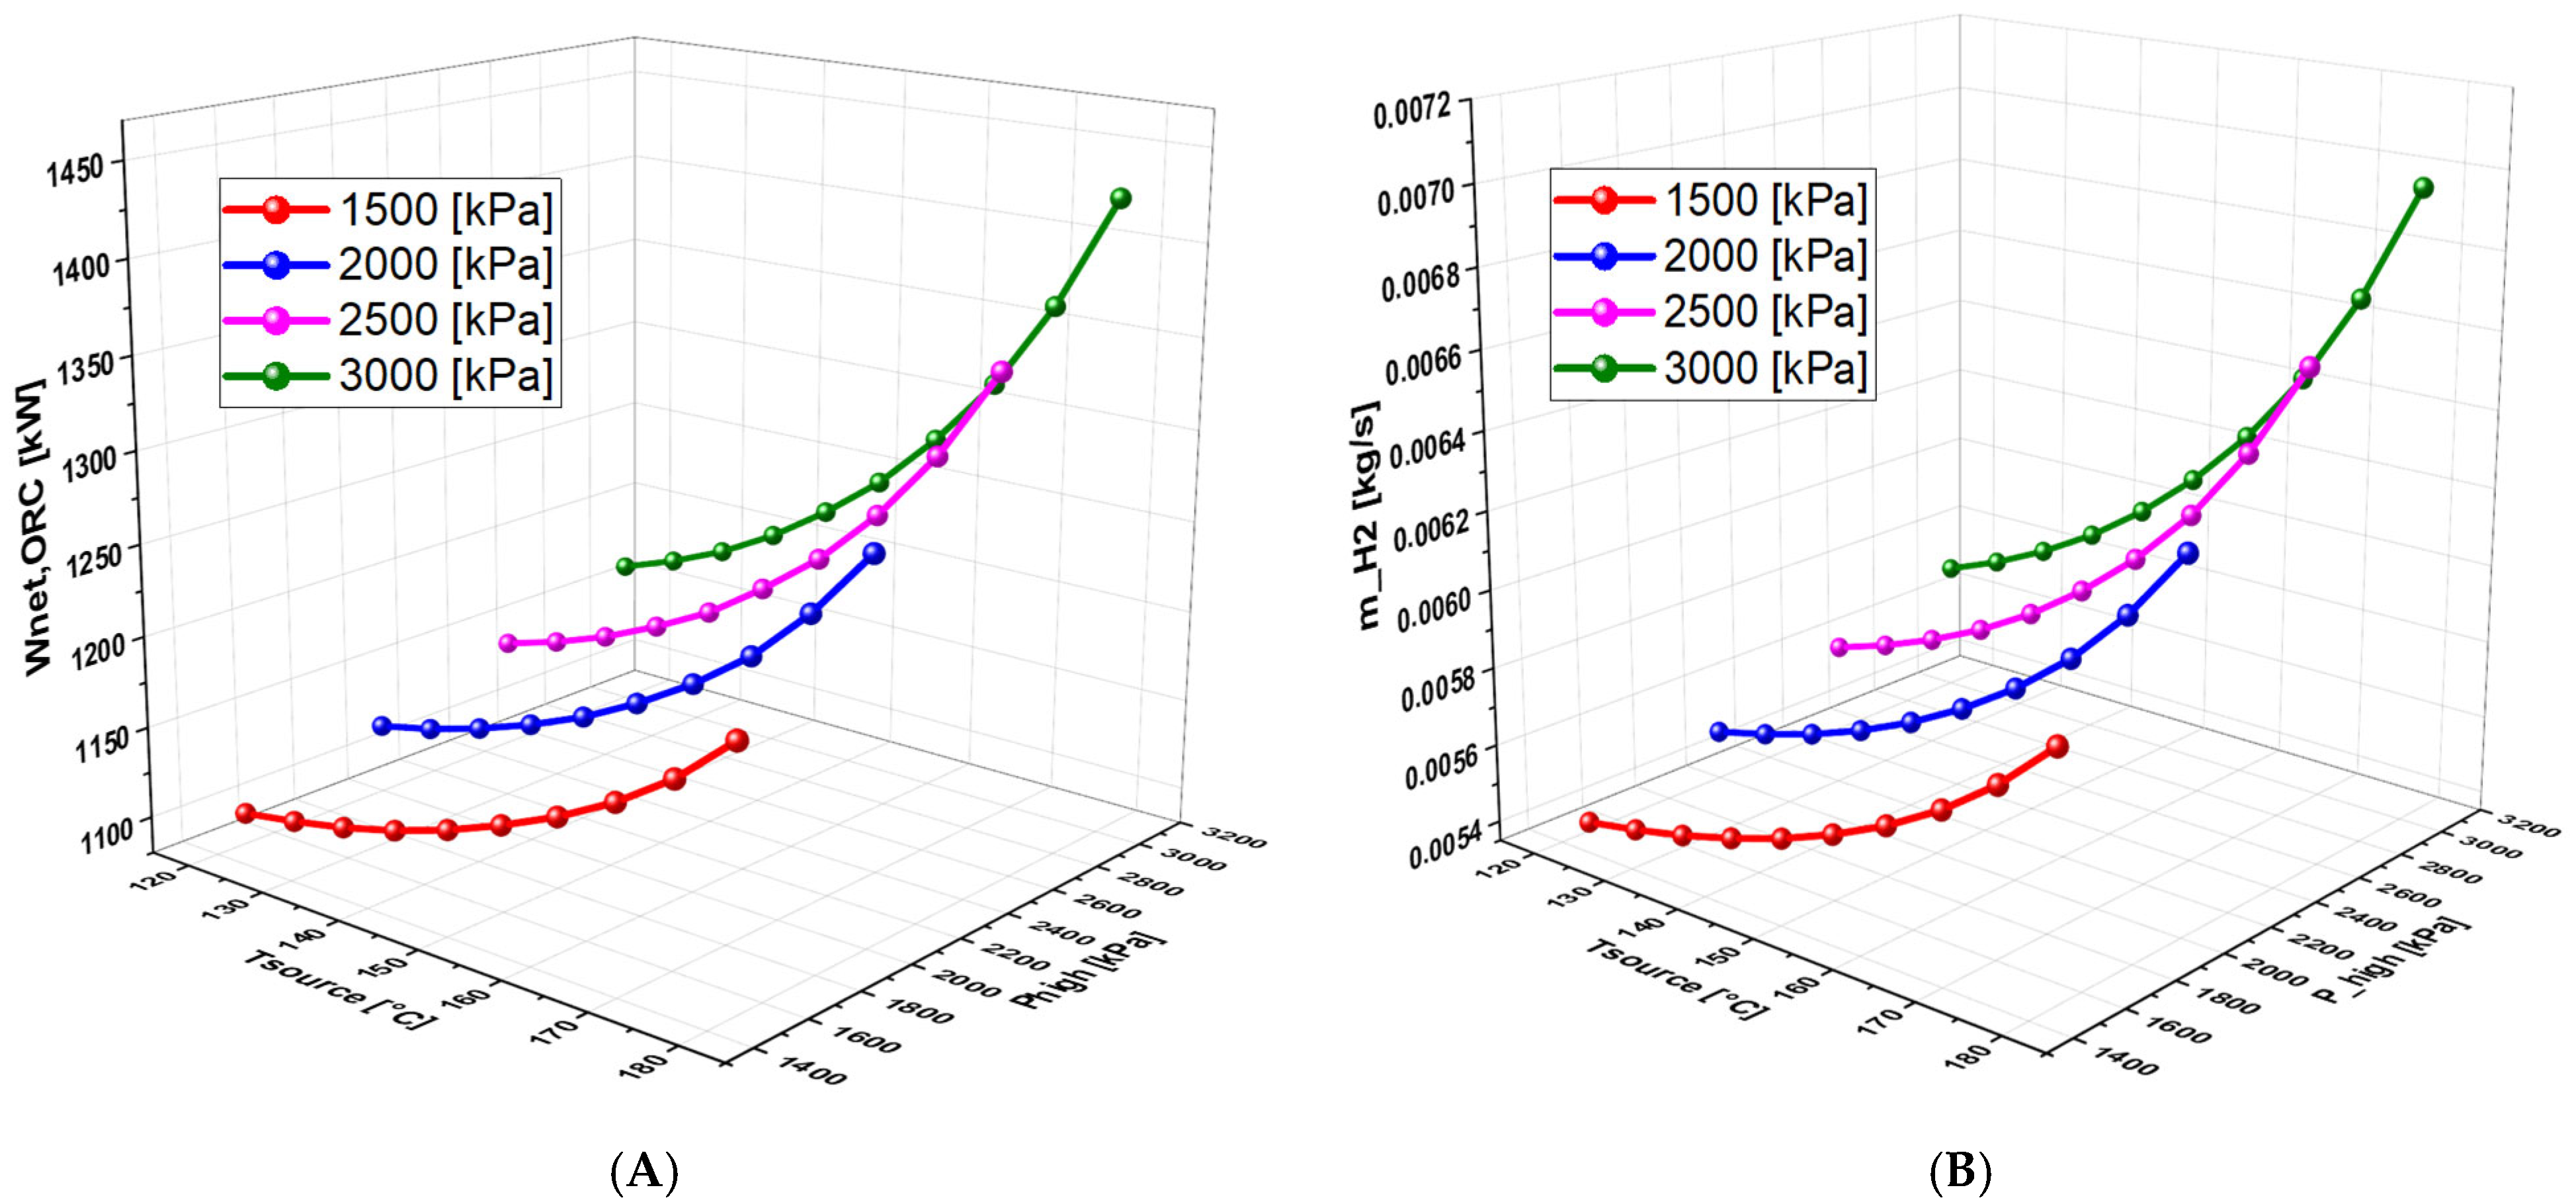
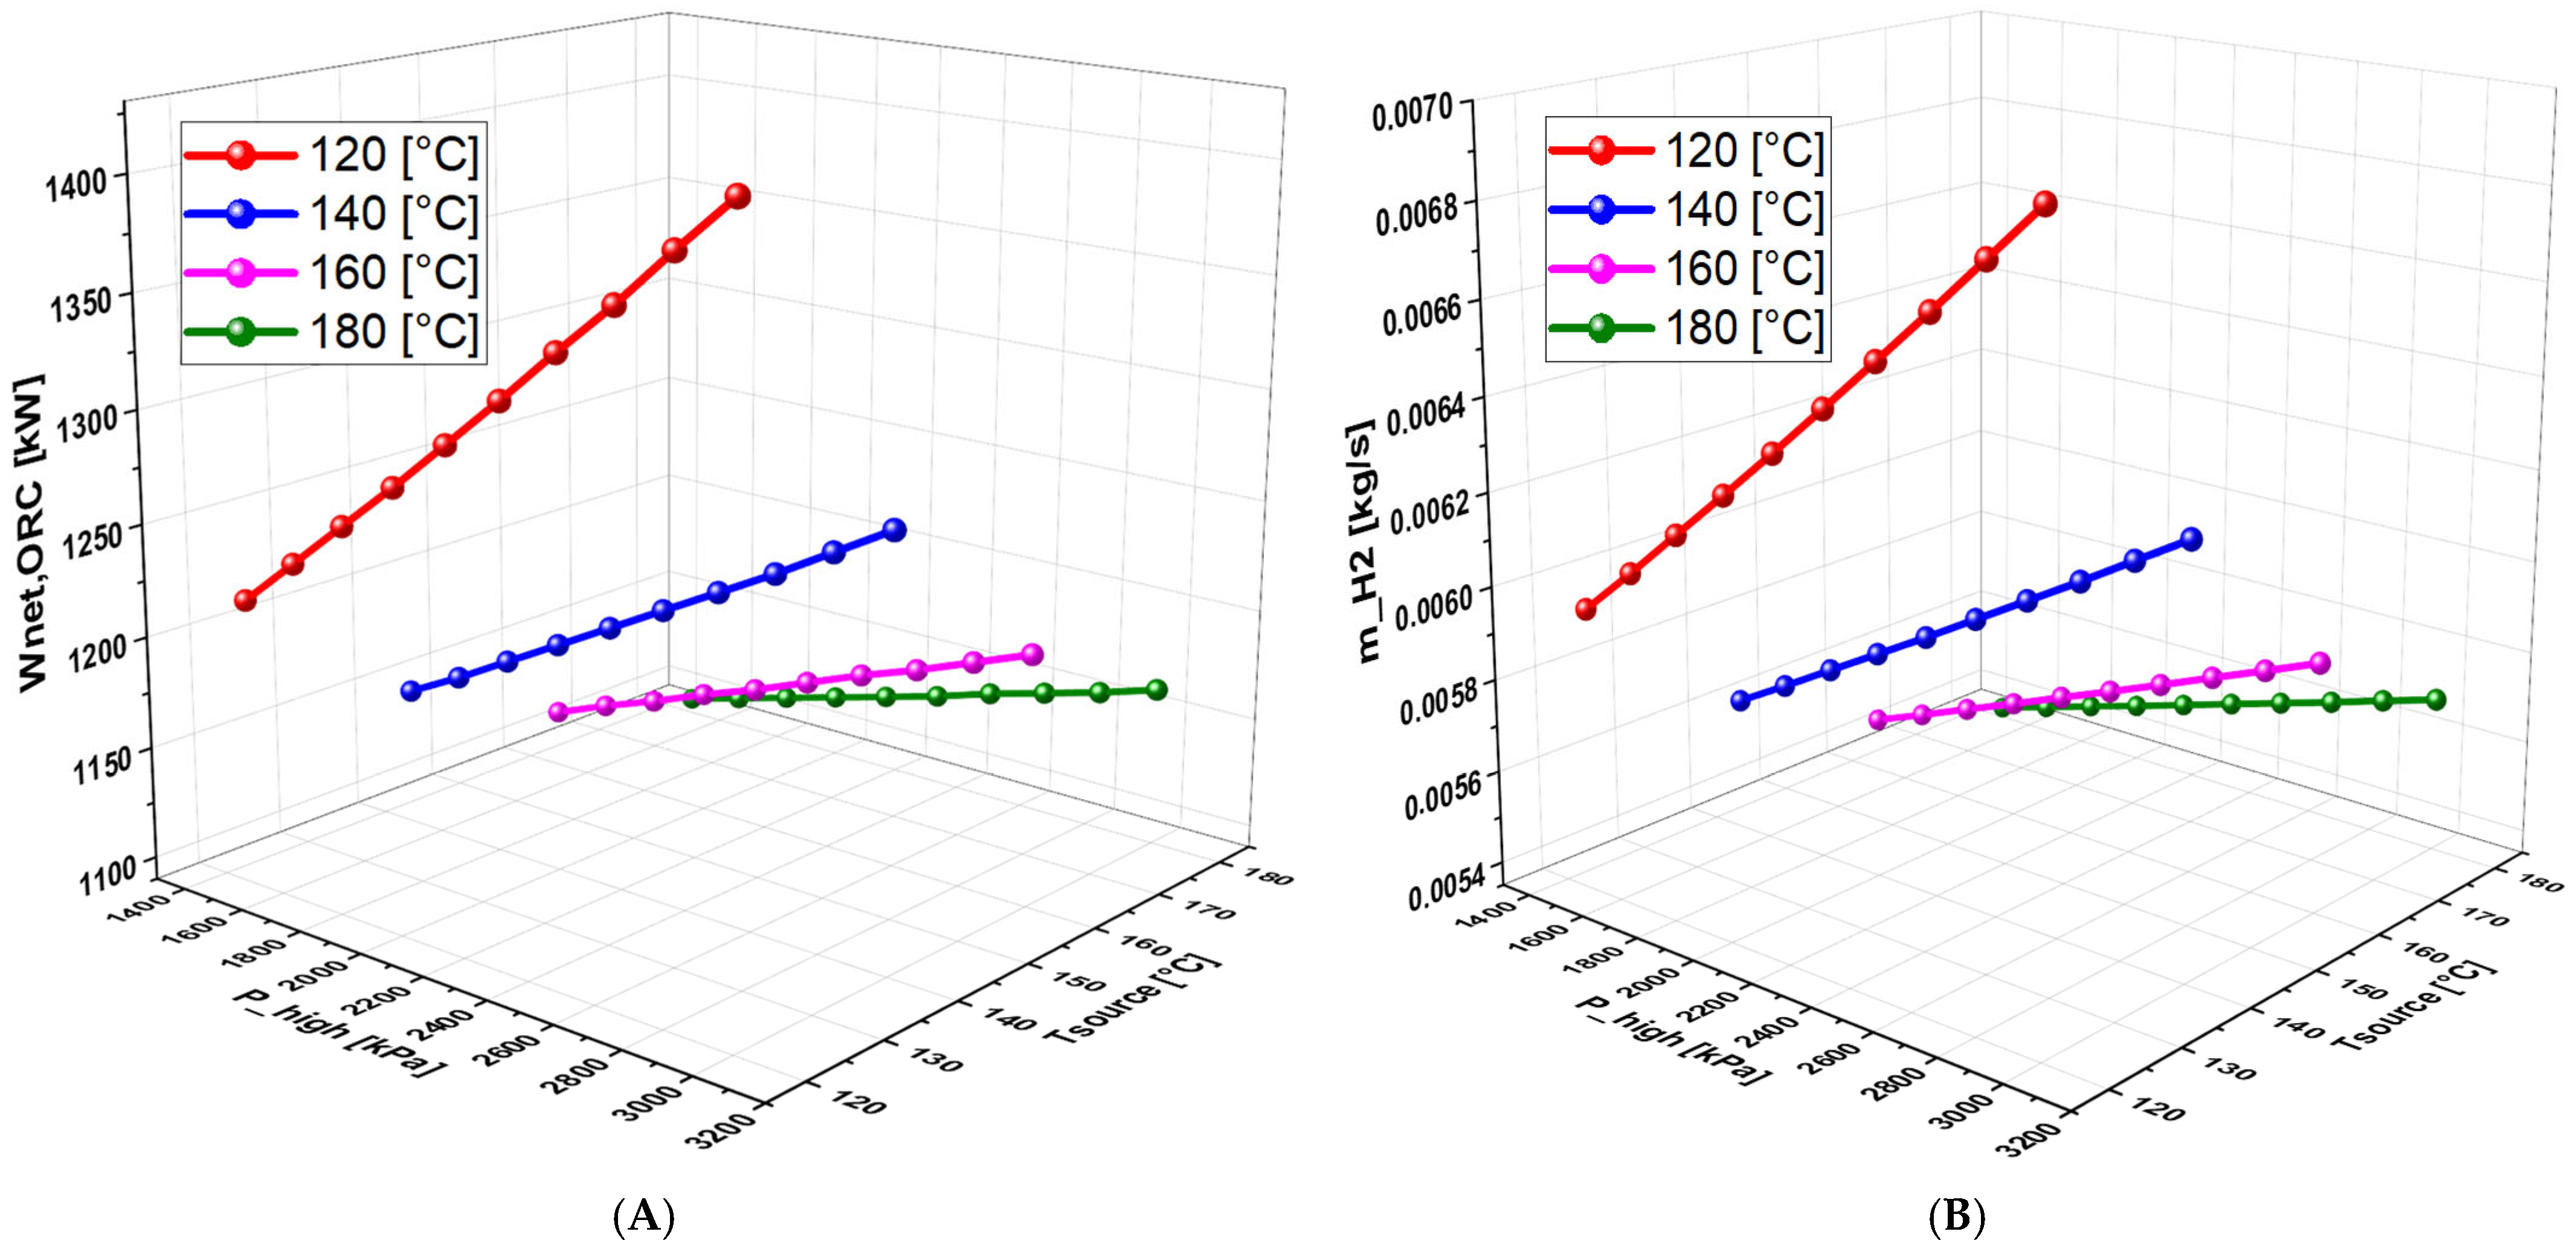
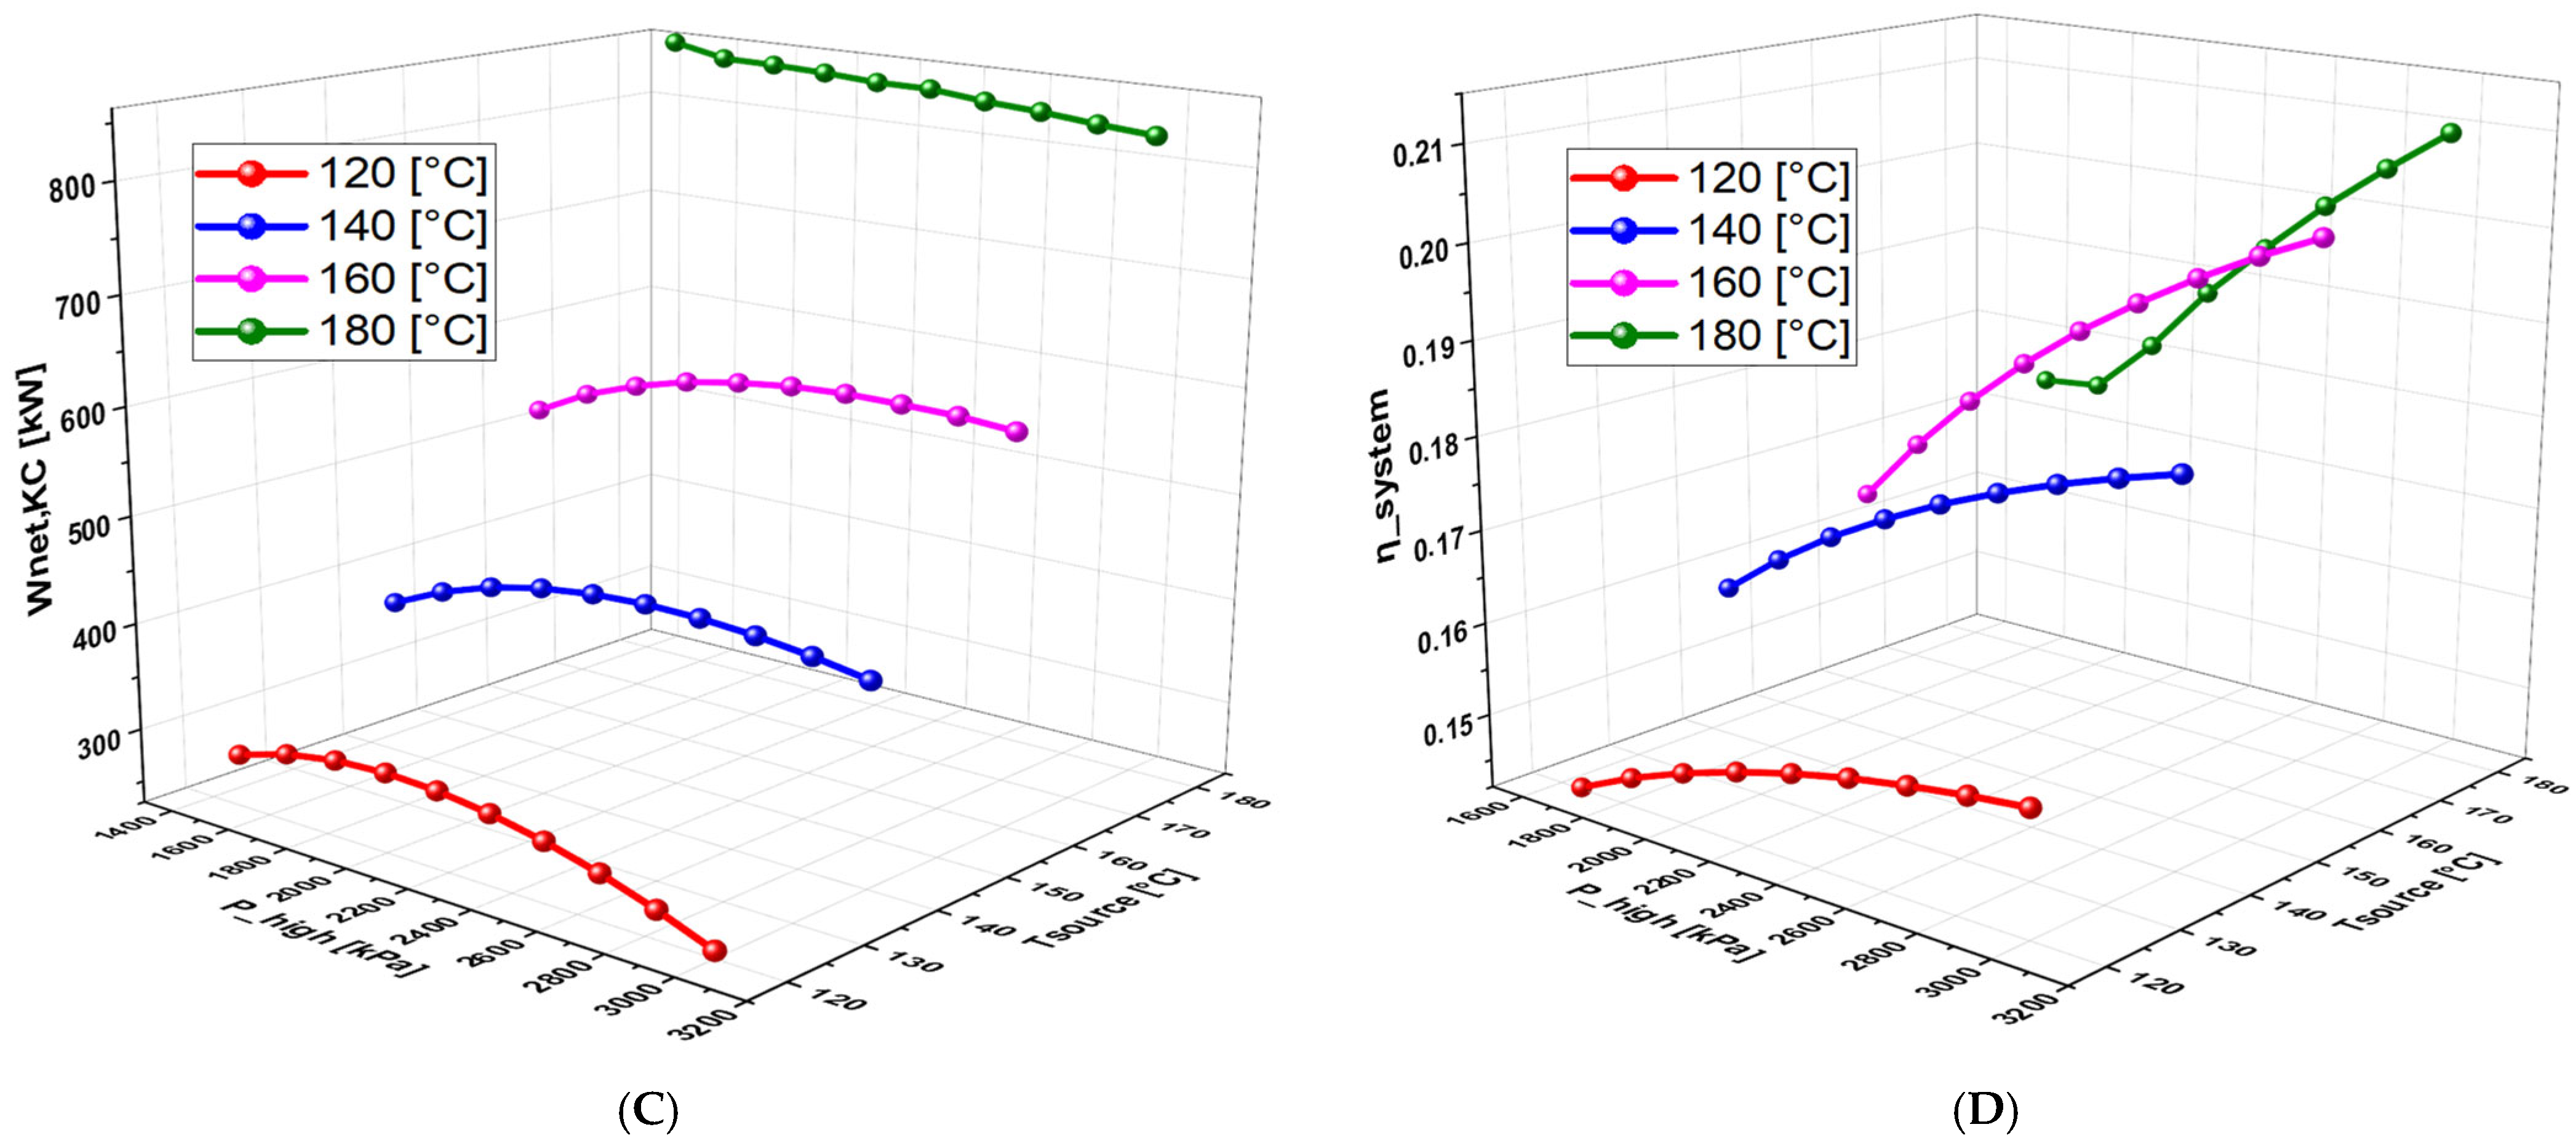
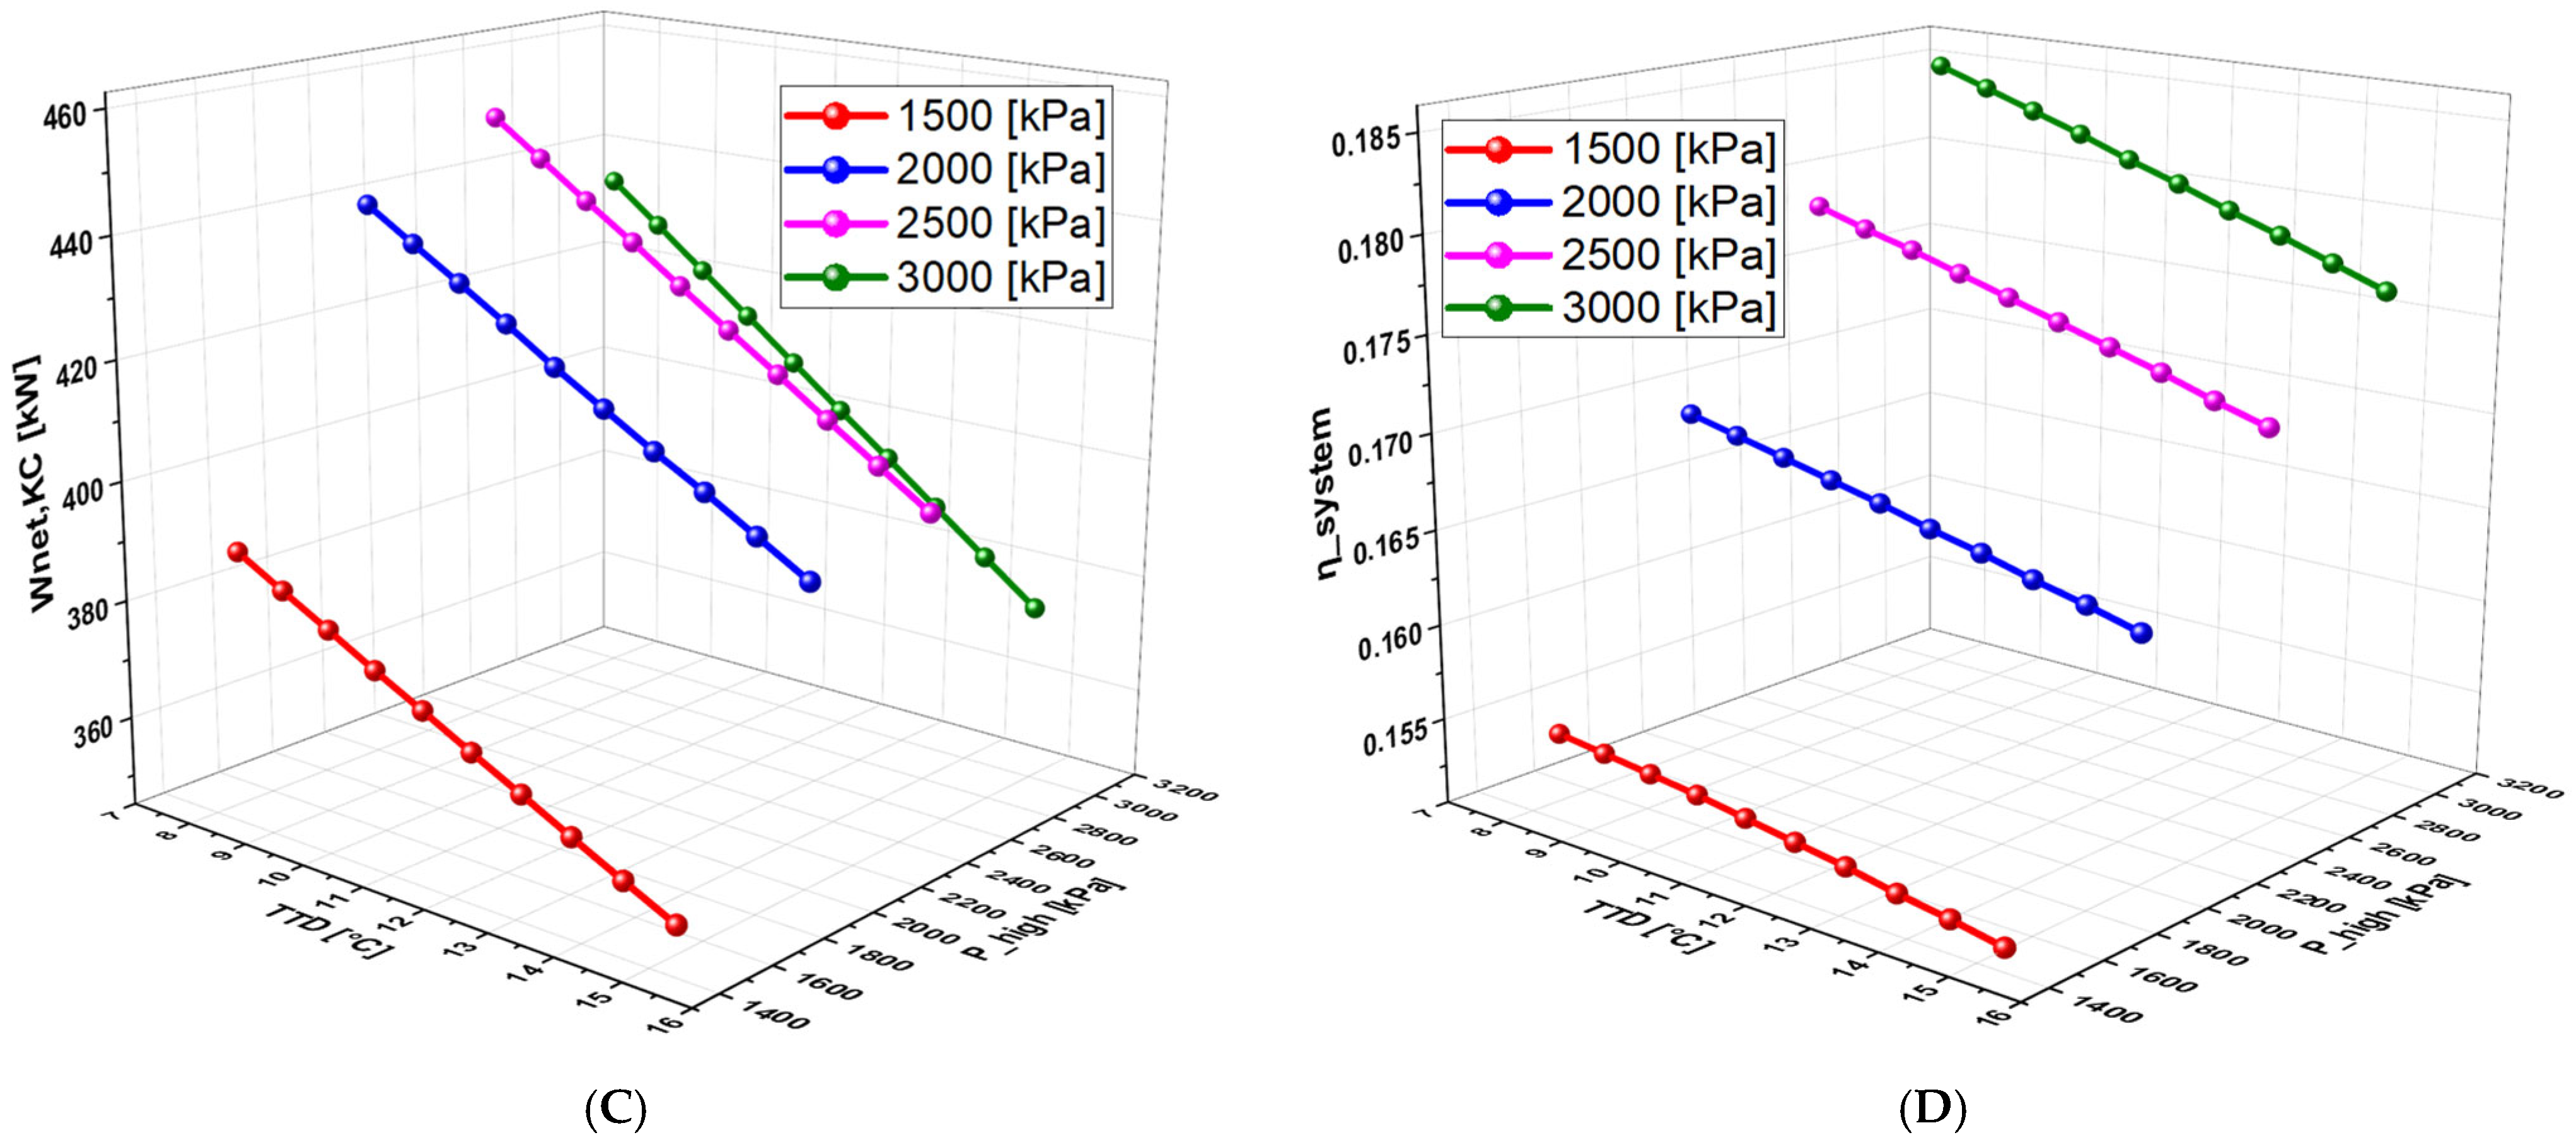
Figure 8 shows the effect of geothermal temperature on net power, hydrogen production and overall system efficiency for a TTD set at 10 °C. Net power (Wnet, ORC and Wnet, KC), hydrogen production, and overall system efficiency increase with an increasing temperature. A pressure of 3000 kPa leads to the best ORC cycle performance (Figure 8A,B), while a pressure of 1500 kPa optimizes the KC net power (Figure 8C).
Figure 8. Effect of geothermal temperature on (A) net power, ORC, (B) hydrogen production, (C) net power, KC, and (D) overall system efficiency.
Fuels 06 00065 g008aFuels 06 00065 g008b

6.4.2. Effect of High Pressure on the System Performance (With separate turbines)

Figure 9 analyzes the effect of P_high on the previously mentioned quantities. Figure 9A,B exemplify that increasing P_high improves the performance of the ORC cycle, especially at a geothermal temperature of 120 °C. Figure 9C indicates that the KC’s net power reaches a maximum. Then, it decreases. This has an impact on the system’s overall efficiency (Figure 9D).
Figure 9. Effect of high pressure on (A) net power, ORC, (B) hydrogen production, (C) net power, KC, and (D) overall system efficiency.
Fuels 06 00065 g009aFuels 06 00065 g009b

6.4.3. Effect of TTD on the System Performance (With Separate Turbines)
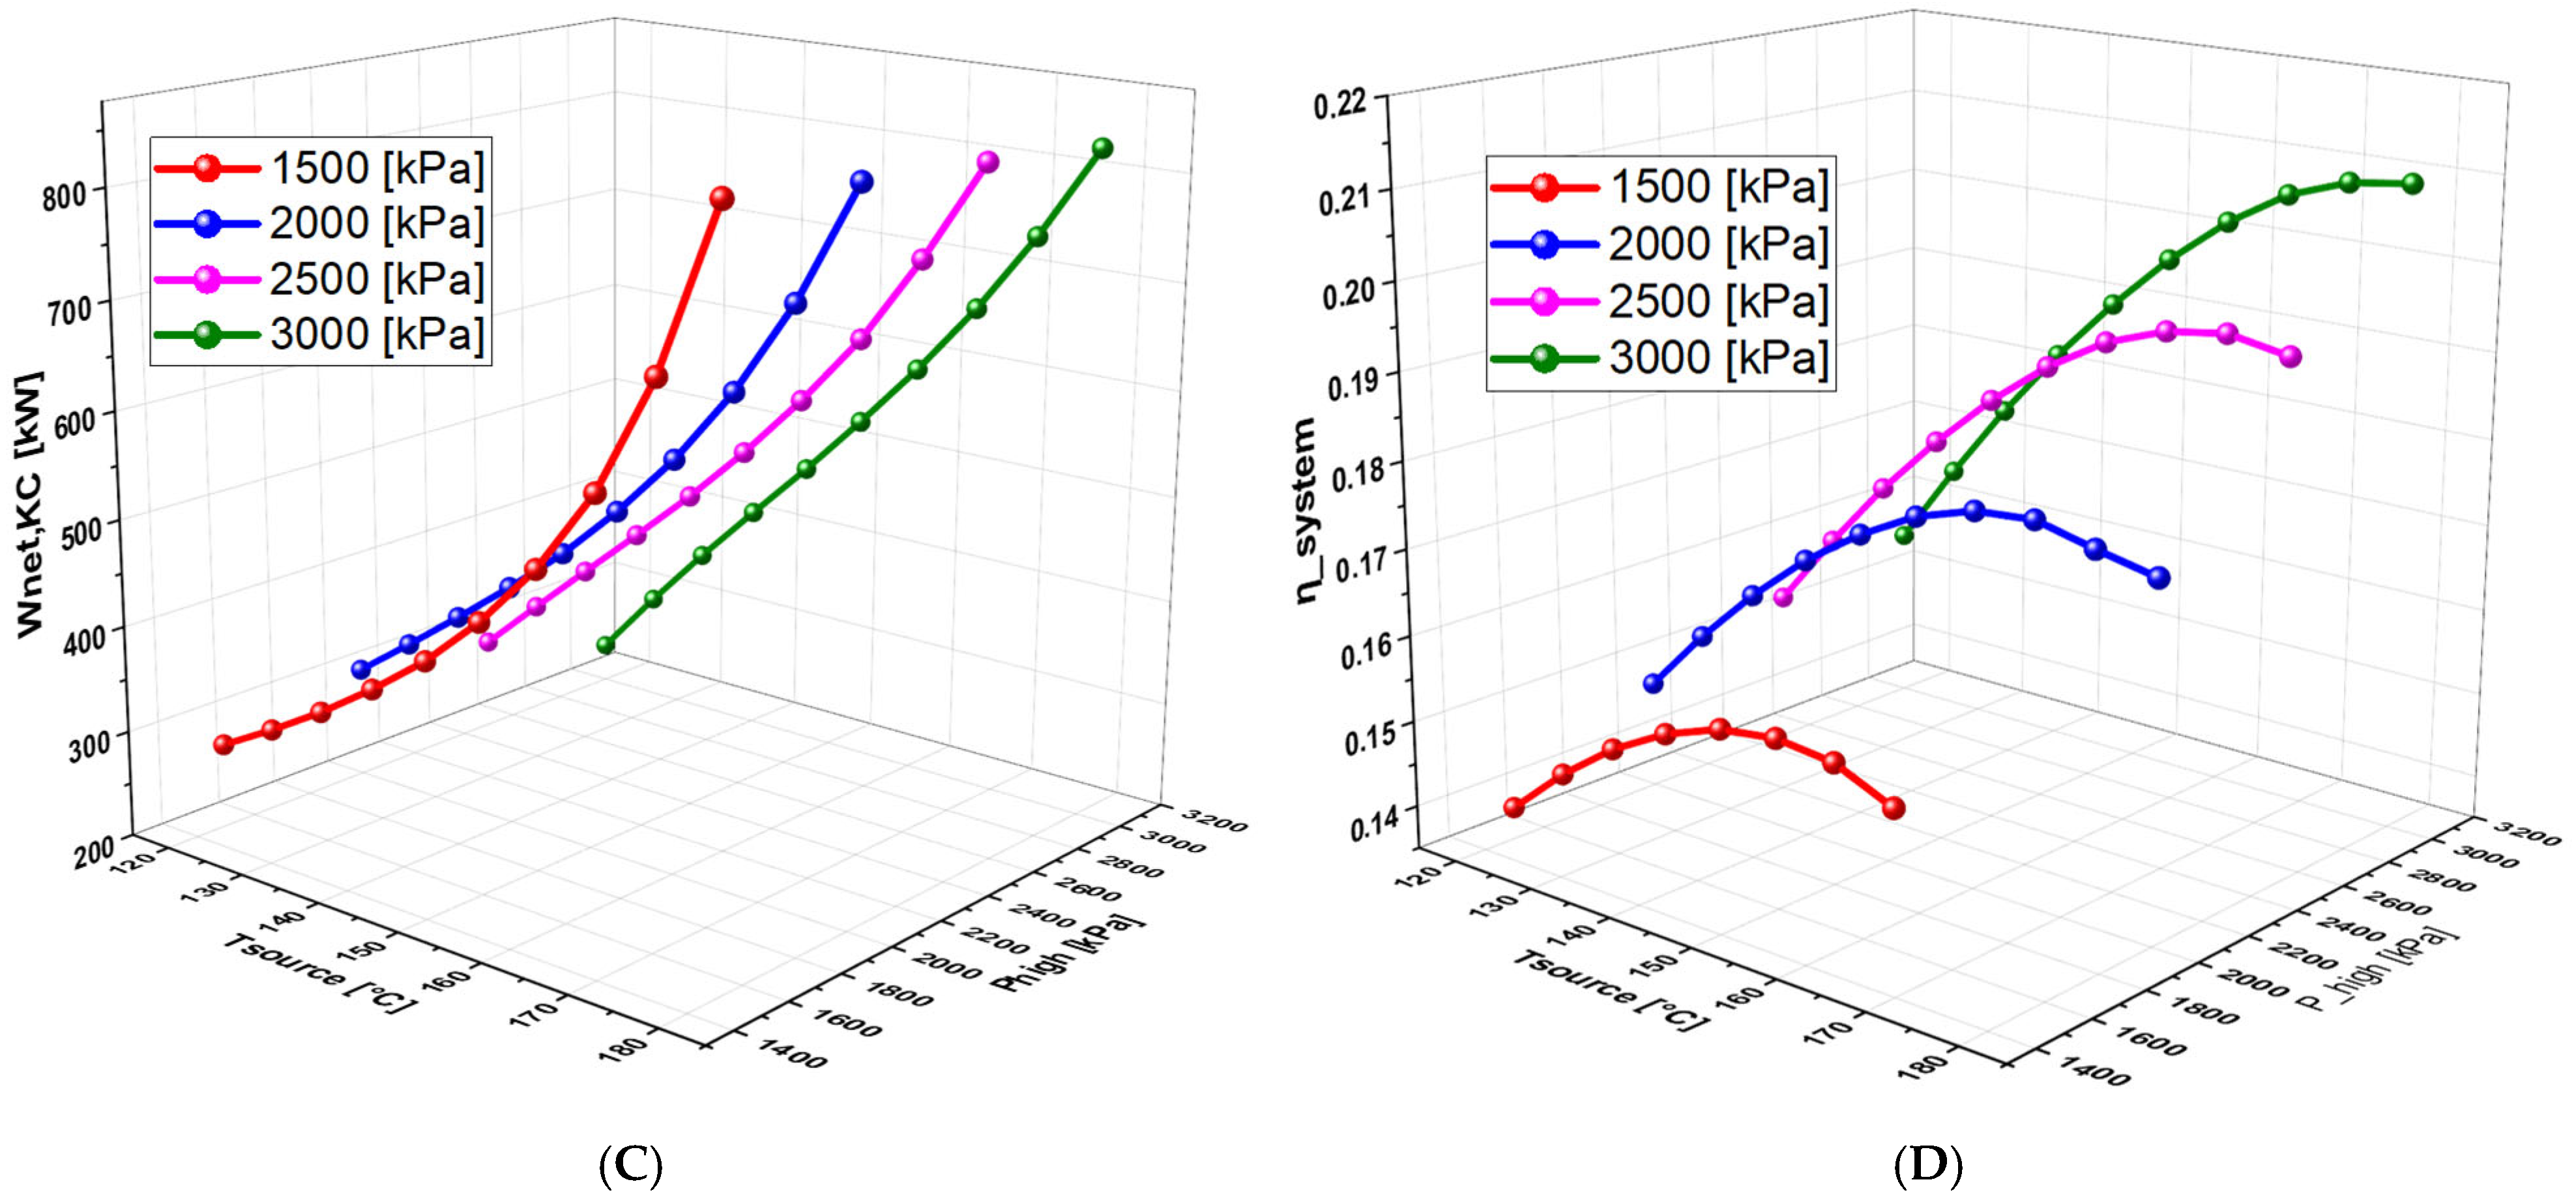
Figure 10 shows the effect of TTD on the net power, hydrogen production, and overall efficiency. Increasing the TTD causes a decrease in all of these quantities. Figure 10A,B indicate that a pressure of 3000 kPa maximizes the performance of the ORC cycle, while Figure 10C demonstrates that the KC net power is optimal at 2500 kPa.
Figure 10. Effect of TTD on (A) net power, ORC, (B) hydrogen production, (C) net power, KC, and (D) overall system efficiency.
Fuels 06 00065 g010aFuels 06 00065 g010b

7. Conclusions

A poly-generation system has been proposed in which a combined Kalina/organic Rankine cycle is coupled with an electrolyzer unit to produce both power and green hydrogen in an efficient way. The system is driven by a geothermal energy source. In particular, a comprehensive thermodynamic analysis and an exergetic evaluation were carried out to assess the effect of key parameters (geothermal temperature, high pressure, ammonia–water concentration ratio, and terminal temperature difference) on the performance of the concurrent production of power and green hydrogen. Two configurations schematically displayed in Figure 11 and Figure 12 have been considered. From the achieved simulation and targeted optimization using the genetic algorithm method, following conclusions can be drawn:
  • Under the same operating conditions, the combination of an ammonia–water mixture and MD2M allowed to accomplish the best performance in comparison to the other combinations, with a net power of 1470 kW and hydrogen production rate of 0.007178 kg/s (620.17 kg/day).
  • Optimization results show that among the different combinations analyzed, the combination of ammonia–water + R152a offers the best performance, with a net power of 2004 kW and hydrogen production rate of 0.009742 kg/s (841.708 kg/day). It is followed by the ammonia–water + MD2M combination.
  • The combination of ammonia–water + R152a further provides a significant improvement in the system performance, with an increase of 7.16% in net power and an improvement of 7.08% in hydrogen production.
  • Adjusting the reference temperature to a maximum of 180 °C leads to an increase in energy efficiency from 12% to 15% and a decrease in the total exergy destruction from 14,831 kW to 14,581 kW.
  • Optimization results also indicate that the optimum ammonia concentration for the proposed system is between 0.50 and 0.51 for different combinations.
  • A detailed study of the evolution of the system performance as a function of the main parameters investigated over various ranges of variation reveals that the geothermal temperature is the parameter with the most significant impact on the overall operation of the system.
  • An economic study allows to determine the total investment and payback time of $3,342,000 and 5.37 years, respectively.
  • The levelized cost of hydrogen (LCOH) for the proposed system is estimated at 3.007 USD/kg H2, aligning well with values reported in the literature.
  • In the case of the combined turbine configuration, hydrogen production rate reaches 0.007178 kg/s (i.e., 620.17 kg/day) for a net power output of 1470 kW. In comparison, the separate turbine configuration yields a hydrogen production rate of 0.006044 kg/s (i.e., 522.20 kg/day) with a net power output of 1235 kW. This corresponds to a reduction of 18.76% in hydrogen production compared to the combined configuration.
  • Comparing the performance of the proposed cycle combinations with the existing one without accounting for the economic part indicates that this cycle performs better and is simply flexible as the amount of electricity to be allocated for the hydrogen production can vary between 1235 and 1470 kW.
Figure 11. First configuration: coupled turbines.
Fuels 06 00065 g011
Figure 12. Second configuration: separate turbines.
Fuels 06 00065 g012

Author Contributions

Conceptualization, G.T.M.; methodology, A.S.; software, G.T.M. and Y.B.; validation, G.T.M.; formal analysis, S.Y. and S.M.; investigation, A.F.; resources and DRC geothermal data, M.K. and S.M.; writing—original draft preparation, G.T.M. and A.S.; writing—review and editing, G.T.M.; visualization, G.T.M. and Y.B.; supervision, A.F. and A.S.; project administration, A.S. All authors have read and agreed to the published version of the manuscript.

Funding

This research received no external funding.

Data Availability Statement

No new data has been created.

Acknowledgments

The authors gratefully acknowledge the support by the Technische Universität Darmstadt (Institutes RSM and EKT) and the DFG (German Research Council) through the project SA 8367/15-1, as well as the ENIG/ISTA-Kinshasa Cooperation. The third author acknowledges, especially, the financial support by the China Scholar Council, China (CSC, n° 202009650009). Finally, the authors also acknowledge the Open Access Publishing Fund of Technical University of Darmstadt (Technische Universität Darmstadt).

Conflicts of Interest

The authors declare no conflicts of interest.

Abbreviations

The following abbreviations are used in this manuscript:
Nomenclature
EESEngineering Equation Solver
FFaraday constant
GAGenetic algorithm
GENGenerator
hEnthalpy (kJ/kg)
HEXExchanger
JCurrent density
KCKalina cycle
LHVLower heating value
m ˙ Mass flow rate (kg/s)
m ˙ H 2 Hydrogen production rate (kg/s), (kg/day)
ORCOrganic Rankine cycle
PPressure (kPa)
PEMProton exchange membrane
PEMEProton exchange membrane electrolyzer
Q ˙ Heat flow (kW)
regRegenerator
sEntropy (kJ/kg K)
T0Ambient temperature (°C)
TTemperature (°C)
TTDTerminal temperature difference (°C)
VGVapor generator
VGOverpotential (V)
V_OReversible potential (V)
V_act,aCathode overpotential (V)
V_act,cAnode overpotential (V)
V_ohmOhmic overpotential (V)
WPower (KW)
WnetPower net (KW)
Greek letters
ηEfficiency (%)
εEffectiveness
Subscripts
condCondenser
exExergy
genGenerator
inInlet
outOutlet
thThermal

Appendix A

Table A1. The thermodynamic properties result in different system states (NH3H2O–isobutane).
StateT [°C]P [kPa]h [kJ/kg]s [kJ/kg K]x [%] m ˙ [kg/s]
11302500740.32.519 16.53
270.73404.5672.62.554 16.53
332.41404.5599.72.329 16.53
430404.5271.81.248 16.53
531.652500276.91.252 16.53
6128.92500965.43.1680.655
7128.9250015894.7830.92842.459
885.46671.114075.140.92842.459
9128.92500362.11.6050.38062.541
1050.3125001.0920.60770.38062.541
1150.64671.11.0920.61430.38062.541
1269.43671.1692.72.7140.655
1330671.1−76.390.31470.655
1430.42500−73.180.31740.655
1546.182500−0.30760.55140.655
1688.932500360.71.5870.655
17140400589.21.7390100
18138.9400584.61.7280100
19110.84004651.4270100
2020101.384.010.2965 64.52
2140101.3167.60.5724 64.52
2220101.384.010.2965 45.78
2340101.3167.60.5724 45.78
2486.16400361.21.148 100
2525101.3104.90.3672 0.064
2680101.3335.11.076 0.064
2780101.3472355.81 0.007155
2880101.350.80.1564 0.05684
Table A2. The thermodynamic properties result in different system states (NH3H2O–isobutene).
StateT [°C]P [kPa]h [kJ/kg]s [kJ/kgK]x [%] m ˙ [kg/s]
11302500568.61.6 14.98
260.93353.8494.61.64 14.98
331.92353.8442.31.476 14.98
430353.884.130.2946 14.98
530.88250089.020.2986 14.98
6128.92500964.93.1660.655
7128.9250015894.7820.92852.458
885.43671.114075.1390.92852.458
9128.92500361.91.6040.38082.542
1046.12500−17.40.55020.38082.542
1146.44671.1−17.40.55690.38082.542
1268.68671.1682.82.6860.655
1330671.1−76.390.31470.655
1430.42500−73.180.31740.655
1541.742500−20.870.48650.655
1688.822500358.41.580.655
17140400589.21.7390100
18138.9400584.41.7280100
19110.7400464.51.4260100
2020101.384.010.2965 63.86
2140101.3167.60.5724 63.86
2220101.384.010.2965 45.19
2340101.3167.60.5724 45.19
2486.13400310.71.148 100
2525101.3104.90.3672 0.064
2680101.3335.11.076 0.064
2780101.3472355.81 0.007153
2880101.350.80.1564 0.05684
Table A3. The thermodynamic properties result in different system states (NH3H2O–R236fa).
StateT [°C]P [kPa]h [kJ/kg]s [kJ/kgK]x [%] m ˙ [kg/s]
11302500446.81.7 38.26
272.21320.4417.61.715 38.26
332.49320.4381.31.604 38.26
430320.4236.61.127 38.26
531.442500238.81.128 38.26
6129.52500973.63.1880.655
7129.5250015924.7910.92672.479
886.02671.114105.1480.92672.479
9129.52500365.31.6120.3782.521
1042.842500−30.920.50640.3782.521
1143.19671.1−30.920.51320.3782.521
1268.74671.1683.62.6880.655
1330671.1−76.390.31470.655
1430.42500−73.180.31740.655
1538.282500−36.90.43530.655
1688.862500359.41.5830.655
17140400589.21.7390100
18139.5400587.11.7340100
19110.9400465.61.4290100
2020101.384.010.2965 65.89
2140101.3167.60.5724 65.89
2220101.384.010.2965 45.24
2340101.3167.60.5724 45.24
2486.19400361.31.148 100
2525101.3104.90.3672 0.064
2680101.3335.11.076 0.064
2780101.3472355.81 0.007176
2880101.350.80.1564 0.05684
Table A4. The thermodynamic properties result in different system states (NH3H2O–MD2M).
StateT [°C]P [kPa]h [kJ/kg]s [kJ/kgK]x [%] m ˙ [kg/s]
11302500344.81.424 79.69
274.59109.7329.71.433 79.69
331.92109.7401.31.669 79.69
430109.7231.41.109 79.69
531.382500233.61.11 79.69
6129.72500976.73.1960.655
7129.7250015944.7940.9262.486
886.22671.114125.1510.9262.486
9129.72500366.61.6150.3772.514
1020.512500−128.10.18690.3772.514
1120.92671.1−128.10.1940.3772.514
1265.23671.1637.52.5530.655
1330671.1−76.390.31470.655
1430.42500−73.180.31740.655
1514.762500−144.80.075110.655
1688.422500349.91.5570.655
17140400589.21.7390100
18139.7400588.11.7360100
19110.6400464.11.4250100
2020101.384.010.2965 161.2
2140101.3167.60.5724 161.2
2220101.384.010.2965 42.49
2340101.3167.60.5724 42.49
2486.124003611.147 100
2525101.3104.90.3672 0.064
2680101.3335.11.076 0.064
2780101.3472355.81 0.007178
2880101.350.80.1564 0.05684
Table A5. The thermodynamic properties result in different system states (NH3H2O–R152a).
StateT [°C]P [kPa]h [kJ/kg]s [kJ/kgK]x [%] m ˙ [kg/s]
11302500627.12.237 25.11
274.59690.7583.22.259 25.11
332.61690.7529.12.093 25.11
430690.7253.11.183 25.11
531.382500255.81.185 25.11
6129.12500968.43.1750.655
7129.1250015904.7860.92782.466
885.66671.114085.1430.92782.466
9129.12500363.31.6070.37972.534
1046.492500−15.420.55590.37972.534
1146.83671.1−15.420.56260.37972.534
1268.98671.1686.82.6980.655
1330671.1−76.390.31470.655
1430.42500−73.180.31740.655
1542.142500−19.060.49230.655
1688.882500359.61.5840.655
17140400589.21.7390100
18139.1400585.51.730100
19110.8400465.11.4280100
2020101.384.010.2965 82.51
2140101.3167.60.5724 82.51
2220101.384.010.2965 45.43
2340101.3167.60.5724 45.43
2486.16400361.21.148 100
2525101.3104.90.3672 0.064
2680101.3335.11.076 0.064
2780101.3472355.81 0.007162
2880101.350.80.1564 0.05684

References

  1. Singla, M.K.; Nijhawan, P.; Oberoi, A.S. Hydrogen fuel and fuel cell technology for cleaner future: A review. Environ. Sci. Pollut. Res. 2021, 28, 15607–15626. [Google Scholar] [CrossRef] [PubMed]
  2. Kannah, R.Y.; Kavitha, S.; Preethi; Karthikeyan, O.P.; Kumar, G.; Dai-Viet, N.V.; Banu, J.R. Techno-economic assessment of various hydrogen production methods—A review. Bioresour. Technol. 2021, 319, 124175. [Google Scholar] [CrossRef]
  3. Dash, S.K.; Chakraborty, S.; Elangovan, D. A Brief Review of Hydrogen Production Methods and Their Challenges. Energies 2023, 16, 1141. [Google Scholar] [CrossRef]
  4. Wen, X.; Dressler, L.; Dreizler, A.; Sadiki, A.; Janicka, J.; Hasse, C. Flamelet LES of turbulent premixed/stratified flames with H 2 addition. Combust. Flame 2021, 230, 111428. [Google Scholar] [CrossRef]
  5. Zainal, B.S.; Ker, P.J.; Mohamed, H.; Ong, H.C.; Fattah, I.M.R.; Rahman, S.M.A.; Nghiem, L.D.; Mahlia, T.M.I. Recent advancement and assessment of green hydrogen production technologies. Renew. Sustain. Energy Rev. 2024, 189, 113941. [Google Scholar] [CrossRef]
  6. Aravindan, M.; Kumar, G.P. Optimizing novel green hydrogen production from solar and municipal solid waste: A thermo-economic investigation with environmental comparison between integrated low temperature power cycles. Process Saf. Environ. Prot. 2024, 186, 421–447. [Google Scholar] [CrossRef]
  7. Baral, S.; Šebo, J. Techno-economic assessment of green hydrogen production integrated with hybrid and organic Rankine cycle (ORC) systems. Heliyon 2024, 10, e25742. [Google Scholar] [CrossRef]
  8. Hassan, Q.; Sameen, A.Z.; Salman, H.M.; Jaszczur, M. Large-scale green hydrogen production via alkaline water electrolysis using solar and wind energy. Int. J. Hydrogen Energy 2023, 48, 34299–34315. [Google Scholar] [CrossRef]
  9. Karthikeyan, B.; Kumar, G.P. Thermoeconomic and optimization approaches for integrating cooling, power, and green hydrogen production in dairy plants with a novel solar-biomass cascade ORC system. Energy Convers. Manag. 2023, 295, 117645. [Google Scholar] [CrossRef]
  10. Elrhoul, D.; Naveiro, M.; Gómez, M.R.; Adams, T.A. Thermo-economic analysis of green hydrogen production onboard LNG carriers through solid oxide electrolysis powered by organic Rankine cycles. Appl. Energy 2025, 380, 124996. [Google Scholar] [CrossRef]
  11. Alirahmi, S.M.; Assareh, E.; Pourghassab, N.N.; Delpisheh, M.; Barelli, L.; Baldinelli, A. Green hydrogen & electricity production via geothermal-driven multi-generation system: Thermodynamic modeling and optimization. Fuel 2022, 308, 122049. [Google Scholar] [CrossRef]
  12. Hai, T.; El-Shafay, A.S.; Alizadeh, A.; Chauhan, B.S.; Almojil, S.F.; Almohana, A.I.; Alali, A.F. Combination of a geothermal-driven double-flash cycle and a Kalina cycle to devise a polygeneration system: Environmental assessment and optimization. Appl. Therm. Eng. 2023, 228, 120437. [Google Scholar] [CrossRef]
  13. Madhesh, K.; Devesh, D.R.; Vivin, T.; Raj, M.P.; Phelan, P.E.; Kumar, V.V.; Kumar, G.P. Analysis and multi-objective evolutionary optimization of Solar-Biogas hybrid system operated cascade Kalina organic Rankine cycle for sustainable cooling and green hydrogen production. Energy Convers. Manag. 2024, 301, 117999. [Google Scholar] [CrossRef]
  14. Saoud, A.; Boukhchana, Y.; Bruno, J.C.; Fellah, A. Thermodynamic investigation of an innovative solar-driven trigeneration plant based on an integrated ORC-single effect-double lift absorption chiller. Therm. Sci. Eng. Prog. 2024, 50, 102596. [Google Scholar] [CrossRef]
  15. Sharifishourabi, M.; Dincer, I.; Mohany, A. A novel trigeneration energy system with two modes of operation for thermal energy storage and hydrogen production. Energy 2024, 304, 132121. [Google Scholar] [CrossRef]
  16. Yilmaz, F.; Ozturk, M.; Selbas, R. A parametric examination of the energetic, exergetic, and environmental performances of the geothermal energy-based multigeneration plant for sustainable products. Int. J. Hydrogen Energy 2024, 143, 947–957. [Google Scholar] [CrossRef]
  17. Sabbaghi, M.A.; Sefid, M. Thermo-economic analysis of a combined flash-binary geothermal cycle with a transcritical CO2 cycle to produce green hydrogen. Int. J. Exergy 2024, 43, 110–122. [Google Scholar] [CrossRef]
  18. Hajabdollahi, H.; Saleh, A.; Dehaj, M.S. A multi-generation system based on geothermal driven: Energy, exergy, economic and exergoenvironmental (4E) analysis for combined power, freshwater, hydrogen, oxygen, and heating production. Environ. Dev. Sustain. 2023, 26, 26415–26447. [Google Scholar] [CrossRef]
  19. Li, W.; Li, S.; Abed, A.M.; Ayed, H.; Khadimallah, M.A.; Deifalla, A.; Lee, V.F. Enhancing green hydrogen production via improvement of an integrated double flash geothermal cycle; Multi-criteria optimization and exergo-environmental evaluation. Case Stud. Therm. Eng. 2024, 59, 104538. [Google Scholar] [CrossRef]
  20. Arslan, M.; Yilmaz, C. Development of models for green hydrogen production of Turkey geothermal Resources: A case study demonstration of thermodynamics and thermoeconomics analyses. Fuel 2024, 359, 130430. [Google Scholar] [CrossRef]
  21. Li, K.; Ding, Y.-Z.; Ai, C.; Sun, H.; Xu, Y.-P.; Nedaei, N. Multi-objective optimization and multi-aspect analysis of an innovative geothermal-based multi-generation energy system for power, cooling, hydrogen, and freshwater production. Energy 2022, 245, 123198. [Google Scholar] [CrossRef]
  22. Almutairi, K.; Dehshiri, S.S.H.; Mostafaeipour, A.; Issakhov, A.; Techato, K.; Dhanraj, J.A. Performance optimization of a new flash-binary geothermal cycle for power/hydrogen production with zeotropic fluid. J. Therm. Anal. Calorim. 2021, 145, 1633–1650. [Google Scholar] [CrossRef]
  23. Gao, J.; Zhang, Y.; Li, X.; Zhou, X.; Kilburn, Z.J. Thermodynamic and thermoeconomic analysis and optimization of a renewable-based hybrid system for power, hydrogen, and freshwater production. Energy 2024, 295, 131002. [Google Scholar] [CrossRef]
  24. Zhang, S.; Jian, W.; Zhou, J.; Li, J.; Yan, G. A new solar, natural gas, and biomass-driven polygeneration cycle to produce electrical power and hydrogen fuel; thermoeconomic and prediction approaches. Fuel 2023, 334, 126825. [Google Scholar] [CrossRef]
  25. Laleh, S.S.; Gharamaleki, F.P.; Alavi, S.F.; Soltani, S.; Mahmoudi, S.M.S.; Rosen, M.A. A novel sustainable biomass-fueled cogeneration cycle integrated with carbon dioxide capture utilizing LNG regasification and green hydrogen production via PEM electrolysis: Thermodynamic assessment. J. Clean. Prod. 2023, 421, 138529. [Google Scholar] [CrossRef]
  26. Wang, S.; Lin, H.; Abed, A.M.; Sharma, A.; Fooladi, H. Exergoeconomic assessment of a biomass-based hydrogen, electricity and freshwater production cycle combined with an electrolyzer, steam turbine and a thermal desalination process. Int. J. Hydrogen Energy 2022, 47, 33699–33718. [Google Scholar] [CrossRef]
  27. Karthikeyan, B.; Kumar, G.P.; Narayanan, R.; Saravanan, R.; Coronas, A. Thermo-economic optimization of hybrid solar-biomass driven organic rankine cycle integrated heat pump and PEM electrolyser for combined power, heating, and green hydrogen applications. Energy 2024, 299, 131436. [Google Scholar] [CrossRef]
  28. Sharifishourabi, M.; Dincer, I.; Mohany, A. Development of a novel biomass-wind energy system for clean hydrogen production along with other useful products for a residential community. Energy Built Environ. 2025. [Google Scholar] [CrossRef]
  29. Forootan, M.M.; Ahmadi, A. Machine learning-based optimization and 4E analysis of renewable-based polygeneration system by integration of GT-SRC-ORC-SOFC-PEME-MED-RO using multi-objective grey wolf optimization algorithm and neural networks. Renew. Sustain. Energy Rev. 2024, 200, 114616. [Google Scholar] [CrossRef]
  30. Bamisile, O.; Huang, Q.; Hu, W.; Dagbasi, M.; Kemena, A.D. Performance analysis of a novel solar PTC integrated system for multi-generation with hydrogen production. Int. J. Hydrogen Energy 2020, 45, 190–206. [Google Scholar] [CrossRef]
  31. Lykas, P.; Georgousis, N.; Kitsopoulou, A.; Korres, D.N.; Bellos, E.; Tzivanidis, C. A Detailed Parametric Analysis of a Solar-Powered Cogeneration System for Electricity and Hydrogen Production. Appl. Sci. 2022, 13, 433. [Google Scholar] [CrossRef]
  32. Mansir, I.B. Thermodynamic investigation of novel hybrid plant with hydrogen as a green energy carrier. Int. J. Hydrogen Energy 2024, 51, 1171–1180. [Google Scholar] [CrossRef]
  33. Colakoglu, M.; Durmayaz, A. Energy, exergy and economic analyses and multiobjective optimization of a novel solar multi-generation system for production of green hydrogen and other utilities. Int. J. Hydrogen Energy 2022, 47, 19446–19462. [Google Scholar] [CrossRef]
  34. Effatpanah, S.K.; Rahbari, H.R.; Ahmadi, M.H.; Farzaneh, A. Green hydrogen production and utilization in a novel SOFC/GT-based zero-carbon cogeneration system: A thermodynamic evaluation. Renew. Energy 2023, 219, 119493. [Google Scholar] [CrossRef]
  35. Gargari, S.G.; Rahimi, M.; Ghaebi, H. Thermodynamic analysis of a novel power-hydrogen cogeneration system. Energy Convers. Manag. 2018, 171, 1093–1105. [Google Scholar] [CrossRef]
  36. Makuku, L. Inventory of geothermal sources in the DRC and their development plan for the electrification of locals areas. In IOP Conference Series: Earth and Environmental Science, Proceedings of the 2nd International Geothermal Conference, Petropavlovsk-Kamchatsky, Russian, 4–7 September 2018; IOP Publishing: Bristol, UK, 2019; Volume 249, p. 012016. [Google Scholar] [CrossRef]
  37. Mukandala, P.S.; Mahinda, C.K. Geothermal Development in the Democratic Republic of the Congo-a Country Update. In Proceedings of the 8th African Rift Geothermal Conference, Nairobi, Kenya, 2–8 November 2020. [Google Scholar] [CrossRef]
  38. Mbuto, M.; Albert, Y.-Y.; Albert, K. Etude Differentielle Des Sites Geothermiques De Kankule A Katana Au Sud-Kivu I. Rev. Littérature 2020, 12, 2278–4861. [Google Scholar]
  39. Mergner, H.; Weimer, T. Performance of ammonia–water based cycles for power generation from low enthalpy heat sources. Energy 2015, 88, 93–100. [Google Scholar] [CrossRef]
  40. Ayou, D.S.; Coronas, A. New Developments and Progress in Absorption Chillers for Solar Cooling Applications. Appl. Sci. 2020, 10, 4073. [Google Scholar] [CrossRef]
  41. Hannon, C.L.; Gerstmann, J.; Mansfeld, F.B.; Sun, Z.N. Development of Improved Corrosion Inhibitors for Ammonia–Water Absorption Heat Pumps. In Advanced Energy Systems; American Society of Mechanical Engineers: Orlando, FL, USA, 2000; pp. 35–46. [Google Scholar] [CrossRef]
  42. Jiang, W.; Li, S.; Yang, L.; Du, K. Experimental investigation on performance of ammonia absorption refrigeration system with TiO2 nanofluid. Int. J. Refrig. 2019, 98, 80–88. [Google Scholar] [CrossRef]
  43. Yang, J.; Wang, S.; Xu, D.; Guo, Y.; Yang, C.; Li, Y. Effect of ammonium chloride on corrosion behavior of Ni-based alloys and stainless steel in supercritical water gasification process. Int. J. Hydrogen Energy 2017, 42, 19788–19797. [Google Scholar] [CrossRef]
  44. Chaboki, Y.A.; Khoshgard, A.; Salehi, G.; Fazelpour, F. Thermoeconomic analysis of a new waste heat recovery system for large marine diesel engine and comparison with two other configurations. Energy Sources Part A Recovery Util. Environ. Eff. 2024, 46, 10159–10184. [Google Scholar] [CrossRef]
  45. Öksel, C.; Koç, A. Modeling of a Combined Kalina and Organic Rankine Cycle System for Waste Heat Recovery from Biogas Engine. Sustainability 2022, 14, 7135. [Google Scholar] [CrossRef]
  46. Rostamzadeh, H.; Ghaebi, H.; Vosoughi, S.; Jannatkhah, J. Thermodynamic and thermoeconomic analysis and optimization of a novel dual-loop power/refrigeration cycle. Appl. Therm. Eng. 2018, 138, 1–17. [Google Scholar] [CrossRef]
  47. Bamisile, O.; Huang, Q.; Dagbasi, M.; Adebayo, V.; Okonkwo, E.C.; Ayambire, P.; Al-Ansari, T.; Ratlamwala, T.A.H. Thermo-environ study of a concentrated photovoltaic thermal system integrated with Kalina cycle for multigeneration and hydrogen production. Int. J. Hydrogen Energy 2020, 45, 26716–26732. [Google Scholar] [CrossRef]
  48. Bahrami, H.-R.; Rosen, M.A. Exergoeconomic evaluation and multi-objective optimization of a novel geothermal-driven zero-emission system for cooling, electricity, and hydrogen production: Capable of working with low-temperature resources. Geotherm. Energy 2024, 12, 12. [Google Scholar] [CrossRef]
  49. Ni, M.; Leung, M.K.H.; Leung, D.Y.C. Energy and exergy analysis of hydrogen production by a proton exchange membrane (PEM) electrolyzer plant. Energy Convers. Manag. 2008, 49, 2748–2756. [Google Scholar] [CrossRef]
  50. Taheripour, M.; Kahani, M.; Ahmadi, M.H. A hybrid poly-generation system for power and hydrogen production by thermal recovery from waste streams in a steel plant: Techno-economic analysis. Energy Rep. 2024, 11, 2921–2934. [Google Scholar] [CrossRef]
  51. Nami, H.; Akrami, E.; Ranjbar, F. Hydrogen production using the waste heat of Benchmark pressurized Molten carbonate fuel cell system via combination of organic Rankine cycle and proton exchange membrane (PEM) electrolysis. Appl. Therm. Eng. 2017, 114, 631–638. [Google Scholar] [CrossRef]
  52. Bejan, A.; Tsatsaronis, G.; Moran, M.J. Thermal Design and Optimization; John Wiley and Sons: Hoboken, NJ, USA, 1996. [Google Scholar]
  53. Dehghani, M.J. Enhancing energo-exergo-economic performance of Kalina cycle for low- to high-grade waste heat recovery: Design and optimization through deep learning methods. Appl. Therm. Eng. 2021, 195, 117221. [Google Scholar] [CrossRef]
  54. Sadiki, A.; Ries, F. Entropy Generation Analysis in Turbulent Reacting Flows and Near Wall: A Review. Entropy 2022, 24, 1099. [Google Scholar] [CrossRef]
  55. Shankar, R.; Rivera, W. Investigation of new cooling cogeneration cycle using NH3H2O mixture. Int. J. Refrig. 2020, 114, 88–97. [Google Scholar] [CrossRef]
  56. Srinivas, T.; Ganesh, N.S.; Shankar, R. Flexible Kalina Cycle Systems; Apple Academic Press: Palm Bay, FL, USA, 2019. [Google Scholar] [CrossRef]
  57. Mosaffa, A.H.; Mokarram, N.H.; Farshi, L.G. Thermoeconomic analysis of a new combination of ammonia/water power generation cycle with GT-MHR cycle and LNG cryogenic exergy. Appl. Therm. Eng. 2017, 124, 1343–1353. [Google Scholar] [CrossRef]
  58. Alelyani, S.M.; Fette, N.W.; Stechel, E.B.; Doron, P.; Phelan, P.E. Techno-economic analysis of combined ammonia–water absorption refrigeration and desalination. Energy Convers. Manag. 2017, 143, 493–504. [Google Scholar] [CrossRef]
  59. Dehghani, M.J.; Yoo, C.K. Modeling and extensive analysis of the energy and economics of cooling, heat, and power trigeneration (CCHP) from textile wastewater for industrial low-grade heat recovery. Energy Convers. Manag. 2020, 205, 112451. [Google Scholar] [CrossRef]
  60. Köse, Ö.; Koç, Y.; Yağlı, H. Energy, exergy, economy and environmental (4E) analysis and optimization of single, dual and triple configurations of the power systems: Rankine Cycle/Kalina Cycle, driven by a gas turbine. Energy Convers. Manag. 2021, 227, 113604. [Google Scholar] [CrossRef]
  61. Cao, Y.; Haghghi, M.A.; Shamsaiee, M.; Athari, H.; Ghaemi, M.; Rosen, M.A. Evaluation and optimization of a novel geothermal-driven hydrogen production system using an electrolyser fed by a two-stage organic Rankine cycle with different working fluids. J. Energy Storage 2020, 32, 101766. [Google Scholar] [CrossRef]
  62. Emadi, M.A.; Mahmoudimehr, J. Modeling and thermo-economic optimization of a new multi-generation system with geothermal heat source and LNG heat sink. Energy Convers. Manag. 2019, 189, 153–166. [Google Scholar] [CrossRef]
  63. AShirazi; Taylor, R.A.; Morrison, G.L.; White, S.D. A comprehensive, multi-objective optimization of solar-powered absorption chiller systems for air-conditioning applications. Energy Convers. Manag. 2017, 132, 281–306. [Google Scholar] [CrossRef]
  64. Ghaebi, H.; Parikhani, T.; Rostamzadeh, H.; Farhang, B. Thermodynamic and thermoeconomic analysis and optimization of a novel combined cooling and power (CCP) cycle by integrating of ejector refrigeration and Kalina cycles. Energy 2017, 139, 262–276. [Google Scholar] [CrossRef]
  65. Sharifi, S.; Heravi, F.N.; Shirmohammadi, R.; Ghasempour, R.; Petrakopoulou, F.; Romeo, L.M. Comprehensive thermodynamic and operational optimization of a solar-assisted LiBr/water absorption refrigeration system. Energy Rep. 2020, 6, 2309–2323. [Google Scholar] [CrossRef]
  66. Ghaebi, H.; Parikhani, T.; Rostamzadeh, H.; Farhang, B. Proposal and assessment of a novel geothermal combined cooling and power cycle based on Kalina and ejector refrigeration cycles. Appl. Therm. Eng. 2018, 130, 767–781. [Google Scholar] [CrossRef]
  67. Gogoi, T.K.; Hazarika, P. Comparative assessment of four novel solar based triple effect absorption refrigeration systems integrated with organic Rankine and Kalina cycles. Energy Convers. Manag. 2020, 226, 113561. [Google Scholar] [CrossRef]
  68. Ghaebi, H.; Namin, A.S.; Rostamzadeh, H. Exergoeconomic optimization of a novel cascade Kalina/Kalina cycle using geothermal heat source and LNG cold energy recovery. J. Clean. Prod. 2018, 189, 279–296. [Google Scholar] [CrossRef]
  69. Ghaebi, H.; Farhang, B.; Parikhani, T.; Rostamzadeh, H. Energy, exergy and exergoeconomic analysis of a cogeneration system for power and hydrogen production purpose based on TRR method and using low grade geothermal source. Geothermics 2018, 71, 132–145. [Google Scholar] [CrossRef]
  70. Akrami, E.; Chitsaz, A.; Ghamari, P.; Mahmoudi, S.M.S. Energy and exergy evaluation of a tri-generation system driven by the geothermal energy. J. Mech. Sci. Technol. 2017, 31, 401–408. [Google Scholar] [CrossRef]
  71. Soleymani, E.; Gargari, S.G.; Ghaebi, H. Thermodynamic and thermoeconomic analysis of a novel power and hydrogen cogeneration cycle based on solid SOFC. Renew. Energy 2021, 177, 495–518. [Google Scholar] [CrossRef]
  72. Kasuyoka, K. Techno-Economic Analysis of Geothermal Hydrogen Power Generation for Load Management in Kenya. 2023. Available online: https://hdl.handle.net/10371/196544 (accessed on 5 July 2025).
  73. Hamlehdar, M.; Beardsmore, G.; Narsilio, G.A. Hydrogen production from low-temperature geothermal energy—A review of opportunities, challenges, and mitigating solutions. Int. J. Hydrogen Energy 2024, 77, 742–768. [Google Scholar] [CrossRef]
Table 2. Some DRC potential geothermal sites by well temperature and depth.
ReferenceSitesTemperatures [°C]Depth [m]
Kankule [38]Kankule 190–2031019.21–3514.15
Upemba-Moero-Tanganyika [37]Tanganyika40–50
Upemba70–100
Kivu-Edouard [37]Kivu-Edouard20–100
Rwenzori [37]Soixante sites20–100
Virunga [37]Mayi-ya-Moto96
Kahuzi Biega Ruzizi [37]Nyangezi40
Uvira44
Table 3. Some thermodynamic properties of the selected working fluids [44,46].
Working
Fluids
Molar Mass
[kg/kmol]
T c r i t .
[°C]
P c r i t .
[Bar]
ODPGWP
[100/yr]
ASHRAE *
R236fa152.04124.853206300-
MD2M310.7326.311.4401A1
ISOBUTANE58.13134.6636.29020A3
R152a66.05113.3045.2012.4A2
ISOBUTENE56.13144.740-3-
* ASHRAE Standard; 1: no flame propagation; 2: lower flammability; 3: higher Flammability; A: lower Toxicity; B: higher Toxicity.
Table 4. Other thermodynamic input parameters.
ParametersValueUnit
Reference temperature, T025°C
Reference pressure, P0101.3kPa
Geothermal inlet temperature, T_source140°C
Geothermal water mass flow rate, m_geo100kg/s
Terminal temperature difference, TTD10°C
Basic ammonia mass fraction, Xbasic65%
Regenerators effectiveness 1 and 2, εReg95%
High pressure, P_high2500kPa
Turbines isentropic efficiency, ηTur87%
Pumps isentropic efficiency, ηPump75%
Temperature of condenser 130°C
Exchanger, Hex80%
Basic mixture mass flow rate, m_basic5kg/s
Anode activation energy, Eacta76(kJ/kg)
Cathode activation energy, Eactc18(kJ/kg)
Anode pre-exponential factor, Jre,a1.7 × 105(A/m2)
Cathode pre-exponential factor, Jref,c4.6 × 103(A/m2)
Faraday constant, F96,486(C/mol)
Table 5. Thermodynamic balance (energy and exergy) equations for poly-generation system.
ComponentsFirst Low EquationsSecond Low Equations
Vapor generator, KC Q ˙ v g , K C = m ˙ 6 ( h 7 h 16 ) S ˙ g e n , v g = m ˙ 6 ( s 16 s 6 ) + m ˙ 18 ( s 19 s 18 )
Vapor generator, ORC Q ˙ v g = m ˙ 1 ( h 1 h 5 ) S ˙ g e n , v g = m ˙ 1 ( s 5 s 1 ) + m ˙ 18 ( s 18 s 17 )
Separator m ˙ 6 x 6 = m ˙ 9 x 9 + m ˙ 7 x 7
m ˙ 6 h 6 = m ˙ 9 h 9 + m ˙ 7 h 7
m ˙ 6 = m ˙ 9 + m ˙ 7
S ˙ g e n , s e p = m ˙ 9 s 9 + m ˙ 7 s 7 m ˙ 6 s 6
Turbine, ORC W ˙ t u r = m ˙ 1 ( h 1 h 2 )
η i s , t u r = h 1 h 2 h 1 h 2 s
S ˙ g e n , t u r = m ˙ 1 ( s 2 s 1 )
Turbine, KC W ˙ t u r , K C = m ˙ 8 ( h 7 h 8 ) S ˙ g e n , t u r = m ˙ 8 ( s 8 s 7 )
Pump 1 W ˙ p u m p   1 = m ˙ 5 ( h 5 h 4 )
η i s , p u m p = h 5 s h 4 h 5 h 4
S ˙ g e n , p u m p 1 = m ˙ 5 ( s 4 s 5 )
Pump 2 W ˙ p u m p 2 = m ˙ 13 ( h 14 h 13 ) S ˙ g e n , p u m p 2 = m ˙ 13 ( s 13 s 14 )
Regenerator Q ˙ r e g = m ˙ 2 ( h 2 h 3 )
ε r e g = T 2 T 15 T 2 T 3
S ˙ g e n , r e g = m ˙ 2 ( s 3 s 2 ) + m ˙ 15 ( s 14 s 15 )
Regenerator 2 Q ˙ r e g   2 = m ˙ 15 ( h 16 h 15 ) S ˙ g e n , r e g   2 = m ˙ 9 ( s 10 s 9 ) + m ˙ 15 ( s 15 s 16 )
Valve 1 h 10 = h 11 S ˙ g e n , v a l v e = m ˙ 10 ( s 11 s 10 )
Mixer 1 m ˙ 11 x 11 + m ˙ 8 x 8 = m ˙ 12 x 12
m ˙ 11 h 11 + m ˙ 8 h 8 = m ˙ 12 h 12
m ˙ 11 + m ˙ 8 = m ˙ 12
S ˙ g e n , m i x 1 = m ˙ 17 s 17 m ˙ 15 s 15 m ˙ 16 s 16
Condenser 1 Q ˙ c o n d 1 = m ˙ 3 ( h 3 h 4 ) S ˙ g e n , c o n d 1 = m ˙ 3 ( s 4 s 3 ) + m ˙ 20 ( s 21 s 20 )
Condenser 2 Q ˙ c o n d 2 = m ˙ 12 ( h 13 h 12 ) S ˙ g e n , c o n d 2 = m ˙ 12 ( s 12 s 13 ) + m ˙ 22 ( s 23 s 22 )
HEX Q ˙ h e x = m ˙ 19 ( h 19 h 24 ) S ˙ g e n , h e x = m ˙ 19 ( s 24 s 19 ) + m ˙ 25 ( s 25 s 26 )
Table 6. Purchase cost of system equipment [57].
ComponentsPurchasing CostCEPCI
Turbine 4405     ( W ˙ t u r b i n e ) 0.7 C 2024 C 2012
Pump 1120     ( W ˙ p u m p ) 0.8 C 2024 C 2012
CI2000, CI2012 and CI2024 are equal to 394.1, 584.6, and 795.4, respectively [53,58]
Table 7. Genetic algorithm responsible parameters [66].
ParametersValues
Individuals number in the population32
Number of generations64
Maximum mutation rate0.25
Minimum mutation rate0.0005
Initial mutation rate0.25
Crossover probability0.85
Table 8. The ranges of decision variables.
Decision VariableRange
TTD (°C)8–15
x b a s i c 0.50–0.90
P h i g h · (kPa)1500–3000
T s o u r c e · (°C)120–180
Table 9. ORC validation [67].
StateTemperature [°C]Pressure [kPa]Enthalpy [kJ/kg]Entropy [kJ/kgK]
ReferenceStudyReferenceStudyReferenceStudyReferenceStudy
11451451129.811130531.84531.81.9431.943
298.998.71177.79177.2494.034941.9541.954
347.5047.48177.79177.3443.38443.41.8081.808
43030177.79177.4239.10239.11.1351.135
530.4030.41129.811130239.90239.91.1361.136
669.5467.131129.811130290.94290.51.3031.293
Wnet [kW]38103947
Thermal efficiency0.15080.1536
Table 10. Validation of KCS [68].
Pressure [kPa]Temperature [K]Ammonia Concentration
Present WorkReferenceRelative
Error [%]
Present WorkReferenceRelative Error [%]Present WorkReferenceRelative Error [%]
1491949190433.2433.150.0120.62990.62990
2491949190433.2433.150.0120.90940.90940
3491949190433.2433.150.0120.42690.42690
4491949190319319.07−0.0020.42690.42690
5823.28230.024319.8319.81−0.0030.42690.42690
6823.28230.024352.3356.54−1.1890.90940.90940
7823.28230.024342.2342.160.0120.62990.62990
8823.28230.024312.1312.100.62990.62990
9491949190313313.06−0.0190.62990.62990
10491949190378.7378.690.0030.62990.62990
Present workReferenceRelative error [%]
Thermal efficiency0.13530.13520.07396
Table 11. Validation of PEME [50].
ParametersPresent WorkReference
Current density [A/m2]50005000
Water primary temperature [°C]2525
Electrolyzer temperature [°C]8080
Net power [kW]29,42129,421
Hydrogen production [kg/s]0.09400.0940
Table 12. Thermodynamic evaluation results obtained from the simulation.
Working FluidsWnet [kW] m ˙ H 2 [kg/s] η t h η e x
NH3H2O–MD2M14700.0071780.11840.1258
NH3H2O–R236fa14690.0071760.13320.1269
NH3H2O–R152a14670.0071620.11860.1261
NH3H2O–ISOBUTANE14650.0071550.13710.1258
NH3H2O–ISOBUTENE14650.0071530.14340.1253
Table 13. Thermodynamic evaluation results obtained after simulation (ammonia–water + MD2M).
OutputsValues
Net power, Wnet1470 [kW]
Hydrogen production, m ˙ H 2 0.007178 [kg/s]
Energy efficiency, η t h 0.1184
Exergy efficiency, η e x 0.1258
PEME efficiency, η P E M E 0.5831
System efficiency, η s y s t 0.1875
TIC($) 3,342,000
DPT5.37 (yr)
LCOH3.007 $/kg H2
Table 14. (a) Optimization results of different combinations. (b) Results comparison before and after optimization.
(a)
Working FluidsWnet [kW] m ˙ H 2 [kg/s] η t h η e x
NH3H2O–MD2M17740.0086390.1660.2438
NH3H2O–R236fa17440.0084980.15550.248
NH3H2O–R152a20040.0097420.14910.252
NH3H2O–ISOBUTANE17540.0085430.16250.2468
NH3H2O–ISOBUTENE17290.0084250.17140.2537
(b)
TermsPre-OptimizationPost-Optimization
Temperature source [°C]180180
Terminal temperature difference [°C]108.968
High pression [kPa]25003000
Ammonia concentration (X_basic)0.650.8966
Net power, Wnet [kW]18702004
Hydrogen production, m ˙ H 2 [kg/s]0.0090980.009742
Energy efficiency, η t h 0.12320.1491
Exergy efficiency, η e x 0.20070.252
System efficiency, η s y s t 0.19540.2358
TIC [$]3,994,0004,120,000
Disclaimer/Publisher’s Note: The statements, opinions and data contained in all publications are solely those of the individual author(s) and contributor(s) and not of MDPI and/or the editor(s). MDPI and/or the editor(s) disclaim responsibility for any injury to people or property resulting from any ideas, methods, instructions or products referred to in the content.