Article

Elemental Composition Analysis of Major Refined Petroleum Fuel Products in Ghana

by
Robert Wilson
1 and
Calvin Kwesi Gafrey
1,2,*
1
Laser and Fibre Optic Centre, Department of Physics, University of Cape Coast, Cape Coast P.O. Box UCC, Ghana
2
Department of Electronics Engineering, Soonchunhyang University, Asan 31538, Republic of Korea
*
Author to whom correspondence should be addressed.
Fuels 2025, 6(3), 62; https://doi.org/10.3390/fuels6030062
Submission received: 28 January 2025 / Revised: 25 July 2025 / Accepted: 13 August 2025 / Published: 19 August 2025

Abstract

Samples of refined petroleum fuels from the three major oil-marketing companies (GOIL Company Limited, Total Energies Ghana Limited and Shell Vivo Ghana Limited) in Ghana have been analysed for elemental concentrations using an X-ray fluorescence facility at the National Nuclear Research Institute, Ghana Atomic Energy Commission. The samples were acquired from seven different fuel service stations where customers directly purchase refined petroleum fuels such as diesel, petrol and kerosene. The X-ray fluorescence method was considered for the study because sample preparation does not require the addition of reagents, and the fluorescence measurements involve a direct electron transition effect. The fluorescence study was carried out to estimate the concentrations of sulphur and other contaminants in the major refined petroleum fuel products patronised in Ghana. The average sulphur concentration in the samples of diesel products were 17.543, 25.805 and 26.813 ppm in DFS, DE and DXP samples compared to 22.258, 22.623 and 15.748 ppm in petrol samples of PE, PXP and VP. Also, the sulphur concentration of sample KE, kerosene products, is 33.250 ppm. Among the diesel samples, DE and DXP recorded the highest but most comparable average concentration of elemental contaminants, and DFS the least, while PXP recorded the least among the petrol samples. The study estimated the concentrations of four heavy metal elements that are toxic to biological life (Hg, Pb, Cr and Mn) to be less than 10.0 ppm, except Cr. The study concluded that most of the elemental contaminants of heavy metals in the samples were relatively less than ultra-low levels. Therefore, exhaust emissions may have little impact on the environment. Also, the content of the ash-producing metal elements in each sample of the seven refined fuel products is between 10.0 and 50.0 ppm. Since the concentration of sulphur and a few other elemental contaminants could not meet the internationally accepted standard (<10.0 ppm), the imported refined fuel products used in Ghana may be considered relatively good but not environmentally safe.

1. Introduction

Refined petroleum is organic fuel obtained from crude petroleum through thermal catalytic cracking. It consists of petrol (gasoline), diesel (gas oils), kerosene (paraffin oil), heavy oil, wax, etc. Refined petroleum fuel products are burnt in the engines of electric and mechanical plants to generate energy for work done [1]. Refined petroleum contains a lot of metal and non-metal contaminants [2]. This is because these metal and non-metal ionic species under normal physical conditions naturally undergo various chemical bonds with the molecules of hydrocarbons in the sedimentary rock from in which they are acquired. Sulphur is the most abundant non-metal contaminant [3]. Crude petroleum is rated as sweet or sour based on sulphur content. Sulphur composition of 0.5 wt.% and above in crude oil is considered sour and would render costly refinery processes and more expensive petroleum products [4]. If the contaminants are not properly removed from the crude petroleum during the thermal catalytic refinery process, then it would result in serious environmental pollution [1]. The contaminants that remain in refined petroleum fuels lead to improper combustion, pollution and scale formation on delicate components of pumps and engines [5]. Non-metal element contaminants in refined hydrocarbon fuels are sulphur, chlorine, bromine, etc. The emissions of these contaminants in the atmosphere cause acid rain, ash, toxic emissions and the greenhouse effect [6].
The ash content in refined petroleum fuels depends on inorganic compounds in the fuel. Deposition of ash on valves, spark plugs and piston heads during combustion is due to the metal compounds potassium, vanadium, iron, nickel, calcium, zinc, cobalt, etc. in refined fuels [5]. Sulphur impurity in hydrocarbon fuel is notably known as one of the major causes of acid rain. Diesel and kerosene fuels contain a high degree of sulphur content that would lead to acid rain formation in the atmosphere relative to petrol fuel [7]. The sulphur content in refined hydrocarbon fuel reacts with oxygen during combustion to produce sulphur compounds, which cause corrosive effects in the engine [8]. However, depending on the technology for cracking, these contaminants may be minimised but are not removed during cracking. The level of metal and non-metal contaminants in refined fuel determines its quality level in the world market [9]. The emission of organic bromine contaminants in the atmosphere is very dangerous to health. Accumulation of bromine contaminants in animals causes malfunction of the nervous system and thyroid glands [10]. Hence, an important area that requires thorough investigation for its quantification.
Heavy metal ions such as vanadium, mercury, lead, cadmium and arsenic in hydrocarbon fuels are also toxic contaminants [11]. Heavy metal contaminants constitute an important group of toxic pollutants that occur in the atmosphere. Accumulation of heavy metals in live cells and tissues causes ecological imbalance [5,12]. One of the suspected sources of these heavy metals in the atmosphere is the combustion of transport fuels in vehicles. The presence of lead metal in refined fuel may be due to the nature of the sedimentary rock from which the crude oil was acquired and the addition of tetraethyl lead compound to improve octane rating [13]. In the year 1921, research conducted by General Motors confirmed that tetraethyl lead compound in petroleum fuel is toxic and causes acute poisoning [14].
Vanadium is an oxidant metal commonly found in diesel fuel that causes corrosion at high temperatures. During the combustion of hydrocarbon fuels in the engine, vanadium chemically reacts with sodium and sulphur to produce vanadate compounds that increase the rust of steel by removing the inert layer that shields the steel [12]. The chemical effect of vanadate salt increases the rate of rusting in engines, pump transport and exhaust pipelines. Also, residual metal contaminants in refined fuels produce ash and scales that deposit on pistons, injectors and valves of engines. The formation of ash and scales results in improper combustion of hydrocarbon fuel in the engine [15].
In Ghana, refined fuels mostly imported by oil-marketing companies are petrol, diesel, kerosene and petrol premix for fishermen. Ghana is a low-income economy country and only a few wealthy individuals can afford brand new vehicles. The country mostly imports second-hand vehicles from industrialised countries such as the United States, Germany, Canada, United Kingdom, Japan, France, Italy and Republic of Korea for road transportation [16]. These second-hand imported vehicles mostly have weak engines of low fuel combustion efficiency. The engines of such vehicles produce improper combustion, which results in high carbon exhaust emission [17,18,19]. Also, poor quality fuel in good engines may cause improper combustion. As of now, there is no law enforcement agency that access vehicle exhaust emission levels in Ghana to save the environment. It is, therefore, necessary to determine multi-elemental data on the refined fuel products consumed in Ghana to save its environment.
This research employed energy dispersive X-ray fluorescence facility at the National Nuclear Research Institute, Ghana Atomic Energy Commission, to acquire spectral data on samples of refined fuels (petrol, diesel and Kerosene) from GOIL Company Limited, Shell Vivo Ghana Limited and Total Energies Ghana Limited. Developing the scientific procedures for determining the characteristics of various refined petroleum fuels from different oil-marketing companies for environmental safety is very important and calls for research. The spectroscopic technique based on X-ray fluorescence has gained relevance in the field of petroleum research because it provides data containing the intrinsic chemical properties of an analysed sample [20]. The intensity, energy state, wavelength and frequency of X-ray emissions are strongly influenced by the chemical composition of a sample [17]. Energy-dispersive X-ray fluorescence (EDXRF) spectroscopy is very sensitive and gives better detection techniques. Therefore, it is important to conduct spectroscopic studies for the elemental characteristics of Ghana’s petroleum fuel products to obtain comprehensive data for the future development of the petroleum industry and environmental safety measures. In conclusion, the refined fuel samples of petrol and kerosene have fewer contaminants compared to diesel samples [1].
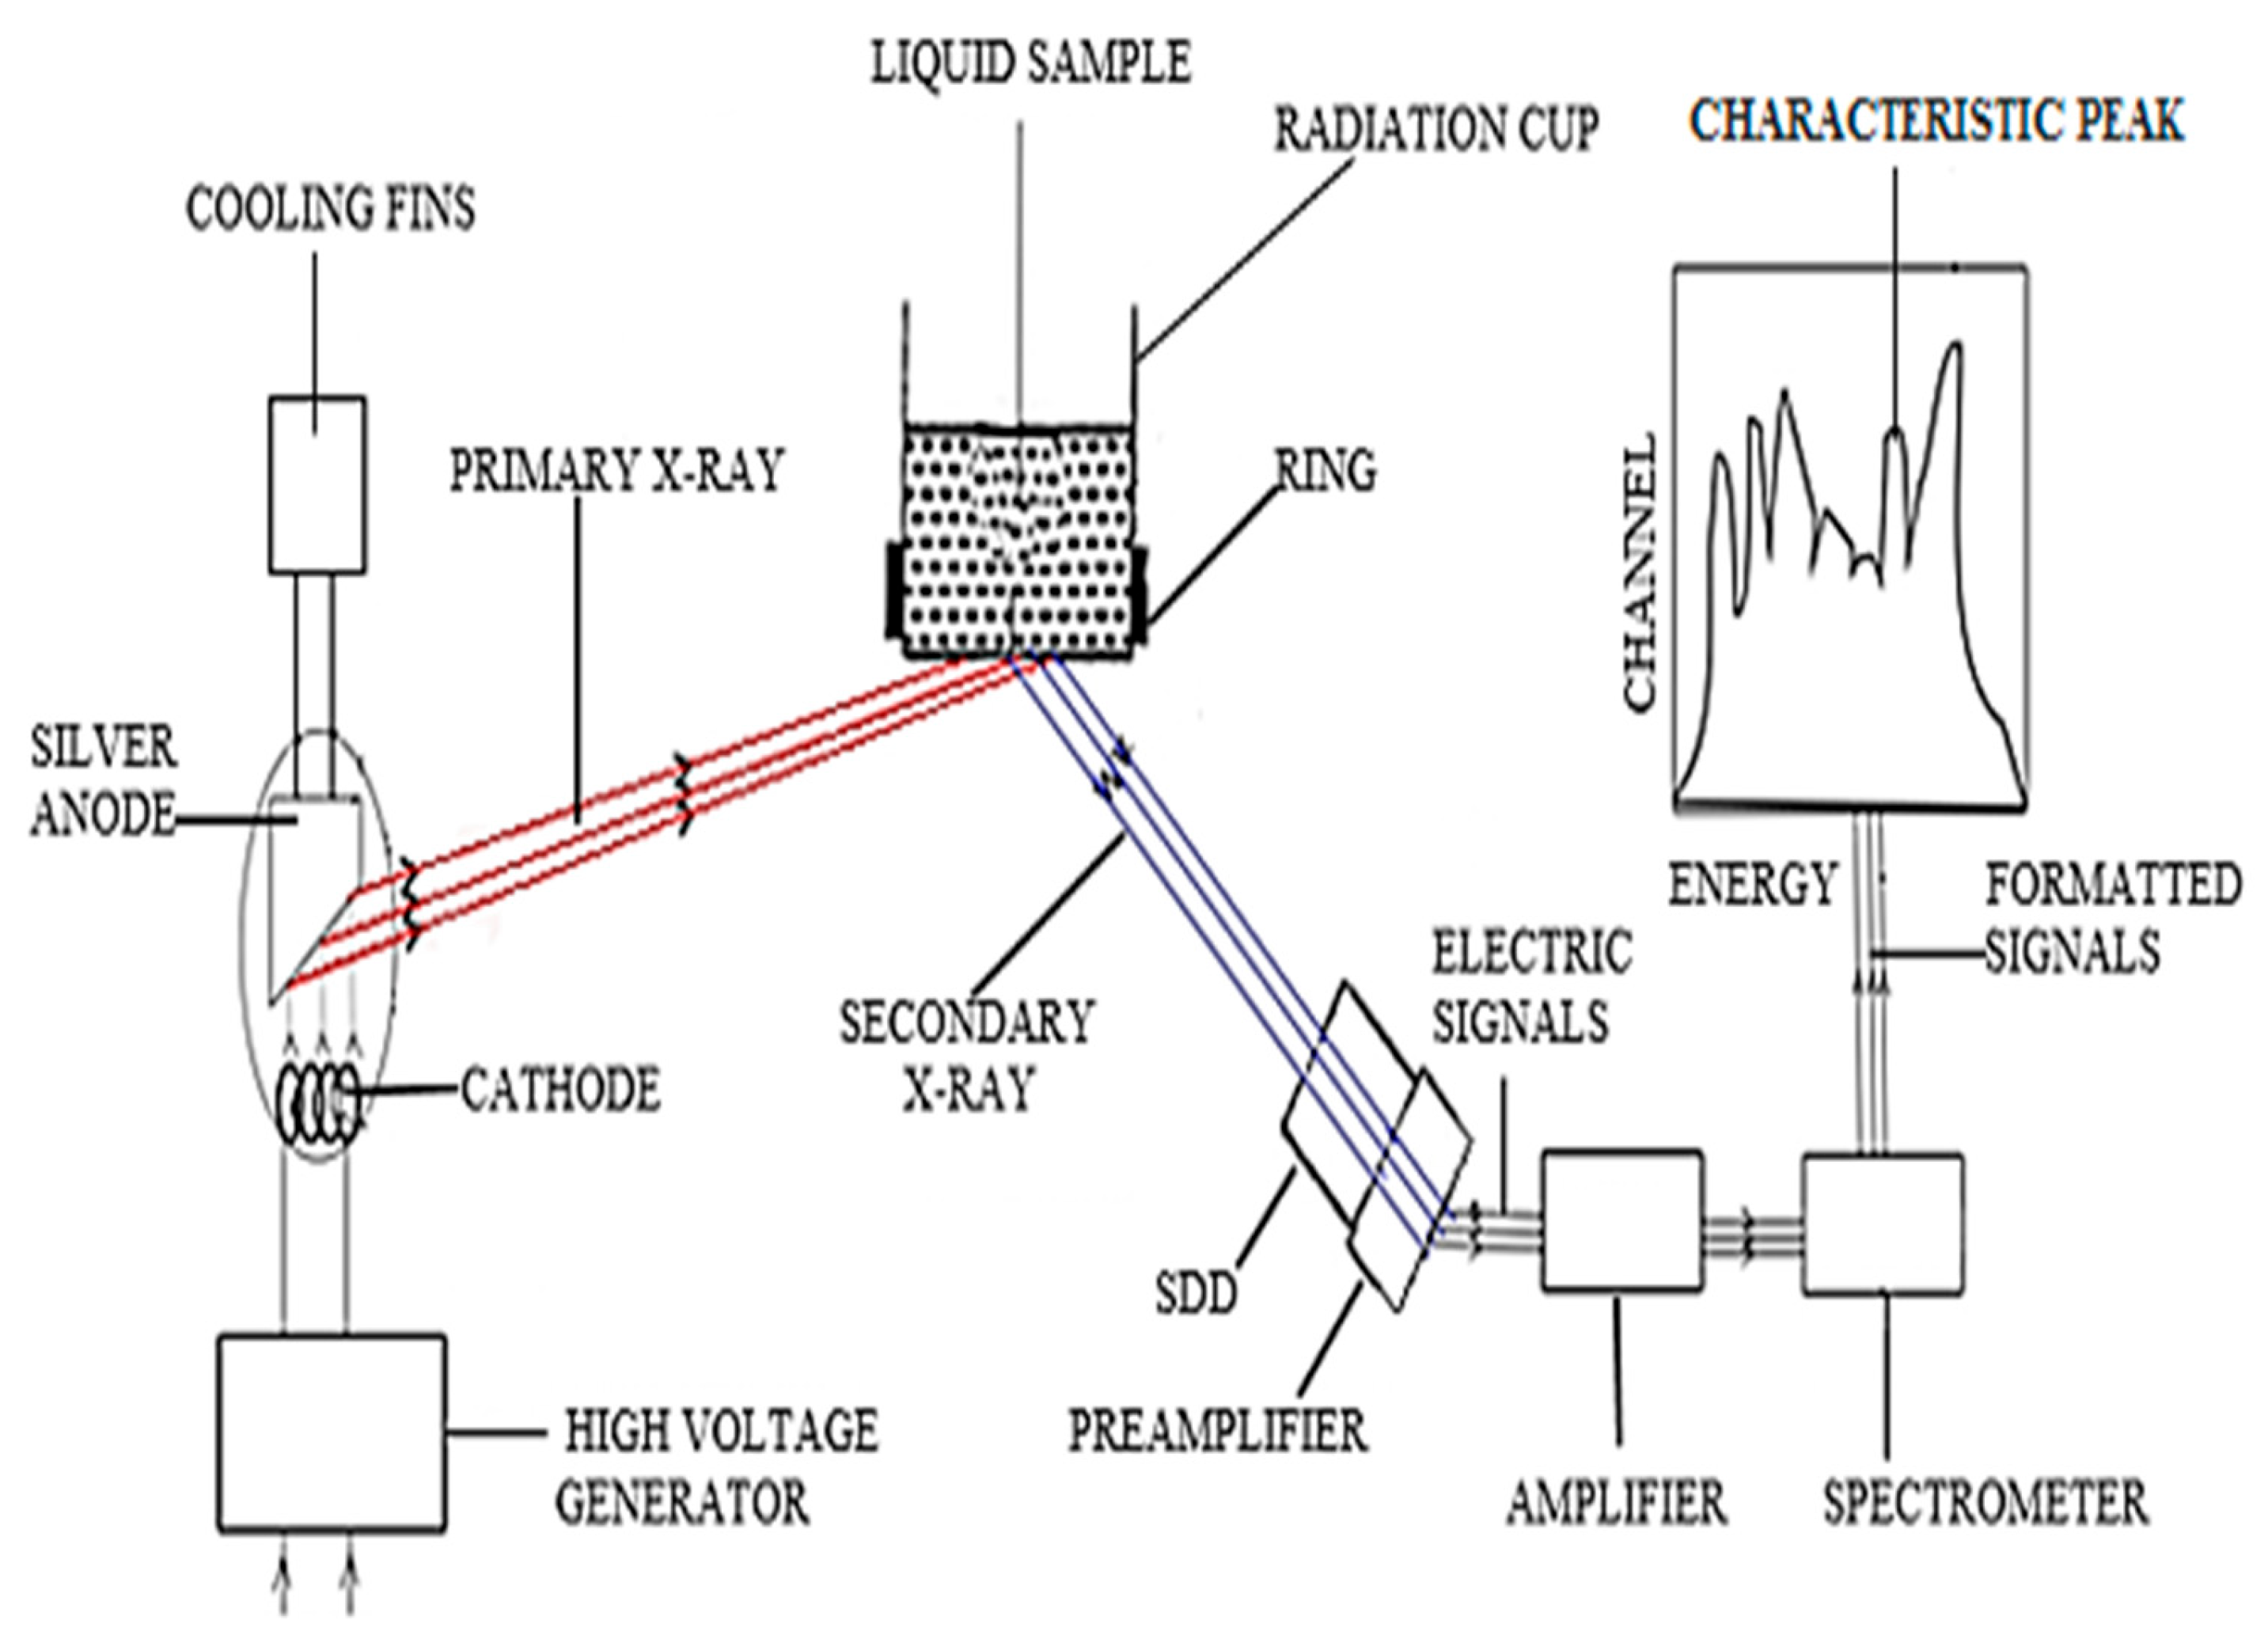
Below is Figure 1, a diagram representing the system of energy-dispersive X-ray fluorescence device. The red-coloured rays from the silver anode to the liquid sample indicate primary X-rays. The blue-coloured rays from the liquid sample to the silicon drift detector, SDD, detector is the fluorescence sample (secondary X-rays) emitted by the atoms of the liquid. The corresponding electric pulses from the emitted fluorescence are transformed to characteristic energy peaks of the atoms. The intensity of each peak is computed and hence converted to elemental concentration in parts per million, ppm.

2. Methodology

2.1. Sample Acquisition

The twenty-eight petroleum fuel samples were acquired from the three major oil-marketing companies (GOIL Company Limited, Shell Ghana Limited and Total Ghana Limited) that mostly distribute and sell petroleum fuel products. Four samples each of a petroleum fuel product were acquired from seven different fuel service stations per two-week interval. The study considered fuel service stations that are geographically located within the southern and middle belt of Ghana, where it is densely populated. The fuel service stations are Adenta Medina GOIL, Tema Community-9 GOIL, Kumasi-Tafo Total Energies, Takoradi Total Energies, Cape Coast Total Energies, Kumasi-Amakom Shell and Techiman Shell Service Station. The Ghana Post Service digital addresses for the locations of the fuel service stations are GA-411-1811, GT-190-6374, AS-U112-6021, WK-593-7536, CC-075-5849, AK-041-2299 and TT-0014-2620, respectively. The samples are diesel xp (DXP), petrol xp (PXP), kerosene excellium (KE), petrol excellium (PE), diesel excellium (DE), v-power (VP) and diesel fuelsave (DFS), respectively. However, Figure 1, Figure 2, Figure 3 are attached to the acronym to represent the corresponding week in which the samples were acquired. The samples acquired per week were kept at the XRF laboratory of NNRI, GAEC.

2.2. Fluorescence Measurement

The EDXRF facility used for fluorescence measurement consists of an X-ray tube with a silver anode of 0.75 µm (AMPTEK Mini-X, USA), a spectrometer (AMPTEK Mini-X-123, USA) and a fluorescence detector (AMPTEK X-123SDD). Beakers, pipettes, radiation cups and rings, were cleaned thoroughly, rinsed with distilled water and dried. Mylar films were fixed tightly to six (6) radiation cups using its rings. A refined petroleum sample (DE-1) from Sunyani Total Energies Service Station of the first week was chosen and a micropipette was carefully used for the transfer of measured crude petroleum sample (2.0 mL each) from a beaker labelled DXP-1into three radiation cups labelled DE-1*A, DE-1*B and DE-1*C. After the characteristic energy calibration settings, by defining the centroids of Fe (6.40 keV) and Mo (17.44 keV), the fluorescence device was set at 45.0 KV at 5.0 µA. The radiation cup DE-1*A was gently placed in the radiation cage for fluorescence measurement for 180.0 s. The fluorescence spectral peaks were saved as DE_1*A*R. The procedure was repeated for radiation cups labelled DE-1*B, DE-1*C, and for the remaining samples.

2.3. Fluorescence Spectral Analysis

The spectra acquired from the samples were processed and analysed using the bAxil software, version 1.1. The qualitative analyses of the elements in all refined petroleum samples were done using the bAxil Fundamental Parameter (bAxil FP) for the standard-less method. However, the quantitative results were purely derived from the “unknown” spectrum analysis. In this situation, the calculations were from all the physical constants and parameters specified in the sample or spectrum model. The standardless fundamental parameter calculations were completed by defining and normalising all elemental concentrations to parts per million (ppm).

2.4. Results and Discussion

The elemental concentrations based on the analyses of fluorescence data acquired from every four samples of the seven refined fuels are shown in Table 1, Table 2, Table 3, Table 4, Table 5, Table 6 and Table 7. Elements with concentrations below the detection limit of the fluorescence measurement technique are indicated as BL. From the seven tables, thirty-one elements were identified from each sample of the refined fuel. The elements are classified into non-metal, alkali metal, alkaline earth, transition metal, base metal and semimetal with an average concentration estimated in parts per million. Table 1, Table 2 and Table 3 show the fluorescence results of fuel samples obtained from the service stations of Total Energies Ghana Limited, DE (diesel excellium), PE (petrol excellium) and KE (kerosene excellium), respectively. Table 4 and Table 5 present the fluorescence results of fuel samples acquired from the service stations of GOIL Company Limited, DXP (diesel xp) and PXP (petrol xp), respectively. Lastly, Table 6 and Table 7 present the fluorescence result of fuel samples acquired from the service stations of Shell Vivo Ghana Limited, VP (v-power petrol) and DFS (diesel fuelsave).
Among the thirty-one elements quantified in the twenty-eight fuel samples, In recorded relatively higher concentrations in each compared to the rest. From the seven tables, P, S, Cl, K, Cr, Fe and In recorded relatively higher concentrations in the samples from kerosene and diesel products, with S in higher concentrations in DE and DXP samples only. Similarly, in petrol products, the concentration of P, Cr and contaminants are relatively higher in fuel samples PE and PXP.
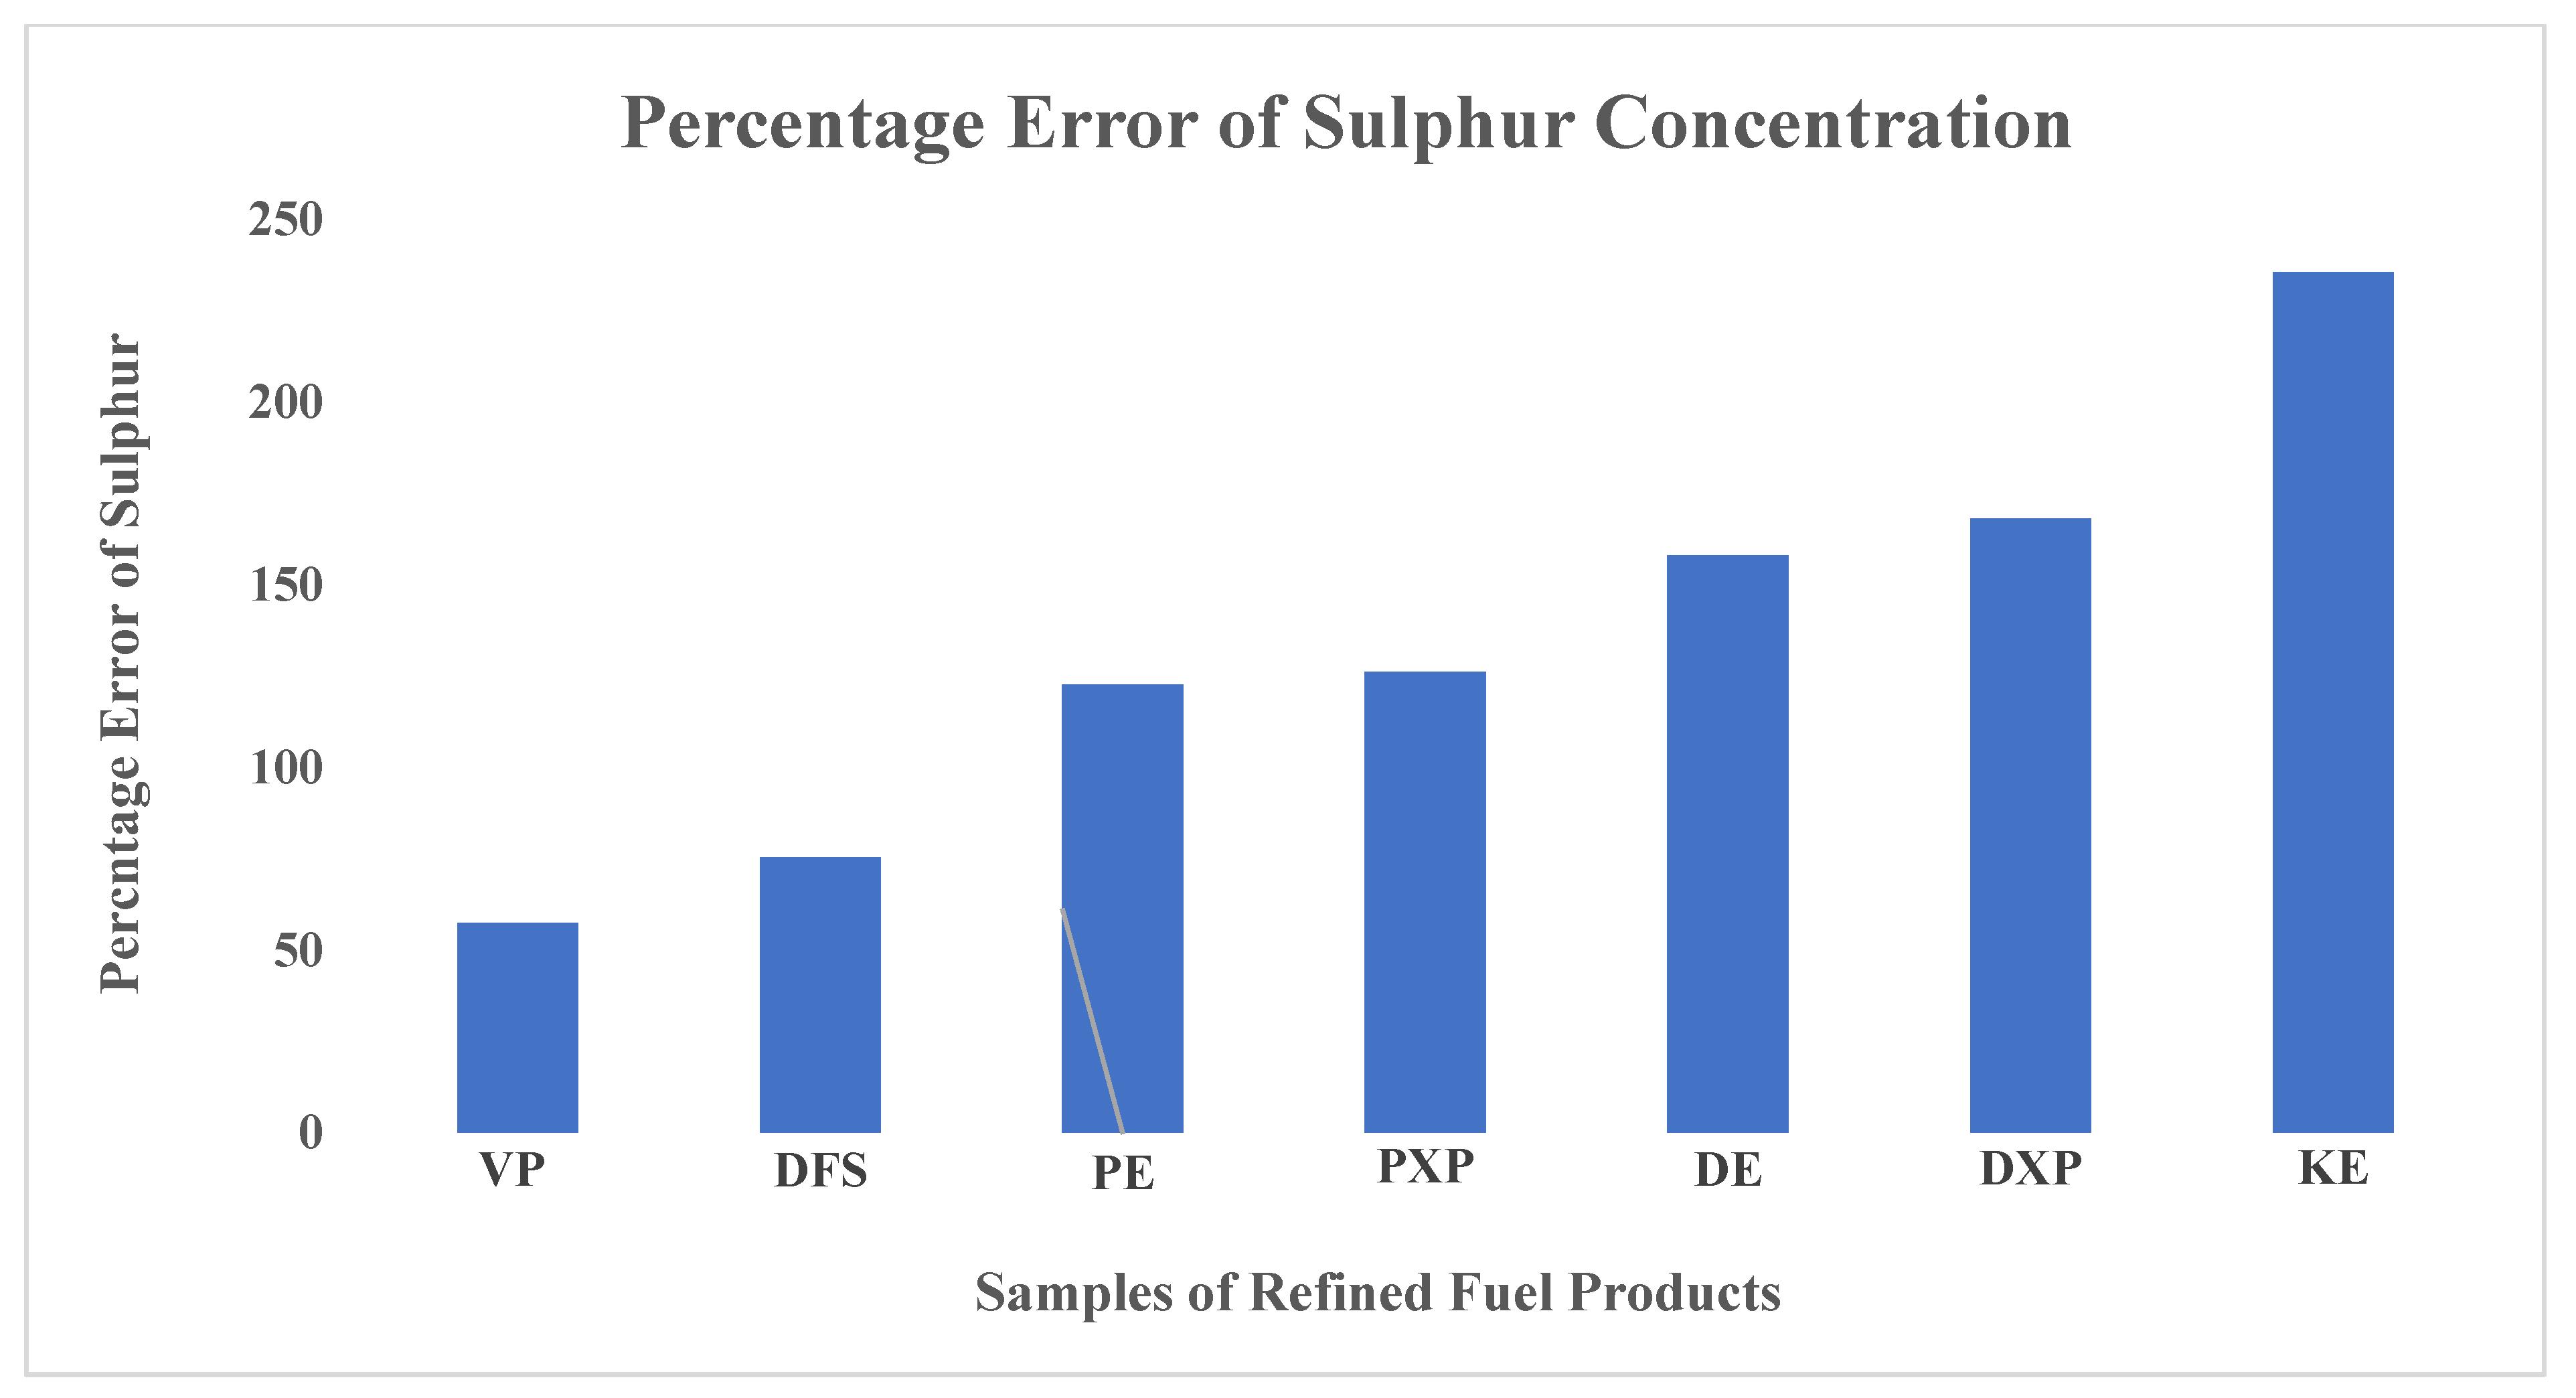
From the seven tables, the elemental concentrations of the non-metals identified were relatively lower compared to the metals. The concentrations of the element S in each fuel sample are between 20.0–50.0 ppm, which is slightly above the ultra-low level of 10.0 ppm per the standards of the Environment Protection Agency of the United States for fuels for on-road engines. On average, fuel sample KE recorded the highest sulphur concentration and sample VP the least. From Table 3, the sulphur concentration in fuel sample KE is relatively higher compared to the rest. This is because kerosene fuel products usually have sulphur content much higher than petrol and diesel products. The study confirmed that sulphur concentration in on-road diesel fuels is usually more than in petrol fuels. From the results it is revealed that the concentration of sulphur in fuel sample DE (diesel) is approximately 1.16 times greater than sulphur in sample PE (petrol) even though both are imported by the same oil-marketing company, Total Energies Ghana Limited. Also, a similar effect happened between the fuel samples DXP (diesel) and PXP (petrol). However, there is a strong correlation between sulphur concentration in fuel sample PXP and PE, even though both are petrol products from different oil-marketing companies. Similarly, the sulphur concentration in sample DXP is approximately 1.02 times greater than that of sample DE. These slight anomalies may be because the major oil-marketing companies of Ghana import refined petroleum fuels from different Asian and European countries. Hence, on-road fuels for engines are acquired from any available source per the prevailing market conditions. Considering 10.0 ppm as the internationally accepted standard concentration of sulphur in on-road refined fuels, the estimated percentage error for the fuel samples—VP, DFS, PE, PXP, DE, DXP and KE—are 57.5, 75.4, 122.6, 126.2, 158.1, 168.1 and 235.5%, respectively, in ascending order. Figure 2 is a bar graph showing the magnitude of the percentage error of sulphur concentration estimated for each sample.
Bromine is a naturally toxic halogen gas. The presence of mine elements in the crude sample may also be attributed to the chemical nature of the sedimentary rocks from which the crudes for the refined fuels were acquired. The comparison from the six tables reveals that, on average, the highest bromine concentration occurred in sample VP (v-power petrol), while sample PXP (petrol XP) recorded the least. The average concentrations of bromine in fuel samples PE (petrol excellium) and DE (diesel excellium) of Total Energies Ghana Limited are comparable. This suggests that the crude oils for fuel oil samples PE and DE were processed with similar refinery technology. Organic bromine contaminants in live tissues and cells cause malfunction of the nervous system and thyroid glands (WHO, 2009). Even though the concentration of bromine by the fluorescence measurement is in ultra-trace, however, when released into the atmosphere, gradual accumulation in the long term may produce dangerous effects.
The research also came up with four toxic metal elements namely mercury, lead, chromium and Manganese [21]. The presence of these toxic metal elements may be attributed to the intrinsic chemical nature of the crude oils and the type of refinery technology during processing [7,22]. The presence of lead may also be from the introduction of tetraethyl lead, Pb(C2H5)4 compound to the refined fuels by the manufacturers as an octane rating booster or antiknock agent [7,22,23]. In the modern day, the octane rating of refined fuels is improved by the addition of methanol, ethanol, methyl tertiary butyl ether, ethyl tertiary butyl ether, etc. The results from the seven tables reveal that the average concentrations of the four identified toxic metals in each seven refined fuel products are non-uniform [13,17,23]. This is because the three major oil-marketing companies in Ghana, import their fuel products from different sources and hence resulting in dissimilar concentrations. Mercury and lead are acute toxic metal elements and therefore their presence in the refined fuel samples will result in toxicity in the environment [18]. The gradual long-period exposure of these toxic metals to animals and humans may cause the bio-amplification of toxic materials. Even though per the standards of the Environmental Protection Agency of the United States, the concentration levels of Hg, Pb and Mn are below ultra-low (10.0 ppm), however, the concentration of chromium is above the ultra-low. Therefore, among the heavy metal elements quantified, there is a relatively higher level of chromium emission from the exhausts of vehicles in Ghana. The sample DE recorded the highest chromium emission and DXP the least.
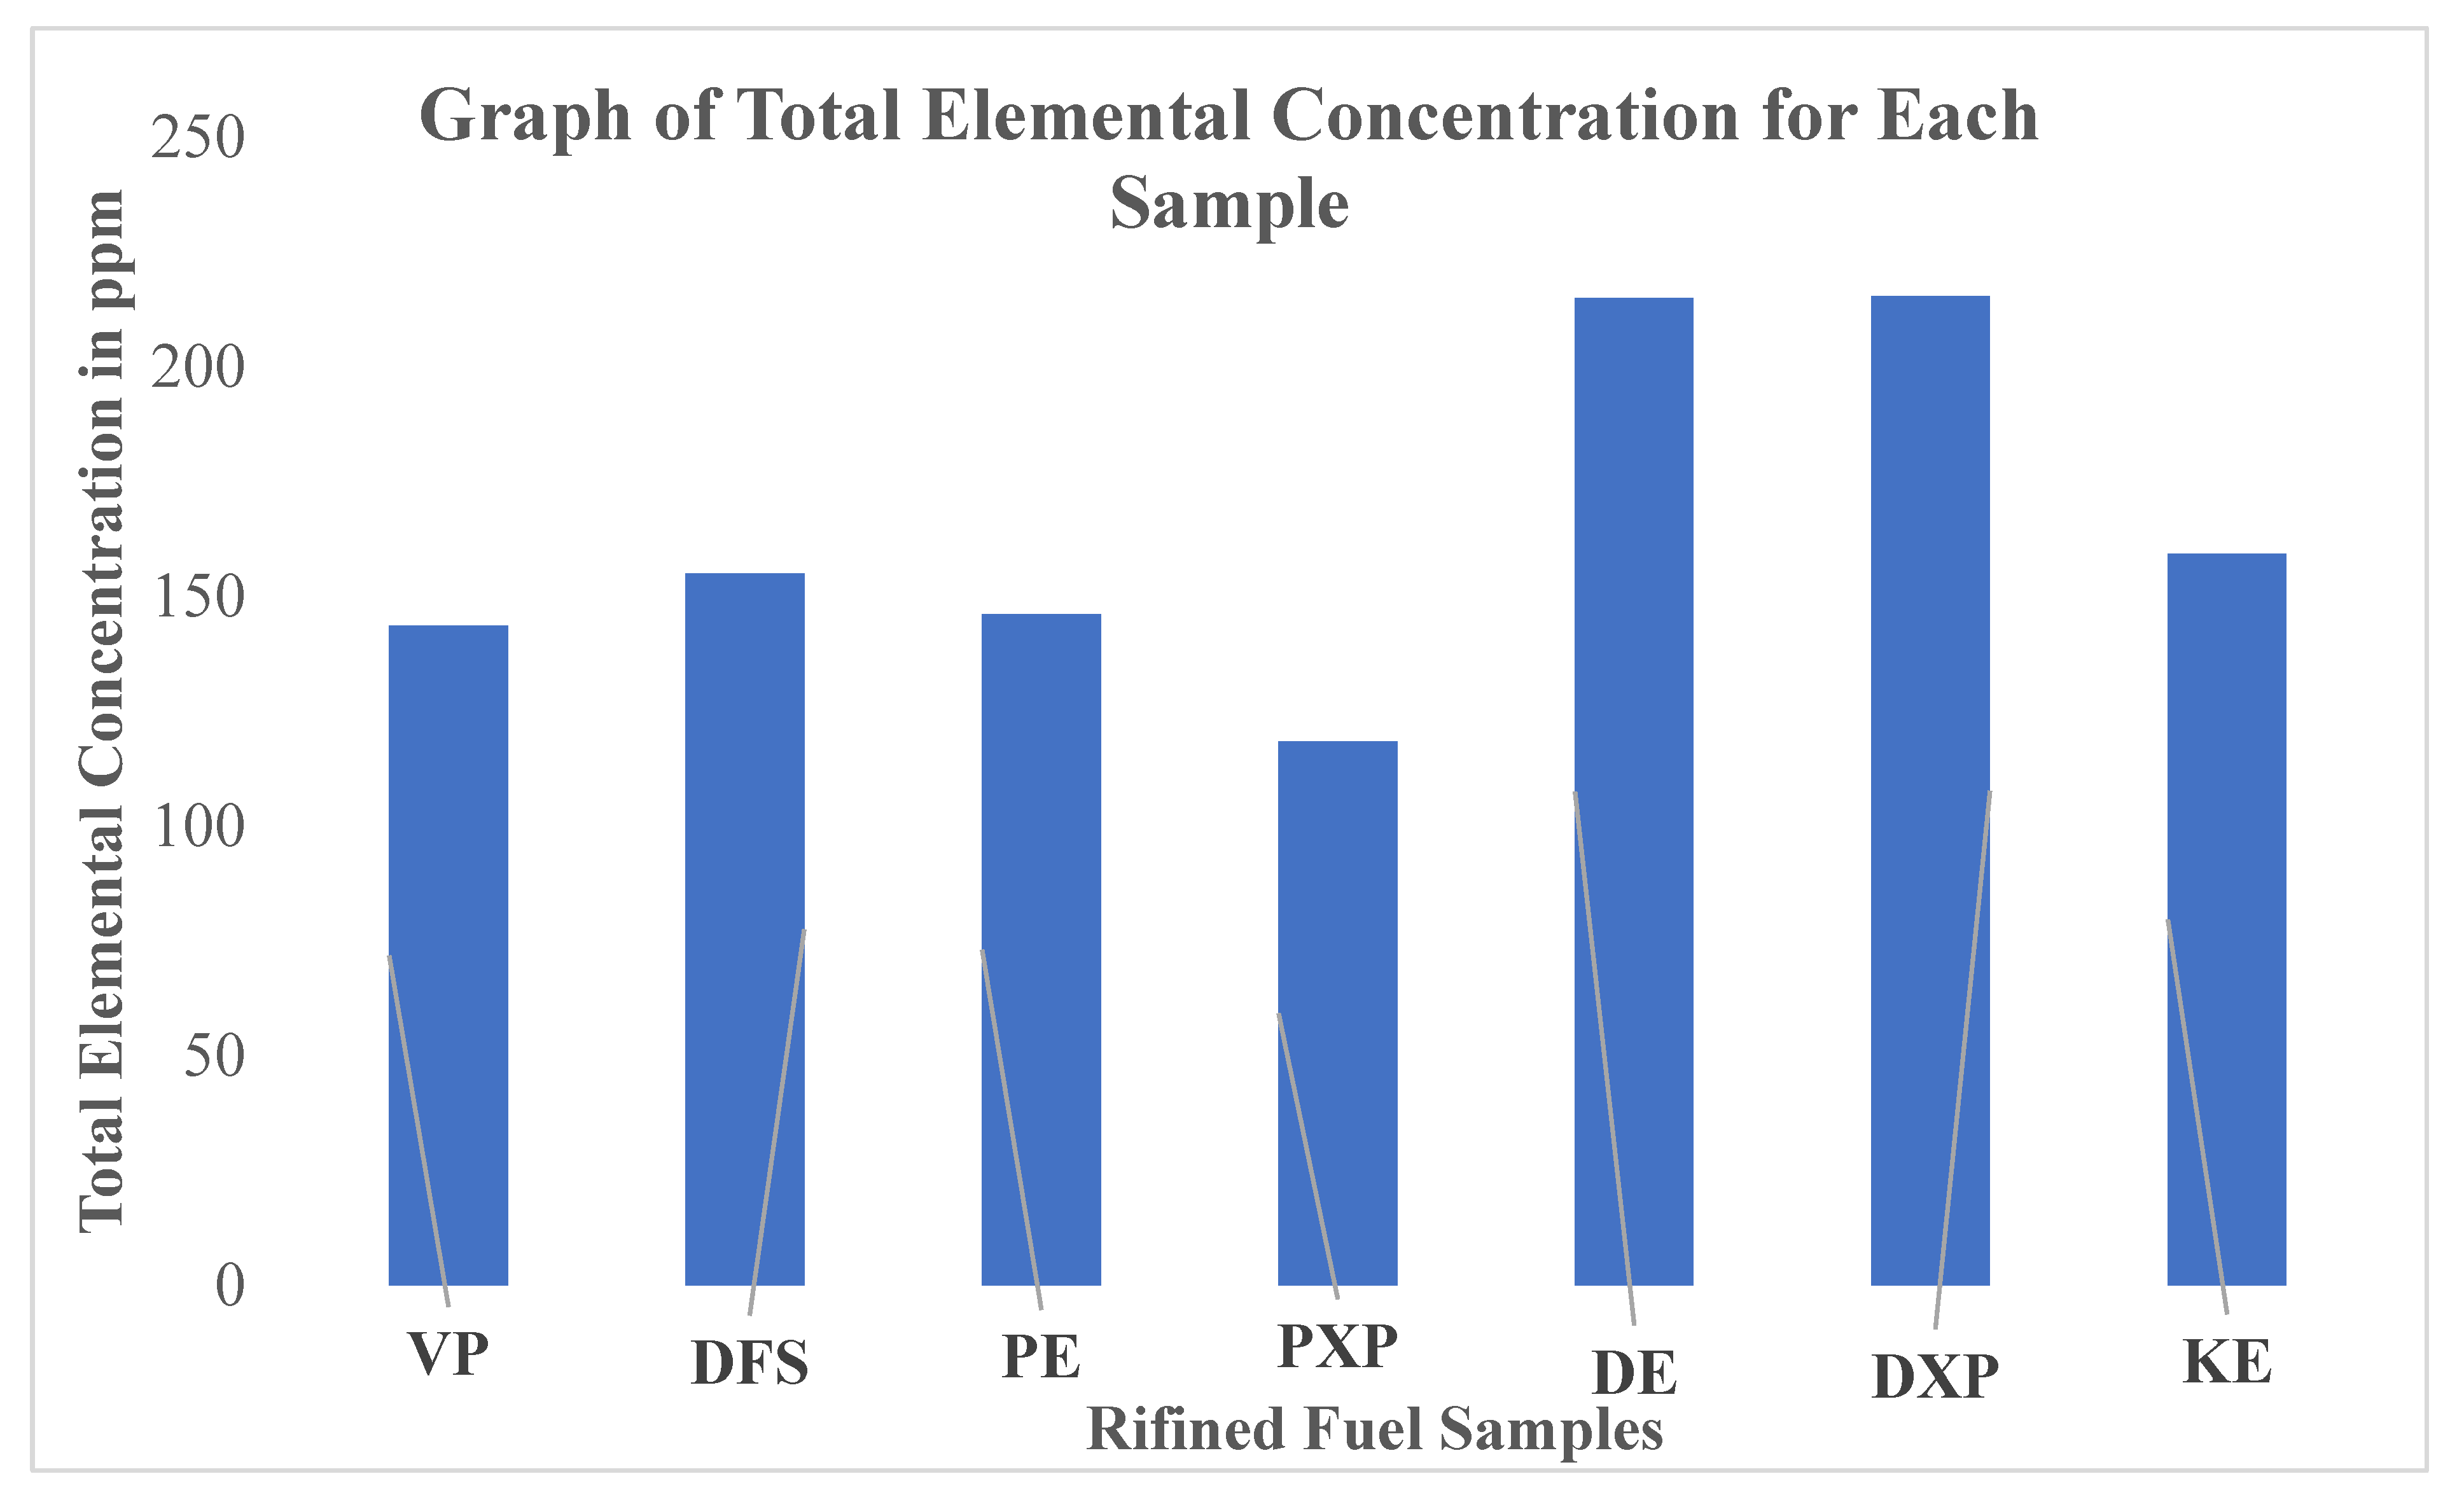
Studies in petrology have proven that metal compounds of alkali, alkaline earth, semimetal, transition and base metal in refined petroleum fuels are ash-producing agents [19]. Salted compounds of these metals in refined fuels produce undesired results in the combustion chamber by causing a high-temperature corrosion effect on burner tips and refractories. The higher the ash-forming constituents, the greater the fouling deposits in the combustion equipment and vice versa. Based on the results for the diesel samples, DFS recorded an approximate total average elemental concentration of 155.0 ppm while DE and DXP recorded 215.0 and 215.3 ppm, respectively. It is seen that the total average concentrations for samples DXP and DE are most comparable, however, the individual elemental concentrations are not the same. Among the petrol products, samples PXP, VP and PE recorded approximate total average concentration values of 118.5, 143.6 and 146.1 ppm, respectively. Hence, the fuel sample PE recorded the highest elemental concentration among the petrol products consumed in Ghana. However, the fuel sample KE of kerosene product recorded an approximate significant value of 159.3 ppm, which represents lesser impurity content compared to diesel samples. Figure 3 is the bar graph showing the impurity levels based on the total elemental concentrations present in the refined fuel samples.
The average specific gravity of each fuel sample was also determined at the Physics laboratory of NNRI. The specific gravity of the samples, DE, PE, KE, DXP, PXP, VP and DFS are 0.892, 0.704, 0.797, 0.881, 0.692, 0.697 and 0.894, respectively at 15.0 °C. Based on the values of specific gravities of the diesel samples, it indicates that DE, DXP and DFS are of grade 2D since diesel fuel of grade 2D has a specific gravity between 0.81–0.96. Grade 2D diesel fuels are recommended for relatively warmer weather conditions and tropical regions. This means the oil-marketing companies of Ghana import diesel fuels that are conducive to the environmental conditions of the country. There are variations among the values of specific gravity of diesel and petrol samples as shown. These anomalies may be due to the variations among both elemental concentrations and organic molecular weight in each sample.
3. Conclusions

The X-ray fluorescence measurements were conducted on four samples of each of the seven refined fuel products, acquired from seven different service stations of the three major oil-marketing companies in Ghana, at the National Nuclear Research Institute. In total, thirty-one elements were identified and quantified in each sample. The fluorescence concentrations of most elements were below ultra-low level, which indicates that the fuel samples used in Ghana meet the internationally accepted standard. However, a few elements such as In, Fe, K, P, S, Cl and Cr recorded concentrations above ultra-low levels in some samples. The average sulphur concentrations in all the fuel products were relatively above ultra-low levels (>10.0 ppm). This implies that the fuel products consumed in Ghana are relatively higher in sulphur concentration and hence exhaust emissions from vehicles have a greater impact on ozone layer depletion. The study came up with the average sulphur concentrations in diesel products to be 2.5 times greater than petrol products, which affirms that usually, petrol products have lower sulphur content than diesel. However, among the samples of petrol products, the sulphur concentration in PXP is 1.016 times greater than that of PE, which is comparable. This slight anomaly may be attributed to the fact that importations of these refined fuel products into Ghana are from the same refinery sources. It may also be attributed to the chemical nature of crude oil from which the products were acquired.
The average bromine concentrations in the fuel samples were far below the recommended ultra-low level of the Environmental Protection Agency of the United States. It was observed that the average bromine concentration in sample PE and DE of Total Energies Ghana Limited was most comparable. The presence of bromine impurity in the samples was attributed to the intrinsic chemical nature of the crude oils from which the samples were acquired. The research identified heavy metals, namely Hg, Pb, Cr and Mn, in the samples. The presence of lead metal in the sample may also be due to the chemical nature of the crude oils from which the fuel products were acquired or the addition of Pb(C2H5)4 as an octane rating improver. The average concentrations of these heavy metal contaminants were ultra-low, except Cr in sample PE, which recorded the highest. Analysis of the fluorescence results of the study concluded that diesel products recorded the highest concentration of elemental contaminant compared to petrol and kerosene. From the twenty-eight fuel samples analysed from seven fuel products, the average total concentration of elemental contaminants of each product is much above the ultra-low level (>10.0 ppm). This means that the ash-producing contaminants in the fuel samples are relatively much higher and hence may cause higher maintenance costs. However, the sulphur and heavy metal contents in each sample of the refined fuel products were between 10.0 and 50.0 ppm. This indicates that fuel oil products imported by the three major oil-marketing companies (GOIL, Total Energies and Shell Vivo) are relatively good but not environmentally friendly. It is observed from the tables that, for a given element of the same kind, the measured fluorescence concentration among samples of the same product is not the same, with a relatively slight disparity among them. Based on this, it can be concluded that the fuel samples that were acquired for the study from the seven different service stations of GOIL Company Limited, Total Energies Ghana Limited and Shell Vivo Ghana Limited were not adulterated.

Author Contributions

The two authors of this manuscript, R.W. and C.K.G., fully participated in the study concept, research design, sample collection, preparation, fluorescent measurement and data analysis. All authors have read and agreed to the published version of the manuscript.

Funding

The authors of this research paper solemnly declare that no funds, grants or support were received during the preparation of this manuscript.

Acknowledgments

Our profound appreciation also goes to all staff of the National Nuclear Research Institute, Ghana Atomic Energy Commission, especially, Owiredu Gyampo and Francis Ofosu for their technical assistance. We express our gratitude to Samuel Boateng of General Transport Petroleum, Tema Oil Refinery and Lukeman Dauda of Kumasi-Tafo Service Station, GOIL Company Limited, for permitting us to acquire refined fuel products used for this study.

Conflicts of Interest

The authors declare no conflicts of interest.

References

  1. Lepoutre, E.; Roman, P.; Georges, S.T. Used Car Market and Heterogeneous Environmental Standards, from Developed to Developing Countries. Ph.D. Thesis, Université catholique de Louvain, Ottignies-Louvain-la-Neuve, Belgium, 2020. Available online: http://hdl.handle.net/2078.1/thesis:27156 (accessed on 5 January 2025).
  2. Lešnik, L.; Kegl, B.; Torres-Jiménez, E.; Cruz-Peragón, F. Why we should invest further in the development of internal combustion engines for road applications. Oil Gas Sci. Technol. Rev. D’ifp Energ. Nouv. 2020, 75, 56. [Google Scholar] [CrossRef]
  3. Di Girolamo, M.; Brianti, M.; Marchionna, M. Octane enhancers. In Handbook of Fuels: Energy Sources for Transportation; Wiley Online Library: Hoboken, NJ, USA, 2021; pp. 403–430. [Google Scholar]
  4. Saleh, T.A. Characterization, determination and elimination technologies for sulfur from petroleum: Toward cleaner fuel and a safe environment. Trends Environ. Anal. Chem. 2020, 25, e00080. [Google Scholar] [CrossRef]
  5. Winid, B. Bromine and water quality–Selected aspects and future perspectives. Appl. Geochem. 2015, 63, 413–435. [Google Scholar] [CrossRef]
  6. Mittal, D.; Singh, D.; Kumar Sharma, S. Thermal characteristics and tribological performances of solid lubricants: A mini review. In Advances in Rheology of Materials; IntechOpen: London, UK, 2023. [Google Scholar]
  7. Almahasheer, H. High levels of heavy metals in Western Arabian Gulf mangrove soils. Mol. Biol. Rep. 2019, 46, 1585–1592. [Google Scholar] [CrossRef] [PubMed]
  8. Robinson, P.R.; Hsu, C.S. Introduction to petroleum technology. In Springer Handbook of Petroleum Technology; Springer: Berlin/Heidelberg, Germany, 2017; pp. 1–83. [Google Scholar]
  9. Akpoveta, O.V.; Osakwe, S.A. Determination of Heavy Metal Contents in Refined Petroleum Products. IOSR J. Appl. Chem. 2014, 7, 1–2. [Google Scholar] [CrossRef]
  10. Simbi, I. Influence of Metal Contents on the Characteristics of Biodiesel and Petrol Blends as Transportation Fuel; Cape Peninsula University of Technology: Cape Town, South Africa, 2021. [Google Scholar]
  11. Lafuerza, S.; Carlantuono, A.; Retegan, M.; Glatzel, P. Chemical sensitivity of Kβ and Kα X-ray emission from a systematic investigation of iron compounds. Inorg. Chem. 2020, 59, 12518–12535. [Google Scholar] [CrossRef] [PubMed]
  12. Gafrey, C.K.; Wilson, R.; Amoako, G.; Anderson, B. Laser-induced fluorescence with Multivariate Analysis in Characterizing Crude Oils from Some Selected Oil Fields in Ghana. Phys. Sci. Int. J. 2021, 25, 8–20. [Google Scholar] [CrossRef]
  13. Robert, T. Environmental health and democracy. The example of lead in gasoline through a case study (1921–1970). HAL Open Sci. 2023. [Google Scholar]
  14. Palaniandy, P.; Suffian, Y.M.; Wang, L.K.; Wang, M.-H.S. Electronic and Electrical Equipment Waste Disposal. In Solid Waste Engineering and Management; Springer: Berlin/Heidelberg, Germany, 2022; Volume 3, pp. 115–161. [Google Scholar]
  15. Shotonwa, I.; Giwa-Ajeniya, A.O.; Mekuleyi, G.O. The physical and chemical components of Nigerian crude oil. In The Political Ecology of Oil and Gas Activities in the Nigerian Aquatic Ecosystem; Elsevier: Amsterdam, The Netherlands, 2018; pp. 33–46. [Google Scholar]
  16. Yao, M.; Wang, D.; Zhao, M. Element analysis based on energy-dispersive X-ray fluorescence. Adv. Mater. Sci. Eng. 2015, 2015, 290593. [Google Scholar] [CrossRef]
  17. Hussain, A.; Hasan, A.; Javid, A.; Qazi, J.I. Exploited application of sulfate-reducing bacteria for concomitant treatment of metallic and non-metallic wastes: A mini-review. 3 Biotech 2016, 6, 119. [Google Scholar] [CrossRef] [PubMed]
  18. Lawal, K.K.; Ekeleme, I.K.; Onuigbo, C.M.; Ikpeazu, V.O. A review on the public health implications of heavy metals. World J. Adv. Res. Rev. 2021, 10, 255–265. [Google Scholar] [CrossRef]
  19. Xie, Y.; Posada, F.; Minjares, R. Diesel Sulphur Content Imparts on Euro VI Soot-Free Vehicles: Considerations for Emerging Markets; International Council for Clean Transportation: Washington, DC, USA, 2020. [Google Scholar]
  20. Wilson, R.; Gafrey, C.K.; Amoako, G.; Anderson, B. Metallic Composition Analysis of Crude Petroleum Some Oil Fields in Ghana. Phys. Sci. Int. J. 2021, 25, 19–29. [Google Scholar] [CrossRef]
  21. Bortnikov, N.S.; Volkov, A.V.; Galyamov, A.L.; Vikent’eV, I.V.; Aristov, V.V.; Lalomov, A.V.; Murashov, K.Y. Mineral resources of high-tech metals in Russia: State of the art and outlook. Geol. Ore Depos. 2016, 58, 83–103. [Google Scholar] [CrossRef]
  22. Briffa, J.; Sinagra, E.; Blundell, R. Heavy metal pollution in the environment and their toxicological effects on humans. Heliyon 2020, 6, e04691. [Google Scholar] [CrossRef] [PubMed]
  23. Bai, P.; Etim, U.J.; Yan, Z.; Mintova, S.; Zhang, Z.; Zhong, Z.; Gao, X. Fluid catalytic cracking technology: Current status and recent discoveries on catalyst contamination. Catal. Rev. 2018, 61, 333–405. [Google Scholar] [CrossRef]
Figure 1. Diagrammatic representation of EDXRF system [7].
Fuels 06 00062 g001
Figure 2. Refined fuel samples and their percentage error of sulphur concentrations.
Fuels 06 00062 g002
Figure 3. Refined fuel samples and their total elemental concentrations.
Fuels 06 00062 g003
Table 1. Elemental Concentrations of the Samples of DE.
Elemental Concentrations of the Samples in ppm
ElementsSymbolDE-1DE-2DE-3DE-4Average
Non-MetalP37.10027.71024.06020.40027.318
S22.59028.52026.61025.50025.805
Cl27.50015.90015.50017.30019.050
Br0.52880.56740.51850.54360.5396
Se0.05010.07250.10100.13400.0894
Alkali MetalK17.52015.20012.10016.10015.230
Rb0.26800.08280.14800.31900.2045
Cs0.76810.76210.77200.70100.7508
Alkaline EarthCa0.89302.17001.10002.10001.5658
Sr0.05230.06290.08300.09070.0722
Ba0.42400.51100.35600.44200.4333
Transition MetalSc1.71000.59300.68100.64100.9063
Ti0.15400.17200.10400.20400.1585
V0.09760.28300.24800.38700.2539
Cr15.50011.30011.00019.70014.375
Mn3.11002.68005.55004.09003.8575
Fe11.40019.90019.70014.20016.300
Co0.13700.17300.18900.18030.1698
Ni5.18005.89005.89008.15006.2775
Cu0.97100.71200.52401.30000.8768
Zn1.78001.70001.89002.99002.0900
Y0.04230.06810.08130.03470.0566
Zr0.03110.09980.05590.05100.0595
Nb0.03850.09230.10900.09370.0834
Mo0.02540.03370.07720.06270.0498
Pd2.83006.67006.49005.86005.4625
Ta0.64201.13001.39001.25001.1030
Ir0.14200.20500.04700.23700.1578
Hg0.60000.15800.17701.43000.5913
Base MetalPb0.17400.18400.17100.30800.2093
Semi-MetalGe0.30900.49000.62300.45200.4685
In62.300106.00114.0081.50090.950
Table 2. Elemental Concentrations of the Samples of PE.
Elemental Concentrations of the Samples in ppm
ElementsSymbolPE-1PE-2PE-3PE-4Average
Non-metalP11.70015.80015.04015.10014.410
S22.36423.58721.89021.19022.258
Cl7.29005.71006.53009.65007.2950
Br0.53010.52250.54210.55300.5369
Se0.03370.02170.07120.11700.0609
Alkali MetalK4.40003.44004.17007.04004.7625
Rb0.16700.12220.21000.11200.1528
Cs0.44200.40800.53400.41400.4495
Alkaline EarthCa1.16001.43203.36001.65001.9005
Sr0.01240.04010.03590.04030.0322
Ba0.09490.24900.44100.45900.3110
Transition MetalSc1.18000.86100.11800.28500.6110
V0.44500.34400.54600.22500.3900
Cr18.40017.90030.50021.80022.150
Mn4.04005.07005.68006.01005.2000
Fe13.10012.70023.20016.00016.250
Co1.62001.21003.19001.86001.9700
Ni5.59005.32009.50006.76006.7925
Cu2.86001.52004.20001.98002.6400
Zn0.69000.90701.24001.18001.0043
Y0.06910.05470.10200.05030.0690
Zr0.02750.01470.05930.03260.0335
Nb0.04370.04460.07660.06720.0580
Mo0.01400.01880.04680.03030.0275
Pd3.55002.52003.75003.34003.2900
Ta0.25900.35200.13900.60700.3393
Ir0.37800.14500.33500.24300.2753
Hg0.15300.35100.49300.36600.3408
Base MetalPb0.20500.12200.10500.14900.1453
Semi-MetalGe0.13300.22500.28700.23000.2188
In46.00044.80072.70047.00052.625
Table 3. Elemental Concentrations of the Samples of KE.
Elemental Concentrations of the Samples in ppm
ElementsSymbolKE-1KE-2KE-3KE-4Average
Non-MetalP21.10015.50018.40020.50018.875
S32.30032.50034.80033.40033.250
Cl1.70901.92001.28101.72001.6575
Br0.56100.55970.51660.56260.5500
Se0.10400.05300.04480.05500.0642
Alkali MetalK3.96004.130012.20010.3407.6575
Rb0.20500.13000.06910.14400.1370
Cs0.14400.58600.89900.60400.5583
Alkaline EarthCa2.07001.48002.82002.21002.1450
Sr0.19010.14100.18900.18500.1763
Ba0.68100.54550.96900.84700.7606
Transition MetalSc1.41101.41001.48001.62001.4803
V0.18540.19900.18000.17700.1854
Cr20.40014.00013.50018.84016.685
Mn9.51002.42002.21006.61005.1875
Fe15.80010.40022.90018.22016.830
Co1.35001.28000.93100.74501.0765
Ni6.92004.47005.64005.12005.5375
Cu1.46001.50002.31001.57001.7100
Zn1.55001.04001.03001.25001.2175
Y0.08340.03190.04230.06270.0551
Zr0.02400.03060.04450.03370.0332
Nb0.04490.04210.07820.05730.0556
Mo0.02550.01540.01720.01310.0178
Pd4.54002.45001.58002.87102.9153
Ta0.37700.33500.35100.40800.3678
Ir0.07200.08471.07000.08710.3285
Hg0.99600.13600.02240.17600.3326
Base MetalPb0.23900.57900.35500.42200.3988
Semi-MetalGe0.23200.20200.30000.30100.2588
In62.50040.70083.50050.64059.335
Table 4. Elemental Concentrations of the Samples of DXP.
Elemental Concentrations of the Samples in ppm
ElementsSymbolDXP-1DXP-2DXP-3DXP-4Average
Non-MetalP17.10018.50023.50022.88020.495
S26.77028.25026.55025.68026.813
Cl13.50014.25017.90019.80016.363
Br0.56870.55670.53740.58450.5618
Se0.03510.07140.06310.07360.0608
Alkali MetalK8.320014.45017.60016.40014.193
Rb0.08280.03920.09010.08780.0750
CsBLBLBL0.26800.0670
Alkaline EarthCa1.33004.20504.57002.85003.2388
Sr0.04930.06340.05470.07420.0604
Ba3.62402.58001.10003.20002.6260
Transition MetalSc0.82800.44400.37600.70400.5880
V0.24500.18400.18300.56300.2938
Cr11.20031.40010.80012.20016.400
Mn0.49000.82200.28000.56300.5388
Fe20.00038.70018.60020.90024.550
Co0.45300.08600.50400.62100.4160
Ni5.670015.3005.68006.00008.1625
Cu0.73200.84200.92601.10000.9000
Zn1.47004.62000.75500.81001.9138
Y0.06840.05450.02590.10100.0625
Zr0.04560.05030.06850.05220.0542
Nb0.09300.69100.14300.14300.2675
Mo0.05010.05620.04630.05900.0529
Pd4.47002.47004.87005.85004.4150
Ta0.87001.40200.85300.84100.9915
Ir0.20400.37000.10300.34200.2548
HgBLBL0.01590.05330.0173
Base MetalPb0.21801.92000.26500.26900.6680
Semi-MetalGe0.66003.66000.68400.64401.4120
In106.0051.90090.200109.0089.275
Table 5. Elemental Concentrations of the Samples of PXP.
Elemental Concentrations of the Samples in ppm
ElementsSymbolPXP-1PXP-2PXP-3PXP-4Average
Non-MetalP31.20011.00014.30012.52017.255
S22.58024.81021.54021.56122.623
Cl7.06004.01004.14004.73004.9850
Br0.51330.52550.51120.52540.5189
Se0.05100.05250.04140.09020.0588
Alkali MetalK4.83005.26003.82005.70404.9035
Rb0.23100.04790.09710.10300.1198
Cs0.16900.48600.25700.61000.3805
Alkaline EarthCa1.13000.50100.73500.41900.6963
Sr0.04050.02030.02500.02840.0286
Ba0.59800.09190.21400.63100.3837
Transition MetalSc0.12880.15300.17820.14500.1513
V0.12400.15700.14700.37200.2000
Cr18.50021.70012.70016.94017.460
Mn6.27003.84003.72004.56004.5975
Fe13.8001.67009.820012.1009.3475
Co1.51000.23001.02000.84600.9015
Ni6.04006.19004.05005.79005.5175
Cu1.46000.07811.26001.56001.0895
Zn1.08000.17700.68101.24000.7945
Y0.09840.01980.02970.02650.0436
Zr0.02260.01280.01720.03780.0226
Nb0.04860.02230.04290.05700.0427
Mo0.04080.03410.03500.04040.0376
Pd3.12000.28501.99003.80202.2993
Ta0.61600.16500.31100.68400.4440
Ir0.21900.04640.10700.11400.1216
Hg0.96400.78300.20900.50500.6153
Base MetalPb0.06670.02740.02670.15800.0697
Semi-MetalGe0.12600.02530.14900.21500.1288
In50.90043.50031.60046.51043.128
Table 6. Elemental Concentrations of the Samples of VP.
Elemental Concentrations of the Samples in ppm
ElementsSymbolVP-1VP-2VP-3VP-4Average
Non-MetalP9.24009.30003.40006.60007.1350
S11.25018.85015.54017.35215.748
Cl0.01050.02500.02060.02200.0195
Br0.60600.55350.69900.66000.6300
Se0.51000.18300.26200.31000.3163
Alkali metalK11.4009.01006.840013.10010.088
Rb0.05720.01970.0365BL0.0284
Cs6.64002.50004.94004.37004.6125
Alkaline EarthCa12.4006.79005.34004.02007.1375
Sr0.31700.12000.23100.20500.2183
Ba2.42000.45600.72500.09420.9238
Transition MetalSc0.87101.18001.63001.55001.3078
V0.12601.2800BL0.47600.4705
Cr22.70012.80026.20014.40019.025
Mn0.46100.20600.41900.42000.3765
Fe11.6003.160012.9003.70007.8400
Co1.74005.49002.220010.6005.0125
Ni1.51001.09001.64000.69401.2335
Cu8.05004.28009.26005.72006.8275
Zn1.44001.33002.87001.20001.7100
Y0.10200.03260.04790.06390.0616
Zr0.07280.04270.05580.06040.0579
Nb0.05830.03080.02190.05350.0411
Mo0.08180.04410.06460.05210.0607
Pd0.06640.01200.03810.03270.0373
Ta0.01820.13600.03780.10900.0753
Ir1.14000.33501.00000.84200.8293
Hg0.11600.39800.10800.18000.2005
Base MetalPb0.34000.39500.30900.13400.2945
Semi-MetalGe2.81001.19001.39002.39001.9450
In79.10041.60056.40062.30059.850
Table 7. Elemental Concentrations of the Samples of DFS.
Elemental Concentrations of the Samples in ppm
ElementsSymbolDFS-1DFS-2DFS-3DFS-4Average
Non-metalP10.70014.80013.04012.80012.835
S19.56416.57717.84016.19017.543
Cl7.06005.21005.53008.65006.6125
Br0.55010.54450.34210.35380.4476
SeBL0.04170.05100.21100.0760
Alkali MetalK5.20003.04004.11003.04003.8475
Rb0.16700.12220.21000.11200.1528
Cs0.24200.20800.23400.22400.2270
Alkaline EarthCa1.24002.03203.33001.64502.0618
Sr0.02240.0331BL0.05030.0265
Ba0.08590.28800.64100.55900.3765
Transition MetalSc1.26000.66100.22800.48500.6585
V0.46500.55400.74600.23500.5000
Cr12.40013.90019.50016.80015.650
Mn4.32005.47005.61005.01005.1025
Fe14.10012.80024.20026.00019.275
Co1.52001.21003.29001.06001.7700
Ni4.59005.52006.50002.76004.8425
Cu2.26001.22002.20001.48001.7900
Zn0.49000.60701.24001.58000.9793
Y0.06610.05570.10200.15030.0935
Zr0.02770.02430.03930.03360.1068
Nb0.04370.04460.07660.07720.0605
MoBLBL0.04680.03330.0195
Pd2.55002.52003.35003.31002.9325
Ta0.22900.32200.12900.20700.2218
Ir0.37800.14500.53500.24300.3253
Hg0.15500.55100.49300.31600.3788
Base MetalPb0.20500.12200.11500.14900.1478
Semi-MetalGe1.15301.22501.28701.53001.2988
In56.00042.80052.70067.00054.625
Disclaimer/Publisher’s Note: The statements, opinions and data contained in all publications are solely those of the individual author(s) and contributor(s) and not of MDPI and/or the editor(s). MDPI and/or the editor(s) disclaim responsibility for any injury to people or property resulting from any ideas, methods, instructions or products referred to in the content.