Article

Utilization of Iron Foam as Structured Catalyst for Fischer–Tropsch Synthesis

by
Yira Victoria Hurtado
1,
Ghazal Azadi
1,
Eduardo Lins de Barros Neto
2 and
Jean-Michel Lavoie
1,*
1
Department of Chemical and Biotechnological Engineering, University of Sherbrooke, Sherbrooke, QC J1K 2R1, Canada
2
Department of Chemical Engineering, Federal University of Rio Grande do Norte, Natal 59078-900, RN, Brazil
*
Author to whom correspondence should be addressed.
Fuels 2025, 6(3), 60; https://doi.org/10.3390/fuels6030060
Submission received: 4 April 2025 / Revised: 4 July 2025 / Accepted: 30 July 2025 / Published: 14 August 2025

Abstract

This work focuses on the fabrication, characterization, and performance of a structured iron catalyst to produce hydrocarbons by the Fischer–Tropsch synthesis (FTS). The structured catalyst enhances the heat and mass transfer and provides a larger surface area and lower pressure drop. Iron-based structured catalysts indicate more activity in lower H2/CO ratios and improve carbon conversion as compared to other metals. These catalysts were manufactured using the sponge replication method (powder metallurgy). The performance of the structured iron catalyst was assessed in a fixed-bed reactor under industrially relevant conditions (250 °C and 20 bar). The feed gas was a synthetic syngas with a H2/CO ratio of 1.2, simulating a bio-syngas derived from lignocellulosic biomass gasification. Notably, the best result was reached under these conditions, obtaining a CO conversion of 84.8% and a CH4 selectivity of 10.4%, where the catalyst exhibited a superior catalytic activity and selectivity toward desired hydrocarbon products, including light olefins and long-chain paraffins. The resulting structured catalyst reached a one-pass CO conversion of 84.8% with a 10.4% selectivity to CH4 compared to a traditionally produced catalyst, for which the conversion was 18% and the selectivity was 19%, respectively. The results indicate that the developed structured iron catalyst holds considerable potential for efficient and sustainable hydrocarbon production, mainly C10–C20 (diesel-range hydrocarbons), via Fischer–Tropsch synthesis. The catalyst’s excellent performance and improved stability and selectivity offer promising prospects for its application in commercial-scale hydrocarbon synthesis processes.

1. Introduction

The transportation sector accounts for approximately 16% of the world’s energy consumption and more than a third of CO2 emissions from end-use sectors [1,2,3,4]. However, due to the urgent need to reduce carbon emissions and promote sustainable mobility, there is a growing interest in developing low-carbon intensity fuels [5,6,7,8]. The combustion of fossil fuels leads to the emission of greenhouse gases, which cause climate change and raise global concerns. Thus, alternative processes for producing renewable energy have been developed to meet the growing demand for energy [9]. One promising approach is the biomass-to-liquid (BTL) processes, which convert lignocellulosic biomass into liquid fuels via thermochemical reactions [10,11,12,13]. Bio-syngas could represent a suitable option as a synthetic fuel to replace non-renewable and fossil fuels.
One of the most well-known BTL routes involves using the syngas produced from biomass gasification. This syngas can then be converted into hydrogen, methanol, or synthetic fuels through different catalytic processes [14,15]. The Fischer–Tropsch synthesis (FTS) is often used to convert syngas into liquid fuels [16,17,18], and it has been widely utilized as a sustainable process for synthetic liquid fuel production [9]. The main operational conditions that influence the gas conversion and product distribution are the temperature (200–350 °C), pressure (10–40 bar), and H2/CO ratio, which can vary depending on the syngas resource [18]. It has also been reported that temperatures of 220–350 °C and pressures of 15–40 bar are optimum FTS process conditions [9]. FTS involves hydrogenating carbon monoxide to produce hydrocarbons which is usually done using heterogeneous, solid metallic catalysts [19,20]. Cobalt and iron are the two most commonly used catalysts for FTS due to their commercial viability. The former is known for having an activity level four times higher than iron, but it can only be used within a very narrow temperature range (from 220 to 250 °C) and syngas composition (H2:CO ratio of 2 to 2.5) [1,21,22]. However, the syngas produced from biomass is often hydrogen-deficient, so obtaining a suitable syngas for FTS is challenging. Iron promotes the water–gas shift (WGS) reaction that occurs simultaneously with the main reaction and is preferred for a lower H2/CO ratio, which is typical of biomass-derived syngas [23]. It has been reported that iron-based catalysts are suitable for a low H2/CO ratio syngas and emphasize the role of promoters on the WGS activity [24]. Using an iron catalyst in a CO2-containing syngas FTS resulted in an 82–85% CO conversion and up to 74% selectivity toward C5+ hydrocarbons under a low H2/CO ratio [25]. Using iron catalysts, it has been found that decreasing the H2/CO ratio from 2 to 1.2 significantly improves the olefin selectivity, reduces methane formation, and increases the CO conversion by up to 85% [26]. Additionally, iron has a higher thermal resistivity than cobalt and is more abundant, making it more economical for large-scale industrial applications. This difference is reflected in global market prices (Co: USD 35,000/ton vs. Fe: USD 120/ton). Therefore, considering iron as a BTL catalyst is an interesting alternative, as emphasized in [1,9]. The reactor design is another key factor in the efficiency and product distribution of the FTS process. The Slurry Bubble Column Reactor (SBCR) has been used mainly on a commercial scale by companies such as Shell and Sasol. While fixed-bed reactors are more common at lab and pilot-scale systems due to their simplicity and easier operation [27,28]. Furthermore, FTS presents challenges that must be addressed. The reaction is exothermic, so careful temperature control is required to optimize the production of the desired hydrocarbons [29,30]. CO2-rich syngas activation is reported to affect the iron carbide formation and product selectivity by improving the production of valuable products such as C5+ and limiting the formation of undesired products such as CH4 and C2–C4 [31]. Additionally, side reactions, such as methanation and WGS reactions, can affect the overall efficiency of the process [32]. Furthermore, supported catalysts used for FTS may experience problems related to mass and heat transfer, such as internal mass transfer limitations and high pressure drops [27,33,34].
To address these issues, structured catalysts are being explored as an alternative to traditional supported catalysts. These catalysts are pre-shaped ceramic or metallic substrates that offer improved heat and mass transfer, reduced pressure drops, and larger geometric surface areas [35]. Structured catalysts have shown promising results in environmental catalysis applications, such as reducing nitrogen oxides in power plant emissions and controlling car exhaust emissions.
Several studies have demonstrated the feasibility of performing Fischer–Tropsch synthesis (FTS) using structural catalysts, including monoliths and foams [36,37,38,39,40,41,42,43,44]. However, the active phase of these catalysts is often cobalt supported on a ceramic, which can negatively impact the bio-syngas conversion to biofuels due to the low thermal conductivity and low activity at low H2/CO ratios. Plus, Fe-based structure catalysts demonstrated an improvement in terms of carbon conversion in the FTS-based method, using biomass-derived syngas as the feed gas [45]. Adding promoters such as Si, Al, and Zn to the iron-based catalyst for FTS is reported to have a notable effect on the catalyst’s textural properties, reduction, carburization, activity, and selectivity. The structural modification was found to increase the extent of the reduction and CO carburization, specifically in the CO2-rich feed. The modified structure with Zn was found to increase CO conversion up to 33.69% and decreased the methane content to 8.5%. However, the catalyst structure using the Si additive indicated a low CO conversion and a high methane selectivity. Thus, the structural modification for iron-based catalysts used in FTS should benefit from a high carburization ability and high oxidation resistance to be suitable for CO2-rich syngas derived from biomass [24]. It has been reported that using structured catalysts, metallic foams such as Co/Cufoam, indicated a higher activity and selectivity for C5+ compared to Co/Al2O3-SiO2, which is often used as a reference catalyst. Metal foam structures improve the thermal activity, which leads to chain propagation improvements and the suppression of methane formation [36]. To our knowledge, few studies have focused on Fe-based catalysts [46], hence, the general goal of this work is to design and evaluate iron-based structural catalysts for converting bio-syngas into renewable liquid fuels. Specifically, this study aims to investigate the feasibility of using a structured iron-based catalyst in the form of a metallic foam for Fischer–Tropsch synthesis (FTS) under hydrogen-deficient conditions, which are typical of biomass-derived syngas. This study aims to address key challenges associated with conventional powder catalysts, such as poor heat and mass transfer, a low selectivity to heavier hydrocarbons, and limited suitability for low H2/CO ratios, by synthesizing and evaluating an Fe foam catalyst in a fixed-bed reactor. This study will determine if the open-cell metallic structure improves the catalyst’s performance and selectivity.

2. Materials and Methods

2.1. Catalyst Preparation and Characterization

2.1.1. Catalyst Preparation

The structured catalyst used in this study was iron foam manufactured using the sponge replication method with a polyurethane (PU) foam as the template. Iron (composition: 95% Fe, 2% Fe2O3, 200 mesh, Fisher Scientific (Alfa Aesar), Ottawa, ON, Canada) was used as the metallic precursor. The template used to generate the structure was a PU foam typically used as an air filter, with a pore count of 50 pores per linear inch (PPI) and a void fraction of approximately 95% that was bought at the local hardware store. The foam was 14 cm thick and cut into a disk with a diameter of 24 mm. The sponge replication method started with a slurry of the metallic precursor. A polymeric solution serves as the slurry’s solvent. The components were sodium carboxymethyl cellulose (1% wt., M_w 700,000, Sigma-Aldrich, Oakville, ON, Canada), which increased viscosity; polyvinyl alcohol (6% wt., low molecular weight, Alfa Aesar), which served as a binder between the powder and template; and alginic acid sodium salt (0.5% wt., low viscosity, Alfa Aesar), which served as a dispersant. The components were selected based on their wide application in ceramic and metallic foam replication methodologies to be compatible with water-based systems, burnout facility, and uniform coating formation on polymer structure as reported in similar studies on Fe-based foam synthesis [47]. To prepare the polymeric solution, distilled water was heated to 80 °C. Then, CMC was added, and the solution was stirred at 300 rpm until homogenized using a magnetic stirrer. Then, the temperature was reduced to 50 °C. Polyvinyl alcohol was added, and, once dissolved, sodium alginate was added [48,49]. Once a homogeneous solution was obtained, the temperature was reduced to 22 °C, after which, iron powder (60% wt.) was added. The metallic slurry was stirred manually, and to coat the template, the PU foam was left to soak in the slurry for 30 min. Then, the foam was removed from the slurry, drained, and pressed between two sheets of absorbent paper to remove excess slurry [47,48,50]. The foams were left to dry overnight at room temperature. Finally, the dry-coated foam was sintered to obtain the metallic structure. The heating ramp used for sintering went as follows: 5 °C/min up to 375 °C, followed by a 30 min plateau to burn the PU template. Then, it was heated at 10 °C/min up to 1200 °C, followed by a 2 h isotherm. The heating ramp was carefully selected to control PU decomposition to ensure structural integrity [51].

2.1.2. Catalyst Characterization

The microstructure of the cross-sections of the Fe foams was characterized by scanning electron microscopy (SEM—FEG—EDS, Hitachi S-4700, Hitachi High-Tech Corporation, Tokyo, Japan). The foam was cleaned in an ultrasonic bath and blow-dried to ensure that the loose particles were removed from the surface. A two-dimensional cross-sectional image of the foam was captured and post-processed to determine the strut size of the final structure, in addition to the grain size and shape of the final structure.
The void fraction of the foam was measured using Equation (1), where ρ s [g/cm3] is the iron density, and ρ b is the foam’s bulk density, measured by the Buoyancy Method.
ε = 1 ρ b ρ s
The catalyst’s specific surface area was measured by nitrogen physisorption (ASAP 2020, Micromeritics, Norcross, Georgia) based on ASTM D3663 [52]. To perform the measurement, a piece of iron foam was placed on the sampling cell and outgassed overnight. Then, a 3-point N2 BET (Brunauer–Emmett–Teller) isotherm was measured at −196 °C.
XRD (X-ray diffraction) analysis was performed to identify the metal phase in the catalyst following the ASTM D3906 standard method [53]. The catalyst sample was manually ground in an agate mortar until a grain size of ≤45 µm was obtained. Then, the sample was placed in an XRD spectrophotometer (X-per Pro MPD, Panalytical, Almelo, the Netherlands), where the analysis was performed from 14° to 100° for 2θ. Cu radiation was used as an X-ray source generated at 40 kV and 10 mA. Scans were taken with a 2θ step size of 0.04°, and a counting time of 1.0 s was used to obtain the diffractogram. The MDI JADE software package (version 9.3) was used to determine the phase composition in the samples with the Rietveld analysis.
Catalyst reducibility was determined by TPR (temperature-programmed reduction) analysis. The experiment was conducted in a 1/2″ tubular quartz fixed-bed reactor, and the gas samples were analyzed using a GC equipped with a TCD. The reduction gas mixture of 10% H2/N2 was made to flow across 300 mg of the Fe foam under gradually increasing temperature (10 °C∙min−1) from 196 °C to 970 °C, resulting in a qualitative co-relationship between reduction rate and temperature.

2.2. Catalyst Test

The Fe foams were stacked inside the reactor to form a catalytic bed approximately 50 to 70 mm high. Each cylinder was 24 mm in diameter and 14 mm in height. The weight of the catalyst in each test was approximately 30 g unless otherwise specified. The catalyst was reduced in situ with a mixture of 70% hydrogen and 30% nitrogen, both with a purity of 99%, at atmospheric pressure. Three reduction temperatures were tested—250 °C, 325 °C, and 400 °C—to evaluate the stepwise activation behavior of the Fe foam catalysts. These temperatures are related to the reduction sequence from Fe2O3 to Fe0, and the carbonization occurred above 300 °C. The temperatures below 300 °C led to reduction without much carbide formation, while 325 °C is reported as an optimum temperature to form FeCx without extra sintering [54]. Additionally, 400 °C was selected to investigate whether deeper reduction could further improve activity. After reduction, the reactor was cooled by flowing the same gas mixture through it. Once the desired reaction temperature of 250 °C was reached, the gas mixture was switched to the desired syngas composition, and the reactor was pressurized to 20 bars. Figure 1 shows a schematic of the reactor and the peripheral components used in this study. The gases (carbon monoxide, hydrogen, and nitrogen) came from compressed gas cylinders. Electronic mass flow controllers (one for each gas) fed the gases to the reactor, ensuring a fixed composition for each experimental run. Before entering the reactor, the gases passed through a static mixer. The reactor’s outlet leads to a gas–liquid separator. A backpressure regulator was installed at the end of the piping system to maintain a stable operating pressure throughout the experiment. Non-condensable gas samples were collected for gas chromatography (GC) analysis, and the remaining gas was purged to the ventilation system under atmospheric conditions. The liquid product, consisting of water and hydrocarbons, was collected in a trap beneath the reactor.
The reactor was a stainless steel 316 tube with an internal diameter of 26 mm and a height of 500 mm and it was heated by a clamshell oven. In this process, the tail gas was not recirculated to the reactor, and no inert compounds were accumulated. The reactor does not have a cooling system and was equipped with two thermocouples that measured the temperature at the top and bottom of the catalytic bed [1]. A stainless steel mesh was placed before and after the catalytic bed to maintain the catalyst position. The gas effluent composition was determined by gas chromatography (GC) analysis using a Bruker Scion 456-GC equipped with two columns, a Molsieve (13X, 80/100 mesh, 1.5 m × 1/8 in. IS) and a Hayesep (N, 80/100 mesh, 0.5 m × 1/8 in. IS), as well as a TCD and an FID. The program used to process the data was Compass CDS with external standards (ASTM D1946 and ASTM D2163 [55,56]). The catalyst’s performance was determined based on CO conversion (XCO), as well as CO2 and CH4 selectivity (SCH4, SCO2, and SC5+, respectively) using Equations (2)–(4).
X C O = 1 F C O , o u t F C O , i n · 100
S C H 4 = F C H 4 , o u t F C O , i n F C O , o u t · 100
S C O 2 = F C O 2 , o u t F C O , i n F C O , o u t · 100
The conversion was calculated based on the product gas analysis for CO, H2, CO2, and CH4, where F indicates molar flow rate [mol∙min−1].

2.3. Product Characterization

There are two liquid products for FTS: an aqueous phase and an organic phase. To characterize these products, their density and pH were measured. The organic phase was analyzed using an Leco Truspec Micro elemental analyzer as well as using GC-MS based on the ASTM D6730 method [57] using an Agilent 5975 Series MSD coupled to an Agilent 7820A GC (Santa Clara, CA, USA). The GC was equipped with a J&W DB-5MS (nonpolar phenyl arylene polymer) column measuring 15 m × 0.25 mm × 0.25 µm. The autoinjector (Agilent ALS, Santa Clara, CA, USA) operated in 10:1 split mode at 300 °C, and helium served as the carrier gas at a flow rate of 1.2 mL/min. One microliter of the sample was injected. The oven temperature was held at 50 °C for one minute, then heated to 300 °C at a rate of 10 °C per minute. The temperature of 300 °C was held for 1 min. The aqueous phase was centrifuged and sterile-filtered using a 0.22 µm Chromspec membrane filter. Then, it was analyzed by HPLC based on ASTM D5501 [58] using an Agilent 1100 Series HPLC system (Santa Clara, CA, USA) equipped with a Rezex ROA-Organic Acid H+ (8%) 300 × 7.8 mm Phenomenex column. The mobile phase was 2.5 mM H2SO4 at a flow rate of 0.6 mL/min. The column temperature was 65 °C and three calibration curves were made for each compound of interest: ethanol, formic acid, and acetic acid.

3. Results

3.1. Catalyst Properties

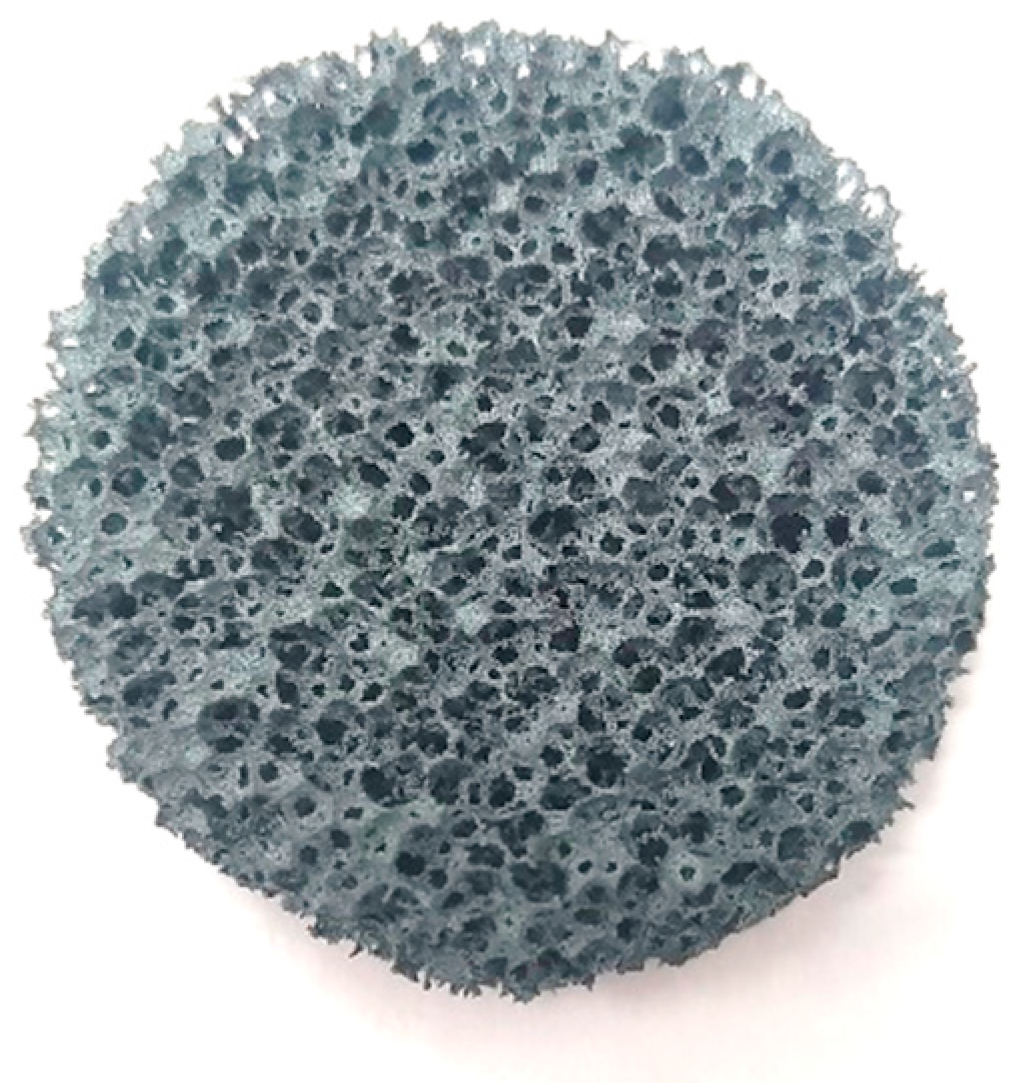
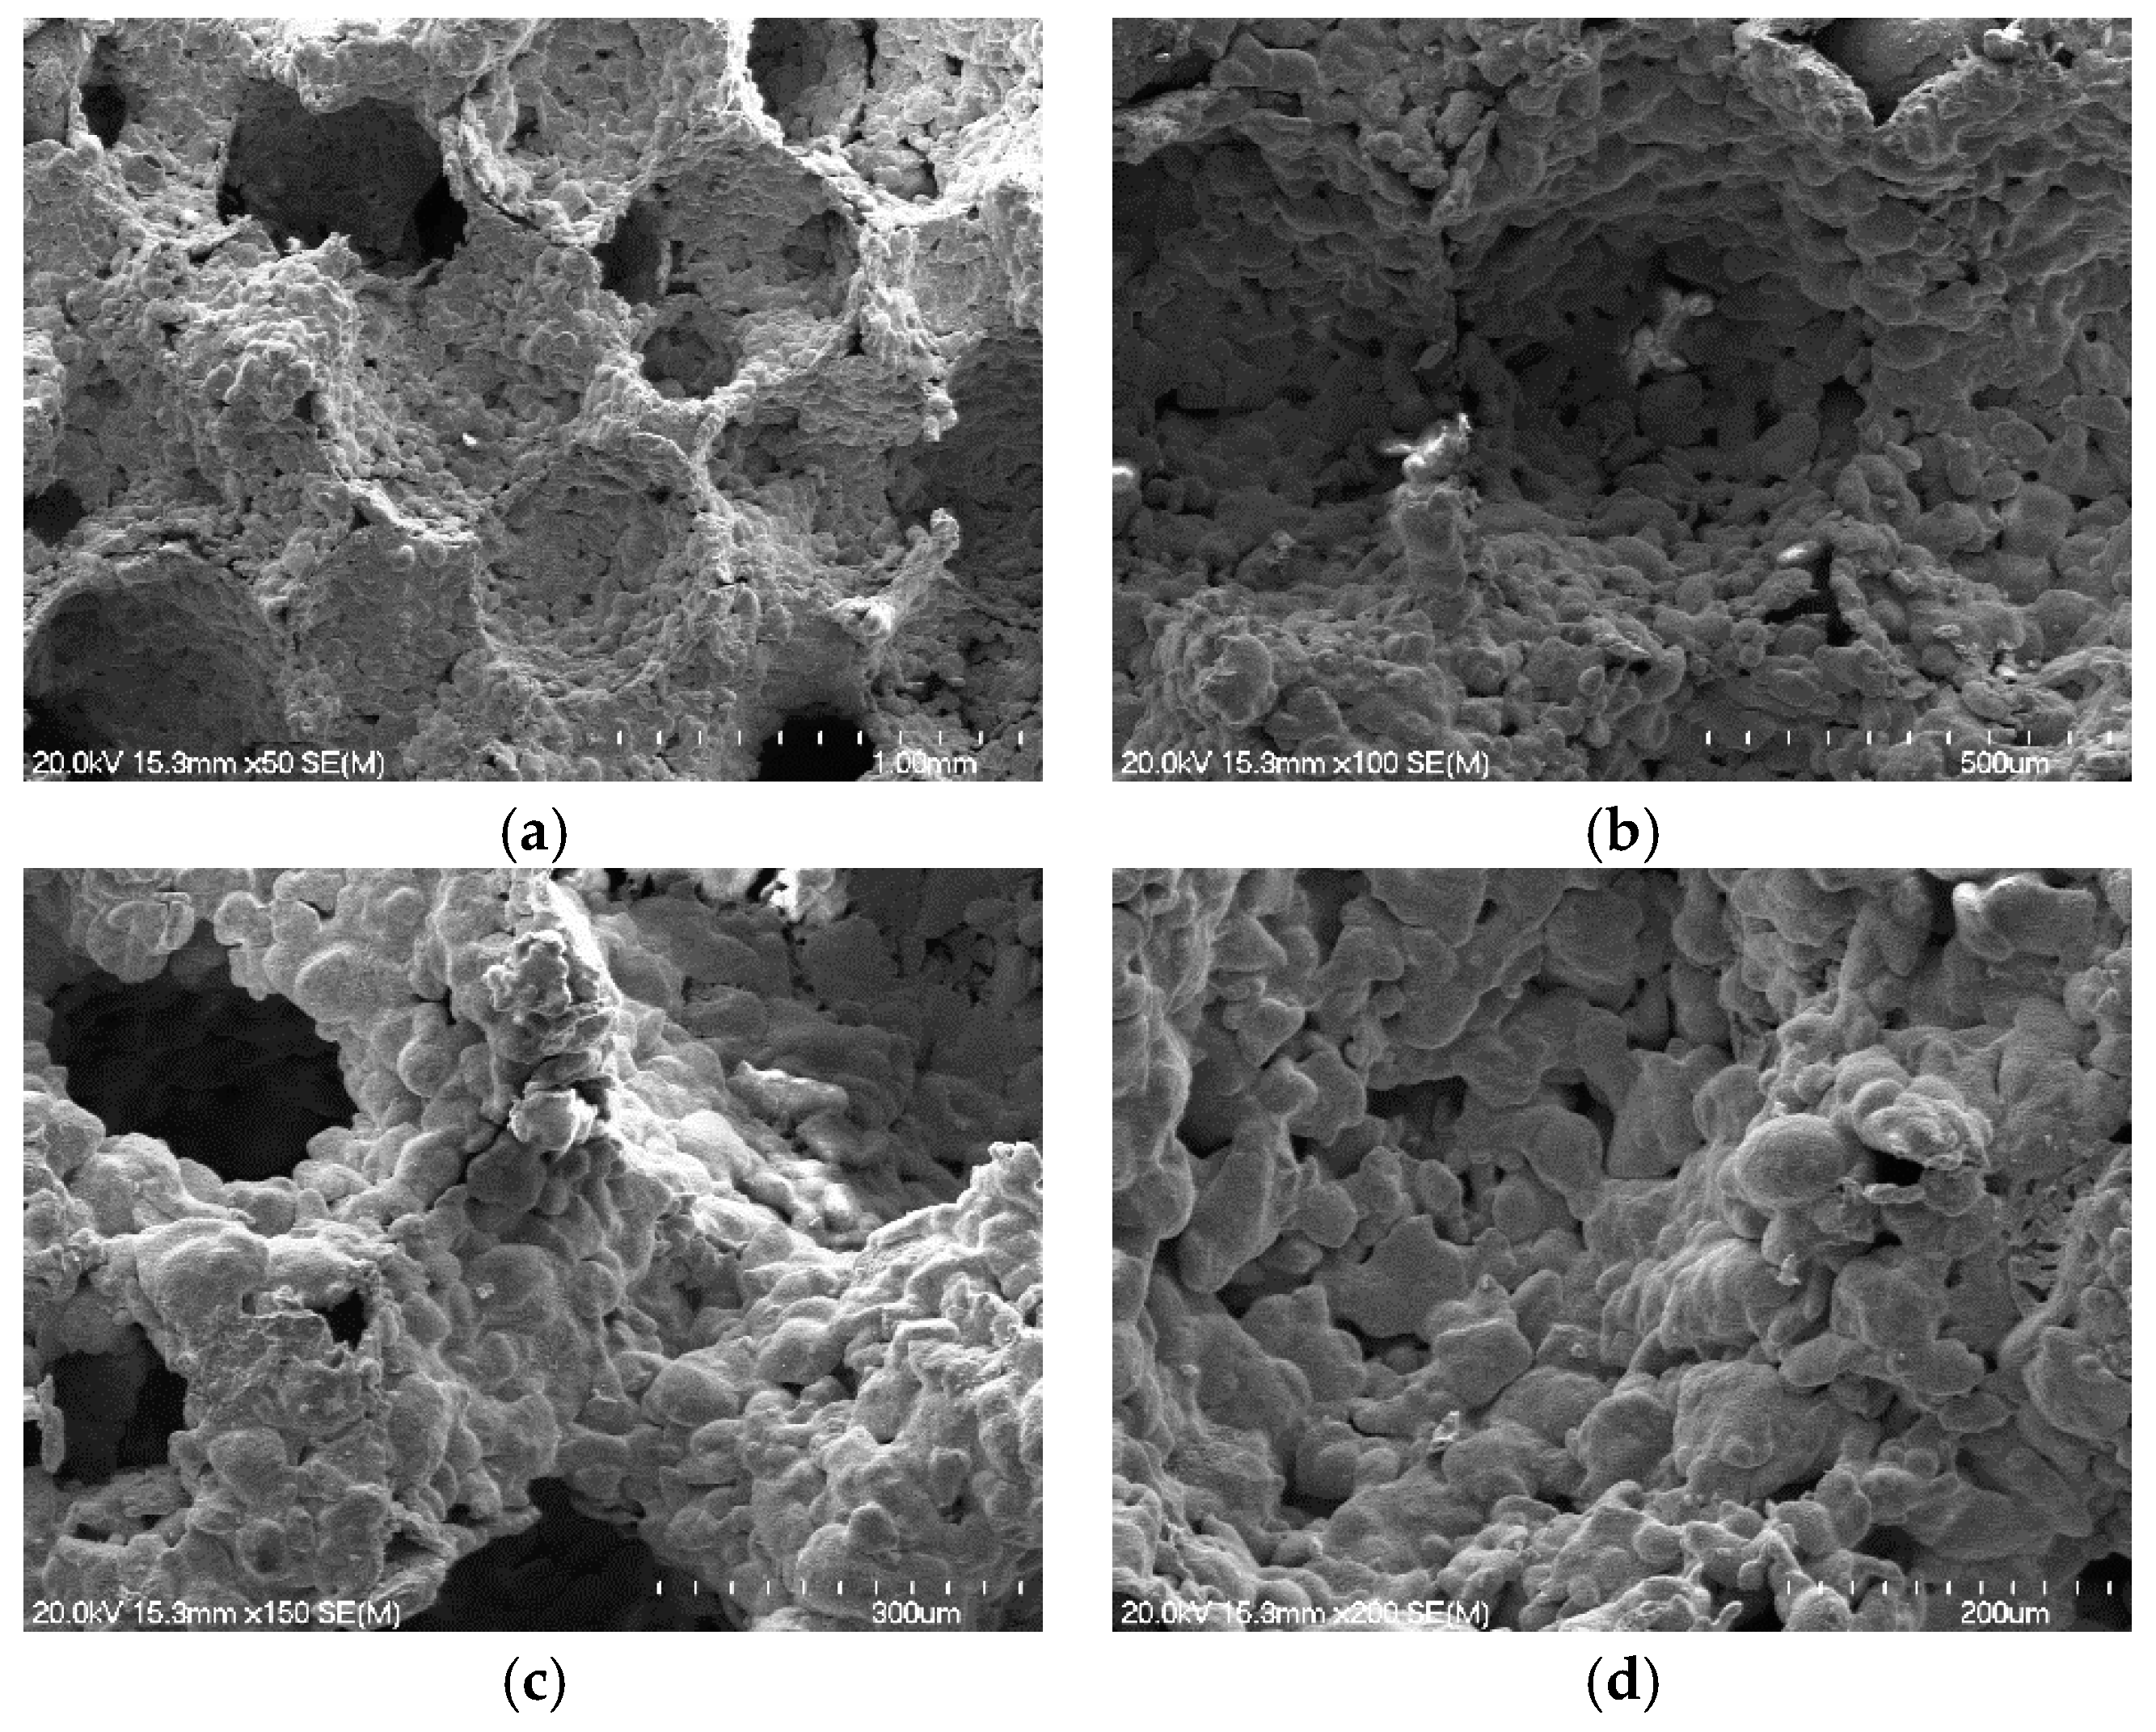
Figure 2 shows a photograph of the iron metal structure obtained using the sponge replication method. The replicated metal foams closely resemble the original polyurethane (PU) structure used as template. However, the structure lost a large amount of the void fraction since the excess slurry agglomerated and could not drain from the cells before the binder dried. As shown in Figure 3, clogging occurred in the cells during the coating stage. Consequently, the metallic structure had a substantially reduced permeability, which could be related to the reduction in the void fraction from 0.95 (reported by the manufacturer) to 0.67. This value was calculated using Equation (1) with the bulk density of the metallic foam, ρb = 1154 g/cm3 (measured by the volumetric displacement method), and the iron density, ρs = 7874 g/cm3. Applying a higher pressure (approximately 5–10 kPa) to drain the slurry resulted in around 40% fewer closed cells [1]. Although the higher pressure helps remove the extra slurry and prevents pore blockage, extreme pressure makes the foams much more brittle and can break when packed in the reactor. This is consistent with literature, which reports that optimized draining can influence the foam porosity and stability [59].
The area measured by the nitrogen adsorption was 3 m2·g−1, which is consistent with reported values for open-cell metal foams that have been sintered without the use of high-surface-area supports [60,61,62,63,64]. The catalyst’s low surface area compared to powder catalysts (20–80 m2·g−1) is offset by the high volume-to-area ratio achievable with a three-dimensional cellular structure, such as open-cell foams [60,64,65,66]. Additionally, higher rates of mass and heat transfer are achieved with a greater tortuosity in the catalytic bed.
The three-dimensional shape of the foam provides a high tortuosity and avoids clogging problems (and high pressure drop) through the reactor due to its open structure, which limits the liquid retention caused by the wax adsorption on the catalyst surface [61,62,63,64]. The open, metallic cellular structure that dissipates heat more effectively, acts as a thermal conductor, and reduces hot spots. Therefore, the Fe foam structure makes the catalyst less prone to sintering [65,67,68]. This has also been indicated in microfibrous metal beds used in the FTS process and resulted in a better thermal gradient (<5 °C) compared to packed-bed systems (>50 °C) [59]. Figure 4 shows the XRD patterns of the Fe foam, which represents the iron phase before the reaction is essentially composed of Fe2O3. It demonstrates Fe2O3 diffraction peaks, which confirms that the sintering preserved the hematite phase prior to the reduction. The absence of the Fe3O4 (35.4°) and metallic iron (44.7°) peaks indicates that no reduction occurred during the sintering process. This is because the sintering occurred at 1200 °C, and the hematite is thermally stable under oxidizing conditions. Similar trends have also been reported after sintering iron-based catalysts in air [66].
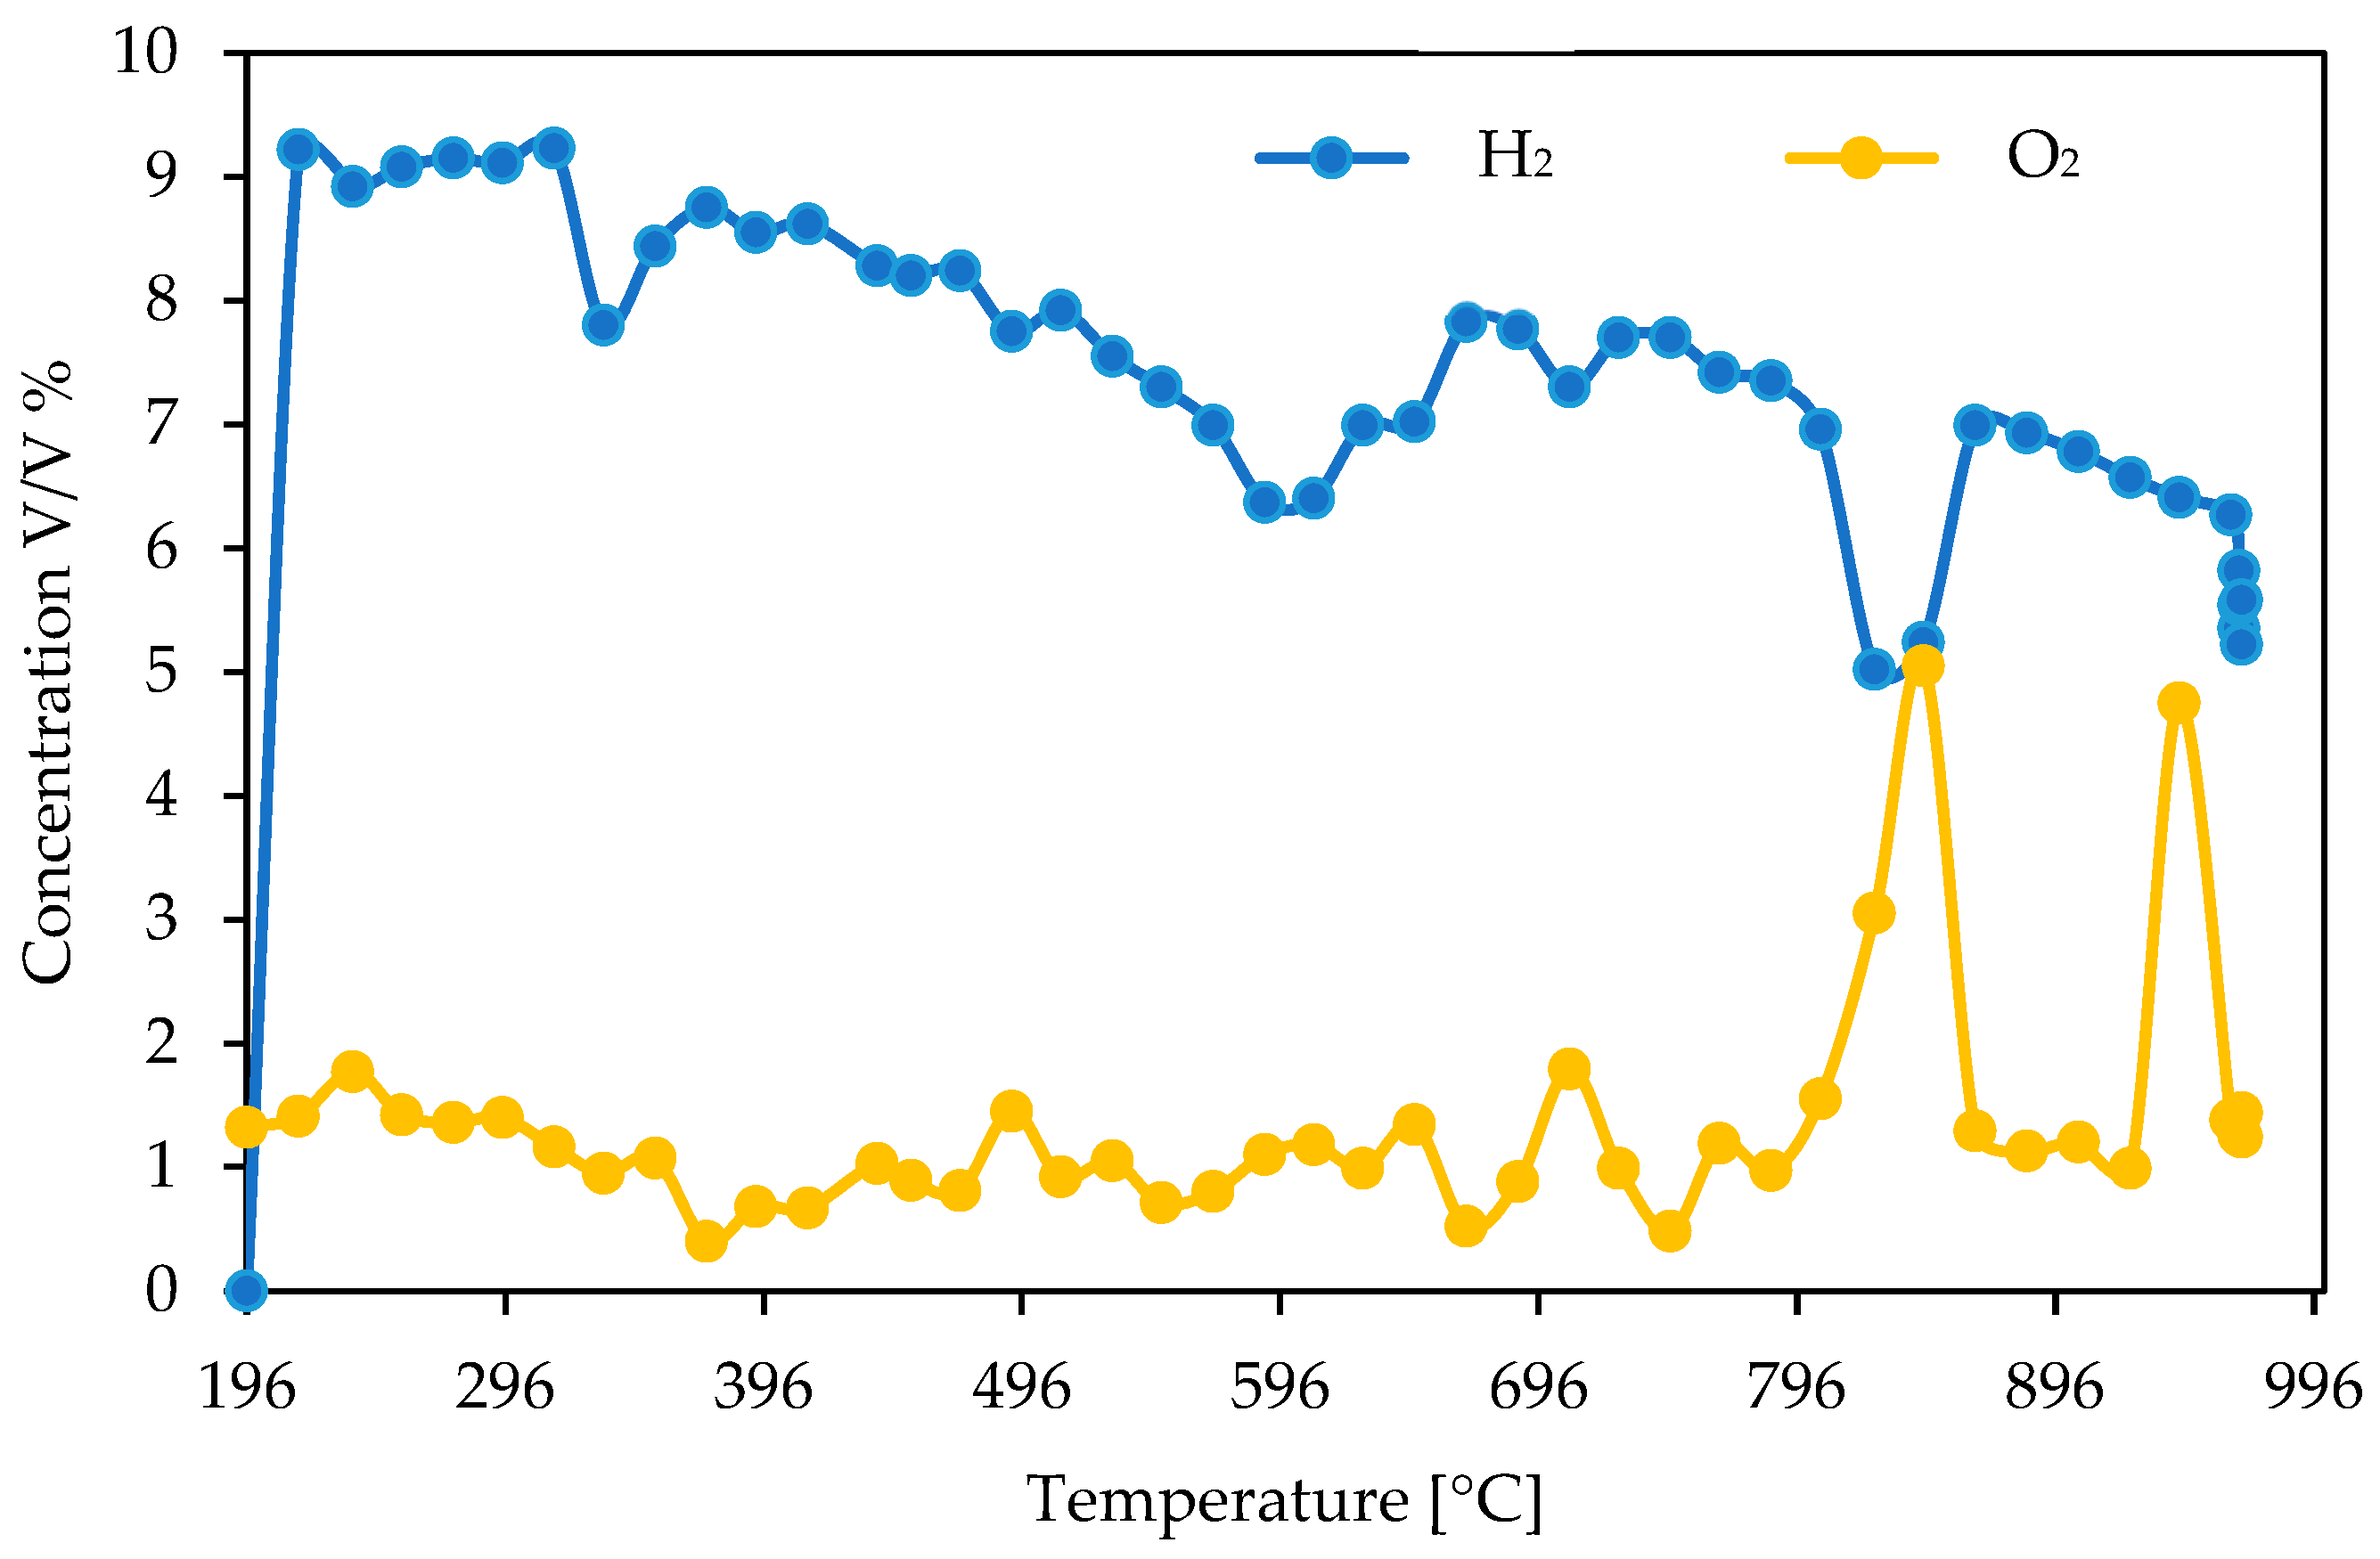
A TPR analysis was used to characterize the catalyst and Figure 5 shows that the catalyst reduction occurs in four stages within the studied temperature range. The reduction begins at 230 °C. The first significant H2 uptake occurs around 315 °C, which corresponds to the reduction of Fe2O3 to Fe3O4. The relatively high H2 consumption of the Fe2O3 → Fe3O4 step suggests that a large fraction of Fe2O3 is present on the surface of the catalyst structure, as indicated by the XRD analysis [1]. The XRD and TPR combination indicates how the Fe3O4/Fe2O3 variation affects thereducibility and activity. It has been demonstrated that a higher Fe2O3 surface content enhances the hydrogen consumption in early TPR stages [69]. This justifies the inference that the high early H2 uptake points to a surface-rich Fe2O3 structure. The next reduction step, Fe3O4 → FeO, was observed at 600 °C after which a third hydrogen uptake occurred around 820 °C, where FeO is reduced to Fe0. A study on TPR profiles of Fe/Cu/K/Al2O3 showed similar multiple reduction steps, Fe2O3 → Fe3O4 → FeO → Fe0 [54]. The hydrogen concentration increased to 7% at 900 °C and shows that another H2 uptake occurred close to 970 °C, which may be associated with the reduction of the Fe carbide [70,71,72]. The high temperature H2 uptake observation could be linked to the carbide transformation and Fe carbide formation [73].

3.2. Catalytic Performance

The catalytic performance of the Fe foams was evaluated in a fixed-bed reactor for the FTS, and a precipitated catalyst with a similar grain size to the Fe foams was used as reference. To prove the concept, the first set of tests on the Fe foams’ capacity as a catalyst for FTS was carried out under conditions more commonly reported in literature (250 °C, 20 bar, and a H2/CO ratio of 2). Under these conditions, the intrinsic activity of the iron sites resulted in a CO conversion of 18–21% [28,30,74,75,76,77]. Both the Fe powder and the Fe foam were reduced in situ under a H2 flow at 250 °C for 4 h prior to the FTS test. The reactions were carried out at 250 °C with a total pressure of 20 bar, an H2/CO ratio of 2, and a CO flow of 100 mL/min, corresponding to a gas hourly space velocity (GHSV) of 1200 h−1. Table 1 shows the performance of the two catalysts after 48 h of operation.
The low conversion rate was attributed to the short residence time, which resulted from the high void fraction of the foams. Despite the lower conversion as compared to the Fe powder catalysts, the foams resulted in more than 87% selectivity toward C3+ hydrocarbons, as shown in Table 1, indicating their potential for diesel-range hydrocarbon production [78]. Nevertheless, these results demonstrate the feasibility of using Fe foams as a catalyst for Fischer–Tropsch synthesis, provided that the optimal porosity and WHSV conditions are identified [79,80].
For the second set of tests, the residence time was increased and the catalyst reduction temperature was varied to determine its influence on the catalyst reducibility and the generation of CO hydrogenation sites. The reduction temperatures used were 250 °C, 325 °C, and 400 °C. The other operating conditions were as follows: a catalyst weight of 30 g; a reaction temperature of 250 °C; a pressure of 20 bar; a CO flow of 135 mL/min, corresponding to a WHSV of 600 h−1; a syngas ratio (H2:CO) of 2; and a time-on-stream of 48 h. Table 2 presents the results of these reactions. It has been reported in literature that a higher reduction temperature favors Fe activation and surface dispersion. However, it can change the selectivity and cause sintering in extreme conditions [81].
For the next set of tests, the syngas ratios were modified since iron can be used for hydrogen-deficient as well as hydrogen-rich syngas. Table 3 shows the performance indicators for Fe foams under the following reaction conditions: a catalyst weight of 30 g; a reduction temperature of 325 °C; a reaction temperature of 250 °C; a pressure of 20 bar; a flow rate of 300 mL/min; a time-on-stream of 48 h; and different syngas ratio from 1.2 to 2.5, as presented in Table 3 below.
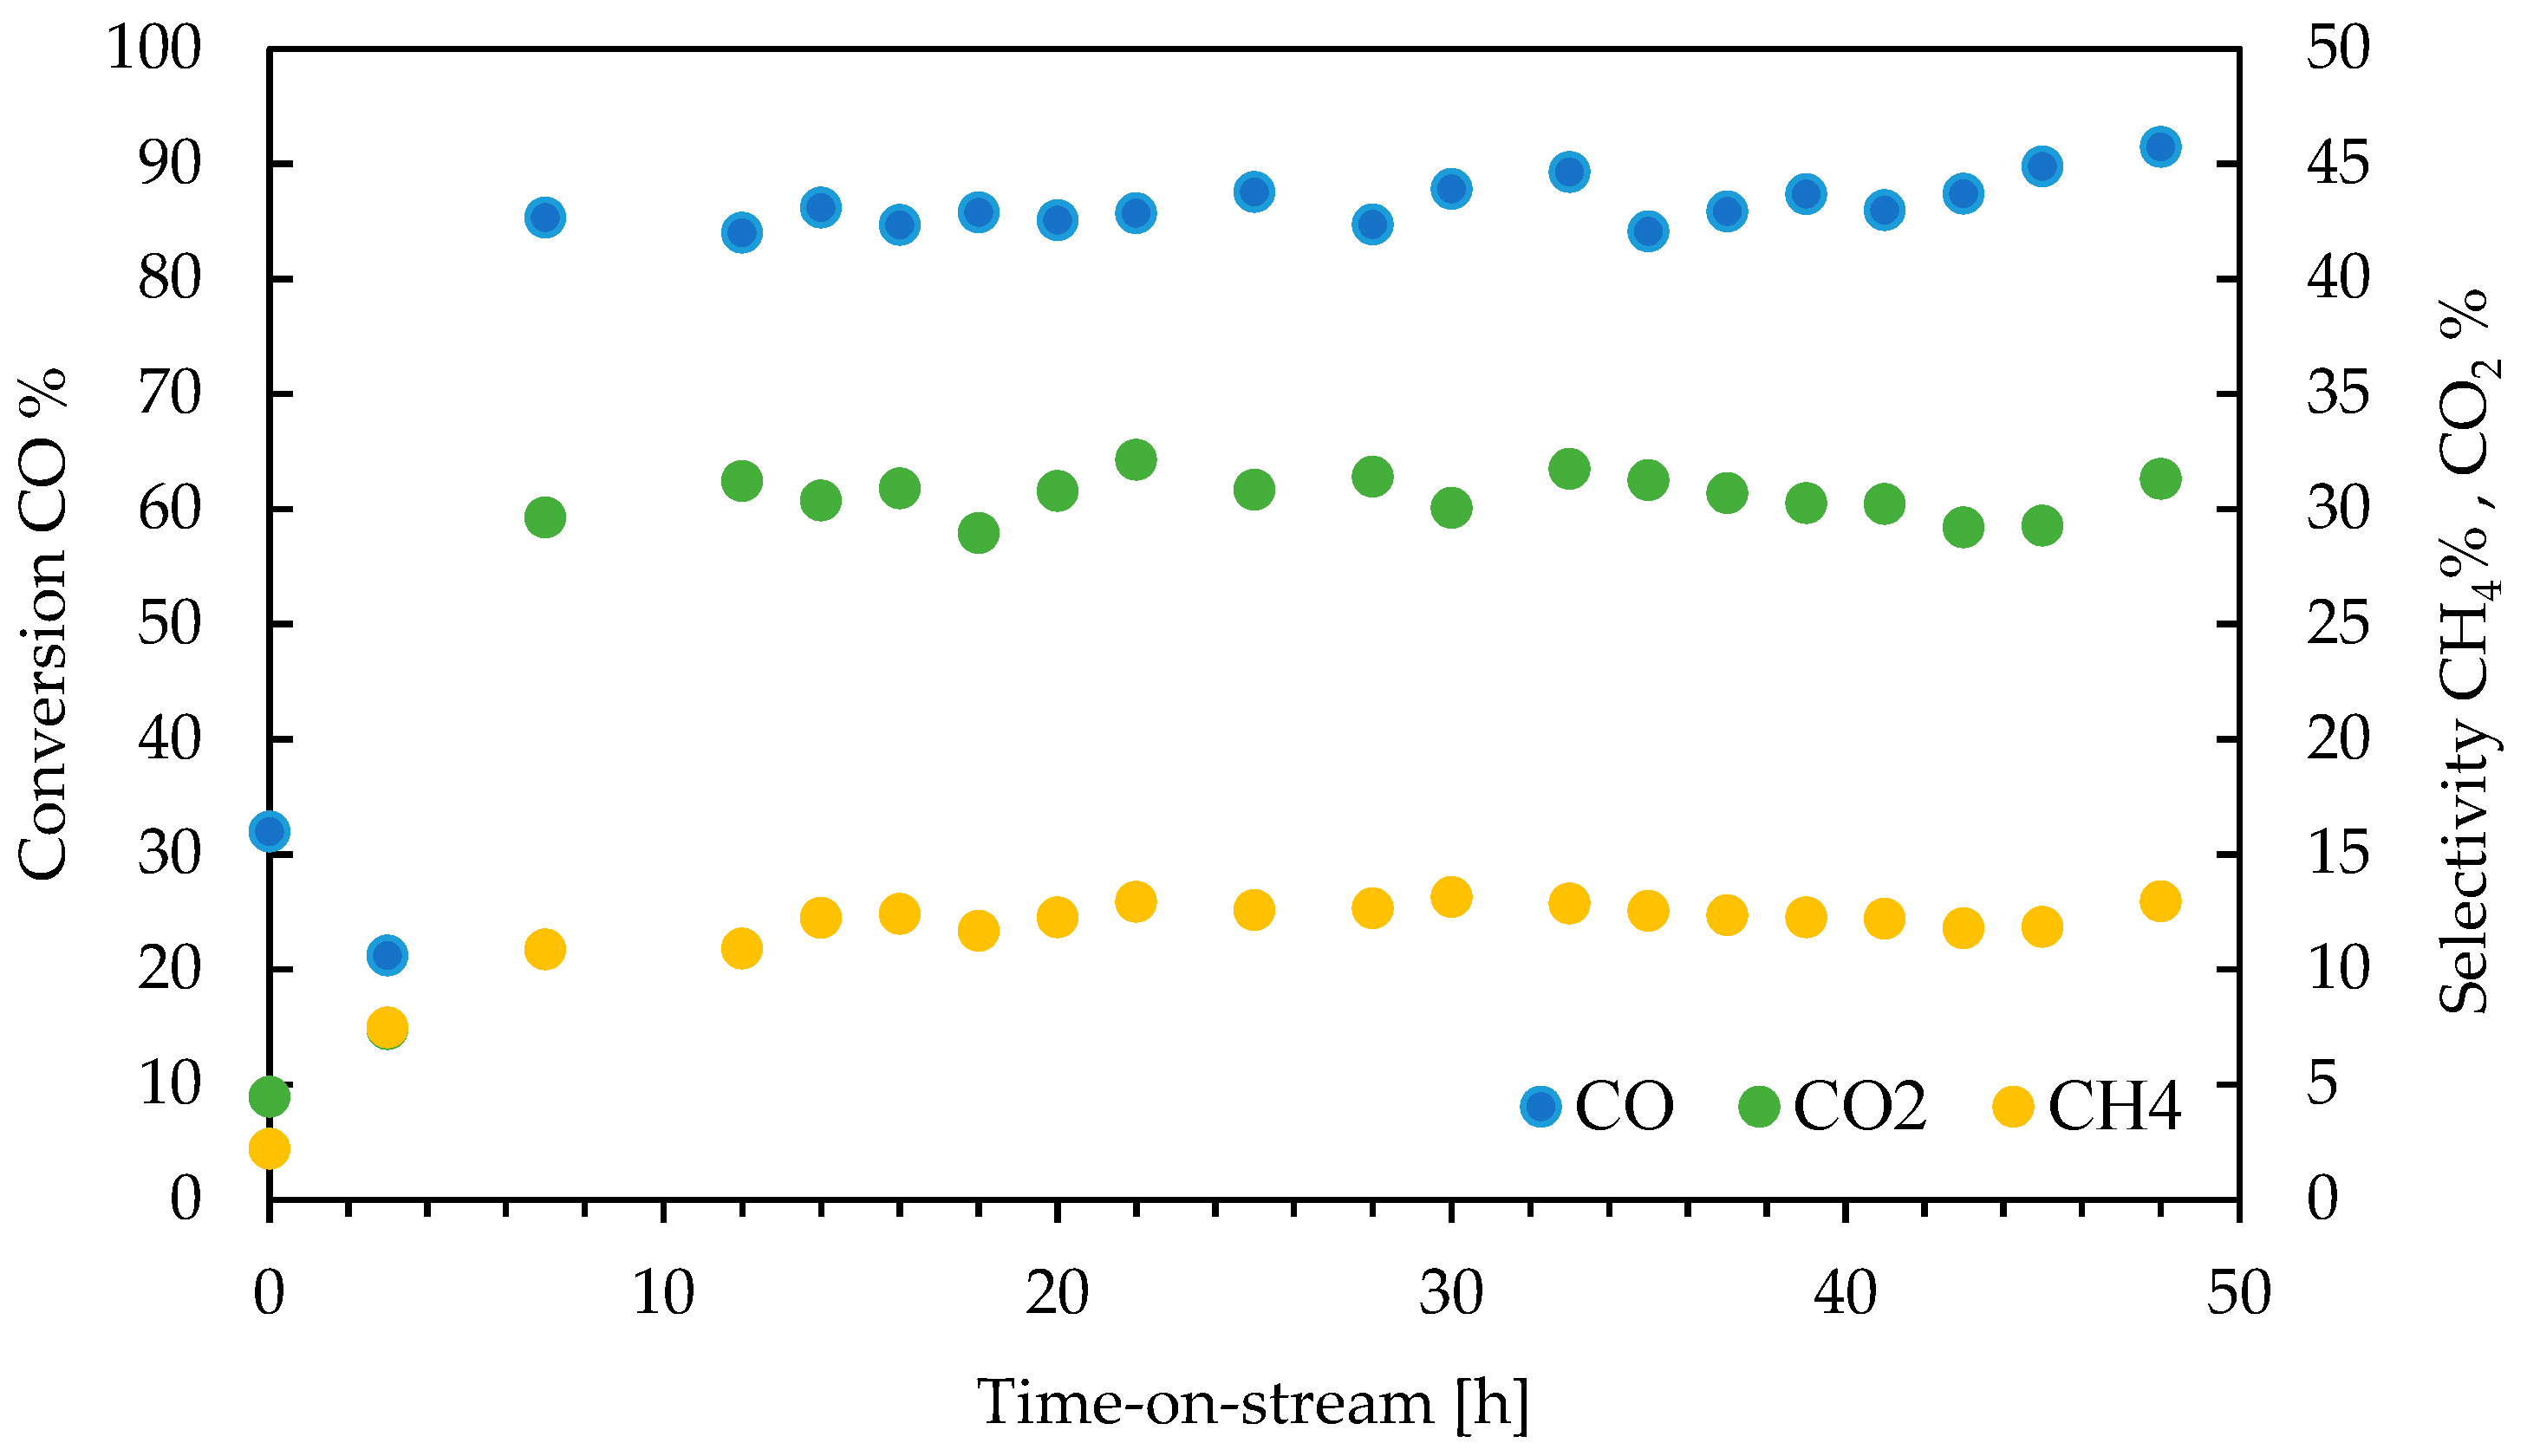
Figure 6 shows a second run of the reaction with the highest performance (H2/CO = 1.2, CO conversion of 84.8%, and CH4 selectivity of 10.4%), where the reaction was tracked every two hours after reaching the steady state; however, abrupt changes in the performance indicators could not be perceived.
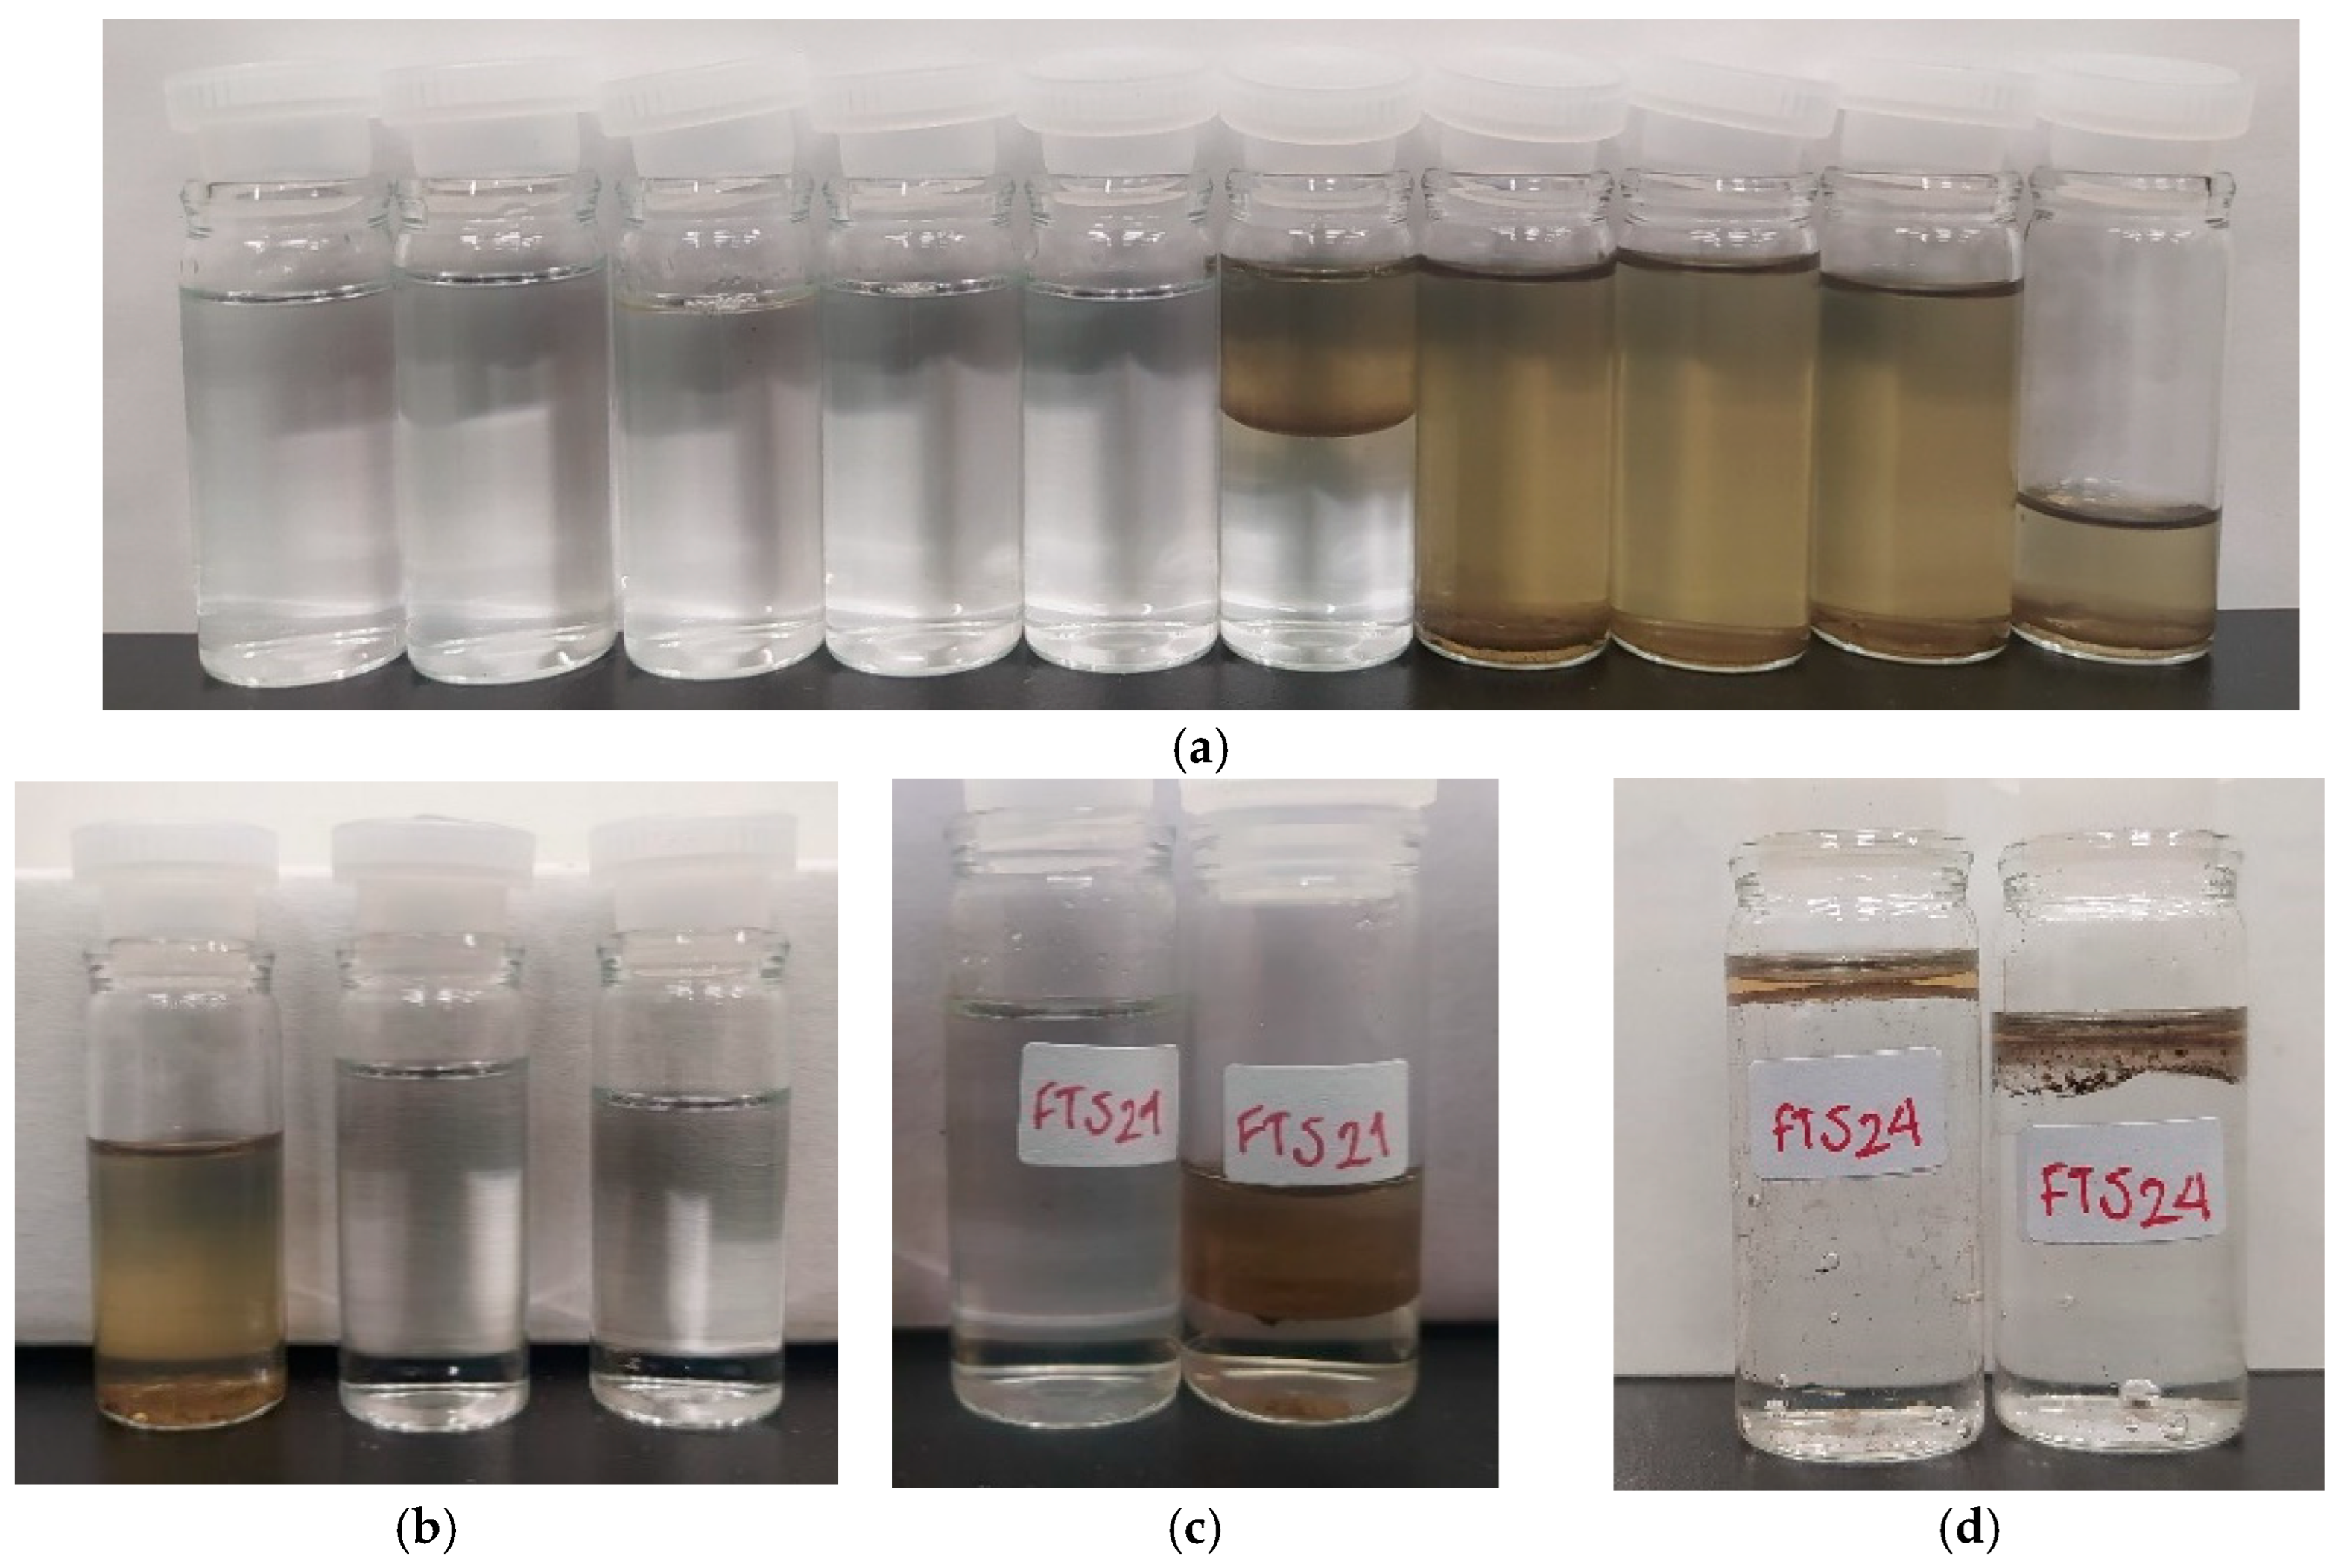
Figure 7 shows the liquid products obtained from the FTS reaction with different H2:CO ratios. It is evident that the Fe foam activity increased for the FTS and WGS. The aqueous by-product phase contained oxygenated compounds that, with the water, could potentially be used as an added-value residue [82].

3.3. Product Analysis

To characterize the liquid products of the FTS process, the density and pH were measured as well as and carried out an elemental analysis of the oil phase. The oxygenates present in the water phase were identified by high-performance liquid chromatography (HPLC), and the hydrocarbon content in the organic phase was determined by a gas chromatography-mass–mass spectrometry (GC-MS) analysis. These analysis were performed for experiments with the lowest H2:CO ratios (1.2 and 1.6).
Table 4 shows the density and pH values of the water and hydrocarbon produced from the FTS reaction using hydrogen-deficient syngas. The density of the oil phase indicated that these products are in the gasoline/diesel range. Meanwhile, the pH suggested that the aqueous phase contains a significant amount of oxygenates. This was confirmed by the HPLC analysis of the samples which are summarized in Table 5. It has been reported that a low H2/CO ratio improves the oxygenate formation through the WGS, and CO-derived intermediates can react with water to generate acetic acid and ethanol [83].
Table 6 presents the result of the elemental analysis of the oil phase. The C/H ratio is consistent with the linear hydrocarbon compounds [84].
According to Table 5, ethanol and acetic acid were the dominant components in the aqueous phase, which aligns with the partial oxidation at a low H2/CO ratio [66]. The elemental analysis of the oil phase presented in Table 6 indicates a decreasing oxygen content at higher H2/CO ratios, demonstrating the purity of the hydrocarbon.
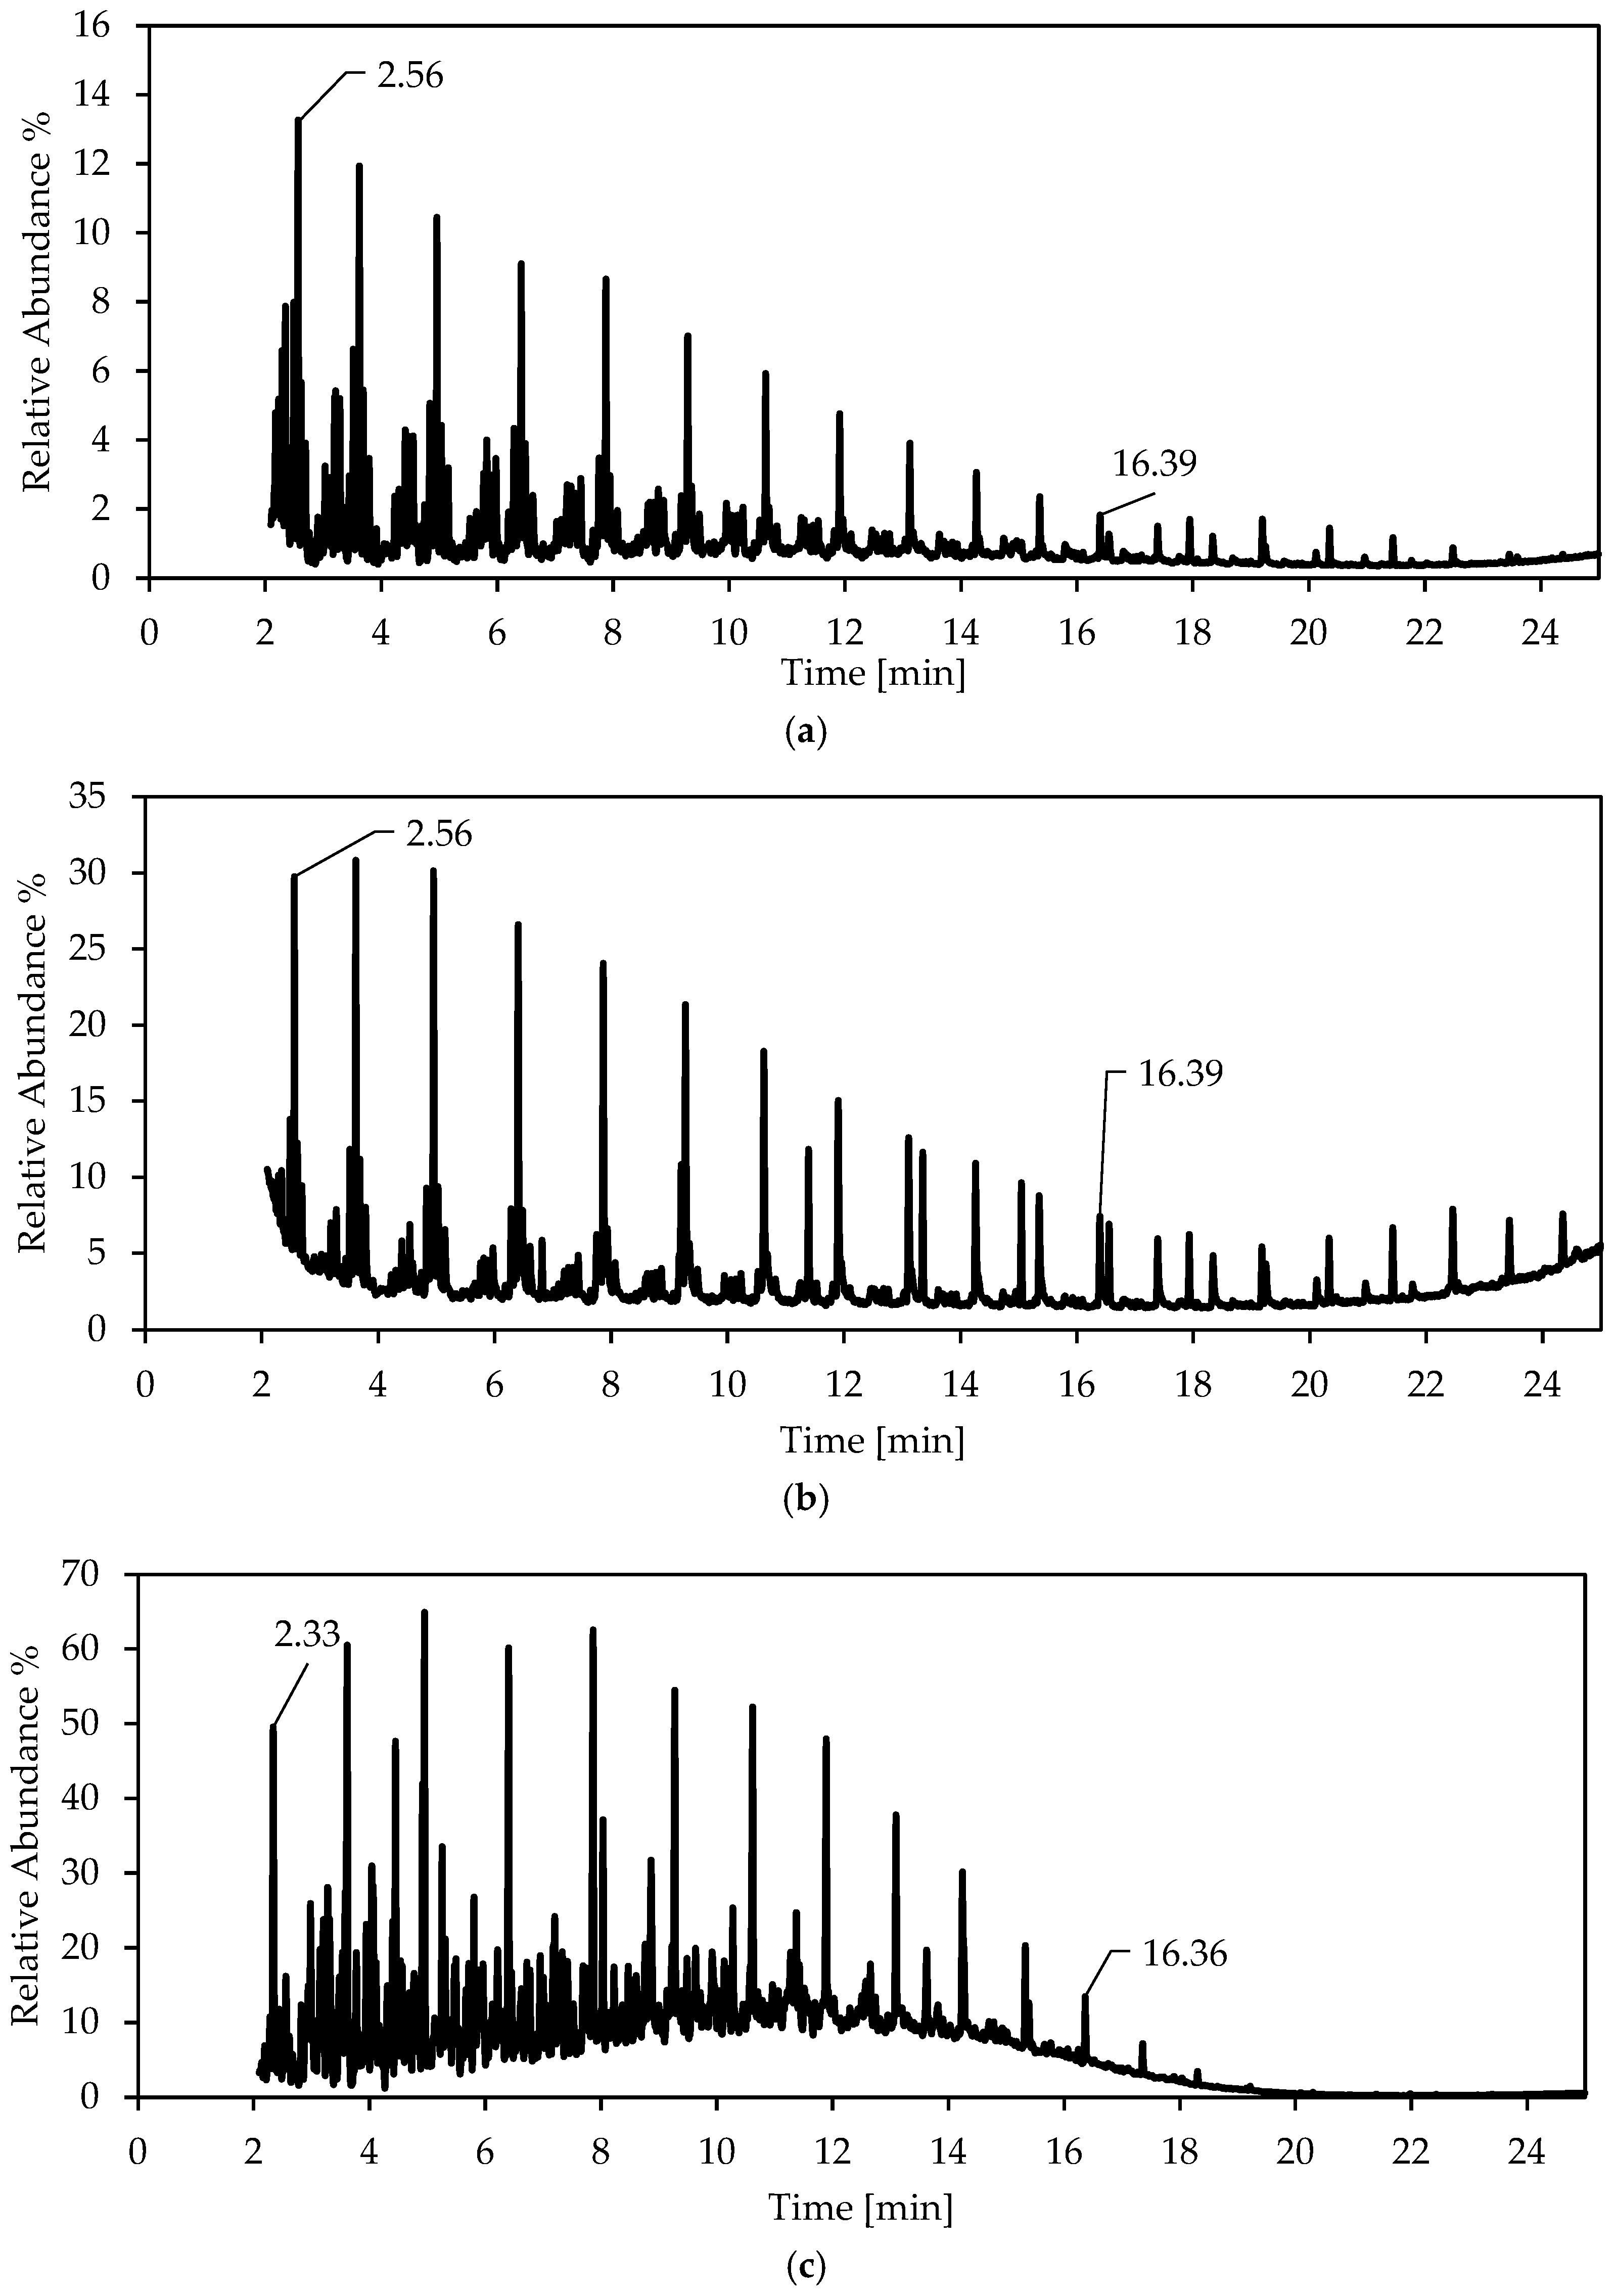
The GC-MS analysis was carried out to identify the hydrocarbons. The GC-MS was run in TIC mode. Chromatograms and MS data were acquired simultaneously. The observed retention time and fragmentation pattern of each analyte were then compared to those of the diesel fuel obtained from a local gas station.
Figure 8 shows the chromatogram of the sample. Panel (a) corresponds to the organic sample with a syngas ratio of 1.2, and panel (b) corresponds to the organic sample with a syngas ratio of 1.6, while panel (c) shows the diesel standard. Relative ions and their abundance were verified using the instrument databases, NIST 23 (National Institute of Standards and Technology, version 2023), for compound identification [85]. The Fischer–Tropsch synthesis is not suited for internal standard since the components are either reaction products of the FTS that are reactive under process conditions or interfere with the signal of one or more products, making the interpretation of the GC-MS chromatogram complex. Nevertheless, diesel hydrocarbons typically contain 12–20 carbon atoms which provided a product range to target. Thus, the objective of this study was to determine whether the organic samples produced in this work contained paraffins within that range. Ultimately, it has been demonstrated that GC-MS was utilized to characterize FTS products by verifying the C12–C20 paraffins in the liquid. This approach aligns with the GC-MS product analysis in FTS studies, focusing on diesel could be in the hydrocarbon range [28,86].

4. Discussion

As shown in Section 3.2, the composition of the catalyst’s bulk phase changed significantly with the reduction in the temperature, which in turn affected the catalytic activity. Increasing the reduction temperature from 250 to 325 °C improved CO conversion from 16.1% to 36.2%. It also increased the active metallic phase for FTS reactions and reduced the number of surface defects due to sintering. However, more research would be needed to fully understand these phenomena, optimize sintering protocols, and investigate promoters such as Cu and K to stabilize the FeCx [78]. The particle size and reduction conditions influenced the formation and stability of Fe carbides, which are crucial for the FTS activity. Additionally, sintering at high temperatures decreased the Turnover Frequency (TOF), which could alter the selectivity. Iron foams lack promoters that would inhibit the sintering of oxide precursors or favor the nucleation of iron carbide crystals. From 330 °C to 600 °C, a reducibility peak could be observed, which can be attributed to the reduction of Fe2O3 to Fe3O4 (see Figure 5). Fe3O4 is the iron phase with a lower catalytic activity for FTS due to its size, as evidenced by its low catalytic activity (15% CO conversion) in this work.
At a lower reduction temperature of 325 °C, the CO binding sites were less likely to undergo sintering and thus, the catalyst activity is higher for all the reactions involved in the process. Since these are competing reactions, a higher conversion means a lower selectivity toward long-chain hydrocarbons and increased CO2 and CH4 production. The conversion increases by 5% when the reduction temperature was fixed at 250 °C, while the WHSV was decreased. The baseline for further experiments was set at 325 °C and at WHSV 600 h−1 because these conditions showed the best performance for the Fe foam so far. Decreasing the WHSV from 1200 h−1 to 600 h−1 increased the CO conversion mainly since it provided more residence time for the gas–catalyst interaction [59]. A comparison between Table 1 and Table 2 showed that increasing the residence time positively affected the activity. It has been reported that a higher residence time improves C2+ yields in Fe-based catalytic systems and is a key factor in the chain growth process. This supports the CO conversion improvement at lower WHSV [87].
As shown in Table 3, Fe foams can be used over a wide range of H2/CO ratios, including those found in synthesis gas streams produced from biomass. These streams often have low H2/CO ratios and produce more olefinic products with a lower CH4 selectivity than Co-based catalysts. Fe foams achieved higher conversions than tailor-made catalysts in a single pass with a typical bio-syngas composition [18,27,77]. Another study confirmed that Fe catalysts demonstrated suitable activity in low H2/CO ratios, a common feature for syngas produced from biomass [88]. The excellent performance of Fe foams as FTS catalysts is due to the uniform dispersion of the active components (FeCx and Fe2O3) on the catalytic bed, which was made possible by the open cellular structure of the catalyst. It has also been reported that structured Fe catalysts have distinct porosities and thermal properties [89]. Fe foams showed a better CO conversion and C5+ selectivity because of their better heat dissipation and open geometry, which led to less mass transfer limitations and preserved active FeCx [31], resulting in better carbonization and product selectivity. The conversion and selectivity, as a function of the ToS, present stable behavior after around 8 h of testing for all experiments.
The liquid product characterization is presented in Section 3.3, while Figure 8 shows the GC-MS chromatograms of the combustible products, which are mainly n-paraffins and α-olefins. In addition to these primary products, minor peaks of other reaction products, including internal olefins, branched alkanes, and linear alcohols, are present, though in relatively small amounts. The peak with the highest intensity ranges from C10 (RT = 2.5) to C21 (RT = 16.3). The similarity of panels (a) and (b) to panel (c) indicates that the hydrocarbons obtained through FTS using iron foams fall within the diesel range. It has been verified that using iron-based catalysts in FTS reactions can result in C10–C20 n-paraffin production under controlled conditions [90].

5. Conclusions

This study evaluated the feasibility of using a structured iron catalyst for Fischer–Tropsch synthesis (FTS) using a synthesis gas (syngas) feedstock representative of those derived from biomass. The iron foam catalyst was synthesized and tested under different reaction conditions. The results demonstrated the catalyst’s activity across different feed compositions and residence times. The maximum CO conversion achieved was 84.8% at a H2/CO ratio of 1.2, with a low CH4 selectivity (10.4%) and a C3+ selectivity reaching up to 89%. These results confirmed its strong performance under hydrogen-deficient conditions.
Compared to a conventional powder catalyst, the structured iron foam exhibited improved temperature control, enhanced activity, and reduced methane formation. These advantages stem from its open cellular geometry, which promotes efficient mass transfer due to the increased tortuosity and excellent thermal conductivity, minimizing hot spots across the catalyst bed. Despite its relatively low BET surface area (3 m2/g), the foam structure enabled the effective gas–solid contact and high catalytic efficiency. The characterization via the TPR and XRD confirmed that the reduction at 325 °C facilitated the FeCx formation without significant sintering, which correlated with the increased catalytic performance.
Using structured Fe catalysts also enhanced the single-pass conversion, which could simplify the process design and enable smaller reactor volumes. Maintaining a controlled WHSV is critical for performance and highlights its importance for scaling up processes from the laboratory to pilot or even industrial level.

6. Future Overview

Future work should focus on developing synthesis and activation protocols that inhibit the sintering of oxide precursors and favor the nucleation of small iron carbide crystals in structured catalysts. This would allow for the direct comparison of turnover rates of FTS on iron and cobalt catalysts with similar crystal sizes.

Author Contributions

Conceptualization, J.-M.L. and Y.V.H.; methodology, Y.V.H.; validation, J.-M.L., Y.V.H. and E.L.d.B.N.; formal analysis, Y.V.H.; investigation, Y.V.H.; resources, Y.V.H.; data curation, Y.V.H.; writing—original draft preparation, Y.V.H.; writing—review and editing, J.-M.L. and G.A.; visualization, Y.V.H.; supervision, J.-M.L.; project administration, J.-M.L.; funding acquisition, Canadian New Frontiers in Research Fund, and Canadian Fond de recherche Société et culture—Québec. All authors have read and agreed to the published version of the manuscript.

Funding

This research was funded by the Canadian New Frontiers in Research Fund, under grant number NFRFG-2020-00148, and the Canadian Fond de recherche Société et culture—Québec, under grant number 308509.

Data Availability Statement

Available upon request.

Acknowledgments

The authors are grateful to the Biomass Technology Laboratory (BTL) and especially its sponsors. Further acknowledgments go to the Biomass, Bioproducts, and Bioprocess Analysis Laboratory (L.A.B.) for its support regarding the HPLC analysis. Finally, the authors would like to thank Henry Gauvin (BTL) for his help in building the experimental setup of this work and Valérie Larouche (Université de Sherbrooke)for her assistance with the GC-MS analysis.

Conflicts of Interest

The authors declare no conflicts of interest.

References

  1. Hurtado, Y.V.H. Development of a Structured Iron-Based Catalyst for Fischer–Tropsch Synthesis Using Bio-Syngas. Ph.D. Thesis, University of Sherbrooke, Sherbrooke, QC, Canada, 2023. Available online: http://hdl.handle.net/11143/21724 (accessed on 12 July 2021).
  2. BP. Energy Use by Sector. Available online: https://www.bp.com/content/dam/bp/business-sites/en/global/corporate/pdfs/energy-economics/energy-outlook/bp-energy-outlook-2024.pdf (accessed on 12 July 2021).
  3. International Energy Agency. World Energy Balances 2019; OECD Publishing: Paris, France, 2019. [Google Scholar] [CrossRef]
  4. Our World in Data. Energy Production and Consumption. Available online: https://ourworldindata.org/energy-production-consumption (accessed on 12 July 2021).
  5. IEA. EIA Projects Nearly 50% Increase in World Energy Usage by 2050, Led by Growth in Asia. Available online: https://www.eia.gov/todayinenergy/detail.php?id=41433 (accessed on 6 March 2021).
  6. Canada Energy Regulator. Provincial and Territorial Energy Profiles–Canada. Available online: https://www.cer-rec.gc.ca/en/data-analysis/energy-markets/provincial-territorial-energy-profiles/provincial-territorial-energy-profiles-canada.html (accessed on 12 July 2021).
  7. Government of Canada. Greenhouse Gas Emissions: Drivers and Impacts. Available online: https://www.canada.ca/en/environment-climate-change/services/environmental-indicators/greenhouse-gas-emissions-drivers-impacts.html (accessed on 12 July 2021).
  8. IEA. Global Energy Review: CO2 Emissions in 2020. 2021. Available online: https://www.iea.org/articles/global-energy-review-co2-emissions-in-2020 (accessed on 2 March 2021).
  9. dos Santos, R.G.; Alencar, A.C. Biomass-derived syngas production via gasification process and its catalytic conversion into fuels by Fischer Tropsch synthesis: A review. Int. J. Hydrogen. Energy 2020, 45, 18114–18132. [Google Scholar] [CrossRef]
  10. Government of Canada. Renewable Fuels Regulations. 2020. Available online: https://www.canada.ca/en/environment-climate-change/services/managing-pollution/energy-production/fuel-regulations/renewable.html (accessed on 4 October 2021).
  11. Government of Canada. Energy and the Economy. 2021. Available online: https://natural-resources.canada.ca/science-data/data-analysis/sources-energy-information (accessed on 4 February 2025).
  12. Renewable Industries Canada. Fuelling a Way Forward. 2021. Available online: https://ricanada.org/ (accessed on 4 October 2021).
  13. Commit. European Union: Energy System Restructuring Towards a Long-Term Lowemission Pathway. 2021. Available online: https://unfccc.int/sites/default/files/resource/365_COMMIT%20Fact%20Sheet%20EU%20-%20a%20long-term%20low-emission%20pathway.pdf (accessed on 12 July 2021).
  14. Benedetti, V.; Ail, S.S.; Patuzzi, F.; Cristofori, D.; Rauch, R.; Baratieri, M. Investigating the feasibility of valorizing residual char from biomass gasification as catalyst support in Fischer-Tropsch synthesis. Renew. Energy 2020, 147, 884–894. [Google Scholar] [CrossRef]
  15. Lappas, A.; Heracleous, E. Production of biofuels via Fischer–Tropsch synthesis: Biomass-to-liquids. In Handbook of Biofuels Production; Elsevier: Amsterdam, The Netherlands, 2016; pp. 549–593. [Google Scholar]
  16. Ail, S.S.; Dasappa, S. Biomass to liquid transportation fuel via Fischer Tropsch synthesis–Technology review and current sce-nario. Renew. Sustain. Energy Rev. 2016, 58, 267–286. [Google Scholar] [CrossRef]
  17. Schulz, H. Short history and present trends of Fischer–Tropsch synthesis. Appl. Catal. A Gen. 1999, 186, 3–12. [Google Scholar] [CrossRef]
  18. Demirbas, A. Converting biomass derived synthetic gas to fuels via Fisher-Tropsch synthesis. Energy Sources Part A Recovery Util. Environ. Eff. 2007, 29, 1507–1512. [Google Scholar] [CrossRef]
  19. Davis, B.H. Fischer–Tropsch synthesis: Current mechanism and futuristic needs. Fuel Process. Technol. 2001, 71, 157–166. [Google Scholar] [CrossRef]
  20. Davis, B.H. Fischer–Tropsch synthesis: Overview of reactor development and future potentialities. Top. Catal. 2005, 32, 143–168. [Google Scholar] [CrossRef]
  21. Bezemer, G.L.; Bitter, J.H.; Kuipers, H.P.; Oosterbeek, H.; Holewijn, J.E.; Xu, X.; Kapteijn, F.; Van Dillen, A.J.; de Jong, K.P. Cobalt particle size effects in the Fischer−Tropsch reaction studied with carbon nanofiber supported catalysts. J. Am. Chem. Soc. 2006, 128, 3956–3964. [Google Scholar] [CrossRef]
  22. Bezemer, G.L.; Radstake, P.; Falke, U.; Oosterbeek, H.; Kuipers, H.; Van Dillen, A.; De Jong, K. Investigation of promoter effects of manganese oxide on carbon nanofiber-supported cobalt catalysts for Fischer–Tropsch synthesis. J. Catal. 2006, 237, 152–161. [Google Scholar] [CrossRef]
  23. Tu, J. Development of Catalysts for Biofuels Production from Biomass via Fischer-Tropsch Synthesis. Adv. New Renew. Energy 2014, 2, 94–103. [Google Scholar]
  24. Sharma, P.; Elder, T.; Groom, L.H.; Spivey, J.J. Effect of structural promoters on Fe-based Fischer–Tropsch synthesis of biomass derived syngas. Top. Catal. 2014, 57, 526–537. [Google Scholar] [CrossRef]
  25. Chun, D.H.; Park, J.C.; Hong, S.Y.; Lim, J.T.; Kim, C.S.; Lee, H.T.; Yang, J.-I.; Hong, S.J.; Jung, H. Highly selective iron-based Fischer–Tropsch catalysts activated by CO2-containing syngas. J. Catal. 2014, 317, 135–143. [Google Scholar] [CrossRef]
  26. Zhu, J.; Liu, H.; Ning, W.; Wu, Y. Performance of fused-iron catalyst in Fischer-Tropsch synthesis in slurry reactor. Petrochem. Technol. 2009, 38, 593–597. [Google Scholar]
  27. Luque, R.; de la Osa, A.R.; Campelo, J.M.; Romero, A.A.; Valverde, J.L.; Sanchez, P. Design and development of catalysts for Biomass-To-Liquid-Fischer–Tropsch (BTL-FT) processes for biofuels production. Energy Environ. Sci. 2012, 5, 5186–5202. [Google Scholar] [CrossRef]
  28. Zhang, S. Production of Transportation Fuel Range Middle Distillates via Fischer-Tropsch Synthesis with Integrated Product Upgrading Under Supercritical Phase Conditions. Ph.D. Thesis, Auburn University, Auburn, AL, USA, 2013. [Google Scholar]
  29. Dry, M.E. High quality diesel via the Fischer–Tropsch process—A review. J. Chem. Technol. Biotechnol. Int. Res. Process Environ. Clean Technol. 2002, 77, 43–50. [Google Scholar] [CrossRef]
  30. Dry, M.E. The fischer–tropsch process: 1950–2000. Catal. Today 2002, 71, 227–241. [Google Scholar] [CrossRef]
  31. Chun, D.H.; Rhim, G.B.; Youn, M.H.; Deviana, D.; Lee, J.E.; Park, J.C.; Jeong, H. Brief review of precipitated iron-based catalysts for low-temperature fischer–tropsch synthesis. Top. Catal. 2020, 63, 793–809. [Google Scholar] [CrossRef]
  32. Shafer, W.D.; Gnanamani, M.K.; Graham, U.M.; Yang, J.; Masuku, C.M.; Jacobs, G.; Davis, B.H. Fischer–Tropsch: Product selectivity–the fingerprint of synthetic fuels. Catalysts 2019, 9, 259. [Google Scholar] [CrossRef]
  33. Rauch, R.; Kiennemann, A.; Sauciuc, A. Fischer-Tropsch synthesis to biofuels (BtL process). In The Role of Catalysis for the Sustainable Production of Bio-Fuels and Bio-Chemicals; Elsevier: Amsterdam, The Netherlands, 2013; pp. 397–443. [Google Scholar]
  34. Guettel, R.; Kunz, U.; Turek, T. Reactors for Fischer-Tropsch Synthesis. Chem. Eng. Technol. Ind. Chem. Plant Equip. Process Eng. Biotechnol. 2008, 31, 746–754. [Google Scholar] [CrossRef]
  35. Parra-Cabrera, C.; Achille, C.; Kuhn, S.; Ameloot, R. 3D printing in chemical engineering and catalytic technology: Structured catalysts, mixers and reactors. Chem. Soc. Rev. 2018, 47, 209–230. [Google Scholar] [CrossRef] [PubMed]
  36. Harmel, J.; Peres, L.; Estrader, M.; Berliet, A.; Maury, S.; Fécant, A.; Chaudret, B.; Serp, P.; Soulantica, K. hcp-Co Nanowires Grown on Metallic Foams as Catalysts for Fischer-Tropsch Synthesis. Angew. Chem. 2018, 130, 10739–10743. [Google Scholar] [CrossRef]
  37. Park, J.C.; Roh, N.S.; Chun, D.H.; Jung, H.; Yang, J.-I. Cobalt catalyst coated metallic foam and heat-exchanger type reactor for Fischer–Tropsch synthesis. Fuel Process. Technol. 2014, 119, 60–66. [Google Scholar] [CrossRef]
  38. Hilmen, A.-M.; Bergene, E.; Lindvåg, O.; Schanke, D.; Eri, S.; Holmen, A. Fischer–Tropsch synthesis on monolithic catalysts of different materials. Catal. Today 2001, 69, 227–232. [Google Scholar] [CrossRef]
  39. Tronconi, E.; Groppi, G.; Visconti, C.G. Structured catalysts for non-adiabatic applications. Curr. Opin. Chem. Eng. 2014, 5, 55–67. [Google Scholar] [CrossRef]
  40. Visconti, C.G.; Tronconi, E.; Lietti, L.; Groppi, G.; Forzatti, P.; Cristiani, C.; Zennaro, R.; Rossini, S. An experimental investiga-tion of Fischer–Tropsch synthesis over washcoated metallic structured supports. Appl. Catal. A Gen. 2009, 370, 93–101. [Google Scholar] [CrossRef]
  41. Visconti, C.G.; Tronconi, E.; Groppi, G.; Lietti, L.; Iovane, M.; Rossini, S.; Zennaro, R. Monolithic catalysts with high thermal conductivity for the Fischer–Tropsch synthesis in tubular reactors. Chem. Eng. J. 2011, 171, 1294–1307. [Google Scholar] [CrossRef]
  42. Visconti, C.G.; Groppi, G.; Tronconi, E. Highly conductive “packed foams”: A new concept for the intensification of strongly endo-and exo-thermic catalytic processes in compact tubular reactors. Catal. Today 2016, 273, 178–186. [Google Scholar] [CrossRef]
  43. Liu, W.; Wang, Y.; Wilcox, W.; Li, S. A compact and high throughput reactor of monolithic-structured catalyst bed for con-version of syngas to liquid fuels. AIChE J. 2012, 58, 2820–2829. [Google Scholar] [CrossRef]
  44. Mehariya, S.; Iovine, A.; Casella, P.; Musmarra, D.; Figoli, A.; Marino, T.; Sharma, N.; Molino, A. Fischer–Tropsch synthesis of syngas to liquid hydrocarbons. In Lignocellulosic Biomass to Liquid Biofuels; Elsevier: Amsterdam, The Netherlands, 2020; pp. 217–248. [Google Scholar]
  45. Mai, K.; Elder, T.; Groom, L.H.; Spivey, J.J. Fe-based Fischer Tropsch synthesis of biomass-derived syngas: Effect of synthesis method. Catal. Commun. 2015, 65, 76–80. [Google Scholar] [CrossRef]
  46. Xue, Y.; Duan, S.; Chen, G.; Sun, J.; Abbas, M.; Chen, J. Effect of annealing atmosphere on Fischer-Tropsch synthesis perfor-mance of Fe/Fe foam structured catalyst. Fuel 2020, 262, 116570. [Google Scholar] [CrossRef]
  47. Feng, Y.; Fornell, J.; Zhang, H.; Solsona, P.; Barό, M.D.; Suriñach, S.; Pellicer, E.; Sort, J. Synthesis of α-Fe2O3 and Fe-Mn oxide foams with highly tunable magnetic properties by the replication method from polyurethane templates. Materials 2018, 11, 280. [Google Scholar] [CrossRef]
  48. Choi, J.H.; Yang, S.; Kim, Y.D.; Yun, J.Y. The effect of binder content for the pore properties of Fe foam fabricated by slurry coating process. J. Powder Mater. 2013, 20, 439–444. [Google Scholar] [CrossRef]
  49. Noor, F.M.; Bakar, M.I.A.; Mohamad, Z.; Ismail, A.E.; Ismon, M.; Ahmad, S.; Ismail, A.; Wahab, H.A.; Main, N.M.; Sanusi, S.H. Composition and type of a binder effects on the stainless steel foam microstructure prepared by sponge replication method. Int. J. Integr. Eng. 2019, 11, 90–94. [Google Scholar]
  50. Yeetsorn, R.; Tungkamani, S.; Maiket, Y. Fabrication of a ceramic Foam Catalyst using polymer foam scrap via the Replica technique for dry reforming. ACS Omega 2022, 7, 4202–4213. [Google Scholar] [CrossRef] [PubMed]
  51. Yun, J.Y.; Park, D.H.; Wang, J.P. A Study on the Effect of Binder Content for Pore Property of Fe Foam Using Slurry Coating Method. In Advanced Materials Research; Trans Tech Publications, Ltd.: Bäch, Switzerland, 2015; Volume 1125, pp. 136–142. [Google Scholar] [CrossRef]
  52. ASTM D3663; Standard Test Method for Surface Area of Catalysts and Catalyst Carriers. ASTM International: West Conshohocken, PA, USA, 2020.
  53. ASTM D3906; Standard Test Method for Determination of Relative X-ray Diffraction Intensities of Faujasite-Type Zeo-lite-Containing Materials. ASTM International: West Conshohocken, PA, USA, 2017.
  54. Wan, H.; Wu, B.; An, X.; Tao, Z.; Li, T.; Xiang, H.; Li, Y. Structural properties, reduction and carburization behaviors of Fe/Cu/K/Al2O3 catalyst for Fischer-Tropsch synthesis. Acta Phys. Chim. Sin. 2007, 23, 1151–1156. [Google Scholar] [CrossRef]
  55. ASTM D1946; Standard Practice for Analysis of Reformed Gas by Gas Chromatography. ASTM International: West Conshohocken, PA, USA, 2019.
  56. ASTM D2163; Standard Test Method for Determination of Hydrocarbons in Liquefied Petroleum (LP) Gases and Pro-pane/Propene Mixtures by Gas Chromatography. ASTM International: West Conshohocken, PA, USA, 2019.
  57. ASTM D6730; Standard Test Method for Determination of Individual Components in Spark Ignition Engine Fuels by 100-Metre Capillary (with Precolumn) High-Resolution Gas Chromatography. ASTM International: West Conshohocken, PA, USA, 2022.
  58. ASTM D5501; Standard Test Method for Determination of Ethanol and Methanol Content in Fuels Containing Greater than 20% Ethanol by Gas Chromatography. ASTM International: West Conshohocken, PA, USA, 2025.
  59. Cheng, X.; Yang, H.; Tatarchuk, B.J. Microfibrous entrapped hybrid iron-based catalysts for Fischer–Tropsch synthesis. Catal. Today 2016, 273, 62–71. [Google Scholar] [CrossRef]
  60. Quadbeck, P.; Kümmel, K.; Hauser, R.; Standke, G.; Adler, J.; Stephani, G. Open cell metal foams-application-oriented structure and material selection. In Proceedings of the CELLMAT 2010, Dresden, Germany, 27–29 October 2010. [Google Scholar]
  61. Sutygina, A.; Betke, U.; Hasemann, G.; Scheffler, M. Manufacturing of Open-Cell Metal Foams by the Sponge Replication Technique. In IOP Conference Series: Materials Science and Engineering; IOP Publishing: Bristol, UK, 2020; Volume 882, p. 012022. [Google Scholar]
  62. Sutygina, A.; Betke, U.; Scheffler, M. Open-Cell Aluminum Foams by the Sponge Replication Technique: A Starting Powder Particle Study. Adv. Eng. Mater. 2020, 22, 1901194. [Google Scholar] [CrossRef]
  63. Sutygina, A.; Betke, U.; Scheffler, M. Hierarchical-Porous Copper Foams by a Combination of Sponge Replication and Freezing Techniques. Adv. Eng. Mater. 2022, 24, 2001516. [Google Scholar] [CrossRef]
  64. Vita, A.; Italiano, C.; Pino, L.; Laganà, M.; Ferraro, M.; Antonucci, V. High-temperature CO2 methanation over structured Ni/GDC catalysts: Performance and scale-up for Power-to-Gas application. Fuel Process. Technol. 2020, 202, 106365. [Google Scholar] [CrossRef]
  65. Giani, L.; Groppi, G.; Tronconi, E. Mass-transfer characterization of metallic foams as supports for structured catalysts. Ind. Eng. Chem. Res. 2005, 44, 4993–5002. [Google Scholar] [CrossRef]
  66. Cruz, M.G.; Bastos-Neto, M.; Oliveira, A.C.; M Filho, J.; Soares, J.M.; Rodriguez-Castellon, E.; Fernandes, F.A. On the structural, textural and morphological features of Fe-based catalysts supported on polystyrene mesoporous carbon for Fischer–Tropsch synthesis. Appl. Catal. A Gen. 2015, 495, 72–83. [Google Scholar] [CrossRef]
  67. Giani, L.; Groppi, G.; Tronconi, E. Heat transfer characterization of metallic foams. Ind. Eng. Chem. Res. 2005, 44, 9078–9085. [Google Scholar] [CrossRef]
  68. Giani, L.; Cristiani, C.; Groppi, G.; Tronconi, E. Washcoating method for Pd/γ-Al2O3 deposition on metallic foams. Appl. Catal. B Environ. 2006, 62, 121–131. [Google Scholar] [CrossRef]
  69. Wu, B.; Tian, L.; Xiang, H.; Zhang, Z.; Li, Y.W. Novel precipitated iron Fischer–Tropsch catalysts with Fe3O4 coexisting with α-Fe2O3. Catal. Lett. 2005, 102, 211–218. [Google Scholar] [CrossRef]
  70. Hu, J.; Yu, F.; Lu, Y. Application of Fischer–Tropsch synthesis in biomass to liquid conversion. Catalysts 2012, 2, 303–326. [Google Scholar] [CrossRef]
  71. Jin, Y.; Datye, A.K. Phase transformations in iron Fischer–Tropsch catalysts during temperature-programmed reduction. J. Catal. 2000, 196, 8–17. [Google Scholar] [CrossRef]
  72. Liu, J.-X.; Wang, P.; Xu, W.; Hensen, E.J. Particle size and crystal phase effects in Fischer-Tropsch catalysts. Engineering 2017, 3, 467–476. [Google Scholar] [CrossRef]
  73. Chun, D.H.; Park, J.C.; Rhim, G.B.; Lee, H.T.; Yang, J.I.; Hong, S.; Jung, H. Nanocrystalline ferrihydrite-based catalysts for Fischer-Tropsch synthesis: Part I. Reduction and carburization behavior. J. Nanosci. Nanotechnol. 2016, 16, 1660–1664. [Google Scholar] [CrossRef]
  74. Davis, B.H.; Occelli, M.L. Advances in Fischer-Tropsch Synthesis, Catalysts, and Catalysis; CRC Press: Boca Raton, FL, USA, 2009. [Google Scholar]
  75. Davis, B.H. Fischer–Tropsch synthesis: Reaction mechanisms for iron catalysts. Catal. Today 2009, 141, 25–33. [Google Scholar] [CrossRef]
  76. Banville, M.; Lee, R.; Labrecque, R.; Lavoie, J. Interaction of CO2/CH4 with steel WOOl in an electrocatalytic dry re-forming reactor. Energy Sust. IV 2013, 176, 17. [Google Scholar]
  77. Van Steen, E.; Prinsloo, F.F. Comparison of preparation methods for carbon nanotubes supported iron Fischer–Tropsch catalysts. Catal. Today 2002, 71, 327–334. [Google Scholar] [CrossRef]
  78. Li, S.; Li, A.; Krishnamoorthy, S.; Iglesia, E. Effects of Zn, Cu, and K promoters on the structure and on the reduction, carburization, and catalytic behavior of iron-based Fischer–Tropsch synthesis catalysts. Catal. Lett. 2001, 77, 197–205. [Google Scholar] [CrossRef]
  79. Espinoza, R.; Steynberg, A.; Jager, B.; Vosloo, A. Low temperature Fischer–Tropsch synthesis from a Sasol perspective. Appl. Catal. A Gen. 1999, 186, 13–26. [Google Scholar] [CrossRef]
  80. Jager, B.; Espinoza, R. Advances in low temperature Fischer-Tropsch synthesis. Catal. Today 1995, 23, 17–28. [Google Scholar] [CrossRef]
  81. Liu, K.; Suo, H.; Zhang, C.; Xu, J.; Yang, Y.; Xiang, H.; Li, Y. An active Fischer–Tropsch synthesis FeMo/SiO2 catalyst prepared by a modified sol–gel technique. Catal. Commun. 2010, 12, 137–141. [Google Scholar] [CrossRef]
  82. Zoppi, G.; Pipitone, G.; Gruber, H.; Weber, G.; Reichhold, A.; Pirone, R.; Bensaid, S. Aqueous phase reforming of pilot-scale Fischer-Tropsch water effluent for sustainable hydrogen production. Catal. Today 2021, 367, 239–247. [Google Scholar] [CrossRef]
  83. Krishnamoorthy, S.; Li, A.; Iglesia, E. Pathways for CO2 formation and conversion during Fischer–Tropsch synthesis on iron-based catalysts. Catal. Lett. 2002, 80, 77–86. [Google Scholar] [CrossRef]
  84. Lim, D.-H.; Jo, J.H.; Shin, D.Y.; Wilcox, J.; Ham, H.C.; Nam, S.W. Carbon dioxide conversion into hydrocarbon fuels on defective graphene-supported Cu nanoparticles from first principles. Nanoscale 2014, 6, 5087–5092. [Google Scholar] [CrossRef] [PubMed]
  85. NIST/EPA/NIH Mass Spectral Library with Search Program (NIST 23); National Institute of Standards and Technology: Gaithersburg, MD, USA, 2023.
  86. Dunn, B.C.; Cole, P.; Covington, D.J.; Heider, E.C.; Gasser, J.; Eyring, E.M.; Meuzelaar, H.L.; Pugmire, R.J. Fischer-Tropsch catalysts supported on sol-gel-derived silica. In Abstracts of Papers of the American Chemical Society; 1155 16TH ST, NW; American Chemical Society: Washington, DC, USA, 2003; Volume 225, p. U858. [Google Scholar]
  87. Karakaya, C.; White, E.; Jennings, D.; Kidder, M.; Deutschmann, O.; Kee, R.J. CO2 hydrogenation to hydrocarbons over Fe/BZY catalysts. ChemCatChem 2022, 14, e202200802. [Google Scholar] [CrossRef]
  88. Chernavskii, P.A.; Zaikovskii, V.I.; Pankina, G.V.; Khodakov, A.Y. Dimensional effects in the carbidization of supported iron nanoparticles. ChemCatChem 2013, 5, 1758–1761. [Google Scholar] [CrossRef]
  89. Oschatz, M.; van Deelen, T.W.; Weber, J.L.; Lamme, W.S.; Wang, G.; Goderis, B.; Verkinderen, O.; Dugulan, A.I.; De Jong, K.P. Effects of calcination and activation conditions on ordered mesoporous carbon supported iron catalysts for production of lower olefins from synthesis gas. Catal. Sci. Technol. 2016, 6, 8464–8473. [Google Scholar] [CrossRef]
  90. Durham, E.; Zhang, S.; Roberts, C. Diesel-length aldehydes and ketones via supercritical Fischer Tropsch Synthesis on an iron catalyst. Appl. Catal. A Gen. 2010, 386, 65–73. [Google Scholar] [CrossRef]
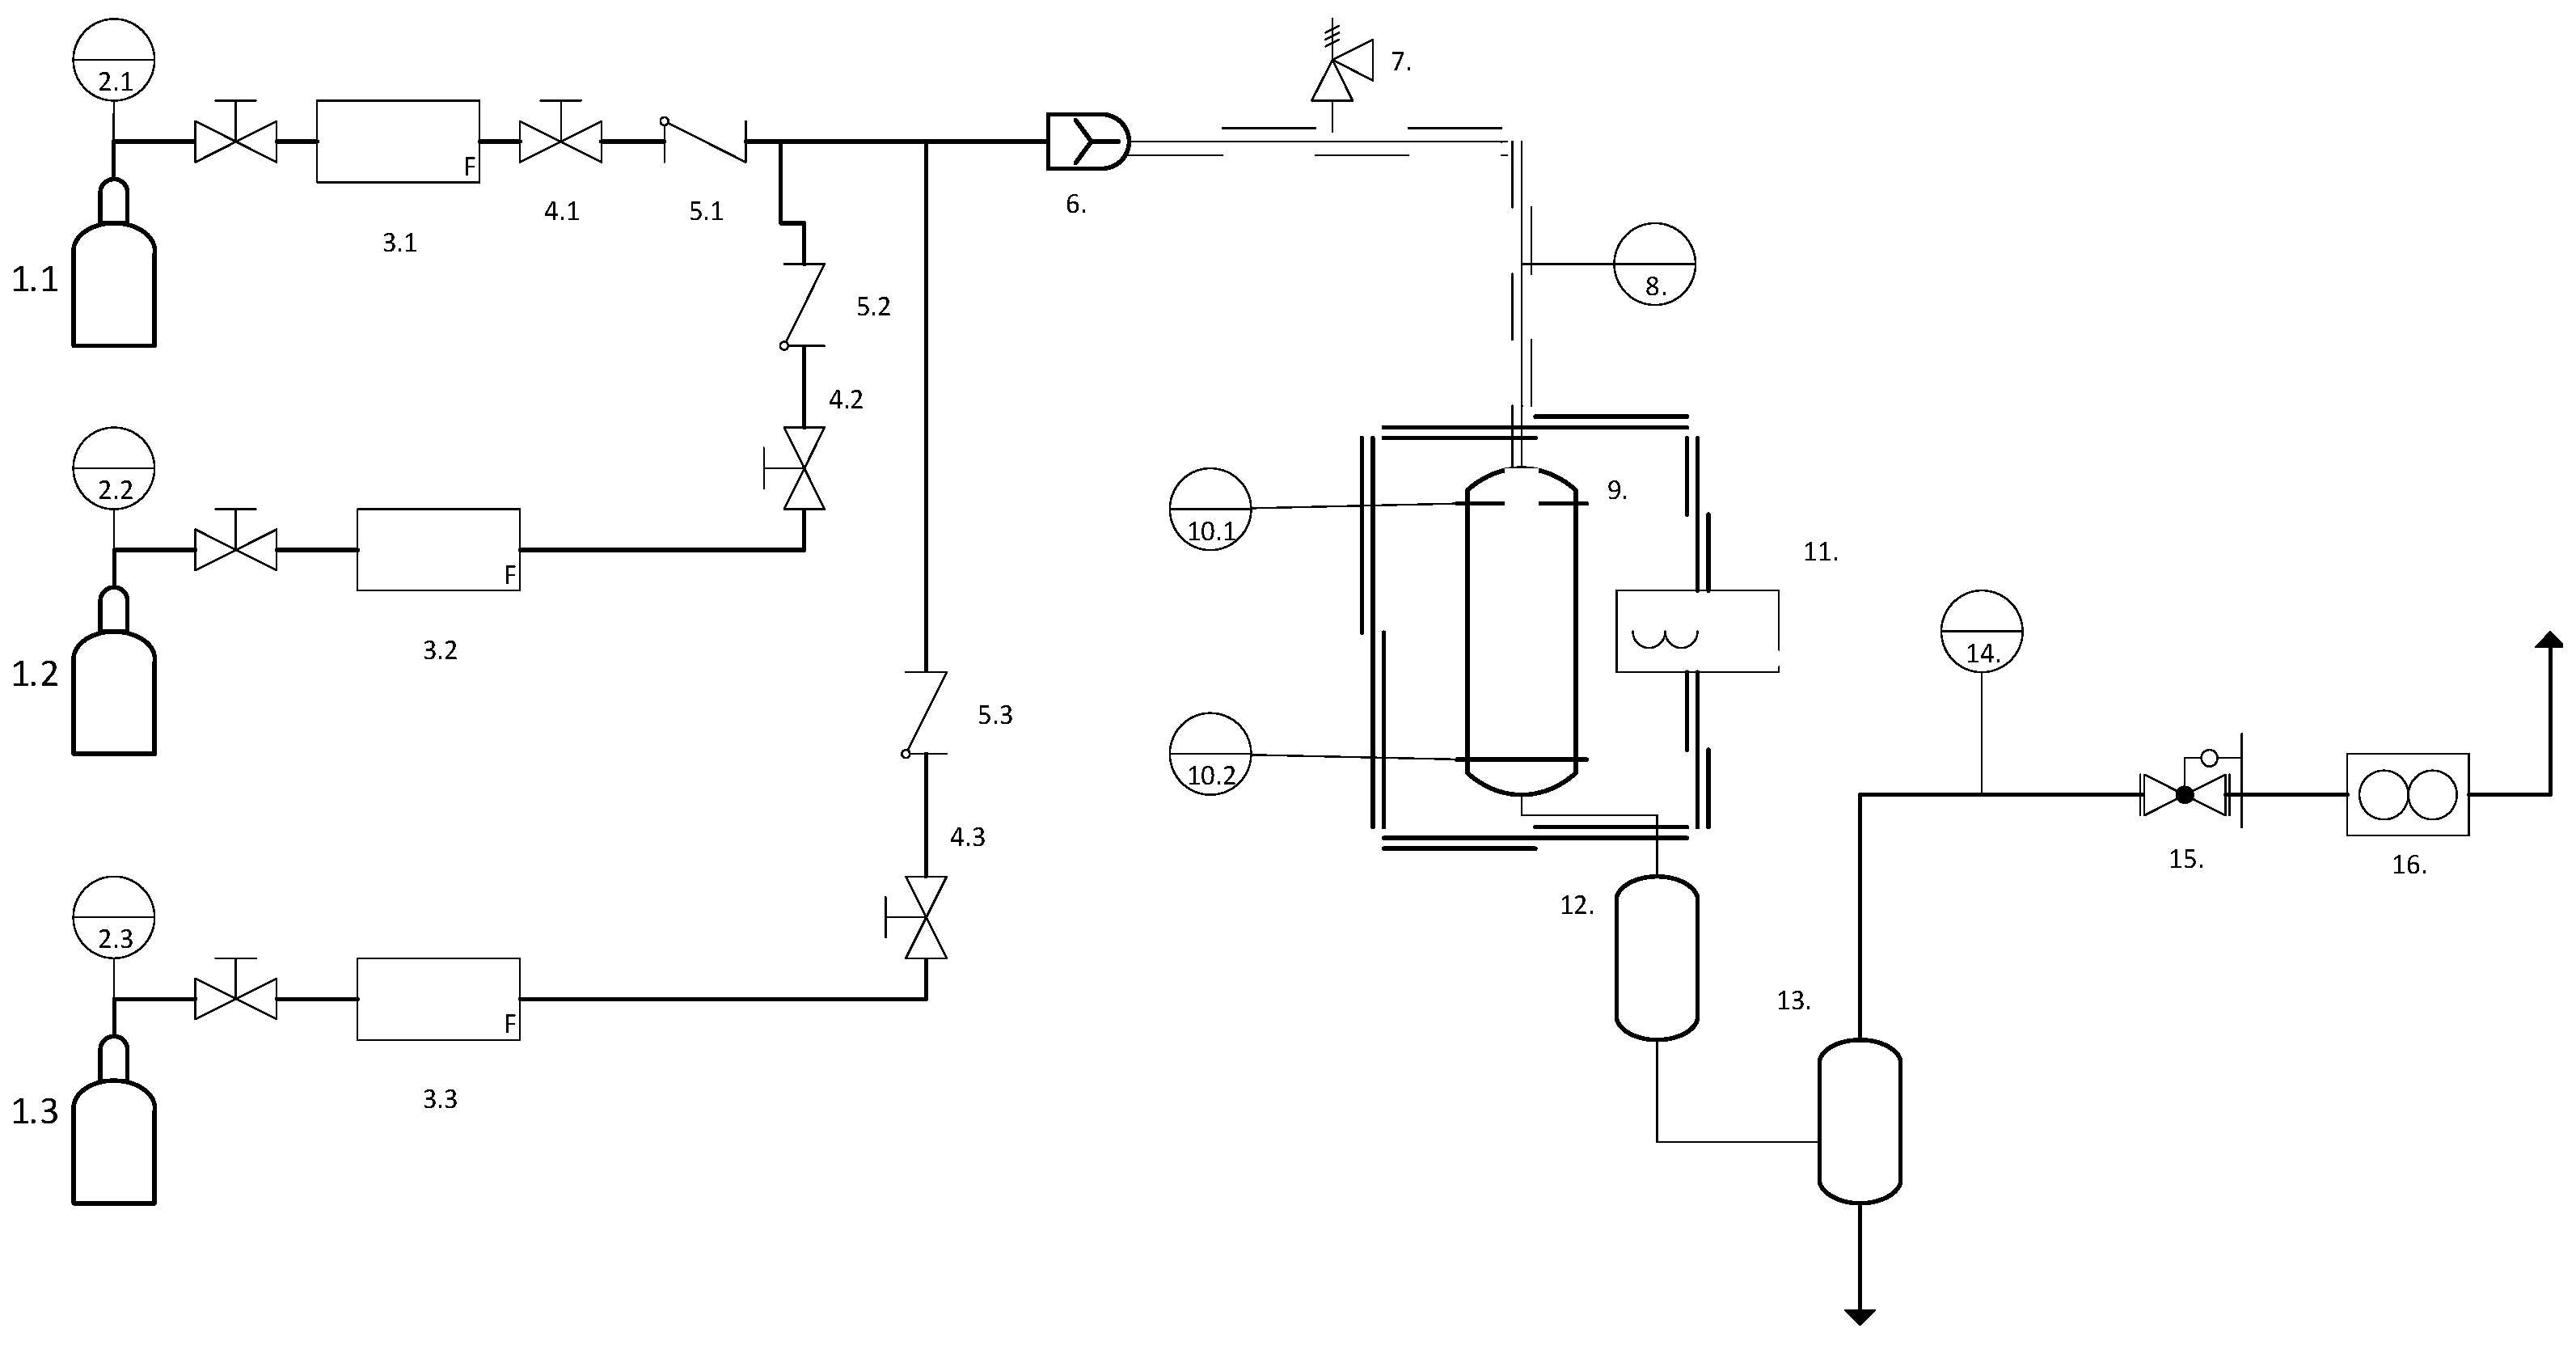
Figure 1. Simplified flow diagram for Fisher–Tropsch reactor and peripheral components. 1.1–1.3 Gas cylinders; 2.1–2.3 pressure regulators; 3.1–3.3, mass flow controllers (F); 4.1–4.3 valves; 5.1–5.3 check valve; 6. pressure gauge; 7. relief valve; 8. bypass valve; 9. tube and shell catalytic reactor; 10.1–10.2 temperature sensors; 11. oven; 12. separation column (hot trap); 13. separation column (cold trap); 14. pressure gauge; 15. backpressure regulator; and 16. gas flow counter.
Fuels 06 00060 g001
Figure 2. Iron foam as obtained by the sponge replication method.
Fuels 06 00060 g002
Figure 3. Micrographs of the sintered foams fabricated by the sponge replication method. The template used was PU foams (50 PPI), and the metallic precursor was the iron powder (mesh 200), where (a) the general aspect of the iron foam, (b) the cell-size view, (c) the strut view, and (d) the high magnification of the surface microstructure.
Fuels 06 00060 g003
Figure 4. X-ray diffraction (XRD) pattern of Fe foam shown In red is the sample, while in gray is the reported match using the JADE software database.
Fuels 06 00060 g004
Figure 5. H2 and O2 evolution for the temperature program thermal treatment of the Fe foam heated to 970 °C at a heating rate of 10 °C·min−1 using a 100 mL/min flow of 10% H2:N2.
Fuels 06 00060 g005
Figure 6. The CO conversion and CH4 and CO2 selectivity as a function of the time-on-stream for FTS using the Fe foam as a catalyst. Reaction conditions: H2/CO = 1.2, 250 °C, 20 bar, WHSV = 600 h−1, and ToS = 48 h.
Fuels 06 00060 g006
Figure 7. Liquid products of FTS using Fe foam as catalyst. (a) H2/CO = 1.2; (b) H2/CO = 1.6; (c) H2/CO = 2.0; and (d) H2/CO = 2.5. Reaction conditions: 250 °C, 20 bar, WHSV = 600 h−1, and ToS = 48 h.
Fuels 06 00060 g007
Figure 8. Chromatogram in TIC mode for organic samples of FTS using Fe foams and hydrogen-deficient syngas. (a) H2:CO = 1.2, (b) H2:CO = 1.6, and (c) diesel standard. Reaction conditions: 250 °C, 20 bar, WHSV = 600 h−1, and ToS = 48 h.
Fuels 06 00060 g008
Table 1. Comparisons of the conversion and selectivity for Fe foams with the powder Fe/Al2O3 catalyst. Conditions: 250 °C, 20 bar, H2/CO = 2, WHSV = 1200 h−1, and ToS = 48 h.
RunCatalystXCOSCO2SCH4+SC3+
1Fe powder17.86.019.074.9
Fe foam10.17.54.5787.9
2Fe powder16.36.514.078.5
Fe foam9.610.810.889.1
Table 2. Conversion and selectivity for Fe foams using different reduction temperatures. Conditions: 250 °C, 20 bar, H2:CO = 2, WHSV = 600 h−1, and ToS = 48 h.
Temp. Red (°C)XCOSCO2SCH4SC+
40015.24.210.185.7
32536.218.614.766.6
25016.13.59.786.8
Table 3. Conversion and selectivity for Fe foams at different syngas ratios (1.2–2.5). Conditions: 250 °C, 20 bar, WHSV = 600 h−1, and ToS = 48 h.
H2/COXCOSCO2SCH4SC+
1.284.826.210.463.4
1.637.110.216.773.2
236.218.614.766.6
2.519.911.118.970.0
Table 4. The density and pH of liquid products of FTS using the Fe foam as a catalyst.
H2/CO1.21.6
PhaseAqueousOilAqueousOil
Density [g·mL−1]0.9920.7500.9880.772
pH3.56--3.49--
Viscosity [cSt]--1.28--1.37
Table 5. Ethanol and acetic acid content in the aqueous phase of FTS using Fe foam as catalyst and hydrogen-deficient syngas.
Amount [mg·kg−1]
OxygenateH2:CO = 1.2H2:CO = 1.6
Ethanol19,796.610,480.9
Acetic acid2418.11330.5
Table 6. Elemental analysis for the organic phase of FTS products using Fe foam as a catalyst and hydrogen-deficient syngas.
H2/CO1.21.6
C62.469.6
H10.812.5
O26.717.8
Disclaimer/Publisher’s Note: The statements, opinions and data contained in all publications are solely those of the individual author(s) and contributor(s) and not of MDPI and/or the editor(s). MDPI and/or the editor(s) disclaim responsibility for any injury to people or property resulting from any ideas, methods, instructions or products referred to in the content.