Article

Enhancing Oil Recovery Through Vibration-Stimulated Waterflooding: Experimental Insights and Mechanisms

1
Energy Systems Engineering, Faculty of Engineering and Applied Science, University of Regina, Regina, SK S4S 0A2, Canada
2
Industrial Systems Engineering, Faculty of Engineering and Applied Science, University of Regina, Regina, SK S4S 0A2, Canada
*
Author to whom correspondence should be addressed.
Fuels 2025, 6(3), 56; https://doi.org/10.3390/fuels6030056
Submission received: 25 April 2025 / Revised: 8 July 2025 / Accepted: 25 July 2025 / Published: 29 July 2025

Abstract

Vibration-stimulated waterflooding (VS-WF) is a promising enhanced oil recovery (EOR) method, especially for reservoirs with high-viscosity or emulsified oil. This study explores the effect of low-frequency vibration (2 Hz and 5 Hz) on oil mobilization under constant pressure and flow rate, using both crude and emulsified oil samples. Vibration significantly improves recovery by inducing stick-slip flow, lowering the threshold pressure, and enhancing oil phase permeability while suppressing the water phase flow. Crude oil recovery increased by up to 24% under optimal vibration conditions, while emulsified oil showed smaller gains due to higher viscosity. Intermittent vibration achieved similar recovery rates to continuous vibration, but with reduced energy use. Statistical analysis revealed a strong correlation between pressure fluctuations and oil production in vibration-assisted tests, but no such relationship in non-vibration cases. These results provide insight into the mechanisms behind vibration-enhanced recovery, supported by analysis of pressure and flow rate responses during waterflooding.

1. Introduction

External vibration-assisted enhanced oil recovery (EOR) methods have attracted considerable attention due to their effectiveness in mobilizing oil flow, reducing heavy oil viscosity, and enhancing fluid permeability within porous media [1,2,3]. Westermark summarized these mechanisms, providing foundational insights into how vibration can improve oil recovery [4]. Kouznetsov et al. demonstrated the application of vibro-energy in waterflooding, highlighting its potential to increase oil production [5]. Li noted that various vibration frequencies have been explored in vibration-stimulated EOR (VS-EOR) processes, with low-frequency vibrations (10–100 Hz) being most effective for mobilizing heavy oil [6]. Moustafa et al.’s laboratory studies further validated this technique’s efficacy, optimizing key parameters such as frequency, amplitude, and duration [7].
The first mechanism explaining the effects of vibration stimulation involves the mobilization of oil slugs. Incorporating vibration into EOR methods improves oil slug mobility within water-saturated capillary tubes by forming a thin fluid film around the slug, reducing its contact area with tube walls [8,9]. Studies on the combined effects of external pressure and low-frequency vibratory excitations show that vibration reduces the maximum pressure needed to mobilize oil slugs and significantly increases the distance they can travel. These findings deepen our understanding of liquid mobilization under vibratory stimulation, underscoring the potential of vibration-assisted techniques to enhance oil recovery through improved waterflooding strategies.
Vibration stimulation also affects the permeability of porous media [10,11]. Zheng investigated the impact of low-frequency vibration acceleration on the properties of low-permeability rocks during waterflooding [12]. The study revealed that appropriately selected vibration accelerations can enhance oil phase permeability while reducing water phase permeability, thus improving oil recovery. This highlights the potential of vibration-assisted techniques to optimize fluid flow dynamics and enhance recovery efficiency in low-permeability reservoirs.
Viscous fingering, which arises from displacement front instability and reduces oil sweep efficiency, is another area where vibration shows promise [13,14,15]. Lyubimova et al. demonstrated that low-frequency vibrations suppress small-scale perturbations at fluid interfaces and stabilize fluid droplets within porous media [16]. Similarly, Marfin et al. found that high-frequency elastic vibrations effectively mitigate undesirable interphase instabilities [17]. These findings collectively indicate the potential of applying vibrations at appropriate frequencies to control viscous fingering, thereby improving displacement efficiency and enhancing oil recovery.
Recent studies emphasize dynamic fluid redistribution and injection optimization for improving EOR efficiency [18,19]. Researchers have extensively examined multi-layer reservoirs, sandstone formations, and waterflooding strategies, showing that oil displacement efficiency is influenced by factors like permeability–thickness relationships, geological reserves, relative permeability variations, and reservoir heterogeneity [20,21,22,23,24]. Optimizing injection strategies based on these parameters has been shown to increase oil recovery, improve fluid sweep efficiency, and delay water breakthrough. However, heterogeneous flow pathways and residual oil trapping remain significant challenges, necessitating advanced oil mobilization techniques beyond traditional waterflooding.
The stick-slip effect is another critical factor in mobilizing high-viscosity fluids [25,26,27]. Gao analyzed stick-slip behavior, attributing it to differences between static and dynamic friction coefficients or irregularities in local friction [28]. He identified a novel phenomenon termed “negative stick-slip,” which contradicted existing models and revealed unexpected friction behavior at low velocities. These findings highlight the intricate nature of stick-slip mechanisms, particularly in scenarios where resonance frequencies at contact points significantly influence fluid dynamics.
Sochi further analyzed wall slip, emphasizing the influence of various physical and chemical factors such as fluid properties, flow characteristics, surface conditions, and the surrounding environment [29]. He suggested reconsidering the commonly accepted no-slip boundary condition at fluid-solid interfaces, especially in non-Newtonian fluids, non-wetting systems, and at microscopic or nanoscopic scales. This understanding is crucial for accurately modeling fluid behavior in specialized conditions, particularly in systems where slip may significantly impact flow dynamics.
In addition to continuous vibration, intermittent stimulation has been proposed as a cost-effective and environmentally friendly approach to EOR. Agi investigated the use of intermittent vibration, demonstrating its efficiency advantages over traditional continuous ultrasonic vibration, which involves high production and maintenance costs [30]. Using a two-dimensional micro-model in an ultrasonic bath, the study showed that oil recovery improves with increasing viscosity, vibration intensity, and proximity to the energy source. These findings suggest that intermittent vibration outperforms continuous methods, highlighting its potential as an innovative and sustainable solution for EOR applications.
Lu explored vibration-stimulated gas pressure cycling (VS-GPC) in a closed porous media system saturated with crude oil [31]. Experiments demonstrated that vibration enhances the transport of live oil (CO2-dissolved crude oil) to regions where gas had not yet penetrated. This was attributed to vibration’s ability to reduce interfacial tension and improve fluid mobility, with transfer efficiency strongly dependent on vibration frequency. These findings support the hypothesis that vibration can effectively enhance fluid flow in porous media, even in complex systems involving gas–oil interactions.
Building on this work, the current study investigates the application of vibration-stimulated waterflooding (VS-WF) to further understand how vibration influences fluid dynamics and oil recovery in water-dominated systems. By extending the principles of vibration-assisted fluid mobilization to waterflooding, this research aims to uncover new mechanisms for improving oil recovery in challenging reservoirs.

2. Experiment

The experiment studies the effects of vibration stimulation through the comparison of various forms of WF under various forms of stimulation. More specifically, five types of WF processes are studied, i.e., constant pressure WF without vibration stimulation, constant pressure VS-WF, constant flow rate WF without vibration stimulation, constant flow rate VS-WF, and intermittent VS-WF.

2.1. Materials

The heavy oil sample used in this study is obtained from Lloydminster, Saskatchewan, Canada. The viscosity of the heavy oil (µo) is measured at 8940 cP (referred to as crude oil) using a Brookfield DV-II viscometer under ambient pressure and at a temperature of 21 °C. The density of the oil (ρo) is determined to be 0.9801 g/cm3 under the same conditions, using an Anton Paar DMA 512P densitometer (Ashland, VA, USA).
For comparative analysis, an emulsion is prepared by mixing 90 mass percent of the Lloydminster heavy oil with 10 mass percent deionized water. The viscosity of the emulsion (µeo) is measured at 14,500 cP (referred to as emulsion oil), and its density (ρeo) is 0.9824 g/cm3, both measured at ambient pressure and 21 °C. Additionally, the density of deionized water (ρw) at 21 °C is recorded as 0.9972 g/cm3. The selection of crude oil and emulsified oil samples aimed to investigate the influence of viscosity and oil phase complexity on vibration-stimulated waterflooding (VS-WF) performance.

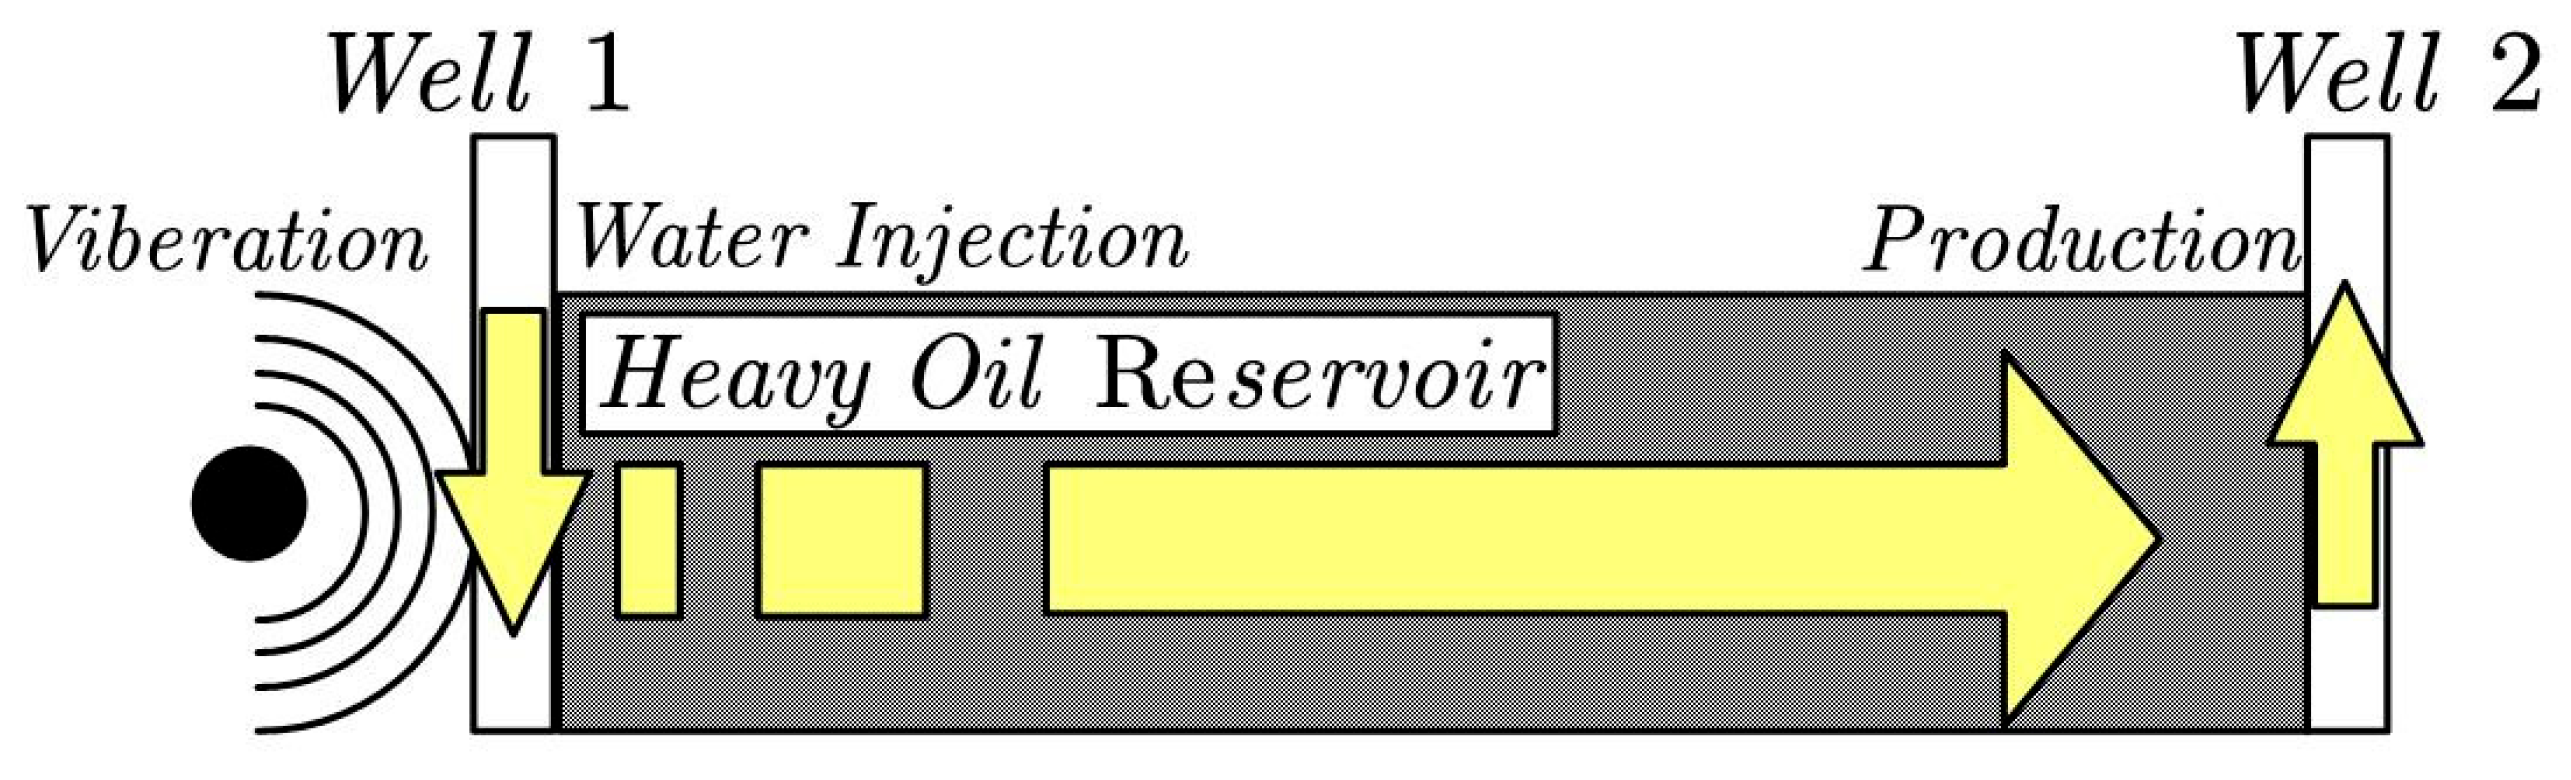
2.2. Experiment Setup

The experimental setup consists of three main components, as follows: a physical sandpack model, an injection system, and a vibration unit. The sandpack model is a cylindrical steel container, 400 mm in length and 40 mm in diameter, designed to hold fluids and a porous medium. The porous medium used in this study is crystallized silica sand with a mesh size of 60–80. Figure 1 illustrates the schematic diagram of the experimental setup for the VS-WF study.
The injection system includes two cylinders containing crude oil and deionized water samples. Water is injected into the sandpack at specified constant pressures or flow rates using a syringe pump (500D, Teledyne, Thousand Oaks, CA, USA). The vibration unit consists of a vibration exciter (JZK-50, Sinocera, Shanghai, China), which generates horizontal vibrations in the sandpack. The sandpack model is mounted on a sliding rail to ensure smooth movement, and the sliding assembly is connected to the exciter shaft. The vibration frequency is controlled by a signal generator (3560c, Bruel & Kjaer, Darmstadt, Denmark) and a power amplifier (YE5874A, Sinocera, China), with the vibration power maintained at a constant level throughout the experiments. The injection system and the physical model make up a prototype that represents the WF process in a reservoir, as shown in Figure 2.
This study investigates two primary modes of waterflooding oil production, as follows: constant-pressure waterflooding and constant-flow-rate waterflooding. Specifically, the effects of vibration excitation on the waterflooding process are examined by analyzing variations in pressure or flow rate within the fluid system and their corresponding influence on oil production rates.
Choice of Vibration Frequencies:
The vibration frequencies of 2 Hz and 5 Hz were selected based on prior studies and preliminary experiments indicating their effectiveness in mobilizing heavy oil. Low-frequency vibrations (<10 Hz) have been shown to enhance fluid mobility by reducing threshold pressure and inducing stick-slip motion in porous media. The comparison between 2 Hz and 5 Hz allowed for the evaluation of frequency-dependent effects on oil mobilization.
Choice of Injection Pressures:
The injection pressures (ranging from 70 kPa to 1000 kPa) were chosen to simulate typical reservoir conditions and to assess the impact of different pressure levels on oil recovery efficiency. The lower pressure range (70–200 kPa) represents scenarios where capillary forces dominate, while higher pressures (500–1000 kPa) reflect conditions where viscous forces become more influential. The variation in pressure was intended to identify the optimal conditions for vibration-induced oil mobilization.

2.3. Experimental Preparation

The physical sandpack model is packed with 60–80 mesh crystallized silica sand to simulate a porous medium. The porosity of the sandpack is measured to range between 37.5% and 39.2%, while the absolute permeability ranges from 7.7 to 10.1 darcy. After packing, the sandpack is blow-dried using an air valve until its weight approaches the previously recorded dry weight, ensuring the absence of residual water in the model.
Subsequently, crude Lloydminster heavy oil is injected into the sandpack using a syringe pump at an injection rate of 0.2 mL/min. This step ensures that the sandpack is fully saturated with oil, simulating reservoir conditions prior to waterflooding. The preparation process is carefully monitored to maintain consistency across all tests, ensuring reliable and reproducible results.

2.4. Experimental Procedure

A total of 22 sandpack tests were conducted and grouped based on injection schemes and vibration conditions:
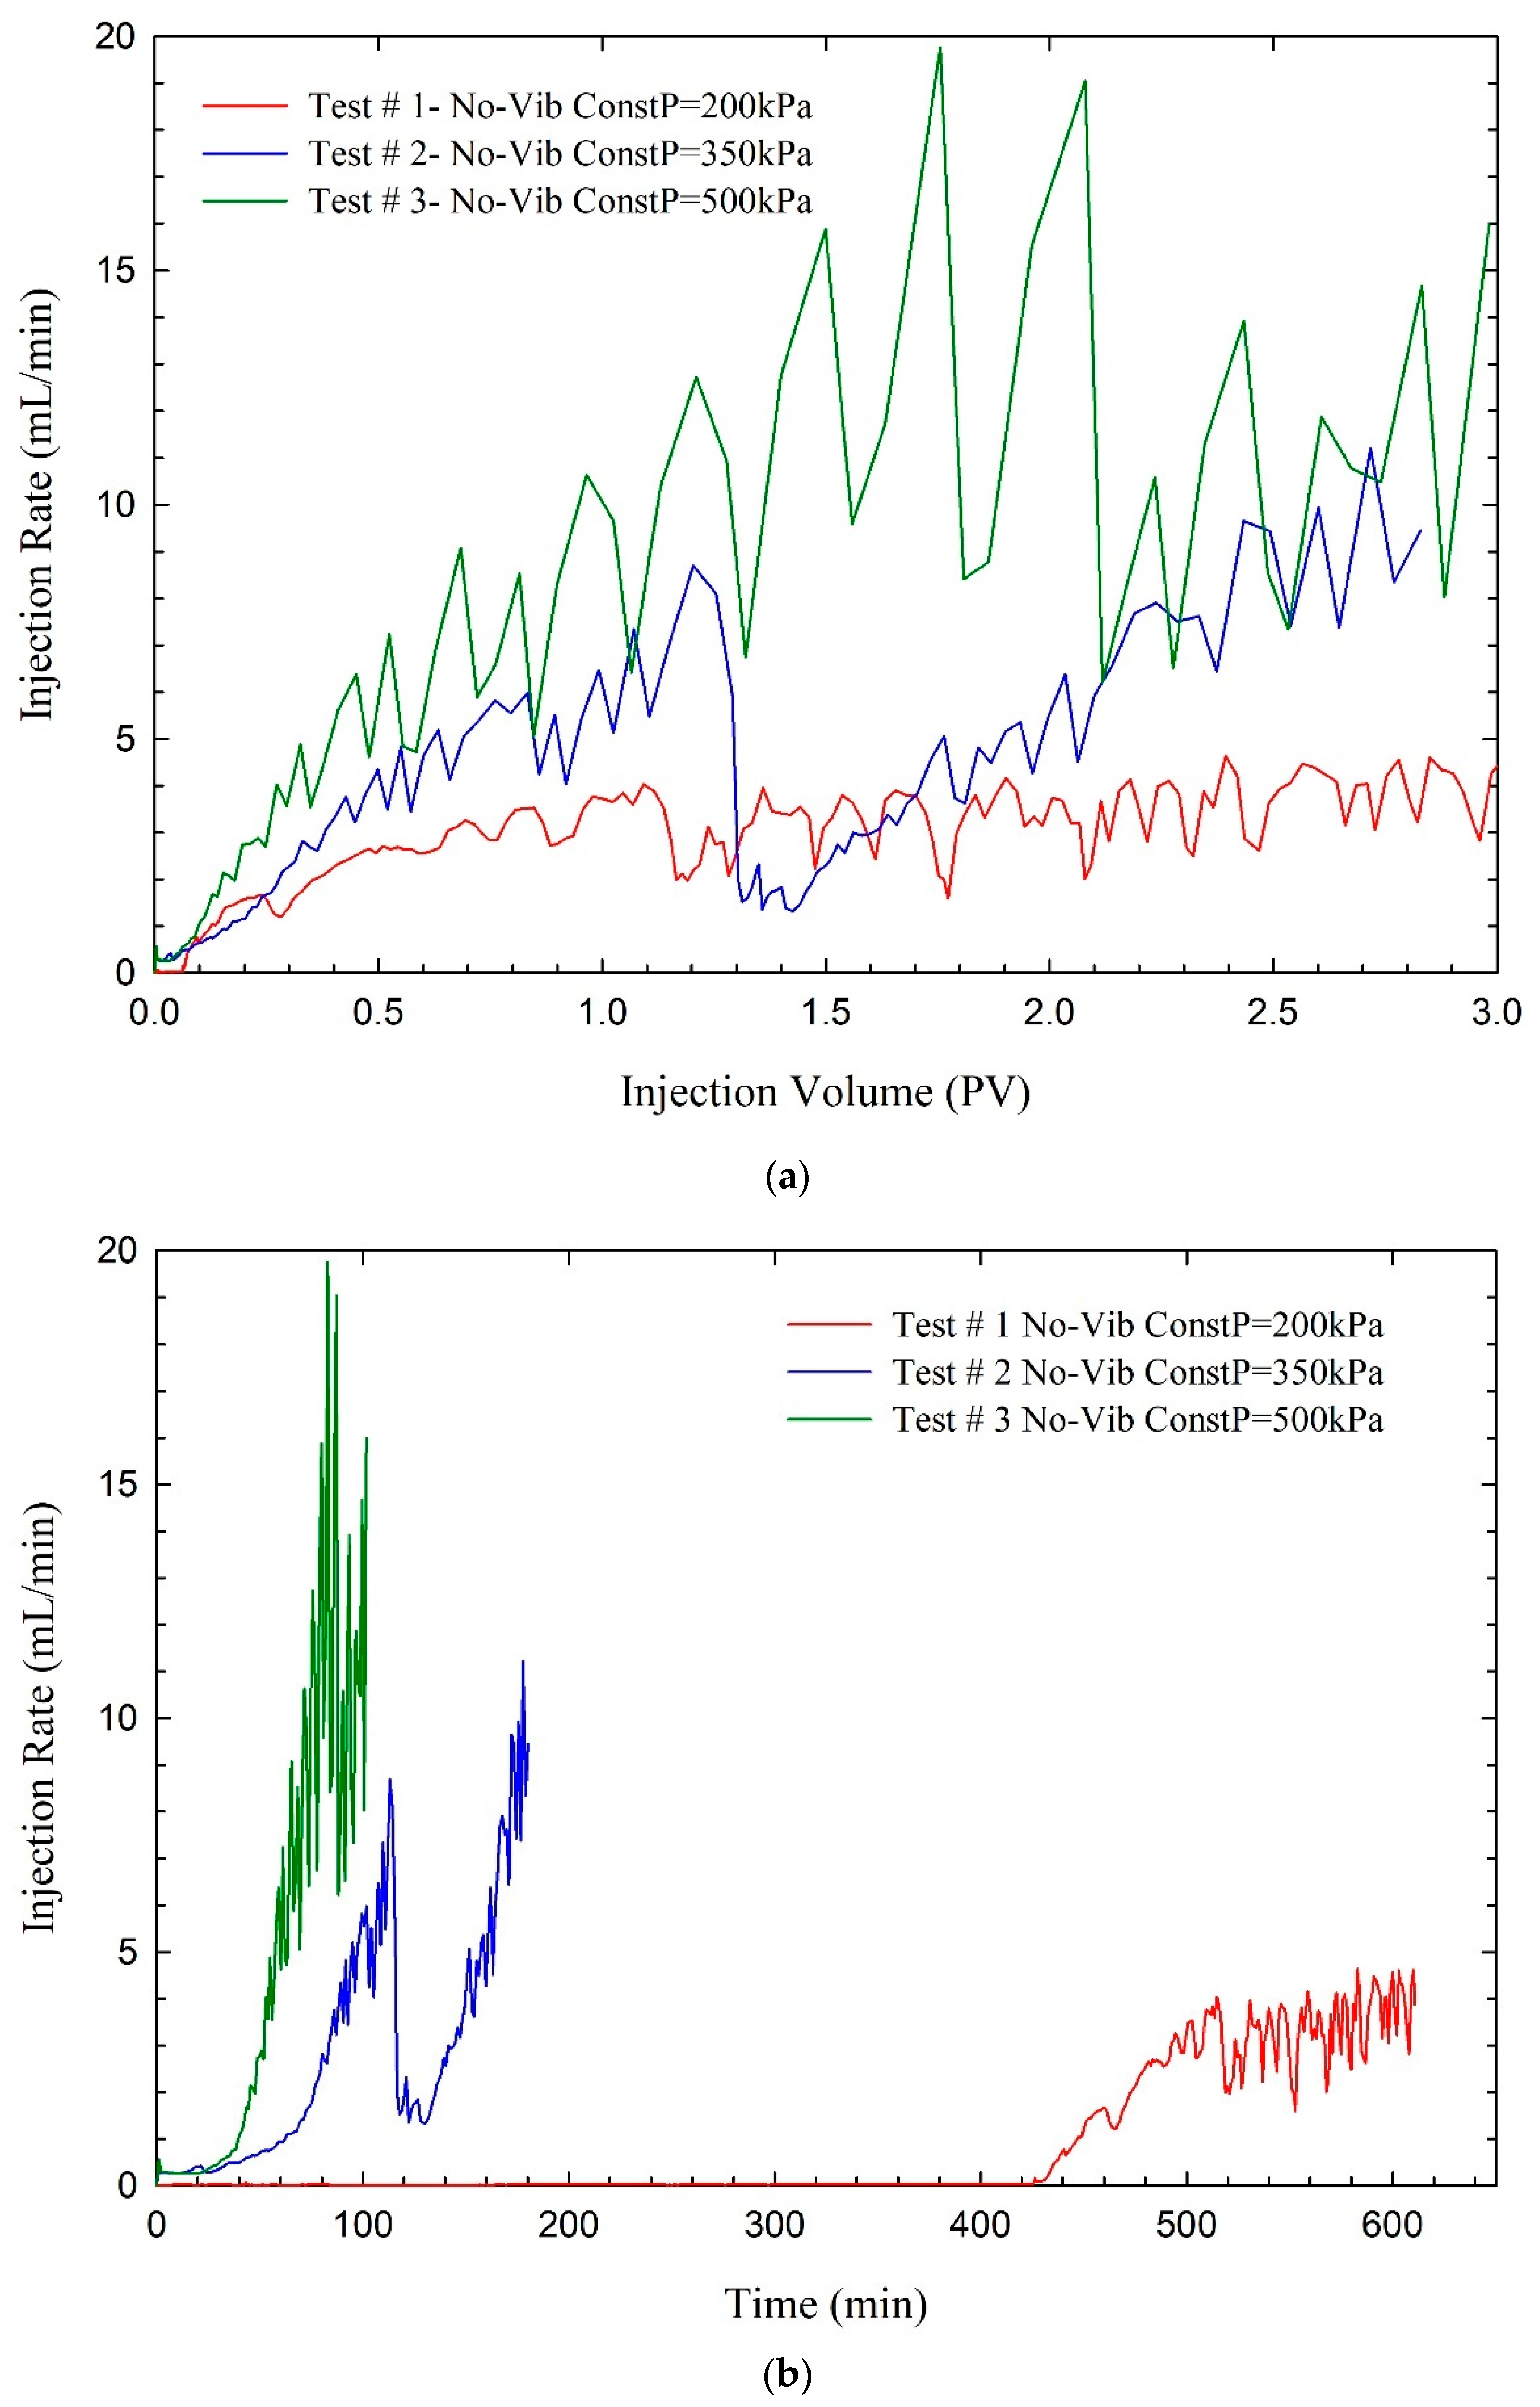
  • Constant-pressure WF tests (Tests 1–3): No vibration; injection pressures of 200, 350, and 500 kPa.
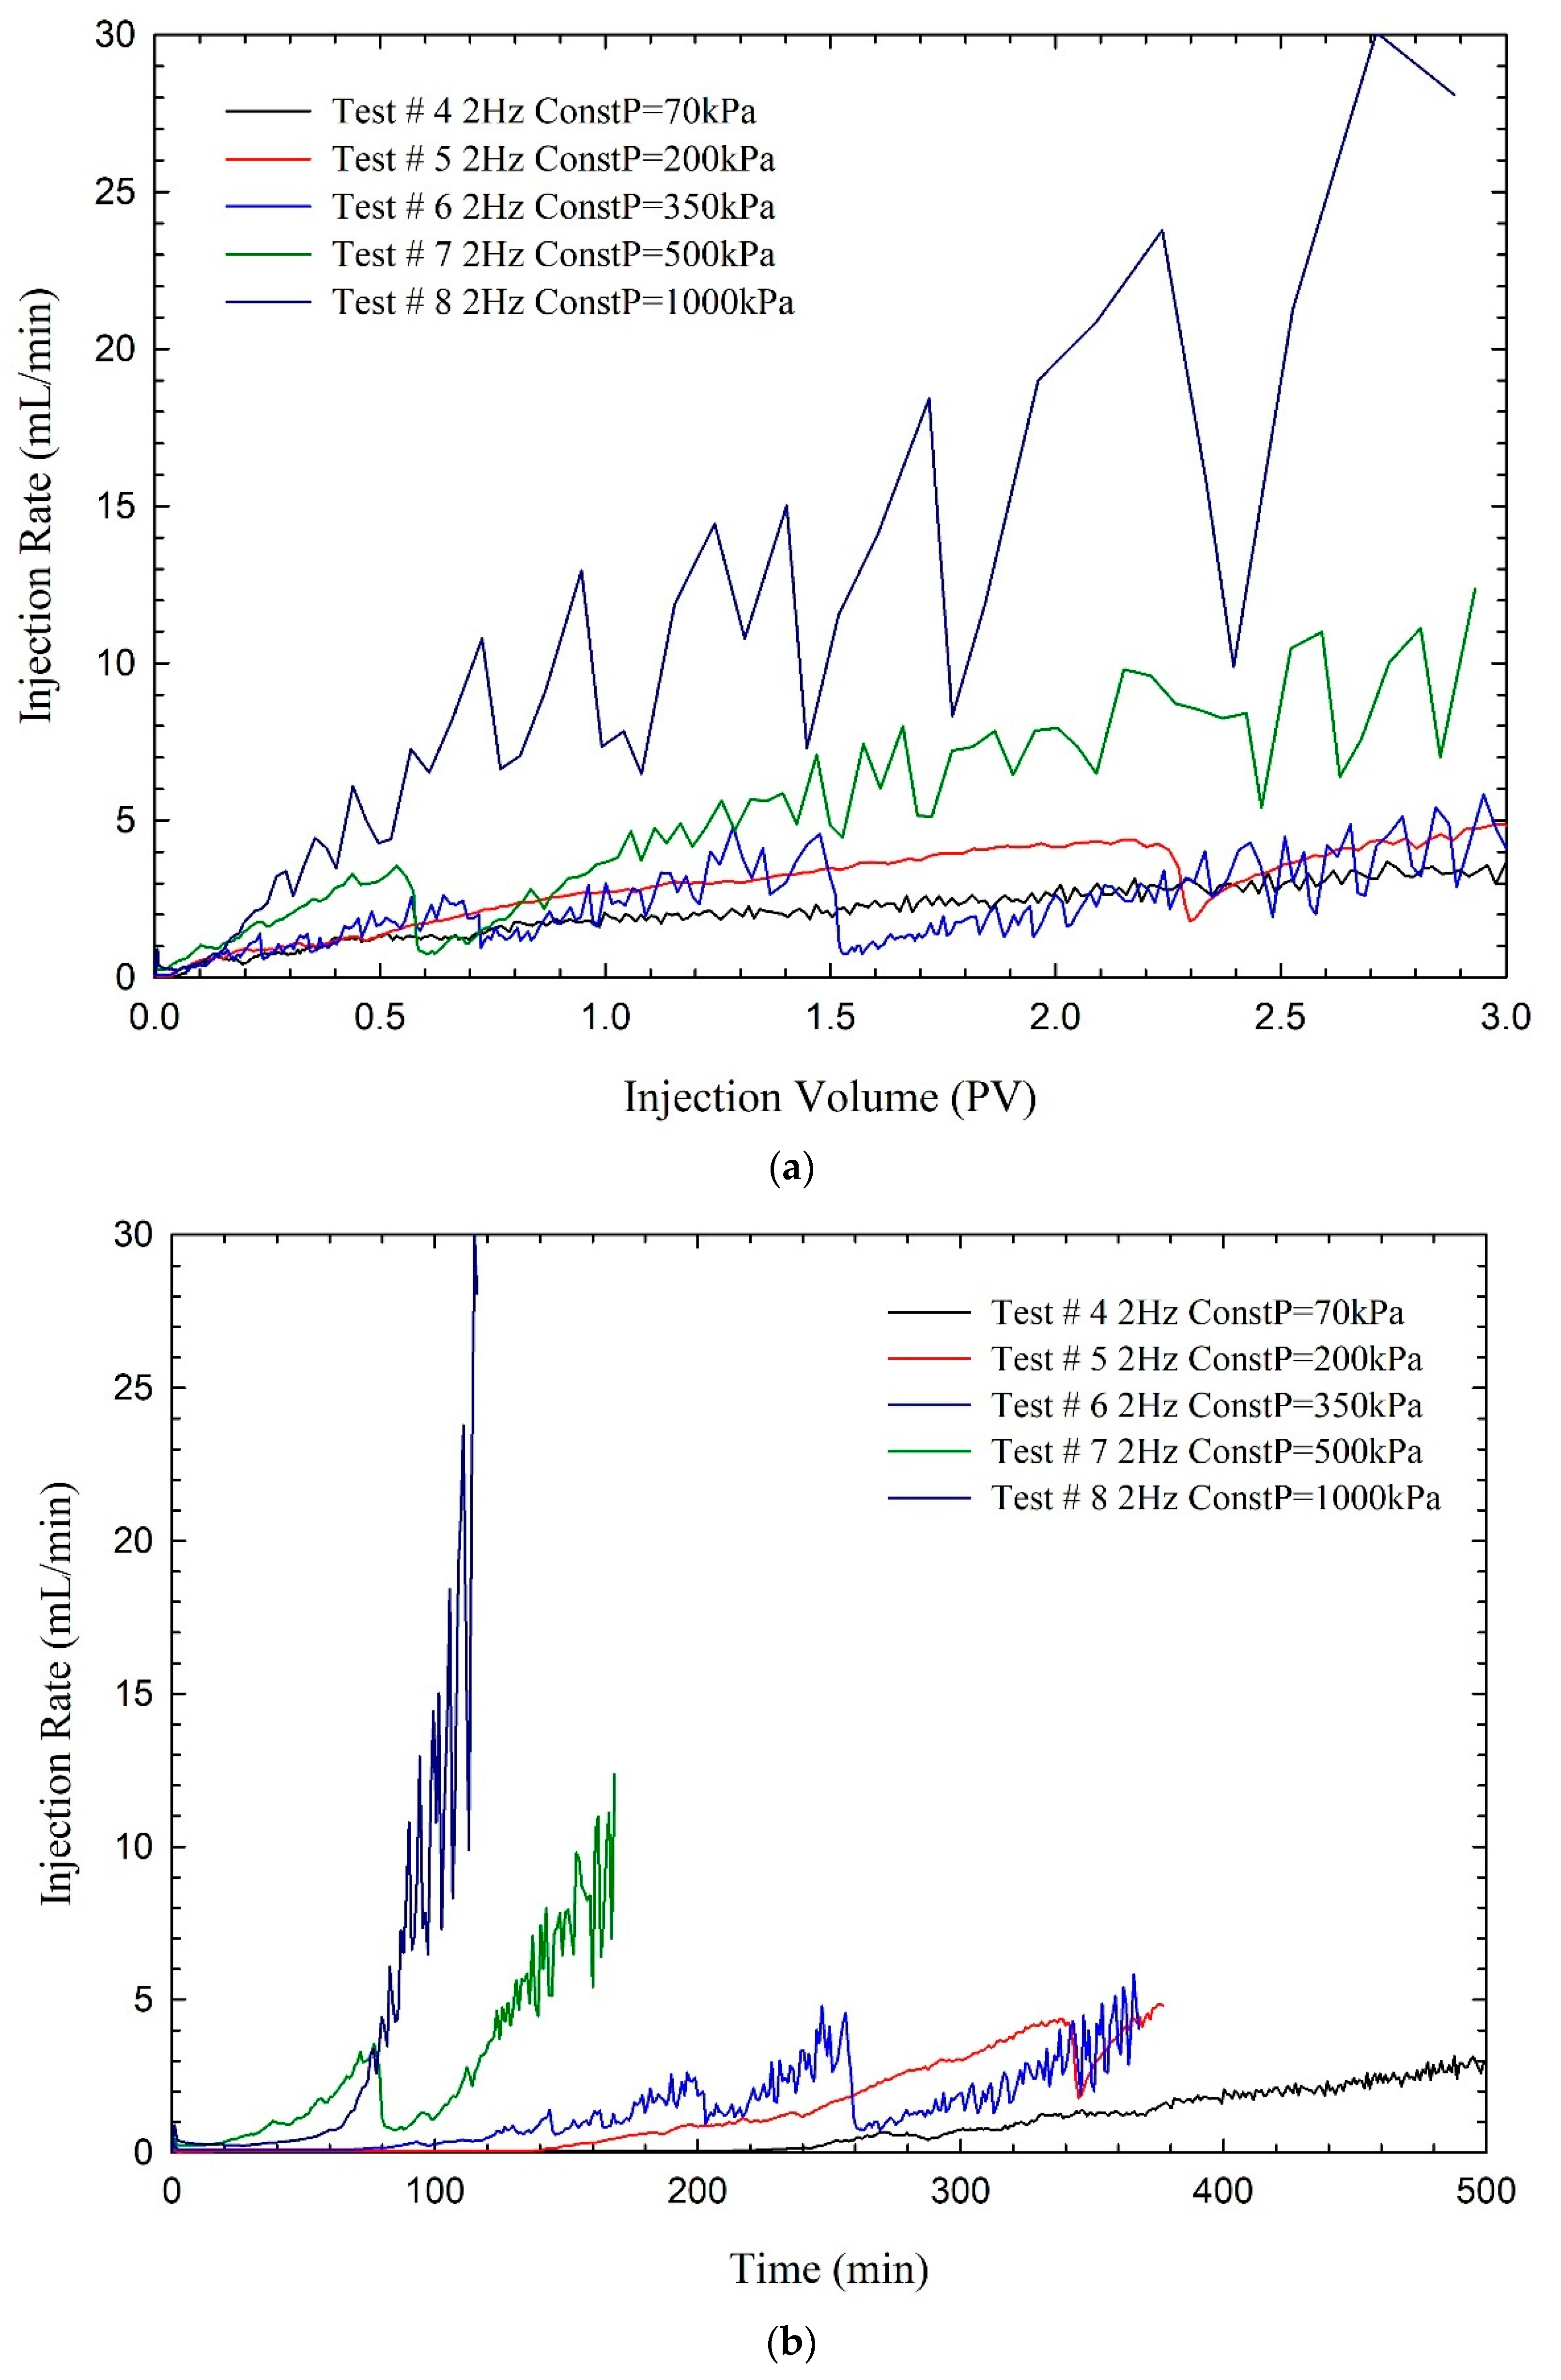
  • Constant-pressure VS-WF tests (Tests 4–8): 2 Hz vibration applied at pressures of 70, 200, 350, 500, and 1000 kPa.
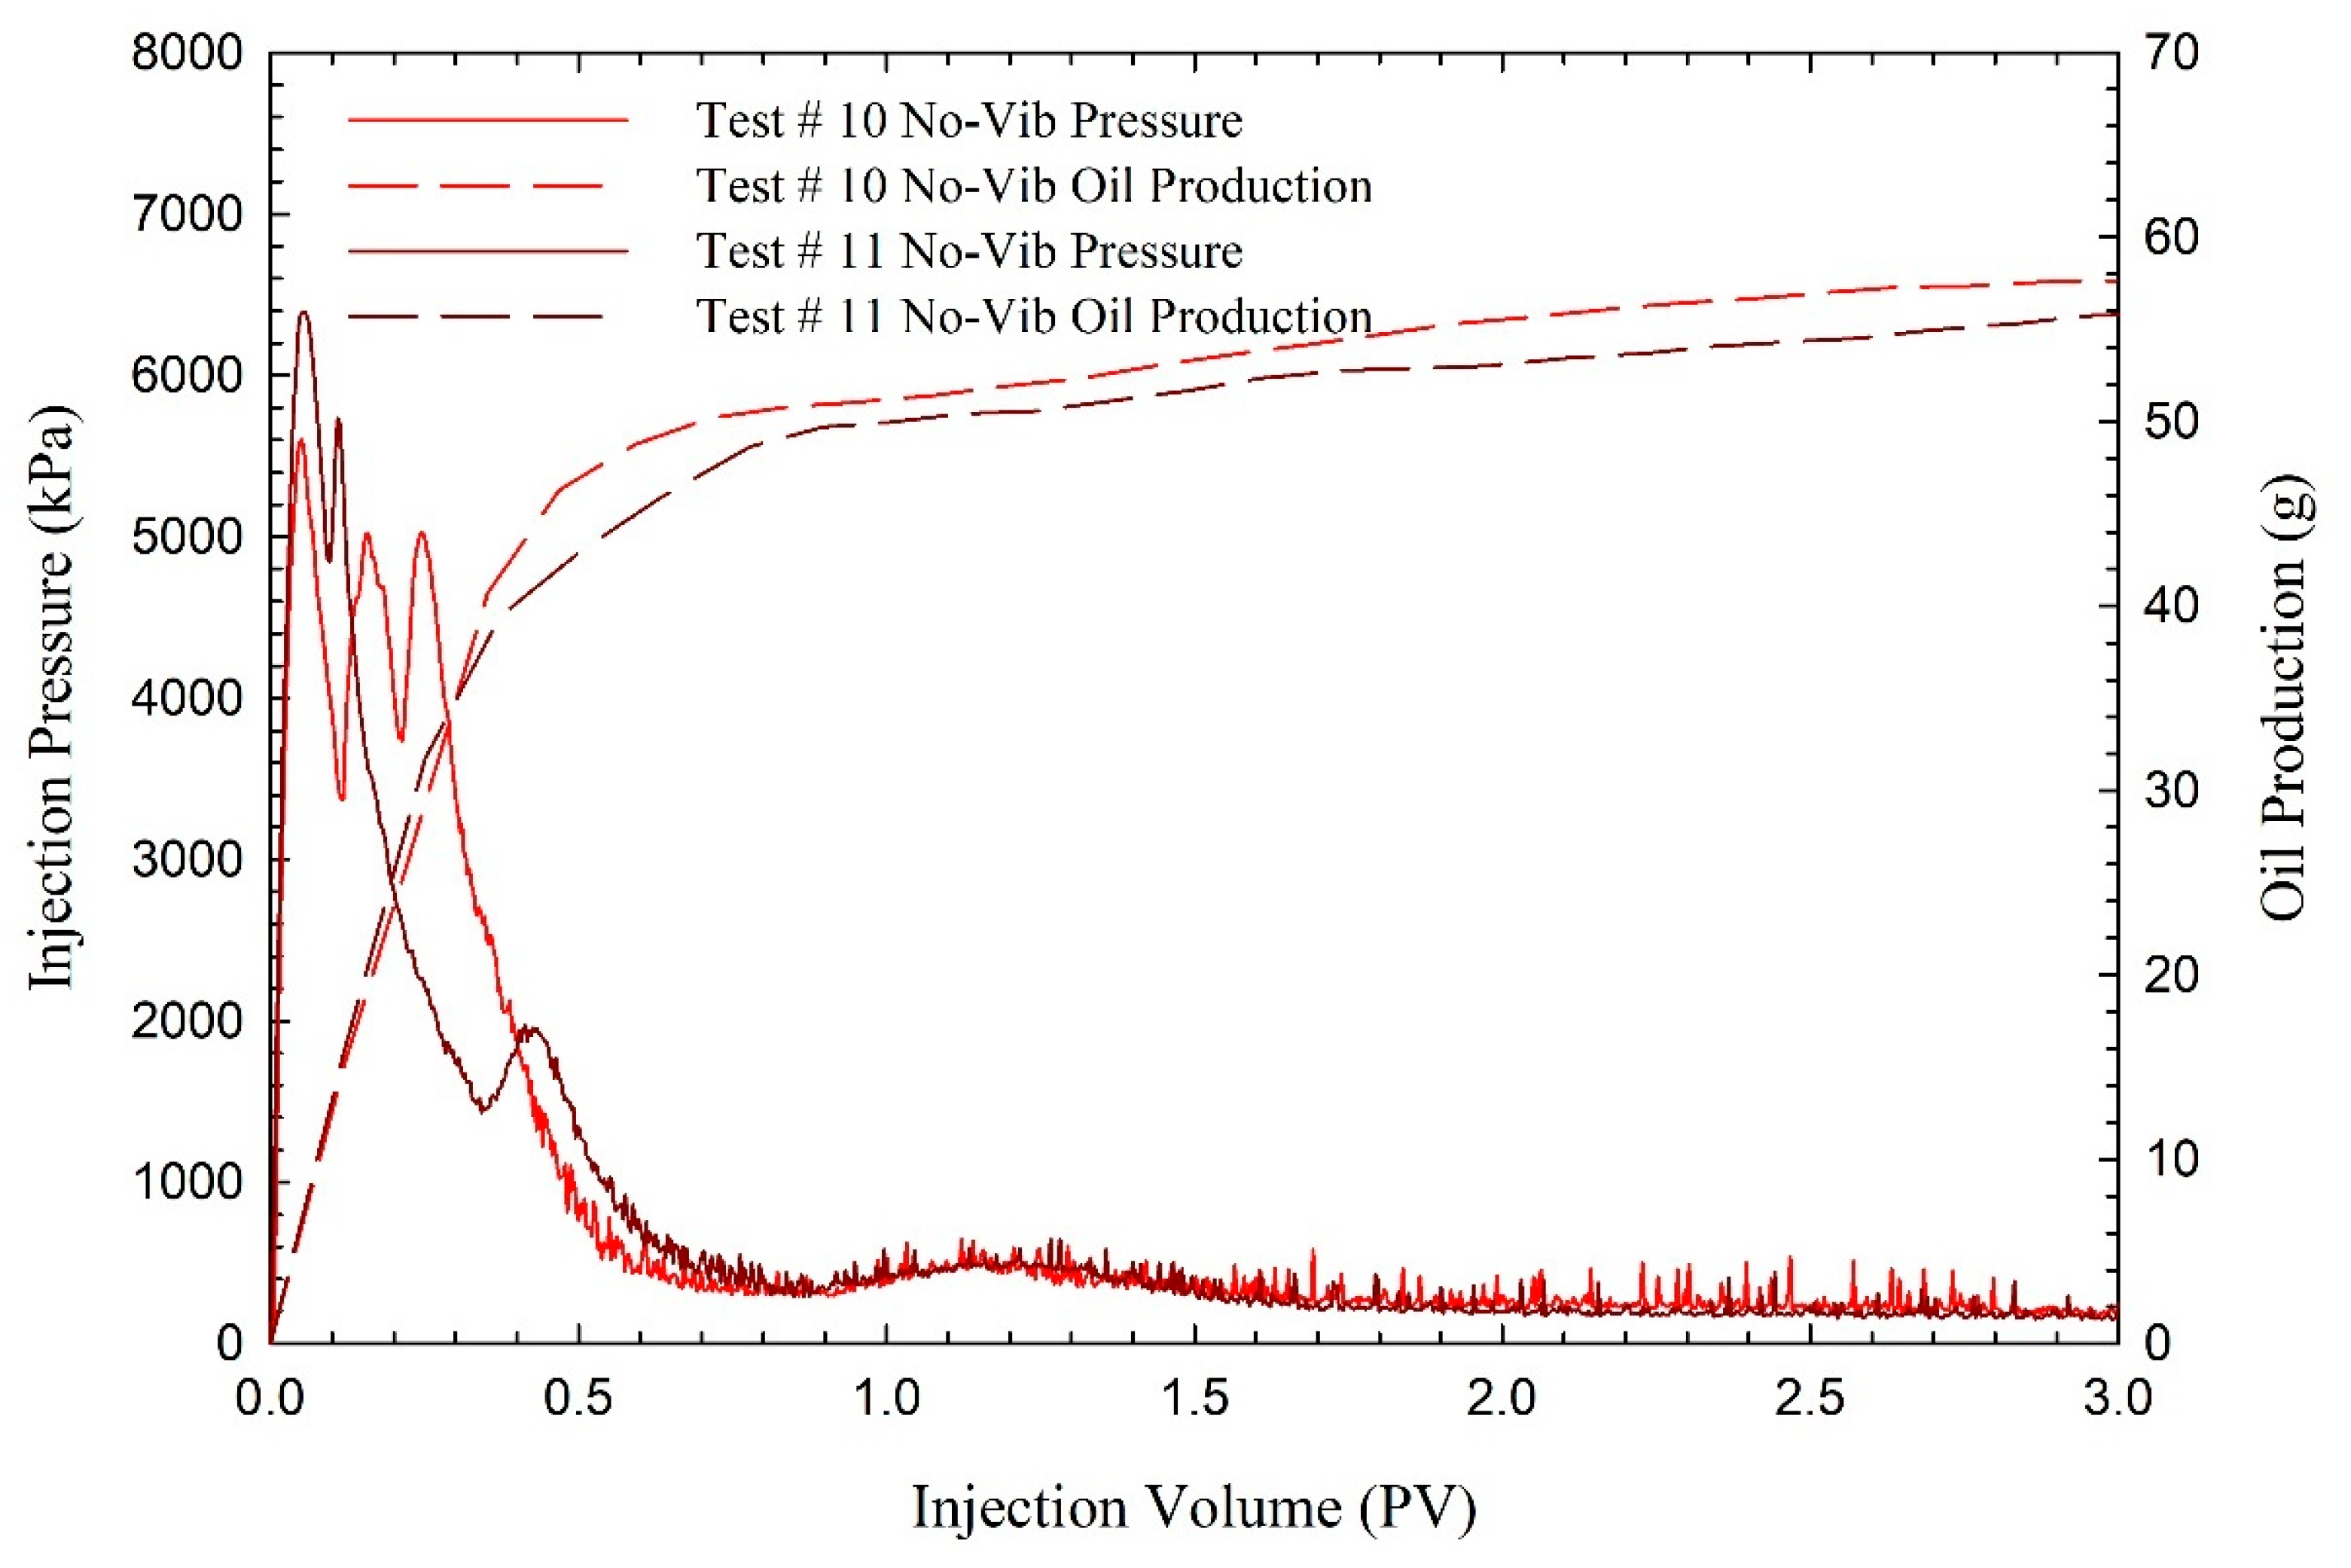
  • Constant-flow-rate WF tests (Tests 10–11, 16): No vibration; constant flow rate of 3 mL/min.
  • Constant-flow-rate VS-WF tests (Tests 12–15, 17–18): 2 Hz or 5 Hz vibration at 3 mL/min flow rate.
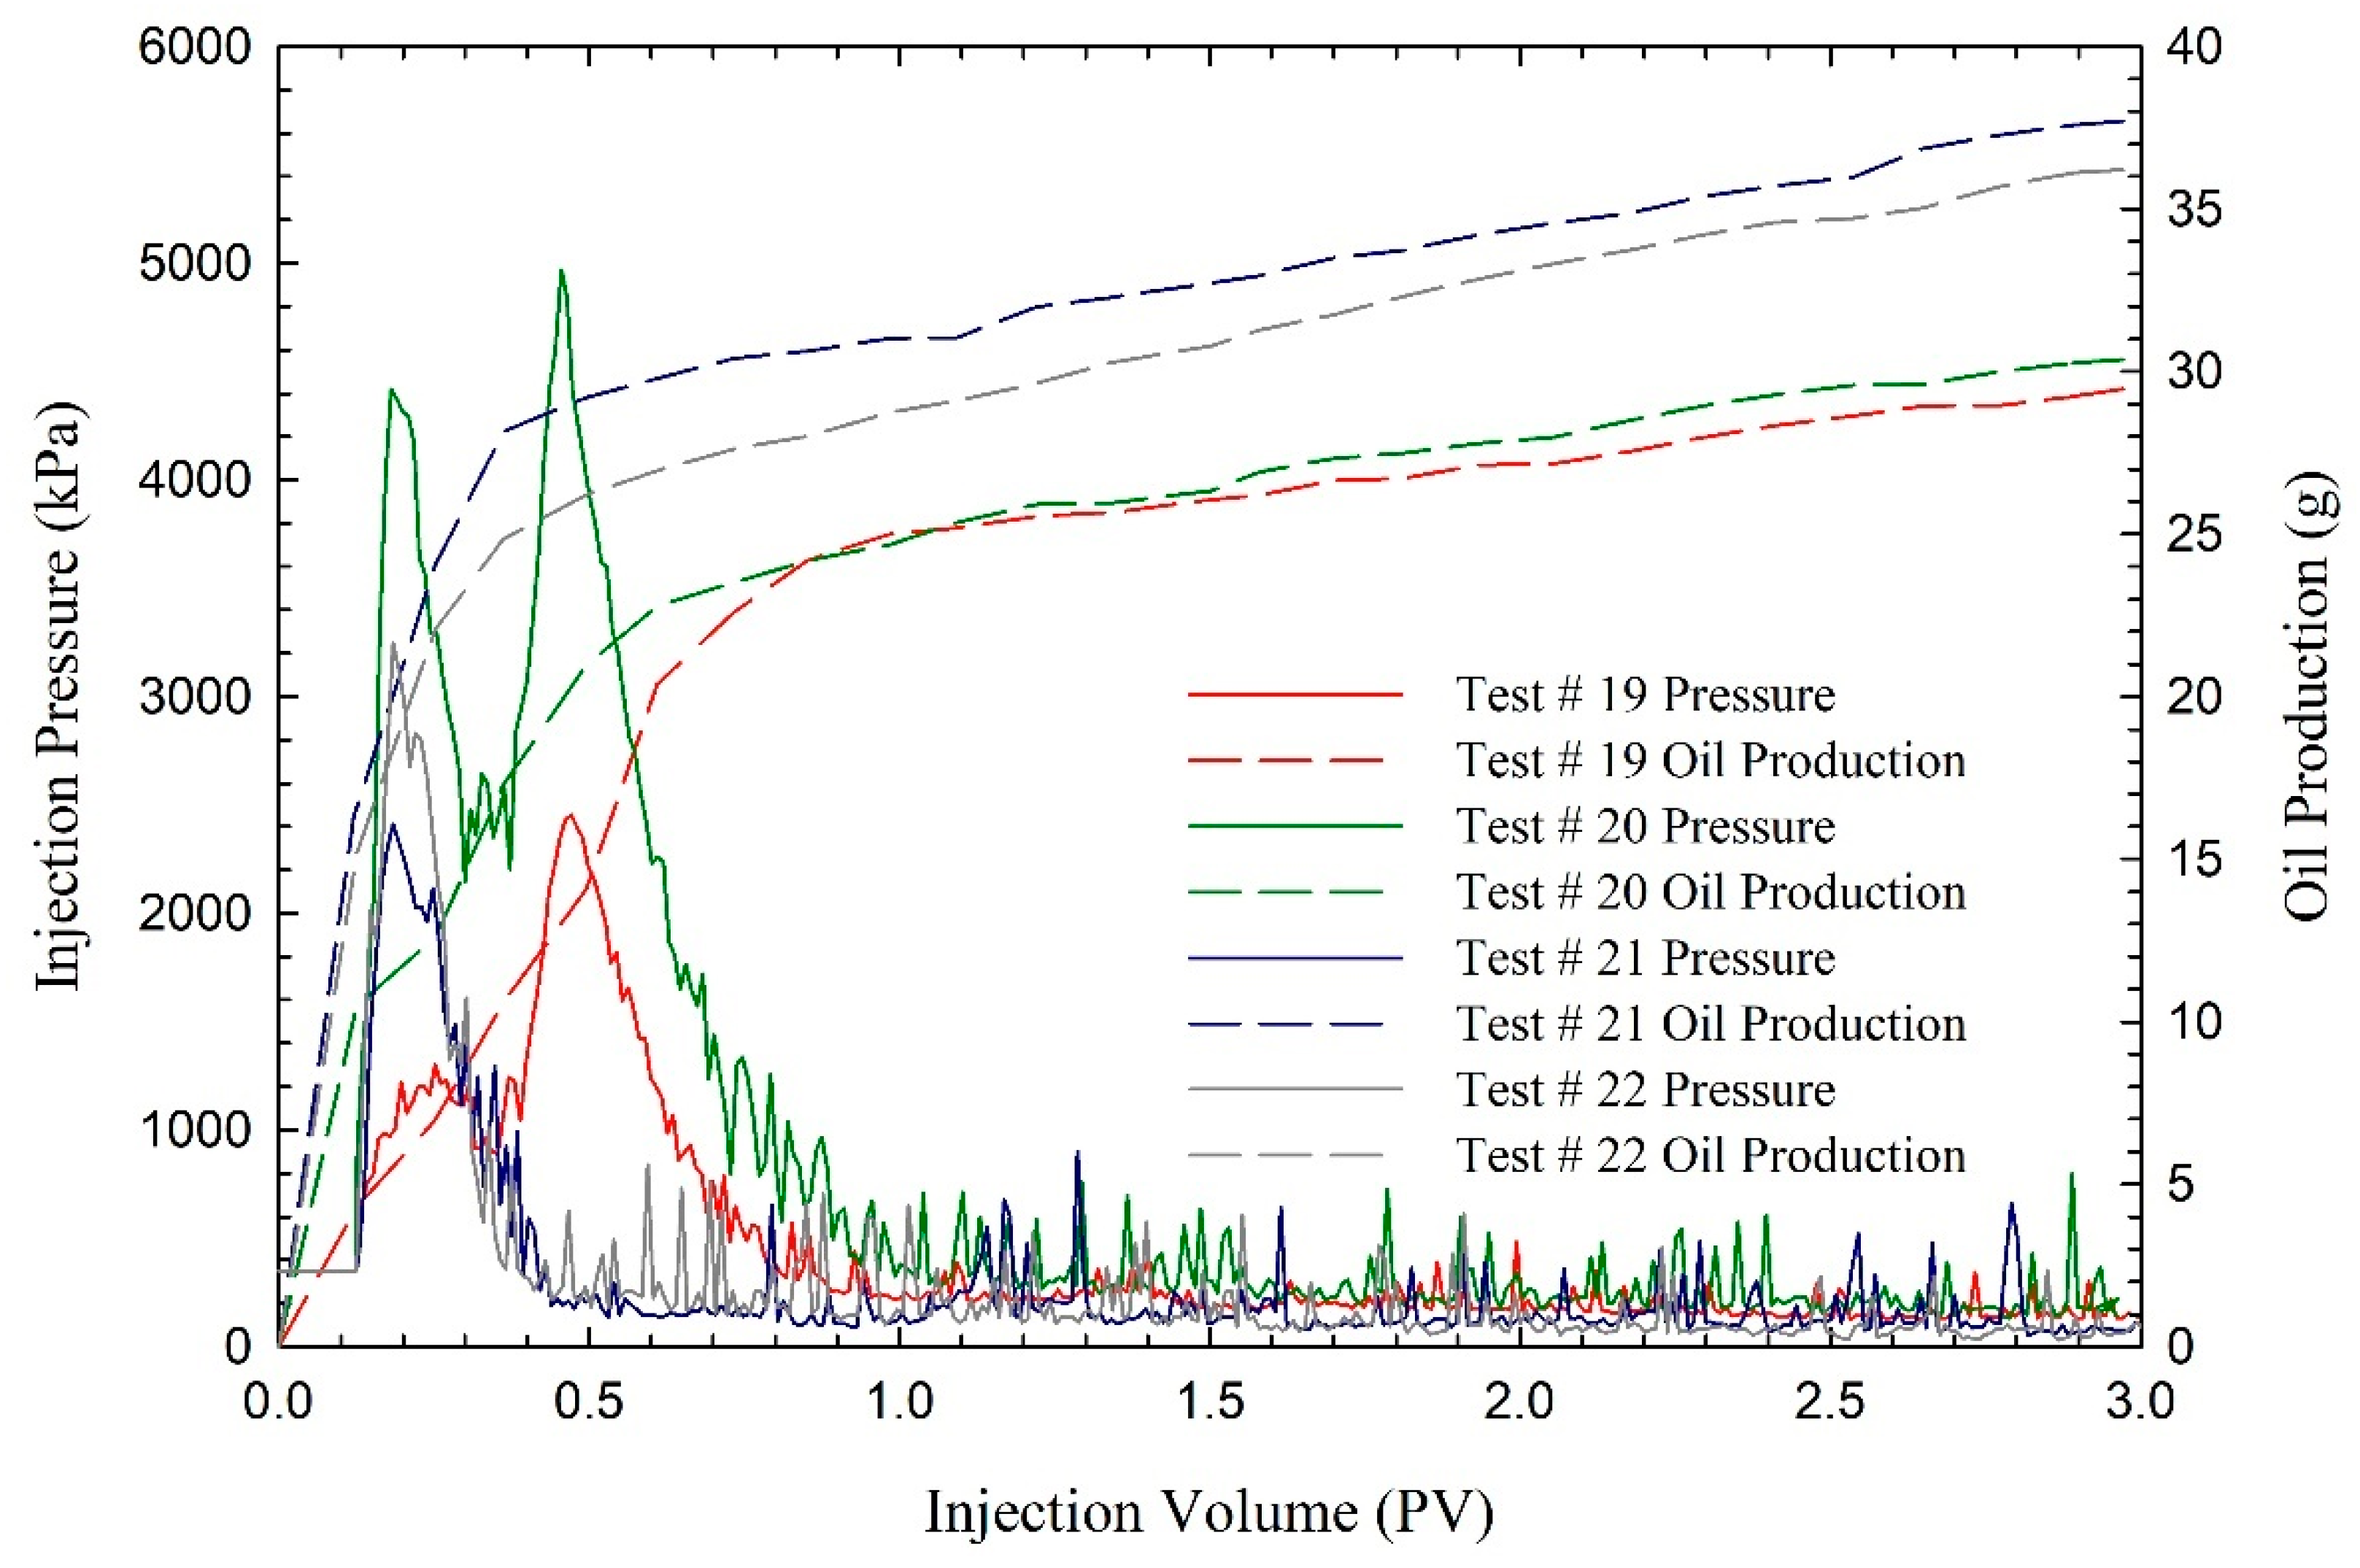
  • Intermittent VS-WF tests (Tests 9, 19–22):
    • Test 9 alternates 2 Hz vibration and rest (20 min each) at 500 kPa.
    • Tests 19–22 combine injection mode switching (from 350 kPa constant pressure to 3 mL/min flow) with intermittent 5 Hz vibration during the first stage.
Tests 16–22 used emulsified oil to mimic post-production reservoir conditions, evaluating the role of vibration under more complex fluid behavior. Detailed test parameters are listed in Table 1, with intermittent vibration conditions summarized in Table 2.

3. Results and Discussion

3.1. Stick-Slip Motion of Water-Heavy Oil Under Constant Pressure WF

Stick-slip behavior during waterflooding results from alternating trapping and mobilization of oil slugs within porous media, distinct from water-sandpack interactions. The “stick” phase occurs when oil slugs become immobilized by capillary forces, causing pressure buildup and flow reduction. The “slip” phase is triggered when pressure reaches threshold values, releasing oil slugs and resulting in flow rate increases and pressure drops.
In constant pressure tests (Tests 1–3 at 200, 350, and 500 kPa), stick-slip behavior demonstrated strong dependence on injection pressure. Test 1 exhibited minimal slip events, indicating insufficient pressure (200 kPa) to overcome capillary trapping. Tests 2 and 3 displayed pronounced stick-slip behavior, with Test 2 showing flow rate reduction from 8 to 1.5 mL/min (80% reduction) after 1.3 PV injection, while Test 3 exhibited smaller but more frequent slip events (~65% reduction), as shown in Figure 3.

3.2. Vibration Effects on Stick-Slip Dynamics

Tests 4–8 conducted under constant pressure with 2 Hz vibration (70 to 1000 kPa), as shown in Figure 4, revealed that stick-slip behavior depended more on flow rate than absolute pressure. At 70 kPa (Test 4), stick-slip was absent, indicating insufficient pressure for oil slug mobilization. Tests 5–7 (200–500 kPa) exhibited periodic slip events occurring when flow rates exceeded 3–4 mL/min, establishing a critical flow rate threshold.
Comparing Test 5 (200 kPa with vibration) to Test 1 (200 kPa without vibration) demonstrated that vibration reduces energy barriers for oil mobilization, enabling stick-slip motion at lower pressures. While Test 1 maintained stable flow, Test 5 exhibited periodic fluctuations once flow rates surpassed the critical threshold.

3.3. Intermittent Vibration Under Constant Pressure VS-WF Test

Figure 5 shows that Test 9 employed intermittent vibration, alternating 20-min intervals of 2 Hz vibration and no vibration at 500 kPa constant pressure. Flow rates during vibration-induced stick-slip events were measured at 6 mL/min, which is intermediate between continuous vibration (3.5 mL/min) and no-vibration (19 mL/min) conditions. Slip events in Test 9 caused a 75% flow rate reduction, matching the continuous vibration magnitude.
Intermittent vibration provides energy-efficient alternatives to continuous vibration while maintaining comparable oil recovery performance. Despite a 50% reduction in vibration time, oil recovery remained equivalent to continuous stimulation, demonstrating intermittent excitation effectiveness.

3.4. Constant Flow Rate Analysis

Oil production is reported in grams throughout the main text to enable direct comparison between tests. This approach is chosen because, although all sandpacks were prepared using the same protocol, small differences in porosity and absolute permeability led to minor variations in the original oil in place (OOIP) for each test. Reporting oil production as a direct mass output avoids the potential misrepresentation that could arise from normalizing to different OOIP values, and is a standard practice in laboratory EOR studies with multiple sandpacks. Recovery factors are summarized in the abstract and conclusion for completeness.

3.4.1. Non-Vibration Baseline Performance

Tests 10 and 11, as shown in Figure 6, conducted without vibration excitation, established baseline performance. Test 10 exhibited pressure spikes to 5600 kPa initially, stabilizing around 5000 kPa for the first 0.3 PV injection. Test 11 demonstrated similar trends with a peak pressure of 6400 kPa, but high-pressure phases lasted only 0.15 PV.

3.4.2. Low-Frequency Vibration Effects (2 Hz)

Figure 7 shows Tests 12 and 13, applying 2 Hz vibration excitation under constant flow rate conditions, exhibited peak pressures of approximately 7500 kPa. Test 12 demonstrated pressure rebound from 4000 kPa to 5000 kPa after 0.25 PV injection, while Test 13 maintained constant pressure during stick phases.

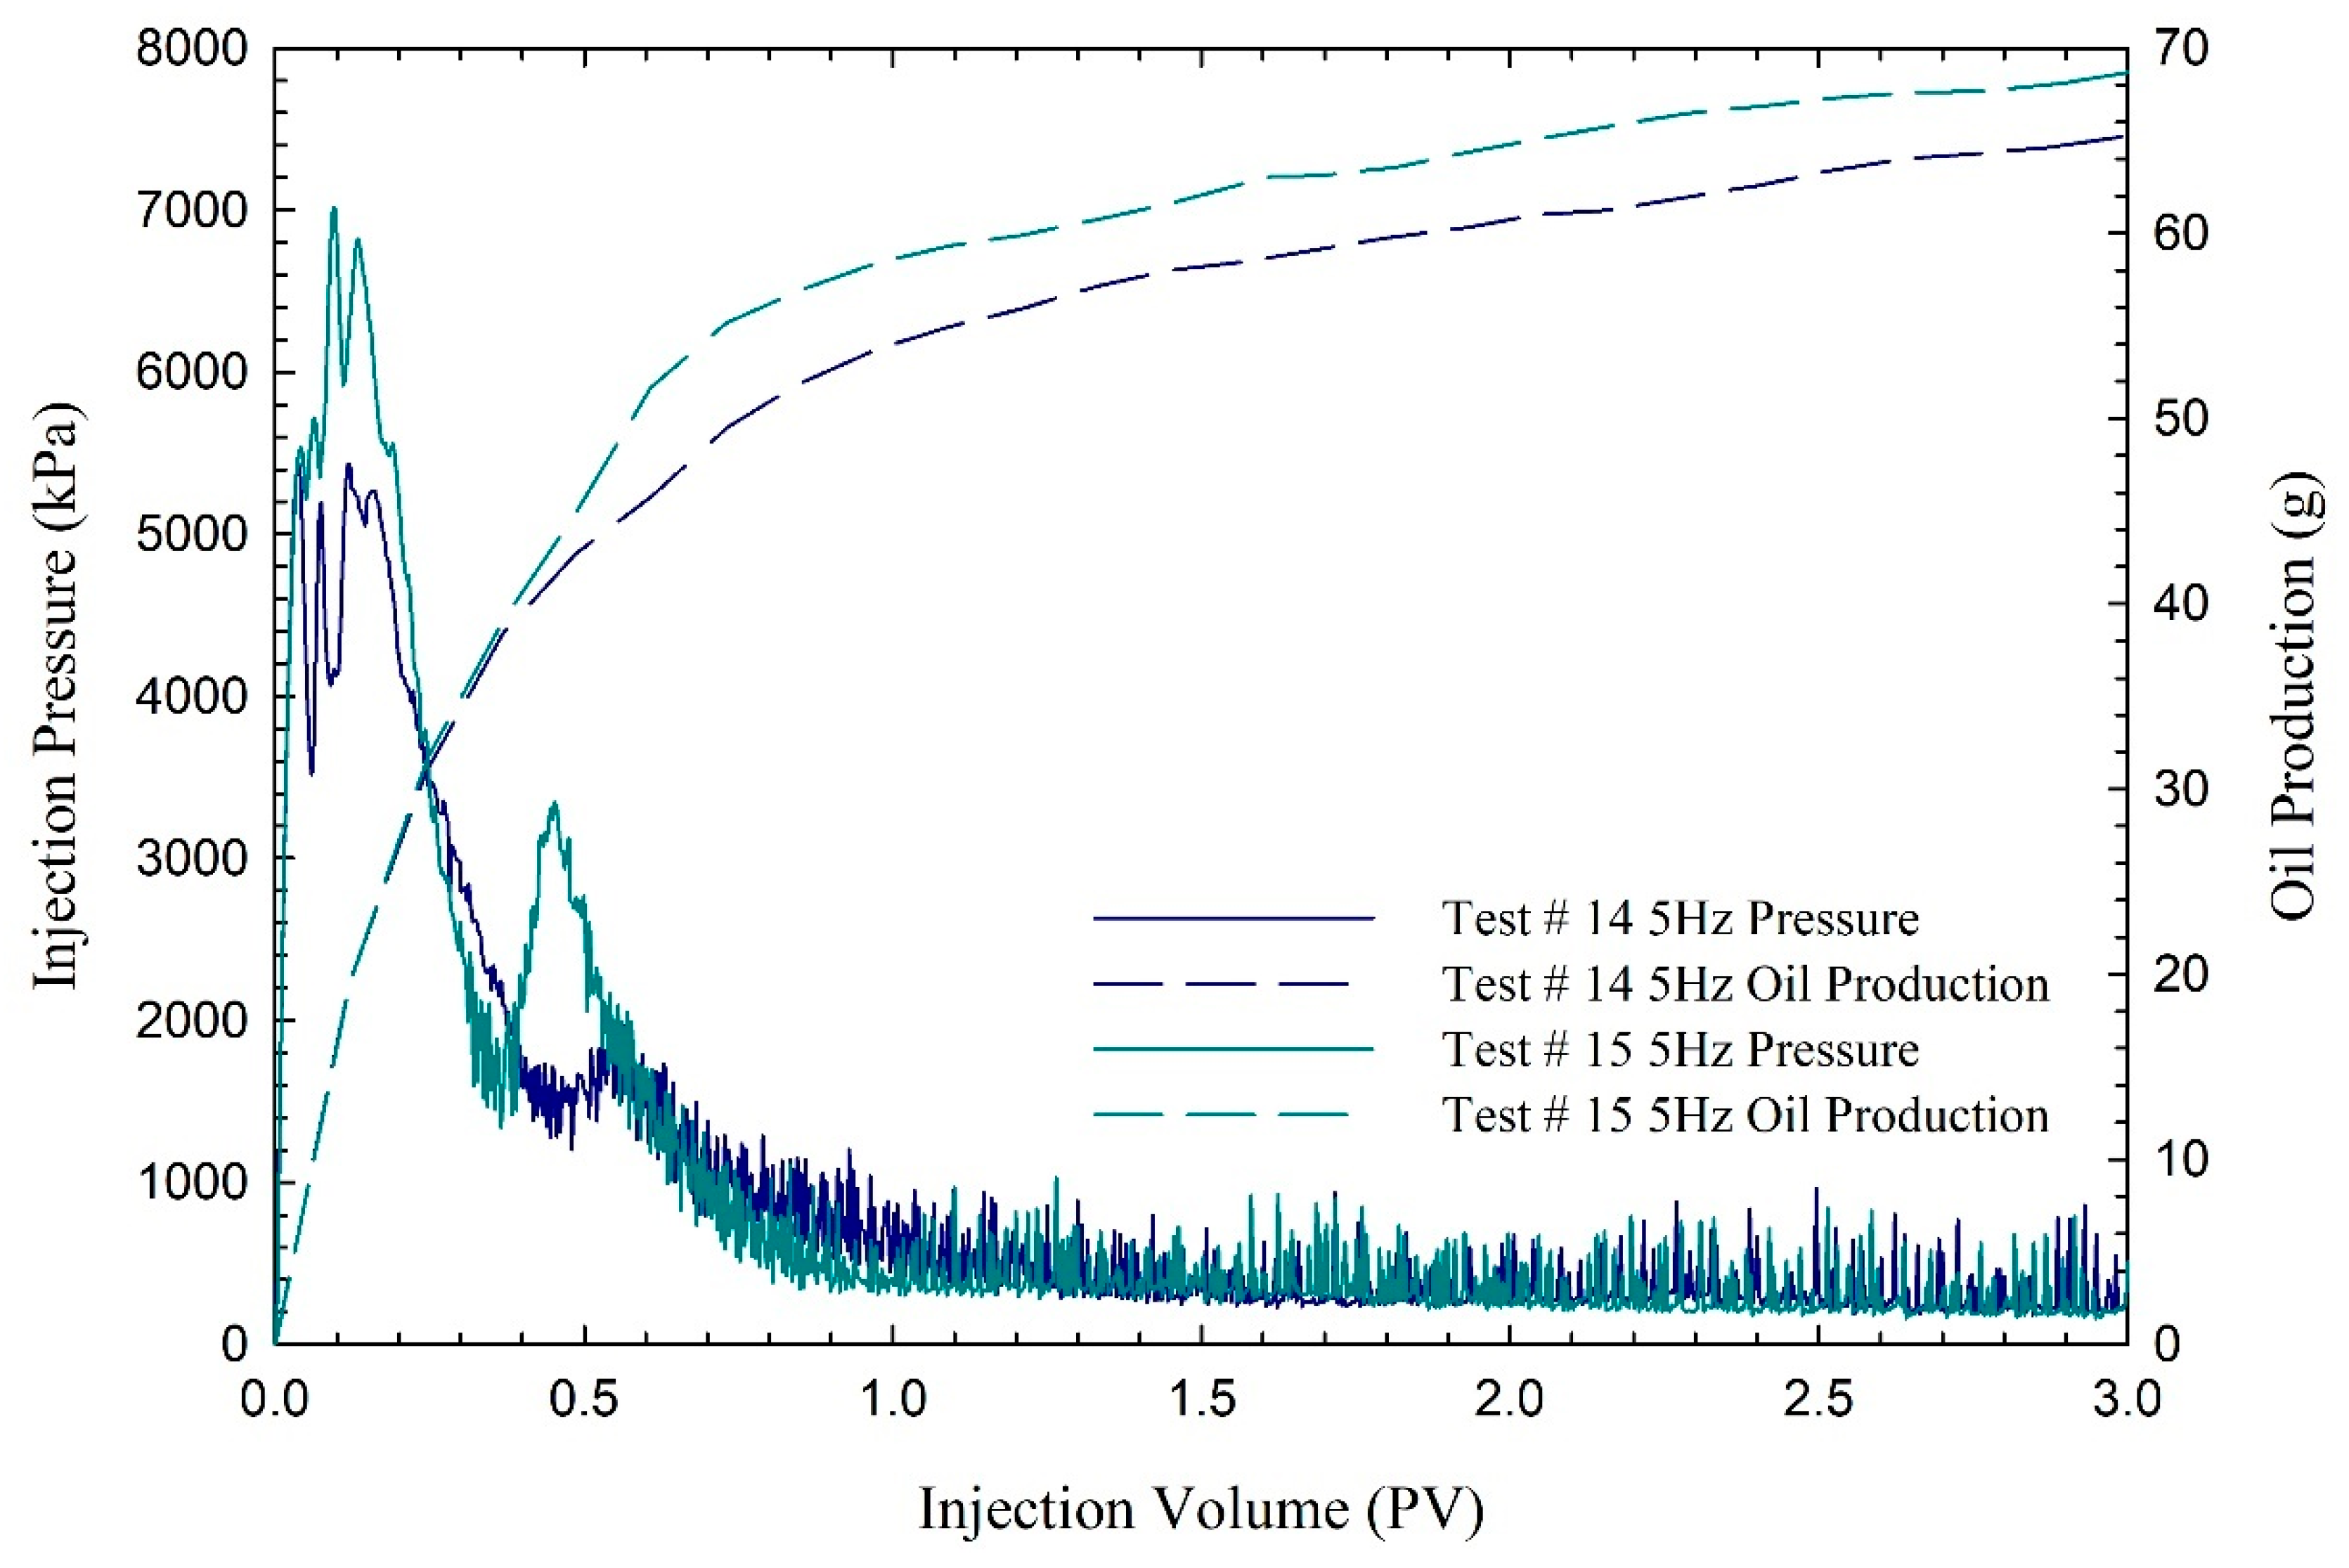
3.4.3. Higher-Frequency Vibration Effects (5 Hz)

Figure 8 shows Tests 14 and 15, applying 5 Hz vibration excitation, recorded peak pressures of 5400 kPa and 7000 kPa, respectively. Stick-slip behavior under 5 Hz vibration differed from lower frequencies, with primary stick events occurring later (0.4–0.5 PV) compared to 0.3–0.35 PV in lower-frequency tests.
To further quantify the relationship between pressure fluctuations and oil production under different vibration conditions, a statistical analysis was performed using a one-way ANOVA on the pressure fluctuation and oil production data for these tests.
To quantitatively assess the relationship between dynamic flow resistance and oil production, pressure fluctuation was calculated for each test. The total pressure fluctuation (ΔPfluctuation) was defined as the sum of absolute differences between consecutive pressure measurements, starting from 0.95 injected pore volumes (PV) to focus on the long-tail recovery phase:
P f l u c t u a t i o n =   i = a b 1 P t i + 1 P ( t i )
where P(ti) is the recorded pressure at time ti, and the summation runs over the selected time interval for each test.
The results show that in the absence of vibration (Test 10), the correlation between pressure variation and oil production is weak and statistically insignificant (p = 0.272, R2 = 7.49%). In contrast, vibration-assisted tests demonstrated strong statistical significance, with much higher coefficients of determination (e.g., Test 13, 2 Hz: p < 0.001, R2 = 66.96%; Test 14, 5 Hz: p < 0.001, R2 = 79.54%). These findings confirm that vibration-induced pressure fluctuations are closely linked to enhanced oil mobilization, supporting the mechanistic interpretation that dynamic flow resistance changes—triggered by vibration—directly contribute to increased recovery efficiency. The evolution of pressure fluctuations for all constant flow rate tests (Tests 10–15) is illustrated in Figure 9, highlighting the much higher fluctuation magnitudes under vibration-assisted conditions.

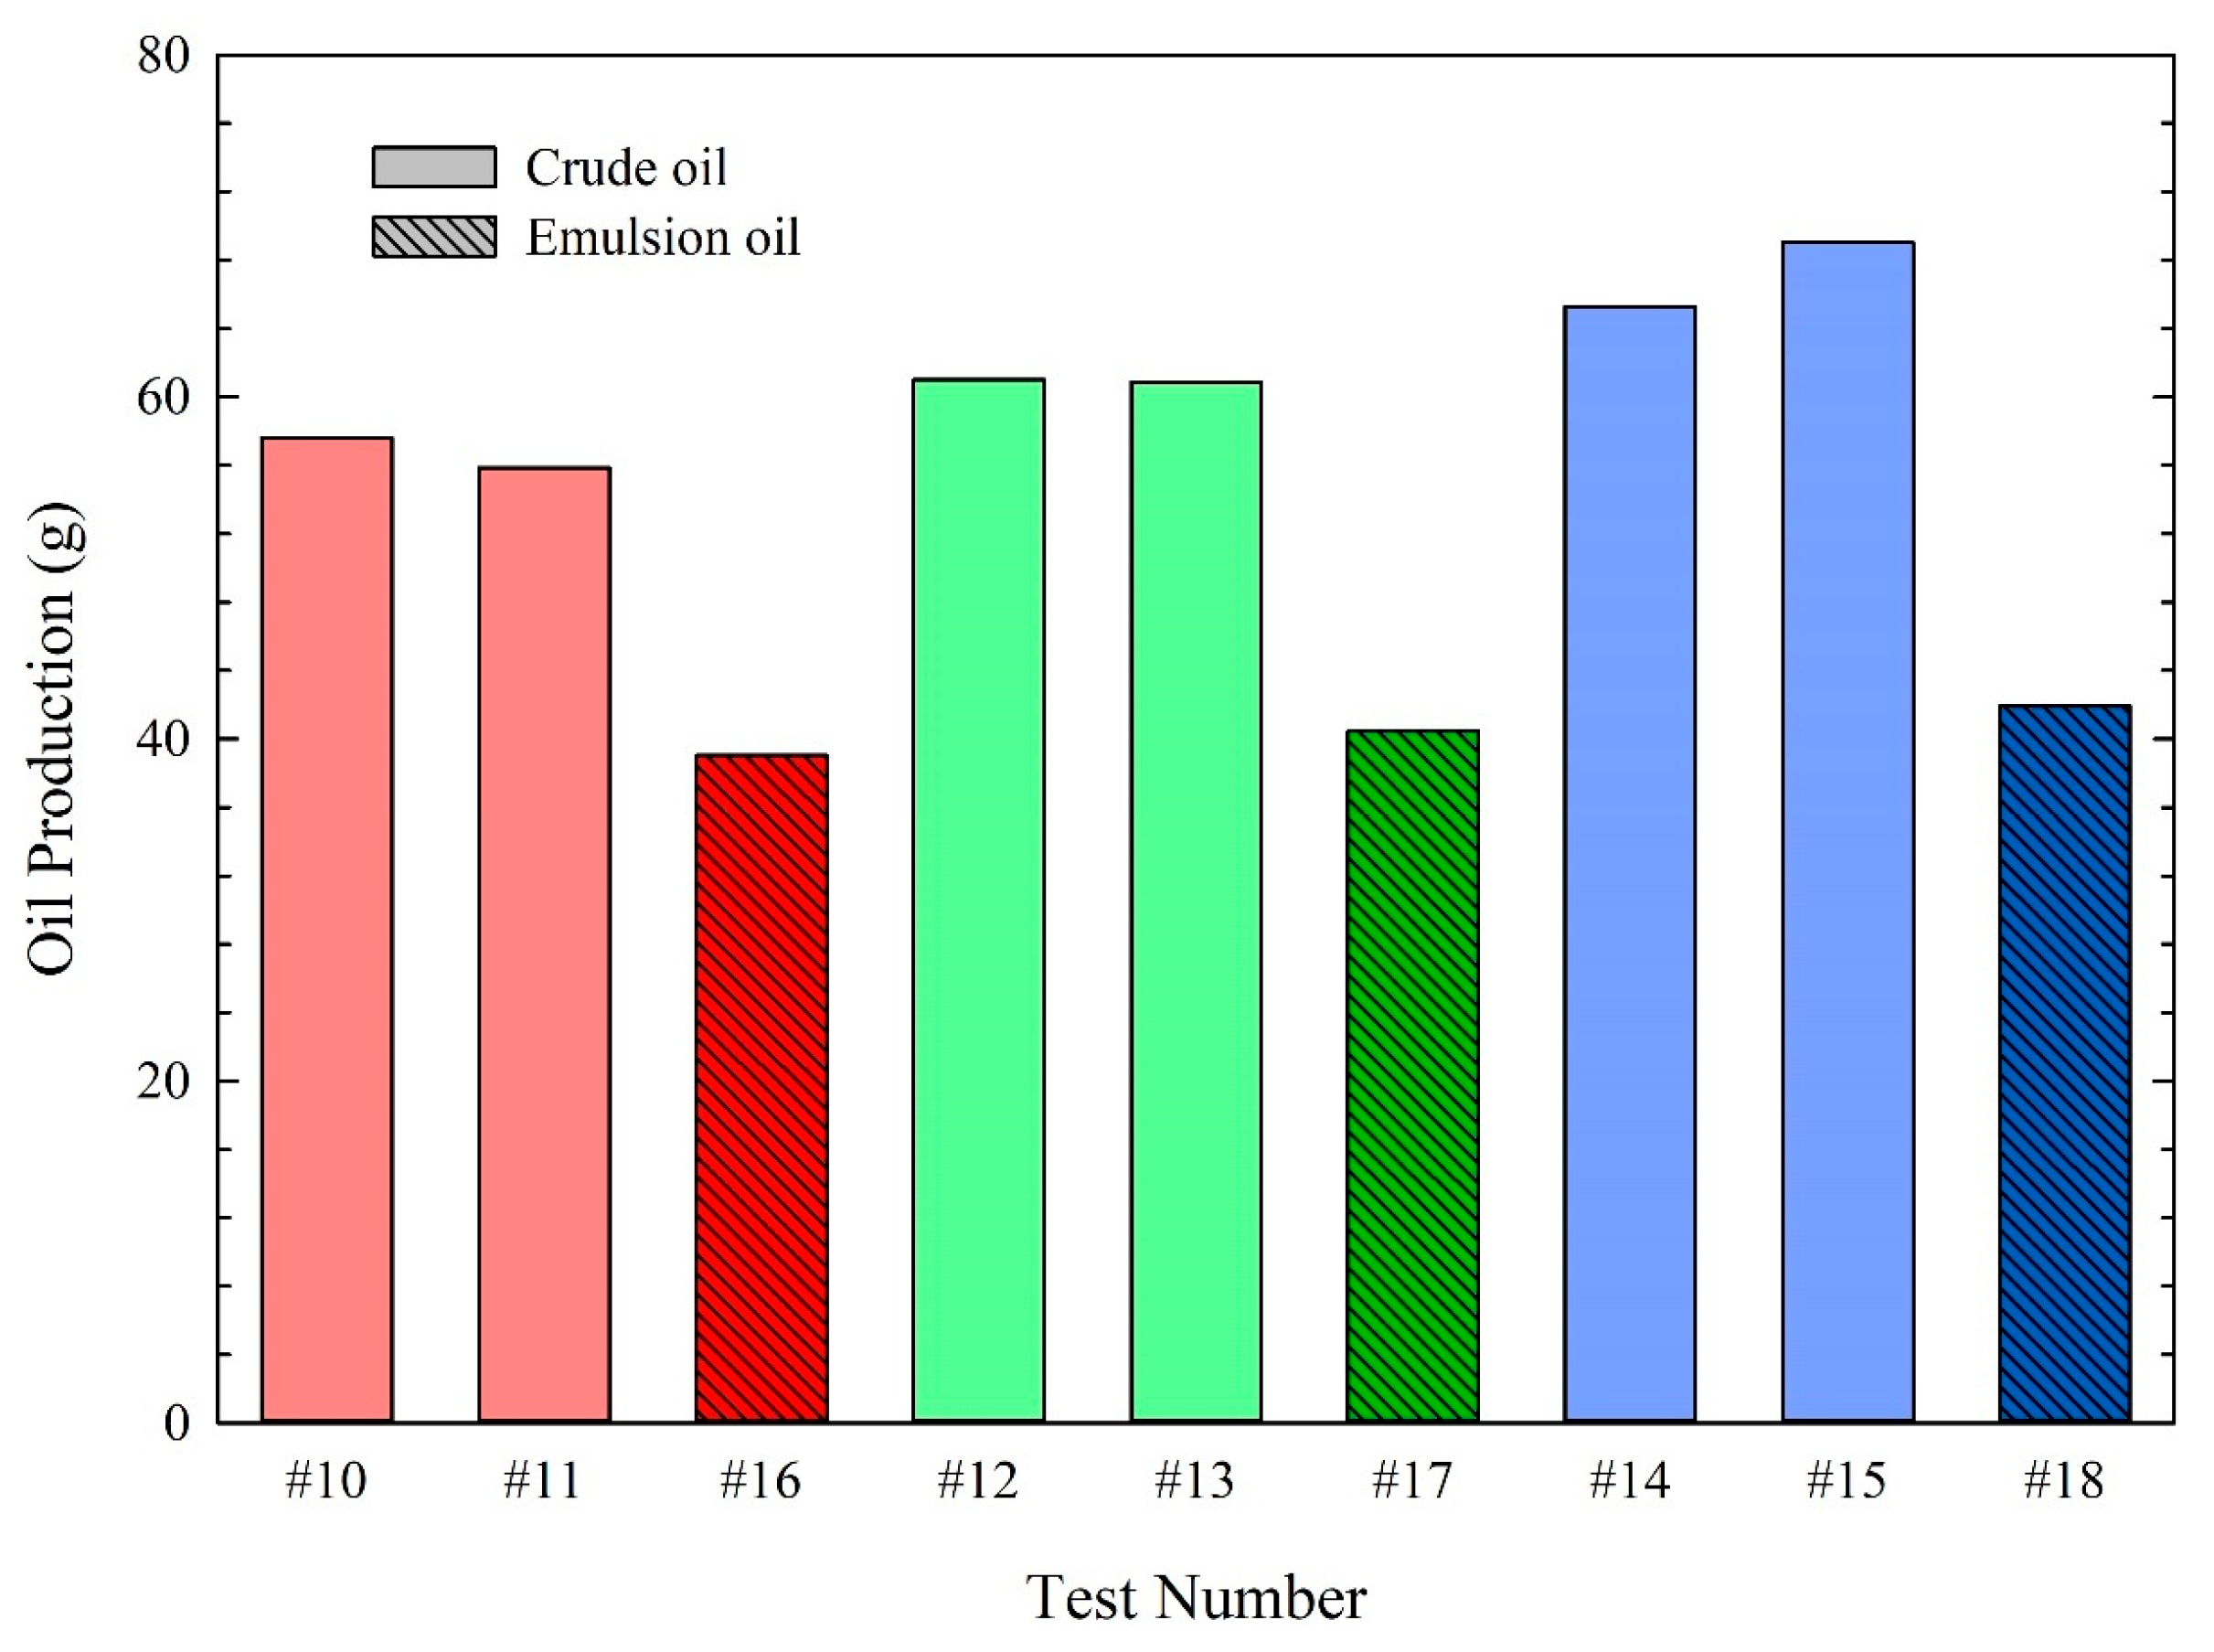
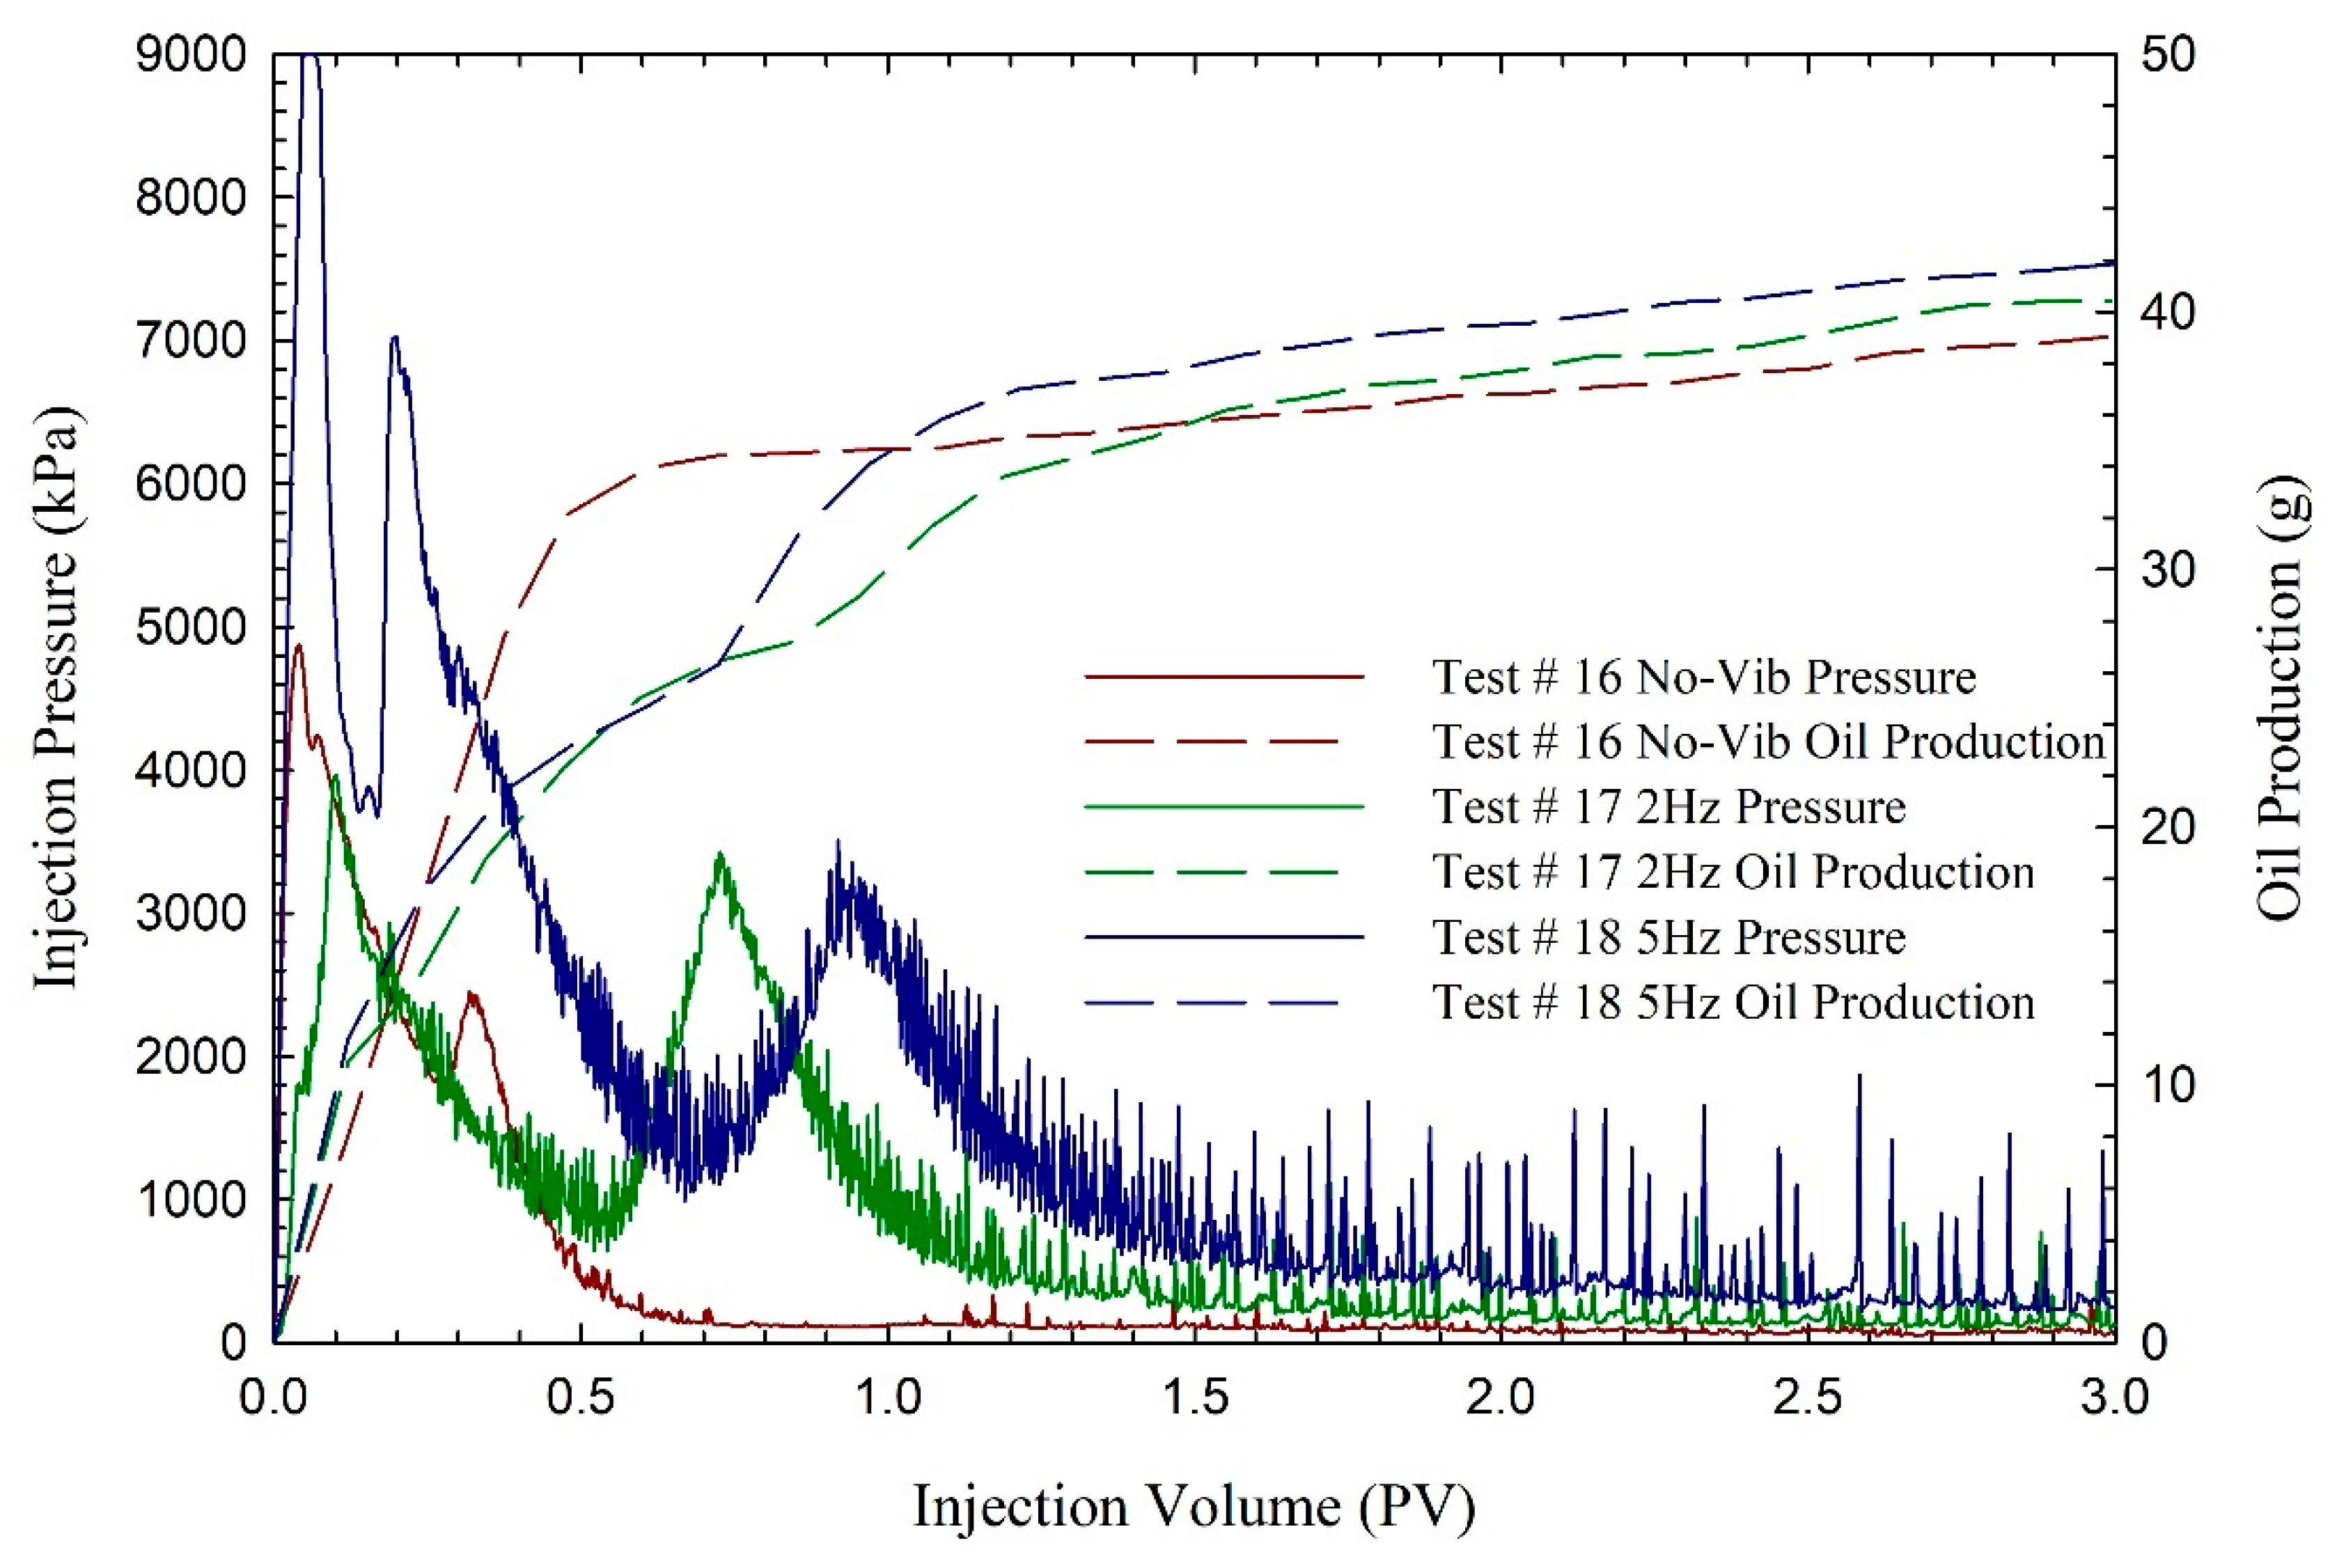
3.5. Emulsified Oil Recovery Analysis

Emulsified oil samples simulated post-production reservoir conditions with significantly higher viscosity (14,500 cP) compared to crude oil (8940 cP). In Test 16 (no vibration), injection pressure exhibited sharp initial spikes reaching 6400 kPa before a gradual decline. Significant stick-slip events occurred early, with pressure rebounding from 3800 kPa to 7000 kPa.
Despite elevated viscosity challenges, vibration excitation moderately improved emulsified oil recovery. Figure 10 shows that oil production increased from 39.05 g without vibration to 40.46 g and 41.92 g under 2 Hz and 5 Hz vibration, respectively. This modest improvement (5–10%) resulted from the emulsion’s rigid structure caused by dispersed water droplets and strong internal cohesion.
The statistical analysis for the emulsion oil tests further supports these observations. Without vibration (Test 16), the correlation between pressure fluctuation and oil production was moderate but not statistically significant (p = 0.082, R2 = 17.72%). When vibration was applied, especially at 5 Hz (Test 18), the relationship became highly significant (p < 0.001, R2 = 88.29%). This indicates that, although the overall recovery improvement for emulsified oil is limited by its physical properties, vibration still plays a crucial role in mobilizing high-viscosity emulsions by enhancing the link between dynamic pressure changes and oil production. Figure 11 also presents the pressure fluctuation evolution for emulsion oil tests (Tests 16–18), showing a similar trend of increased fluctuations and stronger statistical correlation with oil production under vibration.

3.6. Intermittent Mode of WF and VS-WF Tests

Intermittent vibration and alternating injection schemes were evaluated in Tests 19–22 to assess their impact on oil recovery and flow behavior. Each test began with a constant pressure injection phase (350 kPa) followed by a constant flow rate phase (3 mL/min), with 5 Hz vibration applied during the initial stage in Tests 21 and 22. Injection times for the constant pressure stage were longer with vibration (89–90 min) compared to without (66–70 min), indicating that vibration altered flow resistance by mobilizing trapped oil.
Pressure profiles and oil production data (Figure 12) show that vibration during the early stage produced more pronounced pressure fluctuations and higher oil recovery. Tests 21 and 22 (with vibration) yielded 37.79 g and 36.26 g of oil, respectively, compared to 29.61 g and 30.44 g in non-vibration cases (Tests 19 and 20). Table 3 summarizes oil production for each stage.
Although the total recovery from intermittent vibration tests was slightly lower than from continuous vibration tests, the reduction in vibration duration demonstrates improved energy efficiency. These results highlight that applying vibration during critical early injection stages enhances oil mobilization and offers a practical, energy-saving strategy for field implementation.

4. Mechanistic Discussion

4.1. Vibration-Induced Flow Enhancement Mechanisms

Vibration stimulation enhances oil recovery through multiple synergistic mechanisms. Primary mechanisms include the following: (1) reduction of interfacial tension between oil and water phases, (2) disruption of capillary trapping through stick-slip motion induction, (3) enhancement of oil phase permeability while suppressing water phase flow, and (4) mobilization of residual oil through dynamic pressure fluctuations.

4.2. Frequency-Dependent Performance

Lower frequencies (2 Hz) demonstrated effectiveness in mobilizing heavy crude oil through sustained pressure wave propagation, while higher frequencies (5 Hz) provided enhanced performance for both crude and emulsified oil systems. Frequency optimization depends on fluid properties, with higher viscosity fluids requiring tailored frequency selection for maximum mobilization efficiency.

4.3. Comparison with Existing Literature

These results extend previous findings on vibration-enhanced EOR by providing quantitative analysis of stick-slip behavior and pressure–production correlations. Unlike previous studies focusing primarily on ultrasonic frequencies, this investigation demonstrates that low-frequency vibrations (2–5 Hz) provide substantial recovery improvements while maintaining energy efficiency. The observed 24% recovery improvement for crude oil exceeds typical waterflooding enhancement factors reported in conventional EOR literature, while the statistical correlation between pressure fluctuations and oil production provides novel insights into vibration-assisted recovery mechanisms.

5. Conclusions

This investigation demonstrates that vibration stimulation substantially enhances oil production during waterflooding operations, achieving recovery increases of 9–24% for crude oil and 5–10% for emulsified oil. Optimal improvements occurred under constant flow conditions with 5 Hz vibration, confirming that proper vibration parameter tuning plays a critical role in maximizing recovery efficiency.
Key findings:
  • Vibration alters flow behavior by inducing stick-slip dynamics, reducing flow resistance, and facilitating trapped oil mobilization.
  • Higher frequencies and pressures more easily overcome critical thresholds for slip event initiation.
  • Intermittent vibration provides energy-efficient alternatives to continuous stimulation, achieving comparable recovery with approximately 50% reduced energy input.
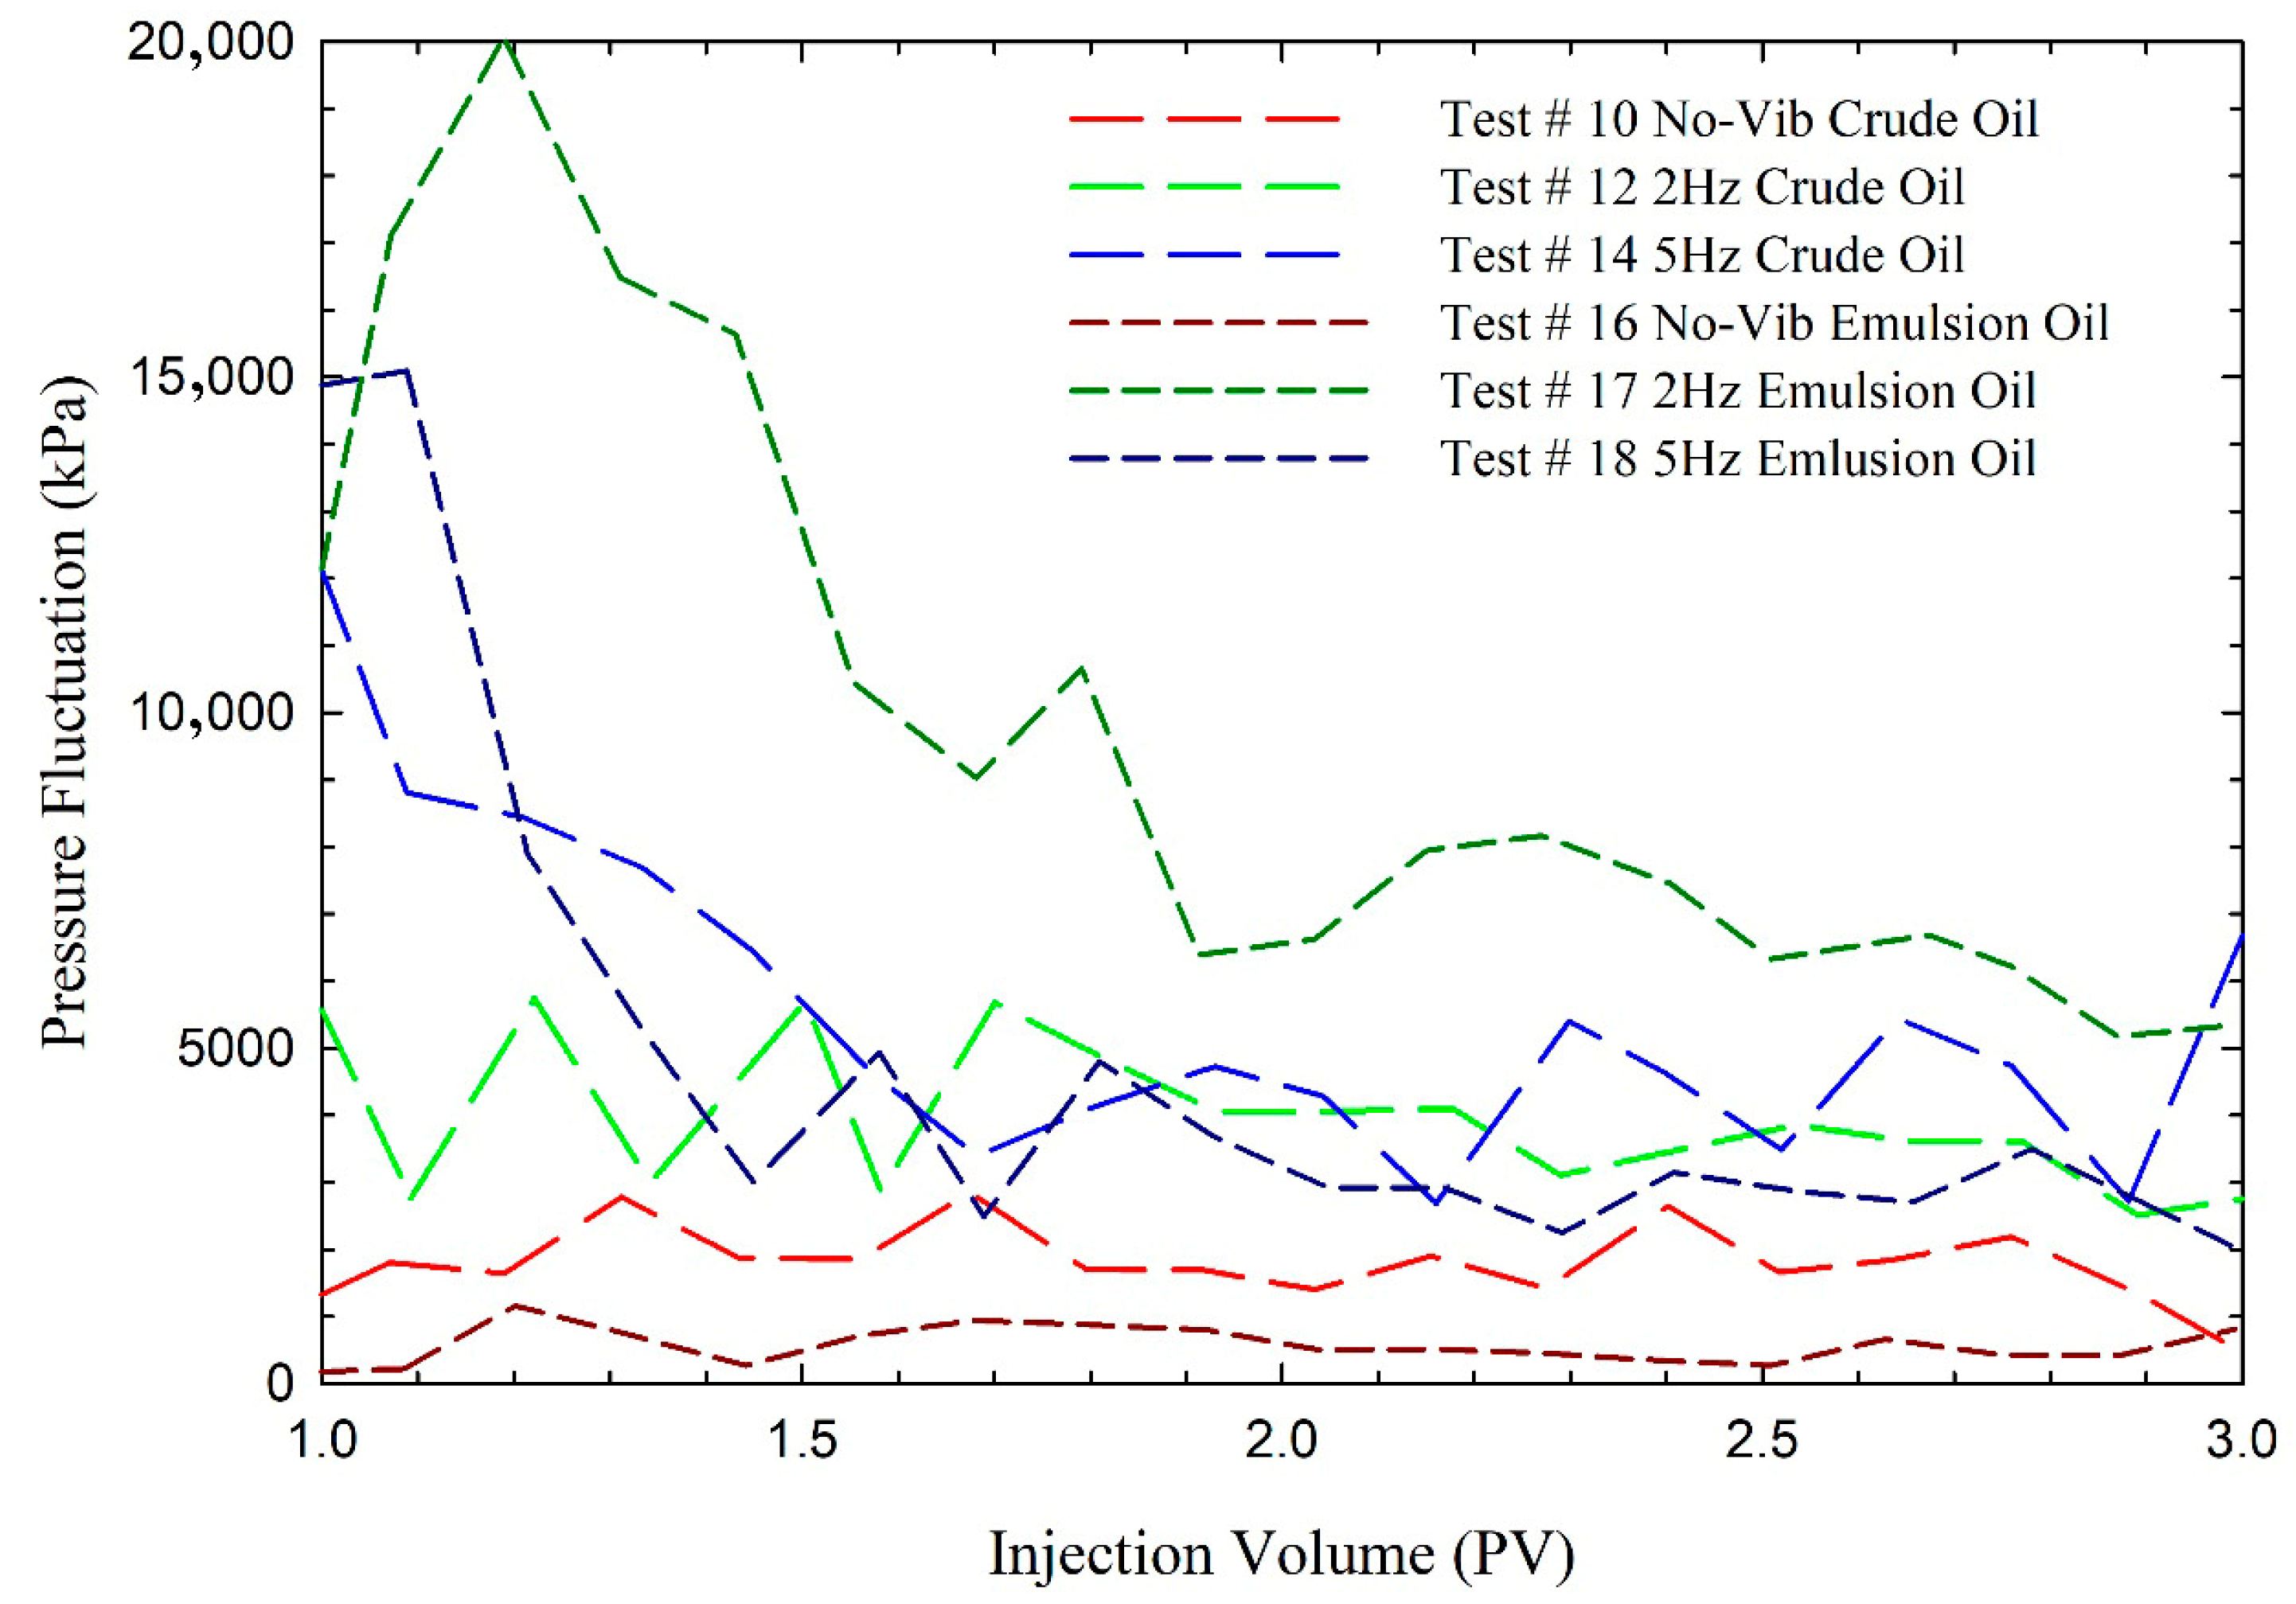
  • Strong correlations exist between pressure fluctuations and oil production in vibration-assisted tests, contrasting with smooth pressure profiles and lower recovery in non-vibration cases.
  • Emulsified oil recovery demonstrates reduced sensitivity to vibration due to elevated viscosity, but clear benefits remain evident.
These findings establish vibration-stimulated waterflooding as a practical and adaptable method for improving oil recovery in heterogeneous reservoirs. Future investigations should focus on vibration timing optimization and long-term field-scale performance assessment under variable reservoir conditions.

Author Contributions

Conceptualization, N.J. and S.L.; methodology, N.J., L.D. and S.L.; software, S.L.; data curation, S.L.; writing—original draft preparation, S.L. and Z.Z.; writing—review and editing, N.J., S.L., L.D. and Z.Z.; visualization, S.L.; supervision, N.J. and L.D.; project administration, N.J. and L.D.; funding acquisition, N.J. and L.D. All authors have read and agreed to the published version of the manuscript.

Funding

This research received no external funding.

Data Availability Statement

Data are contained within the article.

Acknowledgments

The authors appreciate the support from the Energy Systems Engineering and Industrial Systems Engineering programs at the Faculty of Engineering and Applied Science at the University of Regina.

Conflicts of Interest

The authors declare that they have no known competing financial interests or personal relationships that could have appeared to influence the work reported in this paper.

References

  1. Sun, Q.; Retnanto, A.; Amani, M. Seismic Vibration for Improved Oil Recovery: A Comprehensive Review of Literature. Int. J. Hydrogen Energy 2020, 45, 14756–14778. [Google Scholar] [CrossRef]
  2. Yang, H.; Lao, J.; Tong, D.; Song, H. Numerical Investigation on EOR in Porous Media by Cyclic Water Injection with Vibration Frequency. Water 2022, 14, 3961. [Google Scholar] [CrossRef]
  3. Pham, T.; Bui-Thanh, T.; Nguyen, Q. Microseismicity-Based Modelling of Induced Fracture Networks in Unconventional Reservoirs. Fuels 2024, 5, 839–856. [Google Scholar] [CrossRef]
  4. Westermark, R.V.; Brett, J.F.; Maloney, D.R. Enhanced Oil Recovery with Downhole Vibration Stimulation. In Proceedings of the SPE Production and Operations Symposium, Oklahoma City, OK, USA, 24–27 March 2001. [Google Scholar] [CrossRef]
  5. Kouznetsov, O.L.; Simkin, E.M.; Chilingar, G.V.; Katz, S.A. Improved Oil Recovery by Application of Vibro-Energy to Waterflooded Sandstones. J. Pet. Sci. Eng. 1998, 19, 191–200. [Google Scholar] [CrossRef]
  6. Li, W.; Vigil, R.D.; Beresnev, I.A.; Iassonov, P.; Ewing, R. Vibration-Induced Mobilization of Trapped Oil Ganglia in Porous Media: Experimental Validation of a Capillary-Physics Mechanism. J. Colloid. Interface Sci. 2005, 289, 193–199. [Google Scholar] [CrossRef]
  7. Oraby, M.; Abdalla, M.; Aal, T.A.; Mousa, M.; El-Banbi, A. Optimization of the Vibration Parameters in the Vibro-Seismic Applications. J. Pet. Sci. Eng. 2022, 219, 111029. [Google Scholar] [CrossRef]
  8. Dong, M.; Fan, Q.; Dai, L. An Experimental Study of Mobilization and Creeping Flow of Oil Slugs in a Water-Filled Capillary. Transp. Porous Med. 2009, 80, 455–467. [Google Scholar] [CrossRef]
  9. Dai, L.; Zhang, Y. Effects of Low Frequency External Excitation on Oil Slug Mobilization and Flow in a Water Saturated Capillary Model. Petroleum 2019, 5, 375–381. [Google Scholar] [CrossRef]
  10. Riabokon, E.; Turbakov, M.; Kozhevnikov, E.; Aglan, M.; Startsev, D.; Yin, Q.; Wu, J. The Influence of Acoustic Vibrations Parameters on Permeability of Rocks. In Proceedings of the International Field Exploration and Development Conference, Xi’an, China, 12–14 September 2024; Lin, J., Ed.; Springer Nature: Singapore, 2025; pp. 1381–1392. [Google Scholar]
  11. Riabokon, E.; Yin, Q.; Guzev, M.; Turbakov, M.; Kozhevnikov, E.; Riabokon, N.; Panteleev, I. Resonance-Induced Restoration of Rock Permeability Degraded by Heavy Components of Crude Oil. Deep Undergr. Sci. Eng. 2025; early view. [Google Scholar] [CrossRef]
  12. Zheng, L.; Cui, W.; Liu, J.; Zhang, L. Influence of Low-Frequency Vibration Acceleration on the Permeability of Low Permeable Porous Media During Water Flooding. In Proceedings of the International Field Exploration and Development Conference, Xi’an, China, 18–20 September 2018; Lin, J., Ed.; Springer: Singapore, 2020; pp. 74–86. [Google Scholar]
  13. Pinilla, A.; Asuaje, M.; Ratkovich, N. Experimental and Computational Advances on the Study of Viscous Fingering: An Umbrella Review. Heliyon 2021, 7, e07614. [Google Scholar] [CrossRef] [PubMed]
  14. Song, R.; Tang, Y.; Wang, Y.; Xie, R.; Liu, J. Pore-Scale Numerical Simulation of CO2–Oil Two-Phase Flow: A Multiple-Parameter Analysis Based on Phase-Field Method. Energies 2023, 16, 82. [Google Scholar] [CrossRef]
  15. Kozlov, V.; Subbotin, S.; Karpunin, I. Supercritical Dynamics of an Oscillating Interface of Immiscible Liquids in Axisymmetric Hele-Shaw Cells. Fluids 2023, 8, 204. [Google Scholar] [CrossRef]
  16. Lyubimova, T.; Ivantsov, A.; Lyubimov, D. Control of Fingering Instability by Vibrations. Math. Model. Nat. Phenom. 2021, 16, 40. [Google Scholar] [CrossRef]
  17. Marfin, E.A.; Garaeva, S.V.; Abdrashitov, A.A. Experimental Study on Viscous Fingering in Hele-Shaw Cell under Acoustic Impact. IOP Conf. Ser. Mater. Sci. Eng. 2020, 927, 012027. [Google Scholar] [CrossRef]
  18. Zhu, J.; Wang, F.; Wang, J.; Li, Z.; Zhang, S. Investigation on Energy Enhancement of Shale Oil Imbibition Under Different Fracture Fluid Injection Methods—A Case Investigation of Jimsar Lucaogou Formation. Energies 2025, 18, 1412. [Google Scholar] [CrossRef]
  19. Bui, D.; Pham, D.; Nguyen, S.; Nguyen, K. Simulation-Based Optimization Workflow of CO2-EOR for Hydraulic Fractured Wells in Wolfcamp A Formation. Fuels 2024, 5, 673–697. [Google Scholar] [CrossRef]
  20. Guo, J.; Yang, E.; Zhao, Y.; Fu, H.; Dong, C.; Du, Q.; Zheng, X.; Wang, Z.; Yang, B.; Zhu, J. A New Method for Optimizing Water-Flooding Strategies in Multi-Layer Sandstone Reservoirs. Energies 2024, 17, 1828. [Google Scholar] [CrossRef]
  21. Wang, C.; Zhao, L.; Wu, Q.; Xu, A.; Yue, D.; Zhang, Y.; Gao, L. Influence of Sandstone Architecture on Waterflooding Characteristics in Common Heavy Oil Reservoir. In Proceedings of the International Field Exploration and Development Conference, Chengdu, China, 21–22 September 2017; Qu, Z., Lin, J., Eds.; Springer: Singapore, 2019; pp. 265–280. [Google Scholar]
  22. Lee, P.; Tang, H.; Yan, X.; Zhang, S.; Zhang, Z.; Liu, H. Laboratory Evaluation on the Water Flooding Characteristics in Bottom Water Reservoir Containing Interbeds. ACS Omega 2023, 8, 42409–42416. [Google Scholar] [CrossRef] [PubMed]
  23. Li, S.; Liu, Y.; Xue, L.; Yang, L.; Yuan, Z. Experimental Investigation on the Pore-Scale Mechanism of Improved Sweep Efficiency by Low-Salinity Water Flooding Using a Reservoir-on-a-Chip. ACS Omega 2021, 6, 20984–20991. [Google Scholar] [CrossRef]
  24. Mai, A.; Kantzas, A. Mechanisms of Heavy Oil Recovery by Low Rate Waterflooding. J. Can. Pet. Technol. 2010, 49, 44–50. [Google Scholar] [CrossRef]
  25. Hageman, T.; de Borst, R. Stick-Slip like Behavior in Shear Fracture Propagation Including the Effect of Fluid Flow. Int. J. Numer. Anal. Methods Geomech. 2021, 45, 965–989. [Google Scholar] [CrossRef]
  26. Zhao, F.; Sun, M.; Liu, Y.; Sun, W.; Guo, Q.; Yang, Z.; Zhang, C.; Li, M. Review of Foam with Novel CO2-Soluble Surfactants for Improved Mobility Control in Tight Oil Reservoirs. Molecules 2024, 29, 5411. [Google Scholar] [CrossRef]
  27. Turbakov, M.; Shcherbakov, A. Determination of Enhanced Oil Recovery Candidate Fields in the Volga-Ural Oil and Gas Region Territory. Energies 2015, 8, 11153–11166. [Google Scholar] [CrossRef]
  28. Gao, C.; Kuhlmann-Wilsdorf, D. On Stick-Slip and the Velocity Dependence of Friction at Low Speeds. J. Tribol. 1990, 112, 354–360. [Google Scholar] [CrossRef]
  29. Sochi, T. Slip at Fluid-Solid Interface. Polym. Rev. 2011, 51, 309–340. [Google Scholar] [CrossRef]
  30. Agi, A.; Junin, R.; Chong, A.S. Intermittent Ultrasonic Wave to Improve Oil Recovery. J. Pet. Sci. Eng. 2018, 166, 577–591. [Google Scholar] [CrossRef]
  31. Lu, S.; Zhang, Z.; Dai, L.; Jia, N. Vibration-Stimulated Gas Pressure Cycling Process for Enhanced Heavy Oil Recovery. Energy Fuels 2022, 36, 13007–13013. [Google Scholar] [CrossRef]
Figure 1. Schematic diagram of the experimental setup of WF and VS-WF.
Fuels 06 00056 g001
Figure 2. Schematic diagrams of vibration-stimulated waterflooding (VS-WF) process.
Fuels 06 00056 g002
Figure 3. Flow rate of constant pressure WF process with various pressure vs. (a) porous volume (PV), and (b) time for Tests 1–3.
Fuels 06 00056 g003
Figure 4. Flow rate of 2 Hz constant pressure VS-WF processes with various pressures vs. (a) porous volume (PV) and (b) time for Tests 4–8.
Fuels 06 00056 g004
Figure 5. Comparison of the flow rate for constant pressure VS-WF processes vs. time for Tests 3, 7, and 9.
Fuels 06 00056 g005
Figure 6. Pressure and oil production of constant flow rate WF process vs. time for Tests 10–11.
Fuels 06 00056 g006
Figure 7. Pressure and oil production of 2 Hz constant flow rate VS-WF processes vs. time for Tests 12–13.
Fuels 06 00056 g007
Figure 8. Pressure and oil production of 5 Hz constant flow rate VS-WF processes vs. time for Tests 14–15.
Fuels 06 00056 g008
Figure 9. Evolution of pressure fluctuations versus injected pore volume for selected vibration and non-vibration tests (Tests 10, 12, 14, 16–18).
Fuels 06 00056 g009
Figure 10. Comparison of oil production across different vibration conditions for constant flow rate VS-WF tests. Bar colors represent vibration frequencies (red: no vibration; green: 2 Hz; blue: 5 Hz).
Fuels 06 00056 g010
Figure 11. Pressure and oil production of intermittent emulsion oil WF and VS-WF processes vs. time for Tests 16–18.
Fuels 06 00056 g011
Figure 12. Pressure and oil production of intermittent emulsion oil WF and VS-WF processes vs. time for Tests 19–22.
Fuels 06 00056 g012
Table 1. Characteristics and production schemes for WF and VS-WF tests.
Test No.MethodFrequency
(Hz)
Inject VolumePressure
(kPa)
Flow Rate
(mL/min)
Inject Time
(min)
Oil
1Constant Pressure-3 PV200-611Crude Oil
2-500180
3-1000102
4270533
52200377
62350368
72500168
821000116
9Intermittent 2 Hz500181
10Constant Flow Rate--3167
11-167
122167
132167
145167
155167
16-167Emulsion
Oil
172167
185167
19Intermittent Injection-350225
205228
215248
225250
Table 2. Injection schemes for alternating injection WF and VS-WF tests.
Constant PressureConstant Flow Rate
Test No.Frequency (Hz)Pressure (kPa)Time (min)Inject VolumeFrequency (Hz)Flow Rate (mL/min)Time (min)Inject Volume
19-350660.125
PV
-31592.875
PV
20-705158
21589-159
225905160
Table 3. Heavy oil production for each stage of intermittent WF tests and VS-WF tests.
Constant PressureConstant Flow RateTotal Oil Production (g)
Test No.Frequency (Hz)Pressure (kPa)Oil Production (g)Frequency (Hz)Flow Rate (mL/min)Oil Production (g)
19-3504.3-325.3129.61
20-10.48519.9630.44
21516.3-21.4937.79
22515.18521.0836.26
Disclaimer/Publisher’s Note: The statements, opinions and data contained in all publications are solely those of the individual author(s) and contributor(s) and not of MDPI and/or the editor(s). MDPI and/or the editor(s) disclaim responsibility for any injury to people or property resulting from any ideas, methods, instructions or products referred to in the content.

