Abstract
This study evaluates the economic feasibility of flexible, renewable ammonia production in Italy through a comprehensive sensitivity analysis of the levelized cost of ammonia (LCOA). Ammonia is produced through Haber–Bosch synthesis from green hydrogen and nitrogen coming from alkaline electrolysis and cryogenic air separation, respectively. The analysis examines the impact of key parameters such as renewable source peak power, Haber–Bosch reactor flexibility, energy mix, electrochemical and hydrogen storage, on the final production cost. The location considered for the PV and wind power output is Southern Italy. The results show that a wind-driven system with minimal battery storage and a flexibility factor (ratio between the minimum operating capacity and the nominal capacity of the plant) of 20% offers the most cost-effective solution, but production is scaled down to 64 tpd. With the 2030 cost structure, battery storage offers better integration with wind systems and flexible operation, even at low levels of turndown. For different combinations of process design choices and flexibility, the optimal LCOA for a green ammonia production is approximately 0.59 USD/kgNH3 in 2050. This cost of production could be competitive with grey ammonia, provided that a carbon emission allowance of USD 0.12/kgCO2 is applied.
1. Introduction
Anthropogenic emissions of greenhouse gases (GHGs)—particularly CO2—from the combustion of fossil fuels are known to be the leading cause of global warming. In 2022, the largest absolute sectoral increase in emissions came from electricity and heat generation, which led to a new high of over 36.8 Gt of global energy-related CO2 emissions [1]. Renewable energy is one of the pillars for decarbonization. Taking account of all the ongoing policies that have been put in place or announced by legislation and regulatory measures, the Stated Policy Scenario forecasts a global emission of 36 GtCO2 in 2050 with renewables sharing almost 55% of global electricity generation. To achieve carbon neutrality by 2050, the Net-Zero Emissions (NZE) Scenario shows a much higher share of renewable electricity, almost 90%. Higher levels in the use of hydrogen, hydrogen-based fuels, and carbon capture utilization and storage will also support decarbonization. Thus, energy transition will be driven by the electrification of industrial and chemical processes powered by renewable energy, mainly solar and wind [2].
Ammonia is one of the main feedstocks for the chemical industry and it is the second most produced chemical by mass, after sulfuric acid. Approximately four-fifths of all ammonia is used to produce nitrogen fertilizers, and it supports food production for approximately half of the global population [3]. Besides its fundamental role in the production of fertilizers, ammonia is also the main feedstock for many other industrial products such as polyimides, nitric acid, nylon, pharmaceuticals, explosive materials, refrigerants, dyes, and cleaning solutions [4]. In addition, in recent years, ammonia was found to be an excellent hydrogen energy carrier in the “Power-To-X” (PtX) framework. Ammonia surpasses other carriers in terms of gravimetric density and volumetric density. Ammonia shows 17.8 wt% of hydrogen, approximately 3 times greater than that of methylcyclohexane (MCH), and, when liquefied at atmospheric pressure, it contains 12.1 kgH2 per 100 L, 1.7 higher than liquid hydrogen itself. Moreover, the liquefaction is energy effective as it is carried out at room temperature and at pressure below 1 MPa [5].
Several innovative technologies for ammonia synthesis, such as chemical looping and electrosynthesis ([6,7]) have shown promising results in research. However, they still face significant technical, economic, and scalability challenges, preventing them from replacing the well-established Haber–Bosch process. In fact, from the 1940s onward, nitrogen has been fixed in ammonia almost exclusively by the Haber–Bosch (HB) process. Since then, improvements have been made in efficiency, converter design and energy recovery in the synthesis section. However, in recent decades, there have been no fundamental changes in the chemical equipment itself, nor in the plant configuration [8]. The process is normally optimized for continuous mass production and combines elemental hydrogen and nitrogen under high pressure (approx. 200 bar) and temperature (400 °C). The reaction is exothermic, with 2.6 MJ/kgNH3 of heat released [9]. In gray ammonia production, hydrogen is provided by steam methane reforming. The entire process for gray ammonia production involves several energy sinks (primary reformer, steam generation, synthesis feed compression, ammonia refrigeration compression) and energy sources (water gas shift, methanation, and HB reactions). Today, 95% of the hydrogen feedstock for ammonia production is derived from fossil fuels. Therefore, the current global production of ammonia (ca. 200 Mtonne/year) accounts for 420 Mtonne/year of carbon dioxide emissions (1.3% of the global amount) [10]. When renewable energy sources are employed for hydrogen generation, the environmental impact of ammonia production is highly mitigated, introducing the concept of “green ammonia”. Integration of renewable energy sources for electricity production not only eliminates carbon emissions but also alleviates the heat constraints associated with integration. Indeed, the need to recycle heat from high-temperature reforming reactors using steam maximizes heat integration but sacrifices energy efficiency by requiring the use of low-efficiency (42–48%) condensing steam turbines in a heat engine, compromising the overall efficiency of the HB synthesis loop [11].
The downside of renewable production of ammonia is the coupling of a well-known, established production process such as HB, optimized for steady-state operability, with the high intermittency of the renewable energy sources. This integration often leads to mega-scale renewable farms and, consequently, very high capacity for storage systems, especially battery energy storage (BES).
BES not only affects the final cost of production, but also the environmental impact of the green ammonia process. Lithium-ion batteries are the most employed storage technology in a wide range of applications, from electric vehicles to grid support. However, their future implementation could be hindered by both the availability of raw materials (lithium, cobalt, nickel) and the carbon emissions related to the production and utilization phases. Battery storage is currently a minor consumer of lithium, accounting for approximately 5% of demand, but in the NZE Scenario, lithium demand for battery storage would rise to 130 kton Li in 2050, well over ten times the current demand [12]. Concerning availability, the current lithium resources are sufficiently abundant to support the expected increased uptake of the technology, but aggressive demand scenarios could pose challenges for the mining industry, that is highly concentrated in terms of reserves distribution [13]. As for the environmental impact, it has been calculated that the carbon footprint for a single Li-NMC battery stands at 189.357 kg CO2-eq/kWh, mining and producing stages being the most impacting (76.93%), followed by the usage stage (17.13%), primarily attributed to battery losses during charging and discharging [14]. To mitigate the drawbacks brought by resource criticality and environmental issues, the adoption of circular economic strategy is needed, like battery recycling, reuse, and remanufacture [14,15].
The introduction of a flexible synthesis reactor in the HB process synthesis unit would reduce storage needs and, consequently, the levelized cost of ammonia (LCOA). This topic began to gain attention less than 10 years ago and the frequency of publications has been more intense since 2022, even if the literature is still not very extensive. The research could be divided into two main fields. Some papers focus on sensitivity analysis and control models for the ammonia synthesis reactor under variable energy and mass flowrates to evaluate possible instabilities of chemical equipment ([16,17,18,19,20]). Others are interested in the optimal planning and sizing of the whole green ammonia plant to assess their impact on the cost of a flexible production ([21,22,23,24,25,26,27]). It is important to underline that these two fields of research are interconnected. Indeed, on the one hand, a high allowable minimum load for the ammonia reactor limits the flexibility of the whole plant. This leads to either larger storage systems with consequent prohibitive costs, or excessive use of grid electricity for a “green” production [28]. On the other hand, taking into account the contributions of all the units involved, from renewable energy farms to the reactor, it may be found a lower limit in the operating conditions below which flexibility is not cost impacting. In this case, optimized system integration among the different sections of the plant (i.e., heat recovery from the synthesis unit, or energy-effective separation of ammonia) is the key to a further reduction in the LCOA. Regarding the economic evaluation of a load-variable production of green ammonia, the majority works on the subject focus on the resources available in South America, Australia and Northern Europe and none of them addresses explicitly the Italian case.
Sensitivity analysis is a suited approach to understanding the impact of the single factors on the overall problem, thus identifying trends and dependencies of general application. In this context, the objective of this work is to perform a comprehensive sensitivity analysis on the levelized cost of ammonia to assess the feasibility of its flexible, renewable production for an appropriate coupling with intermittent renewable sources for the Italian region.
2. Methods
2.1. Plant Description: Efficiency and Cost Assumptions
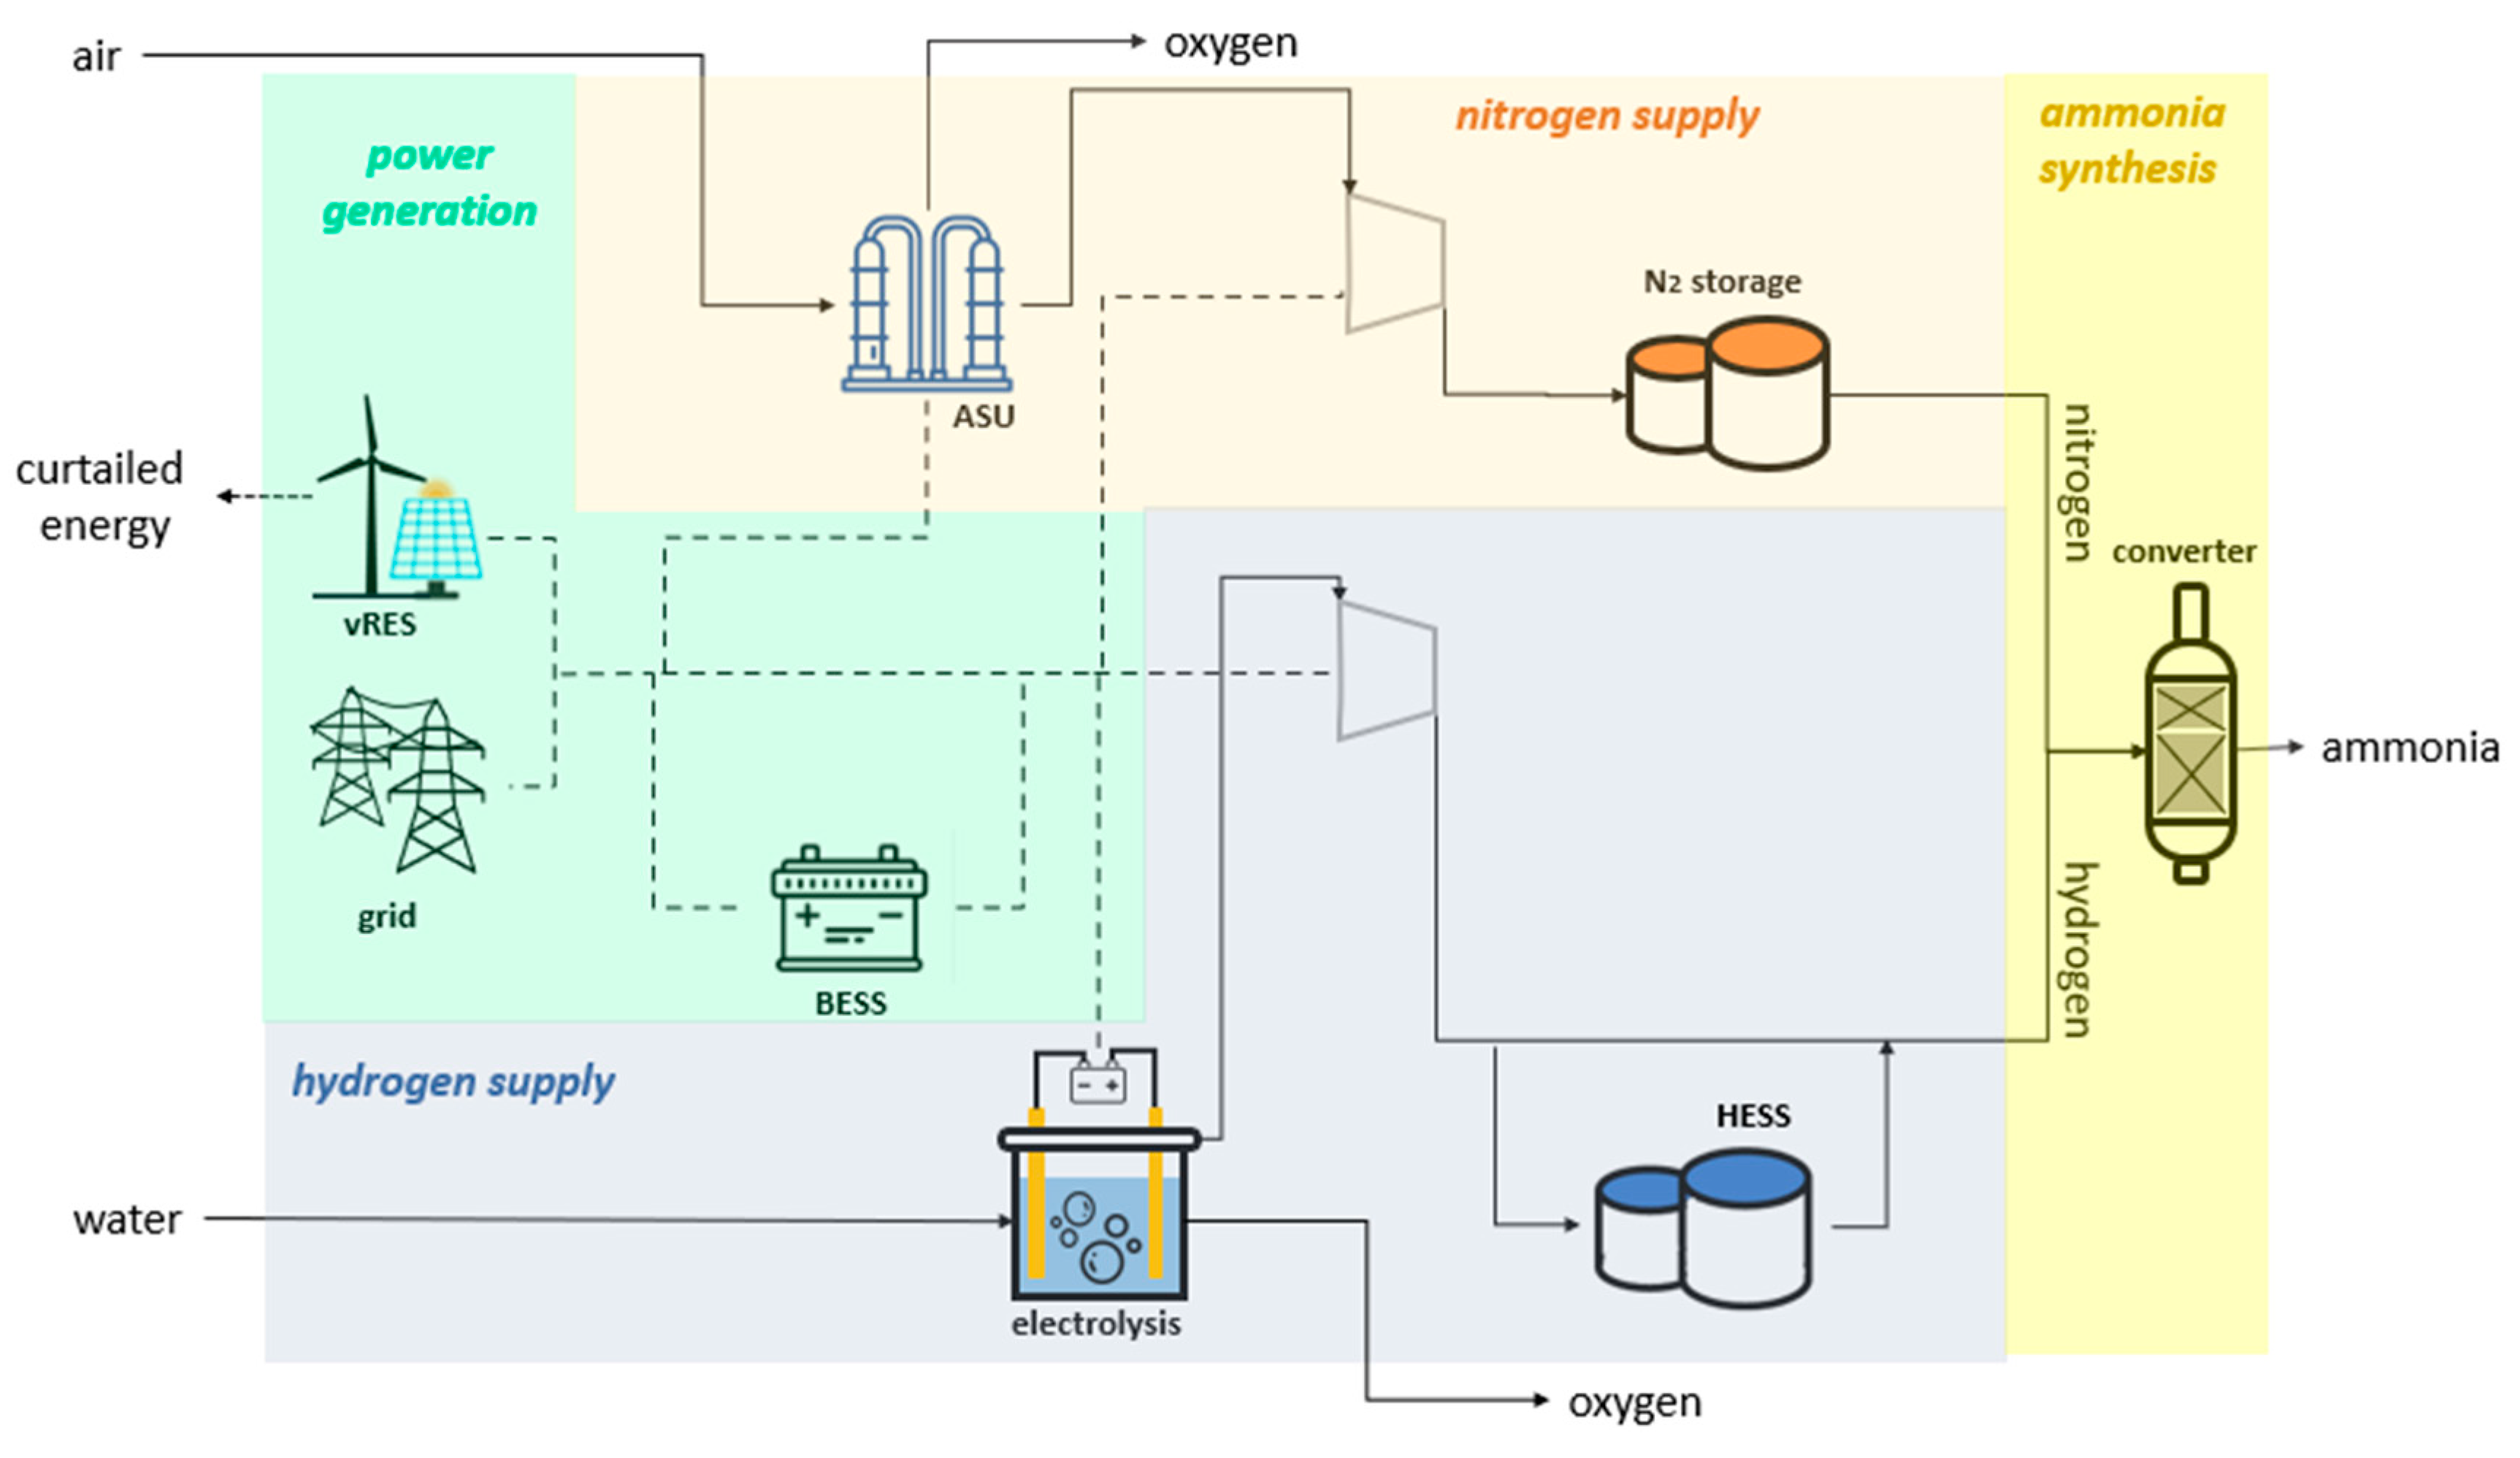
A small-to-medium nominal production of ammonia of 100 tpd referring to the scheme illustrated in Figure 1 has been considered in this study. The system is composed of four fundamental units: power generation (from solar and wind sources, and from grid), hydrogen and nitrogen supply (each including production and storage), and a synthesis unit where the Haber–Bosch reaction takes place:

Figure 1.
Fundamentals units for ammonia production from green hydrogen.
It is worth noting that there are a number of configurations in which the four units could be installed for process optimization, both in terms of power and heat integration, i.e., exploiting the heat generated by the synthesis unit. However, in this study, we focus on the economic benefit that an ideal flexible unit could bring to the LCOA. Thus, we exclude other external factors that could lower the final production costs, such as the possible revenues from oxygen and curtailed energy.
We fix the nominal production capacity of the plant to 100 tpd of ammonia, which corresponds to a small to medium plant. The plant is supposed to operate with a capacity factor of 90% [29], allowing approximately five weeks of shutdown a year, to take into accounts the periods of maintenance.
Regarding power generation, onshore wind turbines and solar photovoltaic are the considered renewable sources. The location from which the hourly power profiles are extrapolated should also take into account appropriate characteristics for the implementation of the infrastructure (i.e., proximity to urban centers). For this reason, we accounted for the Italian weather profiles present in the following existing or under-construction renewable parks: San Vincenzo Wind Farm, located in the city of Troy, in Apulia (Southern Italy), where the current 21 aerogenerators (42 MW in total) are being replaced by 10 new aerogenerators for an overall output of 72 MW. In addition, the same city is home to Italy’s largest photovoltaic plant, with a peak power of 103 MW [30,31].
Base hourly power data are provided by the free-access online tool Renewable.ninja (v 1.1) ([32,33]), considering a base of 1000 kW peak power (data in Table 1).

Table 1.
Data for renewable power profiles in the Italian site.
Surplus renewable energy must be stored to contain the hours of energy shortfall. The three dominant energy storage technologies are pumped hydro, compressed air and batteries. Hydropower is 96% of the global storage capacity but has a round-trip efficiency of approximately 75% and it is site-constrained, as well as compressed air storage, that shows even lower efficiency. Battery energy storage system (BESS), on the other hand, offers greater flexibility in design and siting, allowing the system to operate in varying environments [34]. Among the electrochemical storage devices, the Li-ion battery is the best candidate for grid integrations of RESs applications, as it outperforms other batteries in terms of power, specific energy and daily self-discharge rate [35]. However, even if they generally show a long lifetime, this hardly covers the entire lifetime span of the chemical plant and replacement is required. Concerning the costs of lithium-ion batteries, these data are highly dispersed across different sources ([13,36,37,38]). From [37] the materials represents the 77–86% of the full cost. Therefore, in this study, the cost for the substitution of the battery system is assumed to be 80% of the initial investment, supposing that the balance of plant (BOP) has not to not be replaced.
Concerning hydrogen production, there are four types of electrolyzer technologies available: alkaline electrolysis (AE) and polymer electrolyte membrane (PEM) are already commercial, while anion exchange membrane (AEM) and solid oxide (SOEC), now at lab scale, promise a major step forward [39]. In this work, alkaline electrolysis (AE) is employed because, due to its technological maturity, it is possible to assess reliably the feasibility of a short-time production and, when applied to ammonia, it outperforms PEM electrolysis in terms of costs [40]. For the operating conditions (minimum load, ramping rate, DC power consumption, output hydrogen pressure), we refer to a commercially available alkaline electrolyzer [41]. The costs associated with alkaline electrolysis are equally distributed between the stack and the balance of plant (BOP), 45% and 55%, respectively [39]. Hence, we consider the components subjected to replacement are the whole stack and part of the BOP such as pumps, valves, and sensors. For this reason, the replacement costs here taken amount to 50% of the initial investments, assuming a markup of 5% for the auxiliary components.
For large-scale applications, the current methods to store hydrogen as a pure compound are either in its compressed gaseous or liquified form. Considering its notable high density of 70 kg/m3 at atmospheric pressure, liquid hydrogen is a suitable option especially for transport or storage for compact-scale applications. However, it requires from 3.75 to 6 times the energy requirements for gaseous storage [42]. Concerning ammonia production, the conventional synthesis takes place in the gaseous form at the high pressure of 200 bar. Moreover, there are no impellent constraints on the compactness of volumes, since it is a large-scale, stationary application. Thus, in this study, hydrogen is stored at a compressed gas at the reaction pressure. The storage of gaseous hydrogen can be carried out either in vessels or geological, the latter one to be preferred for seasonal storage of huge amount of energy (GWh). The main weakness for gaseous hydrogen storage is the embrittlement of the material that hinders safety and durability. In this study, we refer to multifunctional steel layered hydrogen storage vessels (MSLVs), which combine different layers of materials to ensure storage requirements and hydrogen compatibility, making them less prone to hydrogen embrittlement [43].
The nitrogen production block operates in a steady state due to the presence of a product storage unit. The main part of the air inlet is cooled down in a recovery heat exchanger and fed to a Medium-Pressure column (6 bar), whose bottom product is crude liquid oxygen. The remaining air (10–20% of the feed) is fed in a high-pressure Linde cycle (200 bar) where it is cooled down by effect of Joule–Thompson expansion and fed in a distillation column operating at atmospheric pressure (Low-Pressure column) whose top product is the liquid nitrogen. The top product of the Medium-Pressure column provides for the thermal input of the reboiler of the Low-Pressure column. The liquid nitrogen is sent to the recovery heat exchanger and exits the unit in gaseous form at 1 bar. This is a conventional configuration already studied in the literature [44]. If this heat recovery system is applied, the power requirement of air separation consists mainly in the initial compression at 6 bars and on the following compression at 200 bars in the Linde cycle. Then, atmospheric nitrogen must be compressed for gaseous storage at the operating pressure of the synthesis unit (200 bars). The nitrogen flowrate fed to the reactor is adjusted on the fluctuating hydrogen supply to maintain the 1:3 ratio at the reactor inlet.
As previously mentioned, variable load operability remains a challenge for the HB converter; therefore, there is fervent activity to optimize chemical equipment for dynamic operation. In particular, most of these advancements include, for example, the development of new catalysts or reactor design to mitigate the harsh conditions of temperature, and especially pressure, at which reaction takes place. Currently, ruthenium-based catalysts have proven to be more efficient in ammonia synthesis, exhibiting higher activity at low pressures (20 bars) and high conversions. However, the scarcity and the cost of ruthenium is a challenge for its widespread implementation [8]. These technologies are still under development and, to assess the short-term feasibility of flexible green ammonia production, we refer to a conventional HB loop operating at 200 bar. In this study, the minimum load range for the HB is set between 20% and 90% of its nominal capacity, to be compared with the 100% steady-state case to assess the extent to which flexibility can contribute to reducing LCOA. Evaluating extreme operating conditions is also essential, as despite the realistic minimum capacity for the synthesis unit being approximately 60%, there is fervent activity to optimize chemical equipment for dynamic operation. Ramping-up/down rates have been neglected, since it has been shown not to have a meaningful effect on the final costs and system design ([24,26]).
The efficiency related to the single units described are shown in Figure 2, while the costs of process components assumed for the 2030 and 2050 scenario are shown in Table 2.
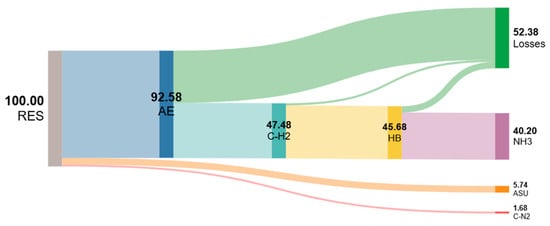
Figure 2.
Step-efficiencies for green ammonia production considered in this work (RES is renewable energy source, AE is alkaline electrolysis, C-H2 is compressed hydrogen, HB is Haber–Bosch, ASU is Air Separation Unit, and C-N2 is Compressed Nitrogen).
Table 2.
Cost assumption for 2030 and 2050 LCOA analysis.
2.2. Implementation in the MATLAB Environment
The dynamic simulation is conducted after determining the flexibility of the chemical plant, the renewable peak power and profile, and the corresponding storage requirements. The maximum ammonia production is set at 100 tpd, while the minimum plant capacity is defined as a fraction of the maximum capacity. The renewable hourly profile is influenced by the energy mix between solar and wind power. The key parameters governing the hourly power profile for ammonia production are:
- Flexibility (f = 20–100%), representing the minimum operational capacity of the plant as a fraction of its maximum capacity.
- Energy mix (m = 0–100%), defining the share of photovoltaic (PV) power relative to the total power (PV + wind).
With these parameters, the hourly power profile for ammonia production is established as:
In Equation (3), S is as a multiplicative factor that ensures the balance between surplus and deficit energy, representing the theoretical storage requirement for an islanded configuration. Given that each day of the year exhibits a unique renewable power profile, for each combination of f and m, we obtain 365 values of S, along with the corresponding total energy storage. The sizing of peak power and the battery energy storage (BES) and Hydrogen Energy Storage (HES) systems are determined based on two key parameters:
- 3.
- The percentile p = 60%, 80%, 100% defines the yearly S and, consequently, assesses the impact of the down-sized renewable energy input and production (i.e., when p = 80%, the plant is sized such that the peak power that is greater than the 80% of the 365 samples of S).
- 4.
- The allocation parameter k = 0%, 50%, 100%, which regulates the distribution of surplus energy of HES over BES.
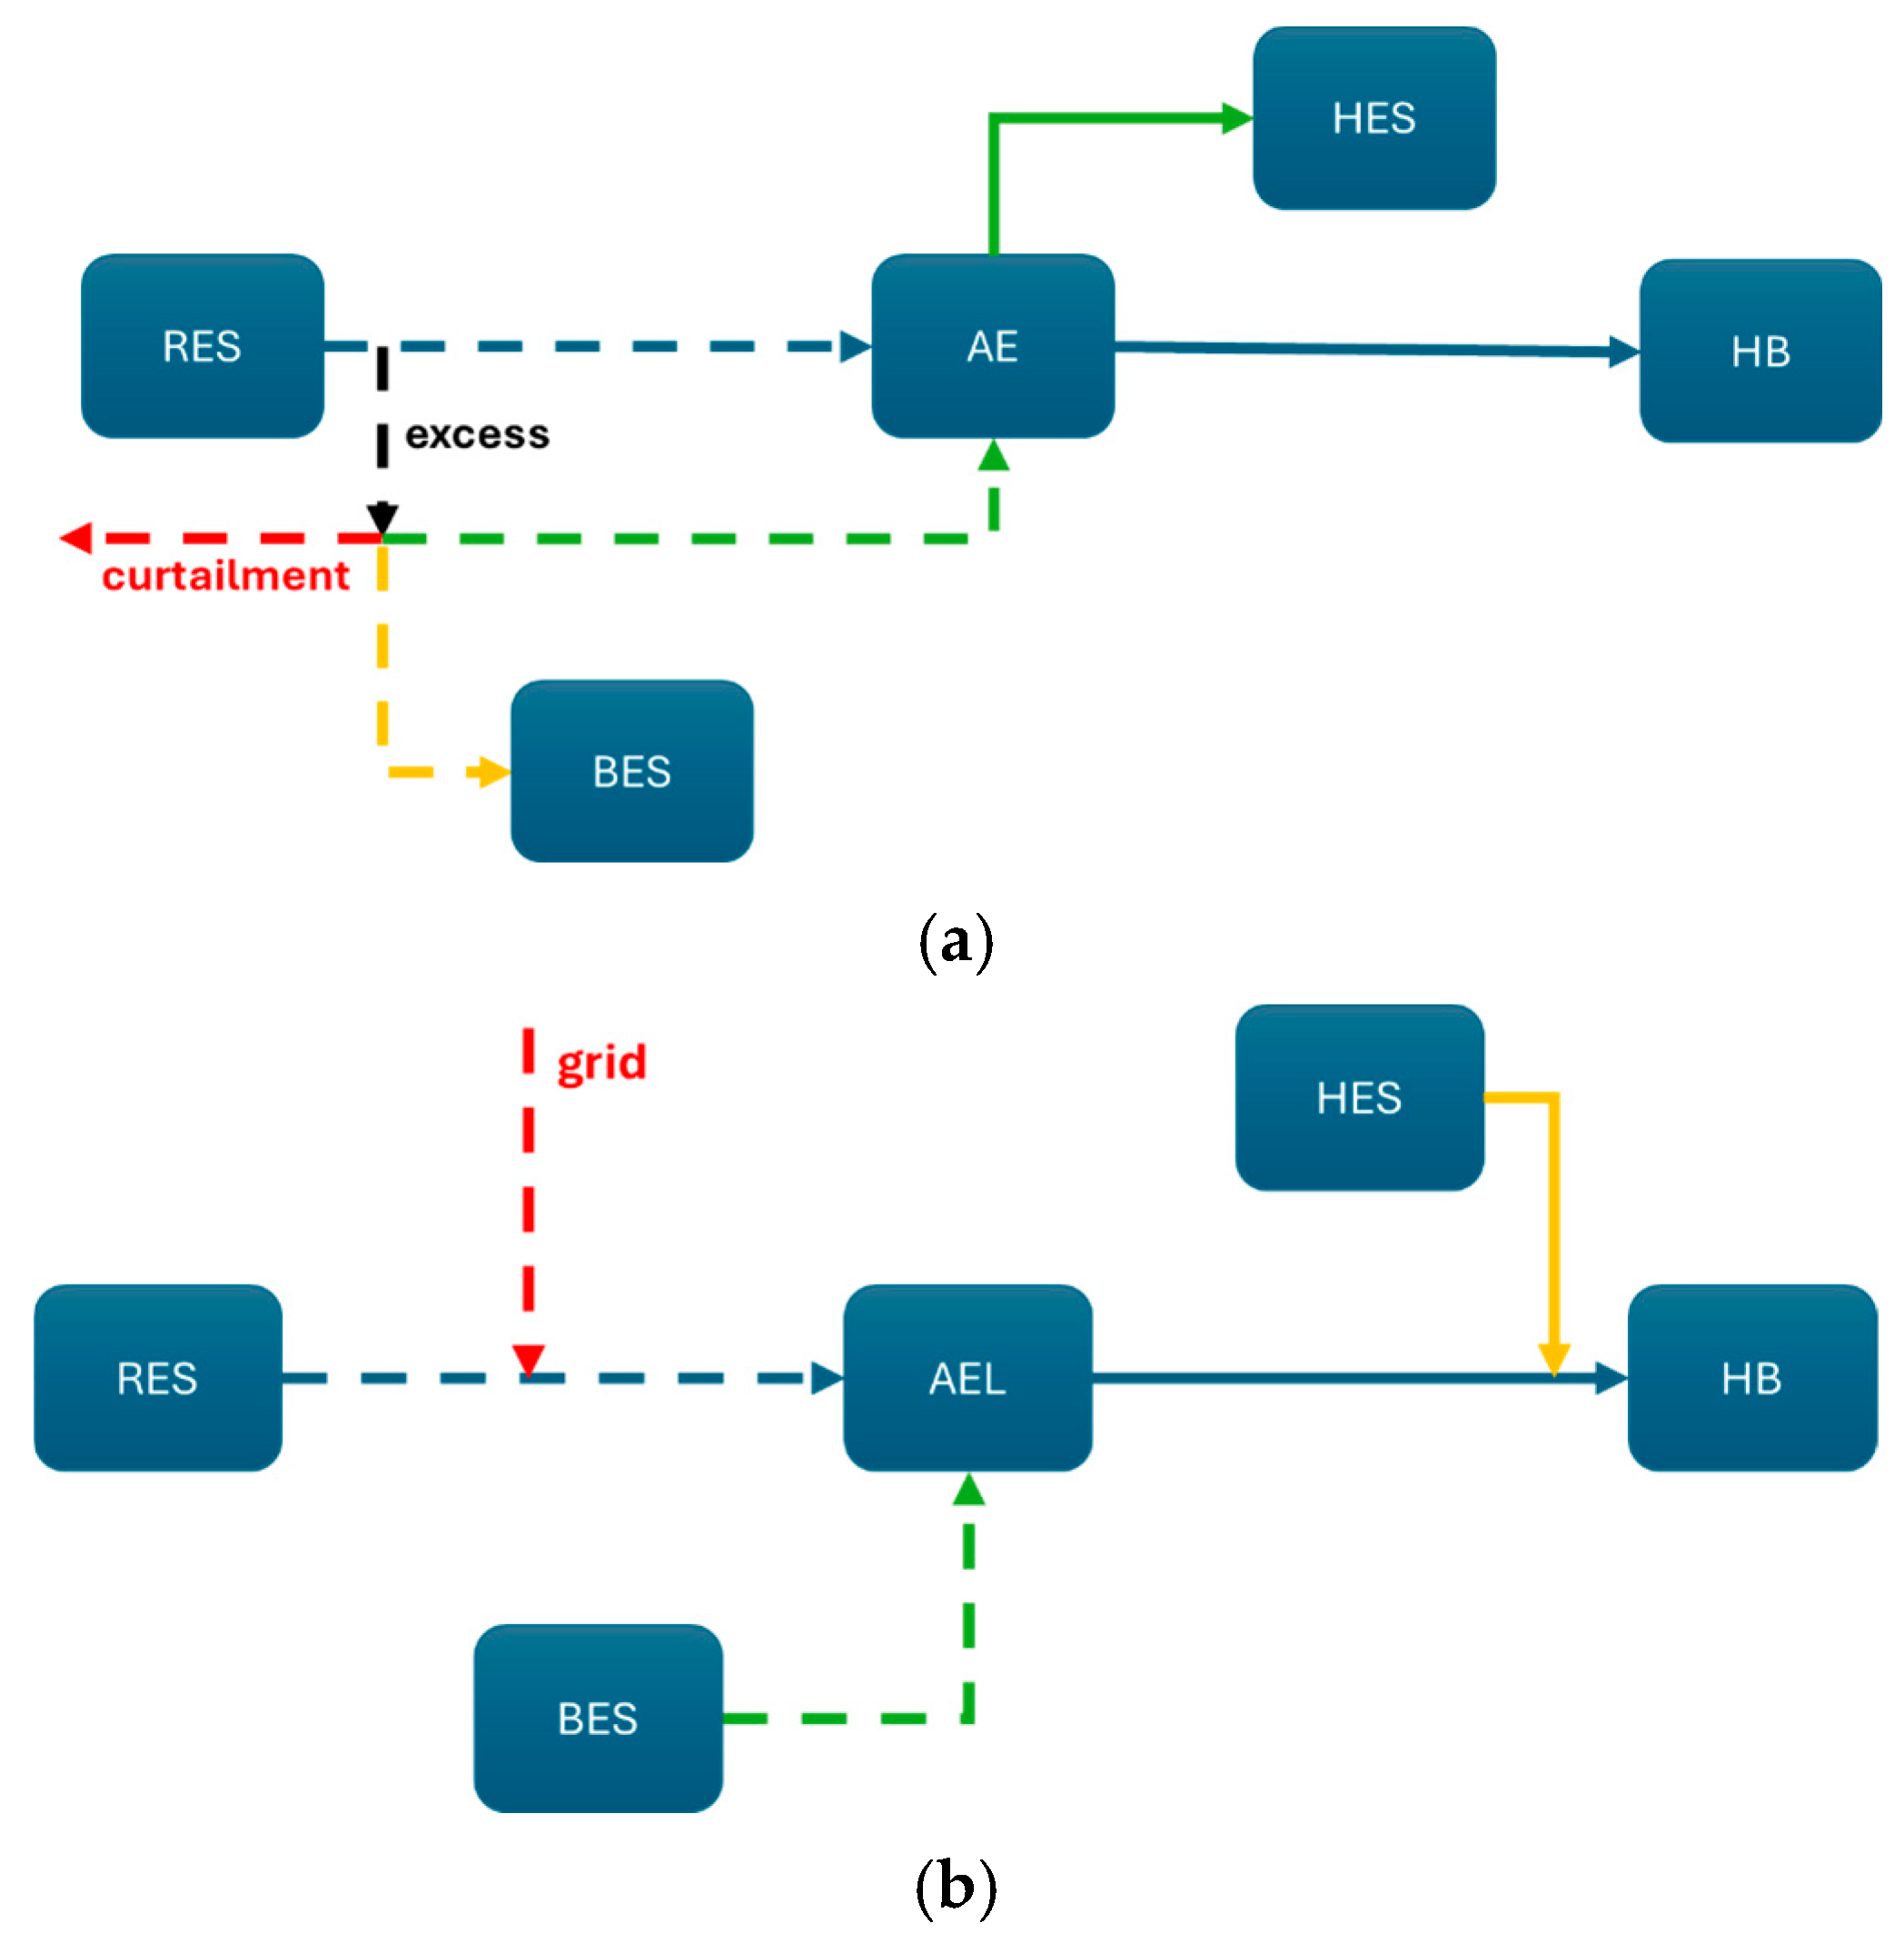
Once the renewable capacity and maximum total energy storage have been determined, the grid energy, curtailment energy, and the production of hydrogen, nitrogen, and ammonia are outputs of the dynamic simulation, which runs under the constraints of energy charge and discharge of the storage systems (Figure 3): in the charge mode, HES is preferred to BES and the opposite happens in the discharge mode. This model mitigates the effect of the self-discharge for battery systems.

Figure 3.
Constraints for charge and discharge operations. HES and BES are filled and emptied in a different order depending on whether the difference in energy between generation and use is a surplus or a deficit. Blue lines represent the conditions of synchronism between hydrogen production and hydrogen utilization in the reactor, while dynamics of the storage systems is represented with different colors according a level of priority: green represents the preferred, yellow the second, and red the last route, which results in an inefficient utilization of the renewable source: (a) charge of the storage system (b) discharge of the storage system.
The levelized cost of ammonia (LCOA) is calculated through the well-known function:
where T is the plant lifetime, J is the total number of single unit of the plant j, CAPEX is the capital expenditure and OPEX is the operational expenditure, U is the sizing of the specific unit (power, energy, flowrate of hydrogen or ammonia), G is the local electricity price, Egrid and A are the amount of grid energy used and tons of ammonia produced in the year t, and r is the Weighted Average Cost of Capital (or WACC), set at 7%. A constant value of 150 USD/MWh is taken as grid energy price [45]. The lifetime of the single units is set at T = 20 years, except for AE and BES, that must be replaced after 10 years. The LCOA is calculated for 2030 and repeated for the 2050 cost projection to assess the impact of the cost reduction in the critical units, such as RES, AE and BES, as defined in Table 2.
All computations and analyses were performed using MATLAB (version R2024b, MathWorks, Natick, MA, USA). Further details on the MATLAB algorithm can be found in Appendix A.
2.3. Allowable Grid Share for Green Hydrogen Production
This study considers a semi-isolated plant with energy supply from the grid in the case of insufficient renewable energy. In this case, the hydrogen produced, and consequently the ammonia, cannot necessarily be considered ‘green’. The European Union (EU) recently enacted a number of directives and Regulations to set the standards for a sustainable production of hydrogen.
According to the European Commission’s Delegated Regulation 2021/2139 [46], which supplements Regulation 2020/852 (EU Taxonomy for sustainable activities), life-cycle GHG emissions from hydrogen production must be below 3 kgCO2eq/kgH2. Moreover, the Directive (EU) 2023/1184 [47] supplements Directive (EU) 2018/2001 (Renewable Energy Directive II, RED II) of the European Parliament and of the Council, by setting out detailed rules for the production of renewable liquid and gaseous transport fuels of non-biological origin. Citing Art. 4 comma 1: “Fuel producers may count electricity taken from the grid as fully renewable if the installation producing the renewable liquid and gaseous transport fuel of non-biological origin is located in a bidding zone where the average proportion of renewable electricity exceeded 90% in the previous calendar year”. Reference [28] offers an analysis of the Directive EU 2023/1184 and concludes that the maximum GHGs intensity threshold is 28.2 gCO2,eq/MJ or, equivalently, 3.38 tCO2,eq/tH2 from renewable sources.
In the present study, the simulation is run considering the 2030 and 2050 cost structure and future energy mix data are obviously not known yet. Therefore, the following considerations are referred to the most recent datasets of the Italian energy mix provided by the free access online tool Electricity Maps, developed by Tomorrow ([48,49]). In 2024, in the region of Southern Italy, the yearly total renewable share amounts to 47.38%, of which nearly 27% is constituted from solar PV and 52% from wind power [48]. For what is defined above, the electricity supply in Southern Italy cannot be considered as fully renewable and a limit must be set on the percentage of grid electricity. The emissions for the Italian grid electricity have been swinging between 357 and 519 gCO2eq/kWh since the beginning of year 2025, being natural gas the main source [49]. If we consider a conservative value of 500 gCO2eq this translates into a maximum contribution of electricity from the grid for hydrogen production of 10%. This is the threshold considered in the present work for grid integration, so that the produced hydrogen and ammonia can be considered “green”.
3. Results and Discussion
In Section 3.1, we present the results of the simulation considering the cost assumptions for the year 2030. The conditions for the most cost-effective solution are identified, in terms of p, m, k and f. In Section 3.2, the results referring to the 2050 cost scenario are presented, and new f, p, m and k values arise for possible different cost-effective conditions for the 2050 case.
3.1. Sensitivity Analysis on 2030 Cost Assumptions
Designing the renewable park under the condition p = 100% maximizes ammonia production; however, it fails to generate sufficient returns to cover the investment costs, regardless of the energy mix, as illustrated in Figure 4. Especially, solar PV is more sensitive to plant under-dimensioning; reducing p from 100% to 80% leads to a 65% decrease in LCOA for wind, while the reduction reaches up to 80% for solar. When solar and wind energy are both used, this effect is less prominent, and it is minimized for m = 25%, where also the lowest absolute value of LCOA for f = 100% is observed. Except for the full solar case, where an additional reduction of 3% can be achieved, further under sizing of the plant (p = 60%) has a negligible influence on the final costs, meaning that the decrease in production balances the investments costs.
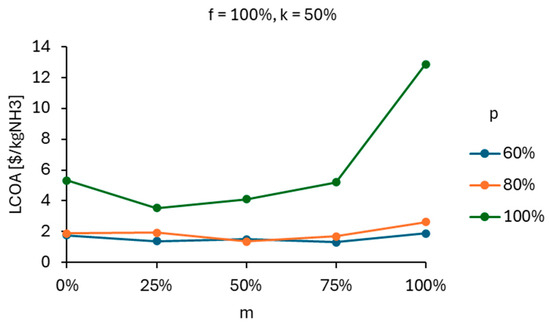
Figure 4.
Effect of under sizing on the LCOA at full capacity and fixed hydrogen/battery storage ratio.
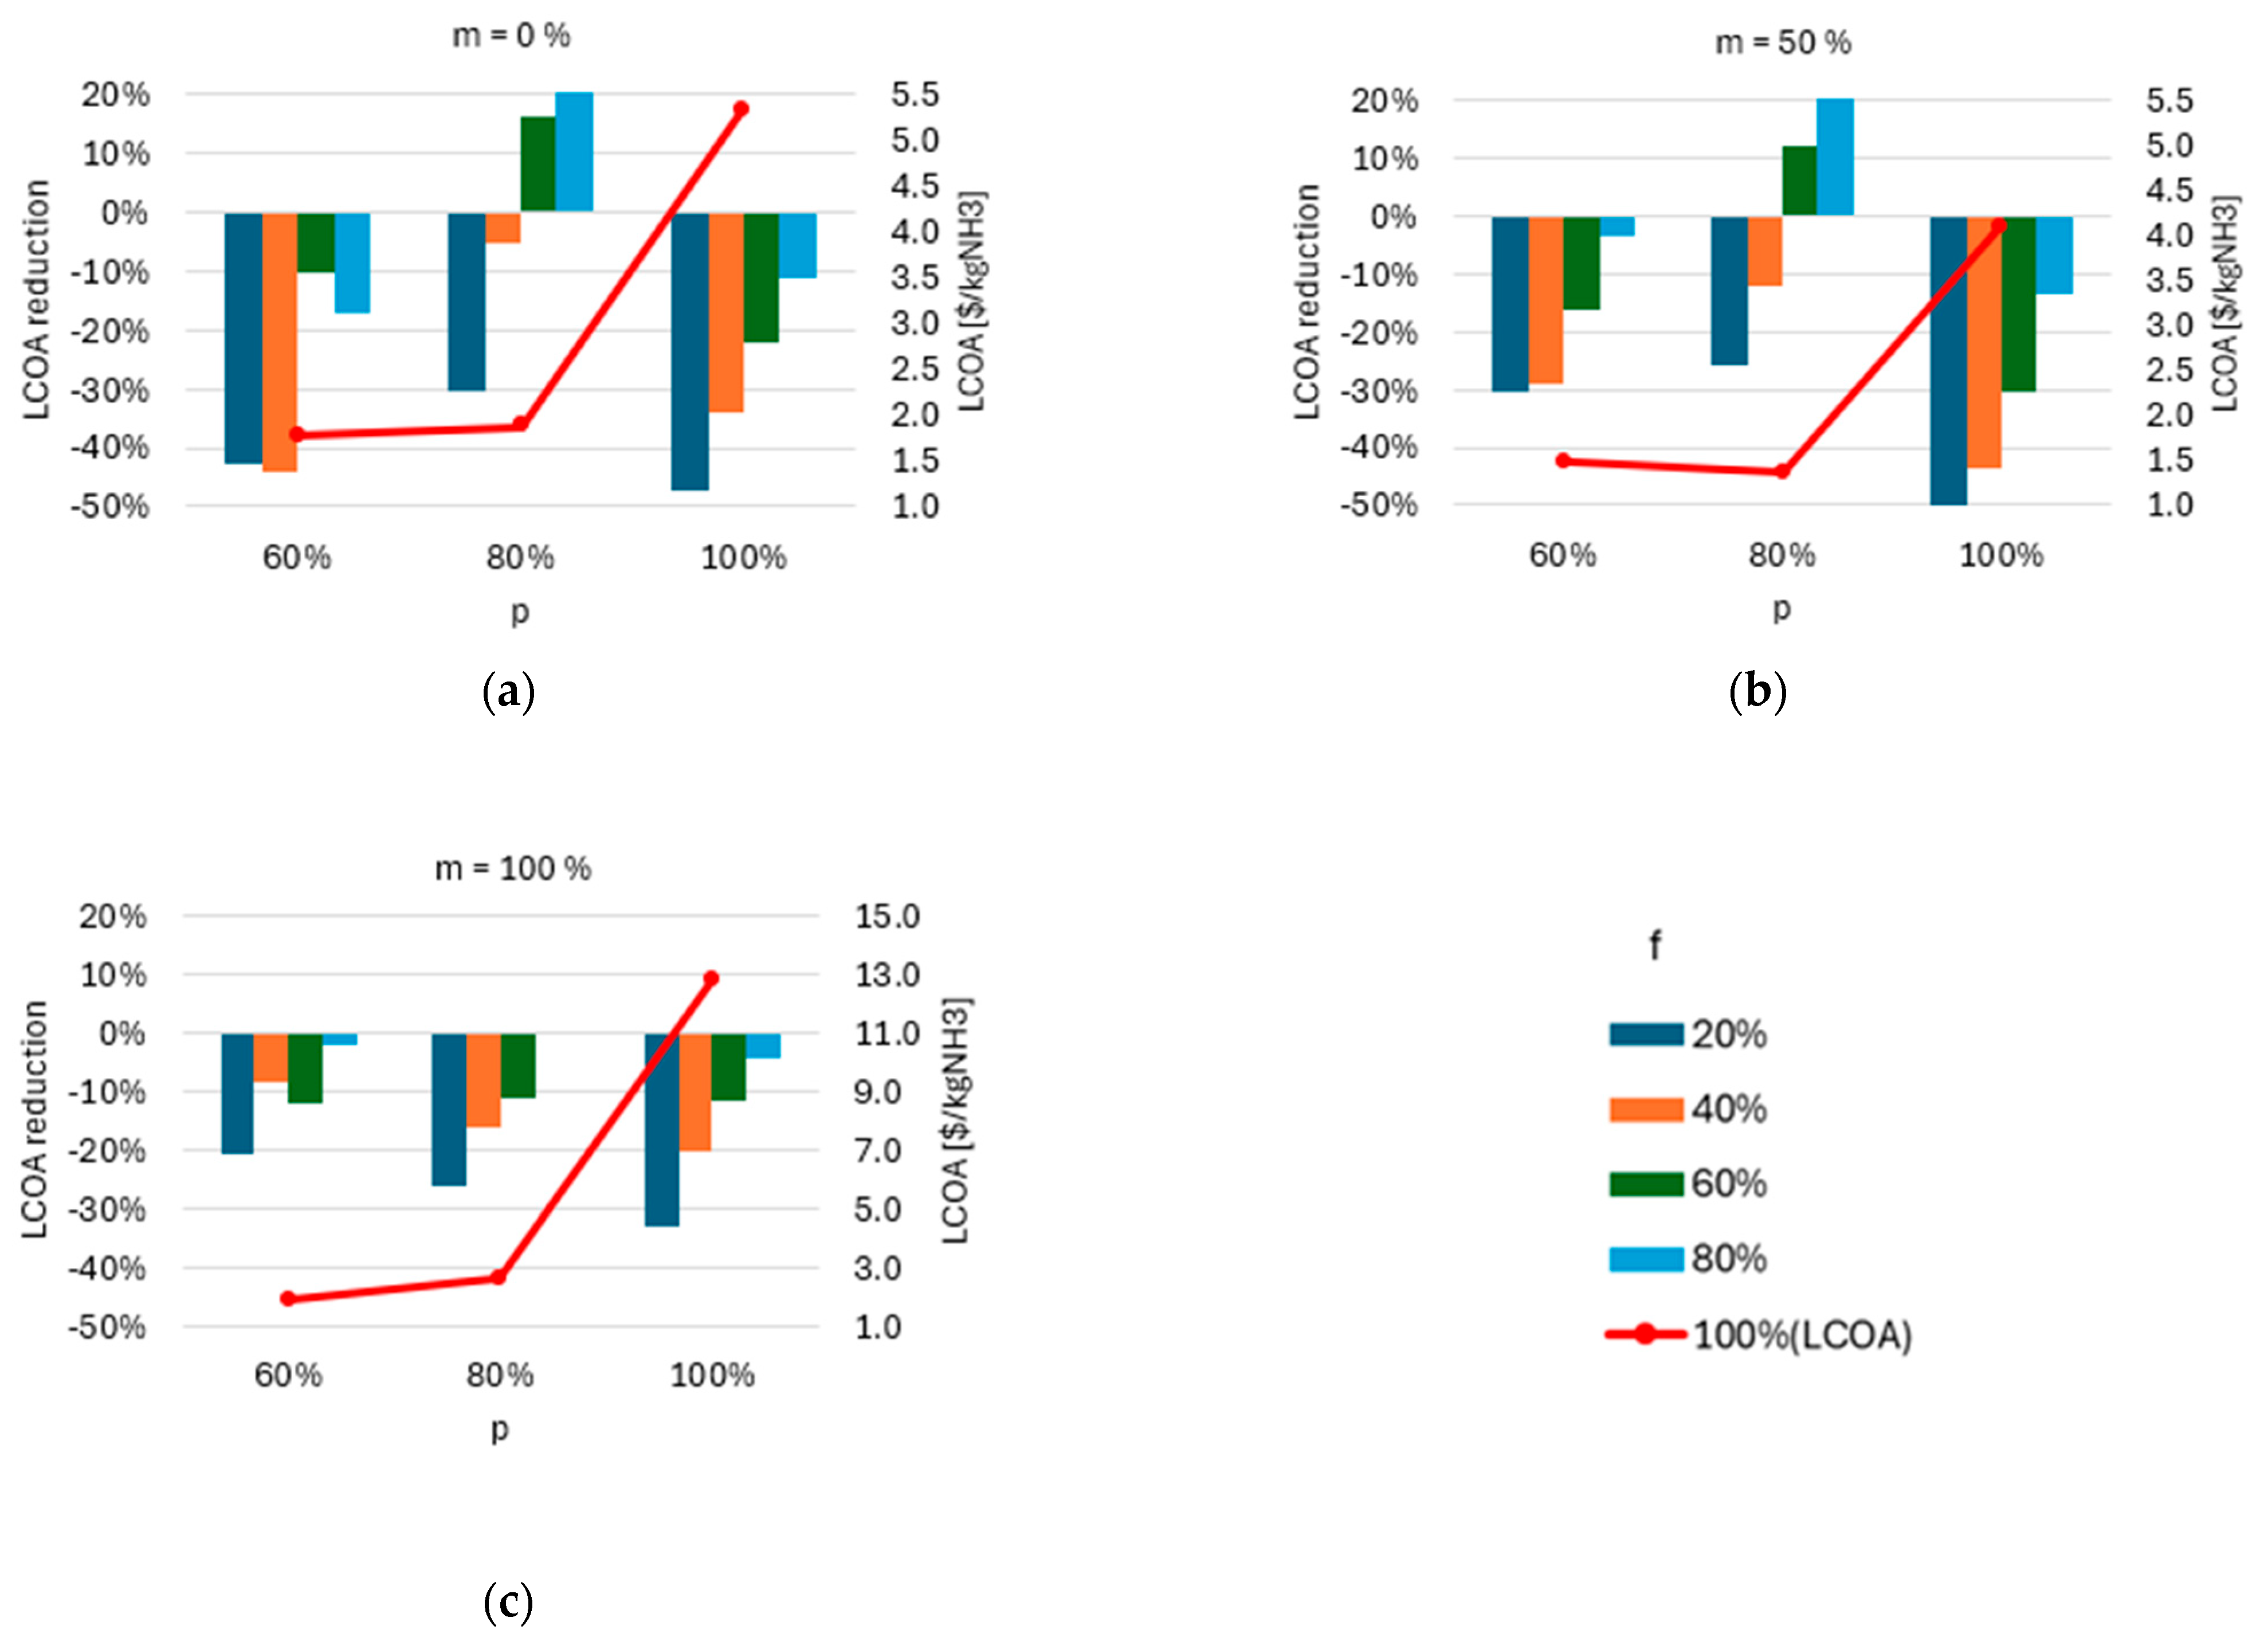
The introduction of flexibility f reinforces this trend across most p and m conditions (Figure 5). In the case of solar energy, for a given f, a reduction in p generally leads to a decrease in LCOA. This is more pronounced at higher turndown ranges (f = 20%, 40%), where the average low production caused by f is compensated by oversizing the plant.
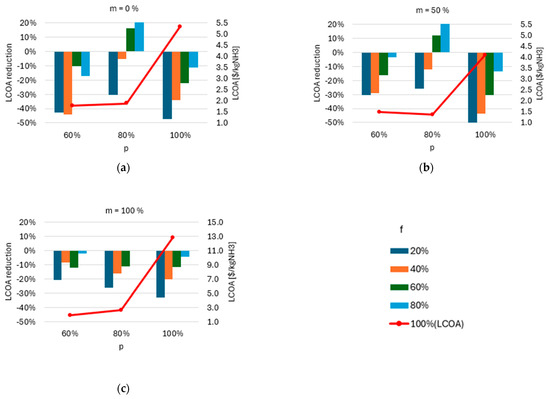
Figure 5.
Effect of flexibility and plant downsizing on the LCOA for: (a) solely wind, (b) PV and wind 1:1, and (c) solely PV.
The trend is not always confirmed when wind is the only source of the mix. Different from solar, a high level for flexibility is always required to observe a substantial percentage decrease in costs, enhanced by plant downscaling, while the combination of plant downscaling with high turndown ranges could even generate opposite effect, leading to increases in LCOA up to 20%.
A negligible or counter-productive effect of flexibility on the LCOA is found also in the literature for other energy input mixes: for example, Campion et al. [22] and Salmon et al. [24] point out that further reductions in the LCOA under 40% of the full load are negligible or minimized, at least for high solar areas. This is true when the ammonia production is constraint to a fixed yearly production ([22]) or a maximized ([24]). However, in this study, the plant’s power profile, thus the total ammonia production is adapted to the incoming renewable power without any constraint on the productivity, and detrimental effect of flexibility on the LCOA can be charged to the peculiarity of the hourly energy input.
However, LCOA itself allows to identify the most cost-effective solution, but not the most sustainable one, thus it is mandatory to verify that the ammonia produced should be classified as “green” considering how green hydrogen is identified by European regulations. Figure 6 identifies which combination of p, f, and m falls under 10% of grid energy input, as identified in Section 2.3. In fact, on the one hand, p = 80% and p = 60% did not bring considerable differences in the LCOA, but on the other hand they are higher impacting on the amount of required grid energy due to the reduction in RES nominal power. Moreover, since the share of electricity is progressively lower at low values of f for any energy mix, the introduction of flexibility makes the larger plants not only economically not viable, but also unsustainable, as green production can still be achieved with sub-sized plants (p = 80%) by increasing the share of wind power in the energy mix up to 50%. On the other hand, sub-sized solar power plants are hardly suitable for green ammonia production.
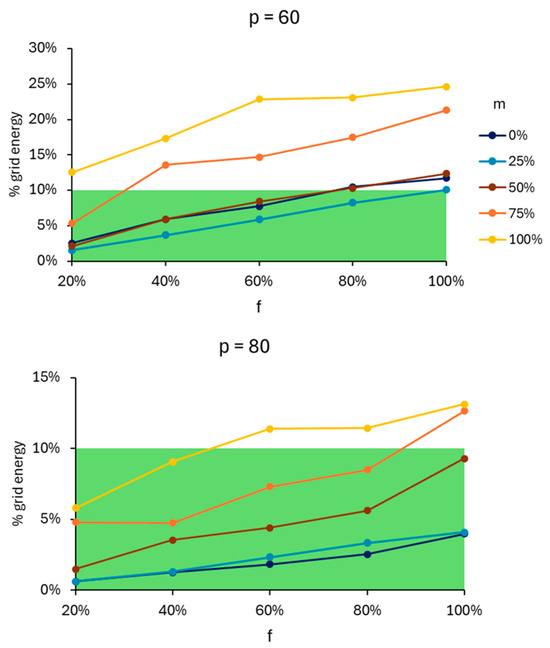
Figure 6.
Effect of p, m and f on the share of grid electricity related to European standards. The green area represents the identified limit of grid electricity in the energy mix.
For all the previous considerations, green ammonia production in the Italian site considered is economically favored using an energy mix with a high share of wind power, as it results in minimum LCOA at full capacity (f = 100%). This value can be further reduced by appropriate plant downsizing and minimum operating rates.
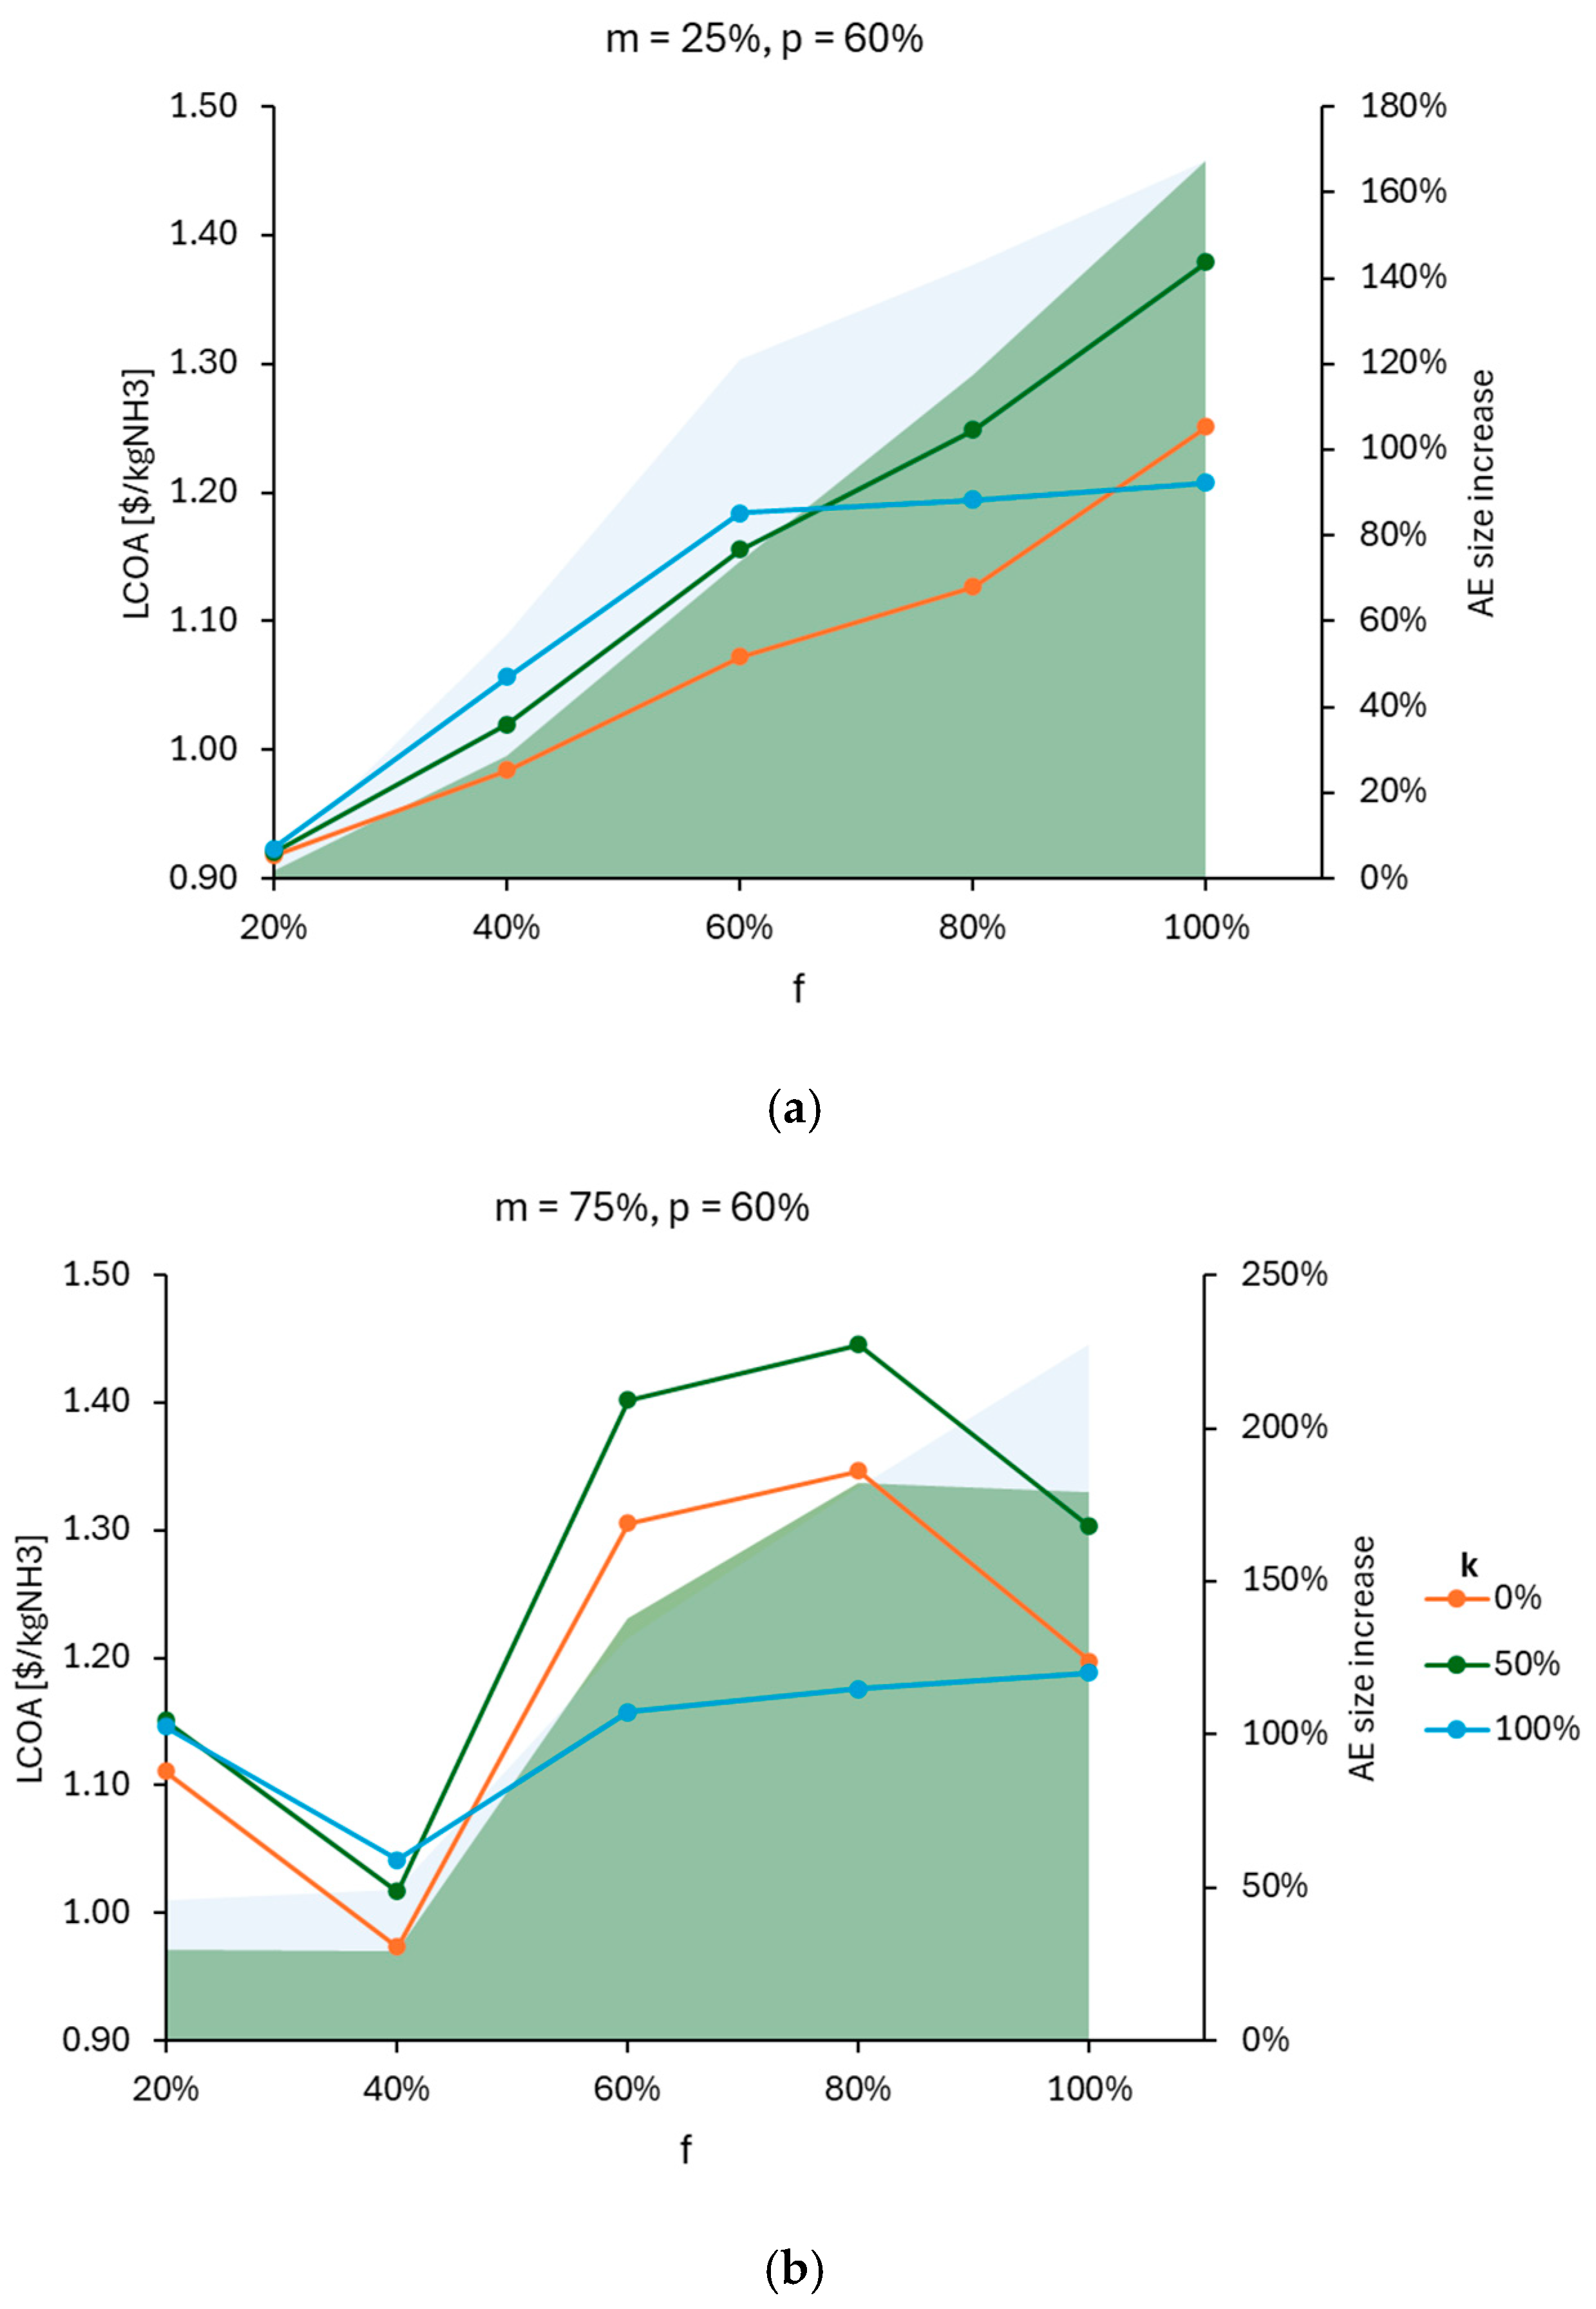
Fixing m = 25% and p = 60%, the influence of hydrogen over battery storage is evaluated at different levels of flexibility. Figure 7a shows that for f = 20–40%, the ability to closely follow the renewable energy profile makes storage systems almost unnecessary. Battery storage proves to be more suitable for dynamic operating conditions, as it can efficiently adapt to fluctuating energy inputs and demand variations in predominantly wind-powered systems: this is attributed to the oversizing of the electrolyzer system, whose capacity is more than doubled even at low f, which reduces the benefits of flexibility at unchanged production levels due to its considerably high investment cost. On the other hand, it is worth noting that there are some conditions where hydrogen storage should be preferred to battery storage, namely when PV is the largest part of the mix (Figure 7b).
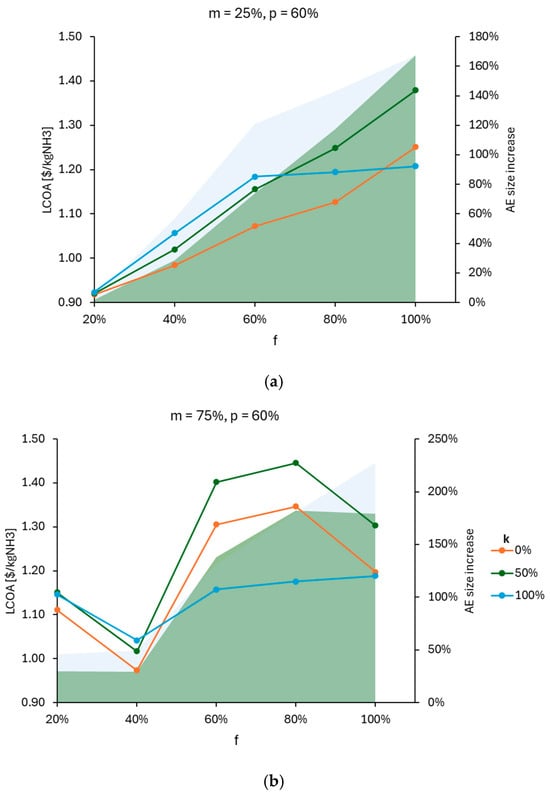
Figure 7.
Hydrogen storage effect on LCOA at fixed plant sizing conditions for: (a) high wind share and (b) high solar share. Areas in light blue and green show the percentage increase in the electrolysis unit.
This is even exaggerated when solar is the only renewable source since the energy stored is on average 2.5 times that required for wind power, leading to >100 MWh at any level of f (Figure 8). The CAPEX associated with battery storage exceeds the cost of oversizing the electrolysis unit, making hydrogen storage a more appropriate choice under the same conditions of flexibility f. Moreover, while at m = 75% flexibility has a positive effect on the LCOA, at m = 100% dynamic operation results in a slightly higher LCOA, this is due to the increase in production that is able to limit the costs of the electrolyzer.
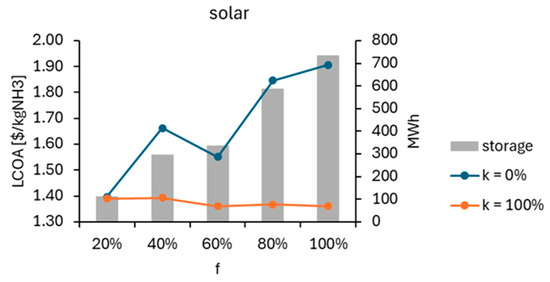
Figure 8.
Hydrogen storage effect on LCOA at fixed plant sizing conditions for m = 100%.
Finally, provided that the synthesis unit can actually range between 20% and 100% of the nominal production capacity, the most cost-effective solution for the Italian case is f = 20%, m = 25%, and a meager amount of battery storage of 2 MWh; however, this results in a significantly reduced production of 64 tpd on average. At this stage, approximately 60% of the capital expenditure (CAPEX) distribution is allocated to the wind farm, while alkaline electrolysis (AE) and photovoltaic (PV) systems each account for approximately 16% of the total investment. The dominant costs are then related to the renewable hydrogen production as confirmed in the literature [25].
3.2. 2050 Cost Scenario
The analysis is repeated to account for the projected cost reductions anticipated by 2050 and reported in Table 2. Once again, operating with smaller plants (p = 60%) proves to be a viable strategy for containing the costs associated with green ammonia production. Regarding the optimal energy mix identified (m = 25%), the estimated 2050 costs result in an average decrease of approximately 30% in the final levelized cost of ammonia (LCOA) under any flexibility scenario, aligning with the expected 26% reduction in wind turbine investment costs.
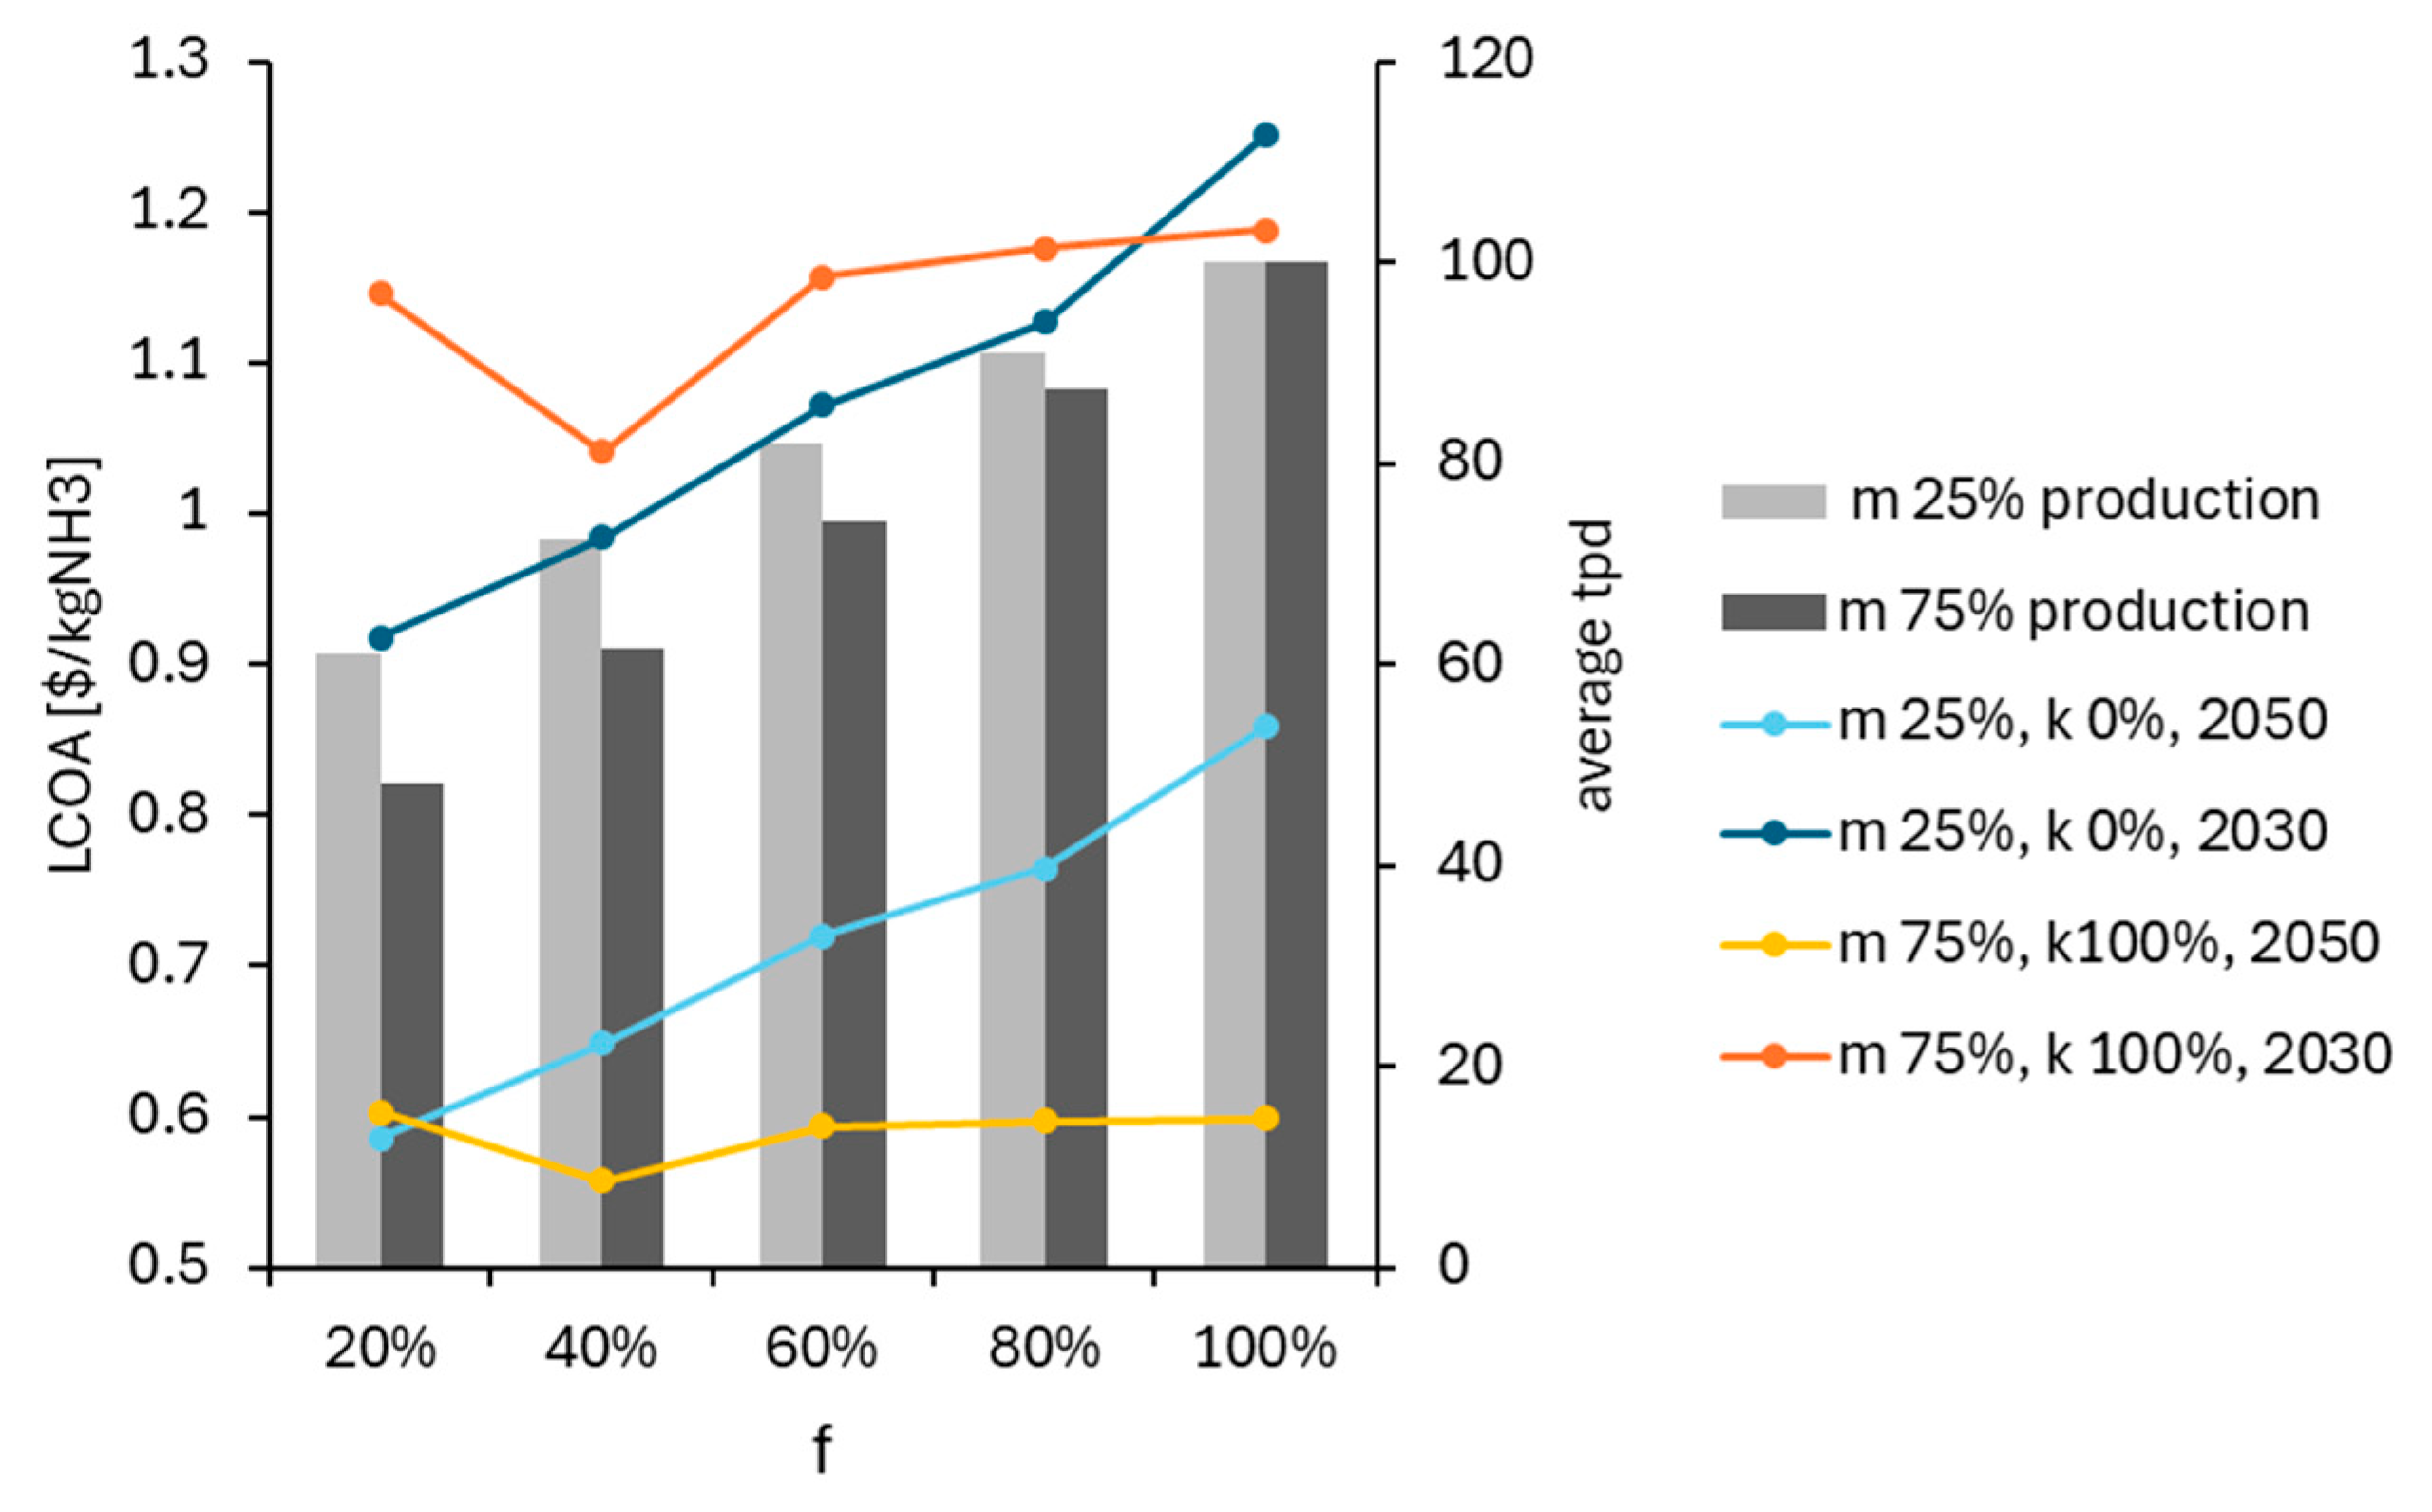
Notably, the reductions in both electrolyzer and photovoltaic (PV) capital expenditures (CAPEX) make high PV shares in the energy mix increasingly competitive with wind-driven power systems. Figure 9 presents a comparison between wind and solar PV systems incorporating battery and hydrogen storage. It is observed that an optimal LCOA of approximately 0.60 USD/kgNH₃ is achieved with reduced flexibility demand for solar-driven systems. From a technical perspective, the latter option is preferred. However, it results in a grid energy share of 15%, which prevents it from being classified as a fully green solution. On the other hand, providing a certain degree of flexibility, cost reductions in electrolyzer and PV technologies highly increase the possibility of a green production even in systems powered by a significant part of the solar energy. In Table 3, we report different combinations of p, m, f, k under which ammonia production can be achieved with less than 10% of grid share in the energy mix. In fact, the main works in the literature on this topic confirm the possibility of systems involving solar photovoltaics and hydrogen storage. However, comparing the results with findings in the literature is not straightforward. Indeed, the problem is multivariable, and the outputs strongly depend on various conditions. These could be gathered into two main categories: not only design choices (plant units, equipment modeling, cost assumptions, and, if optimization is involved, the objective function), but also power input (strength, spread, and type of the renewable source, which also affects the carbon intensity of the grid). Table 4 resumes the main results observed in the literature divided by geographical site. These results show that, generally, the LCOA is below 600 USD/tonNH3 when wind is included in the energy mix. However, they confirm that the optimal cost strongly depends on the local characteristics of the renewable energy source, with significant variations possible even within the same geographical region. Thus, it is essential to evaluate the effects of both plant dimensioning and variability of renewable energy profiles across different geographic coordinates, in order to identify the most economically feasible solution for green ammonia production.
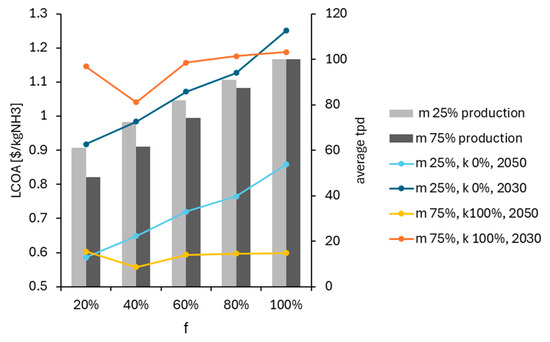
Figure 9.
2050 cost projection for both wind-driven and solar-driven cases.
Table 3.
Points (p, k, m, f) of green ammonia production showing comparable LCOA.
Table 4.
Horizontal comparison with the existing literature.
Comparing the results obtained on the present works in the 2030 and 2050 scenarios, green ammonia is still not a market competitive alternative to gray ammonia, whose cost is in the range of 0.25–0.3 USD/kgNH3 [50]. However, green ammonia could be economically feasible in the future if certain policies on carbon emissions are applied: a carbon emission allowance price of 0.12 USD/kgCO2 to reach the breakeven point with 0.59 USD/kgNH3. This is a plausible value considering that, even though Italy does not impose a direct carbon tax, its carbon pricing system includes the EU Emissions Trading System (EU ETS) with an effective carbon rate of more than 0.09 USD/kgCO2eq, among the highest within the G20 economies [51]
4. Conclusions
The present work examines the economic impact of different design choices for green ammonia considering the Italian availability of solar PV and onshore wind power. In particular, the plant’s, flexibility, scaling, energy mix, and hydrogen and battery storage are investigated. Flexibility is simulated by assuming an ammonia synthesis unit capable of ranging from its maximum capacity of 100 tpd down to different minimum loads. Resuming the results obtained, we conclude that:
- Conservative choices for the renewable peak power drastically increase LCOA, especially for solar power and subsizing of the renewable park is necessary to obtain significant reductions: operating with p = 80% we obtain a decrease in the LCOA of −80% and −65% for 100% solar and 100% wind plants, respectively. Further downscaling (p = 60%) is definitely less impacting, because of the decrease in yearly ammonia production.
- Flexibility is necessary to reduce the need for grid energy under 10% of the total energy input and therefore make ammonia production actually green. However, when flexibility is applied to a sub-scaled wind powered system, the high decrease in production could lead to the opposite effect and increase the final cost of production.
- Hydrogen storage requires notable increase in AE size, reaching approximately +160% and +230% at f = 100% when wind or solar is the relevant renewable source in the mix, respectively. Introducing flexibility, battery storage is preferred for wind-based systems. On the other hand, even under flexible conditions, HES is the preferred option for solar-based systems, where energy storage on average 2.5 times that required when using wind power, since it is cheaper than BES and therefore compensates the increase in the AE size.
- The most cost-effective solution in 2030 is 0.92 USD/kgNH3 with 111 MW of wind power and 37 MW of solar power and a 20–100% range of flexibility to minimize BES. However, in 2050, assuming that water electrolysis and PV costs decrease as projected, solar power combined with hydrogen storage could become a viable solution, showing small deviations from the 2050 optimal LCOA value obtained for wind-driven systems. With an energy mix of 75% PV, 25% wind, hydrogen storage and sub-sized renewable park (p = 60%), an LCOA of 0.593 USD/kgNH3 is targeted. In addition, this competitive LCOA is met for a more narrow range of flexibility (60–100%), which ease the technical feasibility the synthesis unit.
- In conclusion, for different combinations of process design choices and flexibility, the optimal LCOA is approximately 0.59 USD/kgNH3 in 2050. Provided that a carbon rate of 0.12 USD/kgCO2eq is applied, green ammonia could be a cost-competitive alternative to traditional ammonia production.
- Further extension of this study will involve the application of the methodology and the plant layouts in different geographical areas, both in Italy and other countries worldwide.
Author Contributions
Conceptualization, C.P.; methodology, C.P. and M.D.F.; software, C.P.; validation, C.P. and M.D.F.; formal analysis, C.P.; investigation, C.P. and M.D.F., resources, C.P. and M.D.F.; data curation, C.P.; writing—original draft preparation, C.P.; writing—review and editing, M.D.F., A.G., and C.B.; visualization, C.P.; supervision, M.D.F., A.G., and C.B.; project administration, A.G. and C.B.; funding acquisition, A.G. and C.B. All authors have read and agreed to the published version of the manuscript.
Funding
This research was funded by the European Union—NextGenerationEU from the Italian Ministry of Environment and Energy Security, POR H2 AdP MEES/ENEA with involvement of CNR and RSE, PNRR—Mission 2, Component 2, Investment 3.5 “Ricerca e sviluppo sull’idrogeno”, CUP: I83C22001170006.
Data Availability Statement
All data used in this study are presented and explained in detail in this manuscript.
Acknowledgments
The authors gratefully acknowledge the contributions of all those who supported the development of this study, whether through technical help, constructive discussions, or general encouragement.
Conflicts of Interest
The authors declare no conflicts of interest.
Abbreviations
| AE | Alkaline electrolyzer |
| At | Ammonia production in year t [kg] |
| BES | Battery energy storage |
| Egrid | Energy from local grid [MWh] |
| EU | European Union |
| G | Price of grid electricity [USD/MWh] |
| HES | Hydrogen Energy Storage |
| J | Total units of the plant |
| LCOA | Levelized cost of ammonia |
| Pmax | Power requirement for nominal capacity production [MW] |
| Pplant | Hourly power requirement from plant production [MW] |
| PRE | Hourly power input from RE [MW] |
| RE | Renewable energy |
| RED | Renewable Energy Directive |
| S | Total renewable peak power [MW] |
| T | The plant’s lifetime [years] |
| Uj | Size of the j-th unit of the plant, in mass flowrate [kg/hr] or power [MW] |
| f | Ratio between maximum and minimum ammonia production capacity [%] |
| k | Ratio between HES and BES [%] |
| m | Ratio between solar and wind power [%] |
| p | Percentile for peak power definition [%] |
| r | Weighted Average Cost of Capital (WACC) [%] |
Appendix A
The computation of the LCOA requires knowledge of units’ capacity of the plant and of the productivity and consumption of the plant. Therefore, the MATLAB algorithm can be divided into three sections (Figure A1):
- Renewable power and energy storage sizing (subroutine 1),
- Productivity of hydrogen and ammonia (subroutine 2), and
- Economic evaluation of the LCOA.
The flow diagrams of the two main subroutines are reported in Figure A2 and Figure A3. In both subroutines, the plant’s power requirement during the year is determined by an iterative programming (subroutine 1.1) based on the value of peak power, energy mix and minimum load, or S, m and f, respectively (Figure A2). Each day of the year presents the maximum renewable power S required to satisfy the equality constraint between charge and discharge energy. Among the 365 values of S, the final value of the peak power installed is determined according to a certain downsizing represented by the parameter p. The amount of the corresponding storage is split into hydrogen and battery storage through the parameter k (Figure A2).
Once the sizing is complete, subroutine 2 (Figure A3) processes the energy flows among the units of the plant and computes the hydrogen and ammonia productions, as well as the grid and the curtailed energy. In this subroutine, the BES and HES storage states are computed according to the logic defined in Figure 3 (Section 2.2): in the case of surplus energy, HES is the first to be filled, while in the case of deficit, BES is the first to be drawn.

Figure A1.
Comprehensive scheme of the algorithm.
Figure A1.
Comprehensive scheme of the algorithm.
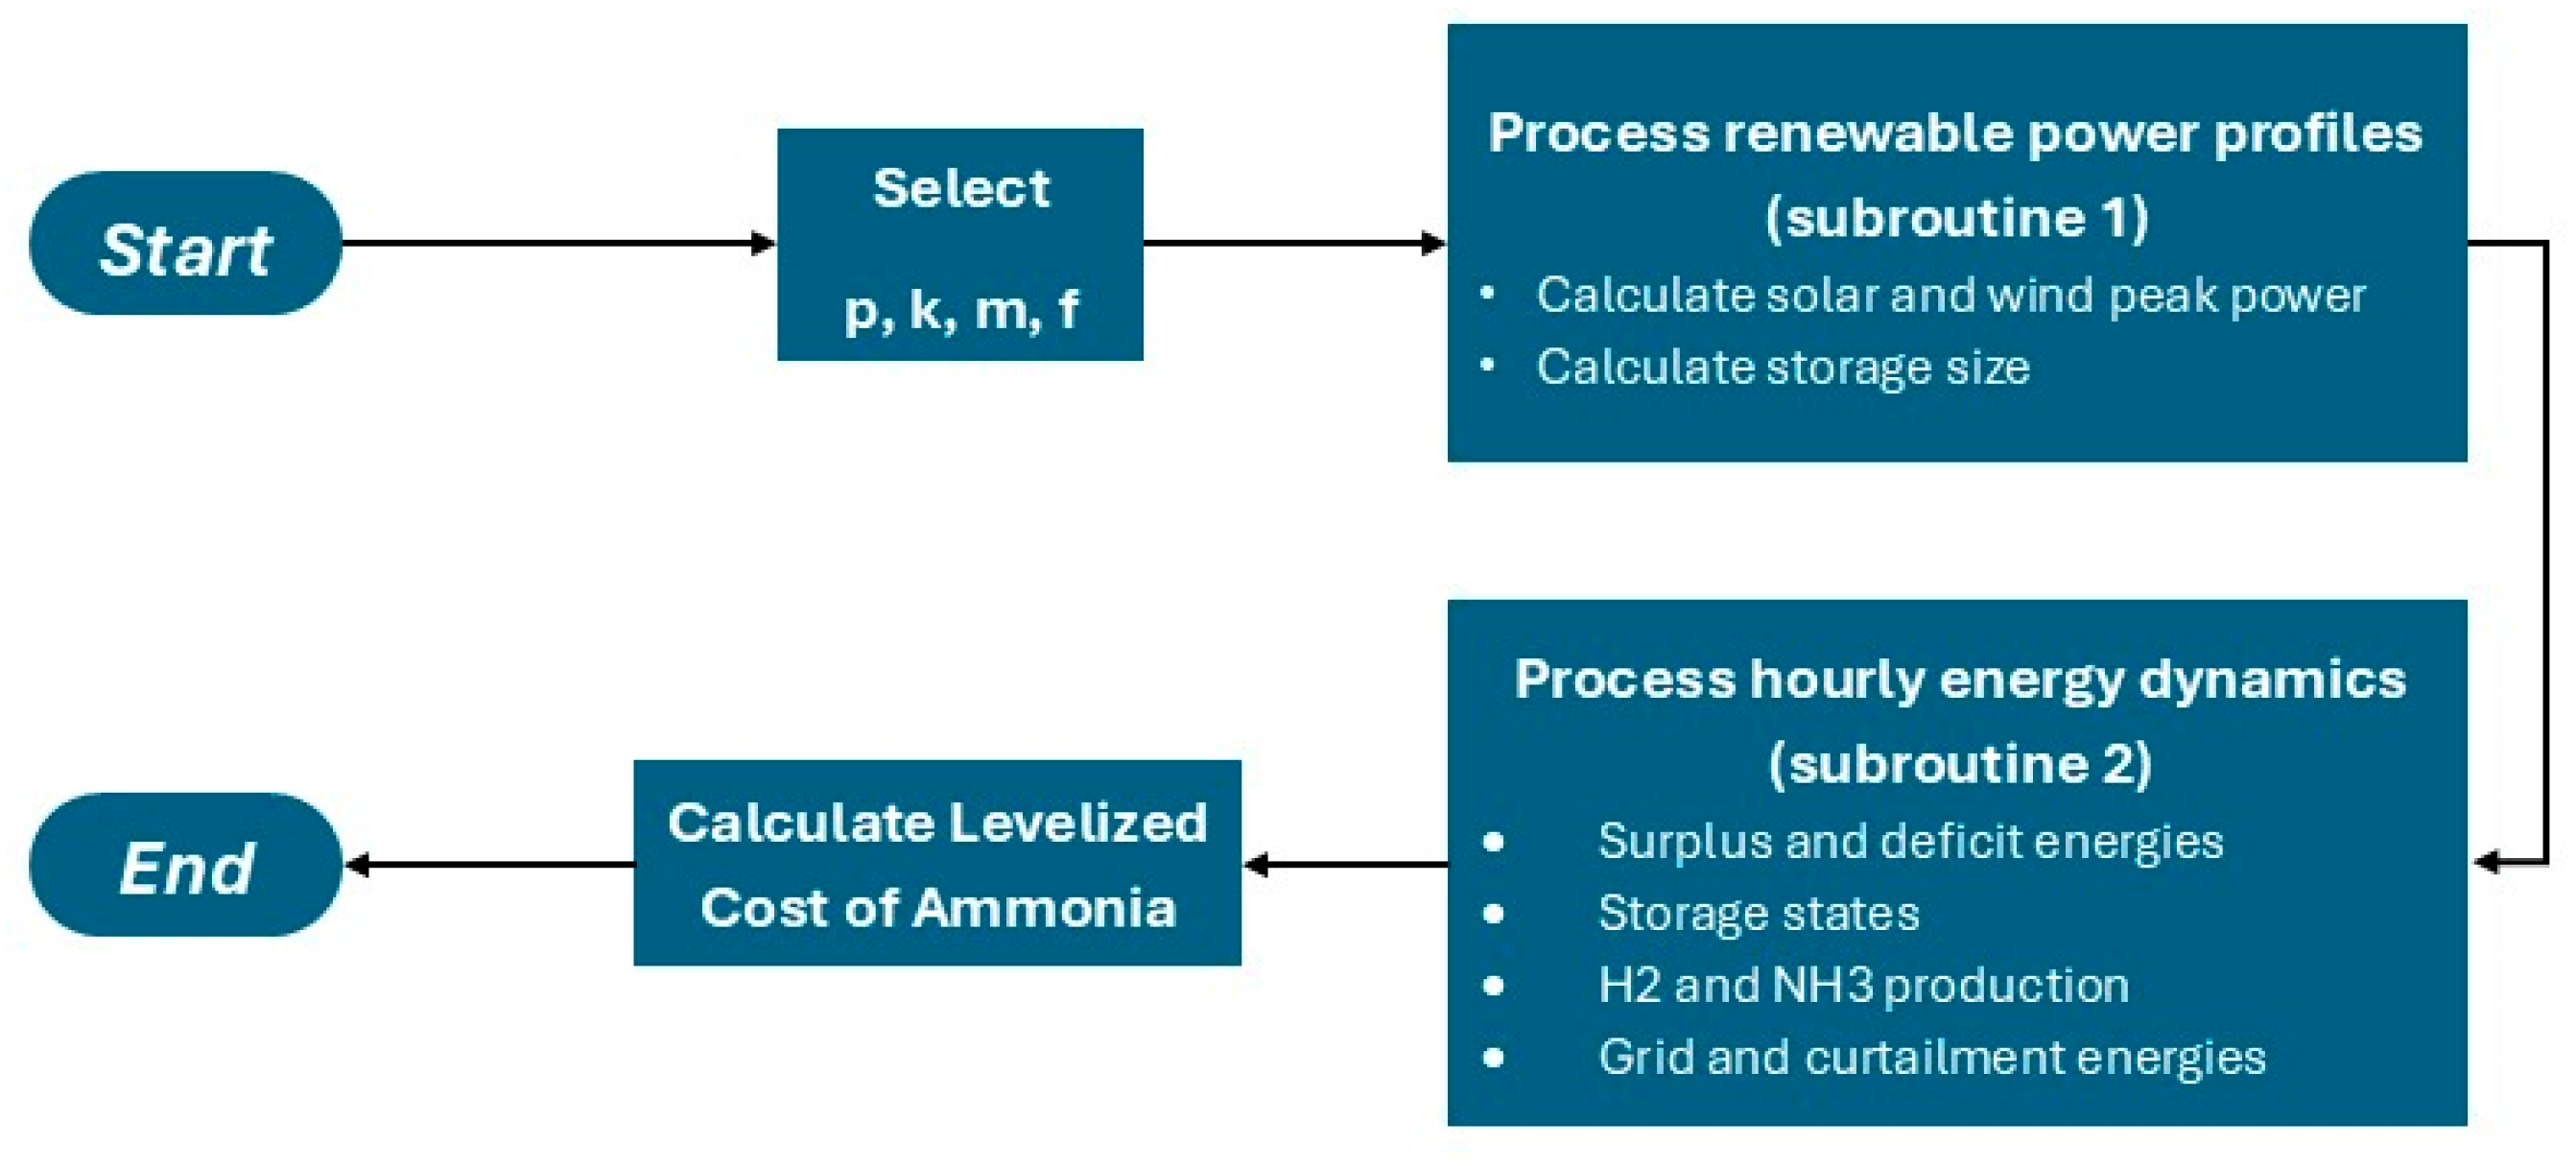

Figure A2.
Process renewables power profiles (subroutine 1).
Figure A2.
Process renewables power profiles (subroutine 1).
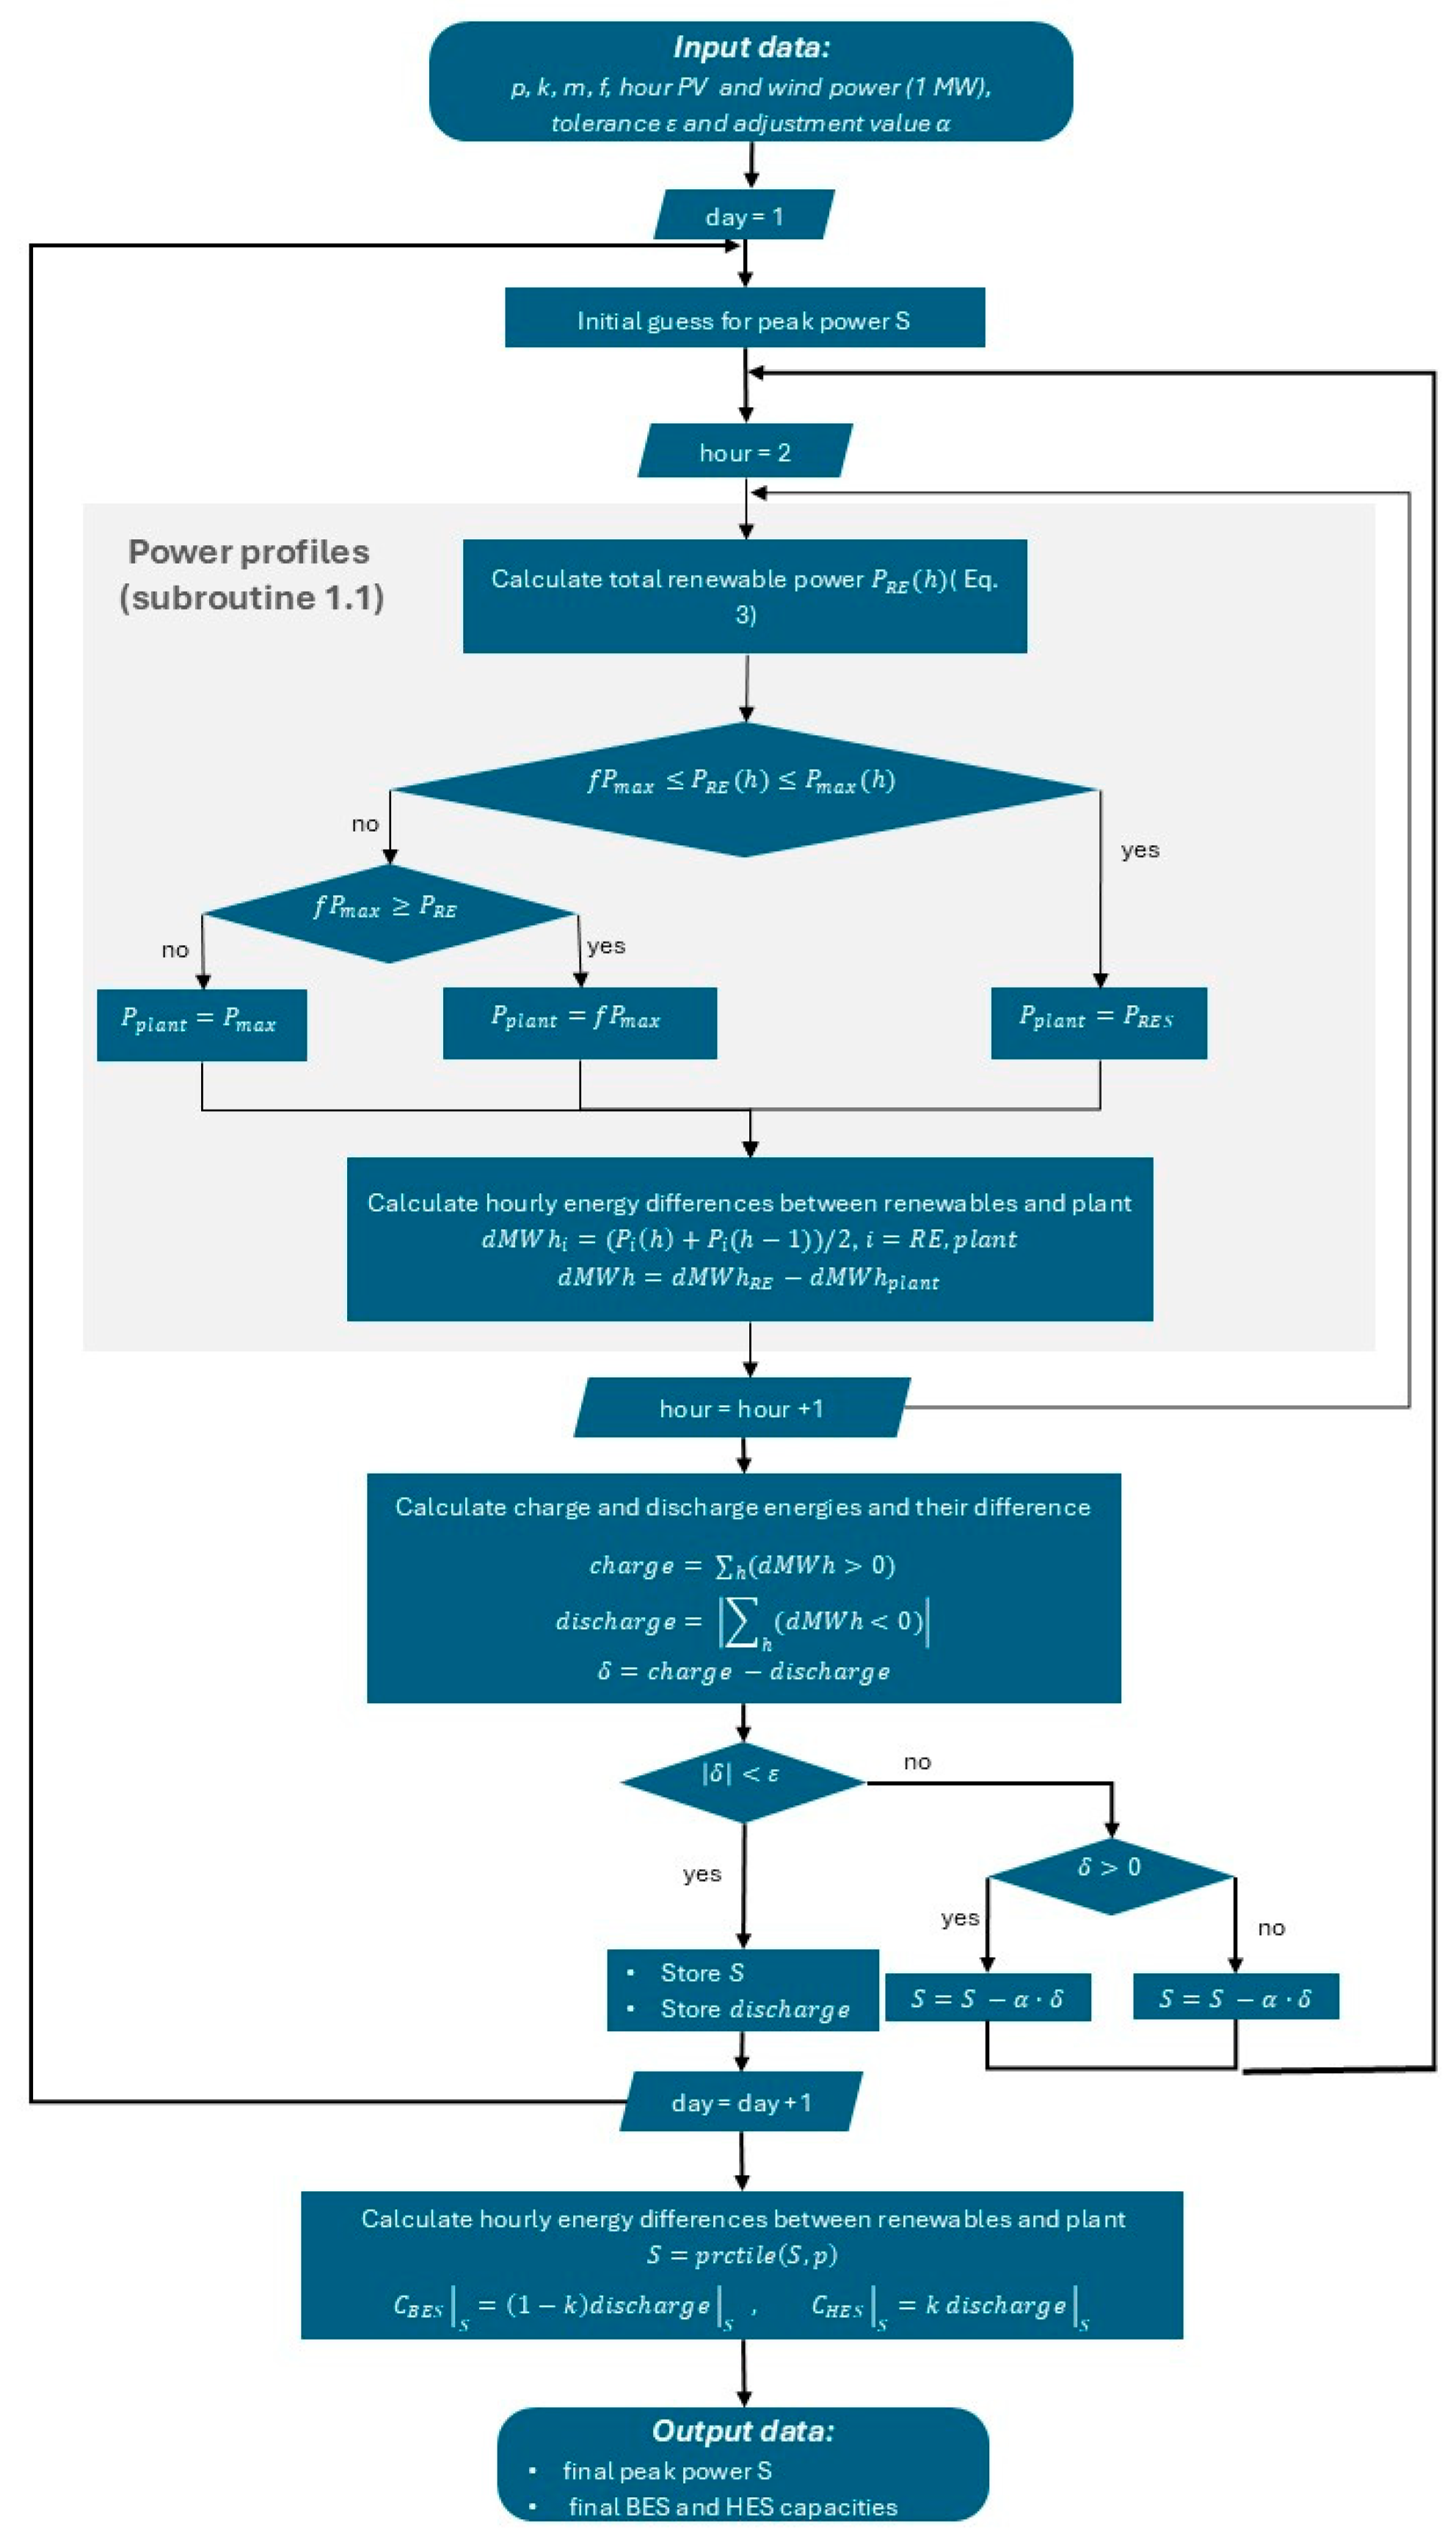
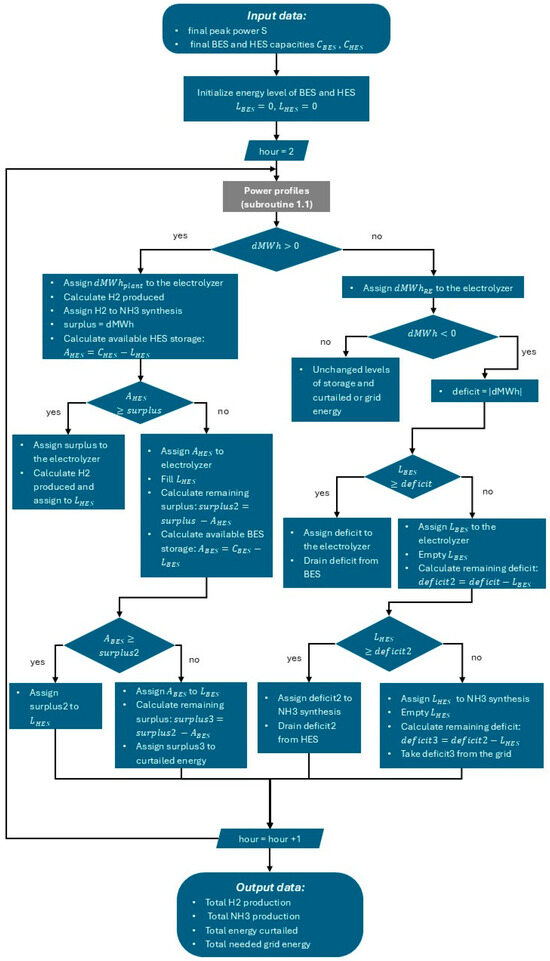
Figure A3.
Process hourly energy dynamics (subroutine 2).
Figure A3.
Process hourly energy dynamics (subroutine 2).

References
- CO2 Emissions in 2022; International Energy Agency: Paris, France, 2022.
- Net Zero by 2050—A Roadmap for the Global Energy Sector; International Energy Agency: Paris, France, 2021.
- Rouwenhorst, K.; Castellanos, G. Innovation Outlook: Renewable Ammonia; Abu Dhabi; International Renewable Energy Agency: Brooklyn, NY, USA; Ammonia Energy Association: Ashburn, VA, USA, 2022. [Google Scholar]
- Ghavam, S.; Vahdati, M.; Wilson, I.A.G.; Styring, P. Sustainable Ammonia Production Processes. Front. Energy Res. 2021, 9, 580808. [Google Scholar] [CrossRef]
- Kojima, Y.; Yamaguchi, M. Ammonia as a hydrogen energy carrier. Int. J. Hydrogen Energy 2022, 47, 22832–22839. [Google Scholar] [CrossRef]
- Palone, O.; Cedola, L.; Borello, D.; Markides, C.N. Decarbonizing power and fuels production by chemical looping processes: Systematic review and future perspectives. Appl. Therm. Eng. 2024, 254, 123844. [Google Scholar] [CrossRef]
- Juangsa, F.B.; Irhamna, A.R.; Aziz, M. Production of ammonia as potential hydrogen carrier: Review on thermochemical and electrochemical processes. Int. J. Hydrogen Energy 2021, 46, 14455–14477. [Google Scholar] [CrossRef]
- Rouwenhorst, K.H.R.; Krzywda, P.M.; Benes, N.E.; Mul, G.; Lefferts, L. Ammonia Production Technologies. In Techno-Economic Challenges of Green Ammonia as an Energy Vector; Elsevier: Amsterdam, The Netherlands, 2021; pp. 41–83. [Google Scholar] [CrossRef]
- Ikäheimo, J.; Kiviluoma, J.; Weiss, R.; Holttinen, H. Power-to-ammonia in future North European 100% renewable power and heat system. Int. J. Hydrogen Energy 2018, 43, 17295–17308. [Google Scholar] [CrossRef]
- Nayak-Luke, R.; Bañares-Alcántara, R.; Wilkinson, I. “Green” Ammonia: Impact of Renewable Energy Intermittency on Plant Sizing and Levelized Cost of Ammonia. Ind. Eng. Chem. Res. 2018, 57, 14607–14616. [Google Scholar] [CrossRef]
- Smith, C.; Hill, A.; Torrente-Murciano, L. Current and future role of Haber–Bosch ammonia in a carbon-free energy landscape. Energy Environ. Sci. R. Soc. Chem. 2020, 13, 331–344. [Google Scholar] [CrossRef]
- Global Critical Minerals Outlook 2024; International Energy Agency: Paris, France, 2024.
- Electricity Storage and Renewables: Costs and Markets to 2030; International Renewable Energy Agency: Abu Dhabi, United Arab Emirates, 2017.
- Marashli, A.; Al-Kassab, A.I.; Gab-Allah, D.M.; Shalby, M.; Salah, A. Numerical life cycle assessment of lithium ion battery, Li-NMC type, integrated with PV system. Results Eng. 2024, 23, 102489. [Google Scholar] [CrossRef]
- Ren, Z.; Li, H.; Yan, W.; Lv, W.; Zhang, G.; Lv, L.; Sun, L.; Sun, Z.; Gao, W. Comprehensive evaluation on production and recycling of lithium-ion batteries: A critical review. Renew. Sustain. Energy Rev. 2023, 185, 113585. [Google Scholar] [CrossRef]
- Fahr, S.; Schiedeck, M.; Schwarzhuber, J.; Rehfeldt, S.; Peschel, A.; Klein, H. Design and thermodynamic analysis of a large-scale ammonia reactor for increased load flexibility. Chem. Eng. J. 2023, 471, 144612. [Google Scholar] [CrossRef]
- Kong, B.; Zhang, Q.; Daoutidis, P. Nonlinear model predictive control of flexible ammonia production. Control. Eng. Pract. 2024, 148, 105946. [Google Scholar] [CrossRef]
- Rosbo, J.W.; Ritschel, T.K.S.; Hørsholt, S.; Huusom, J.K.; Jørgensen, J.B. Flexible operation, optimisation and stabilising control of a quench cooled ammonia reactor for power-to-ammonia. Comput. Chem. Eng. 2023, 176, 108316. [Google Scholar] [CrossRef]
- Sun, Z.; Zhang, Y.; Huang, H.; Luo, Y.; Lin, L.; Jiang, L. Modeling and simulation of dynamic characteristics of a green ammonia synthesis system. Energy Convers. Manag. 2024, 300, 117893. [Google Scholar] [CrossRef]
- Verleysen, K.; Parente, A.; Contino, F. How does a resilient, flexible ammonia process look? Robust design optimization of a Haber-Bosch process with optimal dynamic control powered by wind. Proc. Combust. Inst. 2023, 39, 5511–5520. [Google Scholar] [CrossRef]
- Armijo, J.; Philibert, C. Flexible production of green hydrogen and ammonia from variable solar and wind energy: Case study of Chile and Argentina. Int. J. Hydrogen Energy 2020, 45, 1541–1558. [Google Scholar] [CrossRef]
- Campion, N.; Nami, H.; Swisher, P.R.; Hendriksen, P.V.; Münster, M. Techno-economic assessment of green ammonia production with different wind and solar potentials. Renew. Sustain. Energy Rev. 2023, 173, 113057. [Google Scholar] [CrossRef]
- Nayak-Luke, R.M.; Bañares-Alcántara, R. Techno-economic viability of islanded green ammonia as a carbon-free energy vector and as a substitute for conventional production. Energy Environ. Sci. 2020, 13, 2957–2966. [Google Scholar] [CrossRef]
- Salmon, N.; Bañares-Alcántara, R. Impact of process flexibility and imperfect forecasting on the operation and design of Haber–Bosch green ammonia. RSC Sustain. 2023, 1, 923–937. [Google Scholar] [CrossRef]
- Smith, C.; Torrente-Murciano, L. The importance of dynamic operation and renewable energy source on the economic feasibility of green ammonia. Joule 2024, 8, 157–174. [Google Scholar] [CrossRef]
- Wang, C.; Walsh, S.D.C.; Longden, T.; Palmer, G.; Lutalo, I.; Dargaville, R. Optimising renewable generation configurations of off-grid green ammonia production systems considering Haber-Bosch flexibility. Energy Convers. Manag. 2023, 280, 116790. [Google Scholar] [CrossRef]
- Wu, Y.; Zhao, T.; Tang, S.; Wang, Y.; Ma, M. Research on design and multi-frequency scheduling optimization method for flexible green ammonia system. Energy Convers. Manag. 2024, 300, 117976. [Google Scholar] [CrossRef]
- EU Requirements for Renewable Hydrogen and Its Derivatives; International PtX Hub: Berlin, Germany, 2023.
- Ammonia Synthesis Plant from Intermittent Renewable Energy (ASPIRE), Science and Technology Facilities Council (STFC), Feasibility Study. 2022. Available online: https://assets.publishing.service.gov.uk/media/6467910a628371000c3a8921/HYS2169_STFC_Final_Feasibility_Report__Confidential___Public_.pdf (accessed on 20 February 2025).
- Potenziamento del Parco Eolico di Troia San Vincenzo; ERG Eolica San Vincenzo: Genova, Italy, 2023.
- Progetto di Ammodernamento Complessivo (“Repowering”), Relativo All’impianto Eolico Esistente Denominato “San Vincenzo”, con Dismissione Degli Attuali 21 Aerogeneratori e Sostituzione in Riduzione Degli Stessi con L’installazione di 10 Nuovi Aerogeneratori, Della Potenza Unitaria di 7,2 MW, per Una Potenza Totale D’impianto Pari a 72 MW, Ubicato nel Comune di Troia (FG), con Opere di Connessione Alla RTN Ricadenti Anche nel Comune di Lucera (FG) (cod. MYTERNA 202303531)—Info—Valutazioni e Autorizzazioni Ambientali—VAS—VIA—AIA. Consultato: 15 Novembre 2024. Available online: https://va.mite.gov.it/it-IT/Oggetti/Info/10374 (accessed on 20 February 2025).
- Pfenninger, S.; Staffel, I. Long-term patterns of European PV output using 30 years of validated hourly reanalysis and satellite data. Energy 2016, 114, 1251–1265. [Google Scholar] [CrossRef]
- Staffel, I.; Pfenninger, S. Using Bias-Corrected Reanalysis to Simulate Current and Future Wind Power Output. Energy 2016, 114, 1224–1239. [Google Scholar] [CrossRef]
- Rouholamini, M.; Wang, C.; Nehrir, H.; Hu, X.; Hu, Z.; Aki, H.; Zhao, B.; Miao, Z.; Strunz, K. A Review of Modeling, Management, and Applications of Grid-Connected Li-Ion Battery Storage Systems. IEEE Trans. Smart Grid 2022, 13, 4505–4524. [Google Scholar] [CrossRef]
- Kebede, A.A.; Kalogiannis, T.; Van Mierlo, J.; Berecibar, M. A comprehensive review of stationary energy storage devices for large scale renewable energy sources grid integration. Renew. Sustain. Energy Rev. 2022, 159, 112213. [Google Scholar] [CrossRef]
- Technologies | Electricity | 2023 | ATB | NREL. Consultato: 11 Ottobre 2024. Available online: https://atb.nrel.gov/electricity/2023/technologies (accessed on 20 February 2025).
- Lechner, M.; Kollenda, A.; Bendzuck, K.; Burmeister, J.K.; Mahin, K.; Keilhofer, J.; Kemmer, L.; Blaschke, M.J.; Friedl, G.; Daub, R. Cost modeling for the GWh-scale production of modern lithium-ion battery cells. Commun. Eng. 2024, 3, 155. [Google Scholar] [CrossRef] [PubMed]
- Lazard’s Levelized Cost of Storage Analysis—Version 7.0; Lazard: Hamilton, Bermuda, 2021.
- Green Hydrogen Cost Reduction: Scaling Up Electrolysers to Meet the 1.5 °C Climate Goal; Irena: Abu Dhabi, United Arab Emirates, 2020.
- Lee, B.; Lim, D.; Lee, H.; Lim, H. Which water electrolysis technology is appropriate?: Critical insights of potential water electrolysis for green ammonia production. Renew. Sustain. Energy Rev. 2021, 143, 110963. [Google Scholar] [CrossRef]
- Large | McPhy. Consultato: 18 Novembre 2024. Available online: https://mcphy.com/en/equipment-services/electrolyzers/large/?cn-reloaded=1 (accessed on 20 February 2025).
- Andersson, J.; Grönkvist, S. Large-scale storage of hydrogen. Int. J. Hydrogen Energy 2019, 44, 11901–11919. [Google Scholar] [CrossRef]
- Elberry, A.M.; Thakur, J.; Santasalo-Aarnio, A.; Larmi, M. Large-scale compressed hydrogen storage as part of renewable electricity storage systems. Int. J. Hydrogen Energy 2021, 46, 15671–15690. [Google Scholar] [CrossRef]
- Demesa, N.; Bruno, J.C.; Coronas, A.; Huicochea, A. Efficient waste heat recovery in a cryogenic distillation air separation plant using heat pumps. In Proceedings of the ECOS 2016—The 29th International Conference on Efficiency, Cost, Optimization, Simulation and Environmental Impact of Energy Systems, Portorož, Slovenia, 19–23 June 2016. [Google Scholar]
- GME—Gestore Mercati Energetici. Available online: https://www.mercatoelettrico.org/it/ (accessed on 20 February 2025).
- European Commission. Comm. Deleg. Regul. (EU) 2021/2139 2021, L 442/1, 349. Available online: https://eur-lex.europa.eu/legal-content/EN/TXT/PDF/?uri=CELEX:32021R2139&from=EN (accessed on 20 February 2025).
- European Parliament e European Council. Supplementing Directive (EU) 2018/2001 of the European Parliament and of the Council by establishing a Union methodology setting out detailed rules for the production of renewable liquid and gaseous transport fuels of non-biological origin. Off. J. Eur. Union 2023, L 328/82, 9. Available online: https://eur-lex.europa.eu/legal-content/EN/TXT/PDF/?uri=CELEX:32023R1184 (accessed on 20 February 2025).
- Italy, 2024, Total Electricity Mix. Available online: https://app.electricitymaps.com/zone/IT-SO/all/yearly (accessed on 20 February 2025).
- “Italy, 2025, 01/01-31/01, Carbon Intensity Data”, Electricity Maps, ver. January 27, 2025. Available online: https://www.electricitymaps.com (accessed on 20 February 2025).
- Tjahjono, M.; Stevani, I.; Siswanto, G.A.; Adhitya, A.; Halim, I. Assessing the feasibility of gray, blue, and green ammonia productions in Indonesia: A techno-economic and environmental perspective. Int. J. Renew. Energy Dev. 2023, 12, 1030–1040. [Google Scholar] [CrossRef]
- Italy 2023 Energy Policy Review; International Energy Agency: Paris, France, 2023.


Disclaimer/Publisher’s Note: The statements, opinions and data contained in all publications are solely those of the individual author(s) and contributor(s) and not of MDPI and/or the editor(s). MDPI and/or the editor(s) disclaim responsibility for any injury to people or property resulting from any ideas, methods, instructions or products referred to in the content. |
© 2025 by the authors. Licensee MDPI, Basel, Switzerland. This article is an open access article distributed under the terms and conditions of the Creative Commons Attribution (CC BY) license (https://creativecommons.org/licenses/by/4.0/).