Article

Design and Performance Analysis of Dry Gas Fishbone Wells for Lower Carbon Footprint

1
Department of Petroleum Engineering, College of Engineering and Mines, University of North Dakota, Grand Forks, ND 58202, USA
2
Petroleum Engineering Department, College of Petroleum Engineering & Geosciences, King Fahd University of Petroleum & Minerals, Dhahran 31261, Saudi Arabia
3
Department of Energy & Petroleum Engineering, College of Engineering and Physical Sciences, University of Wyoming, Laramie, WY 82071, USA
*
Author to whom correspondence should be addressed.
Fuels 2023, 4(1), 92-110; https://doi.org/10.3390/fuels4010007
Submission received: 16 January 2023 / Revised: 5 February 2023 / Accepted: 24 February 2023 / Published: 27 February 2023

Abstract

:
Multilateral well drilling technology has recently assisted the drilling industry in improving borehole contact area and reducing operation time, while maintaining a competitive cost. The most advanced multilateral well drilling method is Fishbone drilling (FbD). This method has been utilized in several hydrocarbon fields worldwide, resulting in high recovery enhancement and reduced carbon emissions from drilling. FbD involves drilling several branches from laterals and can be considered as an alternative method to hydraulic fracturing to increase the stimulated reservoir volume. However, the expected productivity of applying a Fishbone well from one field to another can vary due to various challenges such as Fishbone well design, reservoir lithology, and accessibility. Another challenge is the lack of existing analytical models and the effect of each Fishbone parameter on the cumulative production, as well as the interaction between them. In this paper, analytical and empirical productivity models were modified for FbD in a dry gas reservoir. The modified analytical model showed a higher accuracy with respect to the existing model. It was also compared with the modified empirical model, which proved its higher accuracy. Finally, machine learning algorithms were developed to predict FbD productivity, which showed close results with both analytical and empirical models.

1. Introduction

A multilateral well configuration encompasses the deployment of multiple horizontal laterals branching off from a singular vertical wellbore, with the objective of enhancing production efficiency [1]. The utilization of multilateral wells aims to increase the drainage area and thus augment the production rate [2]. Although the drilling cost associated with multilateral wells may be higher, this cost is offset by the improved reservoir recovery resulting from enhanced wellbore-reservoir contact. There has been extensive research directed towards optimizing multilateral drilling costs and designs [3,4]. One of the latest advancements in multilateral drilling technology is Fishbone Drilling (FbD) [5]. FbD is comprised of a series of micro-branches drilled in divergent directions from a primary horizontal wellbore, with a designated inter-branch spacing as shown in Figure 1 [6]. The implementation of FbD can maximize reservoir contact area and facilitate access to previously unreachable geological formations, thereby augmenting cumulative production [7]. FbD has been shown to have higher productivity compared to hydraulic fracturing in relatively low permeability formations [8]. FbD is a desirable solution in the light of economic, environmental, and regulatory limitations [9]. A recent study conducted by THREE60 Energy found that Fishbone drilling methods result in significantly lower CO2 emissions compared to other well enhancement practices [10]. The study demonstrated that the jetting solution employed in FbD resulted in an 88% reduction in emissions and the drilling method resulted in a 95% reduction in emissions compared to other market alternatives. The jetting emissions for FbD were found to be 6.7 tons per completion, in contrast to 53.3 tons for acid-fracturing [11]. Drilling emissions for FbD were 35.4 tons per completion, compared to 651 tons for propped-fracturing. The study concluded that FbD methods provide a safer, more environmentally responsible, and potentially more cost-effective solution for well enhancement, with the ability to selectively stimulate reservoir “sweet spots” and connect with faults and fractures [12,13] through expertly controlled pumping operations [11].
The optimization of Fishbone well parameters has been a subject of investigation by various researchers, who have sought to comprehend the effect on productivity and cumulative production [14]. This includes the impact of branch number, branch length, inter-branch distance, and the angle between the branch and main lateral borehole. The Fishbone configuration has been implemented in the Daqing Peripheral oilfield [8] and a Middle East oilfield [14]. Numerical simulations demonstrate that well productivity is enhanced with an increase in branch number, reaching an optimum point. The optimum branch number represents the least number of branches required to achieve maximum productivity increase. Analogous findings were observed with increasing branch length, with an optimum length of 300 m, beyond which productivity remained constant. The optimal branch angle with respect to the main lateral was found to be 20° and 30° in two different cases, influenced by the control area and its relation to angle changes. The inter-branch distance is still under investigation, as it pertains to multiple factors such as reservoir thickness, petrophysical properties, drilling Kickoff Point (KOP) selection, and build-up severity challenges. To maximize reservoir volume, the drainage area should be of sufficient width to eliminate interference between adjacent branches.
Successful applications of Fishbone well configurations have been reported in several case studies across the globe. In Venezuela, the Zuata field, which comprises non-homogeneous sand, has been documented as the first successful application of Fishbone design (FbD) [15]. The first FbD application in Russia was reported in the Nizhnekhet 1 field, a very thin formation [16]. Four additional case studies from Russia have been documented in the literature, including sandstone formations in the Vostochno-Messoyakskoye onshore field [17], low permeable formations in the East Messoyakha field [18], the Vankor oilfield in Krasnoyarsk, Eastern Siberia [19], and the Srednebotuobinskoye oil and gas condensate field in Eastern Siberia [20]. In the UAE, successful FbD case studies have been reported in naturally fractured reservoirs [21,22], and an innovative Fishbone infill well was applied in the Canadian oil sands play [23]. Research into applications of Fishbone well configurations in areas such as geothermal drilling, enhanced oil recovery, steam-assisted gravity drainage, and underground saltwater disposal are ongoing [24,25].
The production rate of oil and gas from a reservoir can be predicted through reservoir deliverability analysis. The bottom-hole pressure has a significant effect on the production rate, regardless of the completion type and artificial lift methods employed. Analytical models for well deliverability exist to study the relationship between the production rate and bottom-hole pressure [26]. These models are dependent on various factors such as reservoir pressure, boundary type, distance, permeability (vertical, horizontal, and relative permeability), wellbore radius, near-wellbore effect, thickness of the pay zone, and reservoir fluid properties [27]. The prediction of productivity is also dependent on well geometry (e.g., vertical, horizontal, multilateral) and the interrelationship between the parameters mentioned is known as the Inflow Performance Relationship (IPR).
This paper presents advanced approaches to quantify the production rates of some Fishbone well configurations. Analytical, empirical, and data-driven approaches were adopted to develop productivity prediction models in a dry gas reservoir with good petrophysical properties. The developed models consider the effect of the number and length of the branches, the distance between two adjacent branches, the inclination angle, and the permeability anisotropy. The modified analytical model was based on modifying the existing models and some geometrical assumptions. The empirical model was modified using the Grey Wolf Algorithm optimization, and the data-driven models were based on the artificial neural network and support vector regression methods optimized with an advanced genetic algorithm.

2. Background

The implementation of Fishbone well design (FbD) presents numerous difficulties in terms of wellbore analysis and production flow studies due to its complex combination of boreholes with differing well geometries [28]. These difficulties result in the development of analytical models based on various assumptions, leading to potential inaccuracies in production rate predictions. In an effort to mitigate such errors, numerical simulations are often employed, however, these too are subject to complications. As the progress of FbD continues to advance, the development of new models and approaches for the analysis of productivity in Fishbone wells becomes increasingly crucial.
In regard to the analysis of production flow rate, two different approaches exist, analytical and empirical. Analytical approaches are derived from the solution of Darcy’s equation for different flow regimes, while empirical approaches are based on experimental work to develop correlations between drawdown and flow rate [29].
The Inflow Performance Relationship (IPR) for Fishbone wells is challenging to model due to the complexity of its geometries. Two different flow regions exist, with one representing the drilled region where the flow between branches is assumed to be pseudo-steady-state and pseudo-linear flow, and the other representing the formation matrix where the flow is assumed to be pseudo-steady-state radial flow. The inner region denotes the drained volume, while the outer region symbolizes the non-stimulated volume [30] (See Appendix A).
The deliverability of a uniformly distributed number of holes in the inner region for a gas reservoir was presented by [30] (pp. 37–81). The model is stated as:
q g = i = 1 n k H L i p p l 2 p w f 2 1424 μ g ¯ z ¯ T I a n i l n h I a n i r w i I a n i + 1 + π y b i h I a n i 1.224 ( s i + D q g
Equation (1) is used for the inner regions where the formation is drilled using Fishbone branches; Equation (2) is used for the outer region:
q g = k H h 1424 μ g ¯ z ¯ T 1 2 l n 4 A γ C A r P L 2
q g = p 2 p w f 2 1 J P L + 1 J R
where JPL and JR are:
J P L = n k H L i 1424 μ g ¯ z ¯ T I a n i l n h I a n i r w i I a n i + 1 + π y b i h I a n i 1.224 ( s i + D q g
J R = k H h 1424 μ g ¯ z ¯ T 1 2 l n 4 A γ C A r P L 2
In the above equations: L i   length of the branch (ft), n number of the branches, r w i radius of the branch (ft), y b i   distance between adjacent branches (ft) (These parameters represent the Fishbone well design configuration). s i Skin factor, μ g ¯ : Gas viscosity (cp), z ¯ Gas compressibility factor, T Reservoir temperature (°R), p i Initial reservoir pressure ( psia ) , p w f Flowing bottom-hole pressure r = r w   psia ,   r w Well radius ft , s Skin factor, r e Reservoir boundary (ft), p ¯ r Wellbore pressure (psi), h Pay thickness (ft), q g Gas flow rate at pressure p (bbl/day), D Non-darcy flow coefficient (d/Mscf), C A Stabilized performance coefficient (MMScf/D.psia2m or MMScf/D.(psia2/cp)m), m Dimensionless deliverability exponent, defined as the line’s inverse slope on a log-log plot of the change in pressure-squared or pseudo-pressure versus gas flow rate, p p l   Average pressure at the edge of the inner region (psi), γ Fluid specific gravity, I a n i is the relationship between the horizontal and vertical permeability, which is presented as:
I a n i = k H k V
where: kH Horizontal permeability (mD), kV Vertical permeability (mD), rpl Equivalent radius of the inner region, which can be calculated using the following equation:
r p l = n + 1 2 L i y b i π
Due to the complexity of solving analytical models, caused mainly by the lack of accurate PVT data, IPR correlations were introduced to the petroleum industry. Ref. [31] generated an empirical correlation to model IPR in a Fishbone type multilateral dry gas well. Their model was validated using a commercial well performance software simulation with real field data for production history matching. The model does not take into consideration the effect of the distance between the adjacent branches on productivity. This model does not yield accurate results when the number of branches increases.
q o q o , m a x = 1 + a P w f P a v g b n c + d k H k V e P w f P a v g f + g L  
Constants a to f in the above equation are as follows: a = 1.056150135, b = 1.35, c = 0.12837, d = −2.49525, e = −0.02782, f = 1.7, g = 2.52 × 10⁻⁶.
Several papers and research studies report on the productivity prediction of vertical and horizontal wells using different machine learning algorithms [32,33]. It has been recently used as a powerful tool to predict the well performance in complex formations [34]. Ref. [35] developed algorithms based on the Neural-based Decision Tree (NDT) learning model. A higher-order neural network was applied by [36], and a surrogate model was suggested by [37]. The other models are based on integrating supervised machine learning with a well-calibrated bias [38], and experimental data and/or simulation results [39]. Ref. [40] developed a machine learning approach for shale gas horizontal well productivity.
Ref. [41] proposed three methods for artificial intelligence as a new approach to investigate the productivity in Fishbone well, the inputs are the flowing bottom hole pressure (Pwf), the formation permeability ratio (kH/kV), and the length of each lateral (Li). The model output was the flow rate fraction. This study is limited in terms of the other Fishbone parameters such as the number of branches and distance between them. The three applied algorithms were Artificial Neural Network (ANN) model, with 97% accuracy, the Adaptive Neuro-Fuzzy Inference System (ANFIS) with 98% R score, and the Radial Basis Function (RBF) network with a 98% coefficient of correlation.

3. Simulation Model Description

Numerical simulation plays a crucial role in the analysis of well deliverability when field data is scarce or limited, which is the case for a newly developed technology such as fishbone drilling. For this reason, in our study, we consider the results from the numerical simulation to be the benchmark for comparison and validation of our models.
A commercial well performance software was used to evaluate the performance of Fishbone wells at different operating conditions. More than 250 different cases were examined. Actual wellbore conditions and real reservoir data were utilized to perform the study. The reservoir model was examined and validated by an experienced production engineer. The reservoir model consists of 62 × 21 × 11 grid cells, while a 3D Cartesian grid system was used. The Fishbone well was drilled at the center of a gas reservoir that has dimensions of 20,000 × 10,000 × 750 feet. The Fishbone well performance was studied for around 20 years of production, representing a typical field life span in the area. Further descriptions about the reservoir models have been reported previously by [31,41]. In all simulation runs, the well production and bottomhole pressure profiles were recorded. In addition, wide ranges of permeability ratio (kH/kV), the distance between adjacent branches, and the number of branches were used. Table 1 lists the statistical parameters for all reservoir models studied in this work. The production rate varied between 197,900 and 0 SCF/DAY, representing the Absolute Open Flow (AOF) and well shut-in conditions, respectively. A permeability anisotropy factor (kH/kV) between 1000 and 1 was used, which represents very tight vertical permeability and equivalent horizontal and vertical permeability (uniform and homogenous reservoir), respectively. Moreover, flowing well pressure between 14.7 psi and 4800 psi was used, indicating AOF and well shut-in conditions.

4. Model Elaboration

The results generated from the numerical simulations are presented in this section and are used as the input for the analytical, empirical, and data-driven model elaboration. The numerical simulation results are compared with the existing analytical model which is modified and compared with the modified empirical model.

4.1. Analytical IPR Model for Fishbone Well

Based on the literature review presented previously, we modified the analytical models for FbD productivity prediction following the work of [30] (pp. 37–81). The aim was to apply the existing model to the reservoir simulation results and investigate the applicability and reliability of the numerical simulation outputs. The comparison is based on each parameter change, and the output is presented in a chart format.

4.1.1. Number of Branches

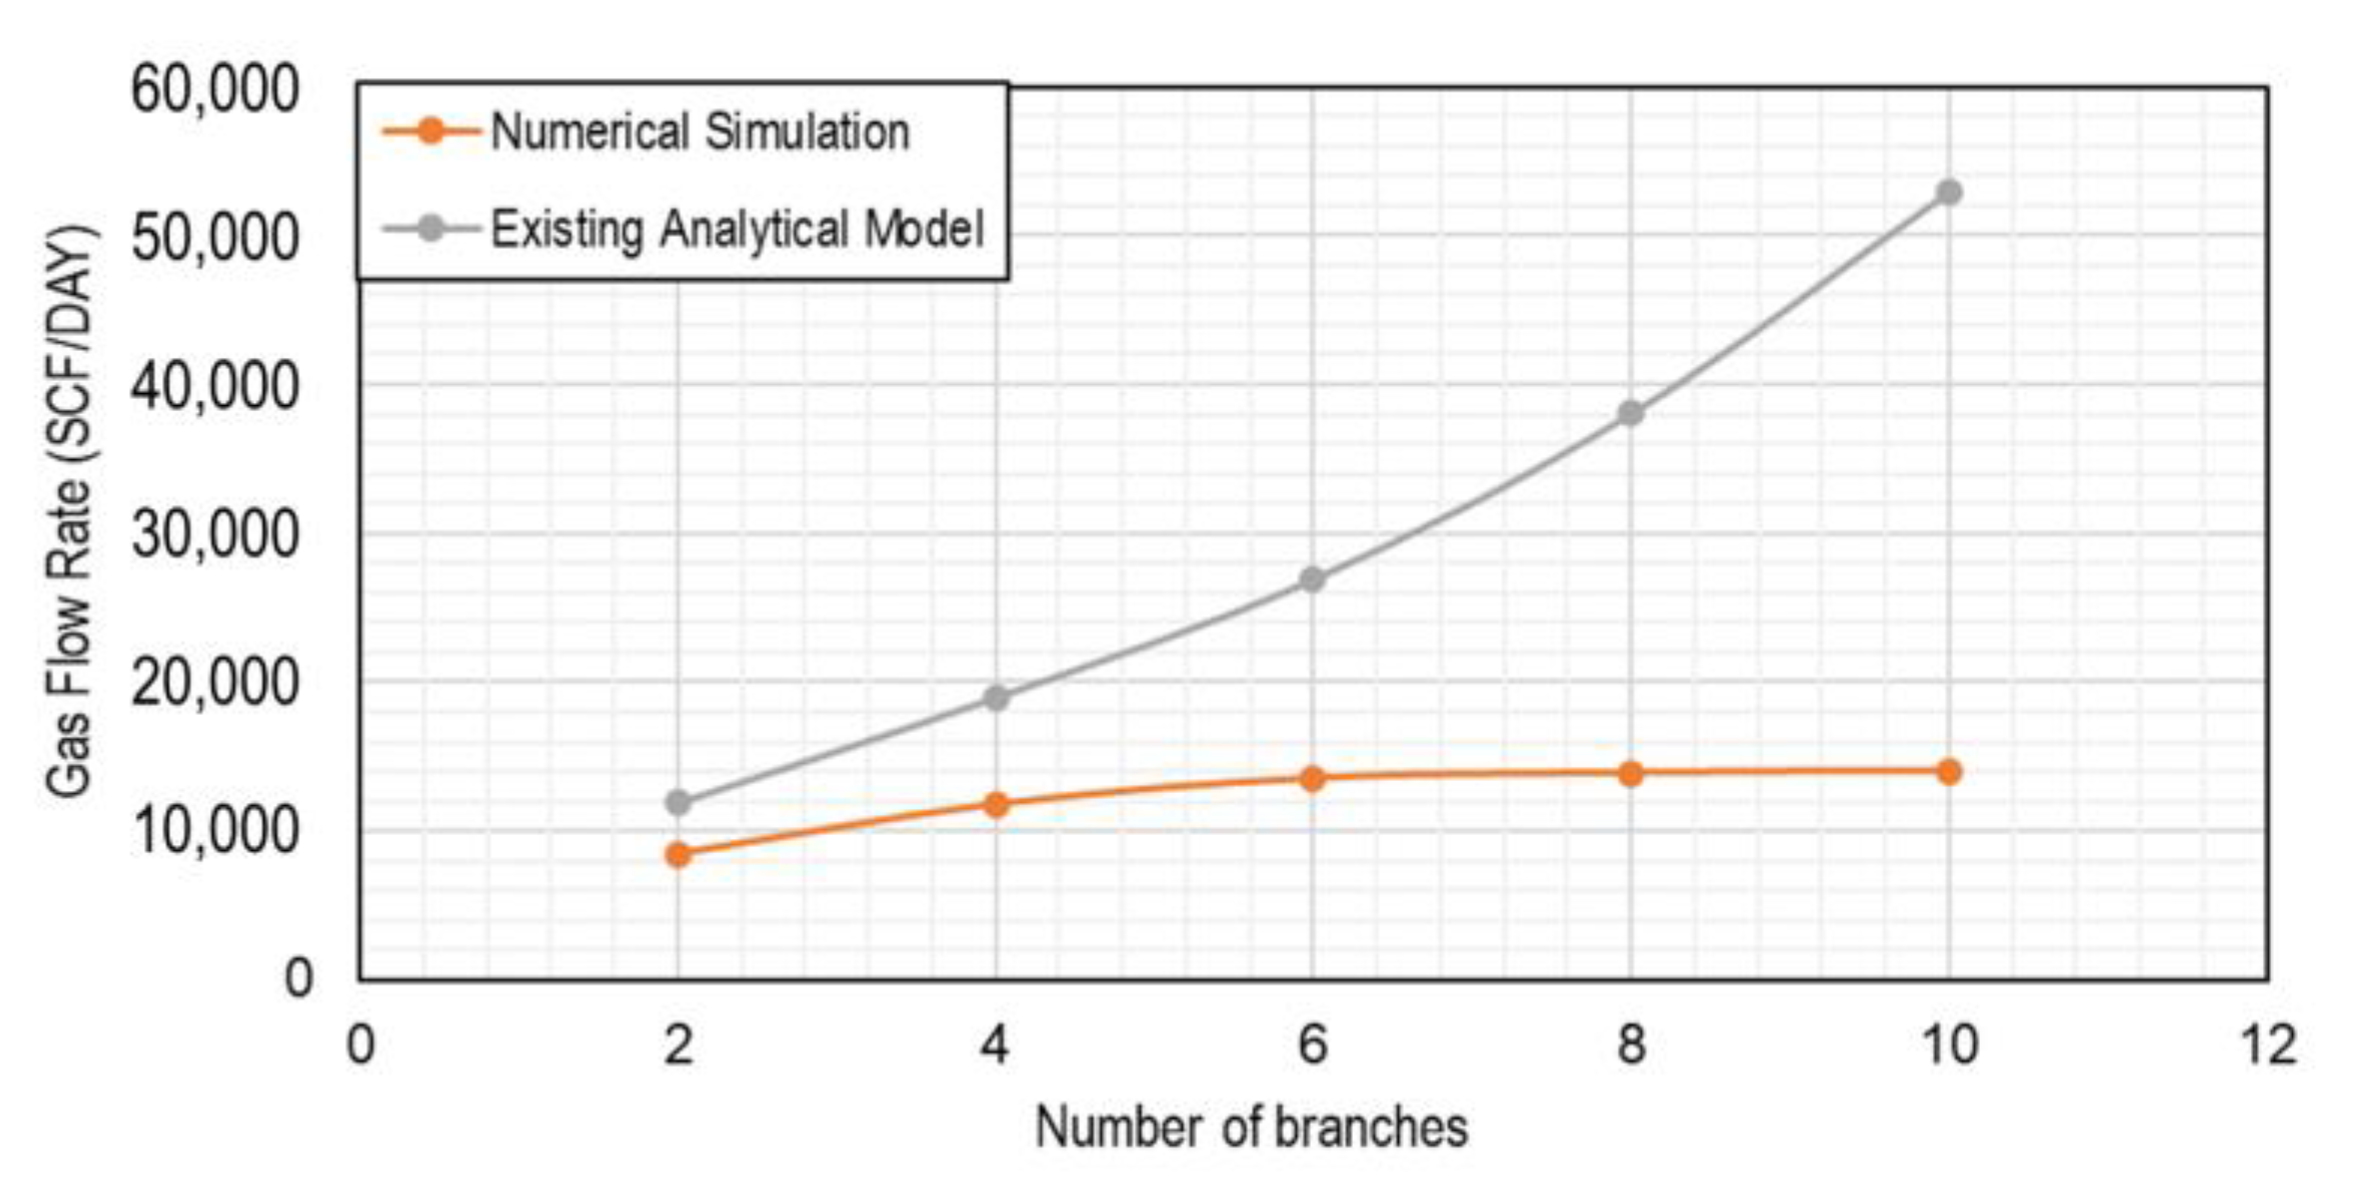
To evaluate the impact of the number of branches on cumulative production, a constant permeability anisotropy of 10 was established while maintaining a fixed length of 3100 feet and an interbranch distance of 2600 feet. The only varying parameter was the number of branches. The results depicted in Figure 2 indicate an exponential increase in flow rates obtained from the analytical model in comparison to a slight increase observed in the numerical simulation results with the increase in the number of branches. These findings verify the limitations of the existing analytical model for a higher number of branches, specifically above four branches.

4.1.2. Length of Branches

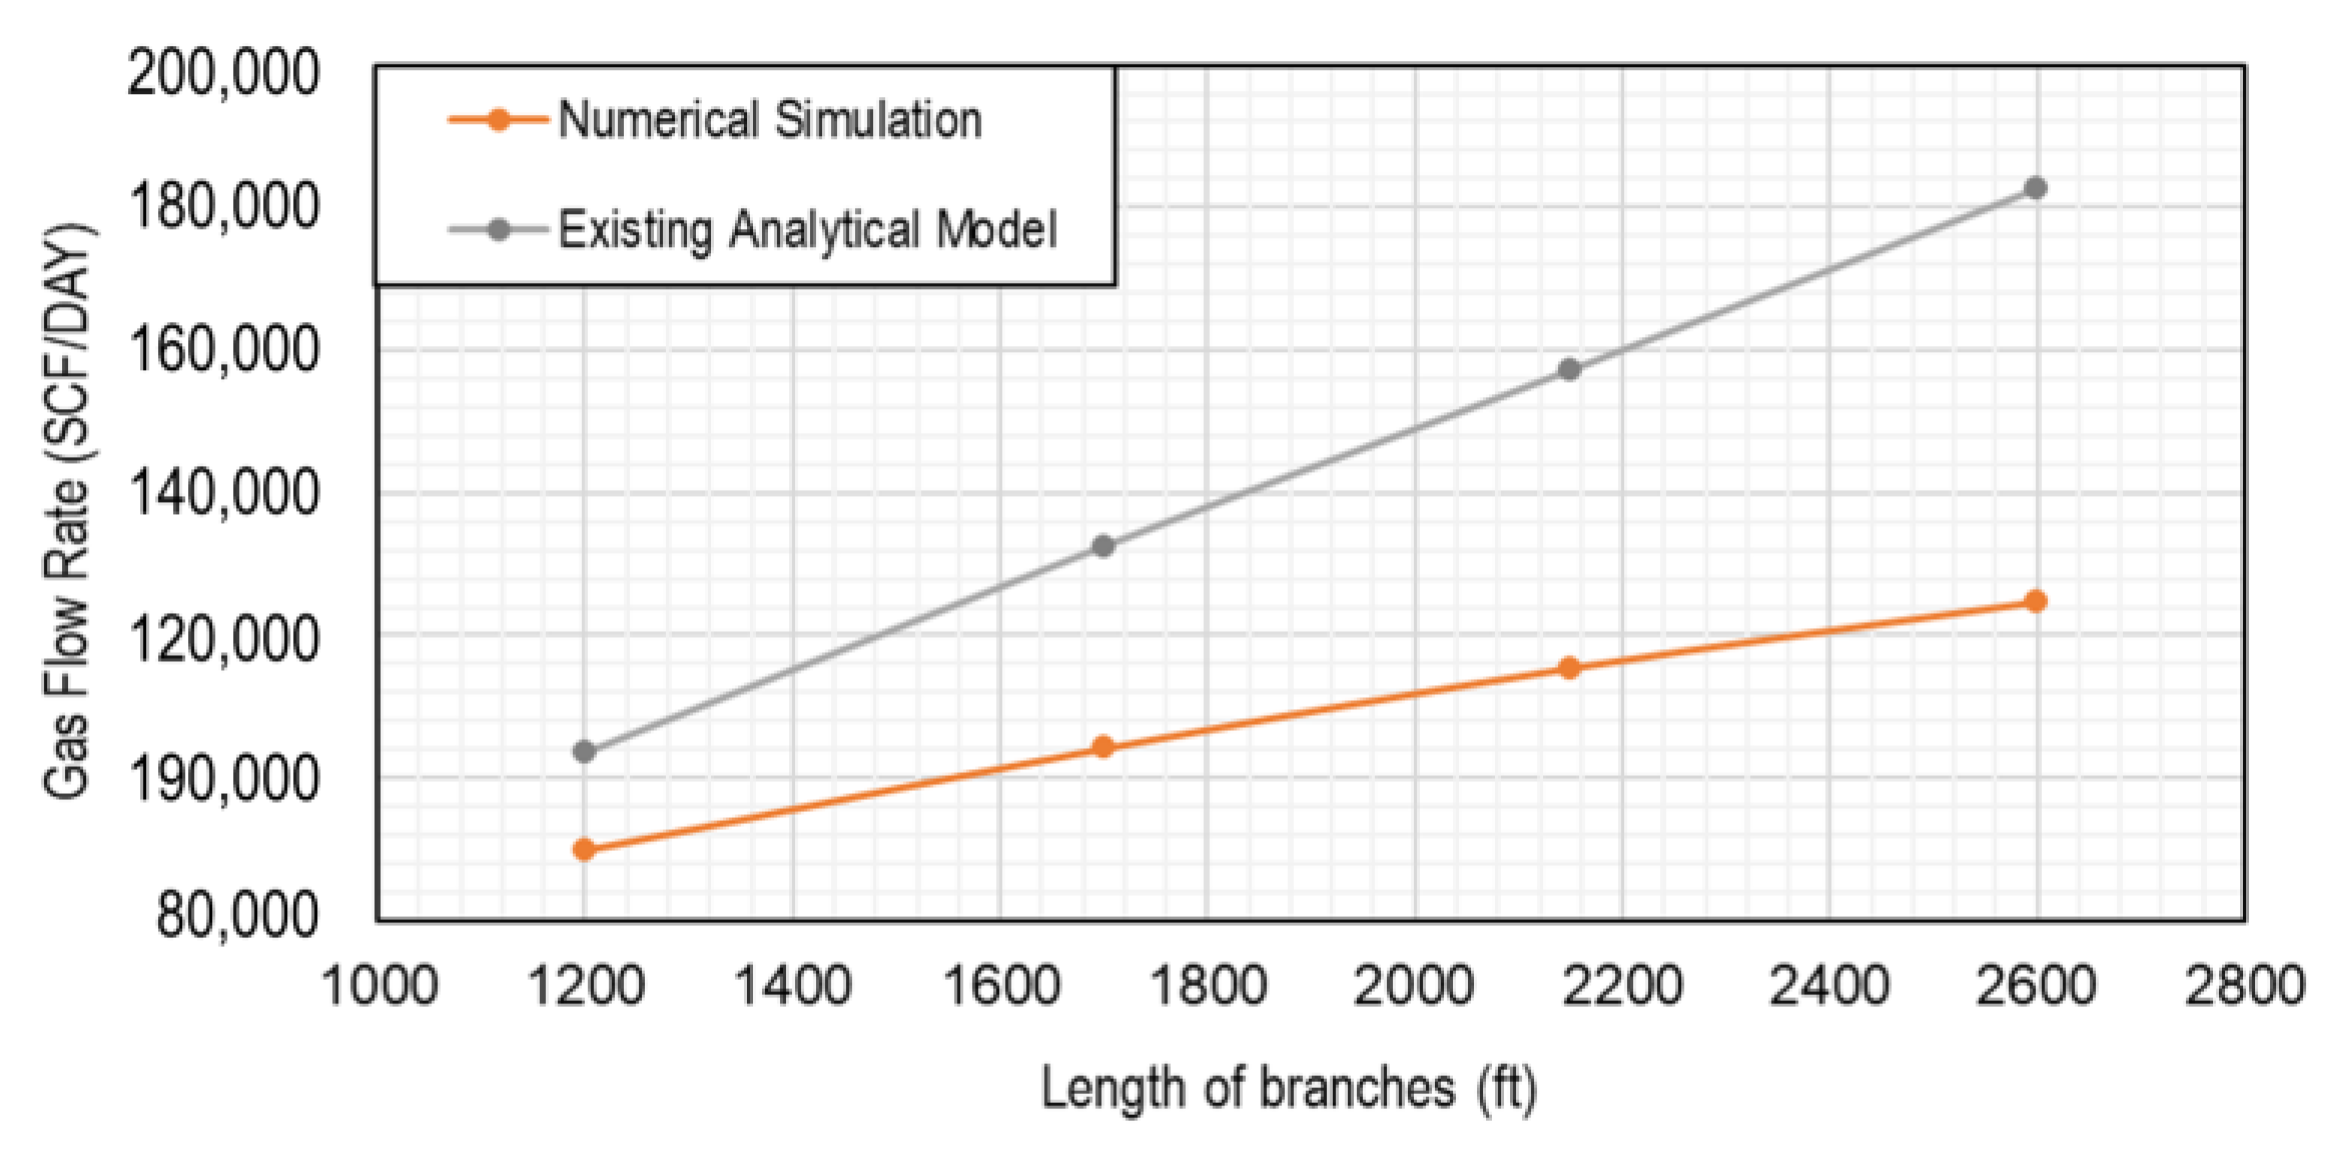
In our analysis of the influence of branch length on cumulative production, a per-meability anisotropy of 10 was maintained while keeping the number of branches constant at 6 and inter-branch distance fixed at 2600 feet. The sole variable in this scenario was the length of the branches. Our numerical simulation and the existing analytical model both depict an increase in well productivity with an increase in branch length. However, the gradients of the productivity growth chart for both models remain unchanged. The existing analytical model demonstrates an overestimation of the impact of the length of branches on flow rate as illustrated in Figure 3, when compared to the results obtained from the numerical simulation.

4.1.3. Permeability Anisotropy

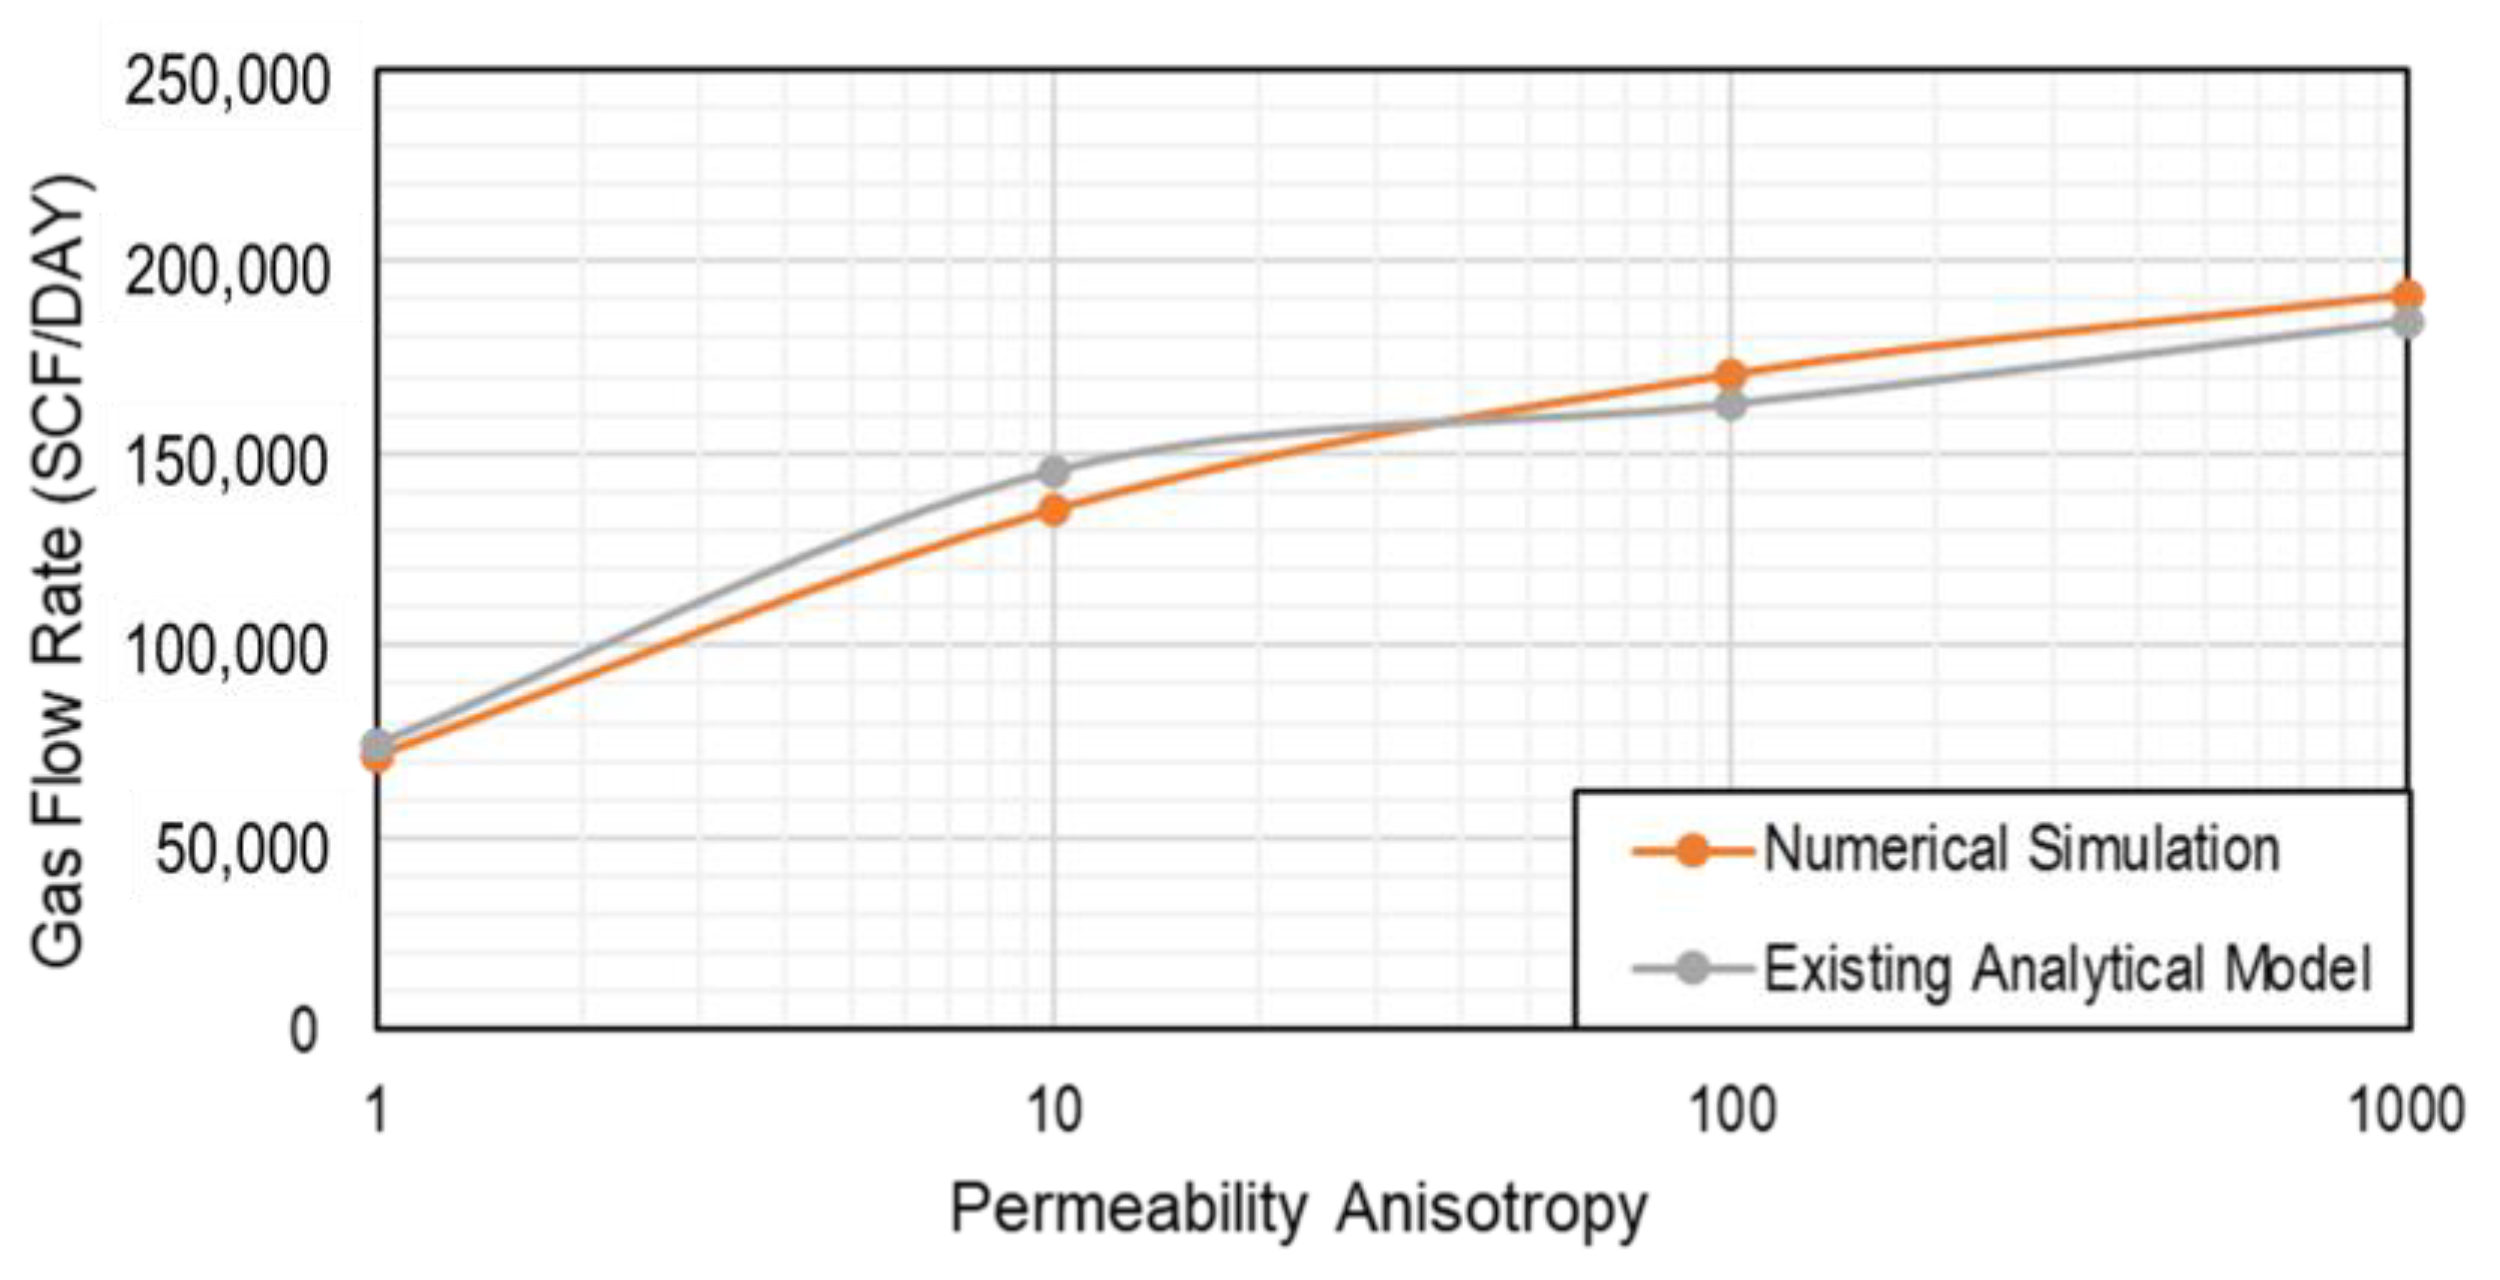
In this study, we evaluated several scenarios where the length of the branches was fixed at 3100 feet, the inter-branch distance was maintained at 2600 feet, and the number of branches was held constant at 6, while varying the permeability anisotropy. The results displayed in Figure 4 indicate a correlation between increased reservoir anisotropy and enhanced well productivity. The outputs from both the existing analytical models and the numerical simulations are highly congruent, with a common value at the intersection between the two models represented by a permeability anisotropy Iani of 40–50.

4.1.4. Distance between Adjacent Branches

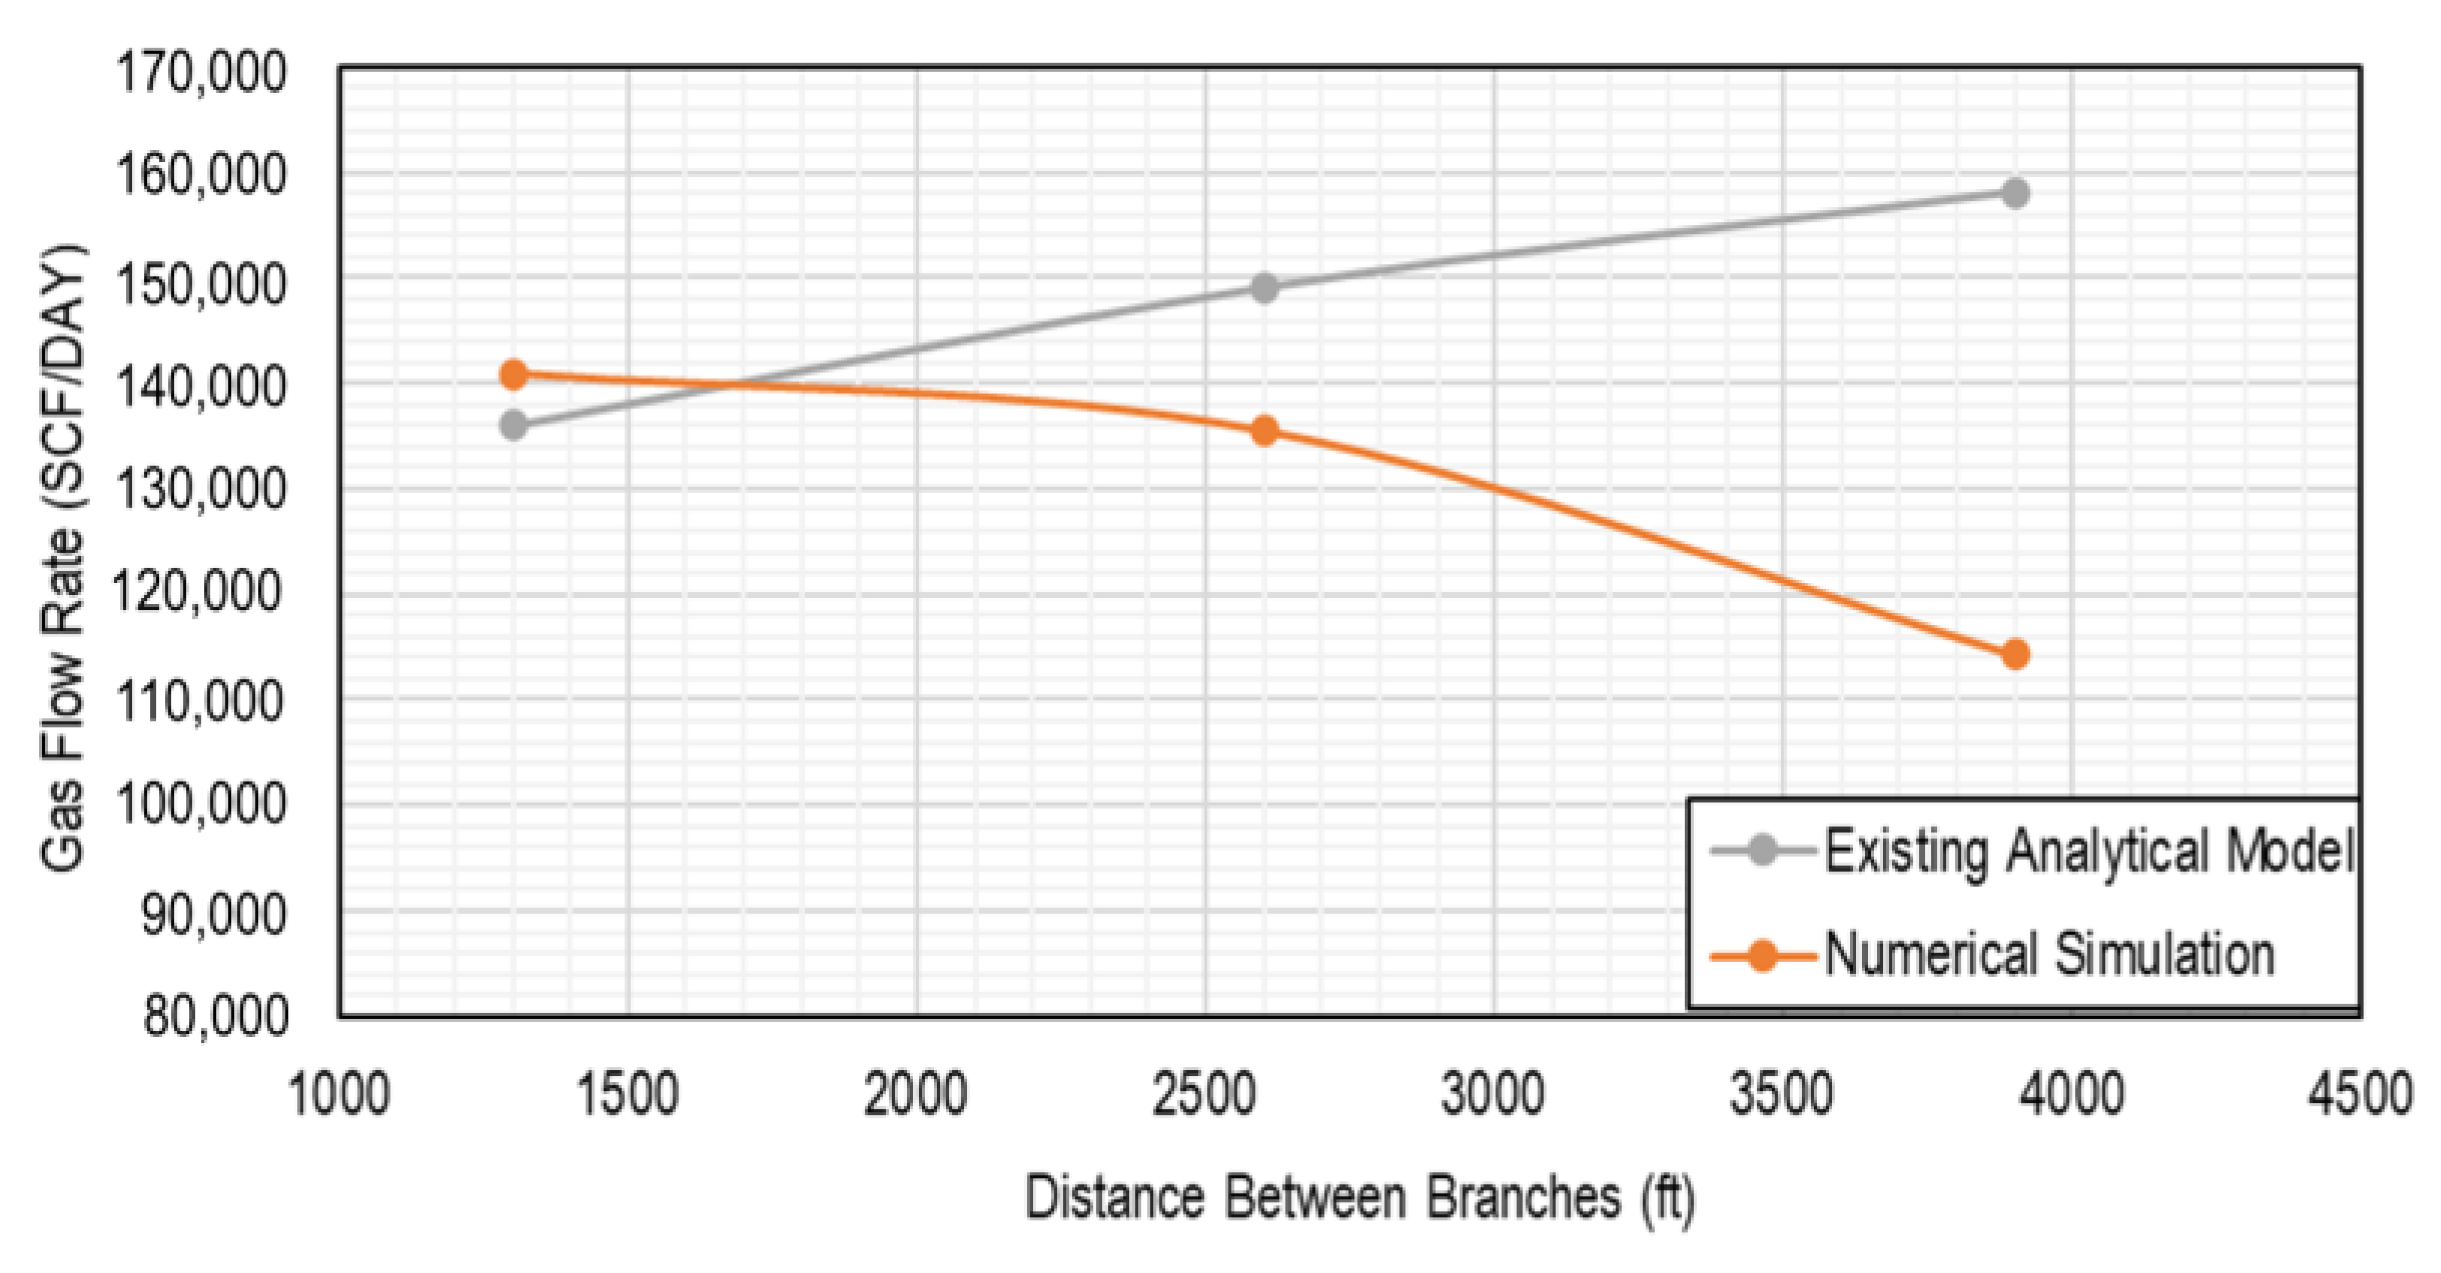
In this examination, we analyzed the impact of inter-branch distance on cumulative production by maintaining a constant number of branches (6), permeability anisotropy (10), and length of branches (3100 feet). The results obtained from the existing analytical model and numerical simulations displayed stark disparities as demonstrated in Figure 5. The trend observed in the numerical simulation depicts a slight decrease, whereas the analytical model exhibits an increase. These findings affirm that the existing analytical model is not suitable for studying the effect of inter-branch distance variations.
The development of the analytical model assumes that as inter-branch distance increases, the drainage area expands. This theory, however, is limited when the inter-branch distance is less than double the drainage radius. An increase in inter-branch distance results in an increase in cumulative production due to the enlarged drainage area. When the inter-branch distance equals double the drainage radius, the cumulative production remains constant and experiences a slight decrease in regions with poor reservoir quality properties. The simulation is configured with inter-branch distances greater than double the drainage radius to prevent any interference with the drainage volume of each branch. As such, the modification of the existing model is based on two parameters:
  • Drainage surface:
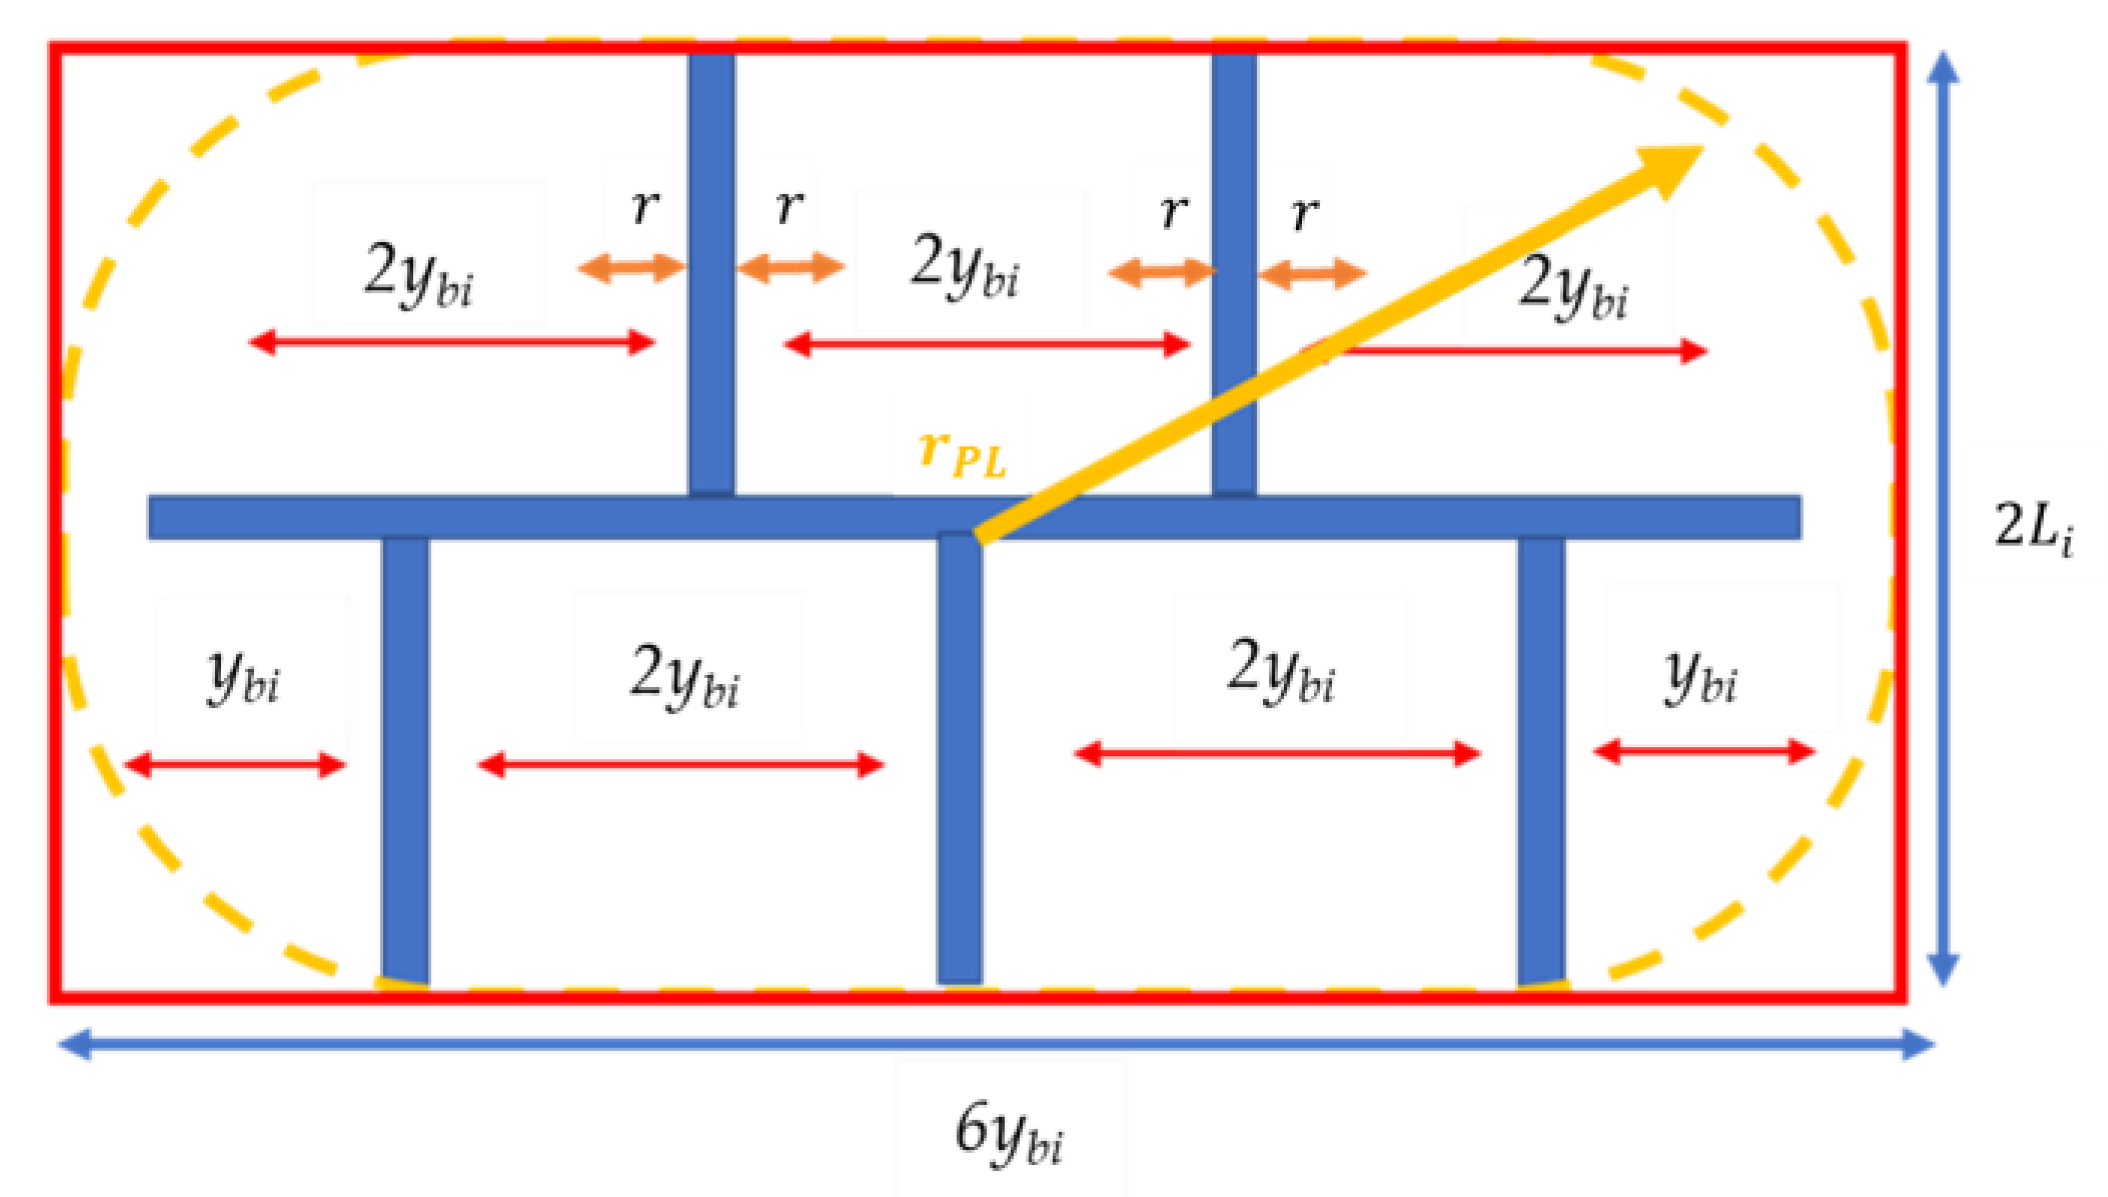
The drainage surface is a part of the stimulated radius “rpl”. The rpl of the existing correlation considers that by increasing the distance between adjacent branches, the drainage surface increases. To develop that, we take an example of a Fishbone well with five branches, as shown in Figure 6.
The development of rpl is as follows:
r P L 2 π + L i 2 y b i 2 r n + 2 y b i r = 2 L i n + 1 y b i
r P L 2 π = L i 2 y b i 2 r n + 2 y b i r + 2 L i n + 1 y b i
r P L 2 π = 2 L i n + 1 ) y b i + r + 2 L i n + 1 y b i
    r P L 2 = ( 2 L i n + 1 ) r / π      
r P L = n + 1 2 L i r π
The developed stimulated radius assumes that the drainage volume is related to the drainage radius and not the distance between adjacent branches. In the case where the double drainage radius is greater than the distance between adjacent branches, Equation (13) can be used instead of Equation (7).
  • High-pressure reservoir effect:
We noticed that the existing analytical models do not consider the effect of high reservoir pressure. For gas reservoirs, when the pressure exceeds 3000 psi, the pressure function (1/μg Bg) becomes nearly constant, and thus can be taken outside the integral. This function will replace (1/μg z) used in low pressure reservoirs [42]. This approximation is called pressure-approximation method. Equation (1) is modified accordingly First, the square function needs to be deleted from the pressure difference (this represents the gas pseudo-pressure integration):
q g = p p l p w f 1 J P L + 1 J R
Second, the constant pressure function (1/μg Bg) is introduced into the equation (adjustments required):
J P L = n k H L i 1424 μ g ¯ B g ¯ I a n i l n h I a n i r w i I a n i + 1 + π y b i h I a n i 1.224 s i + D q g
J R = k H h 1424 μ g ¯ B g ¯ 1 / 2 l n 4 A γ C A r P L 2
In order to apply the p-approximation of gas deliverability equations, the gas volume factor Bg should be introduced, and the gas viscosity needs to be calculated. The correlations are shown in Appendix B.

4.2. IPR Empirical Correlation for Fishbone Well

This section aims to generate a new IPR empirical correlation for a Fishbone well for a conventional dry gas reservoir. The non-linearity between the parameters needs to be solved by either genetic algorithms or evolutionary algorithms. The multifeatured non-linear regression is solved using the Grey Wolf Algorithm (GWA) algorithm which was first introduced in 2014 [43]. The algorithm has been widely used in the petroleum industry [44]. The grey wolf’s behavior mainly inspired the algorithm. In nature, these wolves live in packs of 5–12 wolves which have a hierarchy of dominance. The wolf that governs the pack is called alpha (α), and they are responsible for deciding on the hunt. The whole pack must follow these decisions. Beta (β) wolves come next in the hierarchy, and these are subordinate wolves helping the alpha make decisions. The beta wolves reinforce the alpha decisions through the pack. The next step is to find the delta (δ) wolves. They are subordinate of alphas and betas, but still, dominate omegas (ϒ) which have the lowest level in the hierarchy [43]. This hierarchy and the hunting strategies mentioned in [43] have been modeled mathematically to produce the Grey Wolf Algorithm. First, a random set of solutions is generated to represent the location of these wolves. Each of these solutions is evaluated using the objective function-root mean square error for our case. Second, the solutions are ranked, and the three fittest solutions are assigned as positions to the wolves’ alpha (α), beta (β), and delta (δ), while the rest of the solutions are assigned to the omegas (ϒ). The wolves are looking for prey in the hunting process, which is the optimum solution in the mathematical model.
The modified correlation will be as follows:
q o q o , m a x = 1 + a P w f P a v g b n c + d k H k V e P w f P a v g f + g e h * L y b i
a, b, c, d, e, g, and h are the parameters that calibrate our model to ensure the accuracy between the inputs (dimensionless BHP, anisotropy, distance between adjacent branches, and the length of the branch) and the output (dimensionless flow rate). These parameters are listed in Table 2.
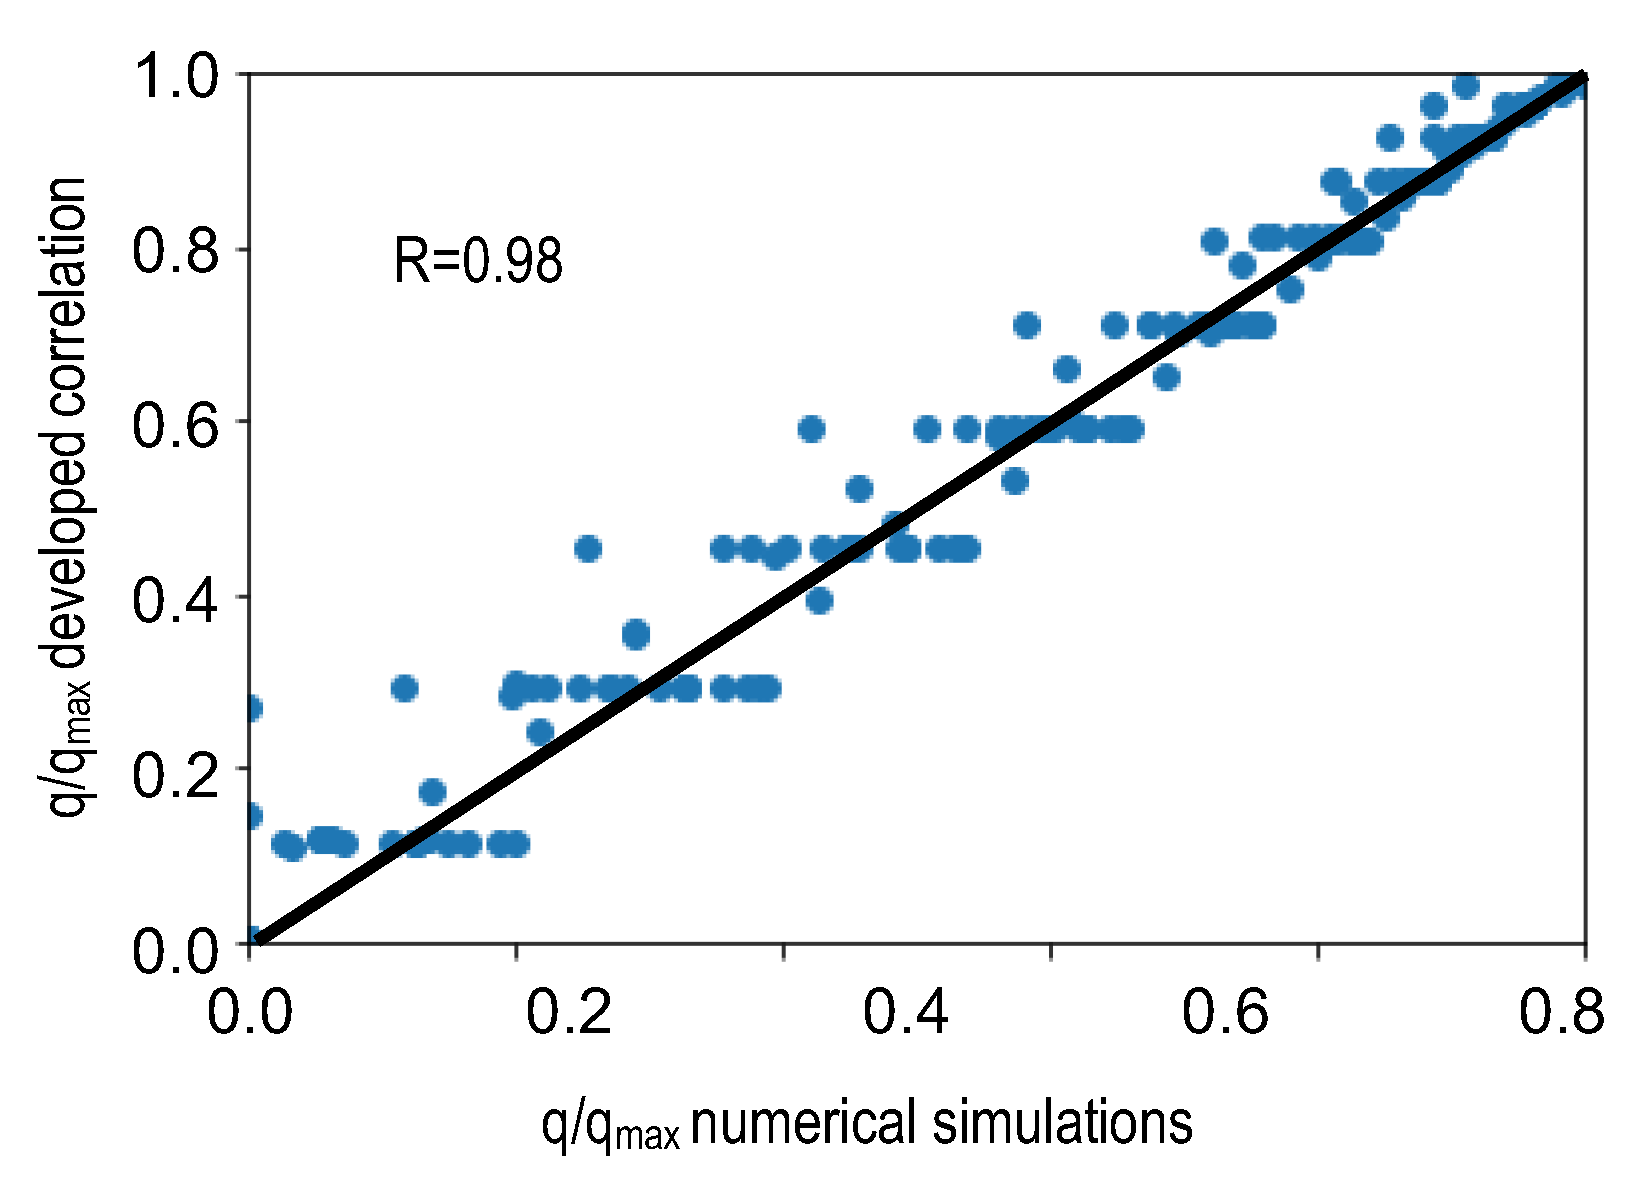
The GWA algorithm was used to find the optimum values of the coefficient. The coefficient of correlation (R-Score) is 98%, as shown in Figure 7:
The coefficient of correlation represented in Figure 7 demonstrates that the variable is highly correlated, so the modified correlation is statistically valid. To ensure that the correlation is physically valid, the signs (negative or positive) of the coefficient are related to the effect of the Fishbone well configuration parameters on the flow rate increase or decrease, which was added to the developed algorithm with possible intervals for each coefficient to account for the physical significance of the problem.
To validate the results, a comparison between the numerical simulation, modified empirical correlation, and modified analytical model flow rates was conducted. This was carried out by varying the number of the branches, length of the branches, anisotropy, and the distance between these branches.

4.3. IPR Data-Driven Models for Fishbone Well

The robust data-driven models are used to predict the flow rate based on the numerical simulation results and the inputs include anisotropy (Iani), the number of the branches (n), the distance between adjacent branches (ybi), the length of each branch (Li), and the BHP pressure divided by the reservoir pressure.
The dataset is obtained from the same numerical simulation used in this study; two powerful algorithms were developed for the productivity prediction, the Support Vector Regression optimized by the Genetic Algorithm (SVR-GA) and the Artificial Neuron Network (ANN).

4.3.1. Artificial Neural Network (ANN)

ANN modeling can mimic human brain behavior and predict the output of a complex function from the inputs through learning [45,46]. Ref. [47] introduced the composition of the ANNs as a learning algorithm presented as an architecture of layers composed of neurons that have transfer functions embedded in them and connected by weights until the signal arrives at the predicted output [48].
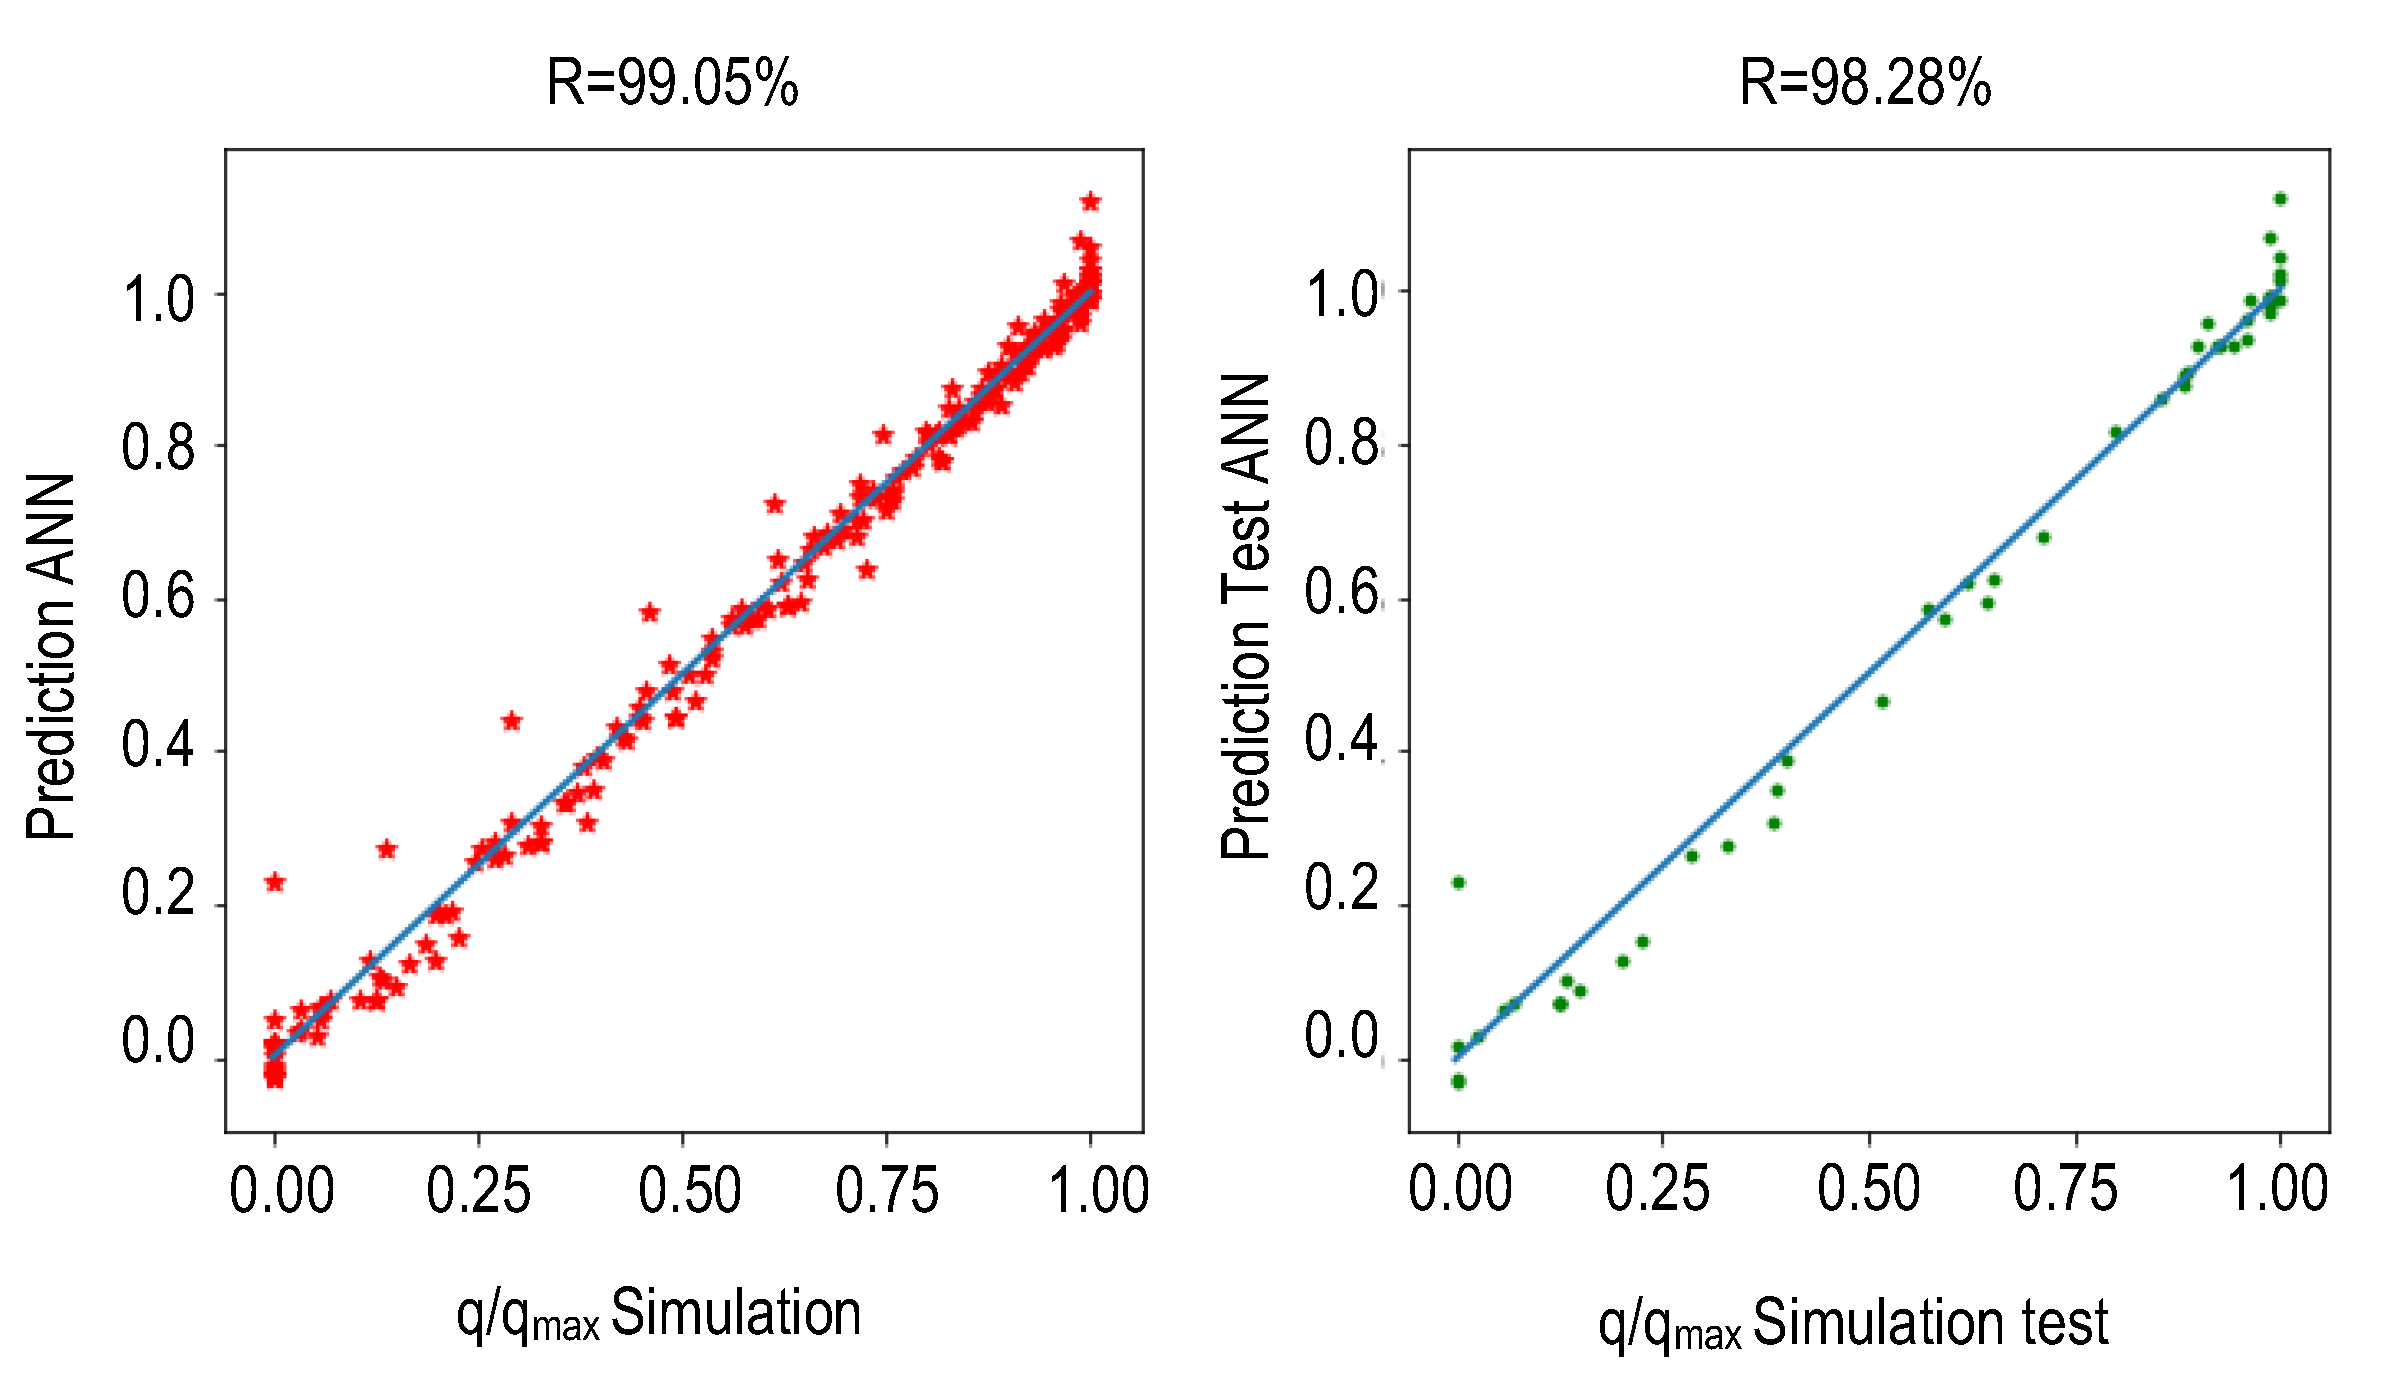
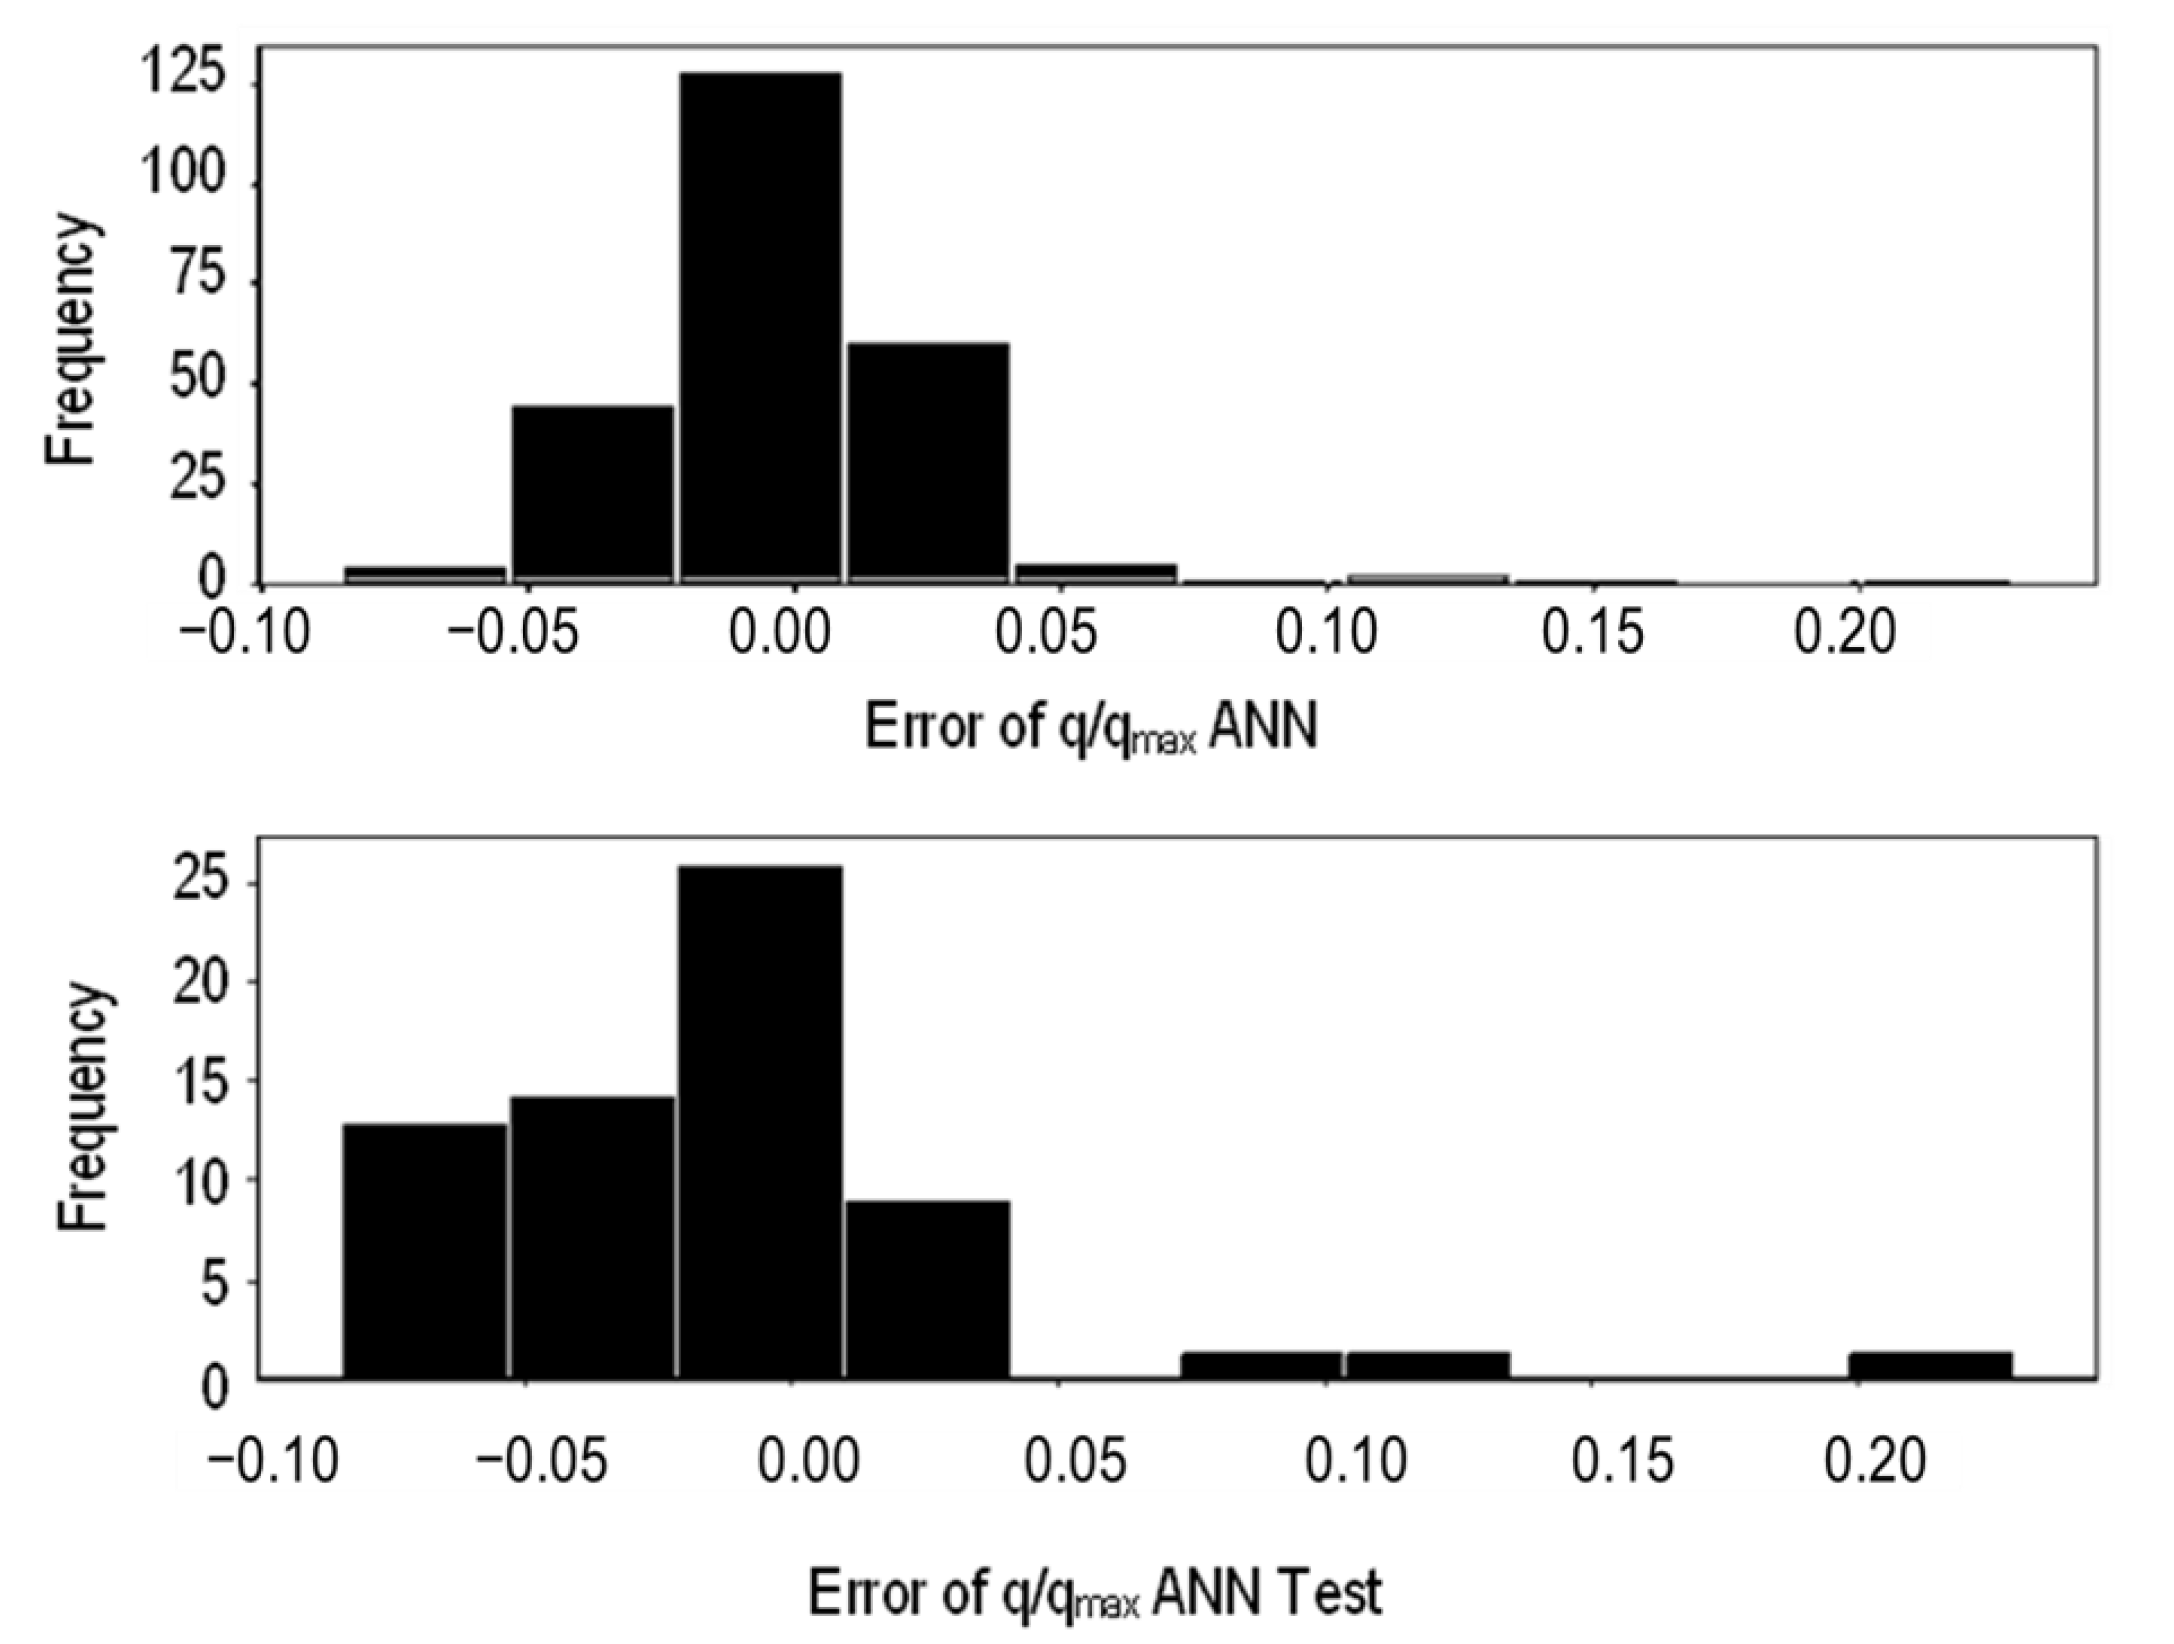
The resulting regression for the ANN showed a high accuracy of 99.05% as shown in Figure 8, with a root mean square error of 0.0205, and the mean absolute error of 0.033 (see Figure 9).

4.3.2. SVR Optimized by the Genetic Algorithm (SVR-GA)

Ref. [49] stated that Support Vector Regression (SVR) is a subset of the Support Vector Machine, which is a machine learning algorithm that performs regression with high efficiency. It was developed by [50]. SVR is different from ordinary regression, where it minimizes the generalized error bound that gathers the training error and a regularization term instead of minimizing the error between the output and the original values [51].
Since the first introduction of Genetic Algorithms (GA) in the sixties to solve both linear and convex optimization along with non-linear simultaneous equations by [52], Evolutionary Algorithms (EA) have played an essential role in advancing numerical solutions and computations. The most famous and widely used algorithm among EA is the Genetic Algorithm which was first introduced by [53]. The main mechanism behind GA is the ability to mimic biological evolution. GA is a population-based algorithm, meaning that it creates an initial set of random solutions called “Chromosomes” composed of genes as the elements of the solution; then, these solutions are subject to a “Fitness Function” defined by the user and, in our case is the performance of the SVR. To obtain the best solution for the optimization, GA used what are called genetic operators [54], that keep interacting with the solution until it converges toward the global optimum.
The SVR-GR model exhibits superior accuracy compared to the ANN model due to the utilization of a robust Genetic Algorithm, effectively reducing the error between the actual and predicted outputs. The optimized values of the SVR hyperparameters, obtained through the GR process, are shown in Table 3.
Additionally, the parameters used in the optimization of the flow rate prediction through the use of SVR are outlined in Table 4 for further clarity.
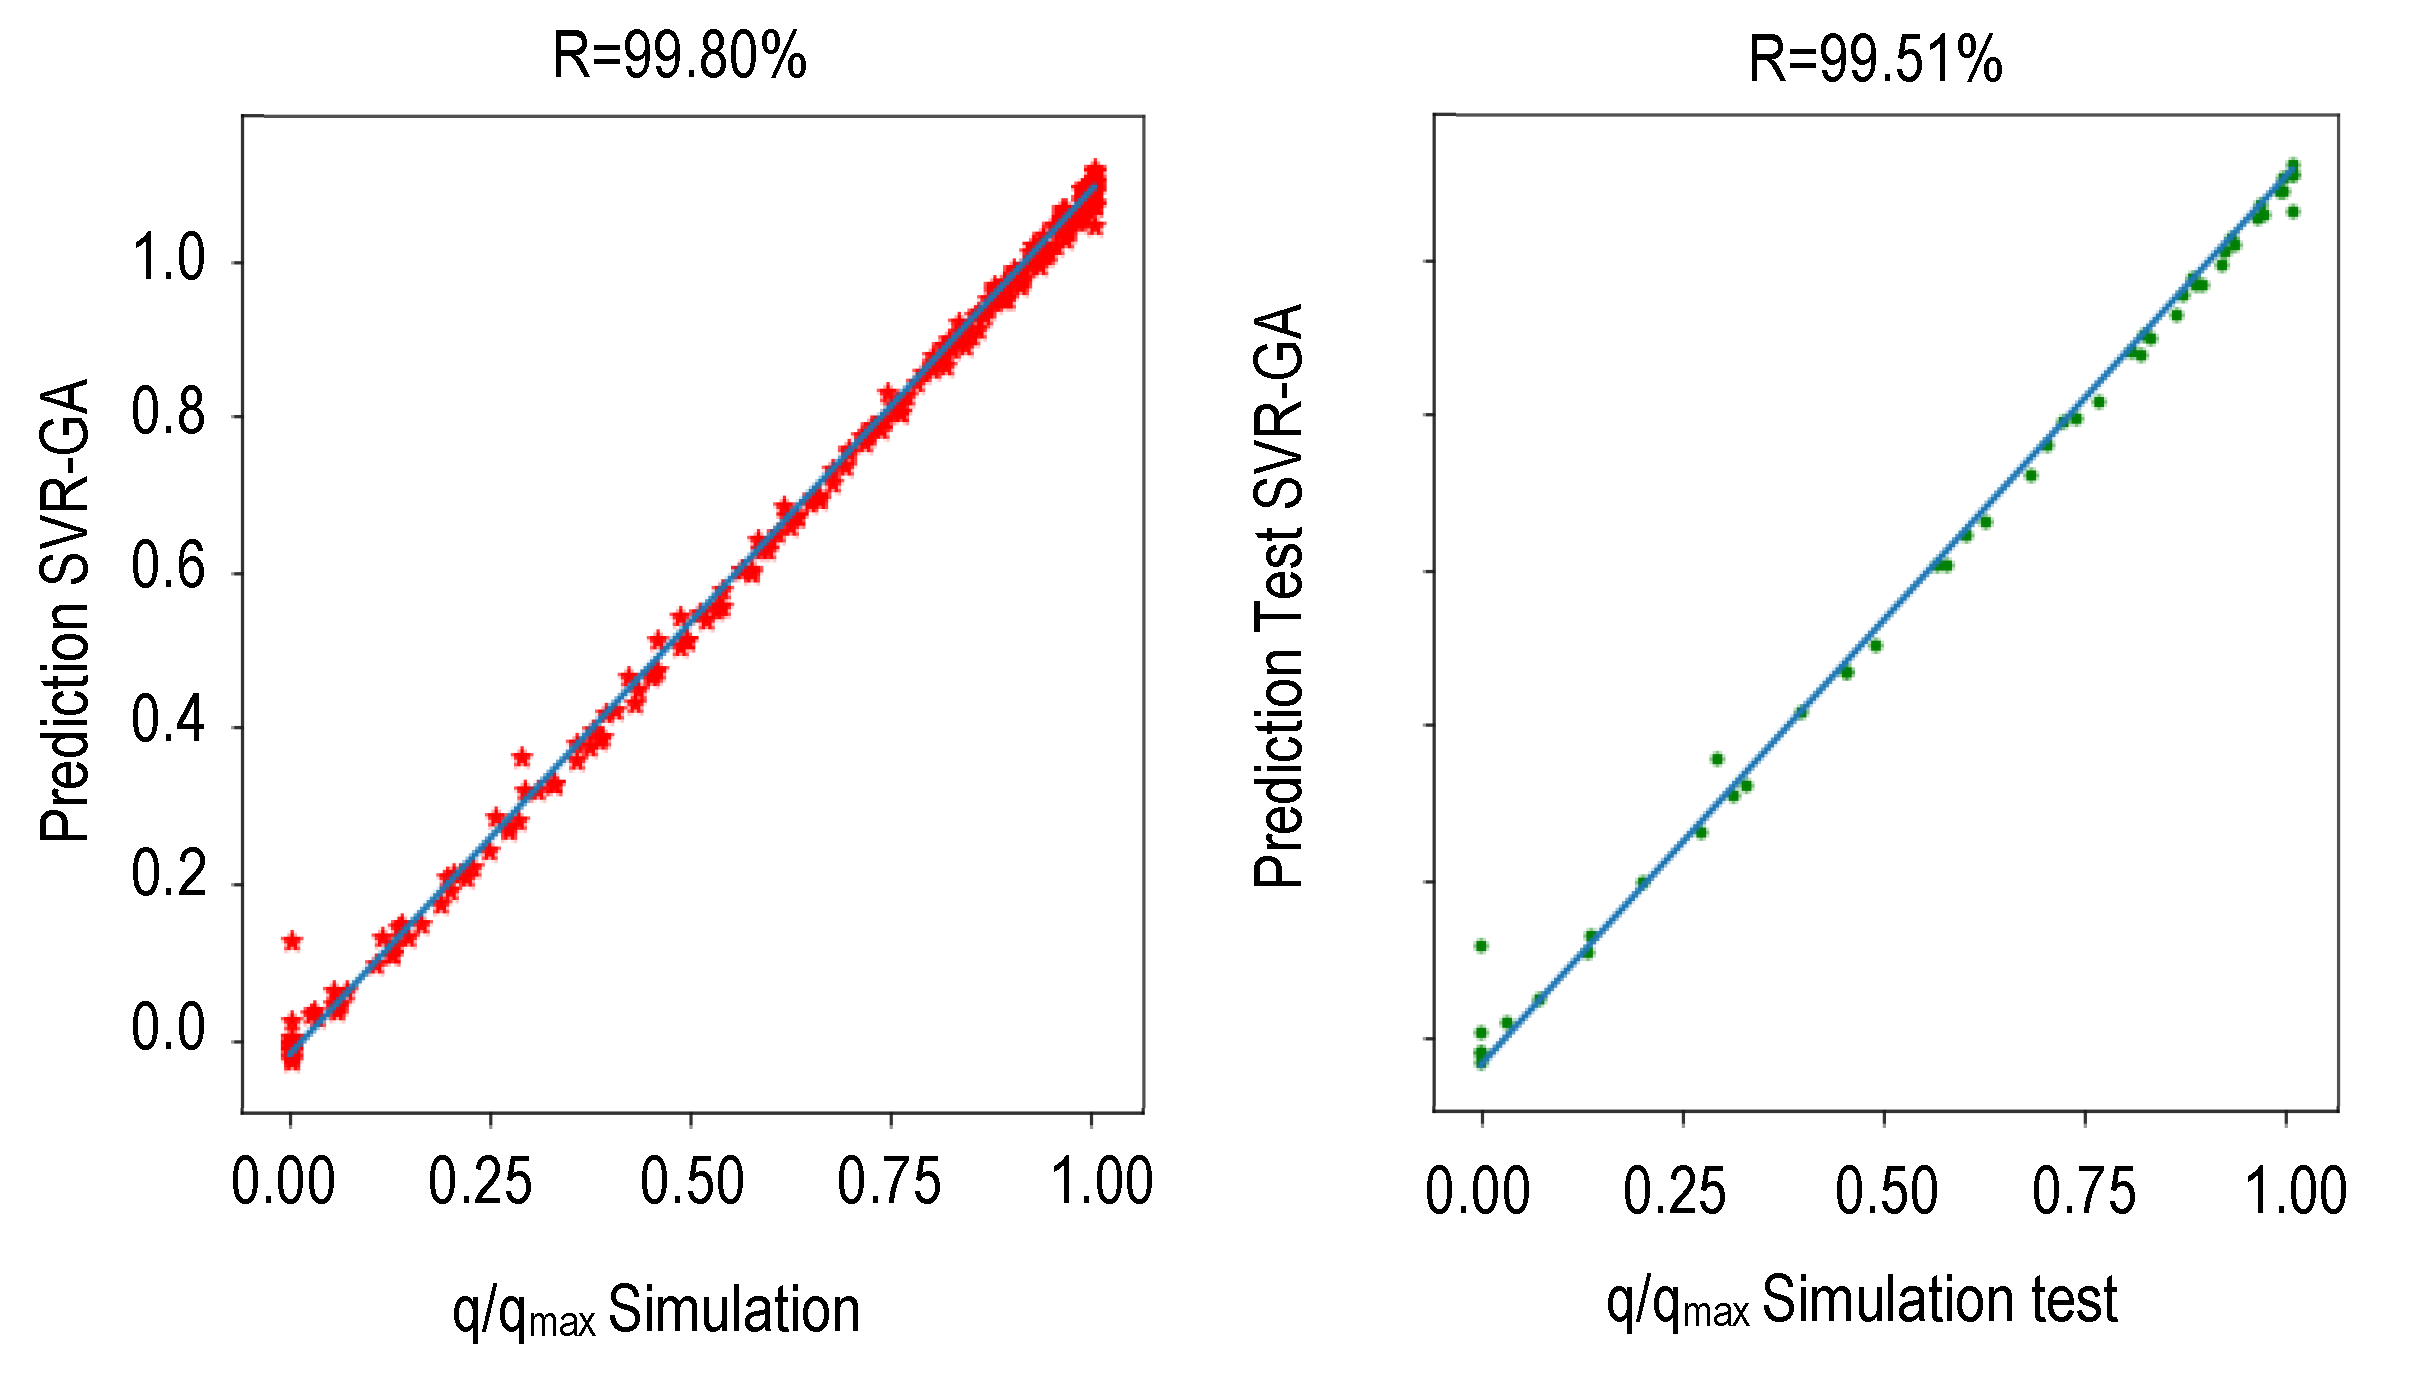
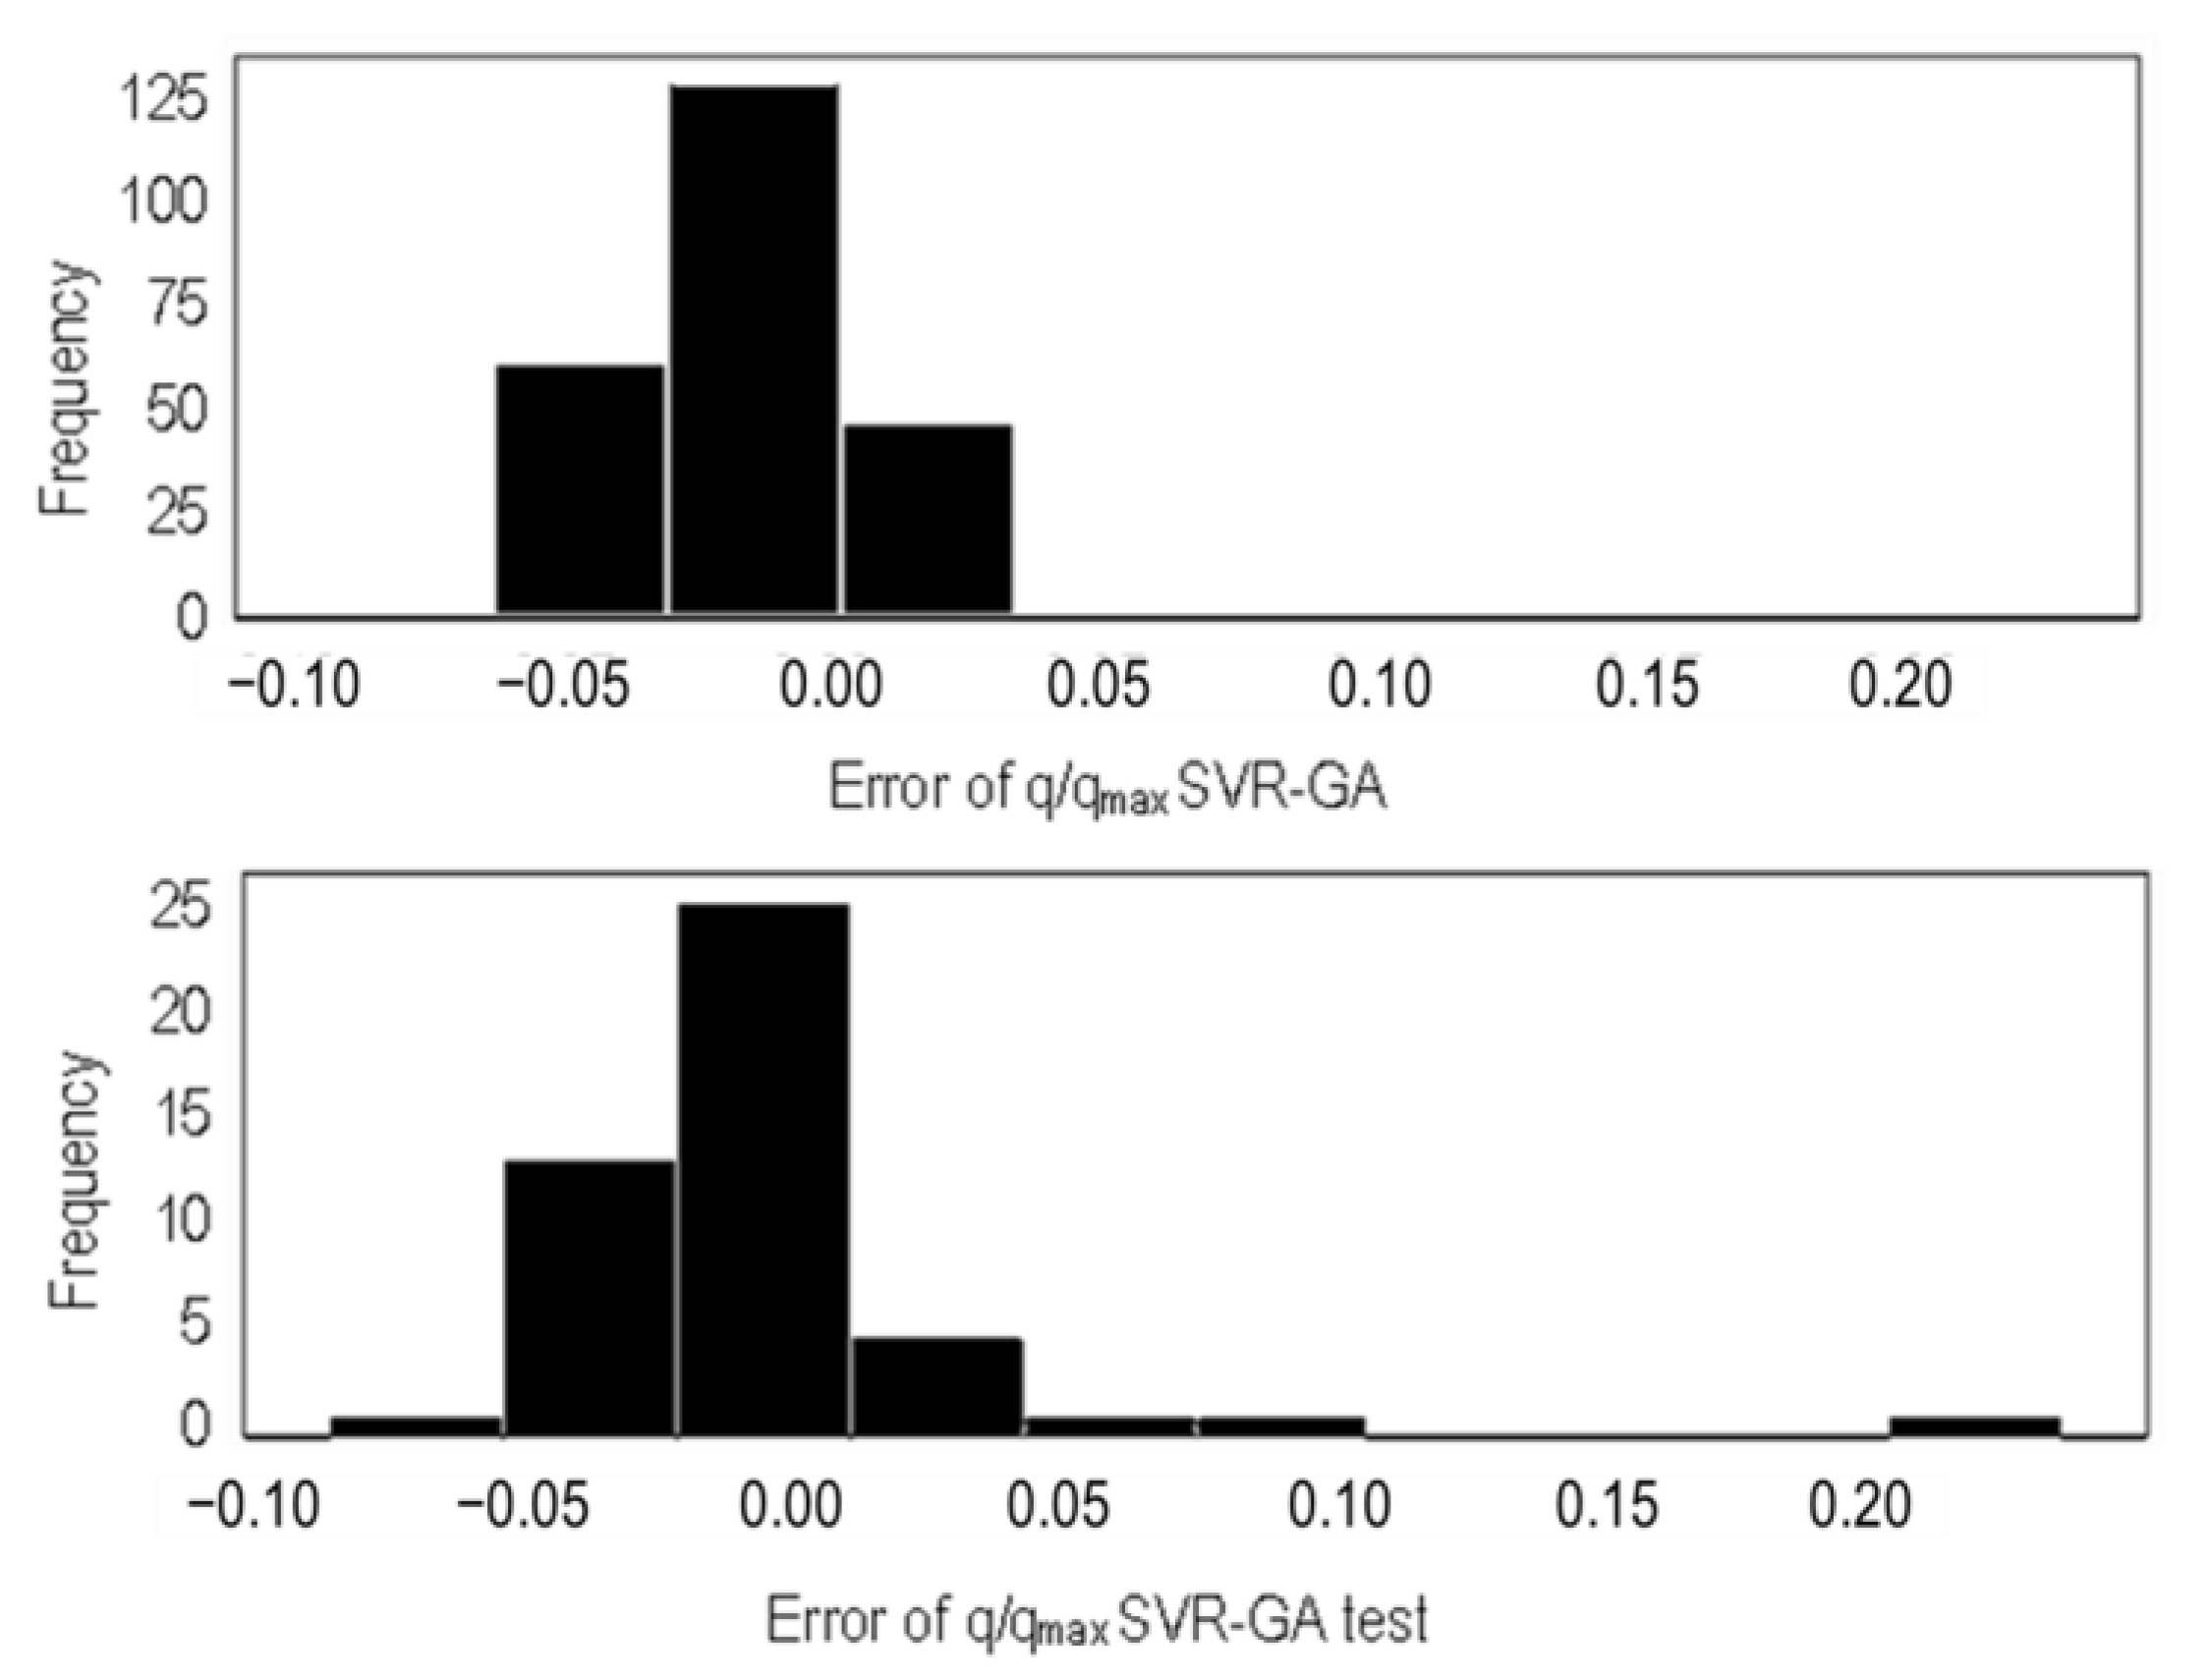
The R-score of the SVR-GA was 99.80%, as shown in Figure 10, with the root mean square error of 0.0149, and the mean absolute error of 0.0104 (see Figure 11).
Both developed data-driven models give powerful results with R scores higher than 98%. These models can be used to predict the flow rate for any new inputs with changes in the Fishbone well design parameters.

5. Models Comparison and Validation

In this section, we aim to perform a comprehensive comparison between the models discussed in Section 5. Our objective is to evaluate the performance and accuracy of each model, and to determine the most suitable model for our particular application.

5.1. Number of Branches

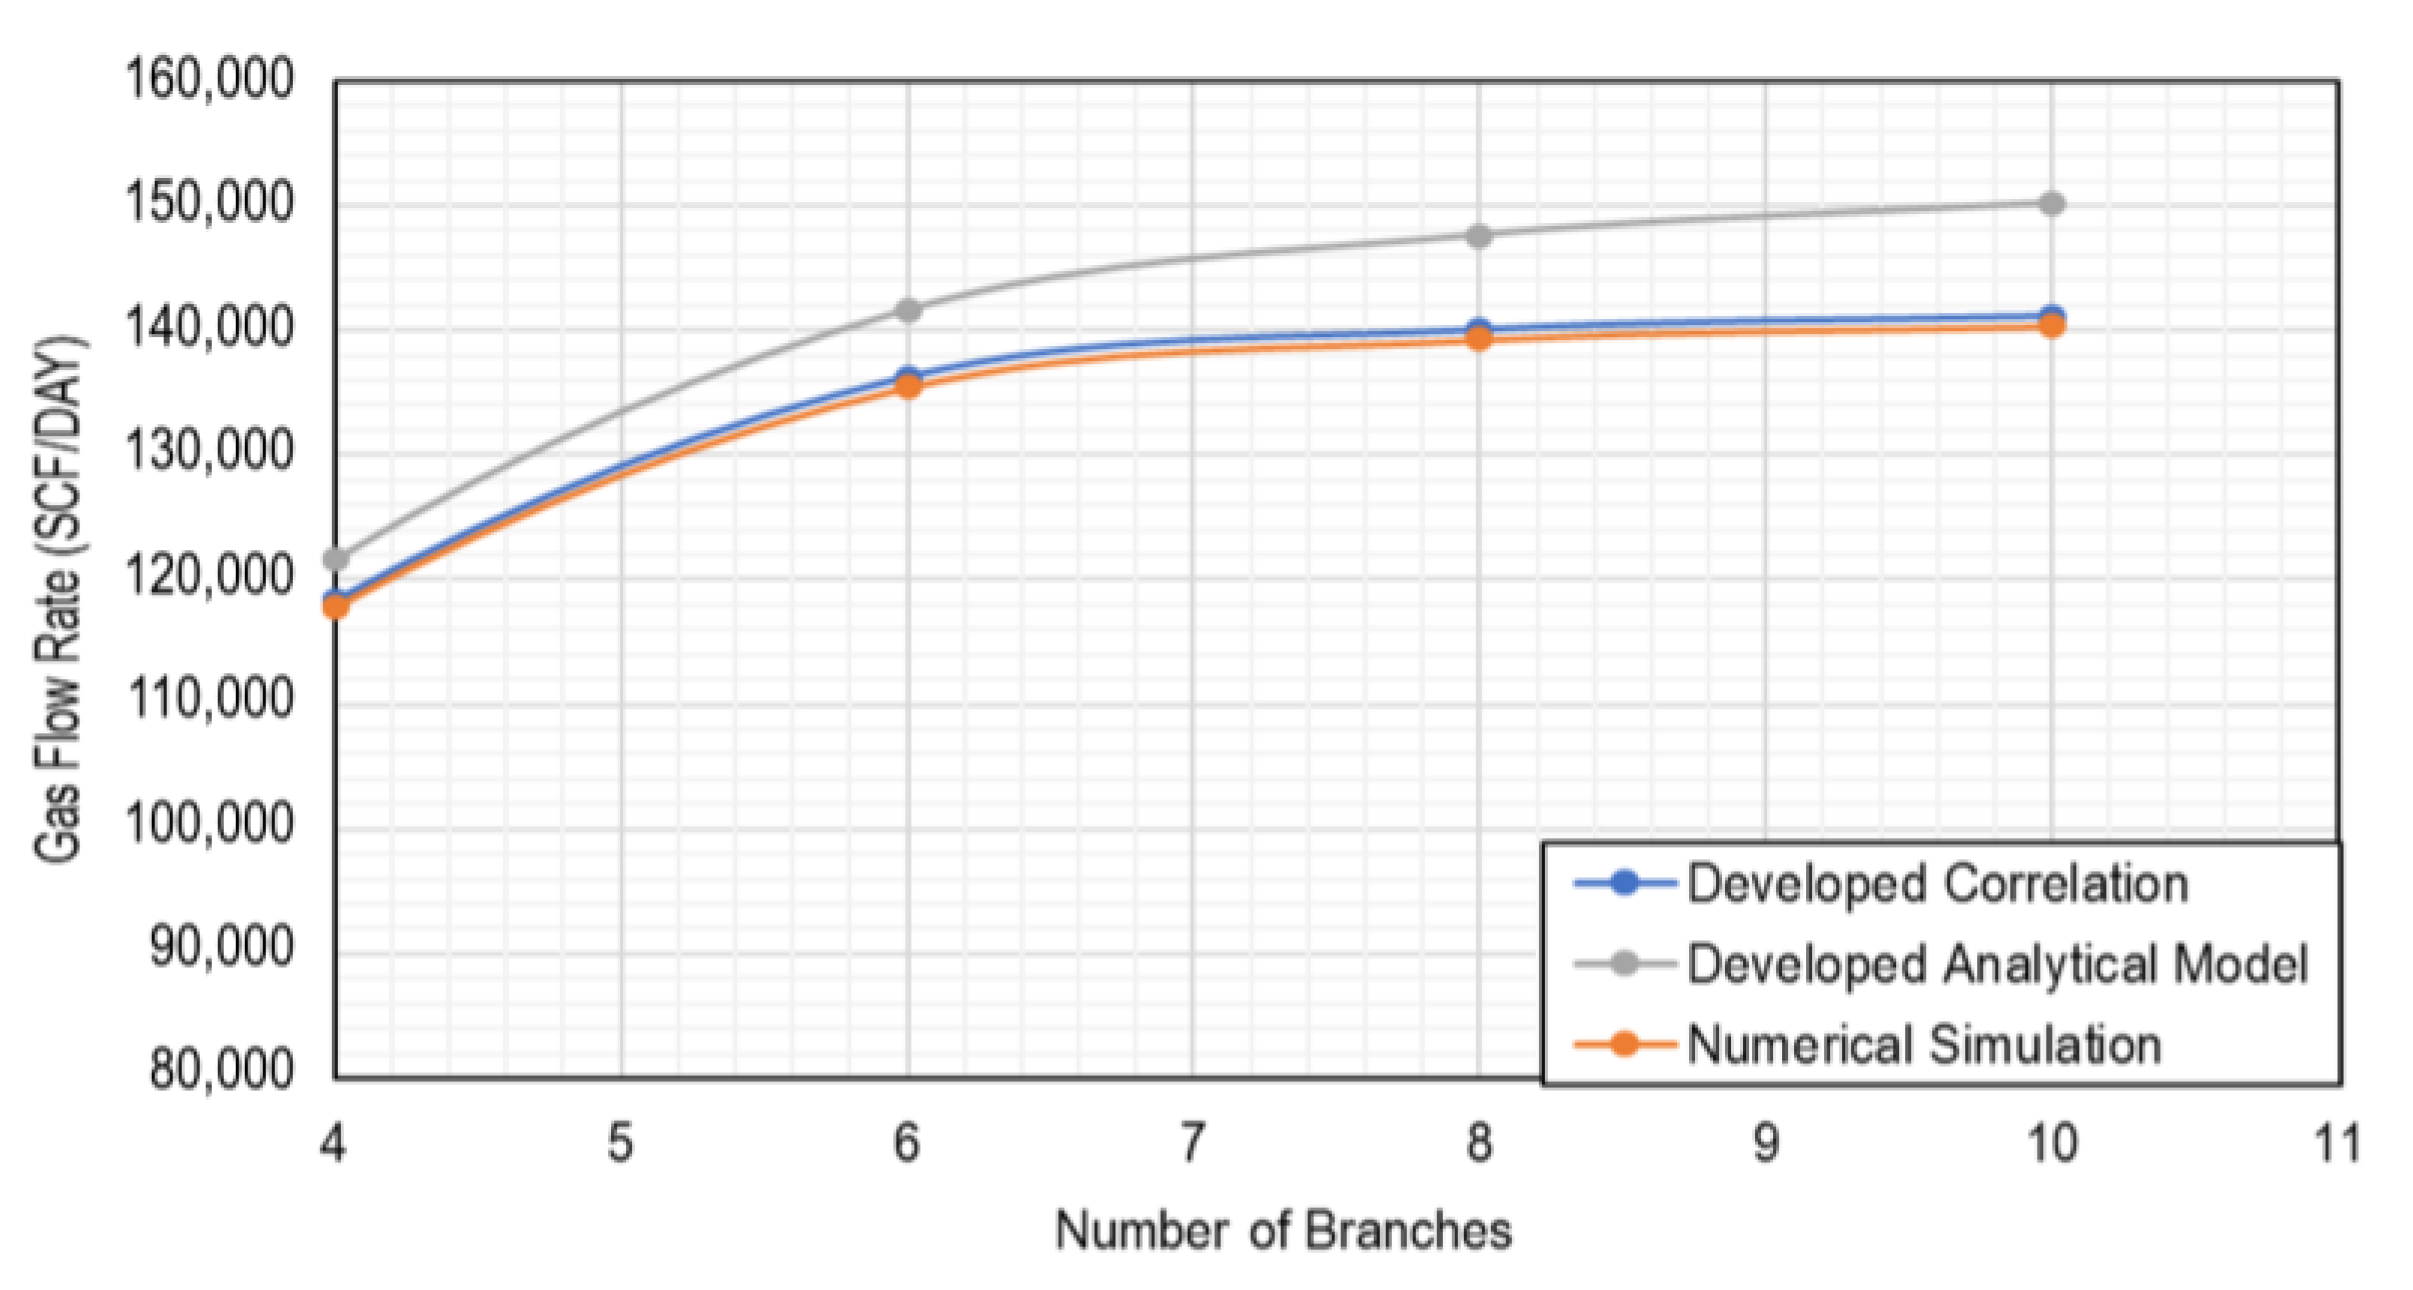
The results show that the flow rate increases with the increase in the number of branches. The trend and the results between the numerical simulation and the modified correlation are similar, with a relatively small difference compared to the modified analytical model (see Figure 12). The augmentation of the number of branches increases the exposed area of the reservoir to enhance production.

5.2. Length of Branches

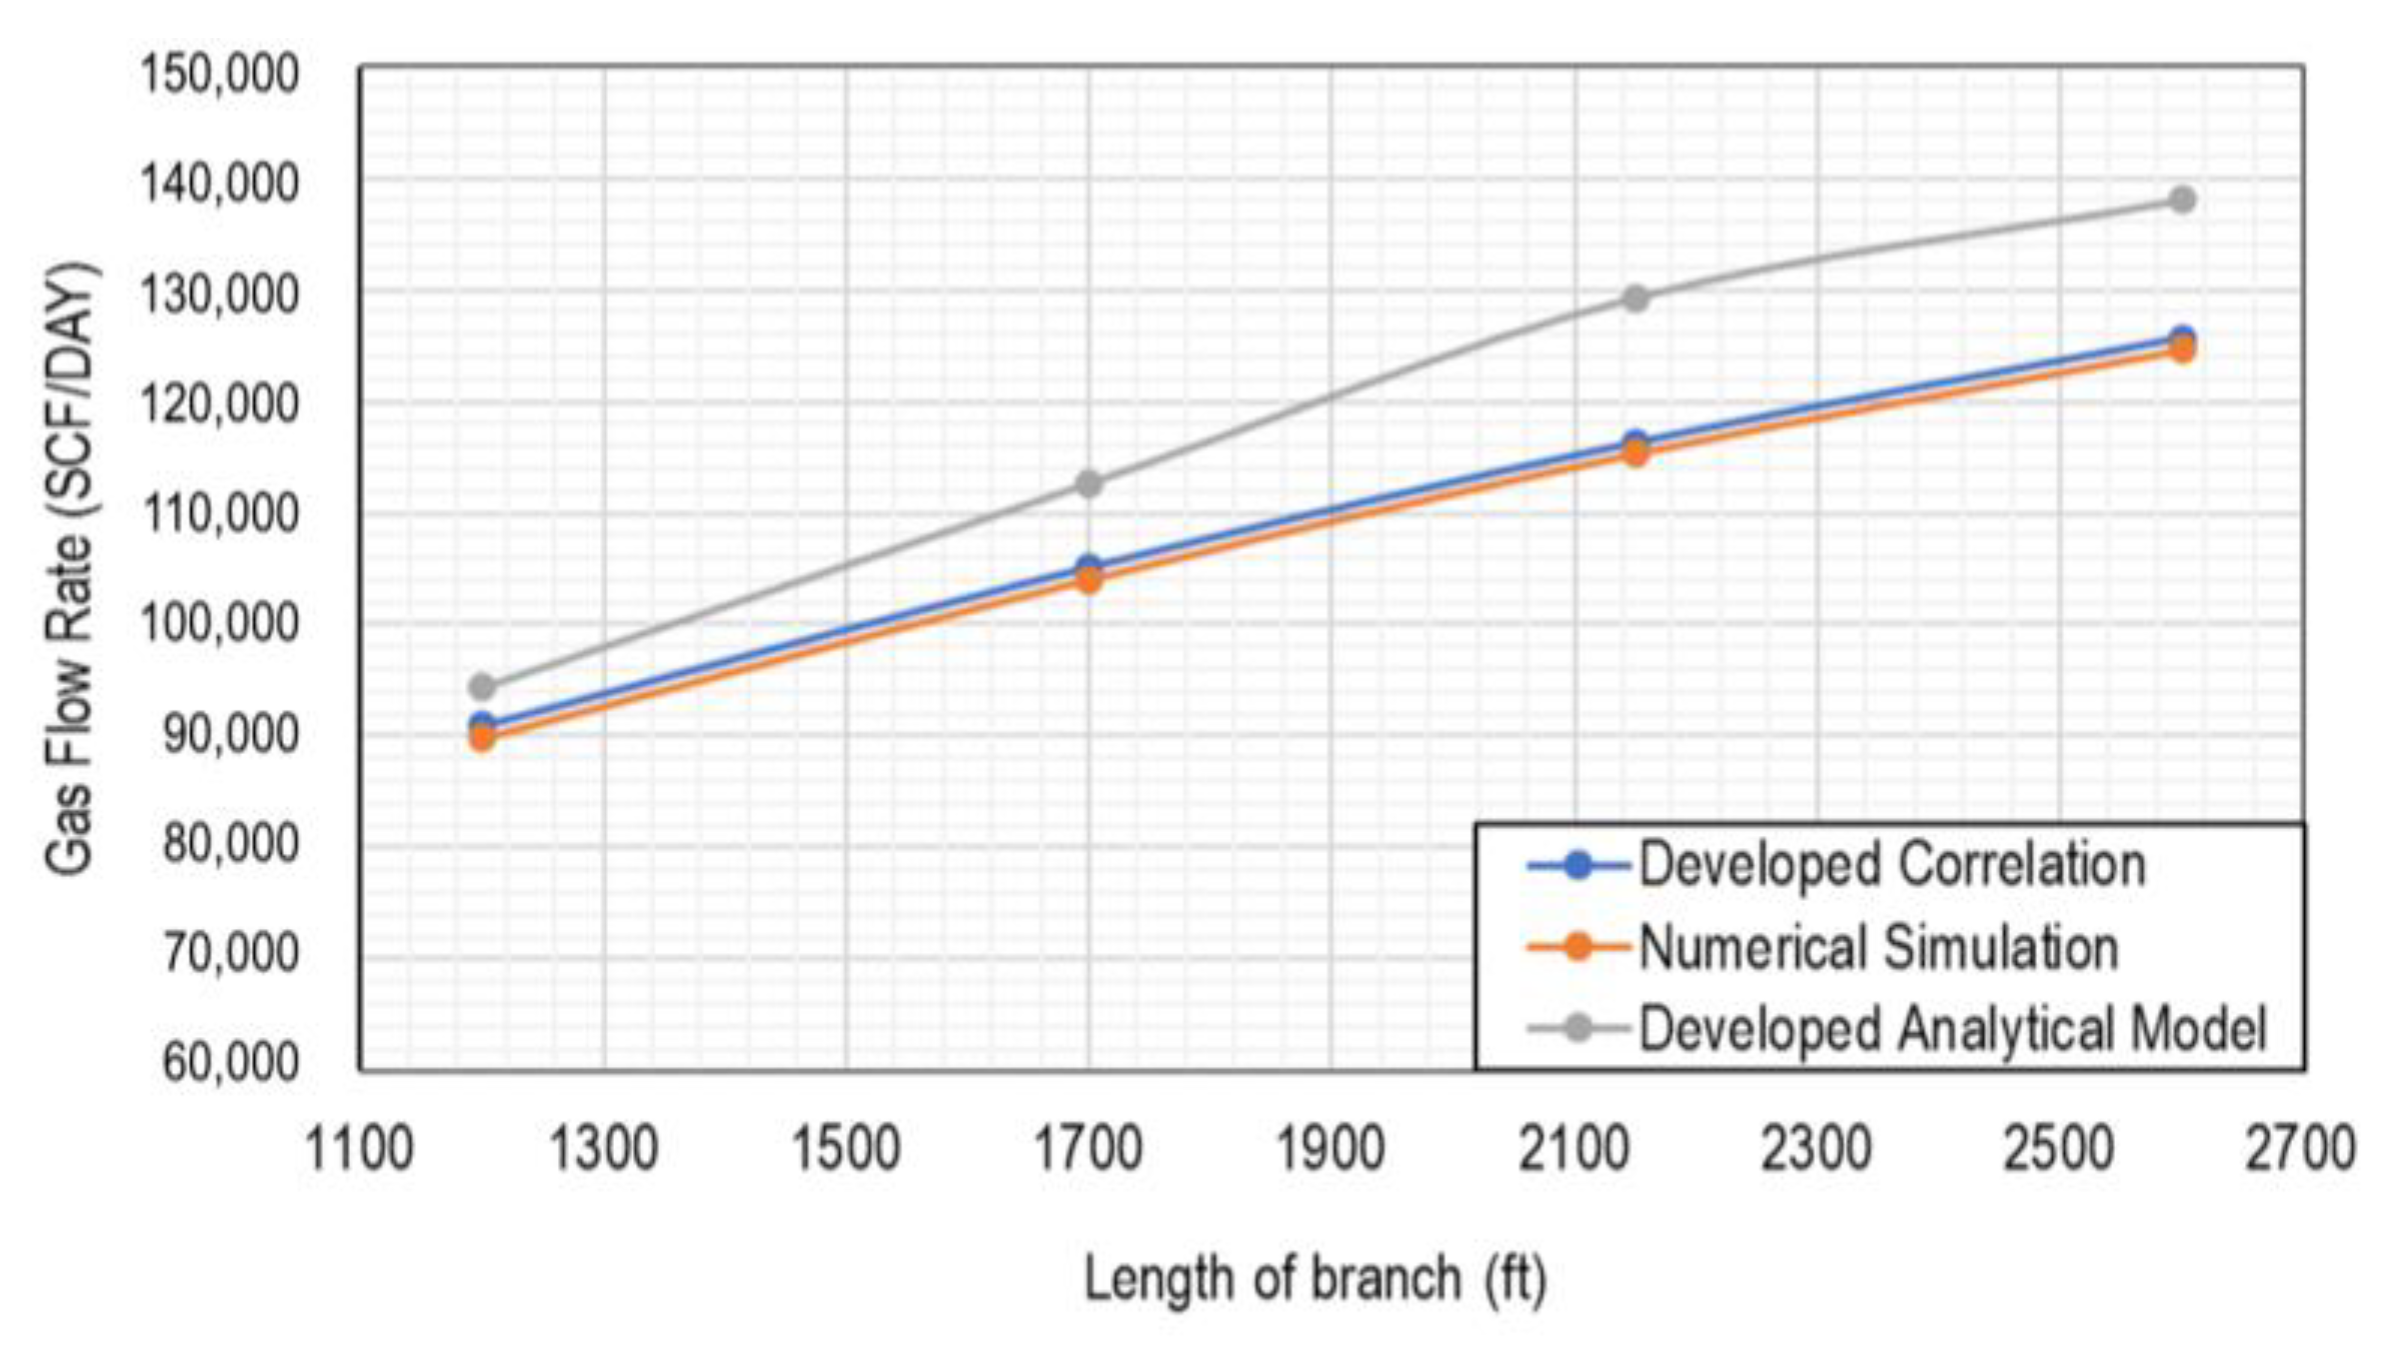
The results show that with the length of branches increasing, the flow rate increases in the numerical simulation, the modified correlation, and the analytical model, with a slight difference between them but nearly the same slope as shown in Figure 13. The reason for the production increase is the fact that a large portion of the reservoir has been exposed to the wellbores due to the length increase of the open hole branches, which aligns with the extended-reach drilling technology, with the idea to push the horizontal length to maximize reservoir drainage and minimize water production [55].

5.3. Permeability Anisotropy

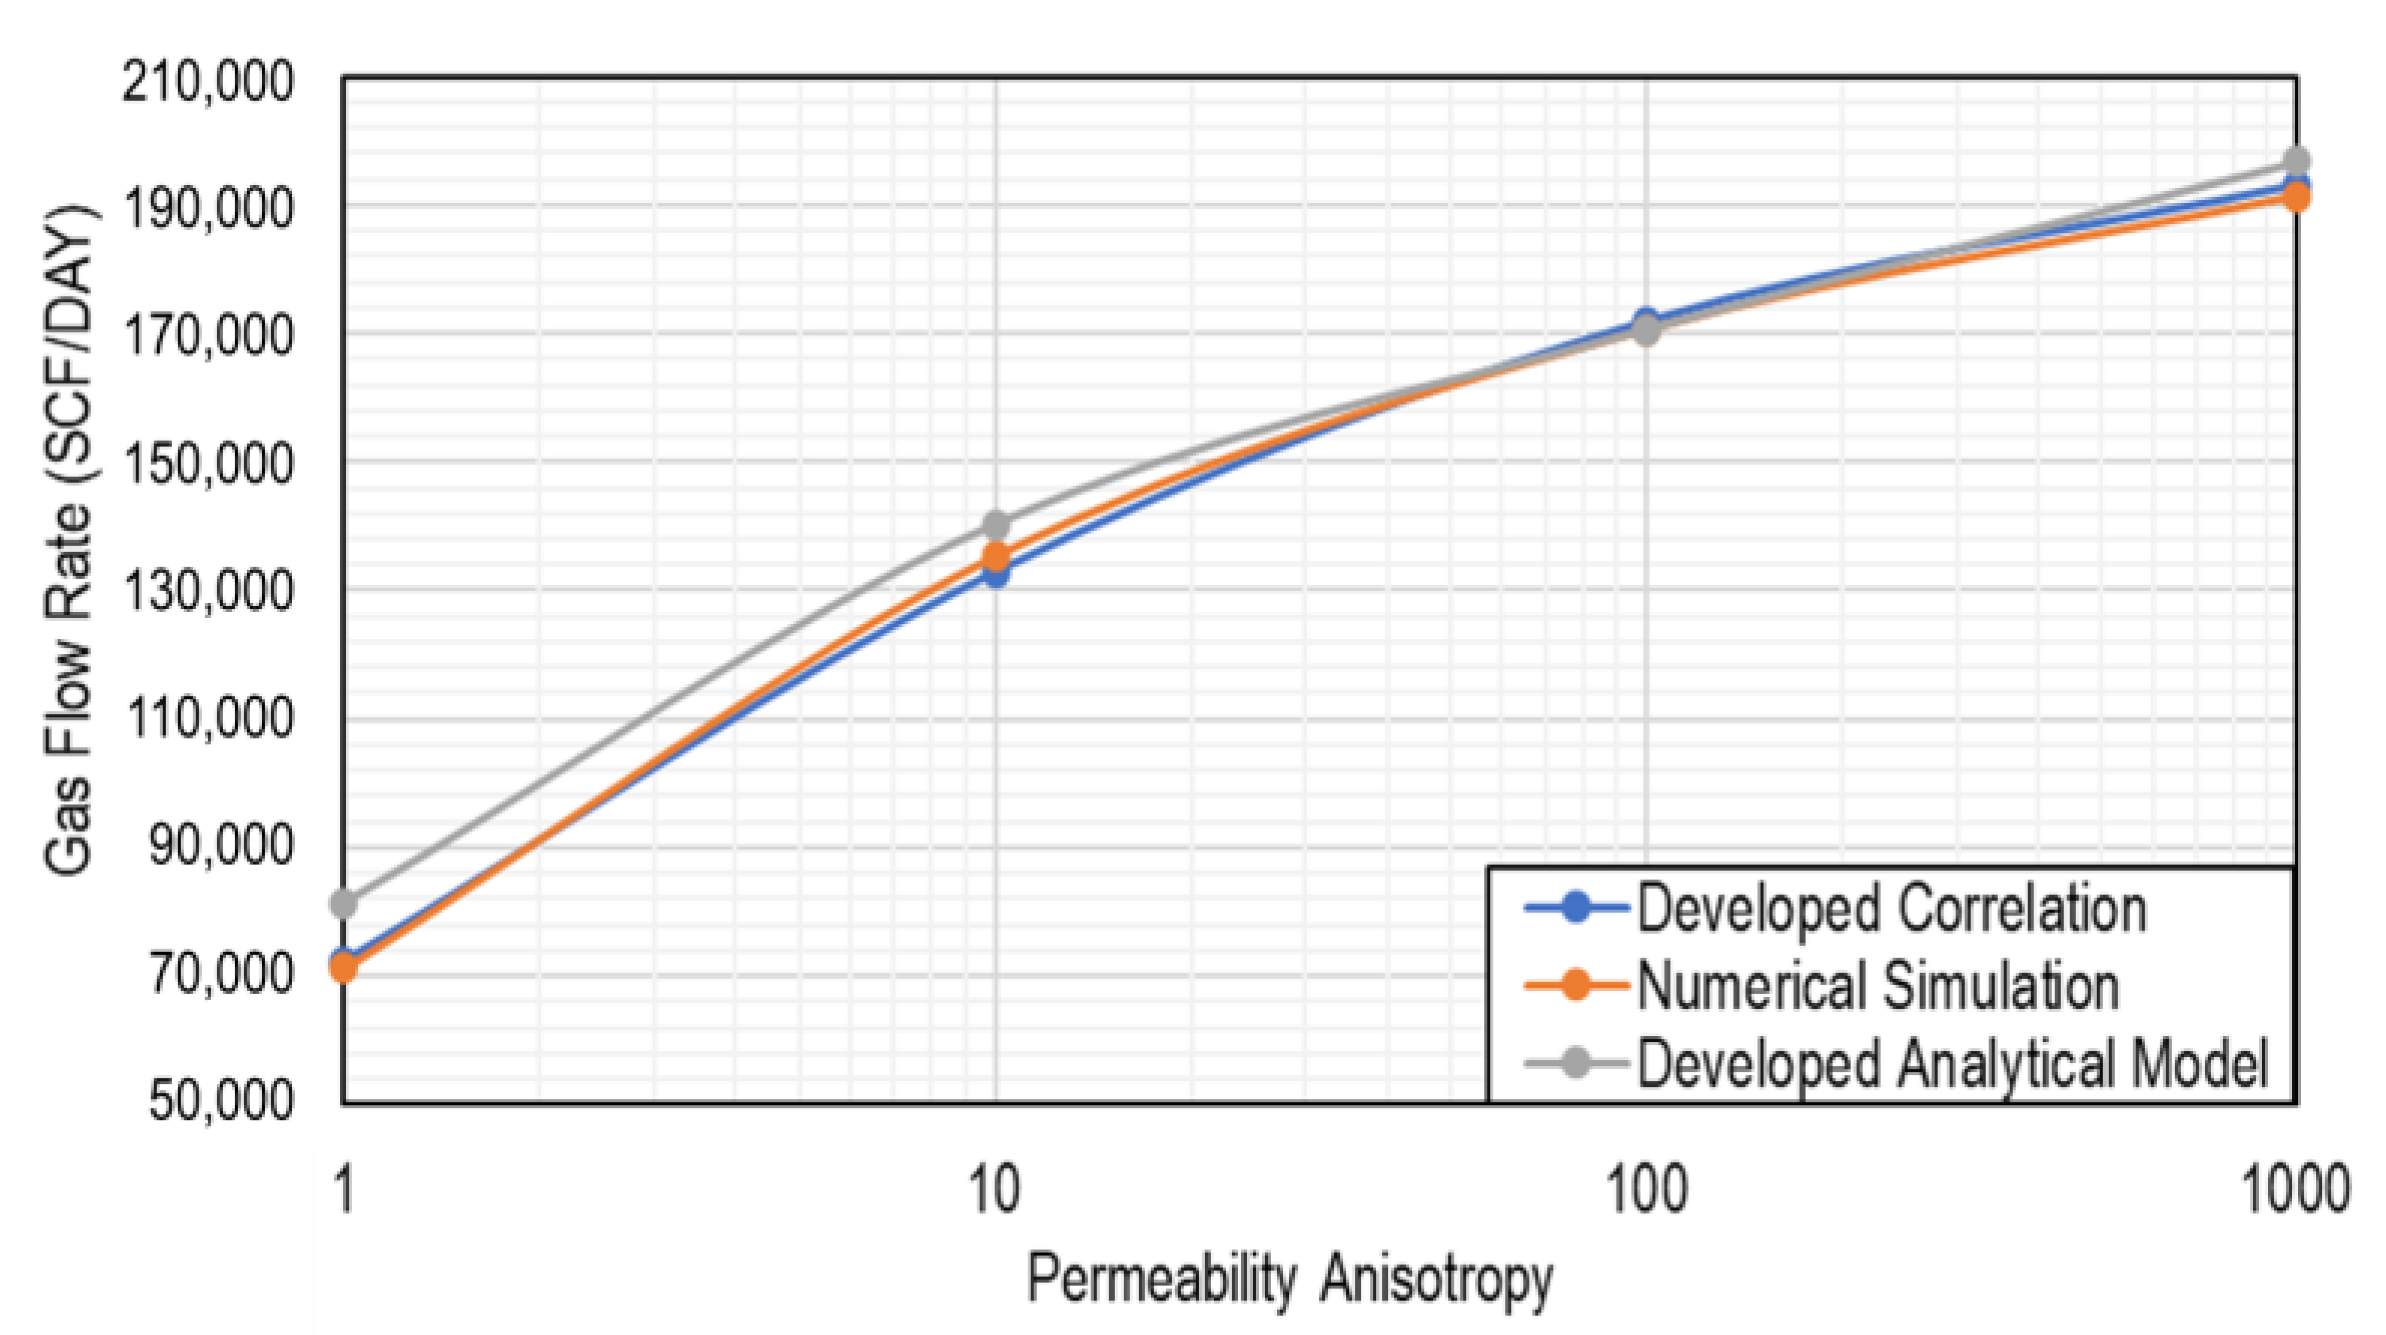
The results found that permeability anisotropy affects productivity, as shown in Figure 14. When the anisotropy increases, the productivity increases. The numerical simulation and both developed analytical and empirical simulation showed a similar amount of production with the anisotropy variation. This means that intersecting the regions of higher permeability anisotropy will increase productivity. This finding supports the findings of [56], which studied the effect of permeability anisotropy on gas production, and as a result, reported that the higher horizontal permeability is more favorable for gas production.

5.4. Distance between Adjacent Branches

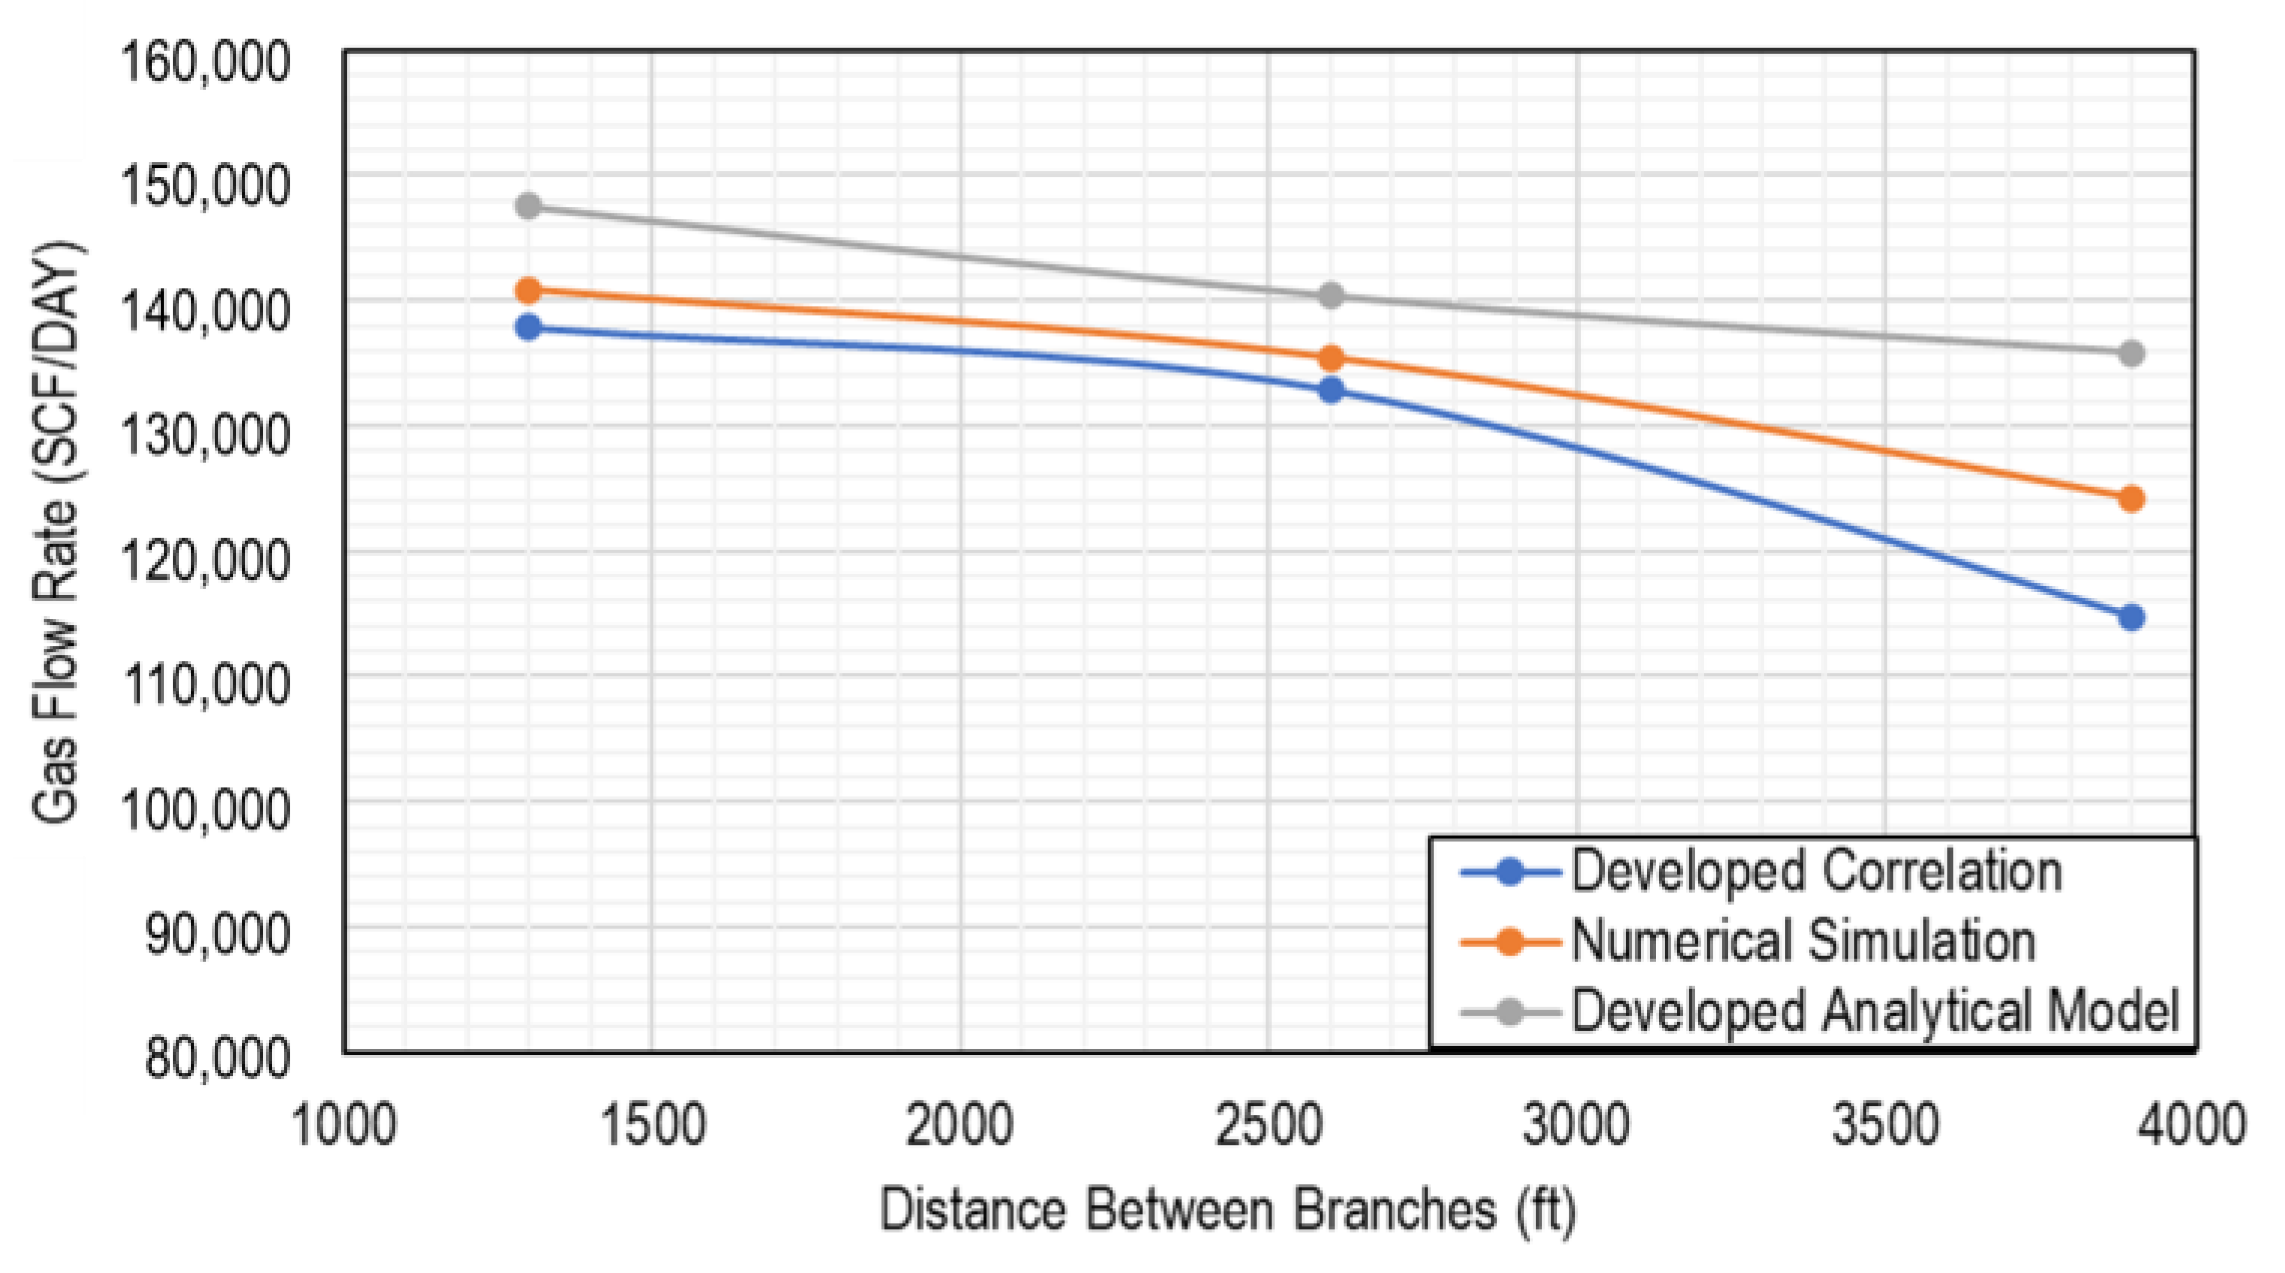
When the distance increases between the branches, the stimulated reservoir decreases, and the flow rate decreases slightly (see Figure 15). The numerical outputs show the same results as the developed correlation, with a constant difference compared to the developed analytical model. The three models confirm a similar trend of productivity decrease as a function of the distance. This validates the effect of the neighboring branches on each other based on the spacing between them, in the case where the distance is above the drainage radius. The results also demonstrate that the severity of the interference between the branches is very low with a very slight communication effect between them.
The statistical comparison between the models as shown in Table 5 demonstrates their potential capabilities for productivity prediction of fishbone well design with some differences among them in terms of the coefficient of correlation and the average error. The developed analytical model presented low accuracy compared to the other models as it is based on mathematical equations derived from Darcy’s equation with many assumptions on the flow regime [57], compared to very sophisticated numerical methods to solve the complicated fundamental differential equation. The data-driven models had the advantages in terms of their high accuracy and low error because there were built in error terms, limited to the extent of the data collected; the same applied for the empirical model, which depends on the studied case and does not elucidate any underlying physics.

6. Conclusions

In this study, the authors developed three models (physical-based, empirical, and data-driven) to evaluate the gas well deliverability using Fishbone well drilling technology. The developed analytical model takes into consideration all Fishbone well design parameters, including the number, length of branches, distance between branches, and permeability anisotropy of the reservoir, offering superior features compared to existing models. It also has potential applications in unconventional reservoirs.
The comparison between the analytical and empirical models demonstrates their ability to accurately predict the gas flow rate well productivity by utilizing various parameters including the Fishbone well parameters, bottom hole pressures, and reservoir pressures. The results obtained from both models are consistent, indicating their effectiveness in this regard.
To improve the accuracy of analytical and empirical models, data-driven models were derived to help in effectively generating results with higher computational speed.
The three models can independently evaluate the well productivity and are useful for comparing results. Optimized with a Genetic Algorithm, the Support Vector Regression model showed the highest accuracy among the developed models. The applicability of these models depends on data availability, reservoir properties, and computational requirements.
Overall, the new analytical, empirical, and data-driven models for estimating the Fishbone well productivity are feasible and practical. The development and implementation of new productivity models for Fishbone well technology is imperative to advance the understanding of this cutting-edge drilling approach and its wide-ranging applications. This novel technology promises to revolutionize the way we recover hydrocarbons, elevating the level of precision and control in stimulation, while minimizing the associated hazards and costs. Furthermore, this innovative approach promotes a more sustainable and environmentally conscious method for enhanced recovery, making it an essential part of the industry’s future.

Author Contributions

Each author contributed to the present paper. H.O. was responsible for preparing the methodology, analyzing the data, validating, drafting the paper, and drawing the conclusion. A.H. was responsible for the numerical simulation and data analyzation and validation. A.L. was responsible for reporting from the literature, analyzing the results and modifying the analytical model. A.C. was responsible for developing the data-driven models and reporting the results. V.R. reviewed the paper and discussed the results and methodology. M.M. provided the data and discussed the results. All authors have read and agreed to the published version of the manuscript.

Funding

This research was possible through North Dakota Industrial Commission (NDIC).

Data Availability Statement

The data presented in this study are available on request from the corresponding author. The data are not publicly available due to confidentiality by the operator.

Acknowledgments

The authors would like to acknowledge the North Dakota Industrial Commission (NDIC) and Petroleum Research Fund, for their financial support of this work. We would like to acknowledge Ahmed Merzoug for his help in reviewing the algorithms developed. We acknowledge the College of Petroleum and Geoscience at King Fahd University of Petroleum & Minerals for the support and permission to publish this work.

Conflicts of Interest

The authors declare no conflict of interest.

Appendix A

Analytical models resulted from Darcy’s equation for IPR (bottom hole pressure and production rate), considering the flow regime (transient, permanent, pseudo-permanent) and the reservoir type.
  • Steady-state flow model for vertical well
The condition to consider this flow regime is when the pressure is constant at any location in the reservoir over time. The solution for Darcy’s equation for gas production is given by [30]:
q g =   7.08 × 10 6   k h   P ¯ R P w f μ g B g a v g l n r e r w 0.5
  • Transient flow model for horizontal well
Ref. [58] presented the Darcy equation solution for constant bottom hole pressure. The transient regime means that the pressure perturbance had not yet reached the reservoir boundaries, and therefore, is a function of time and location. The gas flow rate is as follows:
q g = k h m p i m p w f 1.638 T log t + log k φ μ o c t r w 2 3.23 + 0.87 S
  • Steady-state flow model for horizontal well
Ref. [59] proposed a steady-state analytical equation that considered the horizontal well located between the upper and lower boundaries. Ref. [60] derived a steady-state analytical equation that considers the well completion effects and incorporated a rectangular reservoir with no-flow boundaries. By considering the effect of permeability anisotropy and skin factor and after simplifications, the IPR equation for a horizontal steady-state gas well is as follows:
q g = k h m p i m p w f 1.638 T log t + log k φ μ o c t r w 2 3.23 + 0.87 S

Appendix B

The development of the Equations (15) and (16) where the compressibility factor z needs to be replaced by the gas formation volume factor Bg is demonstrated as follows.
First, the pseudo-critical pressure and pseudo-critical temperature should be calculated using the two correlations for a natural gas system (γg < 0.7)
T p c = 168 + 325 γ g 12.5 γ g 2
p p c = 667 + 15.0 γ g 37.5 γ g 2
Next, the pseudo-reduced pressure and pseudo-reduced temperature are calculated.
p a v g = p + p r e s 2
p p r = p a v g p p c
T p r = T T p c
z = 1.008505 + 0.04623 p p r T p r + 0.862707 p p r 1.368627 10 0.649787 T p r
B g = 0.005035 z T p
The gas viscosity is calculated using Standing (1977) correlation:
( μ 1 ) = ( μ 1 ) u n c o r r e c t e d + Δ μ C O 2 + Δ μ H 2 S + Δ μ N 2
Since we do not have the effect of non-hydrocarbon components (i.e., our gas is considered pure gas to a certain extent), then,
( μ 1 ) = ( μ 1 ) u n c o r r e c t e d
( μ 1 ) u n c o r r e c t e d = 1.709 10 5 2.062   10 6 γ g T 460 + 8.118 10 3 6.15 10 3 log γ g

References

  1. Lyu, Z.; Song, X.; Geng, L.; Li, G. Optimization of multilateral well configuration in fractured reservoirs. J. Pet. Sci. Eng. 2019, 172, 1153–1164. [Google Scholar] [CrossRef]
  2. Elyasi, S. Assessment and evaluation of degree of multilateral well’ s performance for determination of their role in oil recovery at a fractured reservoir in Iran. Egypt. J. Pet. 2016, 25, 1–14. [Google Scholar] [CrossRef] [Green Version]
  3. Chen, D.; Pan, Z.; Liu, J.; Connell, L.D. Characteristic of anisotropic coal permeability and its impact on optimal design of multilateral well for coalbed methane production. J. Pet. Sci. Eng. 2012, 88–89, 13–28. [Google Scholar] [CrossRef]
  4. Sobhaniaragh, B.; Trevelyan, J.; Mansur, W.J.; Peters, F.C. Numerical simulation of MZF design with non-planar hydraulic fracturing from multilateral horizontal wells. J. Nat. Gas Sci. Eng. 2017, 46, 93–107. [Google Scholar] [CrossRef] [Green Version]
  5. Yu, F.; Huang, G.; Ni, H.; Zhen Nie Li, W.; Li, J.; Jiang, W. Analysis of the main factors affecting bottom hole assembly Re-entry into main hole in forward drilling of Fishbone wells. J. Pet. Sci. Eng. 2020, 189, 107018. [Google Scholar] [CrossRef]
  6. Busahmin, B.; Saeid, N.H.; Alusta, G.; Zahran, E.-S.M.M. Review on hole cleaning for horizontal wells. ARPN J. Eng. Appl. Sci. 2017, 12, 4697–4708. [Google Scholar]
  7. Fan, Y.; Han, G.; Yang, C. Production forecast for herringbone well and optimum configuration of lateral holes. Acta Pet. Sin. 2006, 27, 101–104. [Google Scholar]
  8. Xing, G.; Guo, F.; Song, C.; Sun, Y.; Yu, J.; Wang, G. Fishbone Well Drilling and Completion Technology in Ultra-Thin Reservoir. In Proceedings of the IADC/SPE Asia Pacific Drilling Technology Conference and Exhibition, Tianjin, China, 9–11 July 2012. Paper IADC/SPE 155958. [Google Scholar] [CrossRef]
  9. El Ghandour, M. The Fishbone Technology: To Use or Not to Use. Egypt Oil & Gas. 2021. Available online: https://egyptoil-gas.com/features/the-fishbone-technology-to-use-or-not-to-use/ (accessed on 20 January 2022).
  10. Sennaoui, B.; Pu, H.; Rylander, E.; Afari, S.; Malki, M.L. An Experimental Study of CO2 Huff-N-Puff Enhanced Oil Recovery in Three Forks Formation, Williston Basin. In Proceedings of the 56th U.S. Rock Mechanics/Geomechanics Symposium, Santa Fe, NM, USA, 26–29 June 2022. [Google Scholar] [CrossRef]
  11. Fishbone AS Company Website. 2022. Available online: https://www.fishbones.as/ (accessed on 2 January 2023).
  12. Alexeyev, A.; Ostadhassan, M.; Bubach, B.; Boualam, A.; Djezzar, S. Integrated reservoir characterization of the Middle Bakken in the Blue Buttes Field, Williston Basin, North Dakota: Society of Petroleum Engineers. In Proceedings of the SPE Western Regional Meeting, Bakersfield, CA, USA, 23–27 April 2017. [Google Scholar] [CrossRef]
  13. Khetib, Y.; Rasouli, V.; Rabiei, M.; Chellal, H.A.K.; Abes, A.; Bakelli, O.; Aoun., A.E. Modelling Slugging Induced Flow Instabilities and its Effect on Hydraulic Fractures Integrity in Long Horizontal Wells. In Proceedings of the 56th U.S. Rock Mechanics/Geomechanics Symposium, Santa Fe, NM, USA, 26–29 June 2022. [Google Scholar] [CrossRef]
  14. Ouadi, H.; Mishani, S.; Rasouli, V. Applications of Underbalanced Fishbone Drilling for Improved Recovery and Reduced Carbon Footprint in Unconventional Plays. Pet. Petrochem. Eng. J. (PPEJ) 2023, 7. [Google Scholar] [CrossRef]
  15. Stalder, J.L.; York, G.D.; Kopper, R.J.; Curtis, C.M.; Cole, T.L.; Copley, J.H. Multilateral-Horizontal Wells Increase Rate and Lower Cost Per Barrel in the Zuata Field, Faja, Venezuela. In Proceedings of the SPE International Thermal Operations and Heavy Oil Symposium, Porlamar, Venezuela, 12–14 March 2001. [Google Scholar] [CrossRef]
  16. Bazitov, M.V.; Golovko, I.S.; Konosov, D.A.; Mingazov, A.N.; Nigmatullin, R.R.; Lokot, A.V.; Malyasov, V.Y. First Fishbone well drilling at Vankorskoe field. In Proceedings of the Society of Petroleum Engineers—SPE Russian Petroleum Technology Conference, Moscow, Russia, 26–28 October 2015. [Google Scholar] [CrossRef]
  17. Voronin, A.; Gilmanov, Y.; Eremeev, D.; Dubrovin, A.; Abaltusov, N.; Perunov, A. An analysis of rotary steerable systems for sidetracking in open hole Fishbone multilateral wells in vostochno-messoyakhskoye field. In Proceedings of the Society of Petroleum Engineers—SPE Russian Petroleum Technology Conference, Moscow, Russia, 16–18 October 2017. [Google Scholar] [CrossRef]
  18. Akhmetov, M.; Maximov, M.; Lymarev, M.; Malyshev, Y.; Vasilyev, R.; Glushenko, N.; Rakhmangulov, F.; Denis, F. Drilling Extended Reach Well with Eight Fishbone Sidetracks: East Messoyakha Field. In Proceedings of the SPE Russian Petroleum Technology Conference, Moscow, Russia, 22–24 October 2019. [Google Scholar] [CrossRef]
  19. Lezin, A.; Kharitonov, A.; Seminikhin, I.; Korsunov, E.; Gassan, A.; Tikhonov, E.; Jadan, G.; Stashko, V.; Blagonadeshniy, I.; Manikhin, A.; et al. Adaptable drilling fluid system assisted in successful drilling of Taml 2 nine-hole horizontal well in vankor field. In Proceedings of the Society of Petroleum Engineers—SPE Russian Petroleum Technology Conference, Moscow, Russia, 22–24 October 2019. [Google Scholar] [CrossRef]
  20. Rylance, M.; Tuzov, Y.; Aliyev, S.; Gorbov, A.; Galitskiy, I.; Makhmutov, D.; Grinchenko, V.; Sultanov, R.; Levanov, I. Fishbones, wishbones and birch-leaves, multilateral well design on the srednebotuobinskoye field in eastern Siberia. In Proceedings of the Society of Petroleum Engineers—SPE Russian Petroleum Technology Conference, Virtual, 26–29 October 2020. [Google Scholar] [CrossRef]
  21. Rachapudi, R.V.; Al-Jaberi, S.S.; Al Hashemi, M.; Punnapala, S.; Alshehhi, S.; Talib, N.; Loayza, A.F.; Al Nuimi, S.; Elbekshi, A.; Quintero, F.; et al. Fishbone Stimulation a Game Changer for Tight Carbonate Productivity Enhancement, Case Study of First Successful Implementation at Adnoc Onshore Fields. In Proceedings of the Abu Dhabi International Petroleum Exhibition & Conference, Abu Dhabi, United Arab Emirates, 9–12 November 2020. [Google Scholar] [CrossRef]
  22. Quintero, F.; Talib, N.; Jimenez, A.; Chehabi, W.; Ramarao, S.; Al Nuami, M.A.; Al Reyami, M.; Hapa, C.; Edward, R. First Successful Fishbone Stimulation Completion in Onshore Oil Field in the United Arab Emirates. In Proceedings of the Abu Dhabi International Petroleum Exhibition & Conference, Abu Dhabi, United Arab Emirates, 9–12 November 2020. [Google Scholar] [CrossRef]
  23. Ozdemirtas, M.; McGinn, T.; Mejia, J.; McLennan, R.; Lopez, J. Innovative Fishbone SAGD Well Pair: An Integrated Approach to Efficiently Unlock the Resource Potential in Canadian Oil Sands Play. In Proceedings of the SPE/IADC Drilling Conference and Exhibition, London, UK, 17–19 March 2015. [Google Scholar] [CrossRef]
  24. Donnelly, J.K. Application of Steam Assisted Gravity Drainage (SAGD) to Cold Lake. In Proceedings of the SPE/CIM 6th One-Day Conference on Horizontal Well Technology, Calgary, AB, Canada, 12 November 1997; Paper CIM 97-192. Available online: https://www.osti.gov/etdeweb/biblio/595779 (accessed on 20 January 2022).
  25. Farouq-Ali, S.M. Is There Life After SAGD? J. Can. Pet. Technol. 1997, 36, 21–23. [Google Scholar] [CrossRef]
  26. Owusu, P.A.; DeHua, L.; Nyantakyi, E.K.; Nagre, R.D.; Borkloe, J.K.; Frimpong, I.K. Prognosticating the Production Performance of Saturated Gas Drive Reservoir: A Theoretical Perspective. Int. J. Min. Eng. Miner. Process. 2013, 2, 24–33. [Google Scholar] [CrossRef]
  27. Lu, J. New Productivity Formulae of Horizontal Wells. J. Can. Pet. Technol. 2001, 40. [Google Scholar] [CrossRef]
  28. Taha, A.; Amani, M. Introduction to Smart Oil and Gas Wells: Drilling, Completion and Monitoring Solutions. Int. J. Petrochem. Res. 2019, 3, 249–254. [Google Scholar] [CrossRef]
  29. Zolotukhin, A.B.; Gayubov, A.T. Semi-analytical Approach to Modeling Forchheimer Flow in Porous Media at Meso- and Macroscales. Transp. Porous Media 2021, 136, 715–741. [Google Scholar] [CrossRef]
  30. Guo, B.; Liu, X.; Tan, X. Chapter 3—Reservoir Deliverability. In Petroleum Production Engineering, 2nd ed.; Gulf Professional Publishing: Houston, TX, USA, 2017; pp. 37–81. ISBN 9780128093740. [Google Scholar] [CrossRef]
  31. Ahmed, M.E.; Alnuaim, S.; Abdulazeem, A. New Algorithm to Quantify Productivity of Fishbone Type Multilateral Gas Well. In Proceedings of the SPE Annual Technical Conference and Exhibition, Dubai, United Arab Emirates, 26–28 September 2016. [Google Scholar]
  32. Chaikine, I. Machine Learning Applications for Production Prediction and Optimization in Multistage Hydraulically Fractured Wells. Ph.D. Thesis, University of Calgary, Calgary, AB, Canada, 2020. Available online: http://hdl.handle.net/1880/112817 (accessed on 20 January 2022).
  33. Mehana, M.; Guiltinan, E.; Vesselinov Middleton, R.; Hyman, J.D.; Kang, Q.; Viswanathan, H. Machine-learning predictions of the shale wells’ performance. J. Nat. Gas Sci. Eng. 2021, 88, 103819. [Google Scholar] [CrossRef]
  34. Mudunuru, M.K.; O’Malley, D.; Srinivasan, S.; Hyman, J.D.H.; Sweeney, M.R.; Frash, L.P.; Carey, J.W.; Gross, M.R.; Welch, N.J.; Karra, S.; et al. Physics-Informed Machine Learning for Real-Time Unconventional Reservoir Management; No. LA-UR-19-31611; Los Alamos National Lab. (LANL): Los Alamos, NM, USA, 2020. Available online: https://www.osti.gov/servlets/purl/1579690 (accessed on 20 January 2021).
  35. Li, X.; Chan, C.; Nguyen, H. Application of the neural decision tree approach for prediction of petroleum production. J. Pet. Sci. Eng. 2013, 104, 11–16. [Google Scholar] [CrossRef]
  36. Chakra, N.C.; Song, K.-Y.; Gupta, M.M.; Saraf, D.N. An innovative neural forecast of cumulative oil production from a petroleum reservoir employing higher-order neural networks (HONNs). J. Pet. Sci. Eng. 2013, 106, 18–33. [Google Scholar] [CrossRef]
  37. Klie, H. Physics-based and data-driven surrogates for production forecasting. In Proceedings of the SPE Reservoir Simulation Symposium, Society of Petroleum Engineers, Houston, TX, USA, 23–25 February 2015. [Google Scholar]
  38. Fulford, D.S.; Bowie, B.; Berry, M.E.; Bowen, B.; Turk, D.W. Machine learning as a reliable technology for evaluating time/rate performance of unconventional wells. SPE Econ. Manag. 2016, 8, 23–39. [Google Scholar] [CrossRef]
  39. Nguyen-Le, V.; Shin, H.; Little, E. Development of shale gas prediction models for long-term production and economics based on early production data in Barnett reservoir. Energies 2020, 13, 424. [Google Scholar] [CrossRef] [Green Version]
  40. Chen, X.; Li, C.; Gao, P.; Zhou, J. Prediction of shale gas horizontal wells productivity after volume fracturing using machine learning—An LSTM approach. Pet. Sci. Technol. 2022, 40, 1861–1877. [Google Scholar] [CrossRef]
  41. Hassan, A.; Elkatatny, S.; Abdulraheem, A. Application of Artificial Intelligence Techniques to Predict the Well Productivity of Fishbone Wells. Sustainability 2019, 11, 6083. [Google Scholar] [CrossRef] [Green Version]
  42. Naji, S.H. Gas Well Performance, HBSNumerics—Science & Engineering Software. Available online: https://storage.googleapis.com/wzukusers/user-21643054/documents/5a26c97b5d4e6NMpIbc2/Gas%20Wells%20Performance.pdf (accessed on 20 January 2021).
  43. Mirjalili, S.; Mirjalili, S.M.; Lewis, A. Grey Wolf optimizer. Adv. Eng. Softw. 2014, 69, 46–61. [Google Scholar] [CrossRef] [Green Version]
  44. Xu, C.; Nait Amar, M.; Ghriga, M.A.; Ouaer, H.; Zhang, X.; Hasanipanah, M. Evolving support vector regression using Grey Wolf optimization; forecasting the geomechanical properties of rock. Eng. Comput. 2022, 38, 1819–1833. [Google Scholar] [CrossRef]
  45. Nagao, M.; Yao, C.; Onishi, T.; Chen, H.; Datta-Gupta, A. An Efficient Deep Learning-Based Workflow for CO2 Plume Imaging Using Distributed Pressure and Temperature Measurements. In Proceedings of the SPE Annual Technical Conference and Exhibition, Houston, TX, USA, 3–5 October 2022. [Google Scholar] [CrossRef]
  46. Chemmakh, A. Machine Learning Predictive Models to Estimate the UCS and Tensile Strength of Rocks in Bakken Field. In Proceedings of the SPE Annual Technical Conference and Exhibition, Dubai, United Arab Emirates, 21–23 September 2021. [Google Scholar] [CrossRef]
  47. Boualam, A. Impact Of Stress on The Characterization of The Flow Units in The Complex Three Forks Reservoir, Williston Basin. Ph.D. Thesis, University of North Dakota, Grand Forks, ND, USA, 2019. Available online: https://commons.und.edu/theses/2839 (accessed on 20 January 2022).
  48. Soto Maldonado, R.J.; Aoun, A.E. A Data-Driven Evaluation of Hydraulic Fracturing Performance in Hassi Messaoud Field, Algeria. In Proceedings of the SPE Western Regional Meeting, San Jose, CA, USA, 23–26 April 2019. [Google Scholar] [CrossRef]
  49. Laoufi, H.; Megherbi, Z.; Zeraibi, N.; Merzoug, A.; Ladmia, A. Selection of Sand Control Completion Techniques Using Machine Learning. In Proceedings of the International Geomechanics Symposium, Abu Dhabi, United Arab Emirates, 7–10 November 2022. [Google Scholar] [CrossRef]
  50. Vapnik, V.N. The Nature of Statistical Learning Theory; Springer: New York, NY, USA, 1995. [Google Scholar] [CrossRef]
  51. Chen, J.; Yao, C.; Devarakota, P.; Sidahmed, M.; Dong, Z.; Kanuparthi, S.; Wei, J. Full-Stack Machine Learning Development Framework for Energy Industry Applications. In Proceedings of the Abu Dhabi International Petroleum Exhibition and Conferences ADIPEC, Abu Dhabi, United Arab Emirates, 31 October–3 November 2022. [Google Scholar] [CrossRef]
  52. Bremermann, H.J. Optimization through Evolution and Recombination, Self-Organizing Systems; Yovits, M.C., Jacobi, G.T., Goldstein, G.D., Eds.; Spartan: Washington, DC, USA, 1962. [Google Scholar]
  53. Holland, J.H. Adaptation in Natural and Artificial Systems: An Introductory Analysis with Applications to Biology, Control, and Artificial Intelligence; University of Michigan Press: Ann Arbor, MI, USA, 1975. [Google Scholar]
  54. Nait Amar, M.; Zeraibi, N.; Jahanbani, A. Applying hybrid support vector regression and genetic algorithm to water alternating CO2 gas EOR. Greenh. Gases: Sci. Technol. 2020, 10, 613–630. [Google Scholar] [CrossRef]
  55. Li, X.; Gao, D.; Zhou, Y.; Zhang, H.; Yang, Y. Study on the prediction model of the open-hole extended-reach limit in horizontal drilling considering the effects of cuttings. J. Nat. Gas Sci. Eng. 2017, 40, 159–167. [Google Scholar] [CrossRef]
  56. Mao, P.; Sun, J.; Ning, F.; Hu, G.; Wan, Y.; Cao, X.; Wu, N. Effect of permeability anisotropy on depressurization-induced gas production from hydrate reservoirs in the South China Sea. Energy Sci. Eng. 2020, 8, 2690–2707. [Google Scholar] [CrossRef] [Green Version]
  57. Zhang, C.; Wang, P.; Guo, B.; Song, G. Analytical modeling of productivity of multi-fractured shale gas wells under pseudo-steady flow conditions. Energy Sci. Eng. 2018, 6, 819–827. [Google Scholar] [CrossRef]
  58. Kumar, A.; Balikram, A.; Ojha, K. Deep transient testing methodology: An integrated approach to redefine the real-time reservoir complexities and well deliverability. J. Pet. Sci. Eng. 2021, 207, 109179. [Google Scholar] [CrossRef]
  59. Butler, R.M. Horizontal Wells for the Recovery of Oil, Gas and Bitumen, Petroleum Society Monograph Number 2; The Petroleum Society of the Canadian Petroleum Technology: Calgary, AB, Canada, 1994; Volume 33, pp. 27–33. [Google Scholar]
  60. Furui, K.; Zhu, D.; Hill, A.D. A rigorous formation damage skin factor and reservoir inflow model for a horizontal well. SPE Prod. Facil. 2003, 18, 151–157. [Google Scholar] [CrossRef]
Figure 1. Fishbone Drilling Technology.
Fuels 04 00007 g001
Figure 2. The effect of the number of branches on cumulative gas production.
Fuels 04 00007 g002
Figure 3. The effect of the length of branches on the cumulative gas production.
Fuels 04 00007 g003
Figure 4. The effect of the length of branches on the cumulative gas production.
Fuels 04 00007 g004
Figure 5. The effect of the length of branches on the cumulative gas production.
Fuels 04 00007 g005
Figure 6. The outer and inner region representation of the stimulated volume for a Fishbone well.
Fuels 04 00007 g006
Figure 7. The correlation coefficient between the productivity of the modified empirical model and the numerical simulations.
Fuels 04 00007 g007
Figure 8. The correlation of R-Score of the ANN model.
Fuels 04 00007 g008
Figure 9. Error distribution for ANN model.
Fuels 04 00007 g009
Figure 10. The correlation of R-Score of the SVR-GA model.
Fuels 04 00007 g010
Figure 11. Error distribution for the SVR-GA model.
Fuels 04 00007 g011
Figure 12. The effect of the number of branches on cumulative production.
Fuels 04 00007 g012
Figure 13. The effect of the length of branches on the cumulative production.
Fuels 04 00007 g013
Figure 14. The effect of permeability anisotropy on cumulative production.
Fuels 04 00007 g014
Figure 15. The effect of the distance between adjacent branches on the cumulative production.
Fuels 04 00007 g015
Table 1. Statistical parameters for the studied reservoir models.
cProduction Rate (SCF/DAY)Well Pressure (psi)Permeability Ratio (kH/kV)Number of BranchesDistance between
Adjacent Branches (ft)
Branches Length (ft)
Maximum197,900480010001452003100
Minimum014.7121300700
Mean81,861236061727242760
Standard Deviation48,71315522122.5685693
Coefficient of variation6066346382525
Table 2. Constant values of the modified empirical model.
ParameterEstimated Value
a−5.61989377 × 10²
b59.4495457
c−1.35260055 × 10²
d−1.16891882
e−6.94846204 × 10⁻²
f1.91538556
g−4.51686871 × 10⁻⁴
h−1.44650462 × 10²
Table 3. SVR-hyperparameters.
CGamma γEpsilon ε
2770.0735496078370.201690725424970240.020918583247214607
Table 4. Constant values of the modified empirical model.
ParameterValue
The size of the population30
Maximum number of generations8
Crossover probability100
Mutation probability20
Table 5. Comparison between the existing and developed models.
ApproachR2Average Error (RMSE)
Existing Analytical model32.11%0.791
Developed analytical model94.39%0.104
Developed correlation98.56%0.067
Developed ANN Model99.05%0.033
Developed SVR-GA Model99.80%0.014
Disclaimer/Publisher’s Note: The statements, opinions and data contained in all publications are solely those of the individual author(s) and contributor(s) and not of MDPI and/or the editor(s). MDPI and/or the editor(s) disclaim responsibility for any injury to people or property resulting from any ideas, methods, instructions or products referred to in the content.