
First Study on Ammonia Spray Characteristics with a Current GDI Engine Injector

 and
and
Abstract
:1. Introduction
2. Materials and Methods
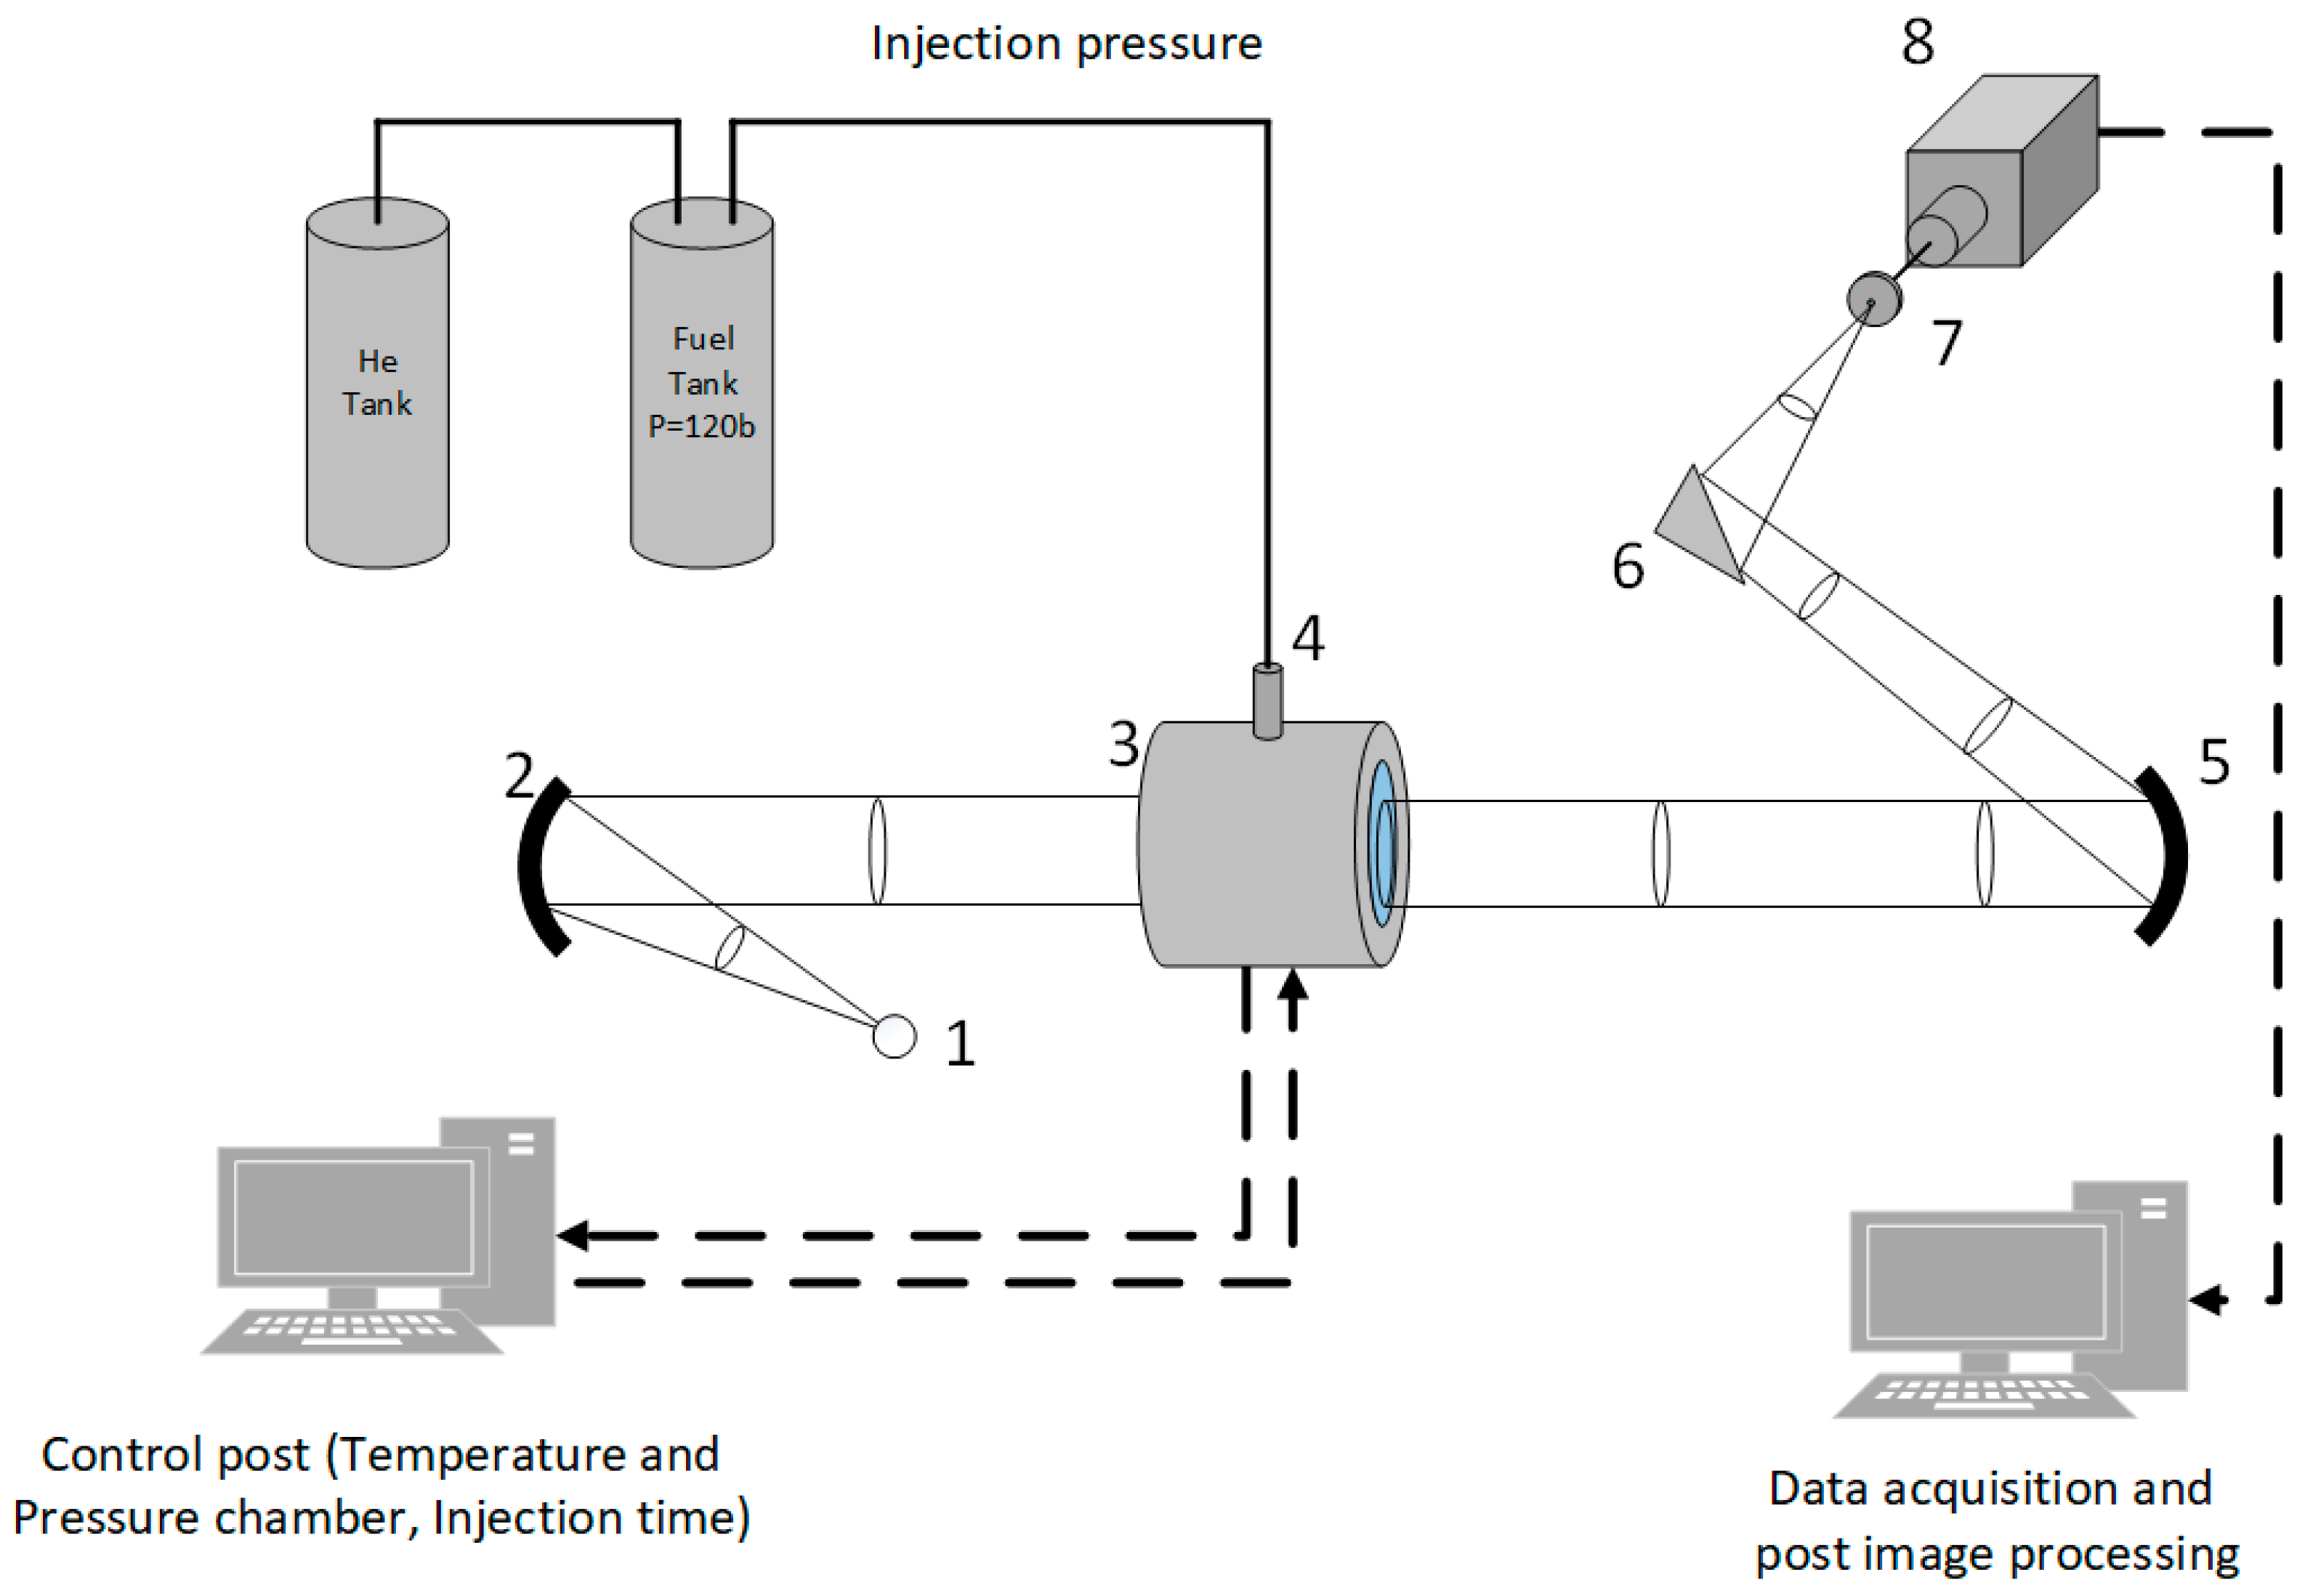
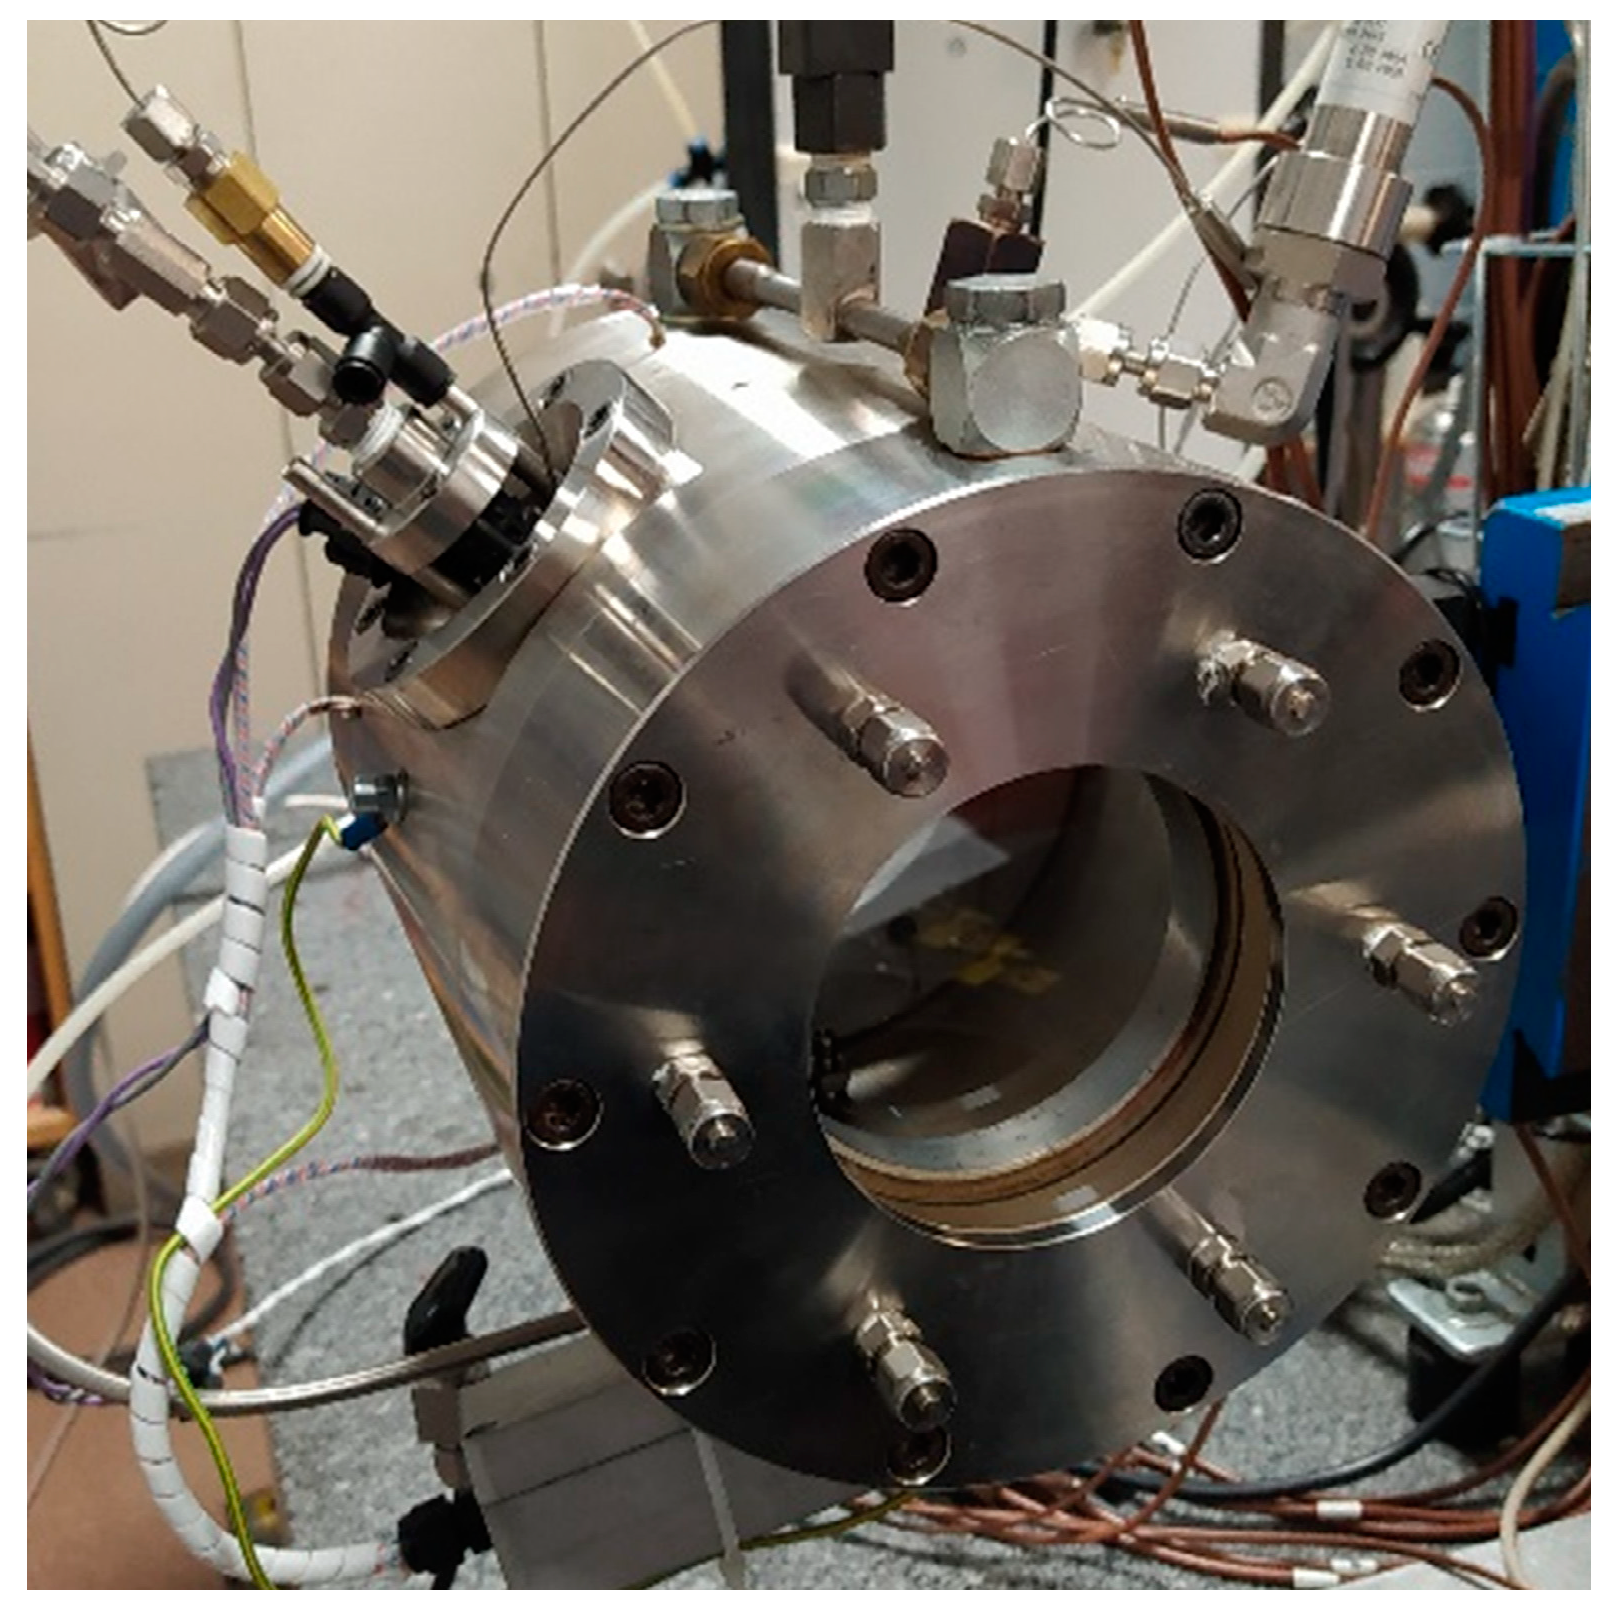
2.1. Experimental Setup
2.2. Schlieren Setup
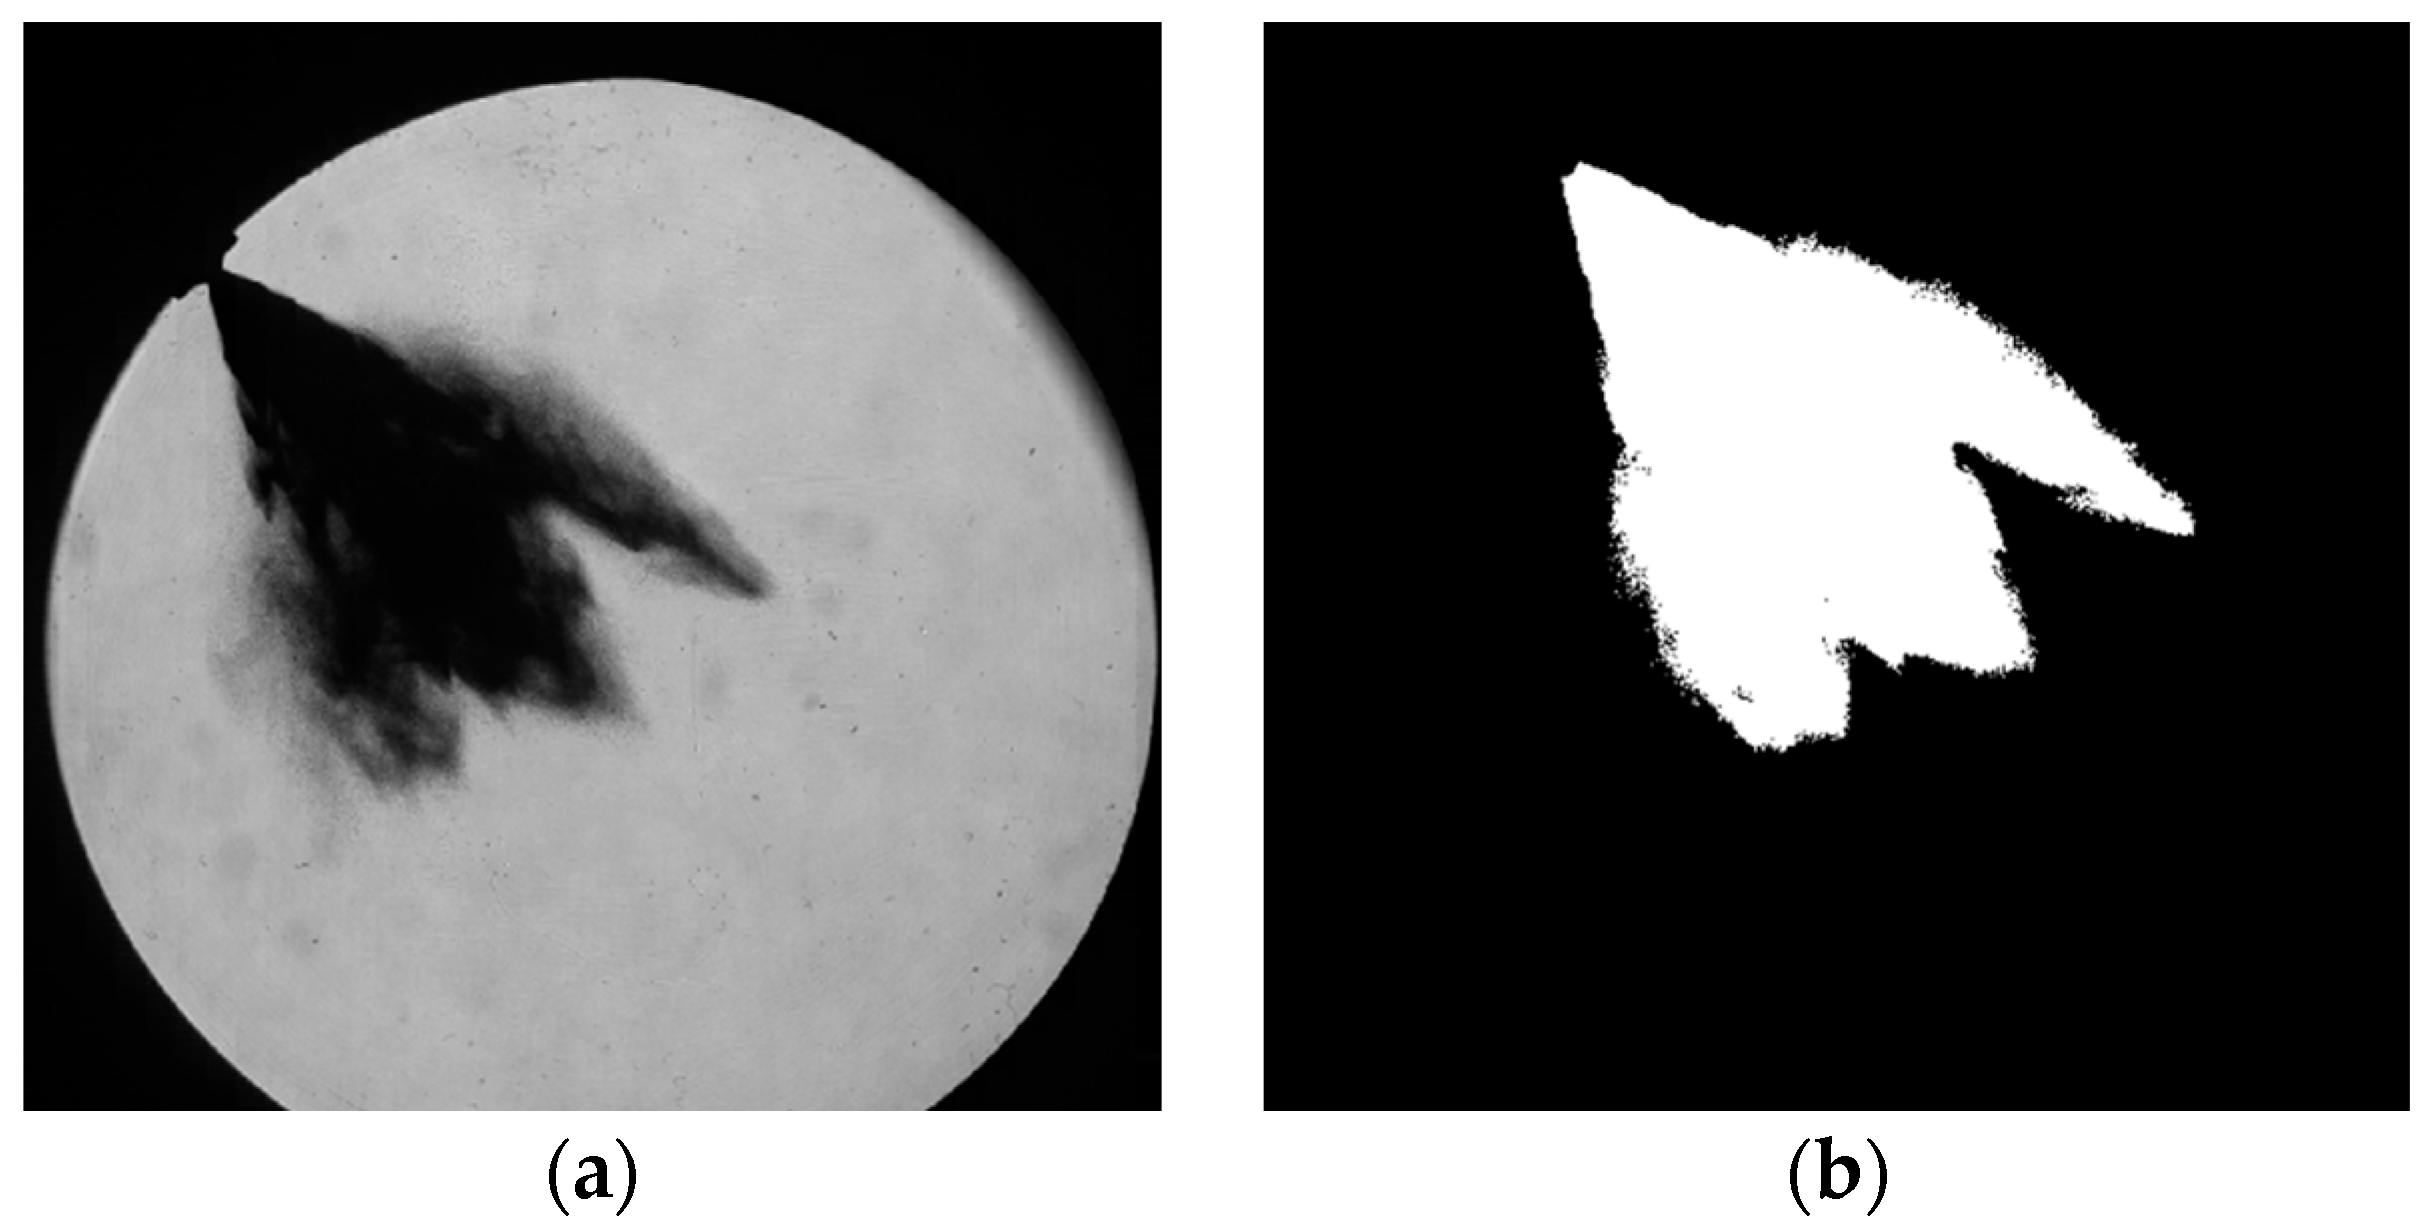
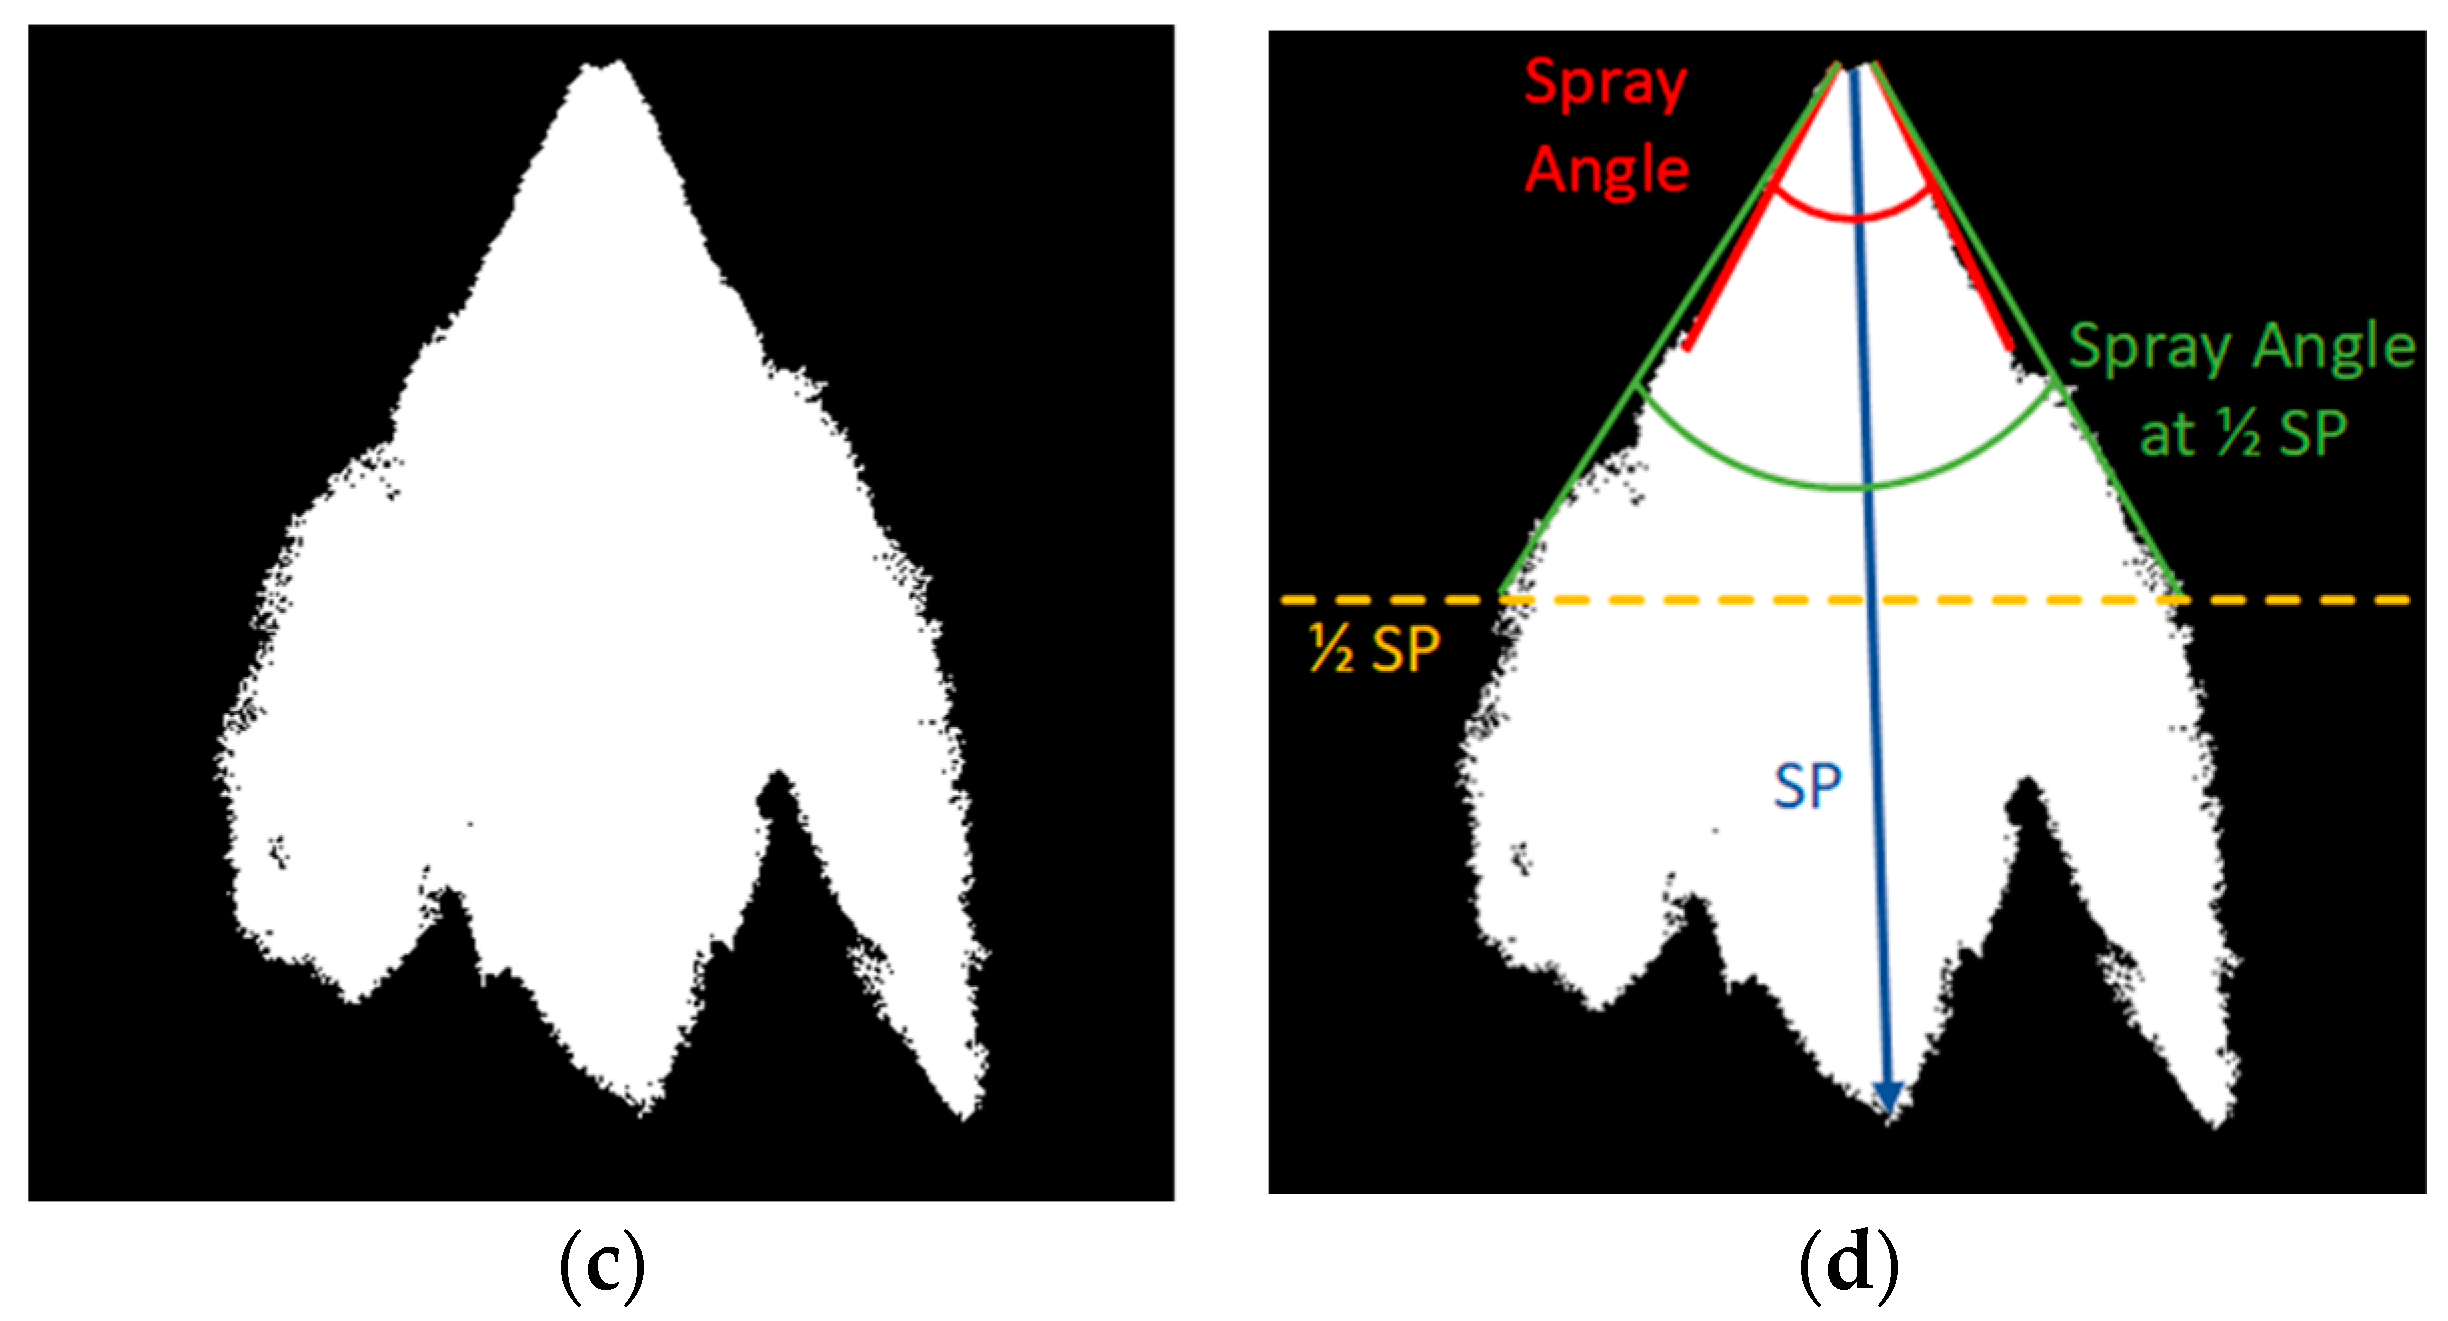
2.3. Image Post-Processing
- -
- SP is the distance between the injector and the end of spray.
- -
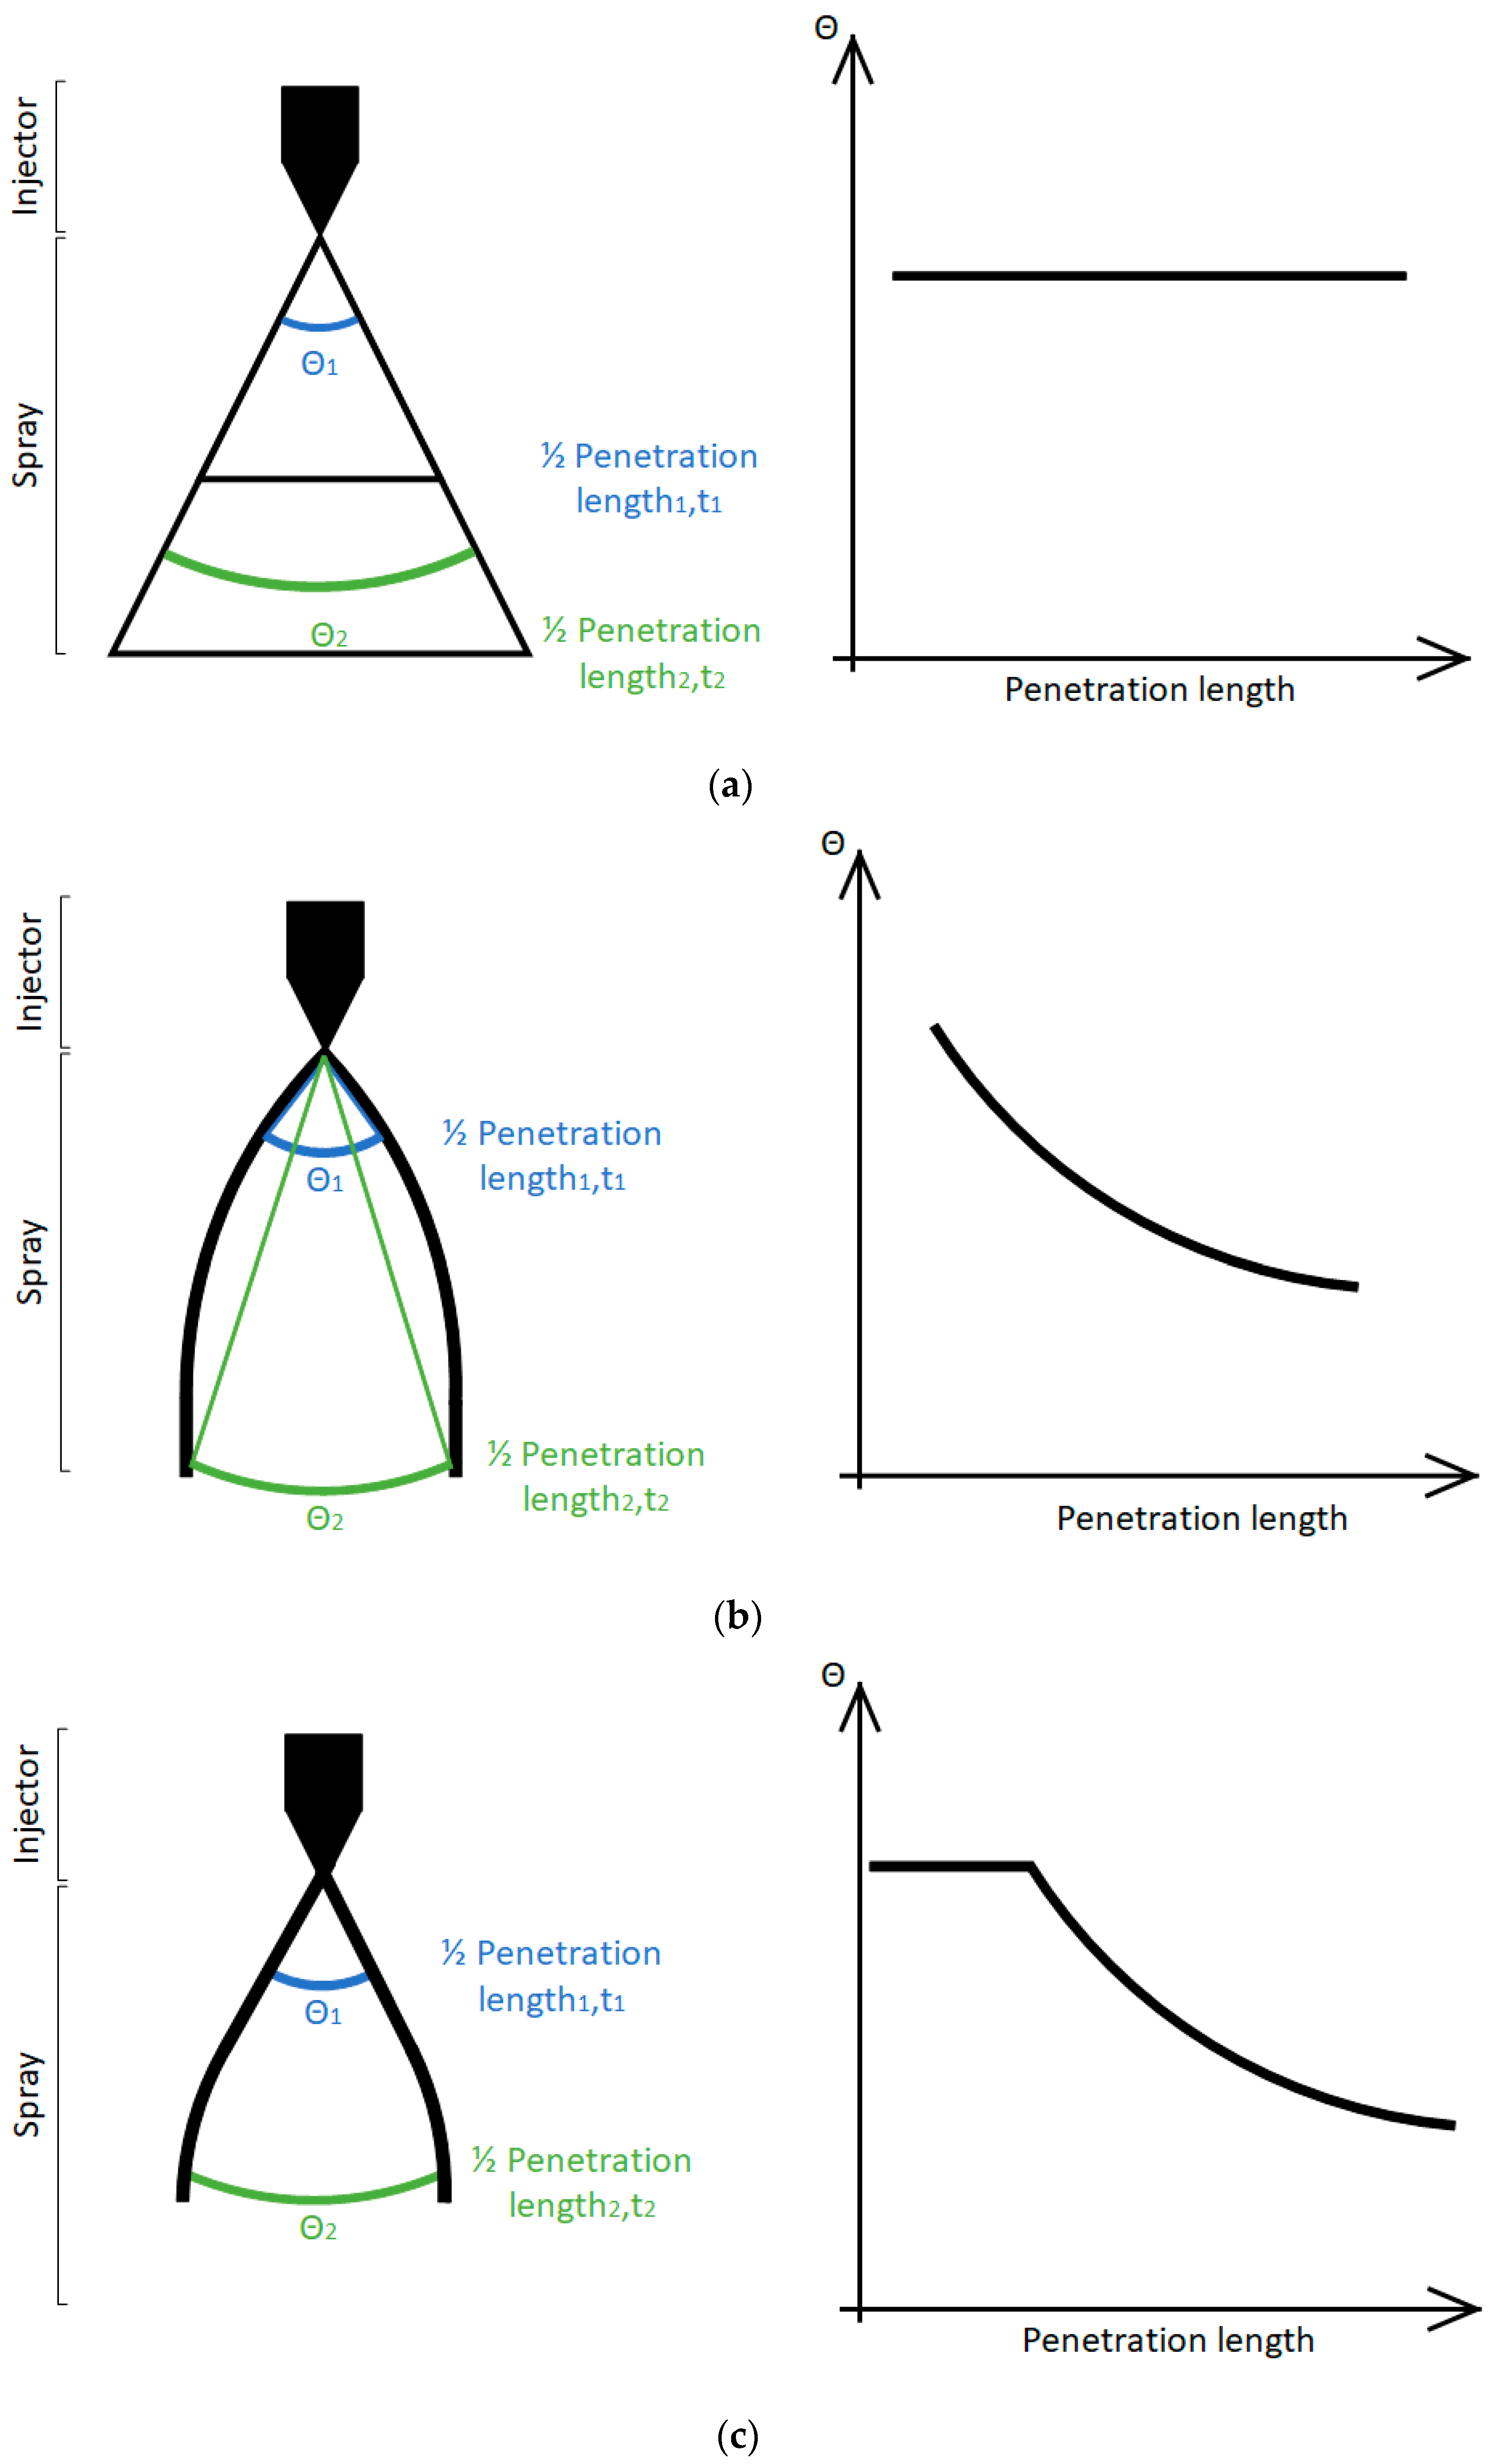
- spray angle is the angle averaged on the first hundred pixels (or 16 mm).where yinj is the vertical position of the injector and Spray angle (i) is the angle for the vertical position i.
- -
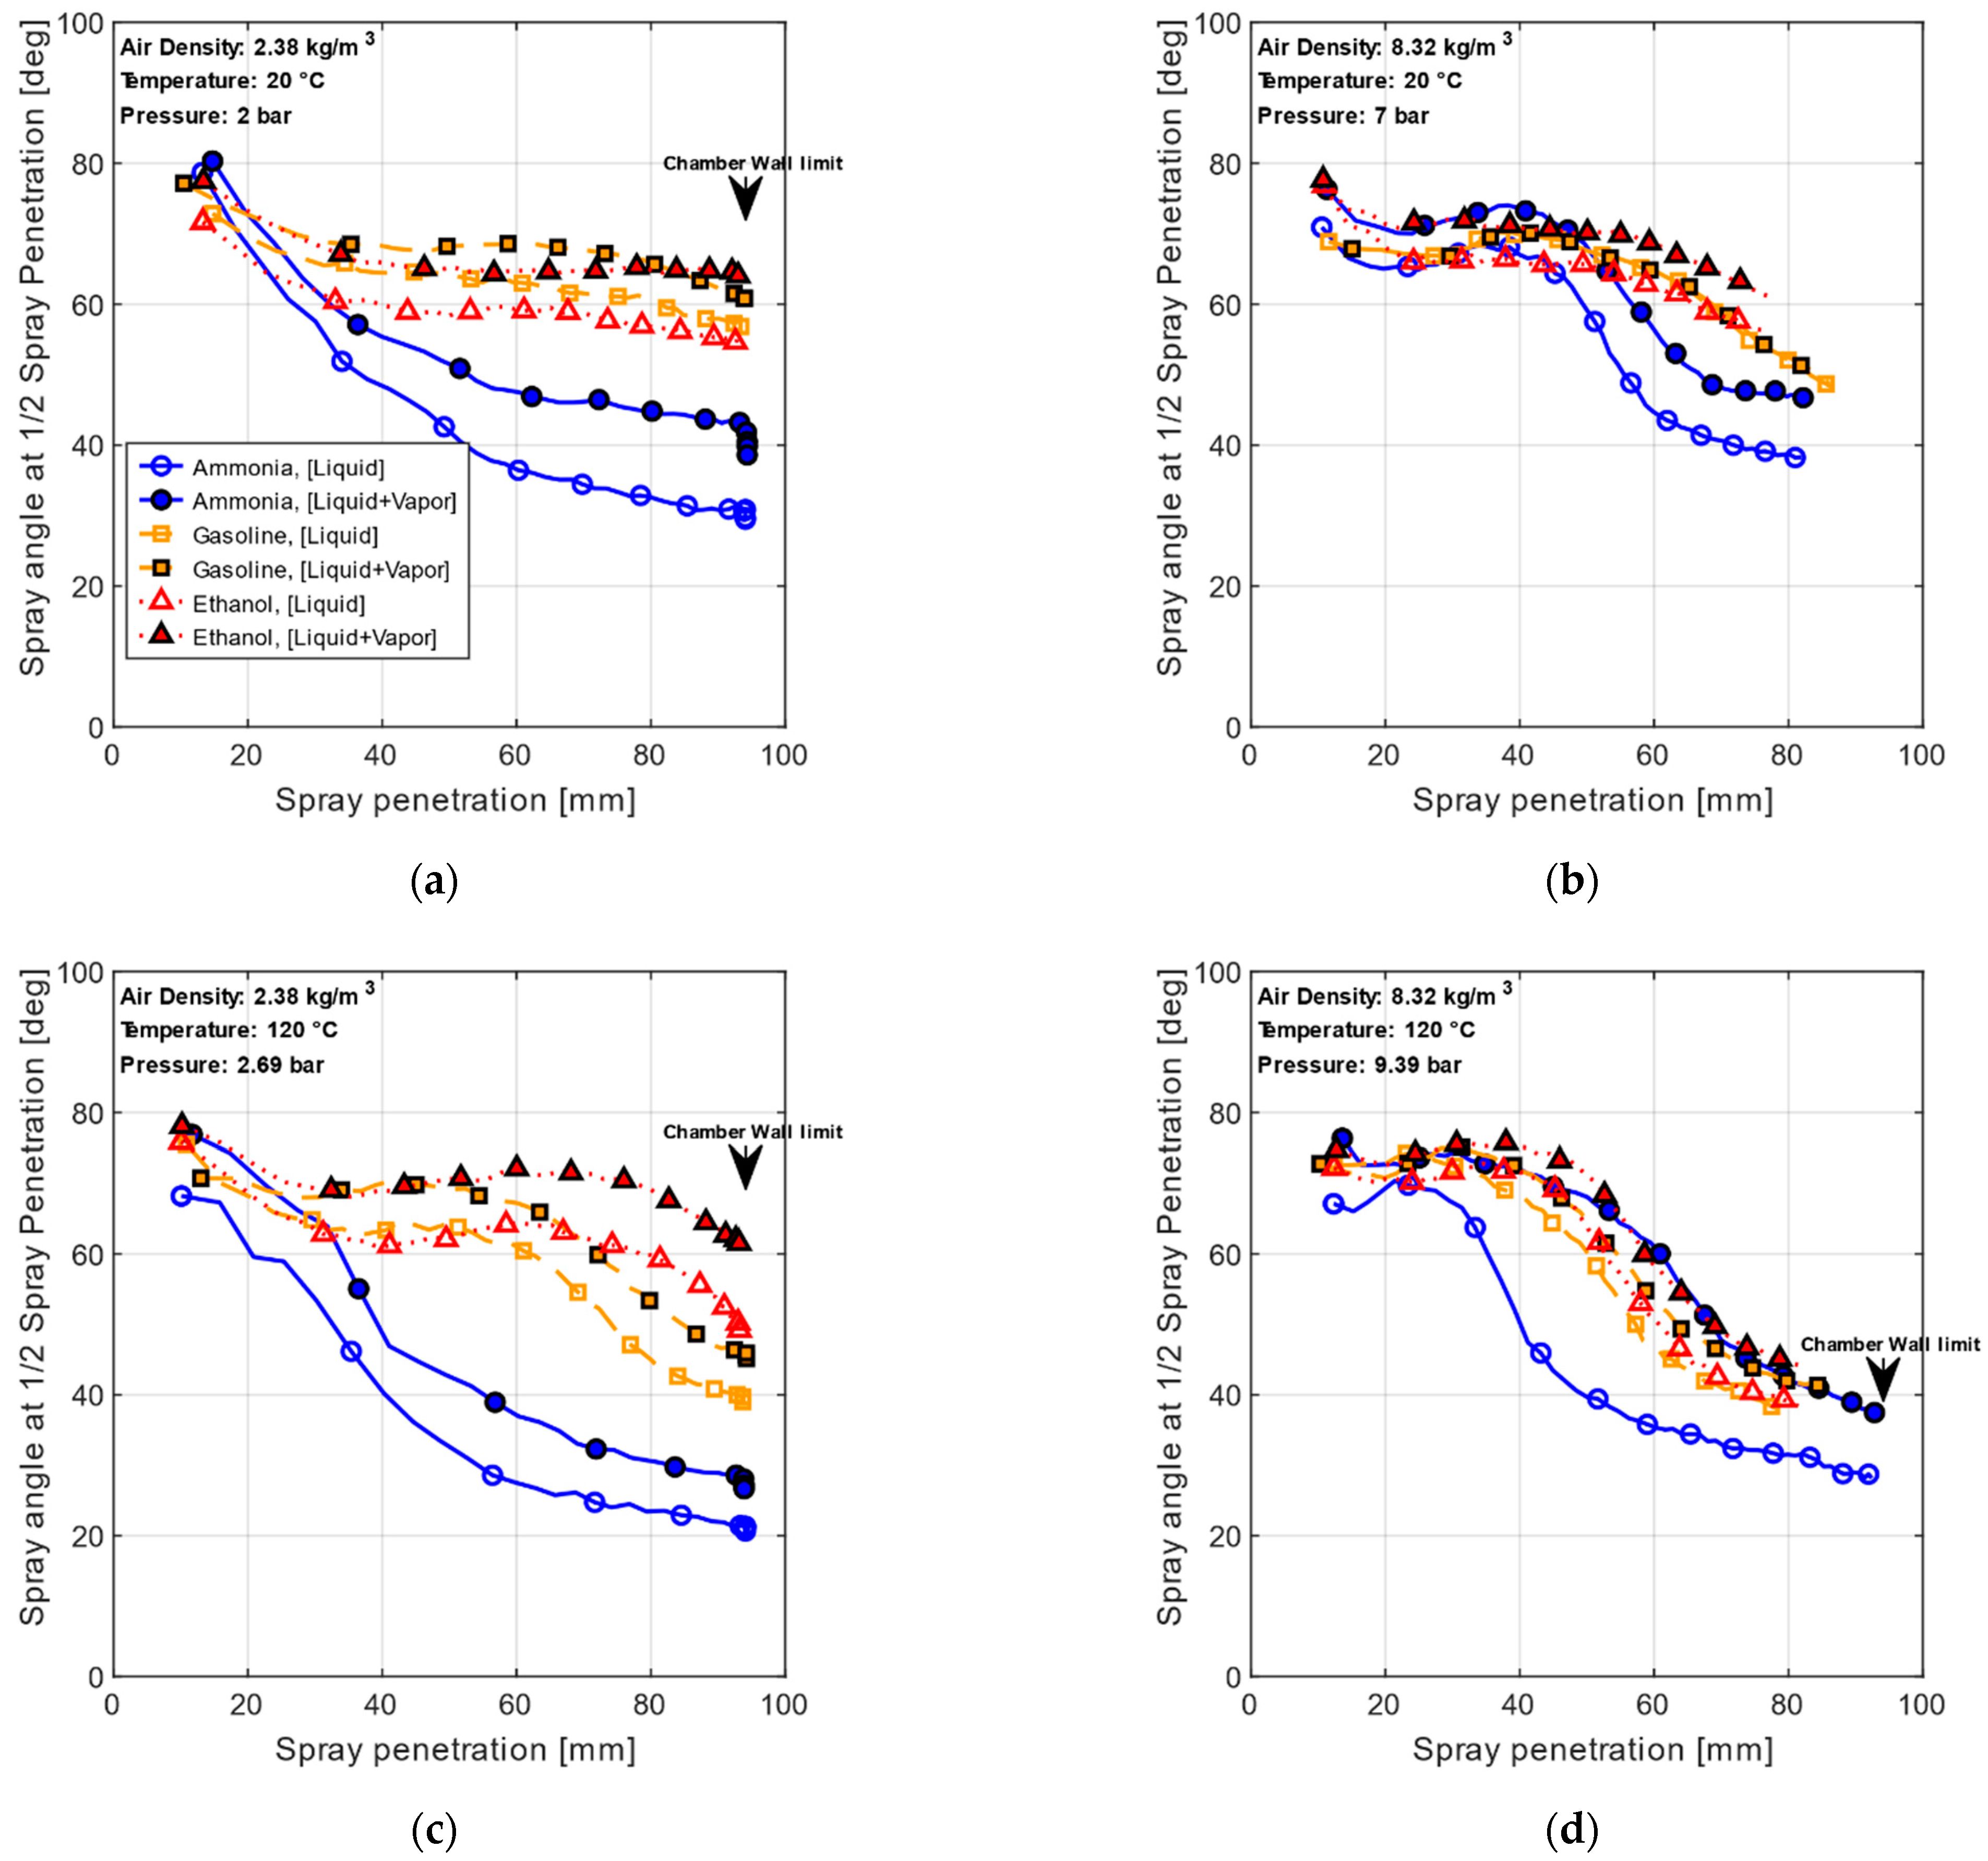
- spray angle at ½ SP is the value of the angle from the injector outlet to the half spray penetration length.
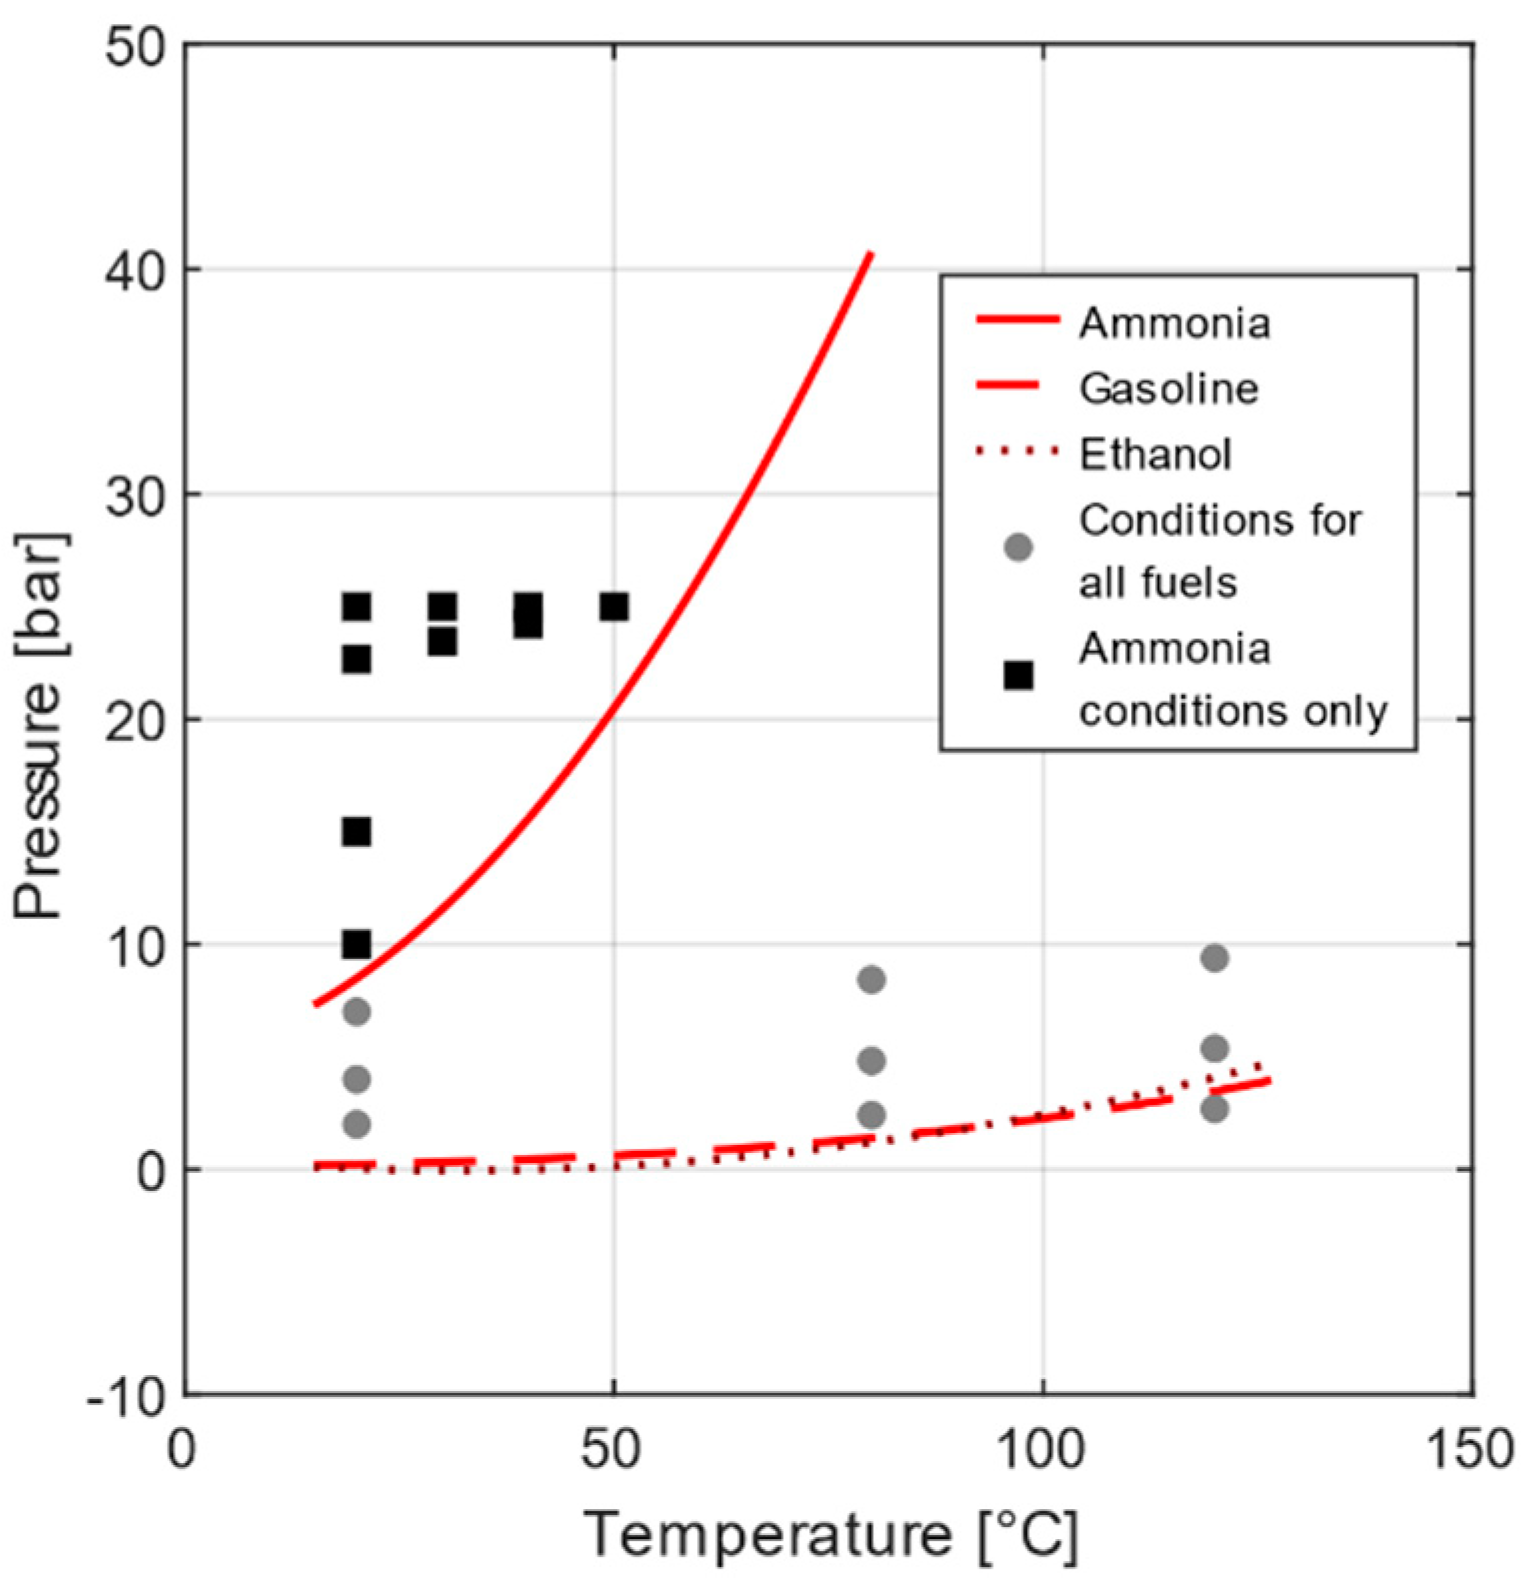
2.4. Experimental Conditions
3. Results and Discussion
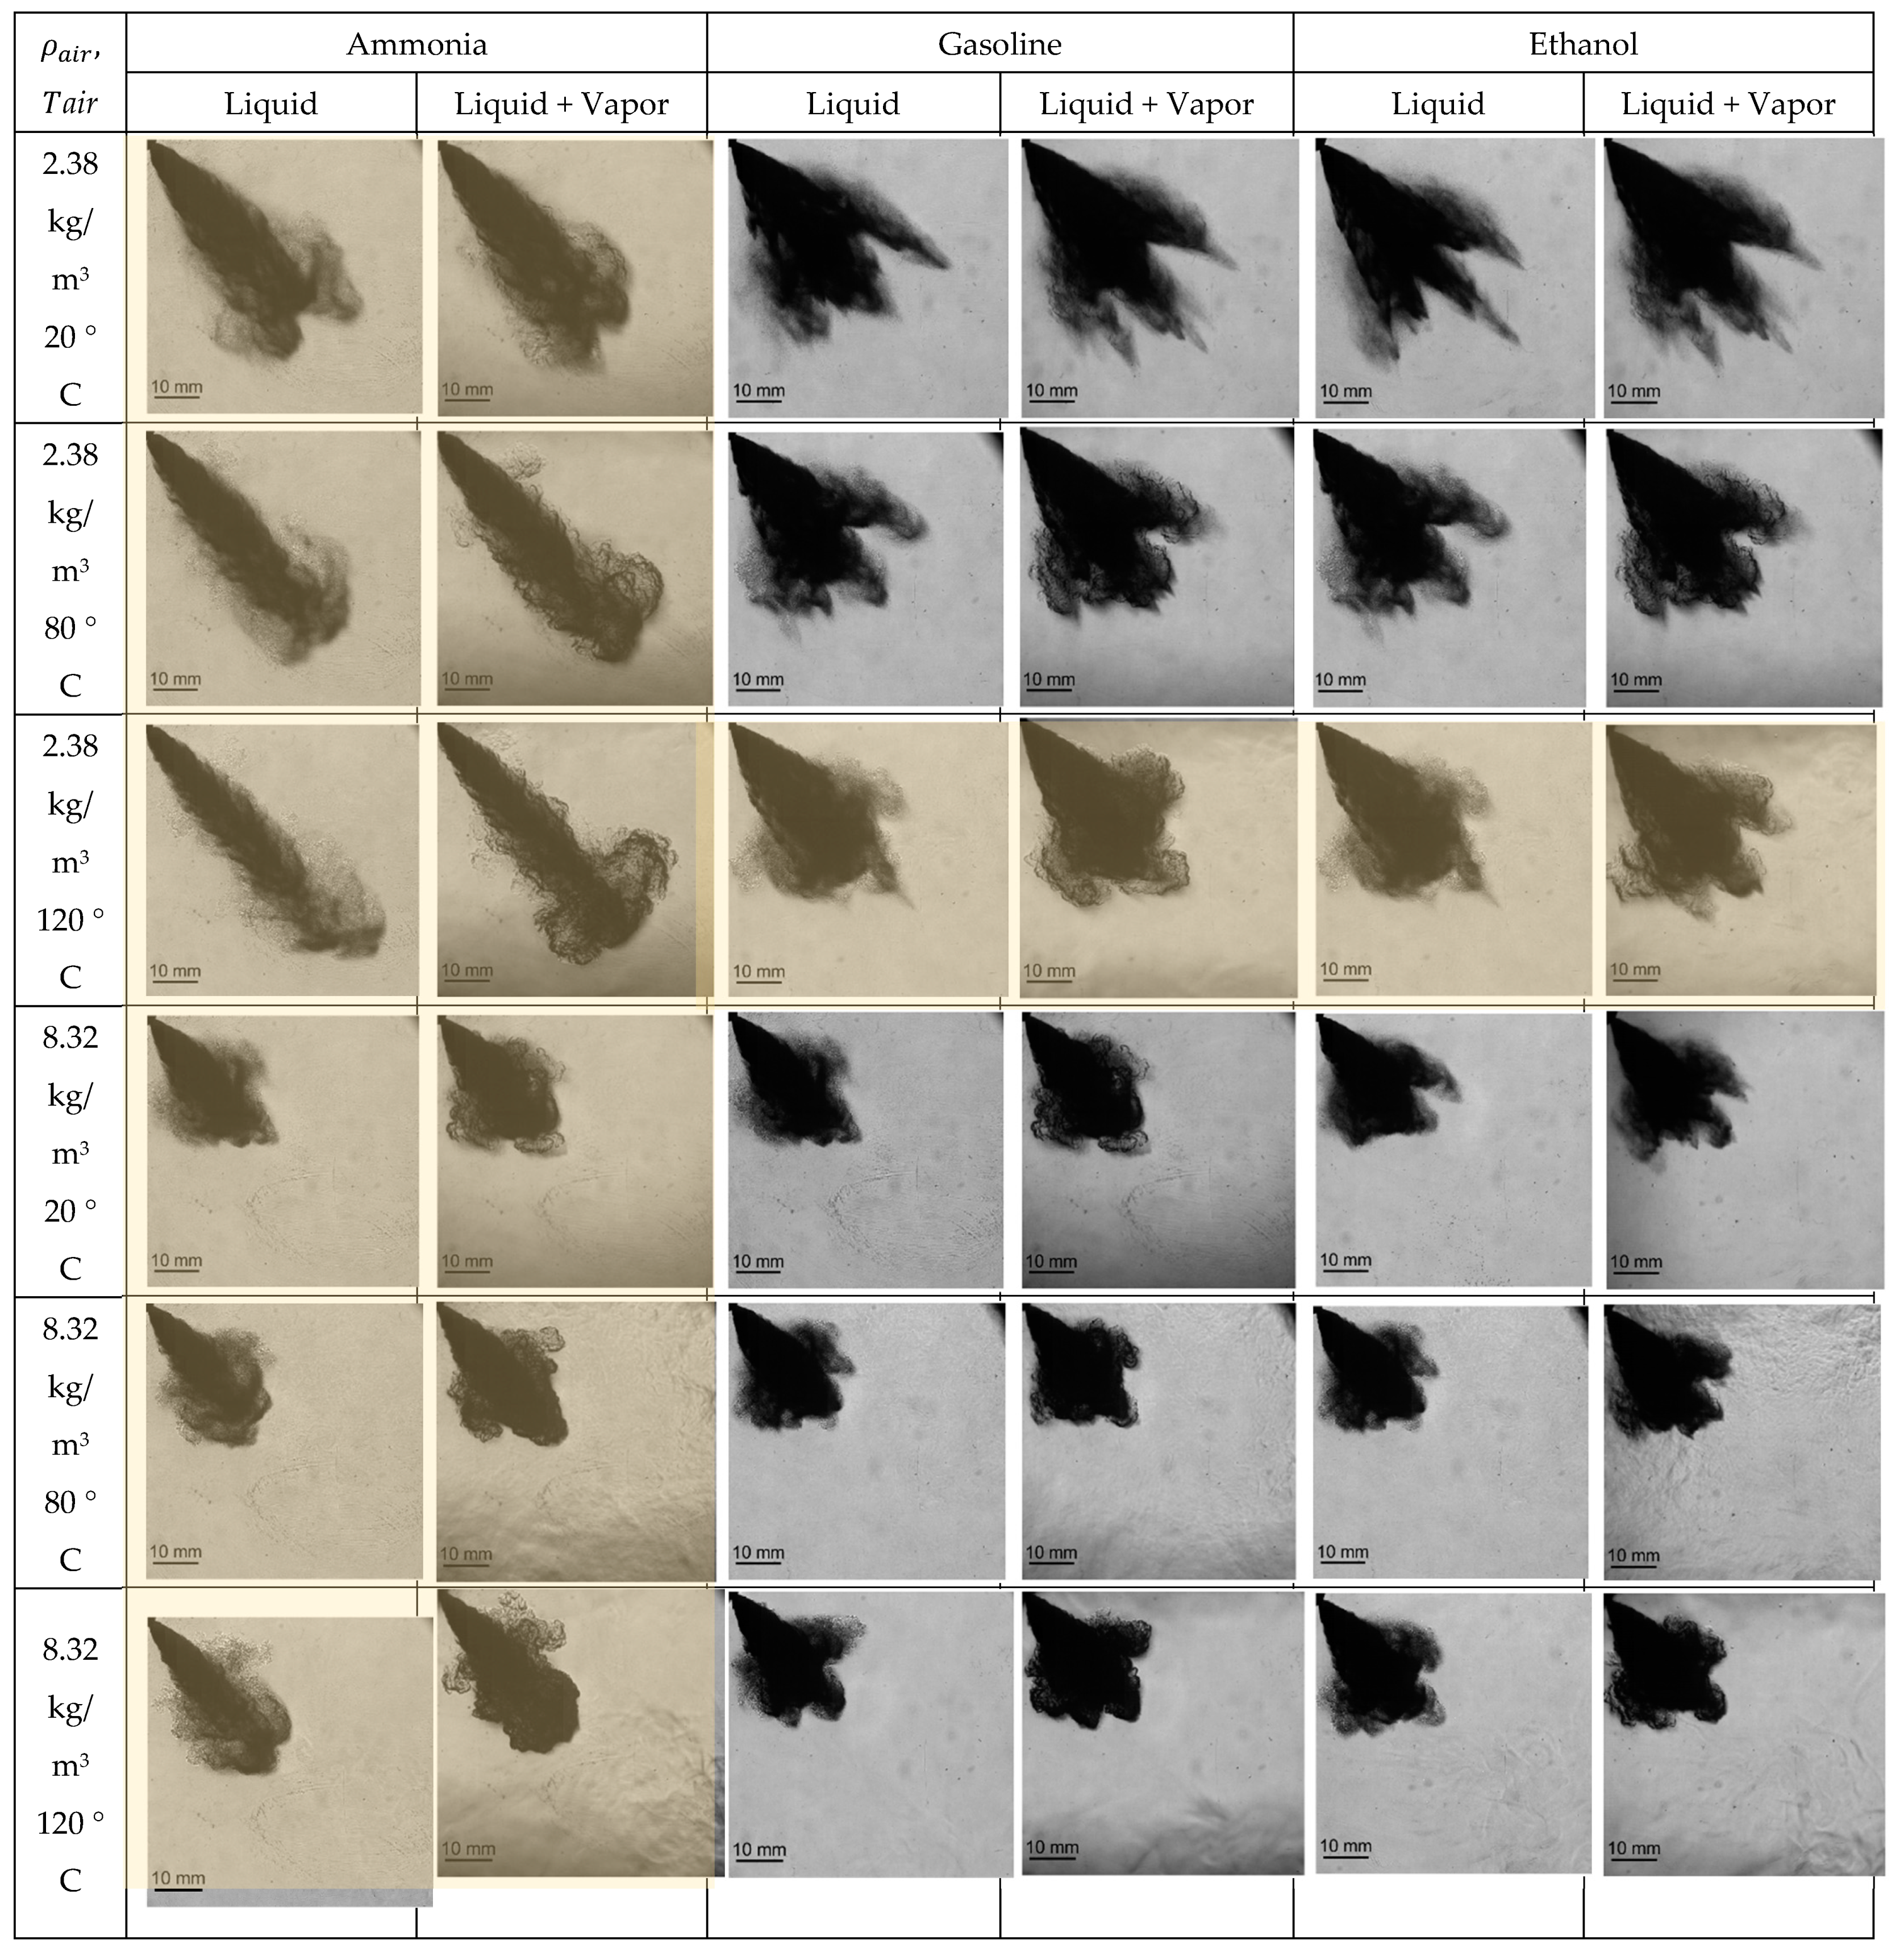
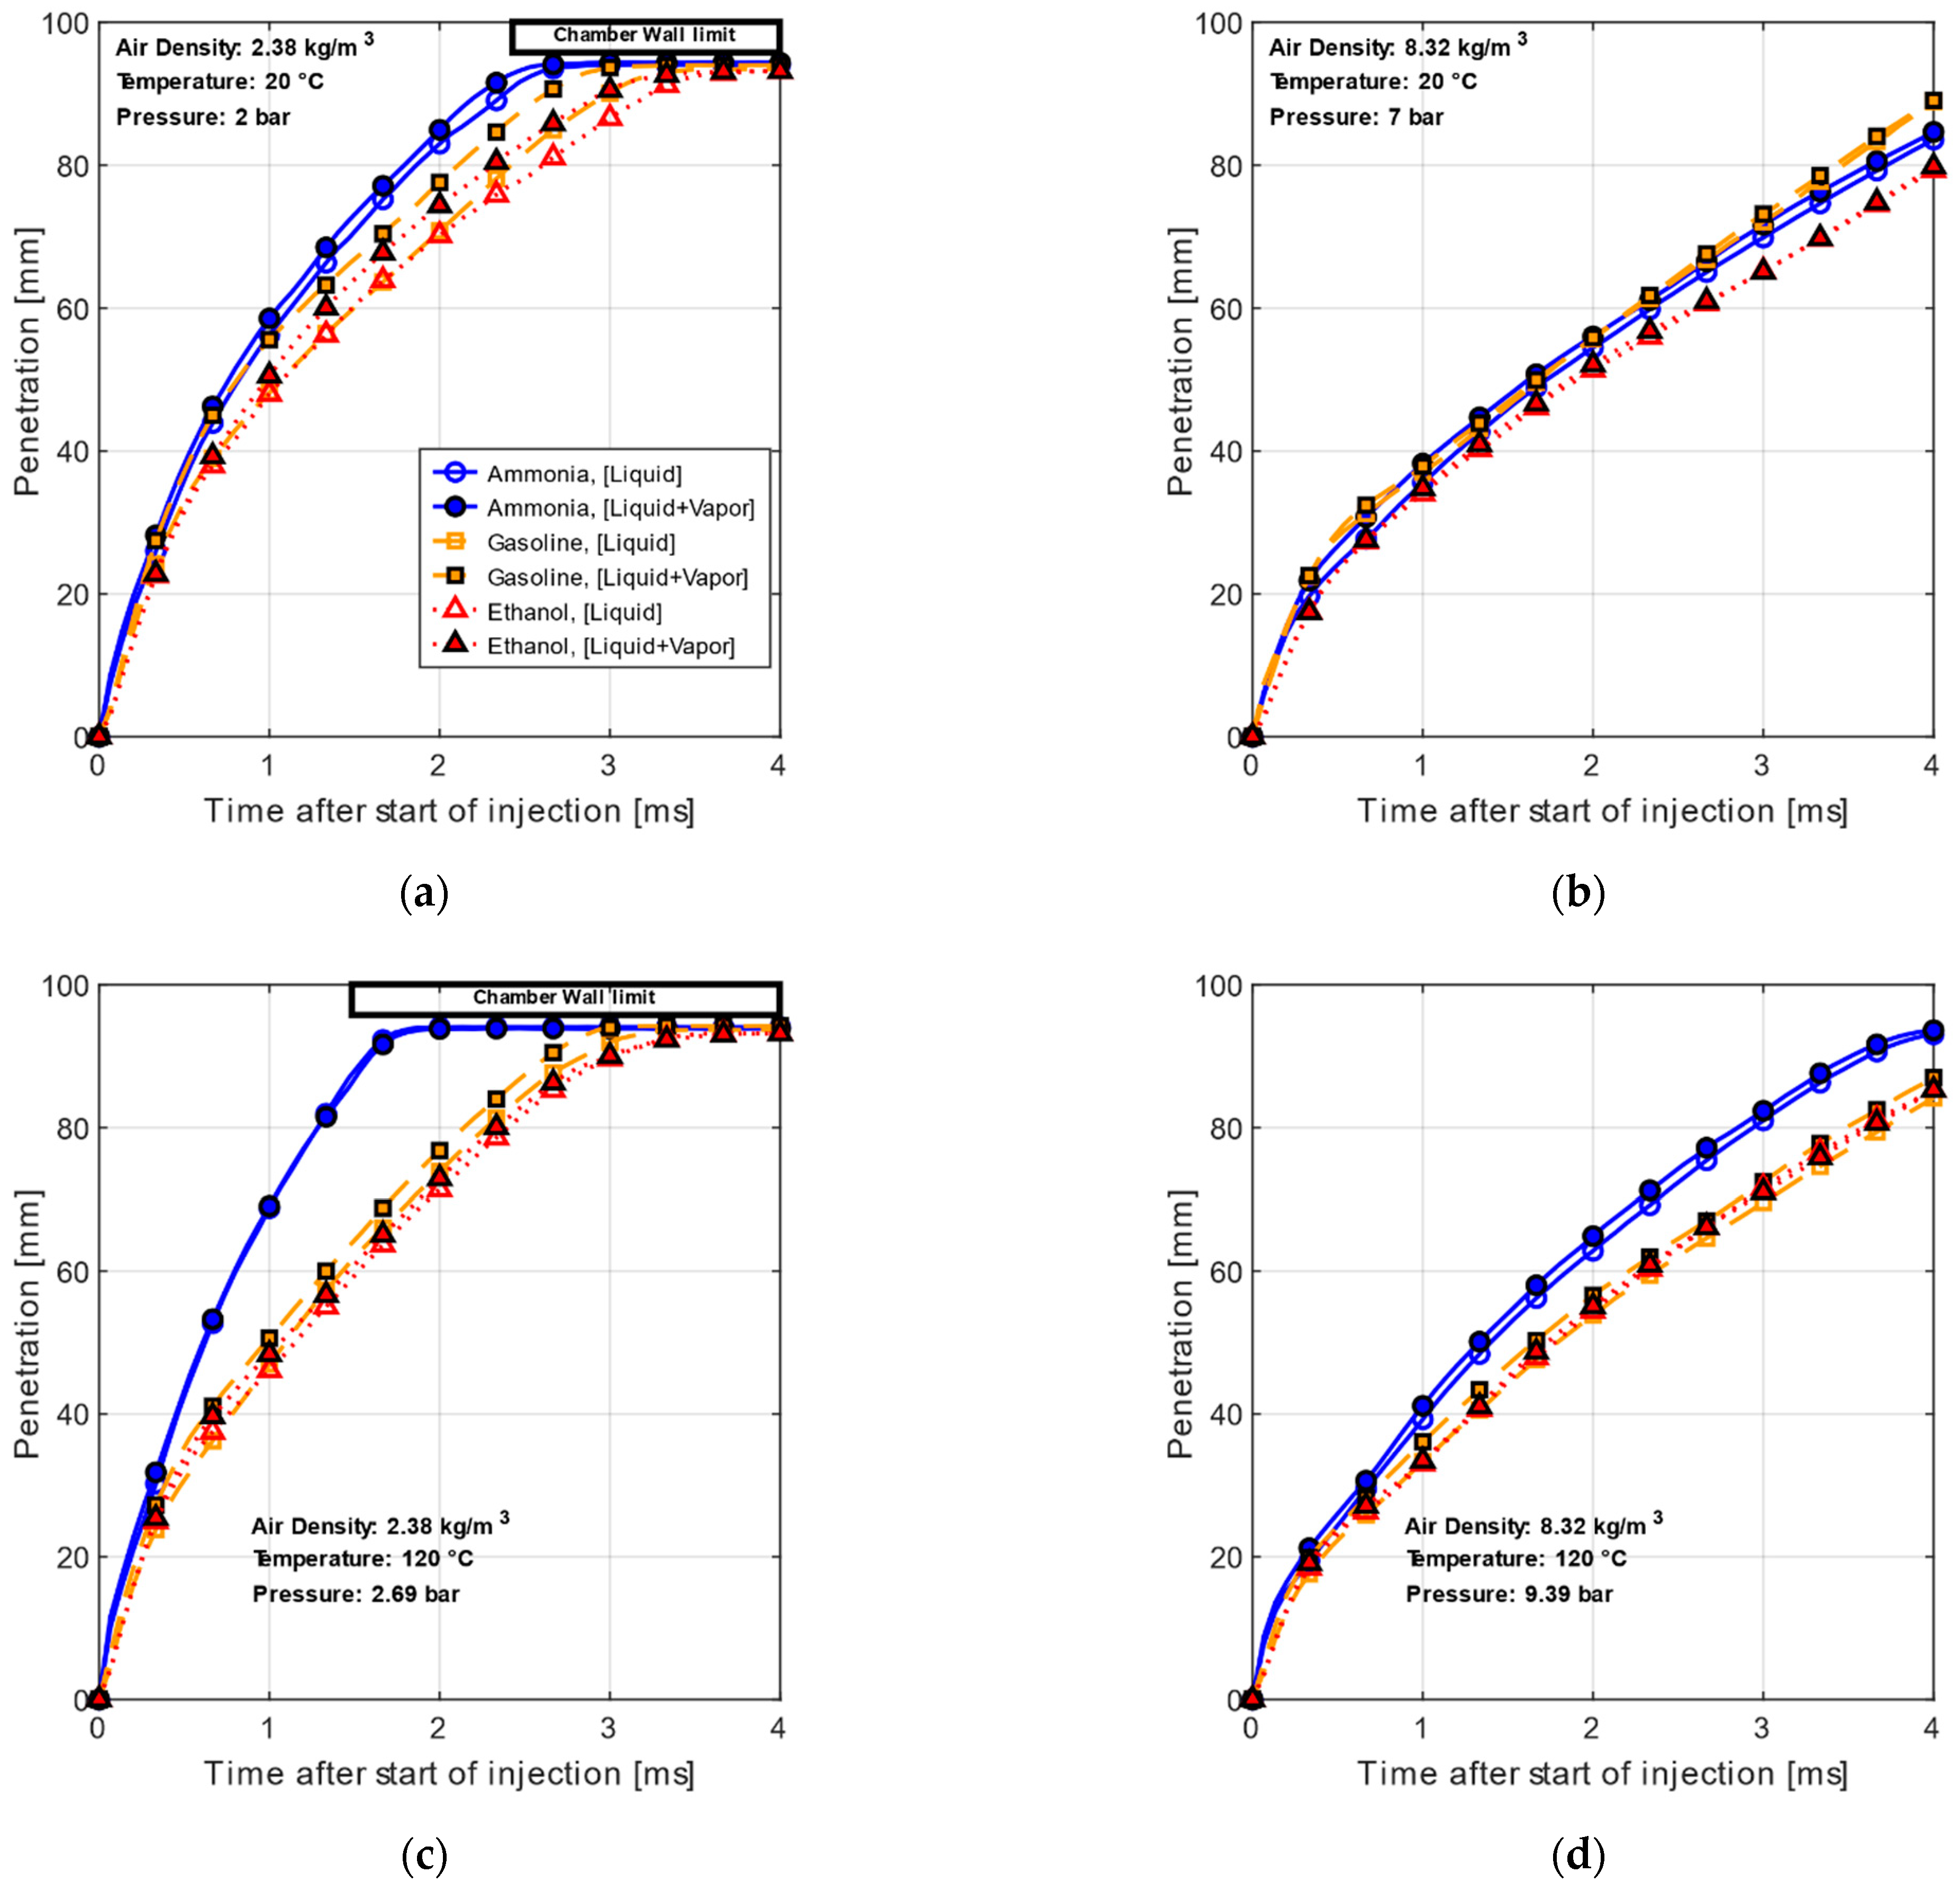
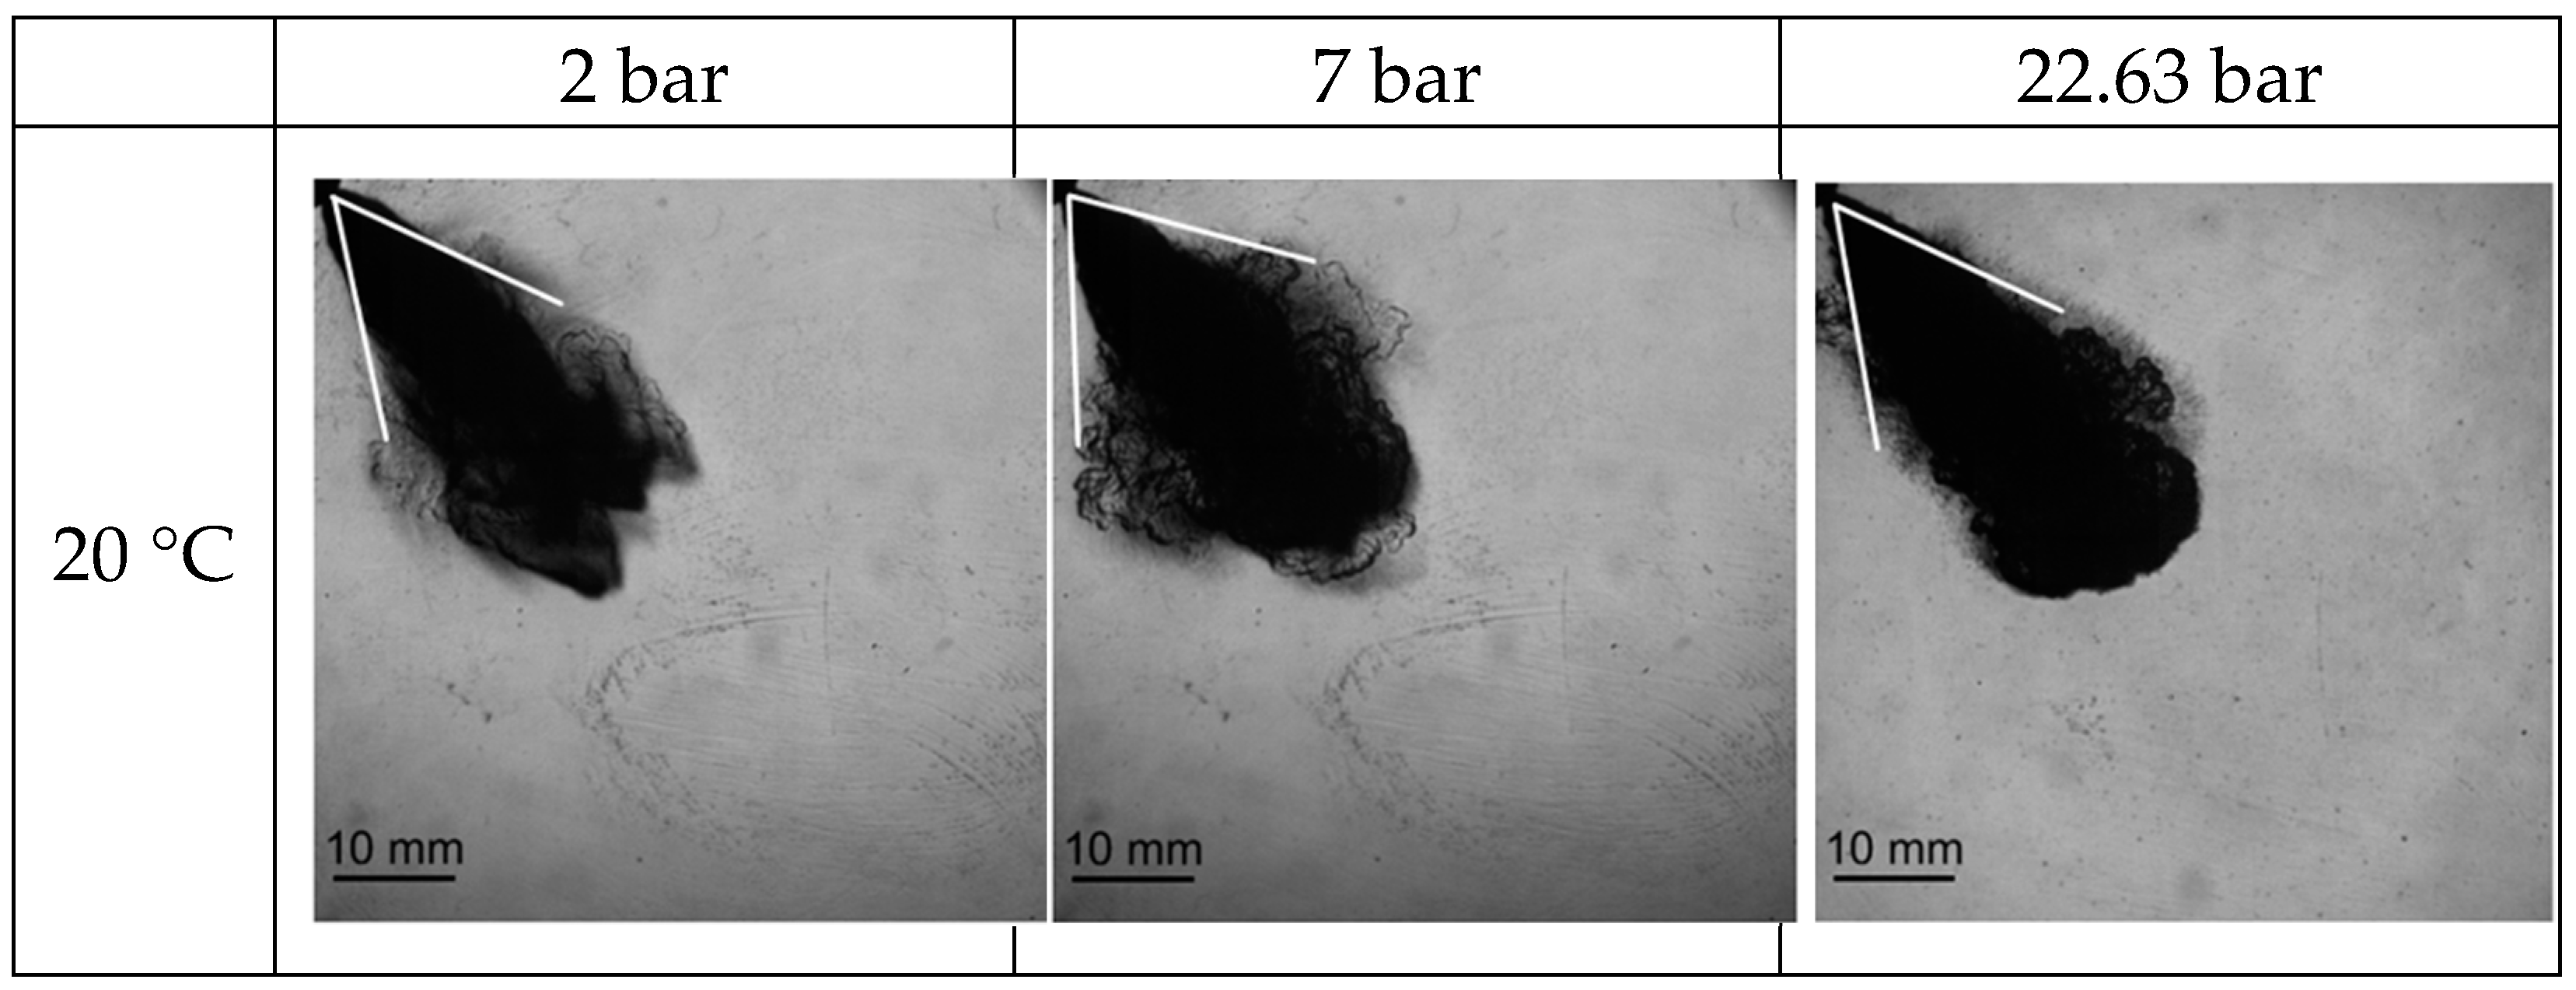
3.1. Comparison of Gasoline, Ethanol, and Ammonia Sprays for Liquid and Liquid + Vapor Phase
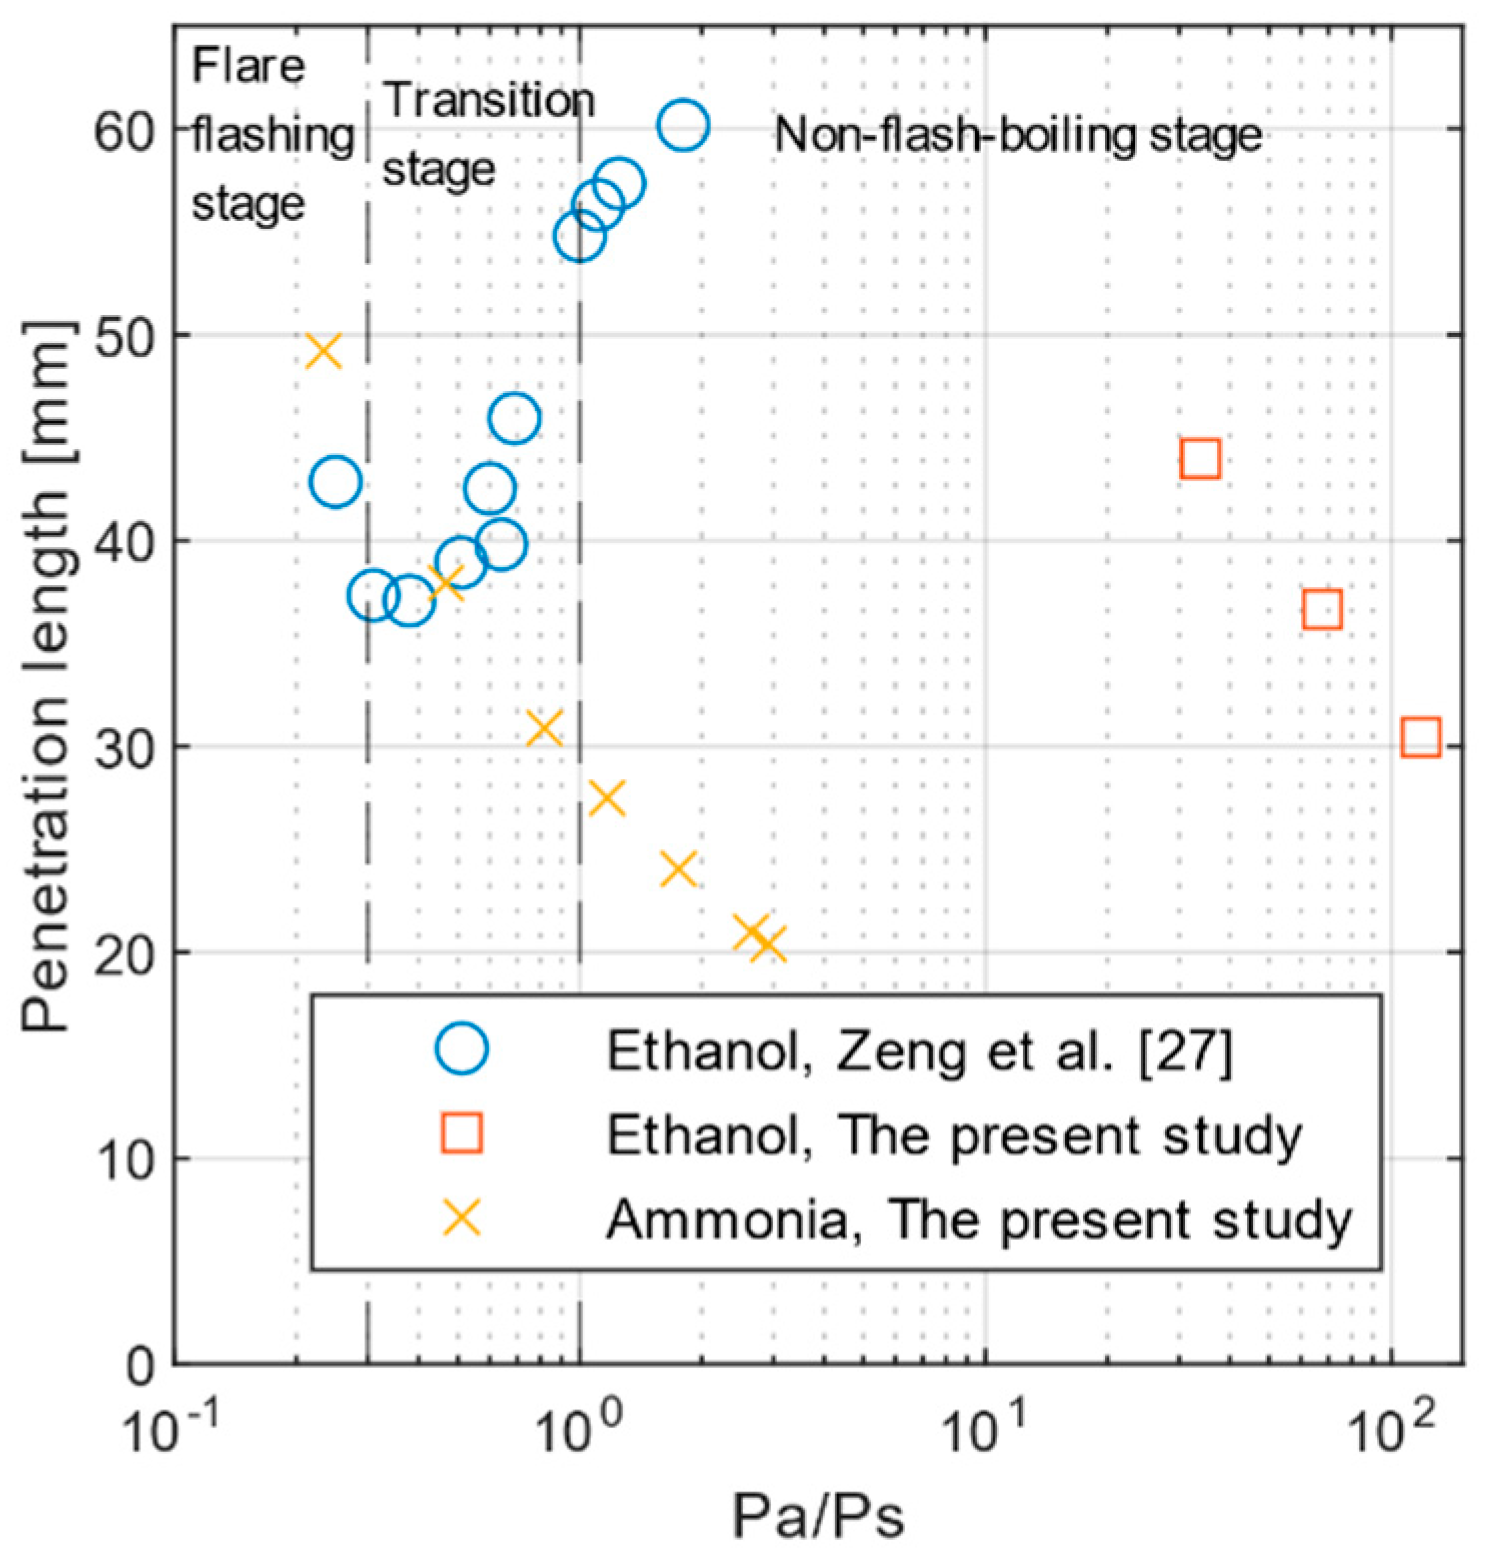
3.1.1. Penetration Length
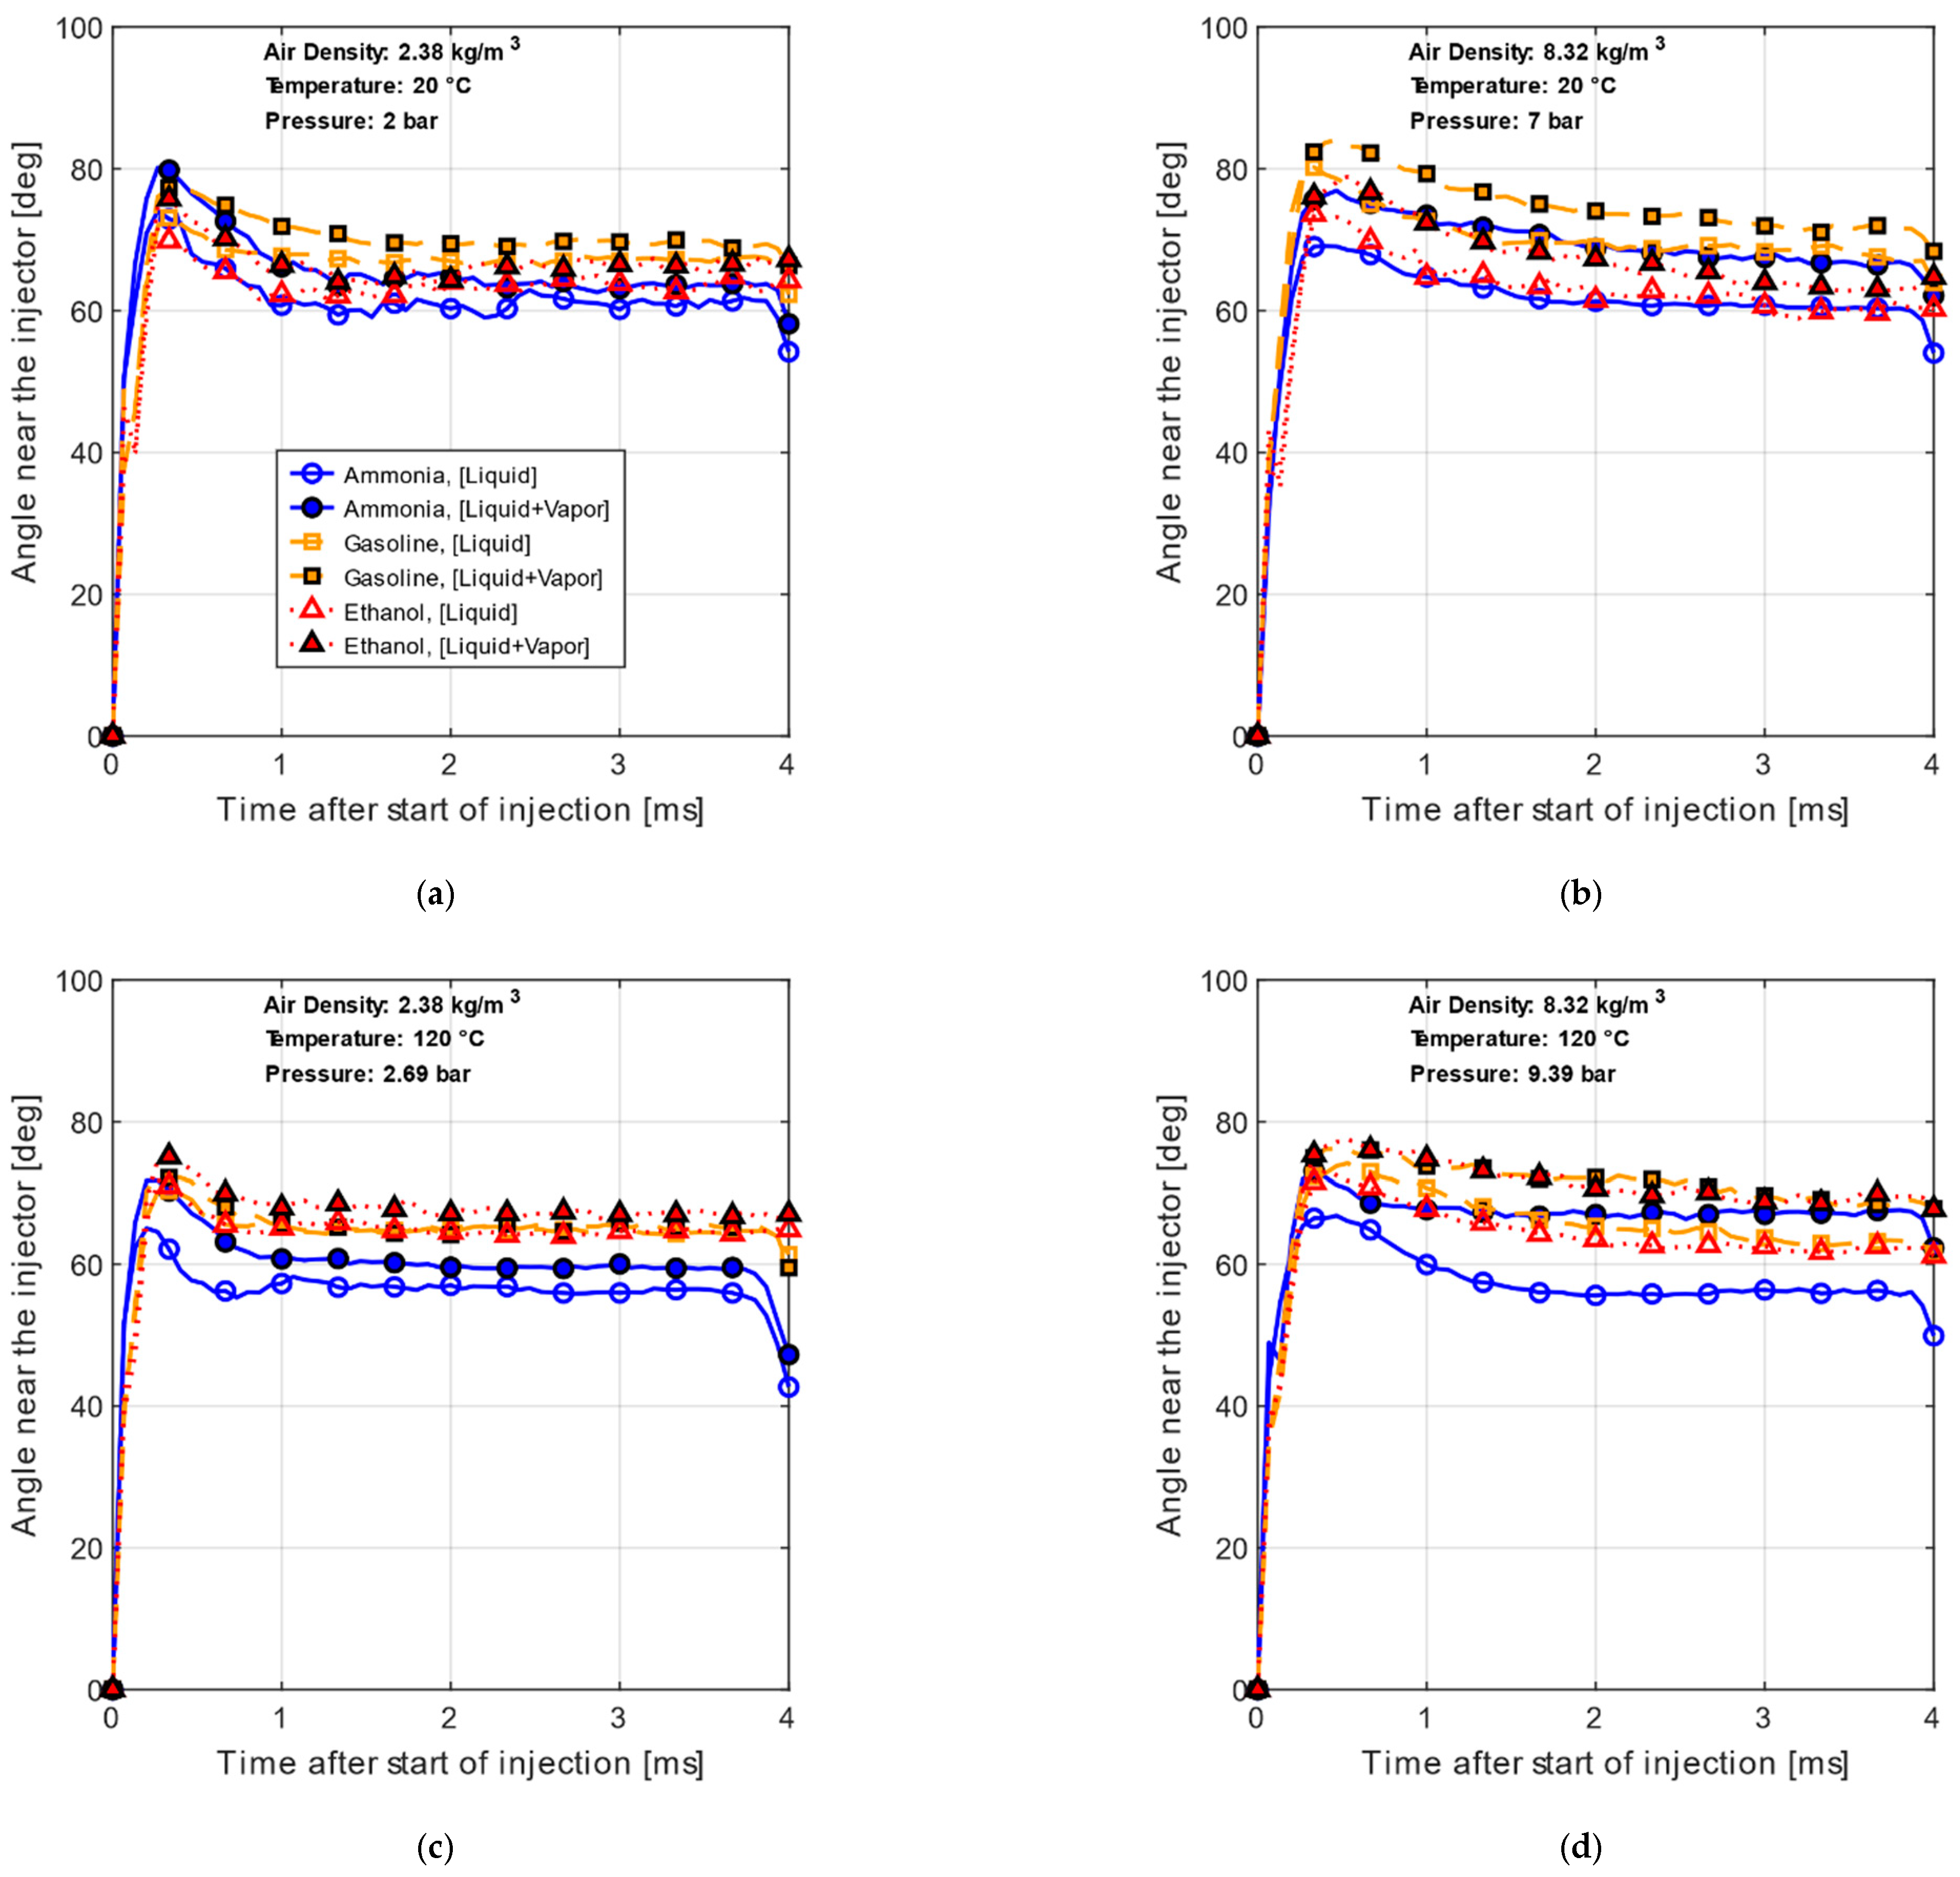
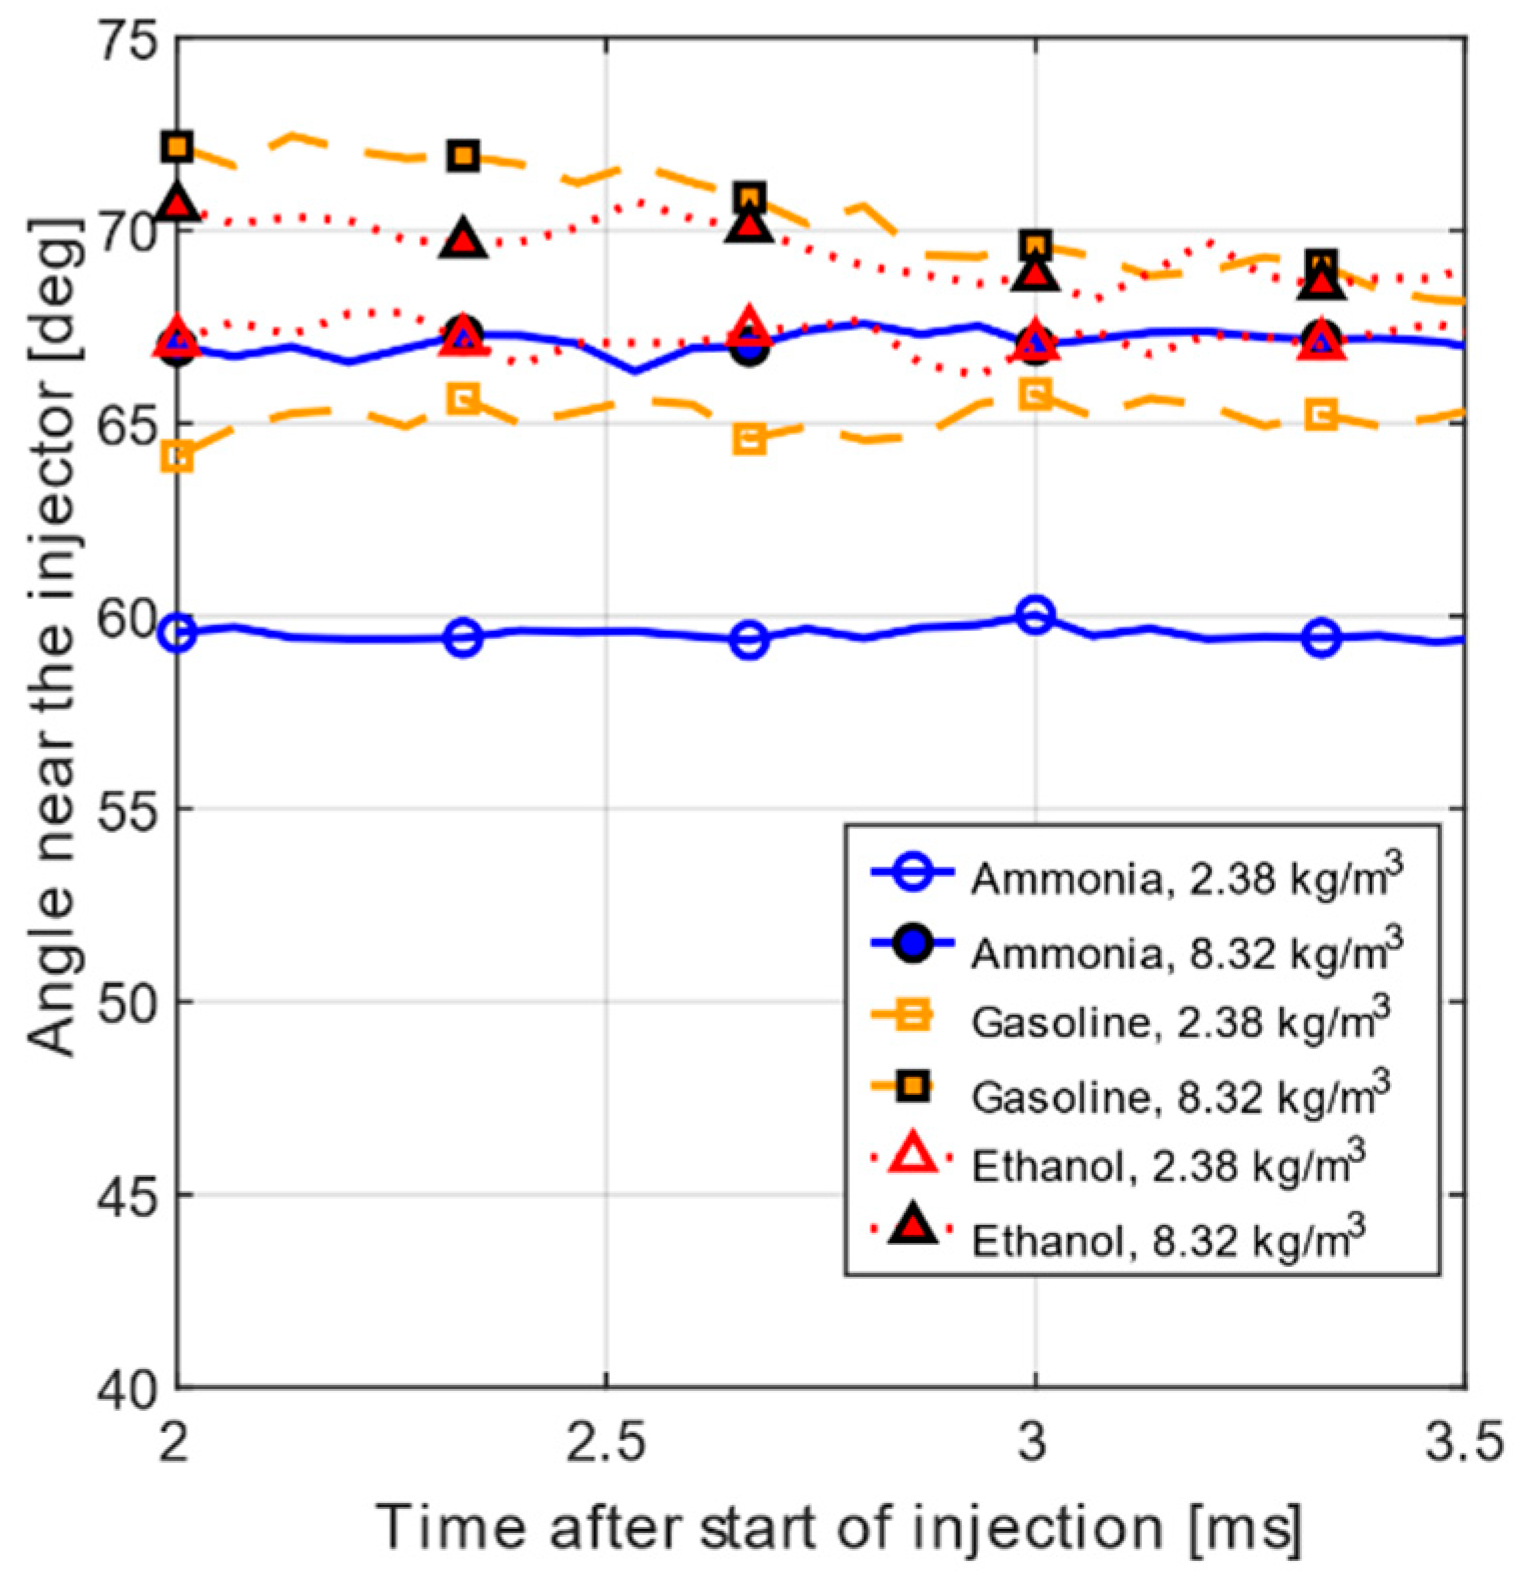
3.1.2. Evolution of Spray Angles
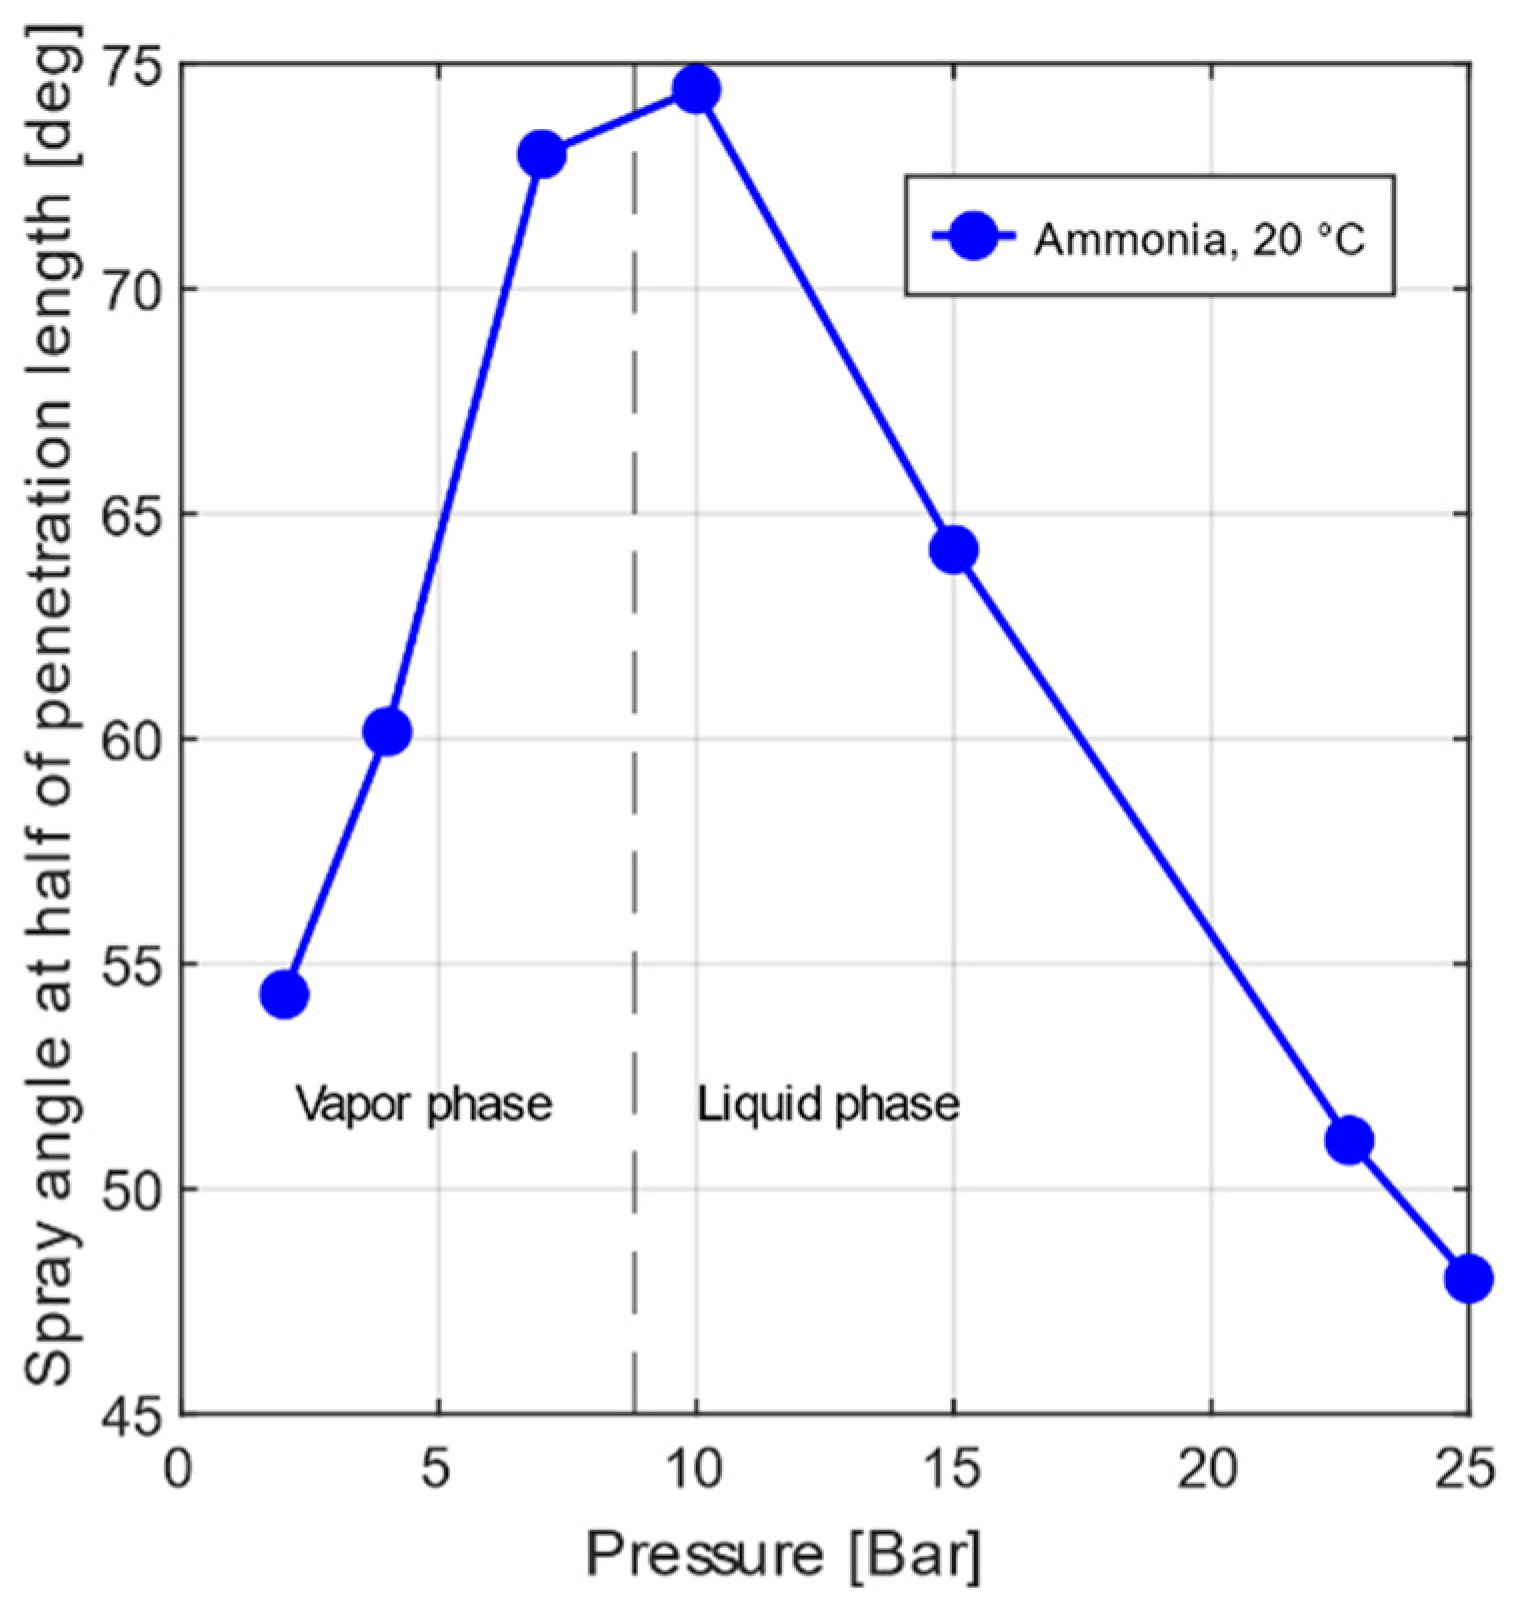
3.2. Effect of Flash Boiling on Ammonia Fuel
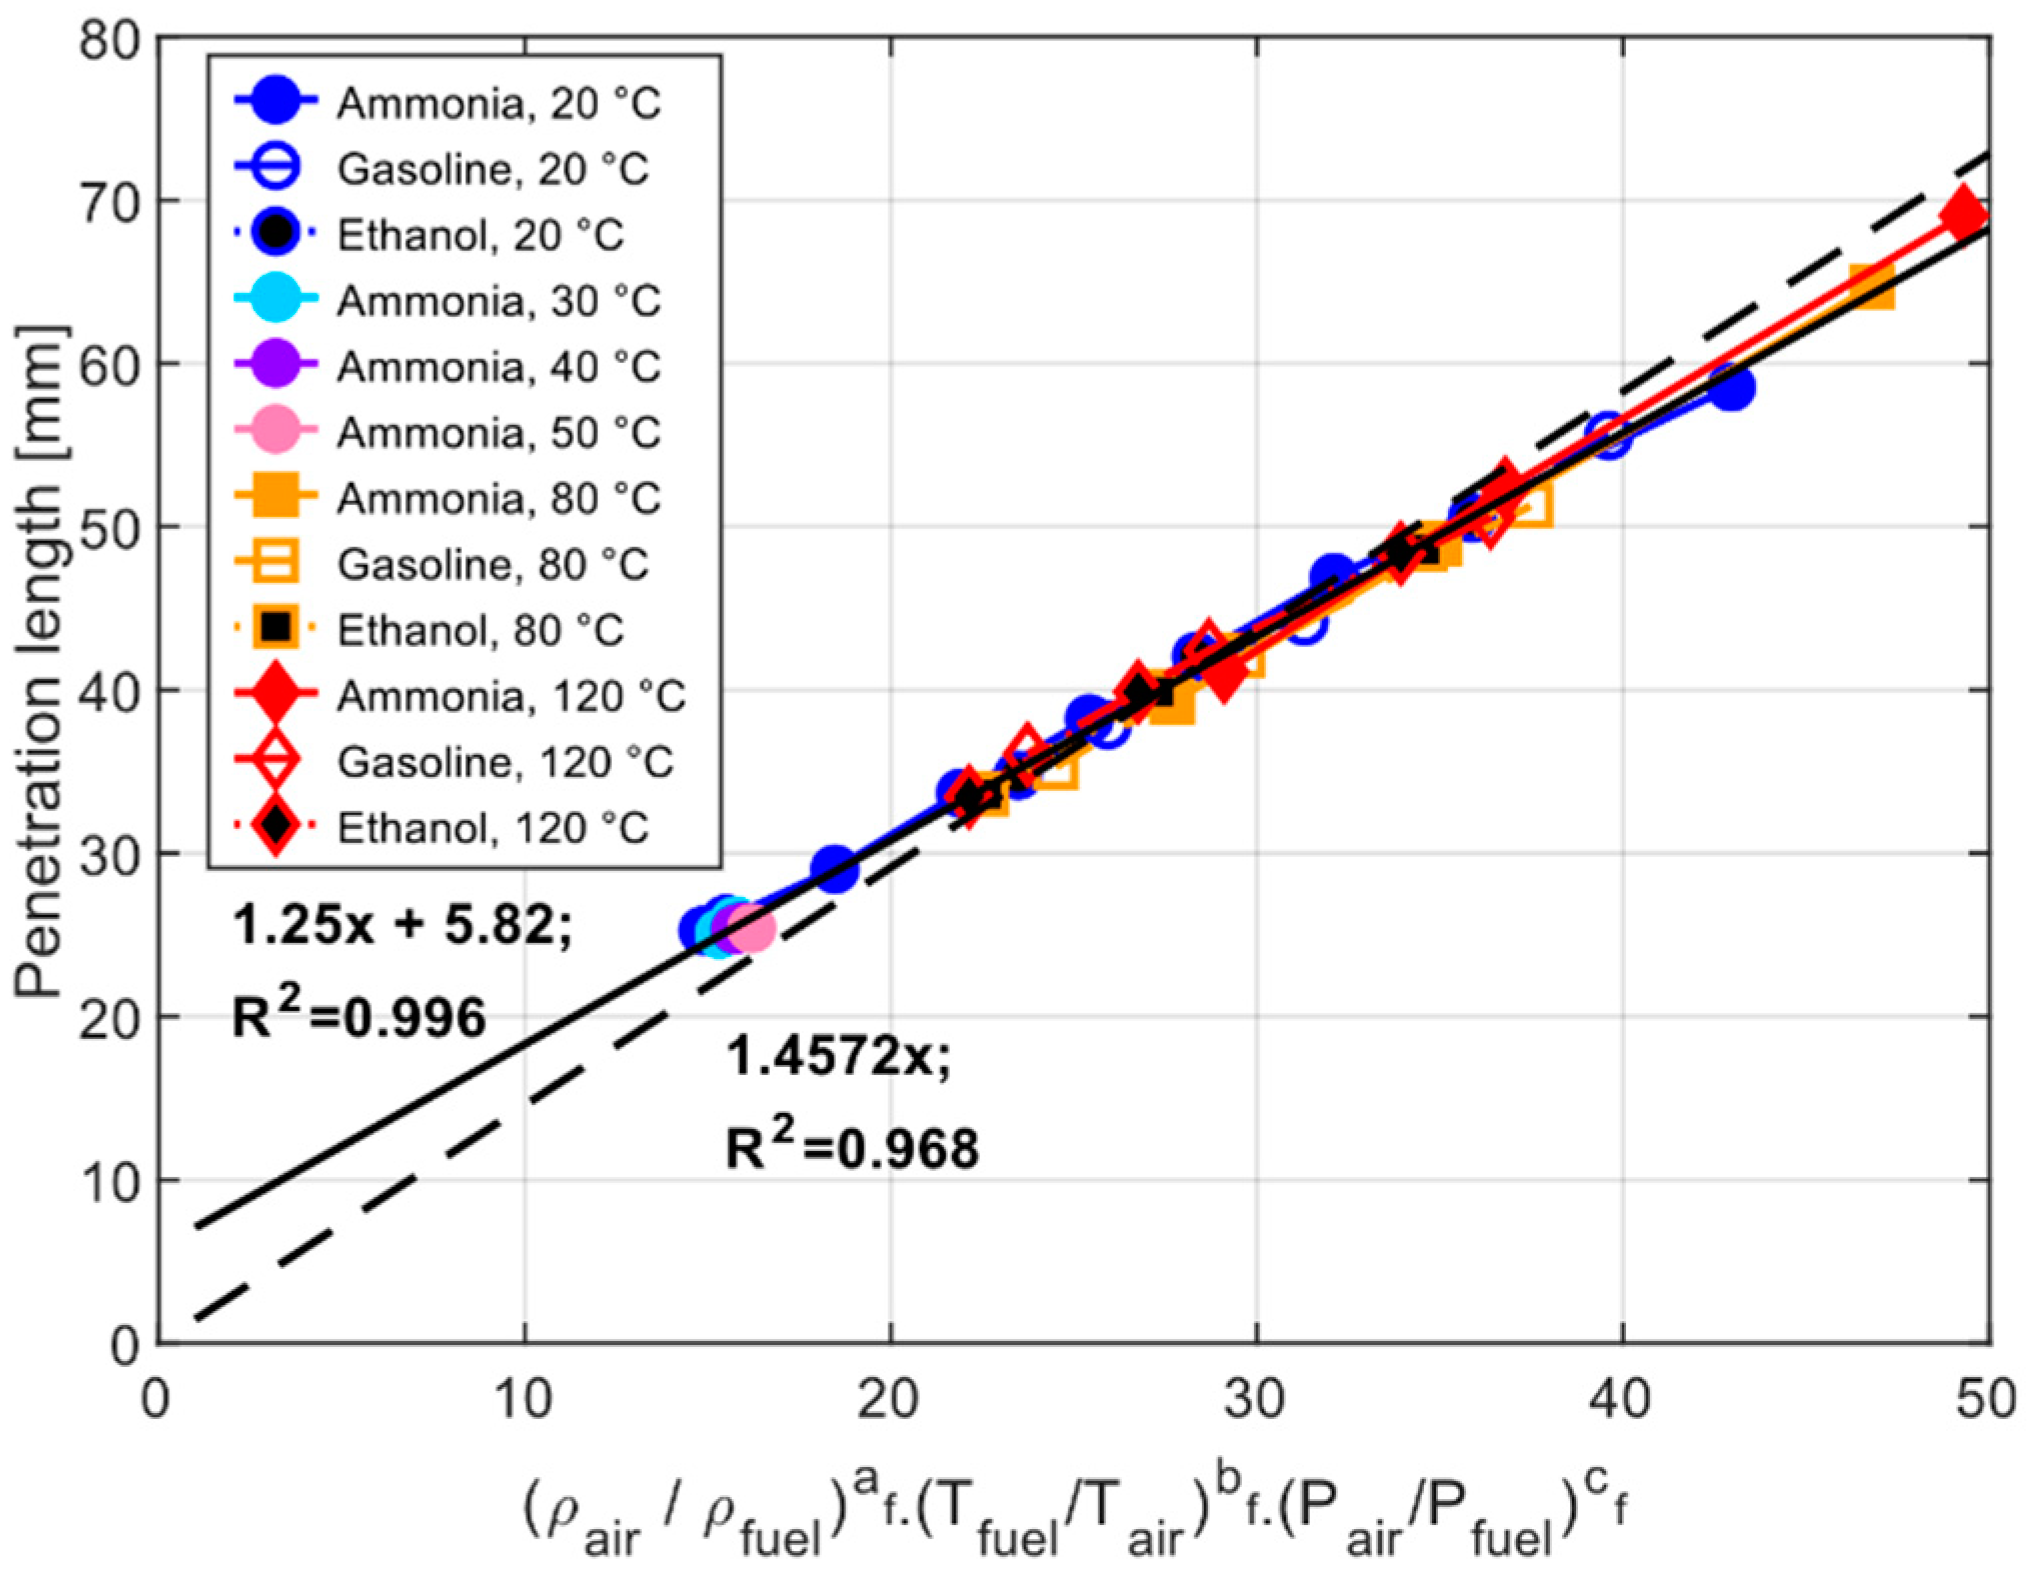
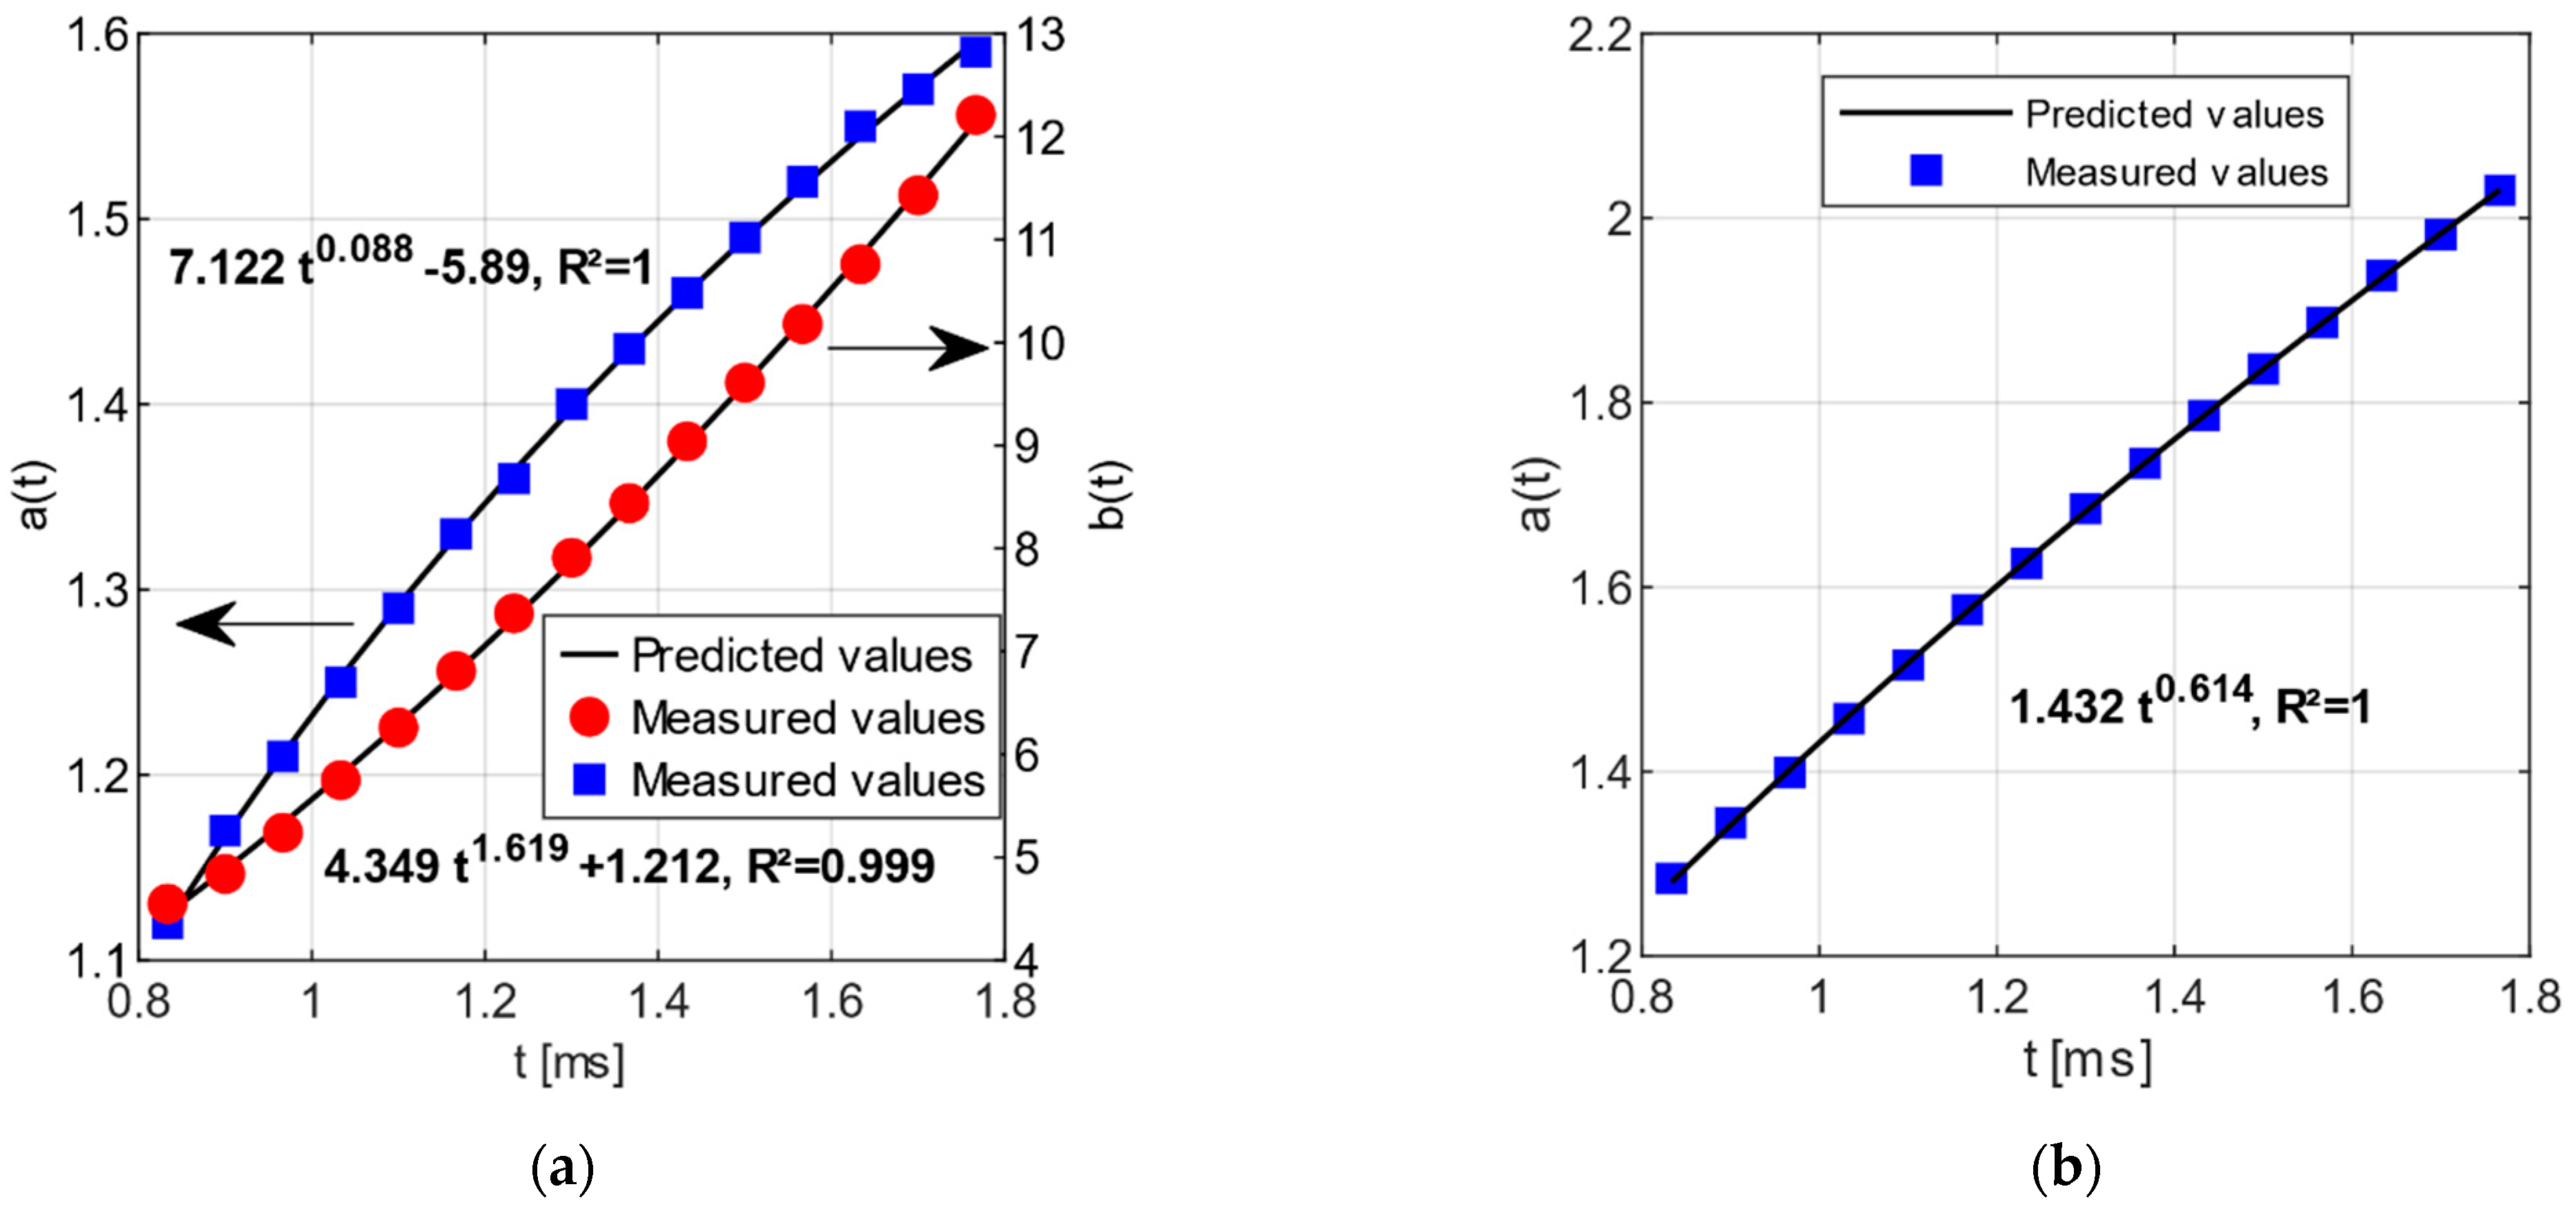
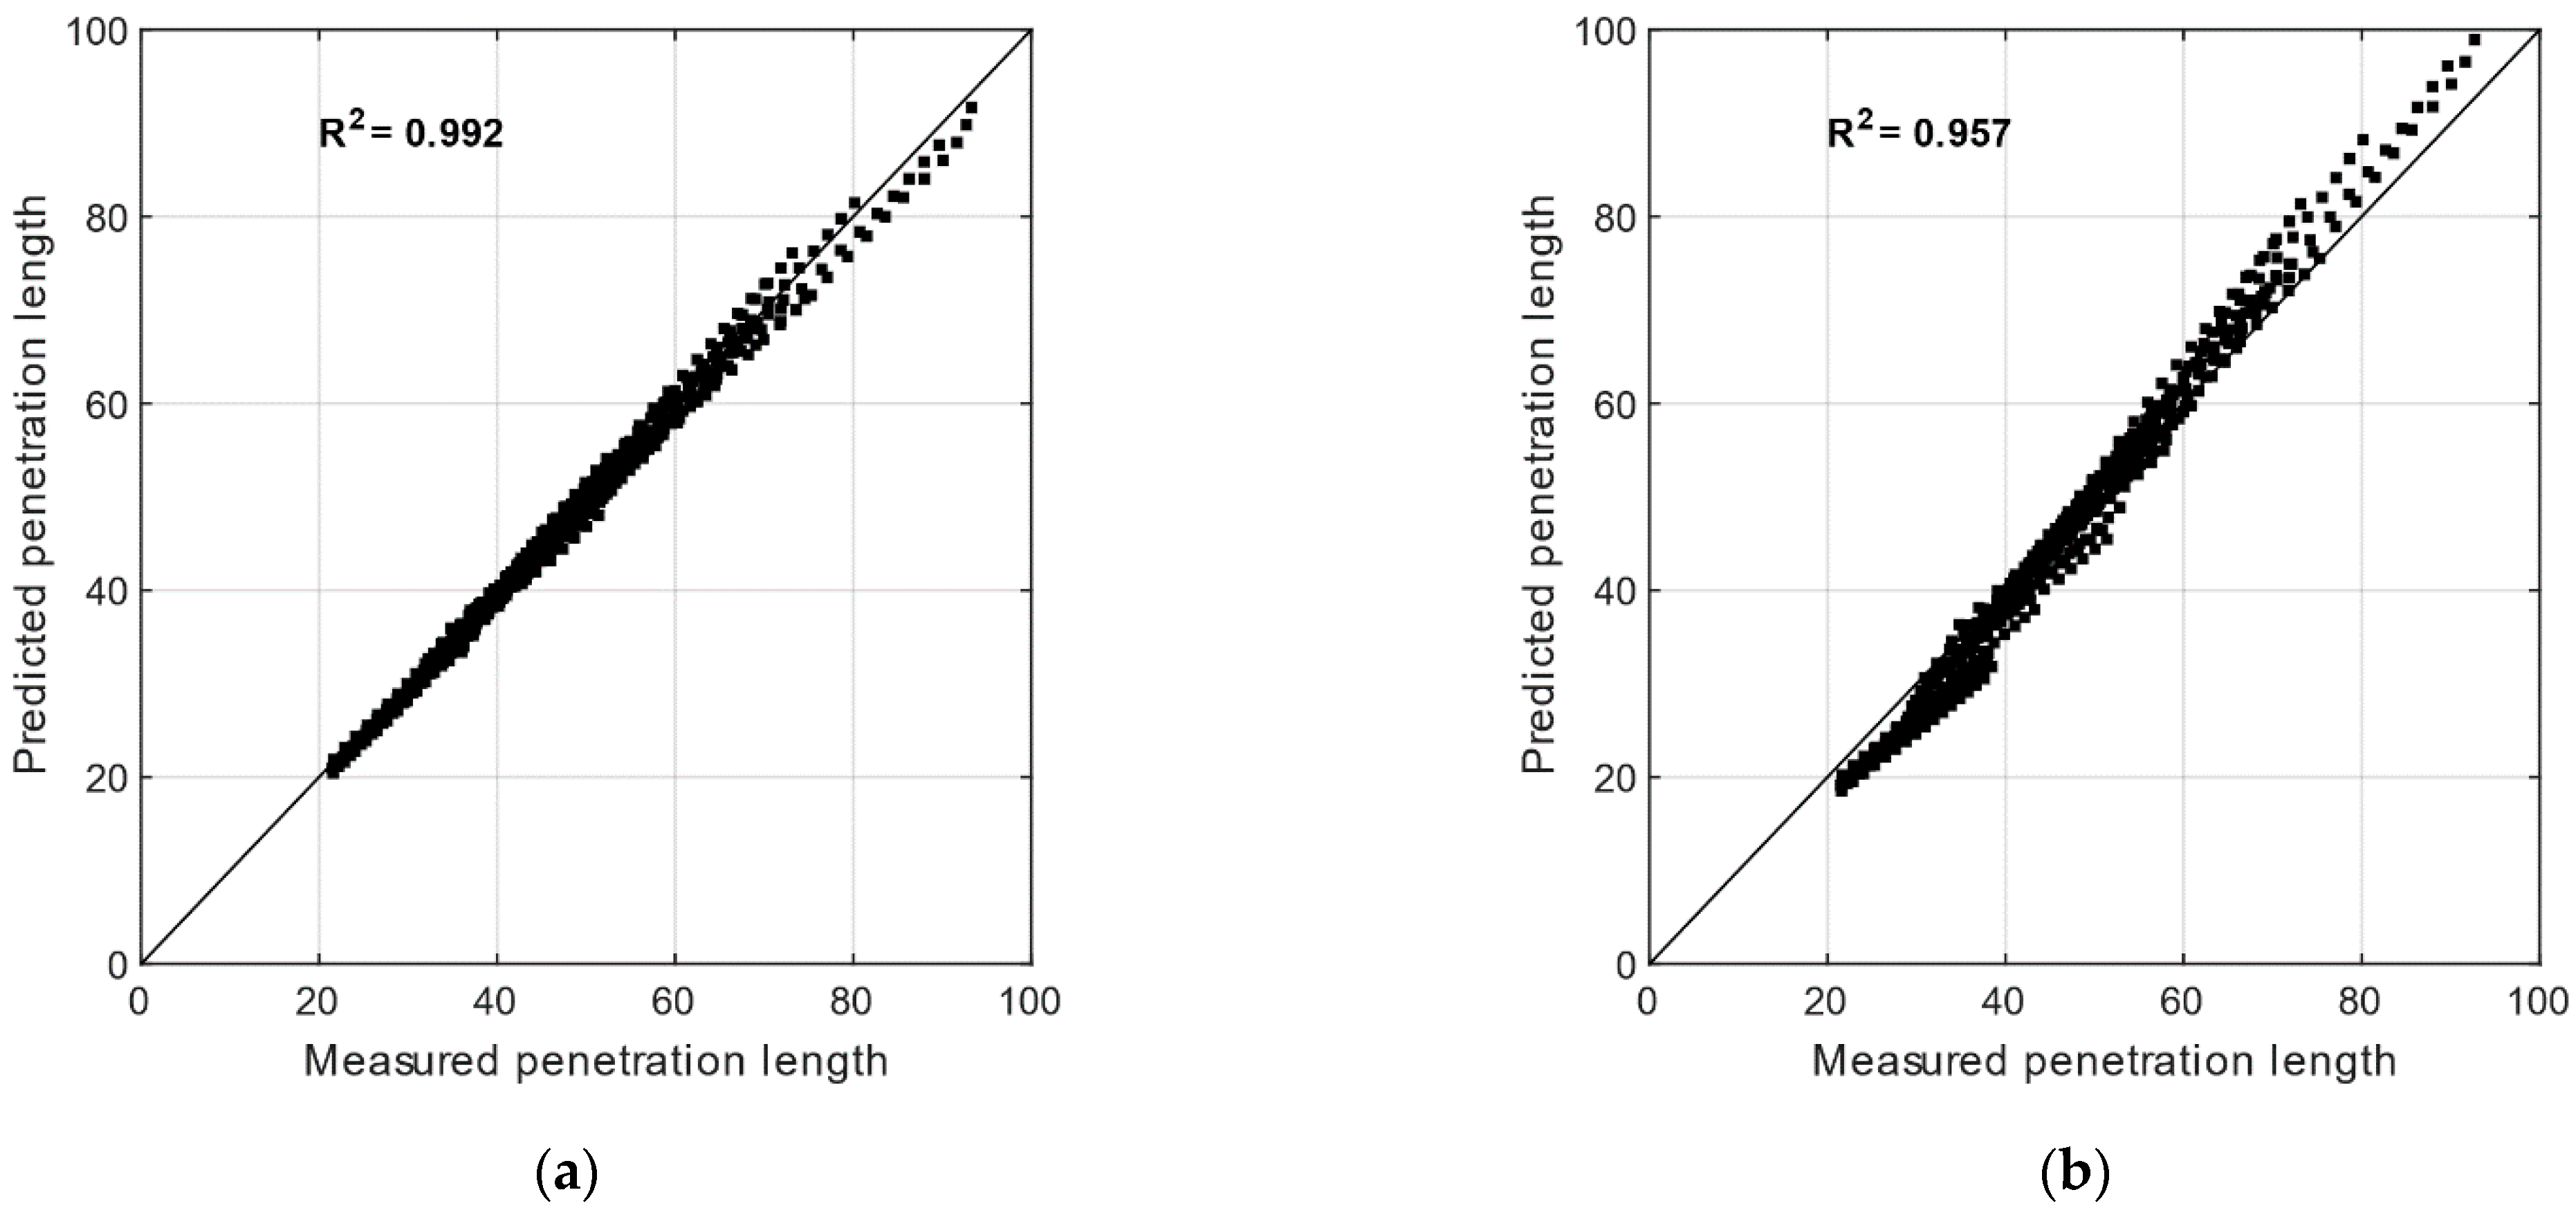
3.3. Improvement of Semi-Empirical Correlation for Penetration Length as a Function of Physical Parameters
4. Conclusions
- The geometry of ammonia spray differs from that of gasoline and ethanol, it is longer and thinner under most conditions than the sprays of the current fuels studied. It evolves differently with temperature and changes in air density; overall, gasoline and ethanol have the same characteristics.
- The spray angle at half the penetration length is maximum at the saturation pressure for ammonia.
- A new correlation of penetration length was validated for ammonia, gasoline, and ethanol and for temperatures between 20 °C to 120 °C, back pressures between 2 bar to 9.39 bar for ethanol and gasoline and up to 25 bar for ammonia, an injection pressure of 120 bar and an injector of 7 holes. Their temperature and air density sensitivities were explored and show that ammonia is more sensitive for both parameters than the other fuels.
Author Contributions
Funding
Acknowledgments
Conflicts of Interest
References
- United Nation. The Paris Agreement. Available online: http://unfccc.int/files/essential_background/convention/application/pdf/english_paris_agreement.pdf (accessed on 19 January 2021).
- Sacramento, E.M.; Carvalho, P.; Lima, L.C.; Veziroglu, T. Feasibility study for the transition towards a hydrogen economy: A case study in Brazil. Energy Policy 2013, 62, 3–9. [Google Scholar] [CrossRef]
- Li, Y.; Bi, M.; Li, B.; Zhou, Y.; Huang, L.; Gao, W. Explosion hazard evaluation of renewable hydrogen/ammonia/air fuels. Energy 2018, 159, 252–263. [Google Scholar] [CrossRef]
- Dimitriou, P.; Javaid, R. A review of ammonia as a compression ignition engine fuel. Int. J. Hydrogen Energy 2020, 45, 7098–7118. [Google Scholar] [CrossRef]
- Rehbein, M.C.; Meier, C.; Eilts, P.; Scholl, S. Mixtures of Ammonia and Organic Solvents as Alternative Fuel for Internal Combustion Engines. Energy Fuels 2019, 33, 10331–10342. [Google Scholar] [CrossRef]
- Kobayashi, H.; Hayakawa, A.; Somarathne, K.D.K.A.; Okafor, E.C. Science and technology of ammonia combustion. Proc. Combust. Inst. 2019, 37, 109–133. [Google Scholar] [CrossRef]
- Mounaim-Rousselle, C.; Brequigny, P. Ammonia as Fuel for Low-Carbon Spark-Ignition Engines of Tomorrow’s Passenger Cars. Front. Mech. Eng. 2020, 6, 70. [Google Scholar] [CrossRef]
- Lhuillier, C.; Brequigny, P.; Contino, F.; Mounaïm-Rousselle, C. Experimental study on ammonia/hydrogen/air combustion in spark ignition engine conditions. Fuel 2020, 269, 117448. [Google Scholar] [CrossRef]
- Okafor, E.C.; Yamashita, H.; Hayakawa, A.; Somarathne, K.D.K.A.; Kudo, T.; Tsujimura, T.; Uchida, M.; Ito, S.; Kobayashi, H. Flame stability and emissions characteristics of liquid ammonia spray co-fired with methane in a single stage swirl combustor. Fuel 2020, 287, 119433. [Google Scholar] [CrossRef]
- Montanaro, A.; Allocca, L. Study of Liquid and Vapor Phases of a GDI Spray. Combust. Sci. Technol. 2019, 191, 1600–1608. [Google Scholar] [CrossRef]
- Xu, M.; Zhang, Y.; Zeng, W.; Zhang, G.; Zhang, M. Flash Boiling: Easy and Better Way to Generate Ideal Sprays than the High Injection Pressure. SAE Int. J. Fuels Lubr. 2013, 6, 137–148. [Google Scholar] [CrossRef]
- Chang, M.; Lee, Z.; Park, S.; Park, S. Characteristics of flash boiling and its effects on spray behavior in gasoline direct injection injectors: A review. Fuel 2020, 271, 117600. [Google Scholar] [CrossRef]
- Naber, J.D.; Siebers, D.L. Effects of gas density and vaporization on penetration and dispersion of diesel sprays. SAE Tech. Pap. 1996, 105, 82–111. [Google Scholar]
- Chang, M.; Park, J.H.; Kim, H.I.; Park, S. Flash boiling macroscopic spray characteristics of multi-hole direct injection injectors with different hole arrangement. Appl. Therm. Eng. 2020, 170, 114969. [Google Scholar] [CrossRef]
- Lacey, J.; Poursadegh, F.; Brear, M.J.; Gordon, R.; Petersen, P.; Lakey, C.; Butcher, B.; Ryan, S. Generalizing the behavior of flash-boiling, plume interaction and spray collapse for multi-hole, direct injection. Fuel 2017, 200, 345–356. [Google Scholar] [CrossRef]
- Wang, L.; Wang, F.; Fang, T. Flash boiling hollow cone spray from a GDI injector under different conditions. Int. J. Multiph. Flow 2019, 118, 50–63. [Google Scholar] [CrossRef]
- Zhang, G.; Xu, M.; Zhang, Y.; Hung, D.L.S. Characteristics of flash boiling fuel sprays from three types of injector for spark ignition direct injection (SIDI) engines. Lect. Notes Electr. Eng. 2013, 189, 443–454. [Google Scholar]
- Chang, M.; Park, S. Spray characteristics of direct injection injectors with different nozzle configurations under flash-boiling conditions. Int. J. Heat Mass Transf. 2020, 159, 120104. [Google Scholar] [CrossRef]
- Bar-Kohany, T.; Levy, M. State of the art review of flash-boiling atomization. At. Sprays 2016, 26, 1259–1305. [Google Scholar] [CrossRef]
- Dernotte, J. Influence des Propriétés Physico-Chimiques des Hydrocarbures sur l’Injection et la Combustion Diesel. Available online: https://hal.archives-ouvertes.fr/tel-00752061/ (accessed on 16 February 2021).
- Nilaphai, O.; Hespel, C.; Chanchaona, S.; Mounaïm-Rousselle, C. Spray and Combustion Characterization of the Alcohol Blends in the High-Pressure High-Temperature Conditions. In Proceedings of the ILASS–Asia 2017, Jeju, Korea, 18–21 October 2017. [Google Scholar]
- Otsu, N. A Threshold Selection Method from Gray-Level Histograms. IEEE Trans. Syst. Man Cybern. 1979, 9, 62–66. [Google Scholar] [CrossRef] [Green Version]
- Huang, Y.; Huang, S.; Huang, R.; Hong, G. Spray and evaporation characteristics of ethanol and gasoline direct injection in non-evaporating, transition and flash-boiling conditions. Energy Convers. Manag. 2016, 108, 68–77. [Google Scholar] [CrossRef] [Green Version]
- Toolbox Website. Ammonia—Vapour Pressure at Gas-Liquid Equilibrium. Available online: https://www.engineeringtoolbox.com/ammonia-pressure-temperatured_361.html (accessed on 11 November 2020).
- Payri, R.; Salvador, F.J.; Martí-Aldaraví, P.; Vaquerizo, D. ECN Spray G external spray visualization and spray collapse description through penetration and morphology analysis. Appl. Therm. Eng. 2017, 112, 304–316. [Google Scholar] [CrossRef]
- Lee, M.Y.; Lee, G.S.; Kim, C.J.; Seo, J.H.; Kim, K.H. Macroscopic and microscopic spray characteristics of diesel and gasoline in a constant volume chamber. Energies 2018, 11, 2056. [Google Scholar] [CrossRef] [Green Version]
- Zeng, W.; Xu, M.; Zhang, G.; Zhang, Y.; Cleary, D.J. Atomization and vaporization for flash-boiling multi-hole sprays with alcohol fuels. Fuel 2012, 95, 287–297. [Google Scholar] [CrossRef]
- Guo, H.; Ding, H.; Li, Y.; Ma, X.; Wang, Z.; Xu, H.; Wang, J. Comparison of spray collapses at elevated ambient pressure and flash boiling conditions using multi-hole gasoline direct injector. Fuel 2017, 199, 125–134. [Google Scholar] [CrossRef]
- Hiroyasu, H.; Arai, M. Structures of Fuel Sprays in Diesel Engines. SAE Tech. Pap. Ser. 1990, 99, 1050–1061. [Google Scholar]
- Du, J.; Mohan, B.; Sim, J.; Fang, T.; Roberts, W.L. Experimental and analytical study on liquid and vapor penetration of high-reactivity gasoline using a high-pressure gasoline multi-hole injector. Appl. Therm. Eng. 2019, 163, 114187. [Google Scholar] [CrossRef] [Green Version]
- Dent, J.C. A basis for the comparison of various experimental methods for studying spray penetration. SAE Tech. Pap. 1971, 80, 1881–1884. [Google Scholar]


| Ambient Temperature (°C) | Ambient Pressure (bar) | Air Density (kg/m3) |
|---|---|---|
| 20 | 2 | 2.38 |
| 4 | 4.76 | |
| 7 | 8.32 | |
| 80 | 2.41 | 2.38 |
| 4.82 | 4.76 | |
| 8.43 | 8.32 | |
| 120 | 2.69 | 2.38 |
| 5.37 | 4.76 | |
| 9.39 | 8.32 |
| Ambient Temperature (°C) | Ambient Pressure (bar) | Air Density (kg/m3) |
|---|---|---|
| 20 | 10 | 11.88 |
| 15 | 17.82 | |
| 22.68 | 26.99 | |
| 30 | 23.45 | |
| 40 | 24.23 | 26.99 |
| 50 | 25 | |
| 20 | 25 | 29.75 |
| 30 | 28.77 | |
| 40 | 27.85 | |
| 50 | 26.99 |
| Fuel | af | bf | cf | af + cf | cf − bf |
|---|---|---|---|---|---|
| Ammonia | −1.41 | 0.53 | 0.99 | −0.42 | 0.46 |
| Gasoline | −1.39 | 1.35 | 1.05 | −0.34 | −0.30 |
| Ethanol | −1.28 | 1.15 | 0.94 | −0.34 | −0.21 |
Publisher’s Note: MDPI stays neutral with regard to jurisdictional claims in published maps and institutional affiliations. |
© 2021 by the authors. Licensee MDPI, Basel, Switzerland. This article is an open access article distributed under the terms and conditions of the Creative Commons Attribution (CC BY) license (https://creativecommons.org/licenses/by/4.0/).
Share and Cite
Pelé, R.; Mounaïm-Rousselle, C.; Bréquigny, P.; Hespel, C.; Bellettre, J. First Study on Ammonia Spray Characteristics with a Current GDI Engine Injector. Fuels 2021, 2, 253-271. https://doi.org/10.3390/fuels2030015
Pelé R, Mounaïm-Rousselle C, Bréquigny P, Hespel C, Bellettre J. First Study on Ammonia Spray Characteristics with a Current GDI Engine Injector. Fuels. 2021; 2(3):253-271. https://doi.org/10.3390/fuels2030015
Chicago/Turabian StylePelé, Ronan, Christine Mounaïm-Rousselle, Pierre Bréquigny, Camille Hespel, and Jérôme Bellettre. 2021. "First Study on Ammonia Spray Characteristics with a Current GDI Engine Injector" Fuels 2, no. 3: 253-271. https://doi.org/10.3390/fuels2030015
APA StylePelé, R., Mounaïm-Rousselle, C., Bréquigny, P., Hespel, C., & Bellettre, J. (2021). First Study on Ammonia Spray Characteristics with a Current GDI Engine Injector. Fuels, 2(3), 253-271. https://doi.org/10.3390/fuels2030015