Article

Extremely Halophilic Biohydrogen Producing Microbial Communities from High-Salinity Soil and Salt Evaporation Pond

by
Dyah Asri Handayani Taroepratjeka
1,*,
Tsuyoshi Imai
2,
Prapaipid Chairattanamanokorn
3 and
Alissara Reungsang
4,5,6
1
Department of Environmental Engineering, Institut Teknologi Nasional Bandung, Jawa Barat 40124, Indonesia
2
Graduate School of Sciences and Technology for Innovation, Yamaguchi University, Yamaguchi 755-8611, Japan
3
Department of Environmental Engineering and Management, Faculty of Environment, Kasetsart University, Bangkok 10900, Thailand
4
Department of Biotechnology, Faculty of Technology, Khon Kaen University, Khon Kaen 40002, Thailand
5
Research Group for Development of Microbial Hydrogen Production Process from Biomass, Khon Kaen University, Khon Kaen 40002, Thailand
6
Academy of Science, Royal Society of Thailand, Bangkok 10300, Thailand
*
Author to whom correspondence should be addressed.
Fuels 2021, 2(2), 241-252; https://doi.org/10.3390/fuels2020014
Submission received: 16 March 2021 / Revised: 23 May 2021 / Accepted: 1 June 2021 / Published: 10 June 2021
(This article belongs to the Special Issue Biomass Conversion to Biofuels)

Abstract

:
Extreme halophiles offer the advantage to save on the costs of sterilization and water for biohydrogen production from lignocellulosic waste after the pretreatment process with their ability to withstand extreme salt concentrations. This study identifies the dominant hydrogen-producing genera and species among the acclimatized, extremely halotolerant microbial communities taken from two salt-damaged soil locations in Khon Kaen and one location from the salt evaporation pond in Samut Sakhon, Thailand. The microbial communities’ V3–V4 regions of 16srRNA were analyzed using high-throughput amplicon sequencing. A total of 345 operational taxonomic units were obtained and the high-throughput sequencing confirmed that Firmicutes was the dominant phyla of the three communities. Halanaerobium fermentans and Halanaerobacter lacunarum were the dominant hydrogen-producing species of the communities. Spatial proximity was not found to be a determining factor for similarities between these extremely halophilic microbial communities. Through the study of the microbial communities, strategies can be developed to increase biohydrogen molar yield.

1. Introduction

As fossil fuel reserves worldwide continue to diminish, research on alternative fuels is becoming more critical than ever. One promising alternative fuel is hydrogen, which has the highest 141 MJ/kg heating value and near-zero end-use emissions [1]. While hydrogen can be produced through electrolysis, gasification, thermochemical cycles, photoelectrolysis and reforming [2], hydrogen production by dark fermentation offers the advantage of lower energy processes compared to other biotechnological methods.
Mixed cultures have several advantages over pure cultures for biohydrogen production through dark fermentation. They do not need aseptic conditions and can adjust to more varieties of raw materials [2]. Mixed cultures offer synergistic metabolic flexibility to eliminate feedback inhibition and increased utilization of substrates, compared to pure cultures for hydrogen production [3]. The raw materials for the substrate include lignocellulosic biomass, which is available as highly generated waste in many industries [4]. However, before the fermentation process, lignocellulosic biomass must be pretreated due to the rigid structures of cellulose, hemicellulose and lignin, where the fermentable sugars are ingrained. Chemical pretreatment methods often employ strong acids or alkalis, so the fermentable sugars in lignocellulose become readily available for fermentation. The pretreated lignocellulose biomass must be usually neutralized and washed prior to fermentation, as most of the dark fermentation bacteria prefer neutral pH and could not tolerate a high salt concentration.
By using halophilic bacteria in dark fermentation, water consumption to dilute the acid or alkali pretreated lignocellulosic biomass can be reduced, as the bacteria can withstand extreme salt conditions of more than 15% NaCl. Employing extremely halophilic bacteria mixed cultures to produce biohydrogen also offers more advantages, as salinity levels above 15% can limit sulfate reduction from hydrogen and methanogenesis [5]; thus, less hydrogen is consumed by methanogenic archaea and bacteria during the fermentation process and sterilization costs could also be significantly reduced.
While biohydrogen production by moderately halophilic microbial communities or species have been reported in several studies, such as the production of biohydrogen from glycerol by Halanaerobium saccharolyticum at the salt concentration of 150 g/L [6], by Vibrionaceae mixed culture at the salt concentration of 75 g/L NaCl [7] and by H. hydrogeniformans at 7% (wt/vol) NaCl [8], very few reports can be found on biohydrogen production by the extremely halophilic microbial community. The extreme halophiles live at 20–30% (3.4–5.1 M) NaCl, compared to moderate halophiles, which grow most rapidly at 5–20% (0.85–3.4 M) NaCl [9]. Studies on microbial communities in biohydrogen production are mostly focused on microbial dynamic at different stages of the fermentation process in a reactor [10,11,12] and, to date, studies on extremely halophilic biohydrogen producing microbial communities have never been reported.
Many of these studies on microbial communities were conducted with polymerase chain reaction-denaturing gradient gel electrophoresis (DGGE). While PCR-DGGE can provide qualitative information on the microbial community, it has the limitation of separating relatively short DNA fragments (~500 bp) [13] and minor constituents of the community may not be identified [14]. High-throughput sequencing offers the solution to this problem, as the method provides quantitative analysis and higher coverage, so the minor constituents of the community can be identified.
Following the previously reported biohydrogen production experiments through dark fermentation [15,16], in this study, the acclimatized, extremely halotolerant communities used in the experiments were analyzed to compare and identify the dominant hydrogen-producing species via high-throughput sequencing. The study aims to provide a better understanding of the microbial communities, so that the optimum biohydrogen molar yield can be produced in high salinity conditions.

2. Materials and Methods

2.1. Sample Collection

The microbial communities originated from the soil from two locations with high-salinity soil in Khon Kaen and one site from the salt evaporation pond in Samut Sakhon, Thailand. After removing the surface layer, the soil was collected in polyethylene bags and kept in cool condition. Approximately 100 g of the soil from each location were added to enrichment media in 500 mL main cultivation vials at 26% (w/w) NaCl condition and were periodically maintained for three years with the method described elsewhere [15], before the samples from individual vials were taken for high-throughput sequencing. Soil for cultivation vials A1 and A2 was collected from salt-damaged soil in Khon Kaen. While soil for cultivation vial A1 was taken from the shore part, soil for cultivation vial A2 was taken from approximately 10 m apart, into drier land. Soil for cultivation vial B was collected from the commercial salt evaporation pond of Samut Sakhon.

2.2. DNA Extraction and Amplicon Sequencing

Extraction of total genome DNA of the samples was performed using the sodium dodecyl sulfate (SDS) method. The extracted DNA purity and concentration were observed on 1% agarose gels. The DNA was then diluted with sterile water to reach the concentration of 1 ng/L. Amplicon sequencing for samples taken from cultivation vials A1, A2 and B was performed on IonS5™XL (Thermo Fisher Scientific, Waltham, MA, USA), at Novogene Company Limited, Hong Kong. PCR amplification of V3–V4 regions of the 16s rRNA was performed using primers 341F and the 806 R. Phusion High-Fidelity PCR Master Mix (New England Biolabs, Ipswich, MA, USA) was used to carry out all the PCR reactions.

2.3. Data Analysis

To collect clean reads with high quality from raw sequencing data, specific filtering conditions with Quantitative Insights Into Microbial Ecology (QIIME) quality-controlled process was employed. The reads were then compared against the Genome Online Database (GOLD) using the UCHIME [17] algorithm to identify chimera sequences. After the removal of chimera sequences, effective reads were attained. These reads were then analyzed by the UPARSE software and sequences with more than 97% similarity were then allotted to the corresponding operational taxonomic units (OTUs).
For each OTU, a specimen sequence was evaluated for further annotation and the mothur software [18] was employed to match up each of the sequences with the SSU rRNA database of the SILVA database [19]. The threshold 0.8–1 was applied for annotation of the genera at each taxonomic rank. MUSCLE [20] was used to compare all the OTUs phylogenetic relationships of the representative sequences. The OTUs abundance information was normalized by a standard of sequence number corresponding to the sample having the fewest sequences. Theses output normalized data were used to analyze the alpha diversity indices, which were determined with QIIME (Version 1.7.0). Krona [21] was used to visualize the genera annotations. Since the previous annotations were limited to genera, the sequences of the most abundant OTUs were then finally compared, using Basic Local Alignment Search Tool (BLAST) analysis, with highly similar sequences in the National Center for Biotechnology Information (NCBI)’s GenBank [22], to understand better the species related to these OTUs.
Alpha diversity indices were calculated with QIIME (Version 1.7.0). The Simpson community diversity index was calculated with the following equation:
D s = 1 p i 2
where pi is the proportion of the community provided by OTU i.
The Shannon–Wiener community diversity index was calculated with the following equation:
H = i = 1 s ( p i l o g 2 p i )
where s is the number of OTUs.
The abundance-based coverage estimator (ACE) community richness index is defined as
S a c e = S a b u n d + S r a r e C a c e + F 1 C a c e I 3 a c e 2
where Sabund is the number of abundant OTUs with more than rare threshold individuals, when the entire of the samples are combined. Srare is the number of rare OTUs having equal or less than rare threshold individuals of the combined samples. Cace is the estimator of sample abundance coverage, F1 is the singletons’ frequency and γ2ace is the rare OTUs estimated coefficient of variation. Assuming the rare threshold is 10 [23], the estimated coefficient of variation is determined by
γ a c e 2 = m a x [ S r a r e C a c e i = 1 10 i ( i 1 ) F i ( N r a r e ) ( N r a r e 1 ) 1.0 ]
The Chao1 bias-corrected community richness index is calculated with the following equation:
c h a o 1 = S o b s + F 1 ( F 1 1 ) 2 ( F 2 + 1 )
The Good’s coverage estimator was used to measure the index of sequencing depth and is defined by
1 F 1 N
where N is the sum of abundances for all OTUs and F1 is the number of singleton-OTUs.
Faith’s phylogenetic diversity (PD) metric [24] was used to calculate the phylogenetic diversity index.
Rarefaction curves were constructed by taking a certain random amount of sequencing data from the samples and the number of species they typify. The calculation of unweighted and weighted UniFrac distance for beta diversity analysis was performed by QIIME software (Version 2.15.3).

3. Results

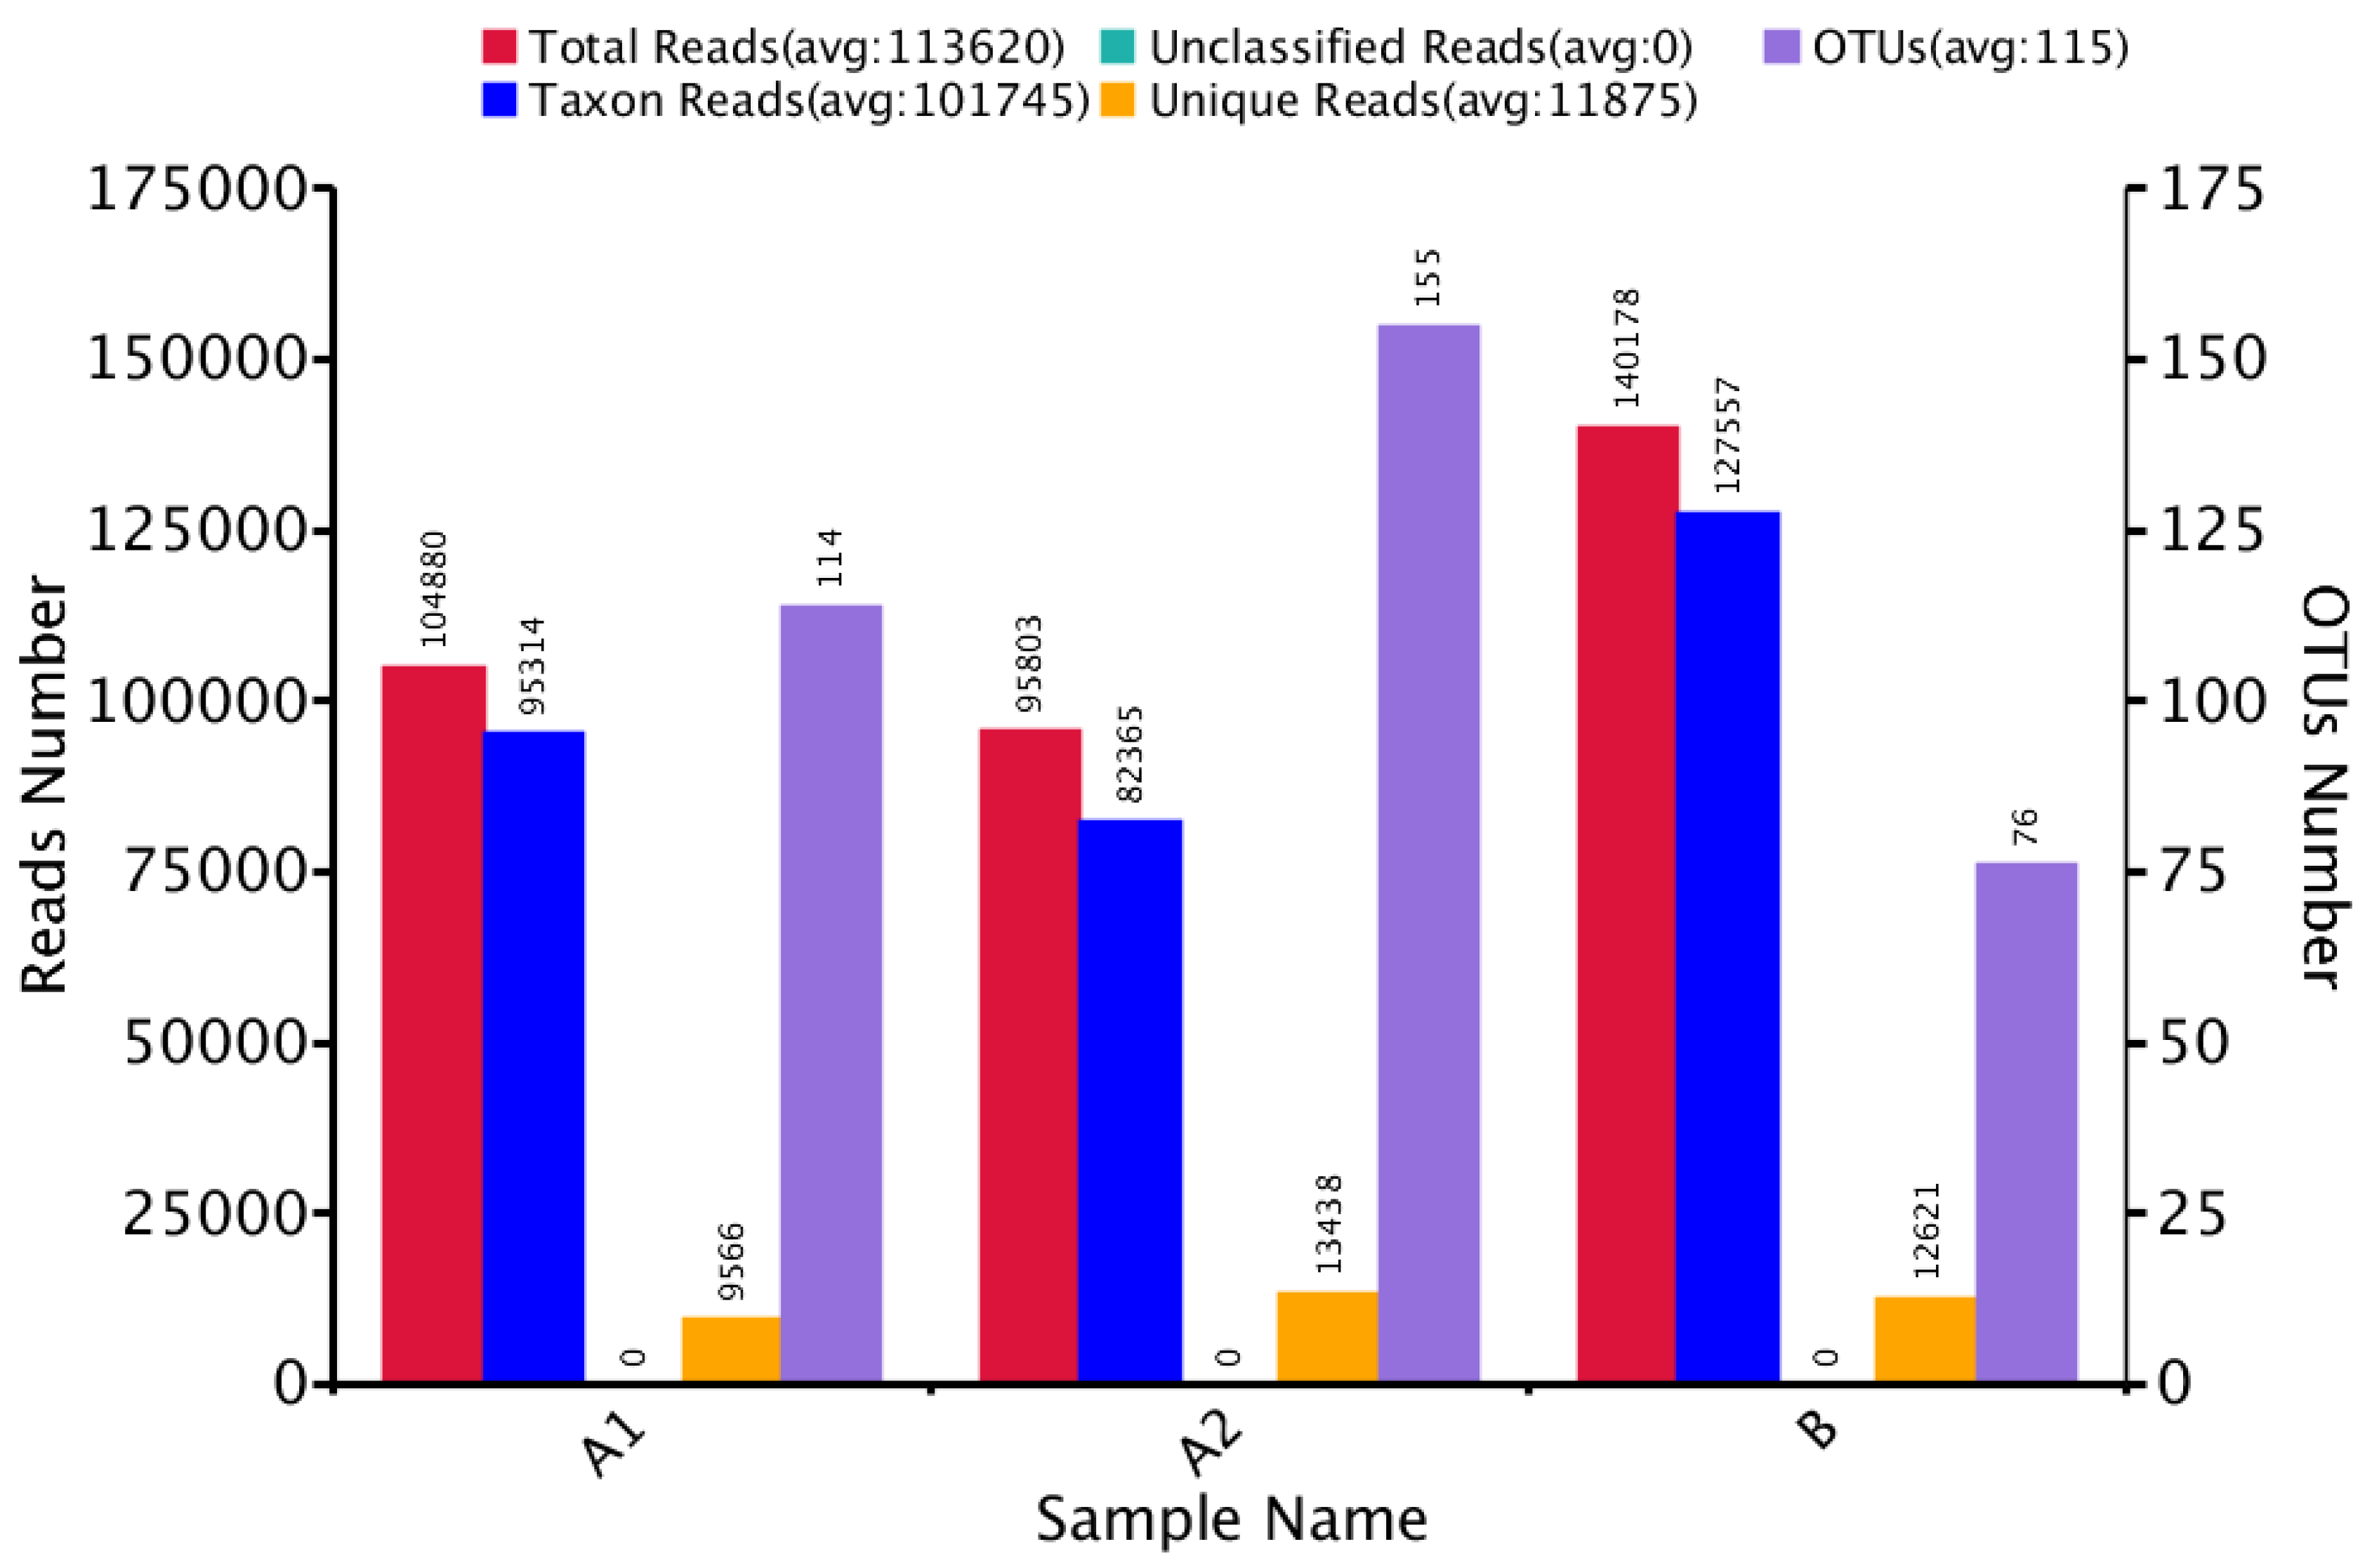
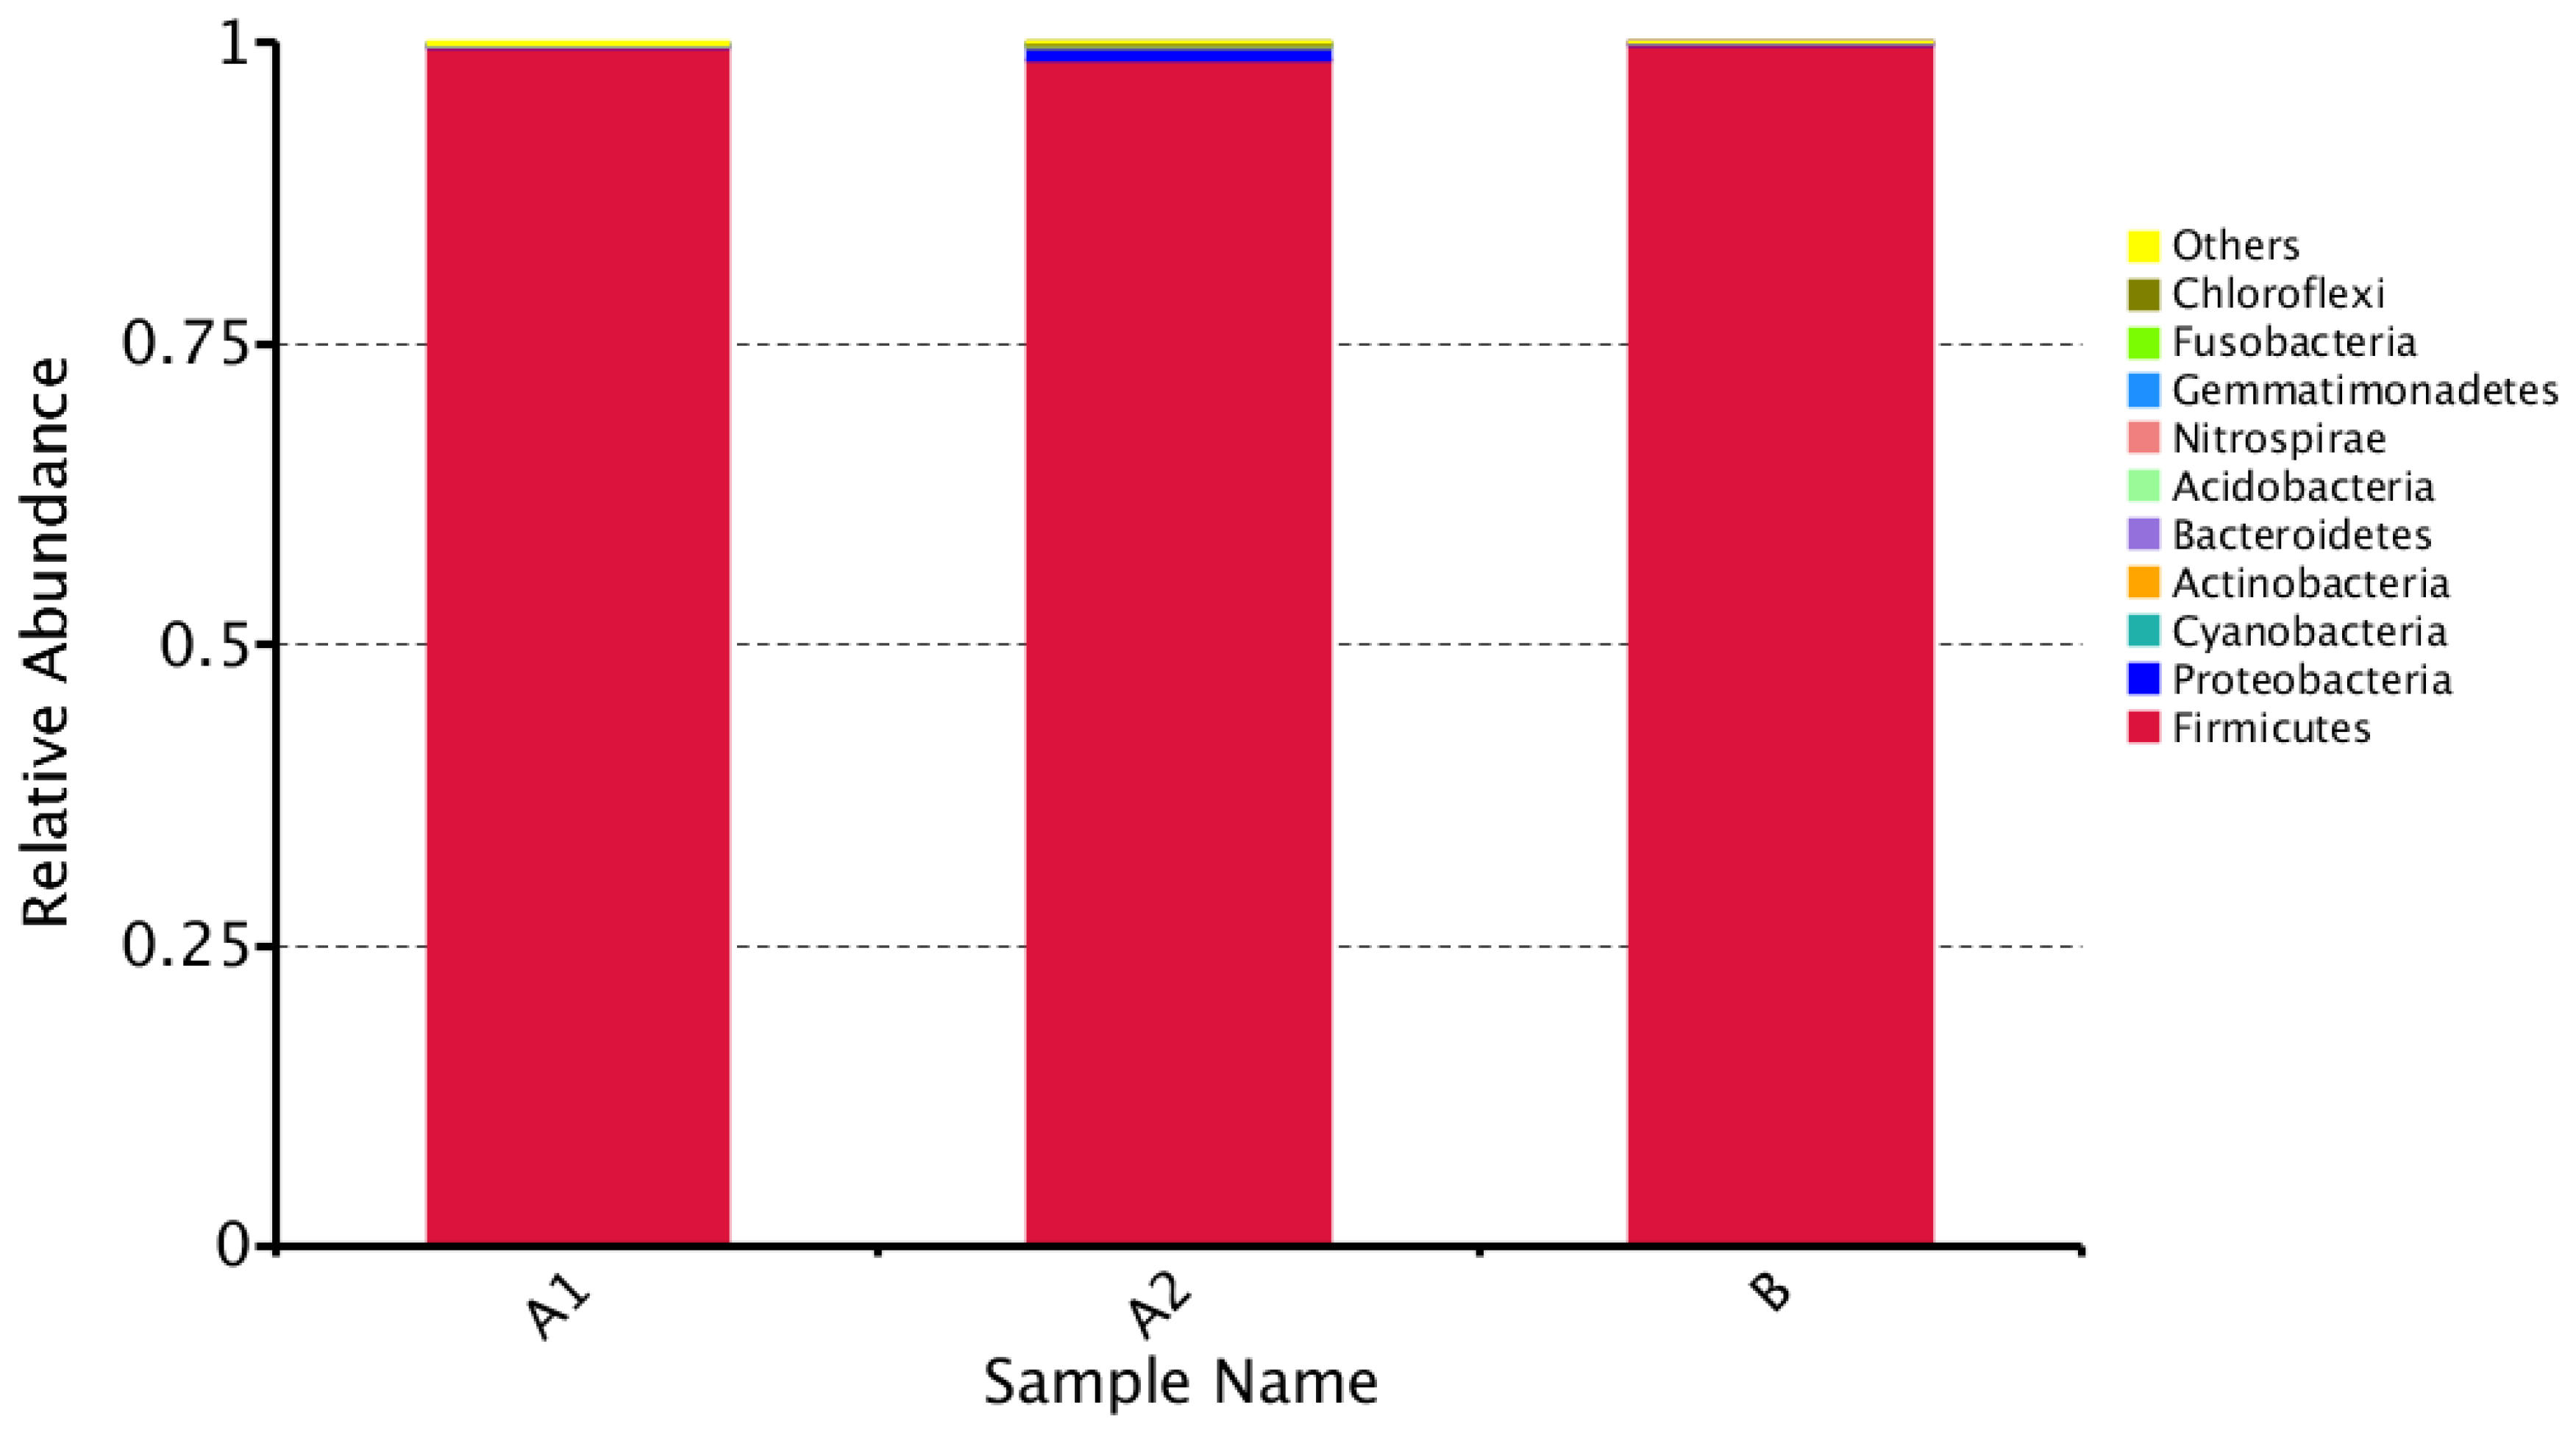
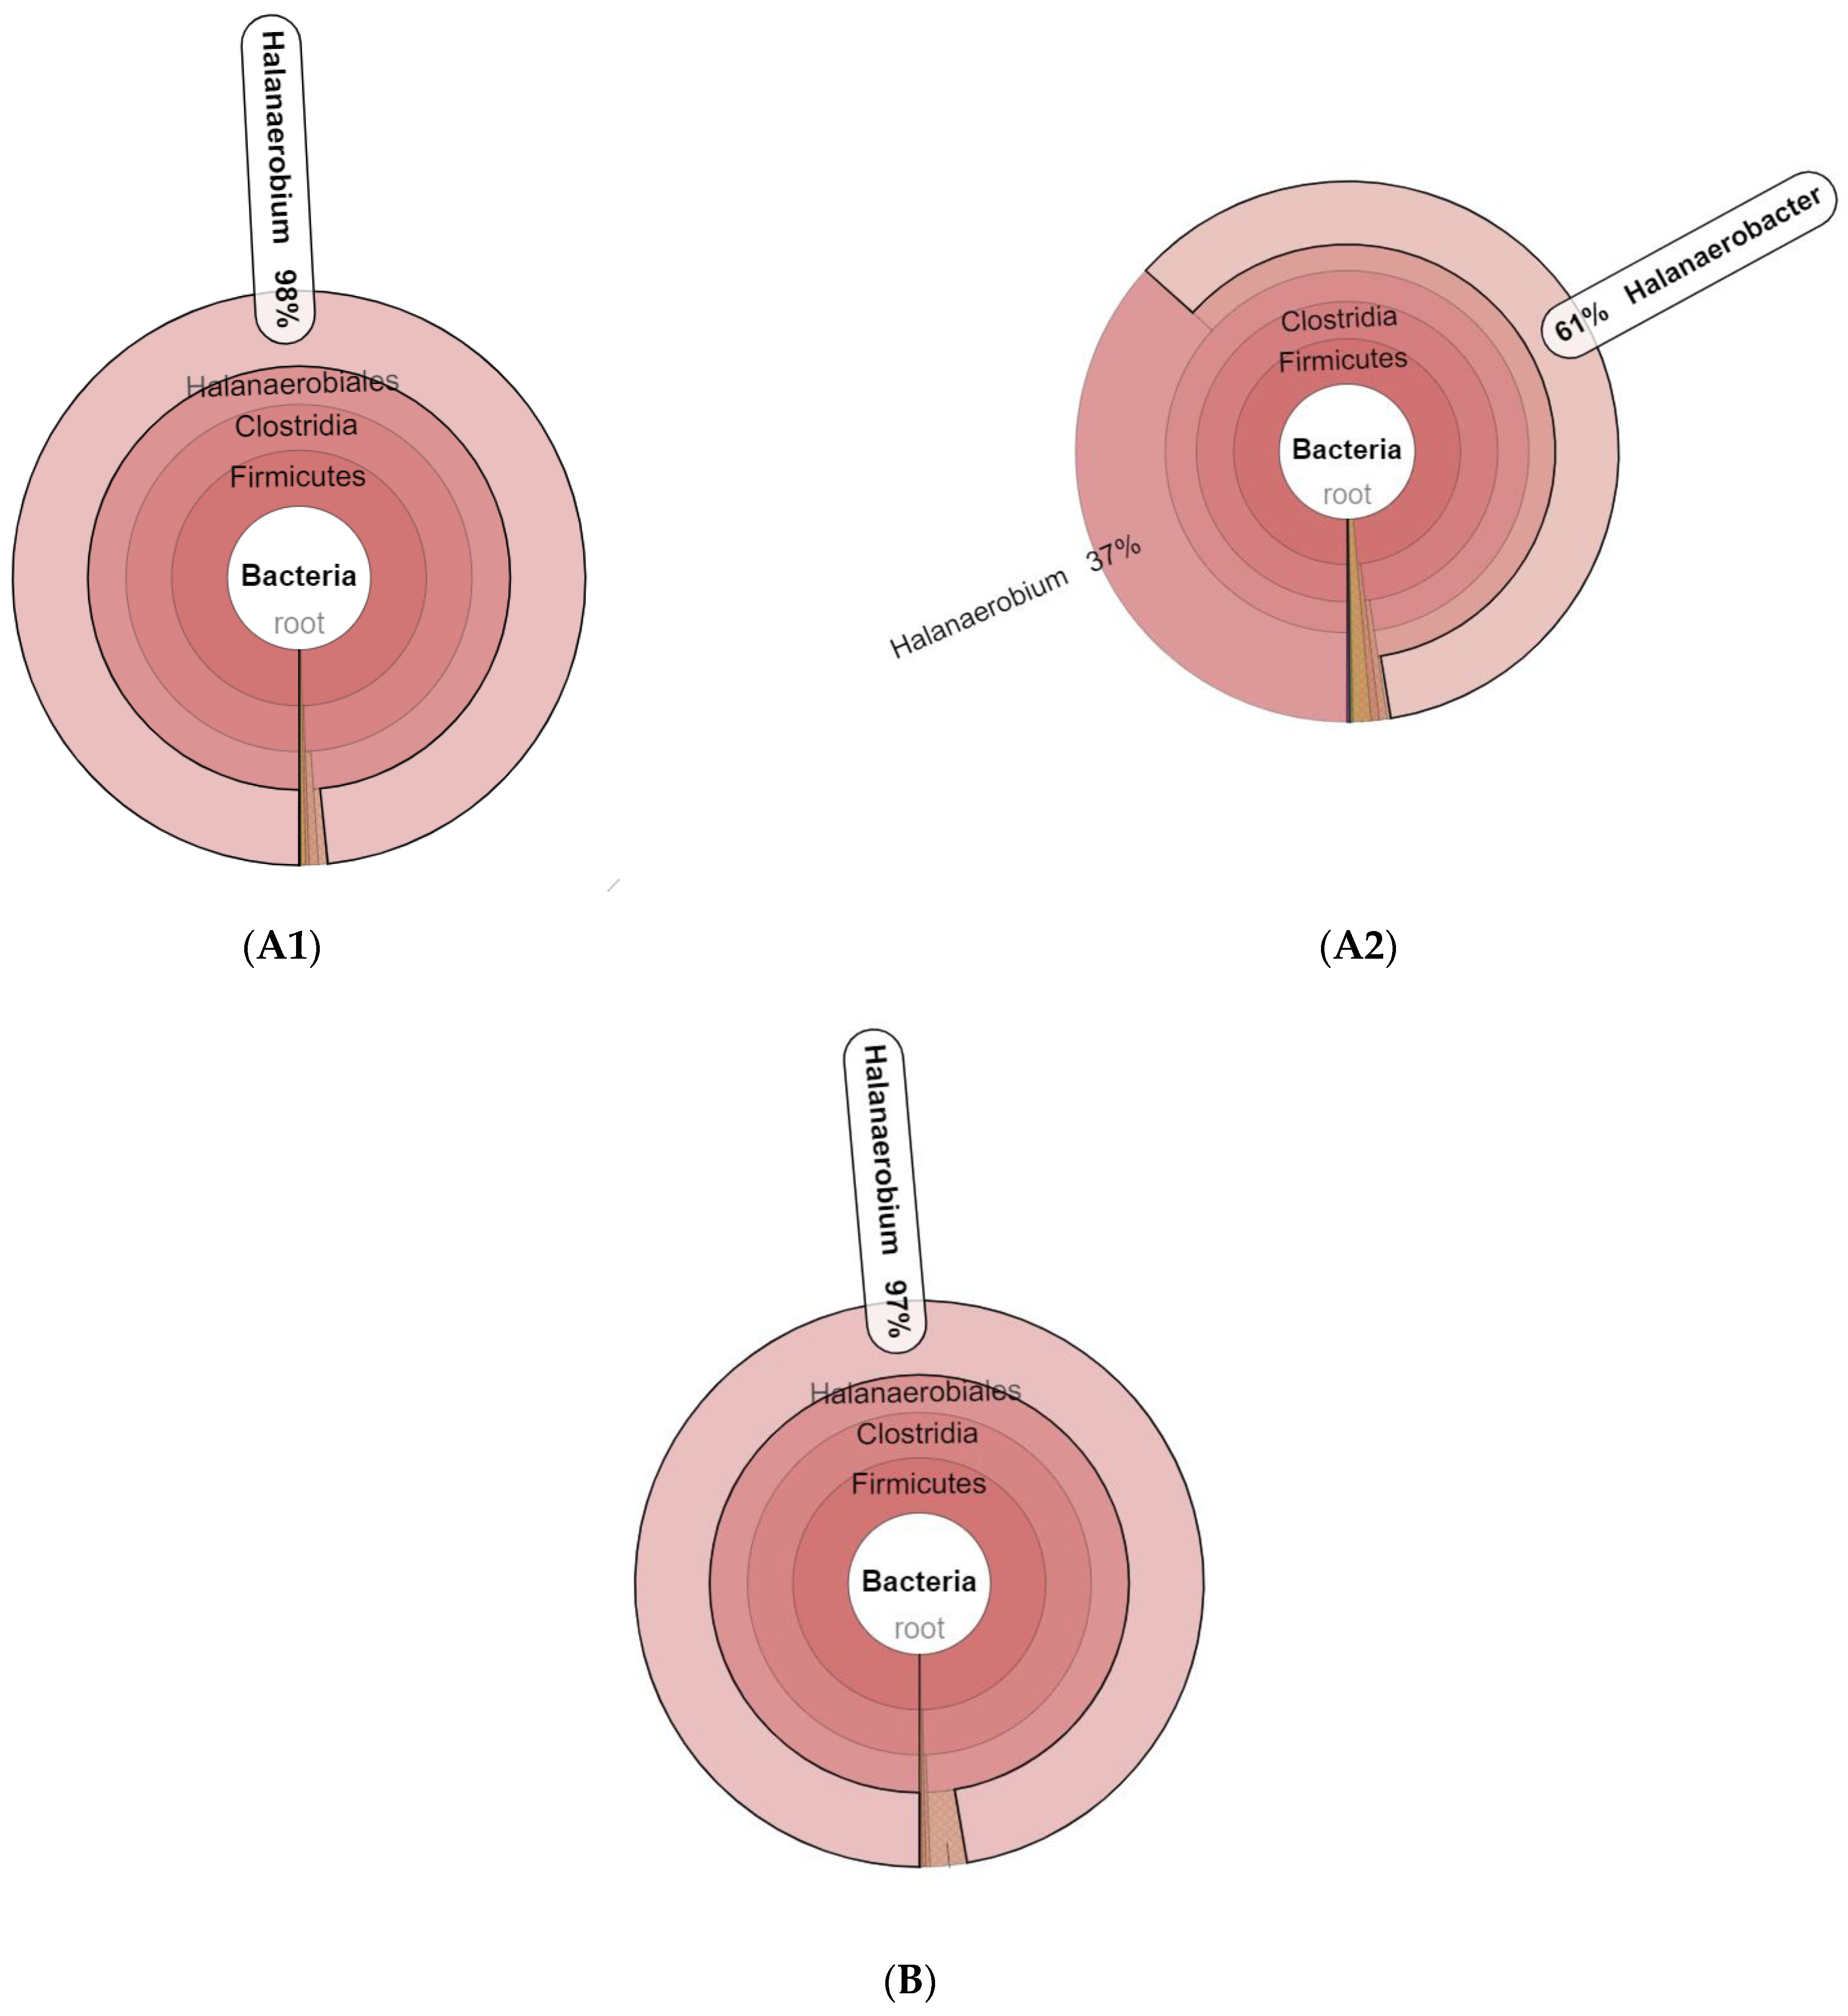
3.1. Microbial Community Amplicon Sequencing

Samples A1, A2 and B generated a mean length of 428 base pairs (bp), effective sequences between 95,803 and 140,178 reads and a total of 355,135 raw reads (Figure 1). A total of 345 OTUs were obtained based on the 97% threshold. Sample B had 76 OTUs, the lowest of all three samples. Sample A1 had 114 OTUs. The highest number of OTUs, 155, belonged to A2 and the average of the three samples was 115 OTUs. The total OTUs corresponded to Bacteria (99.516%) with Firmicutes (99.349%) and Proteobacteria (0.166%) as the most abundant bacterial phyla.
The observed species number of Table 1 is further explained by the rarefaction curves (Figure 2). Rarefaction curves provide a means to compare observed richness from unequally sampled communities by measuring observed OTUs at a certain depth of sequencing [25]. Throughout the sequence, the highest species number was observed in A2, followed by A1 and B. The flatter trendline towards the second half of the rarefaction curves suggested that the number of sequences have represented the microbial communities.
The three samples shared 55 common OTUs (Figure 3), while 34 common OTUs were shared between A1 and A2, but were not present in B. Between B and A1, there were only three shared common OTUs that were not shared with A2 and only five common OTUs were shared between B and A2 and not with A1. A2 has 61 unique OTUs, while 17 and 5 unique OTUs were found in A1 and B, respectively.
The distribution histogram of relative abundance (Figure 4) from the ten most abundant species in different taxonomic ranks indicates that the Firmicutes phylum dominated all the samples. Krona analysis (Figure 5) showed that 98% of A1 and 97% of B comprised Halanaerobium. In contrast, A2 only had 37% of Halanaerobium, while having 61% of Halanaerobacter genus. The other 2–3% of the three samples includes the genera of Acidisoma, Acinetobacter, Alcanivorax, Alistipes, Buchnera, Bacillus, Clostridium sensu stricto 1, Enterococcus, Faecalibacterium, Halanaerobaculum, Hydrogenispora, Ignatzschineria, Lachnospiraceae XPB1014 group, Lactobacillus, Marinobacter, Methylotenera, Marmoricola, Paenibacillus, Propinibacterium, Parvibaculum, Pseudomonas, Ruminococcaceae UCG 002, Ruminococcaceae UCG-005, Ruminococcaceae UCG-014, Ruminococcaceae NK4A214 group, Salinimicrobium, Sporosarcina, Streptococcus, Sphingomonas, Subdoligranulum, Stenotrophomonas and Sarcina.

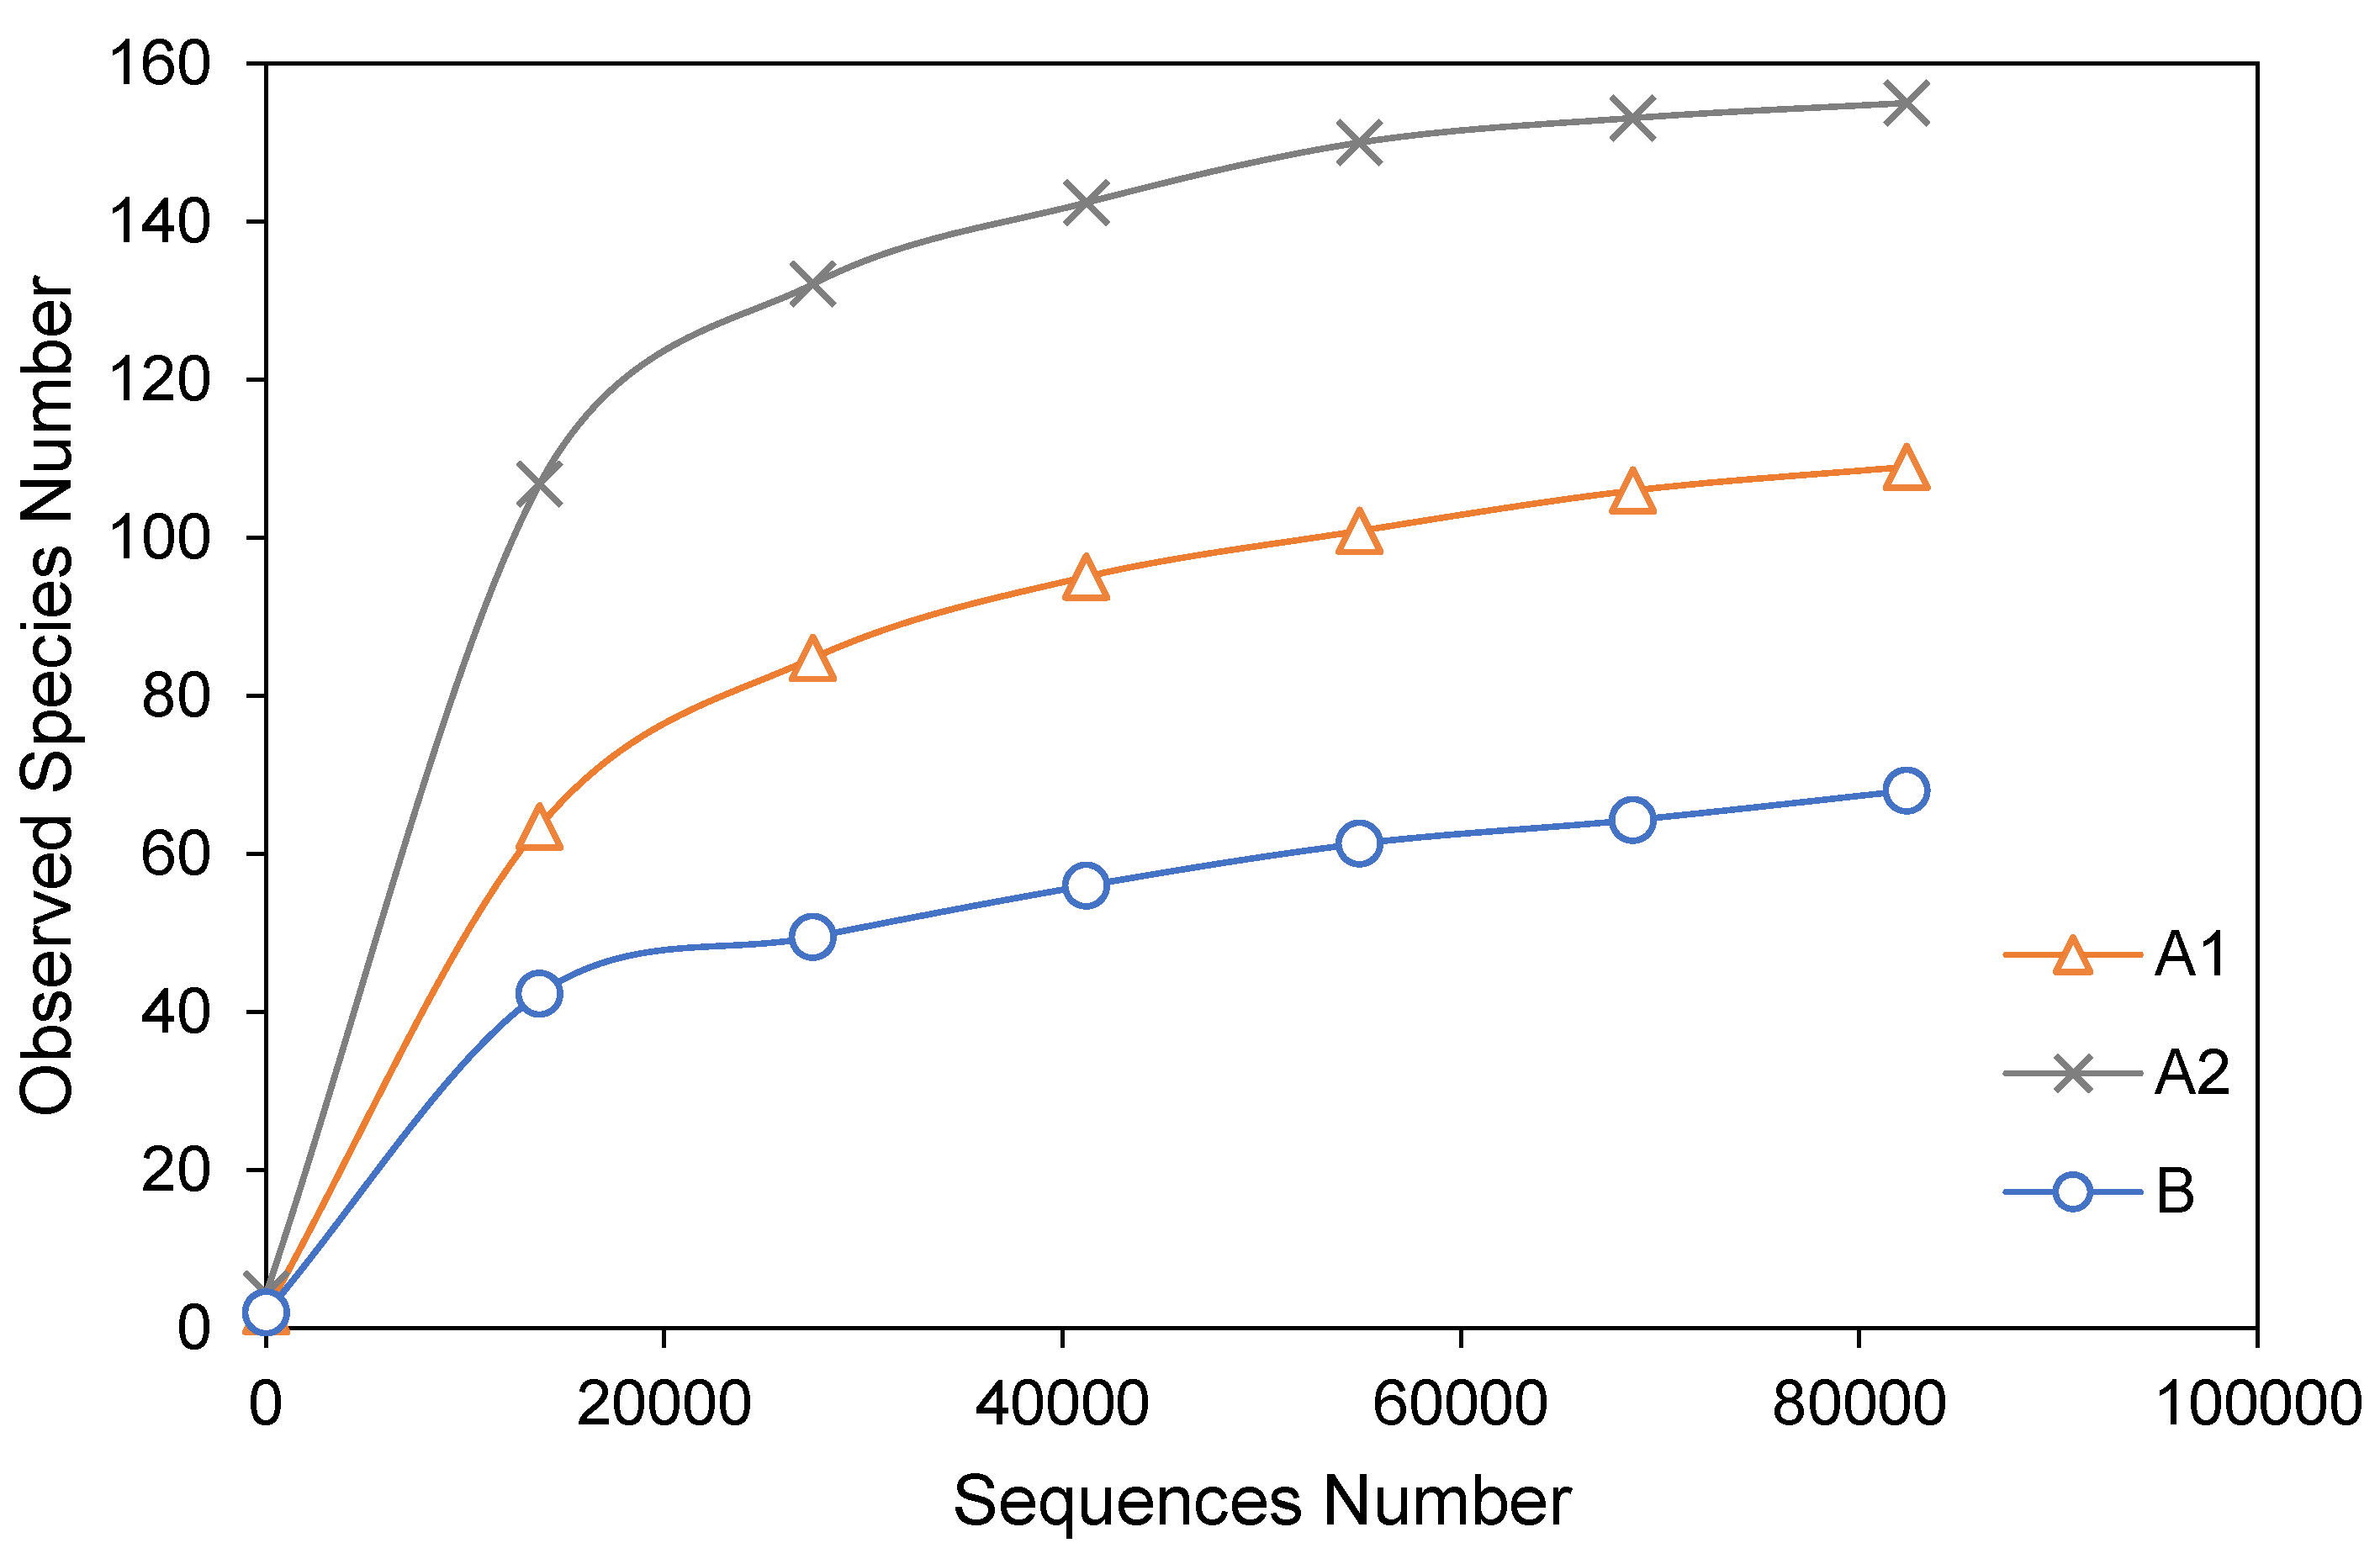
3.2. Alpha Diversity Analysis

The alpha diversity indices of the three samples are listed in Table 1. Among the three samples, the microbial community originated from the drier shore of high-salinity soil in Khon Kaen (A2) had the highest number of observed species, 155, and the highest Simpson diversity index, 0.791, as well as the highest Shannon–Wiener diversity index, 3.152. Even though the microbial community originated from the salt evaporation pond of Samut Sakhon (B) had the fewest observed species, 68, the sample had higher Simpson and Shannon–Wiener indices than the microbial community originated from the shore of high-salinity soil in Khon Kaen (A1), which had 109 observed species. Nevertheless, it should be noted that the difference is only 0.039 points for the Simpson index and 0.127 points for the Shannon-Wiener index between B and A1, compared to 0.563 points and 2.248 difference between A2 and B.
The ACE and Chao1 indices show the same trend as the observed species number among the three samples, with A2 having the highest scores, A1 the second highest and B the lowest. Using sample coverage, the ACE method estimates the number of species, while the Chao1 richness estimator predicted the A2 sample to own the rarest OTUs [25] and B the least rare OTUs.
All the samples have a Good’s coverage score of 1, indicating that all the samples bacterial communities have been acquired at a depth of the current sequence [26]. The PD whole tree index contributed diversity measurement based on the quantification of the diversity of the phylogenetic tree branch [27]. While PD whole tree scores of A2 and A1 only differ by 1.111, the PD whole tree score of B was less than half of that of A1, indicating a lower diversity in B, compared to A1 and A2.

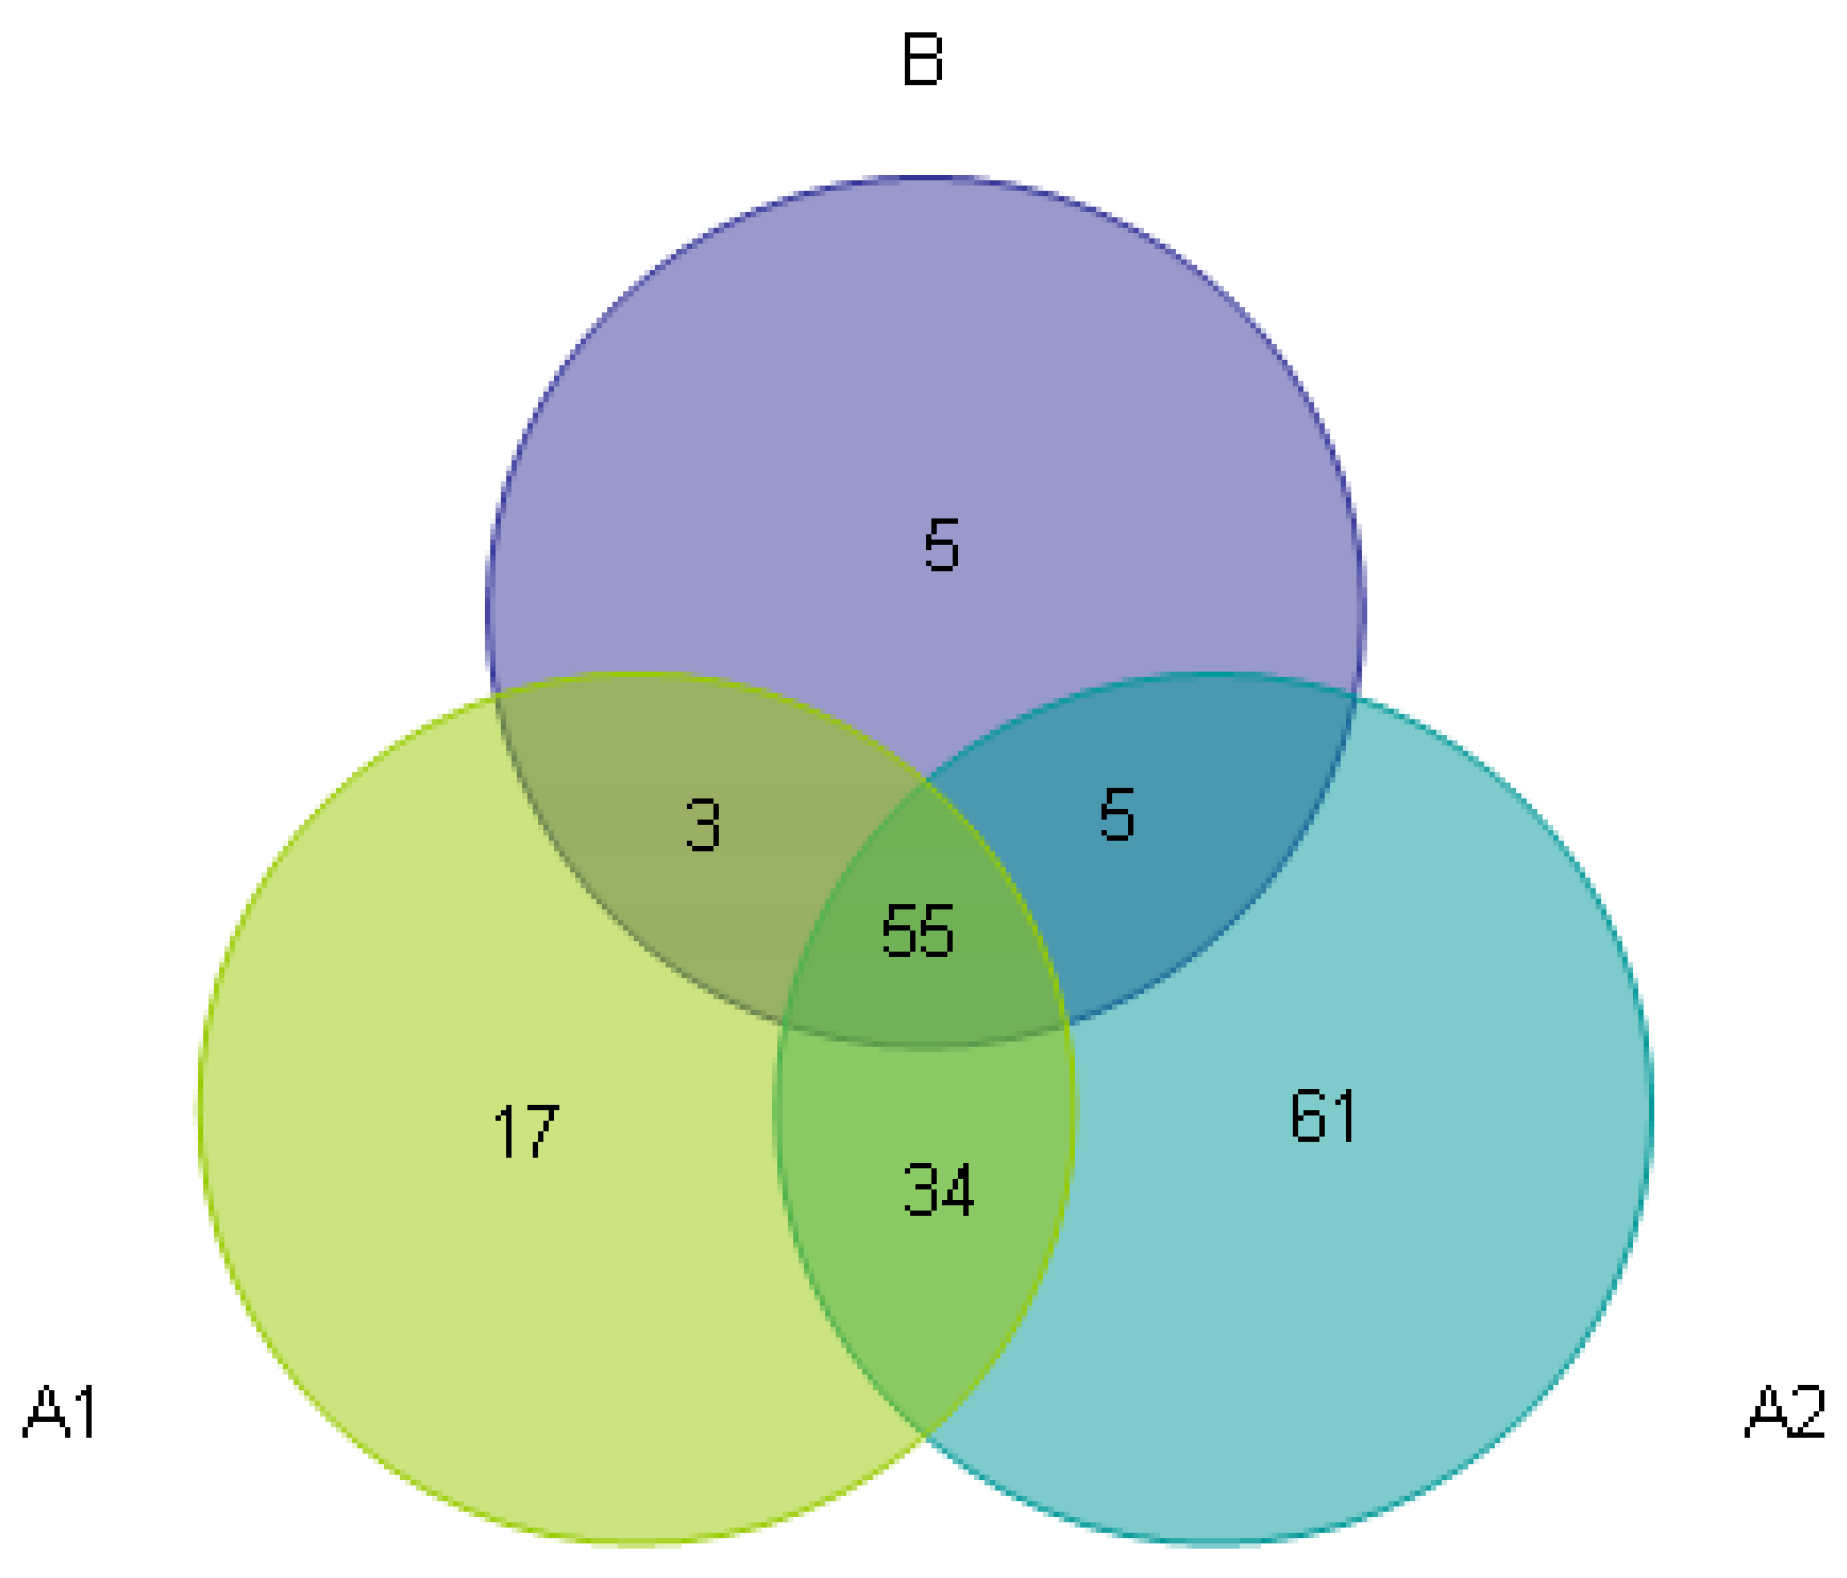
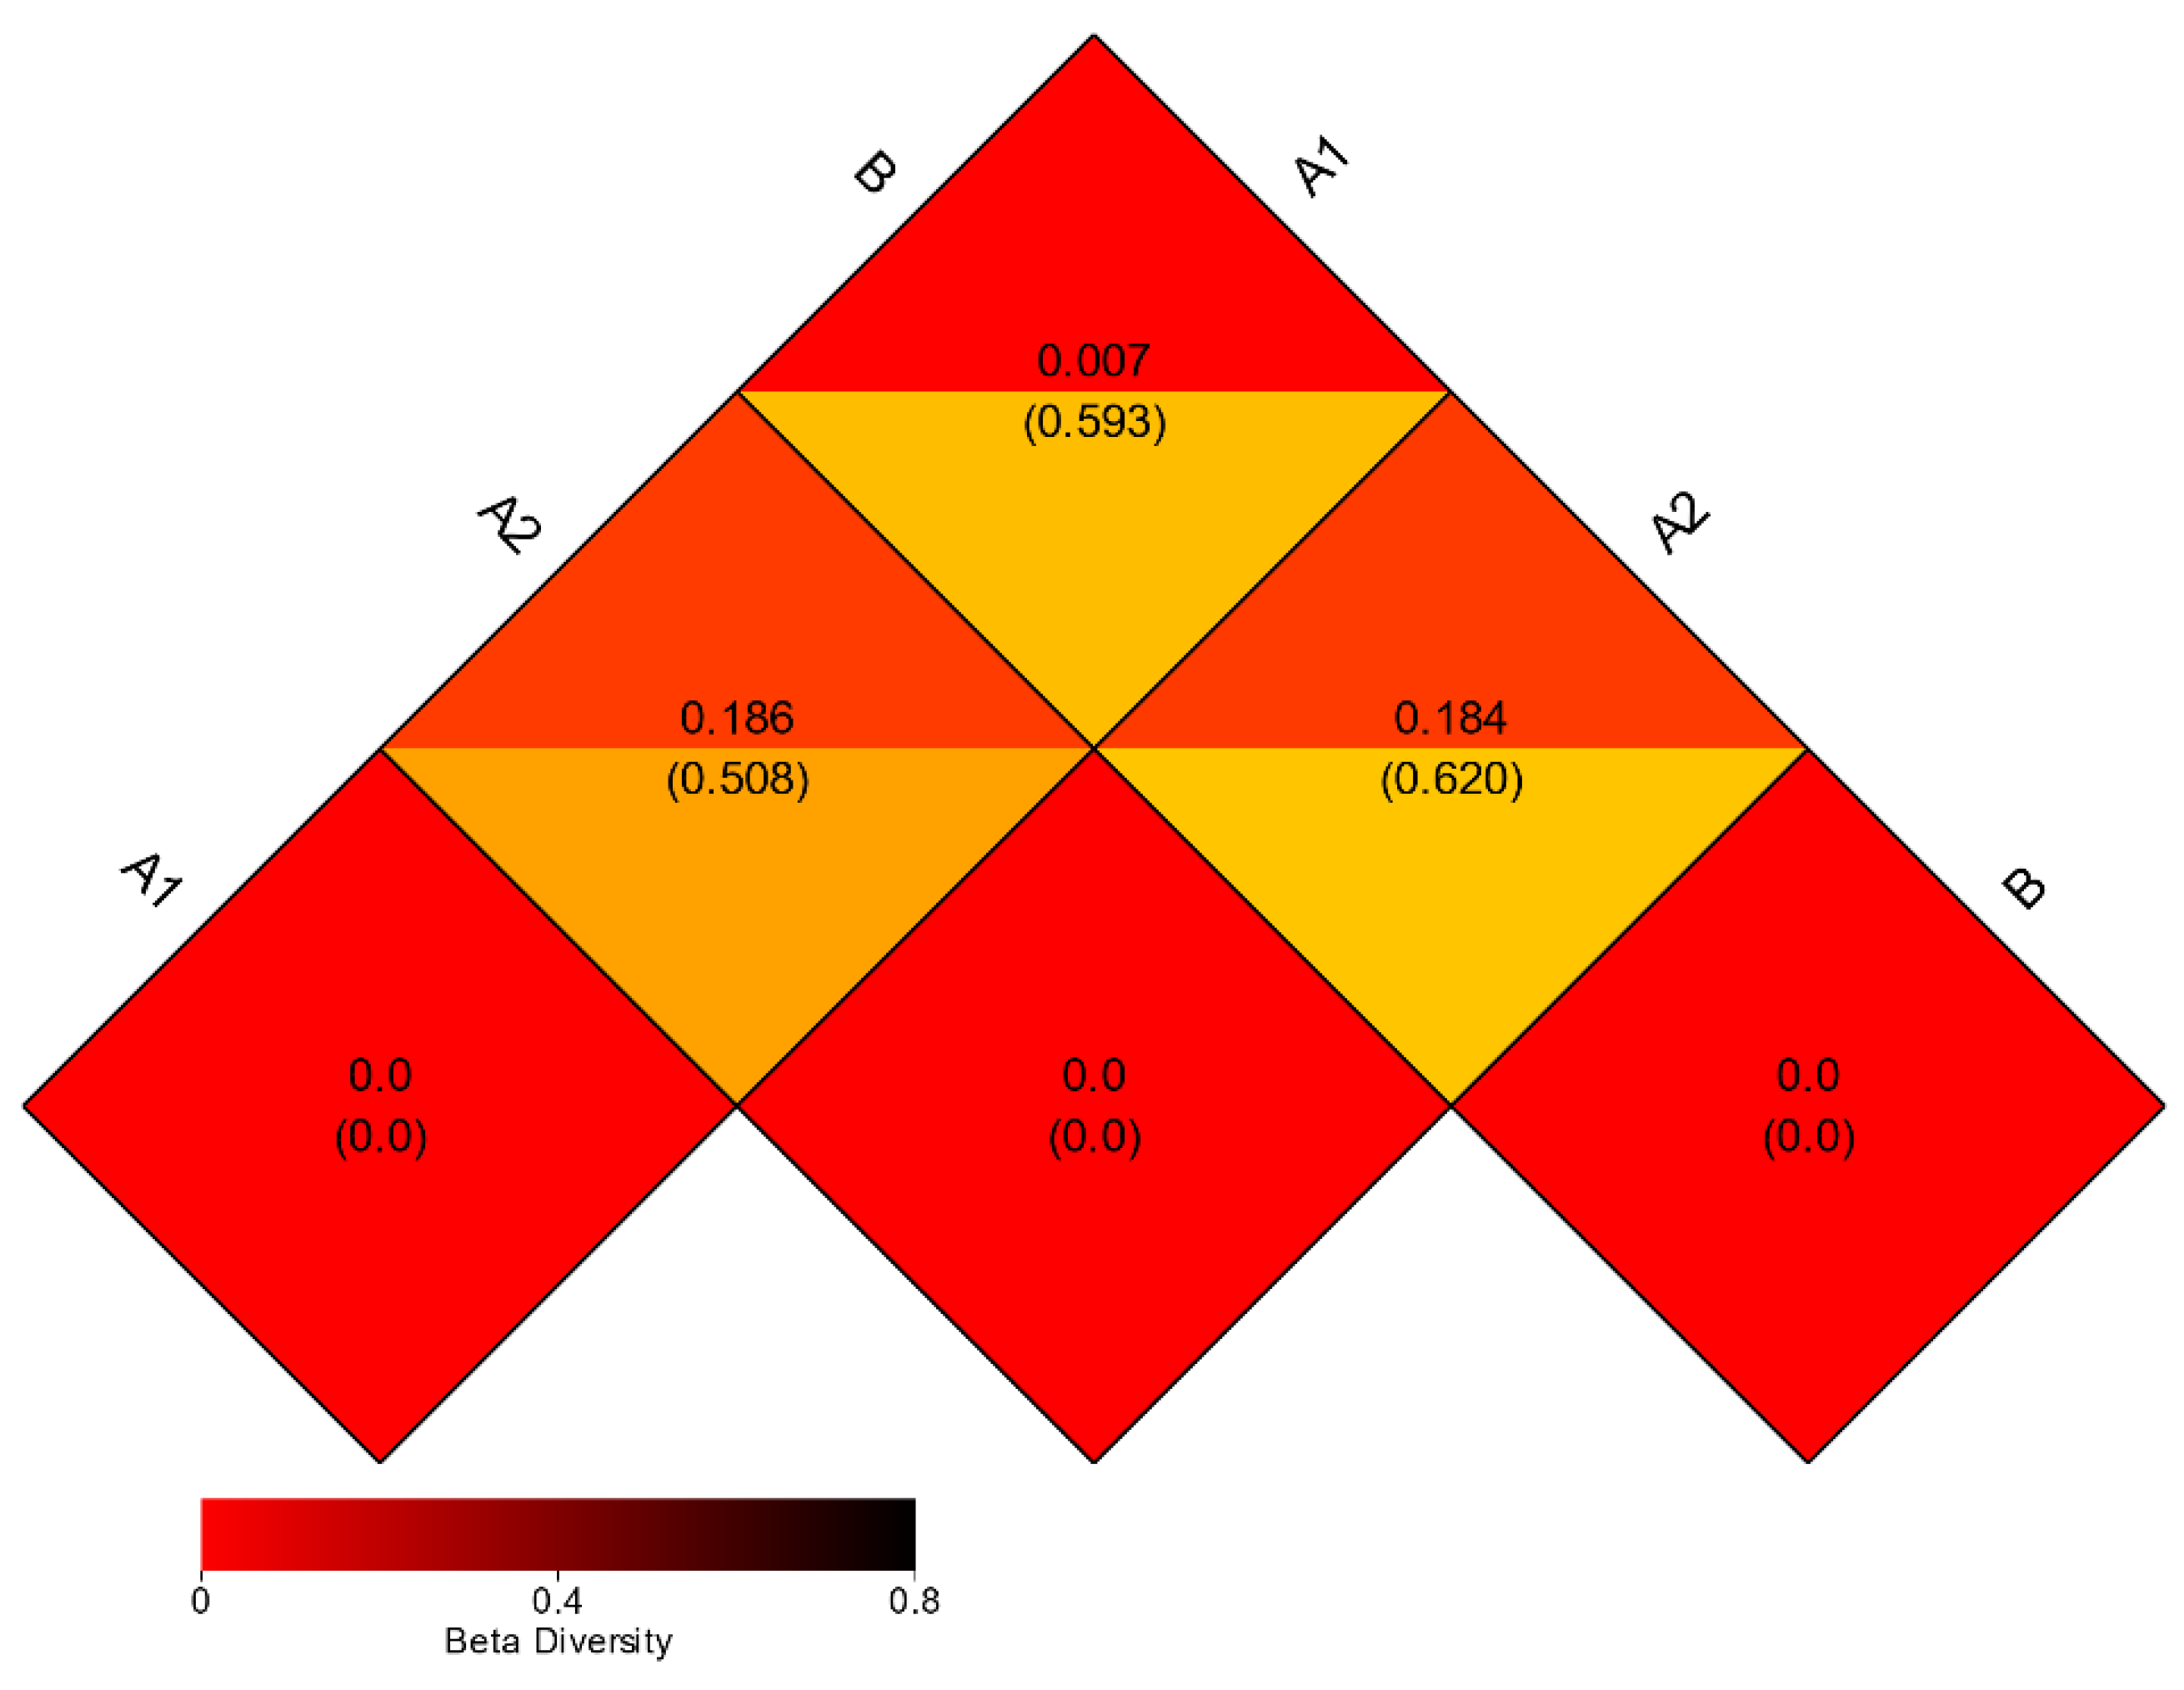
3.3. Beta Diversity Analysis
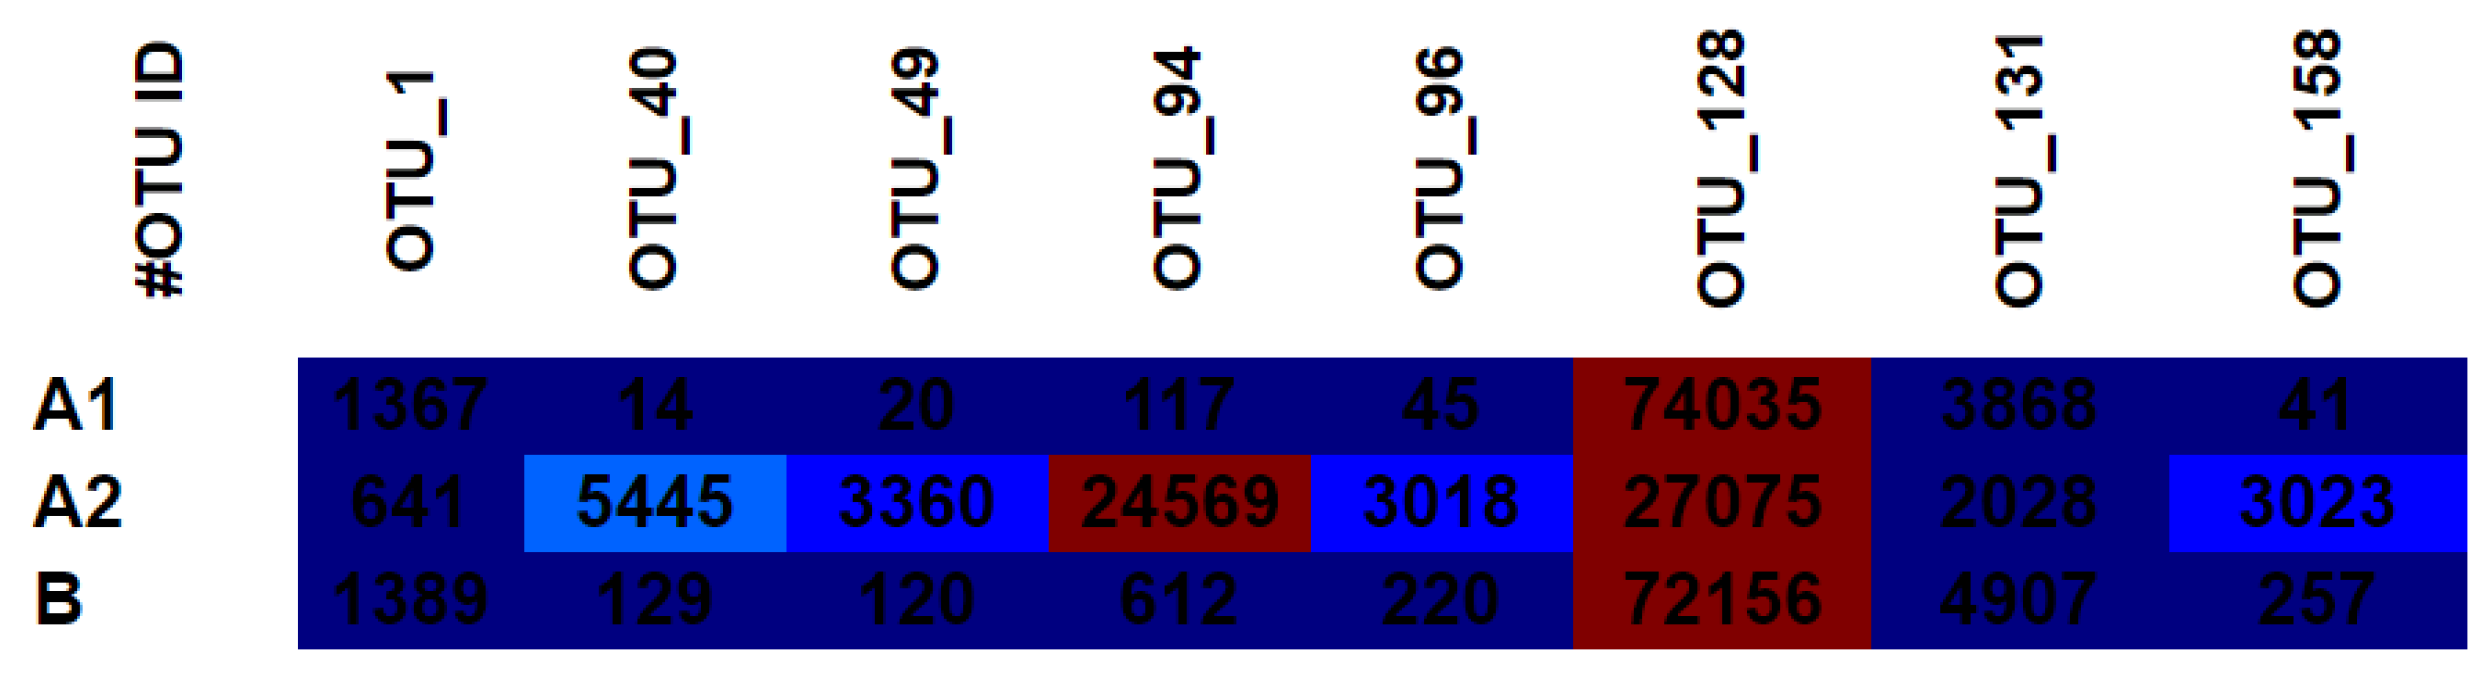
Beta diversity analysis was conducted by comparing the dissimilarity coefficient among the three samples through the means of unweighted UniFrac and weighted UniFrac distance matrix (Figure 6). Lower values of the coefficient suggested more resemblance between the two compared samples. The unweighted UniFrac distance between sample pairs of the microbial communities ranged between 0.508 and 0.620. Based on the unweighted UniFrac distance, samples A2 and A1 have the highest resemblance, at 0.508, while the highest dissimilarity was between sample B and A2, which was 0.620.
Compared to the unweighted UniFrac, the weighted UniFrac distance was much lower, showing only a slight difference. The weighted UniFrac distance between the sample pairs was between 0.007 and 0.186. The weighted UniFrac shows the highest resemblance between sample B and A1, at 0.007 and the highest dissimilarity between A2 and A1, at 0.186.

3.4. OTU Heat Map

The OTU heat map (Figure 7) indicates OTU_128 was present in the highest numbers in A1, A2 and B. While other OTUs appear in high numbers in A2, they are only available in small quantities in A1 and B. OTU_94 and OTU_40 were the next most abundant OTUs in A2.
Phylogenetic identification results (Table 2) revealed that OTU_128 was highly similar to Halanaerobium fermentans strain R-9, with a similarity of 99.5%. The other OTUs which were available abundantly in A2 show a high similarity with Halanaerobacter lacunarum strain TB21, with values between 96.79% and 99.03%. This range of values can be attributed to the sequence length, with the longest sequence (450 bp) contributing to the highest similarity.

4. Discussion

Among the three locations from where the soil for cultivation was taken, the soil for the cultivation vial A2 was noticeably coarser than the soil taken for cultivation vials A1 and B. The soil for cultivation B was the finest among the three. Studies suggest that soils with coarse textures encourage bacterial richness under moist conditions [29]. This condition explains the diversity indices and number of OTUs differences among A1, A2 and B. Spatial proximity was not a determining factor for similarities among these extremely halophilic microbial communities. The relative abundance of OTUs (Figure 4) indicated that the three samples were dominated by the Firmicutes phylum. All Firmicutes have rigid cell walls [30], explaining their ability to survive in very high salt concentrations.
Biohydrogen production experiments among the three microbial communities showed that the highest biohydrogen molar yield was achieved by A1, followed by B and A2, at 1.15, 1,08 and 0.66 mol H2/mol glucose, respectively [15]. In those experiments, higher biohydrogen molar yields were achieved by the inocula with a higher abundance of Halanaerobium, which were A1 and B. While studies on biohydrogen production by pure cultures of Halanaerobium have been more commonly reported, a study on biohydrogen production by Halanaerobacter has never been reported to date.
Studies on biohydrogen production by the Halanaerobium genus have been conducted with H. saccharolyticum [6], H. hydrogeniformans [8], H. salinarius [31] and H. chitinovorans [32], but studies on biohydrogen production by the microbial community, which was dominated by H. fermentans, have only been reported in the research related to this study [16]. H. fermentans R-9 was initially isolated from Japanese fermented puffer fish ovaries (fugu-no-ko nukazuke) [33] and has also been reported to be a part of other salted and fermented food microbial communities from other countries, such as pa-daek from Laos [34], salted fermented seafood from Korea [35] and pla-ra from Thailand [34]. H. fermentans grows in 5–25% NaCl, pH range between 6 and 9 and temperature range between 15 and 45 °C [33]. H. fermentans may favor the high salinity and pH conditions of those fermented foods which develop over time, which is similar to the three-year screening process of the microbial communities performed in this study.
The most abundant OTUs in A2 indicated a high similarity with Halanaerobacter lacunarum (basonym: Halobacteroides lacunaris) TB21, an obligate halophilic isolated from the eastern Mediterranean Sea deep-sea hypersaline anoxic brine [36]. Halanaerobacter can grow in 10–32% NaCl (1.7 M–5.5 M), pH range between 6 and 8.5 and temperature between 25 and 52 °C [31,36,37]. Only very limited studies have been found on the application of H. lacunarum; among them, there are studies on the lipopolysaccharide production by the species for immunostimulant activity [36,38]. Fermentation products of H. fermentans and H. lacunarum include acetate, H2, CO2 and ethanol, while H. fermentans also has the ability to ferment formate and lactate [31,33].
The previous study has shown that the microbial community B has the ability to ferment L-arabinose, one of the lignocellulose-derived carbohydrates, which is unfermentable by the pure culture of H. fermentans. The microbial community also produced butyric acid, which is not a metabolite product of H. fermentans [16,33]. The butyric acid was most likely produced by genus Clostridium sensu stricto 1, which was present in 0.1% in microbial community B. The genus was also known to produce hydrogen [39].
Even though the biohydrogen experiments conducted with microbial community A2, dominated by Halanaerobacter, resulted in lower hydrogen molar yield than communities dominated by Halanaerobium, the experiments showed the potential application of these two microbial community members. By studying the microbial communities and understanding the requirements of their members, strategies can be developed to increase biohydrogen molar yield, such as fine-tuning the substrate, pH and temperature. A further metagenomic study might be helpful to obtain more insights into metabolic pathways and genes attainable in these communities for further enhancement of biohydrogen production in extremely halophilic conditions.

Author Contributions

Resources, P.C. and A.R.; supervision, T.I.; writing-original draft preparation, D.A.H.T.; All authors have read and agreed to the published version of the manuscript.

Funding

This research was funded by The Senior Research Scholar, Thailand Science Research and Innovation (TSRI) (Grant No. RTA6280001).

Institutional Review Board Statement

Not applicable.

Informed Consent Statement

Not applicable.

Data Availability Statement

Data is contained within the article.

Acknowledgments

Authors would like to acknowledge Siriporn Lunprom for her kind help and instructions about NGS. The fourth author would like to acknowledge the Senior Research Scholar, Thailand Science Research and Innovation (TSRI) (Grant No. RTA6280001). This work was supported by the Research Center for Thermotolerant Microbial Resources, Yamaguchi University, Japan.

Conflicts of Interest

The authors declare no conflict of interest.

References

  1. Sarangi, P.K.; Nanda, S. Biohydrogen Production Through Dark Fermentation. Chem. Eng. Technol. 2020, 43, 601–612. [Google Scholar] [CrossRef]
  2. Soares, J.F.; Confortin, T.C.; Todero, I.; Mayer, F.D.; Mazutti, M.A. Dark Fermentative Biohydrogen Production from Lignocellulosic Biomass: Technological Challenges and Future Prospects. Renew. Sustain. Energy Rev. 2020, 117, 109484. [Google Scholar] [CrossRef]
  3. Pachapur, V.L.; Kutty, P.; Pachapur, P.; Brar, S.K.; Le Bihan, Y.; Galvez-Cloutier, R.; Buelna, G. Seed Pretreatment for Increased Hydrogen Production Using Mixed-Culture Systems with Advantages over Pure-Culture Systems. Energies 2019, 12, 530. [Google Scholar] [CrossRef] [Green Version]
  4. Sivagurunathan, P.; Kumar, G.; Mudhoo, A.; Rene, E.R.; Saratale, G.D.; Kobayashi, T.; Xu, K.; Kim, S.-H.; Kim, D.-H. Fermentative Hydrogen Production Using Lignocellulose Biomass: An Overview of Pre-Treatment Methods, Inhibitor Effects and Detoxification Experiences. Renew. Sustain. Energy Rev. 2017, 77, 28–42. [Google Scholar] [CrossRef]
  5. Oren, A. Anaerobic Degradation of Organic Compounds at High Salt Concentrations. Antonie Van Leeuwenhoek 1988, 54, 267–277. [Google Scholar] [CrossRef]
  6. Kivistö, A.; Santala, V.; Karp, M. Hydrogen Production from Glycerol Using Halophilic Fermentative Bacteria. Bioresour. Technol. 2010, 101, 8671–8677. [Google Scholar] [CrossRef]
  7. Pierra, M.; Trably, E.; Godon, J.J.; Bernet, N. Fermentative Hydrogen Production under Moderate Halophilic Conditions. Int. J. Hydrogen Energy 2013, 9, 1–10. [Google Scholar] [CrossRef]
  8. Begemann, M.; Mormile, M.; Sitton, O.; Wall, J.; Elias, D. A Streamlined Strategy for Biohydrogen Production with Halanaerobium Hydrogeniformans, an Alkaliphilic Bacterium. Front. Microbiol. 2012, 3, 93. [Google Scholar] [CrossRef] [Green Version]
  9. Ollivier, B.; Caumette, P.; Garcia, J.L.; Mah, R.A. Anaerobic Bacteria from Hypersaline Environments. Microbiol. Rev. 1994, 58, 27–38. [Google Scholar] [CrossRef]
  10. García-Depraect, O.; Valdez-Vázquez, I.; Rene, E.R.; Gómez-Romero, J.; López-López, A.; León-Becerril, E. Lactate- and Acetate-Based Biohydrogen Production through Dark Co-Fermentation of Tequila Vinasse and Nixtamalization Wastewater: Metabolic and Microbial Community Dynamics. Bioresour. Technol. 2019, 282, 236–244. [Google Scholar] [CrossRef]
  11. García-Depraect, O.; Diaz-Cruces, V.F.; Rene, E.R.; León-Becerril, E. Changes in Performance and Bacterial Communities in a Continuous Biohydrogen-Producing Reactor Subjected to Substrate- and PH-Induced Perturbations. Bioresour. Technol. 2020, 295, 122182. [Google Scholar] [CrossRef] [PubMed]
  12. Goud, R.K.; Arunasri, K.; Yeruva, D.K.; Krishna, K.V.; Dahiya, S.; Mohan, S.V. Impact of Selectively Enriched Microbial Communities on Long-Term Fermentative Biohydrogen Production. Bioresour. Technol. 2017, 242, 253–264. [Google Scholar] [CrossRef] [PubMed]
  13. Muyzer, G. Genetic Fingerprinting of Microbial Communities–Present Status and Future Perspectives. In Proceedings of the 8th International Symposium on Microbial Ecology, Halifax, NS, Canada, 9–14 August 1998; Atlantic Canada Society for Microbial Ecology, 1999; Volume 1, Available online: http://socrates.acadiau.ca/isme/Symposium16/muyzer.PDF (accessed on 9 June 2021).
  14. Kumar, G.; Cho, S.-K.; Sivagurunathan, P.; Anburajan, P.; Mahapatra, D.M.; Park, J.-H.; Pugazhendhi, A. Insights into Evolutionary Trends in Molecular Biology Tools in Microbial Screening for Biohydrogen Production through Dark Fermentation. Int. J. Hydrogen Energy 2018, 43, 19885–19901. [Google Scholar] [CrossRef]
  15. Taroepratjeka, D.A.H.; Imai, T.; Chairattanamanokorn, P. Investigation of Hydrogen-Producing Ability of Extremely Halotolerant Bacteria from a Salt Pan and Salt-Damaged Soil in Thailand. Int. J. Hydrogen Energy 2019, 44, 3407–3413. [Google Scholar] [CrossRef]
  16. Taroepratjeka, D.A.H.; Imai, T.; Chairattanamanokorn, P.; Reungsang, A. Biohydrogen Production by Extremely Halophilic Bacteria from the Salt Pan of Samut Sakhon, Thailand. Chiang Mai J. Sci. 2020, 47, 378–390. [Google Scholar]
  17. Edgar, R.C.; Haas, B.J.; Clemente, J.C.; Quince, C.; Knight, R. UCHIME Improves Sensitivity and Speed of Chimera Detection. Bioinformatics 2011, 27, 2194–2200. [Google Scholar] [CrossRef] [Green Version]
  18. Schloss, P.D.; Westcott, S.L.; Ryabin, T.; Hall, J.R.; Hartmann, M.; Hollister, E.B.; Lesniewski, R.A.; Oakley, B.B.; Parks, D.H.; Robinson, C.J.; et al. Introducing Mothur: Open-Source, Platform-Independent, Community-Supported Software for Describing and Comparing Microbial Communities. Appl. Environ. Microbiol. 2009, 75, 7537–7541. [Google Scholar] [CrossRef] [PubMed] [Green Version]
  19. SILVA Ribosomal RNA Gene Database Project: Improved Data Processing and Web-Based Tools|Nucleic Acids Research|Oxford Academic. Available online: https://academic.oup.com/nar/article/41/D1/D590/1069277?login=true (accessed on 31 January 2021).
  20. Edgar, R.C. MUSCLE: Multiple Sequence Alignment with High Accuracy and High Throughput. Nucleic Acids Res. 2004, 32, 1792–1797. [Google Scholar] [CrossRef] [Green Version]
  21. Ondov, B.D.; Bergman, N.H.; Phillippy, A.M. Interactive Metagenomic Visualization in a Web Browser. BMC Bioinform. 2011, 12, 385. [Google Scholar] [CrossRef] [PubMed] [Green Version]
  22. Benson, D.A.; Cavanaugh, M.; Clark, K.; Karsch-Mizrachi, I.; Lipman, D.J.; Ostell, J.; Sayers, E.W. GenBank. Nucleic Acids Res. 2013, 41, D36–D42. [Google Scholar] [CrossRef] [Green Version]
  23. Chao, A.; Hwang, W.-H.; Chen, Y.-C.; Kuo, C.-Y. Estimating the Number of Shared Species in Two Communities. Stat. Sin. 2000, 10, 227–246. [Google Scholar]
  24. Faith, D.P. Conservation Evaluation and Phylogenetic Diversity. Biol. Conserv. 1992, 61, 1–10. [Google Scholar] [CrossRef]
  25. Kim, B.-R.; Shin, J.; Guevarra, R.; Lee, J.H.; Kim, D.W.; Seol, K.-H.; Lee, J.-H.; Kim, H.B.; Isaacson, R. Deciphering Diversity Indices for a Better Understanding of Microbial Communities. J. Microbiol. Biotechnol. 2017, 27, 2089–2093. [Google Scholar] [CrossRef] [Green Version]
  26. Nam, Y.-D.; Lee, S.-Y.; Lim, S.-I. Microbial Community Analysis of Korean Soybean Pastes by Next-Generation Sequencing. Int. J. Food Microbiol. 2012, 155, 36–42. [Google Scholar] [CrossRef] [PubMed]
  27. Pylro, V.S.; Roesch, L.F.W.; Morais, D.K.; Clark, I.M.; Hirsch, P.R.; Tótola, M.R. Data Analysis for 16S Microbial Profiling from Different Benchtop Sequencing Platforms. J. Microbiol. Methods 2014, 107, 30–37. [Google Scholar] [CrossRef] [PubMed] [Green Version]
  28. Taroepratjeka, D.A.H. A Study of Biohydrogen Production by Extremely Halophilic Bacterial Communities from a Salt Pan and Salt Damaged Soil. Ph.D. Thesis, Yamaguchi University, Yamaguchi, Japan, March 2020. [Google Scholar]
  29. Xia, Q.; Rufty, T.; Shi, W. Soil Microbial Diversity and Composition: Links to Soil Texture and Associated Properties. Soil Biol. Biochem. 2020, 149, 107953. [Google Scholar] [CrossRef]
  30. Vos, P.; Garrity, G.; Jones, D.; Krieg, N.R.; Ludwig, W.; Rainey, F.A.; Schleifer, K.-H.; Whitman, W.B. Bergey’s Manual of Systematic Bacteriology: Volume 3: The Firmicutes; Springer Science & Business Media: Berlin/Heidelberg, Germany, 2011; ISBN 978-0-387-68489-5. [Google Scholar]
  31. Moune, S.; Manac’h, N.; Hirschler, A.; Caumette, P.; Willison, J.C.; Matheron, R. Haloanaerobacter Salinarius Sp. Nov., a Novel Halophilic Fermentative Bacterium That Reduces Glycine-Betaine to Trimethylamine with Hydrogen or Serine as Electron Donors; Emendation of the Genus Haloanaerobacter. Int. J. Syst. Bacteriol. 1999, 49, 103–112. [Google Scholar] [CrossRef] [PubMed]
  32. Liaw, H.J.; Mah, R.A. Isolation and Characterization of Haloanaerobacter Chitinovorans Gen. Nov., Sp. Nov., a Halophilic, Anaerobic, Chitinolytic Bacterium from a Solar Saltern. Appl. Environ. Microbiol. 1992, 58, 260–266. [Google Scholar] [CrossRef] [Green Version]
  33. Kobayashi, T.; Kimura, B.; Fujii, T. Haloanaerobium Fermentans Sp. Nov., a Strictly Anaerobic, Fermentative Halophile Isolated from Fermented Puffer Fish Ovaries. Int. J. Syst. Evol. Microbiol. 2000, 50, 1621–1627. [Google Scholar] [CrossRef]
  34. Marui, J.; Boulom, S.; Panthavee, W.; Momma, M.; Kusumoto, K.-I.; Nakahara, K.; Saito, M. Culture-Independent Bacterial Community Analysis of the Salty-Fermented Fish Paste Products of Thailand and Laos. Biosci. Microbiota Food Health 2015, 2014–2018. [Google Scholar] [CrossRef] [Green Version]
  35. Kim, M.-S.; Park, E.-J. Bacterial Communities of Traditional Salted and Fermented Seafoods from Jeju Island of Korea Using 16S RRNA Gene Clone Library Analysis. J. Food Sci. 2014, 79, M927–M934. [Google Scholar] [CrossRef] [PubMed]
  36. Lorenzo, F.D.; Palmigiano, A.; Paciello, I.; Pallach, M.; Garozzo, D.; Bernardini, M.-L.; Cono, V.L.; Yakimov, M.M.; Molinaro, A.; Silipo, A. The Deep-Sea Polyextremophile Halobacteroides Lacunaris TB21 Rough-Type LPS: Structure and Inhibitory Activity towards Toxic LPS. Mar. Drugs 2017, 15, 201. [Google Scholar] [CrossRef] [PubMed]
  37. Mezghani, M.; Alazard, D.; Karray, F.; Cayol, J.-L.; Joseph, M.; Postec, A.; Fardeau, M.-L.; Tholozan, J.-L.; Sayadi, S. Halanaerobacter Jeridensis Sp. Nov., Isolated from a Hypersaline Lake. Int. J. Syst. Evol. Microbiol. 2012, 62, 1970–1973. [Google Scholar] [CrossRef] [PubMed]
  38. Varrella, S.; Tangherlini, M.; Corinaldesi, C. Deep Hypersaline Anoxic Basins as Untapped Reservoir of Polyextremophilic Prokaryotes of Biotechnological Interest. Mar. Drugs 2020, 18, 91. [Google Scholar] [CrossRef] [PubMed] [Green Version]
  39. Yang, G.; Wang, J. Pretreatment of Grass Waste Using Combined Ionizing Radiation-Acid Treatment for Enhancing Fermentative Hydrogen Production. Bioresour. Technol. 2018, 255, 7–15. [Google Scholar] [CrossRef] [PubMed]
Figure 1. Analysis of annotation and OTUs number of each sample. Total reads are related to the number of effective reads, while taxon reads are related to annotated reads. Unique reads refer to the number of reads with a frequency of 1 and only occur in one sample.
Fuels 02 00014 g001
Figure 2. Rarefaction curves of the three extremely halophilic microbial samples displaying the observed species number compared to the observed OTUs at a certain depth of sequencing.
Fuels 02 00014 g002
Figure 3. Venn diagram of the three extremely halophilic microbial samples. The number of the OTUs is shown inside the diagram. A total of 17, 5 and 61 unique OTUs were found in A1, B and A2, respectively, and 55 OTUs were shared among the three samples.
Fuels 02 00014 g003
Figure 4. The relative abundance of the three extremely halophilic microbial samples associated with ten different phyla, showing the dominance of Firmicutes in all of the samples.
Fuels 02 00014 g004
Figure 5. Krona analysis displaying the most abundant genera of the three extremely halophilic microbial samples. The names of the extremely halophilic microbial samples (A1, A2 and B) are written below each Krona figure.
Fuels 02 00014 g005
Figure 6. Dissimilarity coefficient heat map among A1, A2 and B samples, based on unweighted UniFrac (lower values, in brackets) and weighted UniFrac distances (upper values).
Fuels 02 00014 g006
Figure 7. OTU heat map. Blue color represents a low percentage of OTUs; red color represents a high percentage of OTUs to sample (filter by counts per OTU: 2000).
Fuels 02 00014 g007
Table 1. Alpha diversity indices.
Sample NameObserved
Species
SimpsonShannon–
Wiener
ACEChao1Good’s CoveragePD Whole Tree
A11090.1890.777117.204118.2311.00013.401
A21550.7913.152156.894155.6521.00014.512
B680.2280.90496.98799.6671.0006.243
Table 2. Phylogenetic identification results of the most abundant OTUs (data from [28]).
OTU NumberSequence Length (bp)Closest Relative (NCBI Accession Number)Similarity
OTU_128448Halanaerobium fermentans R-9 (NR 024715.1)99.55%
OTU_94447Halanaerobacter lacunarum TB21 (KJ677978.1)97.45%
OTU_40449Halanaerobacter lacunarum TB21 (KJ677978.1)97.51%
OTU_49450Halanaerobacter lacunarum TB21 (KJ677978.1)99.03%
OTU_158438Halanaerobacter lacunarum TB21 (KJ677978.1)96.79%
OTU_96438Halanaerobacter lacunarum TB21 (KJ677978.1)96.80%
Publisher’s Note: MDPI stays neutral with regard to jurisdictional claims in published maps and institutional affiliations.

