Article

Different Expression Patterns of Metabolic Reprogramming Proteins in Testicular Germ Cell Cancer

1
Department of Experimental and Clinical Medicine, University Magna Graecia, 88100 Catanzaro, Italy
2
de-Health Lab, Department of Mechanical, Energetic and Management Engineering, University of Calabria, 87036 Rende, Italy
3
Department of Pathological Anatomy “Pugliese-Ciaccio” Hospital, 88100 Catanzaro, Italy
4
Department of Pharmacy, Health and Nutritional Sciences, University of Calabria, 87036 Rende, Italy
5
Department of Clinical and Experimental Medicine, University of Catania, 95100 Catania, Italy
*
Authors to whom correspondence should be addressed.
These authors contributed equally to this manuscript and should be regarded as joint senior authors.
Endocrines 2022, 3(4), 578-589; https://doi.org/10.3390/endocrines3040049
Submission received: 28 August 2022 / Revised: 12 September 2022 / Accepted: 19 September 2022 / Published: 1 October 2022
(This article belongs to the Section Andrology and Male Sexual Function)

Abstract

:
Metabolic reprogramming is an emerging hallmark of cancer, involving the overexpression of metabolism-related proteins, such as glucose and monocarboxylate transporters and intracellular glycolytic enzymes. The biology of testicular germ cell tumors (TGCTs) is very complex, and although their metabolic profile has been scantily explored, some authors have recently reported that the metabolic rewiring of cancer cells resulted in an association with aggressive clinicopathological characteristics. In this study we have investigated, by immunohistochemical analysis, the expression of key proteins sustaining the hyperglycolytic phenotype in pure seminoma (SE, nr. 35), pure embryonal carcinoma (EC, nr. 17) tissues samples, and normal testes (nr. 5). GLUT1, CD44, PFK-1, MCT1, MCT4, LDH-A, and PDH resulted in more expression in EC cells compared to SE cells. TOM20 was more expressed in SE than in EC. GLUT1, MCT1, and MCT4 expression showed a statistically significant association with SE histology, while for EC, the association resulted in being significant only for GLUT1 and MCT4. Finally, we observed that EC resulted as negative for p53, suggesting that the GLUT1 and MTC overexpression observed in EC could be also attributed to p53 downregulation. In conclusion, our findings evidenced that EC exhibits a higher expression of markers of active aerobic glycolysis compared to SE, suggesting that the aggressive phenotype is associated with a higher glycolytic rate. These data corroborate the emerging evidence on the involvement of metabolic reprogramming in testicular malignancies as well, highlighting that the metabolic players should be explored in the future as promising therapeutic targets.

1. Introduction

Testicular germ cell tumors (TGCTs) are a rare group of neoplasms and the most common solid malignancy found in young male patients, with an increasing incidence rate in the last 4 decades [1,2,3,4]. TGCTs include two major histologic types: seminoma (SE) and non-seminomatous germ cell tumors; the latter, comprising embryonal carcinomas (EC), choriocarcinoma yolk sac tumors, and teratomas, can contain a mix of both seminomatous and non-seminomatous components. The histogenesis of TGCTs is very complex and has not yet been completely elucidated. Many authors have postulated that TGCTs develop from a premalignant intratubular germ cell neoplasia, also known as germ cell neoplasia in situ (GCNIS), arising from the failure of the gonocytes’ normal maturation during fetal or postnatal development [5]. Although most patients affected by TGCTs have good responses to platinum-based chemotherapy, about 10–20% of them are resistant to treatment and present unfavorable clinical outcomes [6,7]. Aneuploidies and recurrent mutations exert a crucial role in the pathogenesis of TGCTs [8]. Furthermore, the molecular mechanisms underlying the complex heterogeneity of TGCTs are poorly understood; therefore, the identification of new oncogenic events is essential to optimizing treatments and the management of TGCTs, mainly for poorly responding patients. In this respect, in recent years, researchers pointed out that the deregulation of cellular energetics, a consistent hallmark of cancer, could represent a possibly relevant biological mechanism [9]. Cancer cells tend to develop a process of metabolic reprogramming in which, even in the presence of oxygen, the production of energy through glycolysis is preferred, a phenomenon called the “Warburg effect”. This metabolic phenotype leads to the greater consumption of glucose and lactate production than are found in the normal metabolic profile, depending mostly on oxidative phosphorylation [9,10,11]. Although glycolysis is not an energy-efficient pathway, in cancer cells, it represents a faster way for anabolic reactions, enhancing the aggressive phenotype [12]. To preserve this phenotype, cancer cells upregulate some metabolism-related key proteins, such as glucose and monocarboxylate transporters, pH regulators, and intracellular glycolytic enzymes [12,13,14]. Therefore, the overexpression of these metabolic players could represent new prognostic factors, as well as promising therapeutic targets. Recently, two studies reported that the cellular metabolism of TGCTs switches toward a high rate of aerobic glycolysis and an acid-resistant phenotype, a result which is associated with a worse prognosis [15,16].
Therefore, starting from these emerging findings, we have investigated, by immunohistochemistry, the expression profile of some proteins involved in the metabolic reprogramming of pure human SE and EC tissues and their eventual involvement in glucose uptake and lactate shuttle.

2. Materials and Methods

2.1. Antibodies

The following primary antibodies were used: anti-MCT1 (sc-365501), anti-MCT4 (sc-376140), anti-GLUT1 (sc-377228), anti-LDHA (sc-137243), anti-PFK1 (sc-377346), anti-PDH (sc-37709), anti-PDK1 (sc-293160), anti-TOM20 (sc-17764), anti-3pGSK3 (sc-373800), anti-pAKT (sc-271966), and anti-p53 (sc-126; Santa Cruz Biotechnology, Santa Cruz, CA, USA); anti-CD44 (MA5-13890; Thermo Fisher Scientific, Meridian Rockford, IL, USA); and Vectastain Universal Elite ABC Kit and diaminobenzidine chromogen (DAB; Vector Laboratories, Burlingame, CA, USA).

2.2. Human Tissues

The investigation was performed on formalin-fixed and paraffin-embedded testicular tissues obtained from 5 Caucasian patients (aged 31–44 years) with sarcoidosis-like granulomatous lesions (controls) and 52 Caucasian patients with testicular germ cells cancer (aged 25–59 years; 35 SEs and 17 ECs undergoing therapeutic orchidectomy). Only primary tumors before chemotherapy were selected. Tumor samples were provided from the archives of the Division of Pathology, Hospital A. Pugliese, Catanzaro, Italy. The clinicopathological data included age, date of diagnosis, histological type, tumor grade (when applicable), and the presence of vascular invasion, according to Italian testicular cancer guidelines [17]. All patients gave their informed consent to use the remaining portions of their tissue specimens for research purposes after their primary use for routine histologic staining. Therefore, for this study, no formal ethical approval was required for processing archival testicular tissue.

2.3. Histopathological Analysis

Morphological analysis of the controls and tumor samples was performed by Hematoxylin–Eosin staining. The histology slides were examined by three independent pathologists who were blinded to the clinical diagnosis and the observations made by the other pathologists. A careful description of tissue structural features and cellular components was performed on each sample analyzed.

2.4. Immunohistochemistry

The immunohistochemical experiments were carried out on paraffin-embedded sections from all samples. Sections that were 5 μm thick, after heat-mediated antigen retrieval, were obtained. Immunodetection was performed at 4 °C overnight, using the following specific primary antibodies: anti-MCT1 (1:100), anti-MCT4 (1:100), anti-GLUT1 (1:100), anti-CD44 (1:250), anti-PFK1(1:200), anti-LDHA (1:100), anti-PDH (1:100), anti-PDK1(1:200), anti-TOM20 (1:200), anti-pGSK3(1:200), anti-pAKT (1:250), and anti-p53 (1:200). Then, biotinylated IgG (1:600) was applied for 1 h at room temperature, followed by avidin-biotin complex (ABC)/horseradish peroxidase (HRP). Immunoreactivity was visualized by using diaminobenzidine chromogen (DAB). Sections were also counterstained with hematoxylin. The specificity of the Abs (antibodies) was verified by using normal rabbit serum and normal mouse serum, respectively, instead of the primary Abs. After immunohistochemical analysis, slides of the tumor samples were visualized using an Olympus BX41 microscope, and the images were taken with CSV1.14 software using a CAM XC-30 for image acquisition.

2.5. Scoring System

Immunoreactivity for the neoplastic tissues was scored as negative (0), weakly positive (1), moderately positive (2), positive (3), or strongly positive (4). For each sample, the most frequent score among the three independent observers was chosen. A minimum of 100 cells were evaluated in each slide. Seven serial sections were scored for each sample.

2.6. Statistical Analysis

The intensity score is presented as the median (IQR) of the sample groups (control, SE, and EC). The groups’ scores were compared using the Kruskal–Wallis test and the Wilcoxon test as the post hoc test. The frequency of protein expression, calculated as the proportion of positive cancerous cells in the total count of cancerous cells, as well as the comparison with clinicopathological data, were analyzed using one-way ANOVA and the Wilcoxon test as the post hoc test. The area under the ROC curve (AUC) was calculated to measure the ability of the markers to discriminate between SE and EC. A p-value < 0.05 was considered significant. All analyses were conducted with R (4.2.1).

3. Results

3.1. Morphological Analysis

The morphological analysis of the control testes showed normal seminiferous tubules with germ, Sertoli, and Leydig cells in the interstitial tissue. The same analysis in the SE samples showed large cells with clear cytoplasm and hyperchromatic nuclei with prominent nucleoli. The SE cells were arranged in small clusters separated by connective tissue, frequently presenting lymphocytic infiltrate. The tumor samples of EC showed the distinctive sheets, papillary, and glands structures of primitive epithelial cells with crowded pleomorphic nuclei. The EC cells were arranged in several architectural patterns, and multiple foci of necrosis were observed. Lymphocytic infiltrates and granulomatous reactions were rare (Figure 1).

3.2. Immunohistochemical Localization Markers of Aerobic Glycolysis in Control Testis and TGCTs

The immunoreactivity of the aerobic glycolysis markers showed an increased expression in the tumor samples, particularly in EC. GLUT1 appeared to be strongly expressed in the cytoplasmic membranes of the embryonic carcinoma cells, less expressed in the seminomatous cells, and completely absent in the control sections. The CD44 expression showed the same expression pattern as GLUT1 versus control although the localization was confined to the stromal cells. An increased expression of PFK-1 was evident in the EC samples versus both the control and SE samples (Figure 2; Table 1).

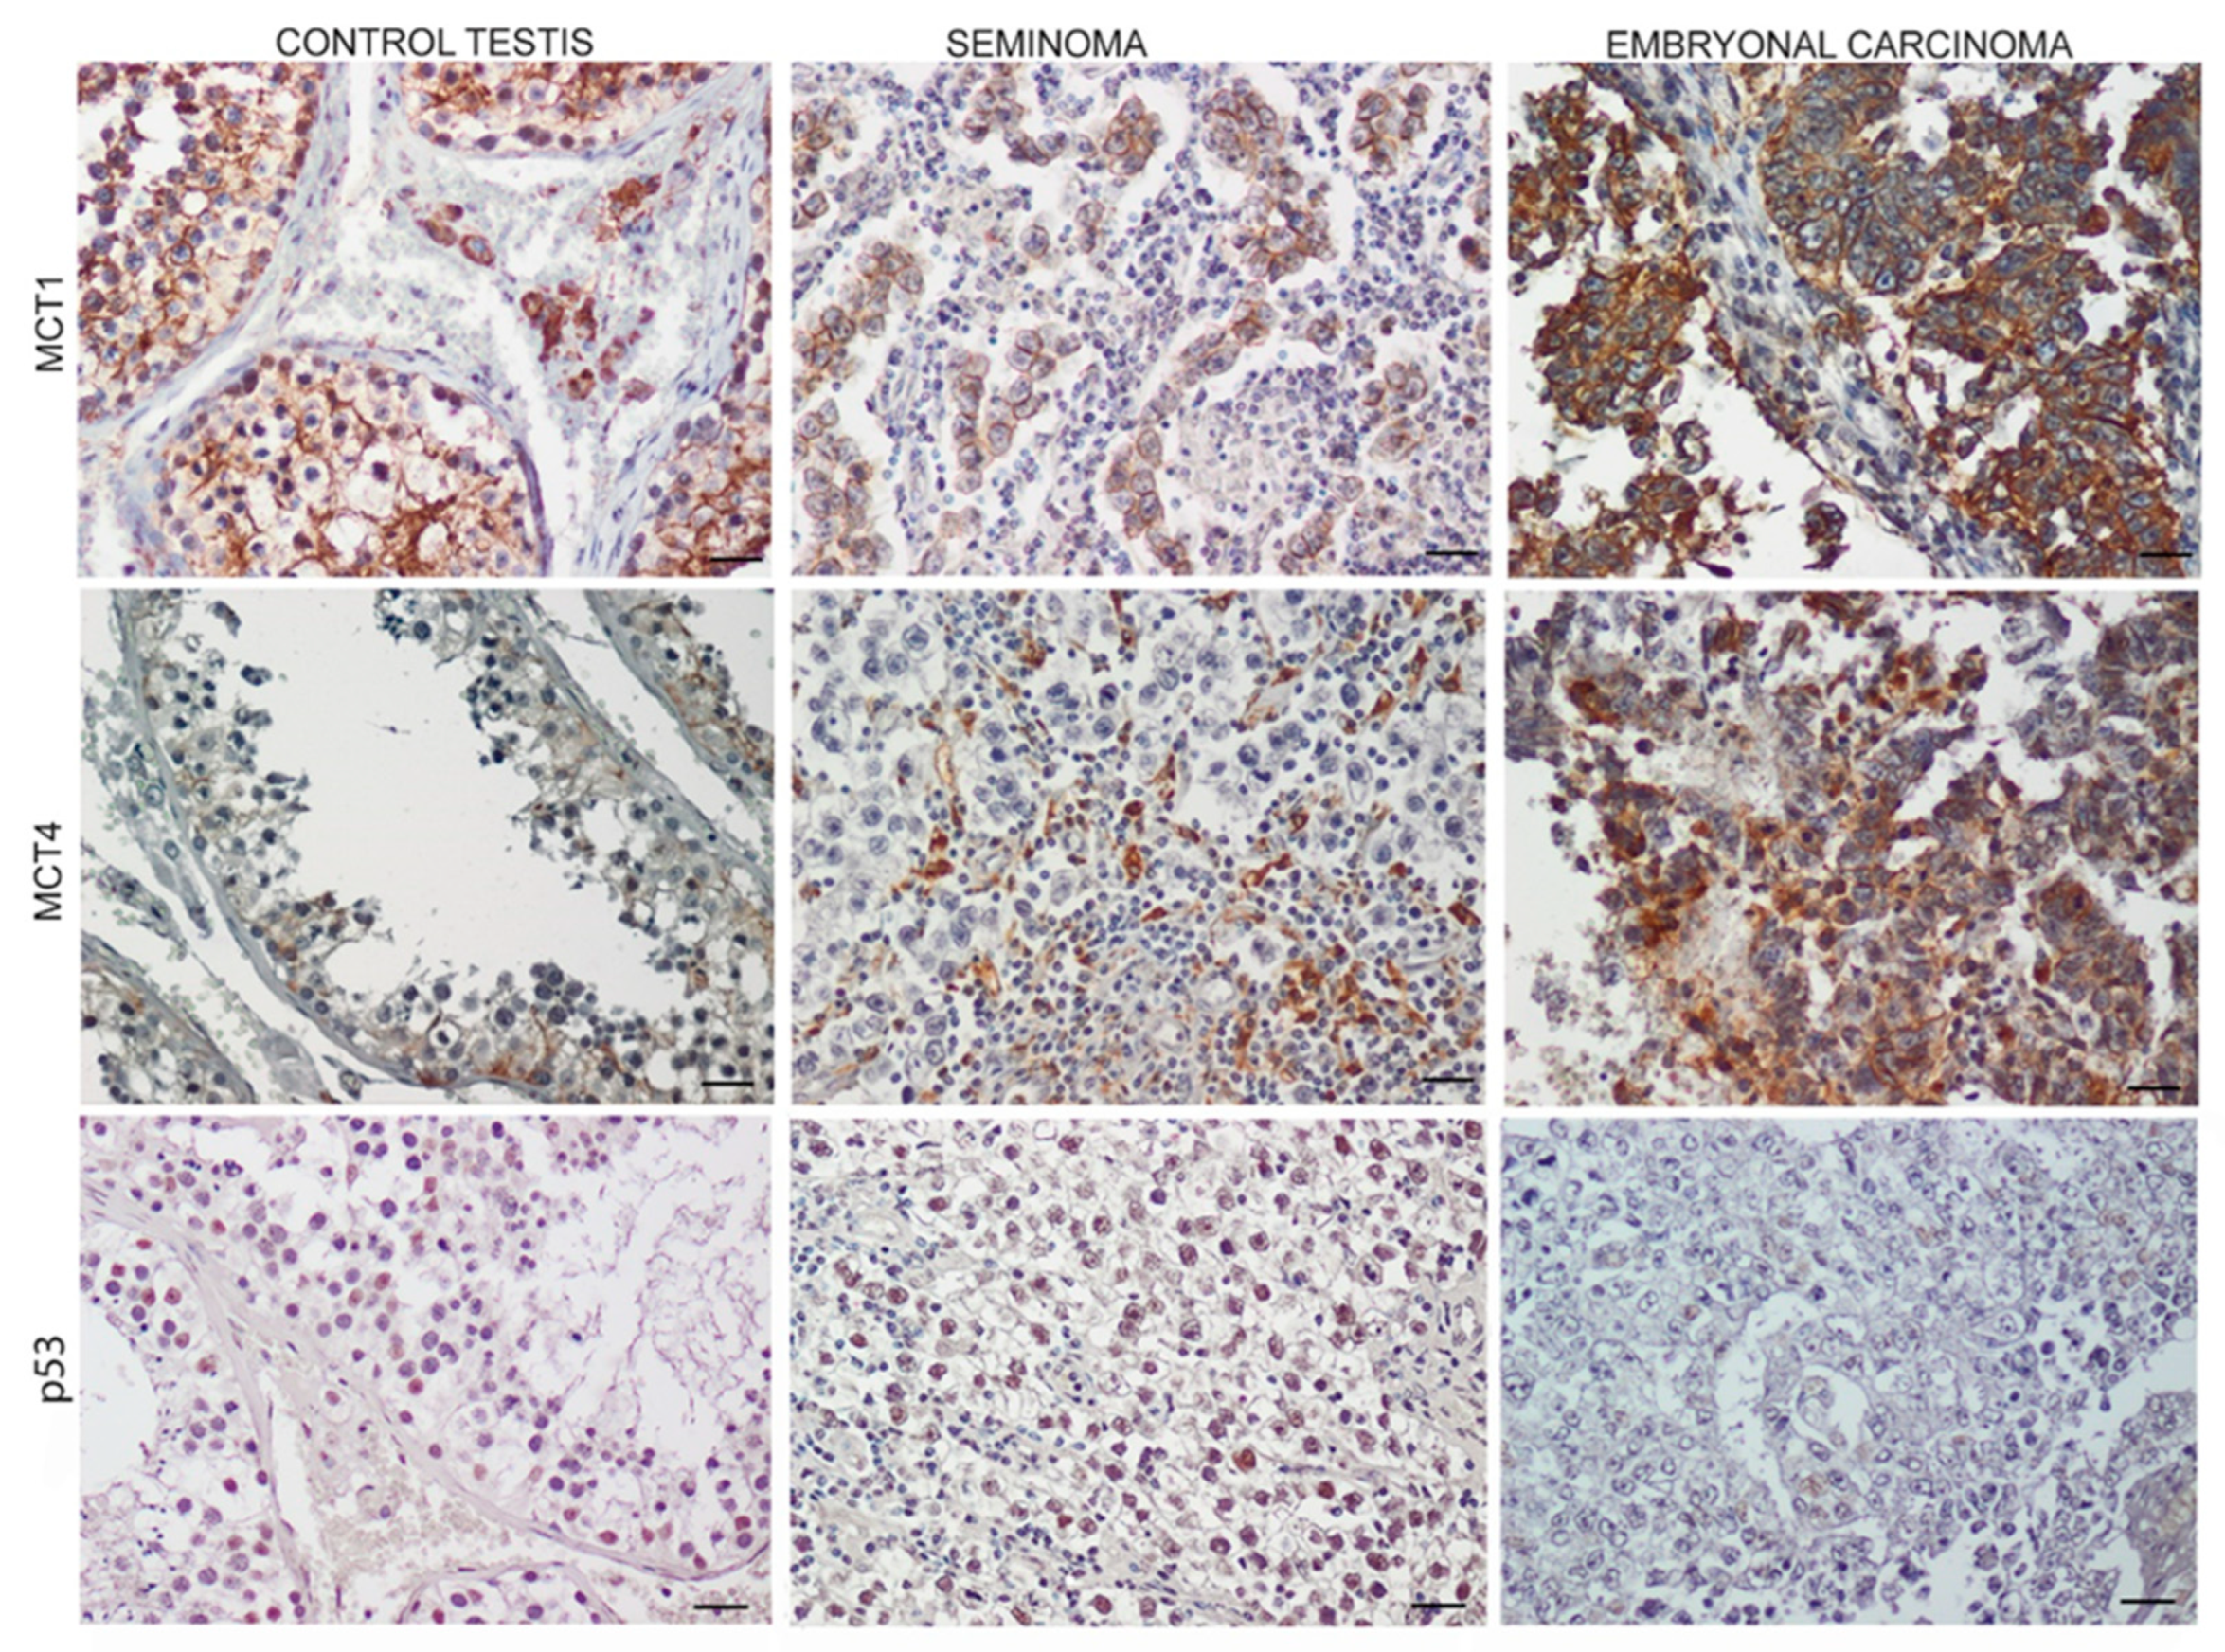
3.3. Monocarboxylate Transporters 1 (MCT1),4 (MCT4) and p53 Expression in TGCTs

Figure 3 summarizes the MCT1 and MCT4 expressions in the normal, SE, and EC samples. A significant increase in both the MCT1 and MCT4 expression was observed in the EC tissues compared to the SE and control samples. In the control samples, MCT1 was strongly expressed in the Sertoli cell membranes, while in both SE and EC, the localization was restricted to tumoral cell membranes at different intensities. As for MCT4, weak staining was evident in the controls, while in the SE sections, the localization was confined to the connective compartment around the tumor cells. Conversely, EC showed a very strong localization in tumoral cells. Regarding p53 expression, our results showed the absence in the EC samples compared to the SE and control tissues. (Figure 3; Table 2).

3.4. LDH-A Pattern Expression in TGCTs

The conversion of pyruvate to lactate increased the LDH-A expression mainly in EC. This high expression could be influenced by the intracellular signaling necessary for cell proliferation. Our immunohistochemical results showed an increased expression of pAKT and pGSK3β in EC compared to SE and the control, highlighting the involvement of the PI3K pathway activation in the hyperglycolytic phenotype of this cancer (Figure 4; Table 3).

3.5. Oxidative Mitochondrial Protein Expression

Figure 5 showed the overexpression of pyruvate dehydrogenase (PDH) in EC compared to the control and SE samples, occurring concomitantly with the downregulation of its inhibitor, PDK1. Furthermore, TOM20 resulted in expression in both SE and EC although in the latter, the expression was lower (Figure 5; Table 4).

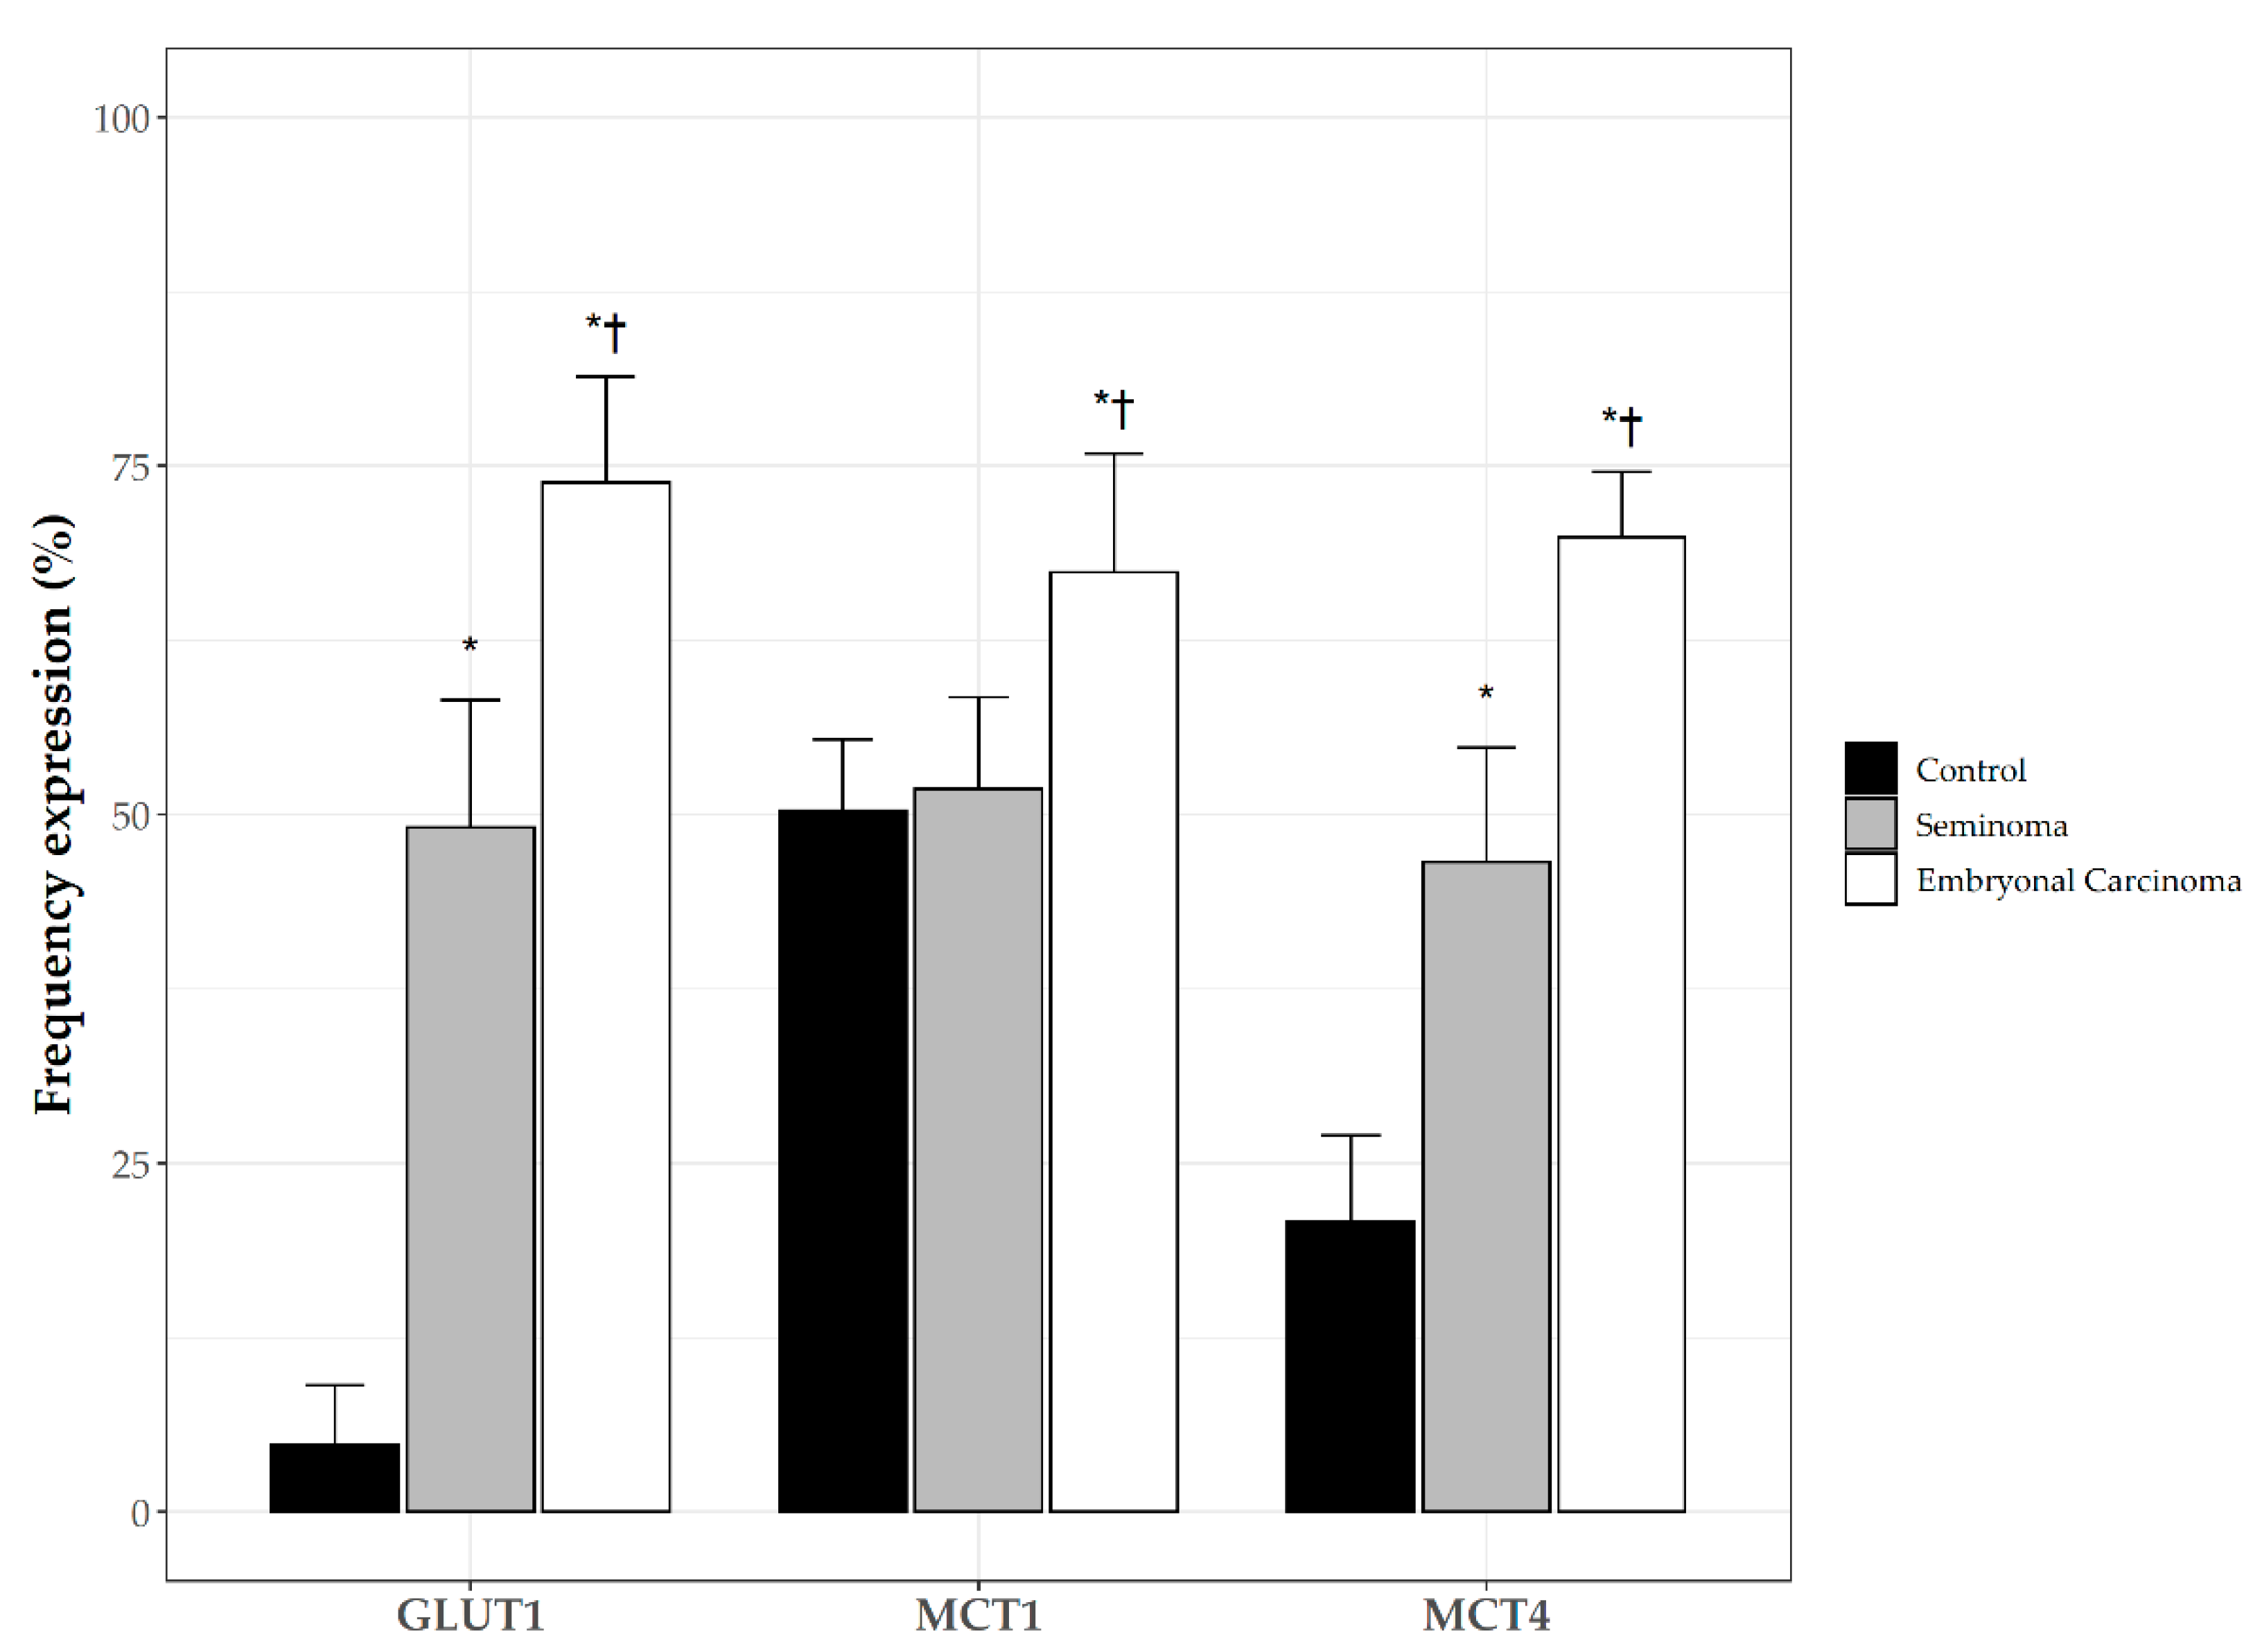
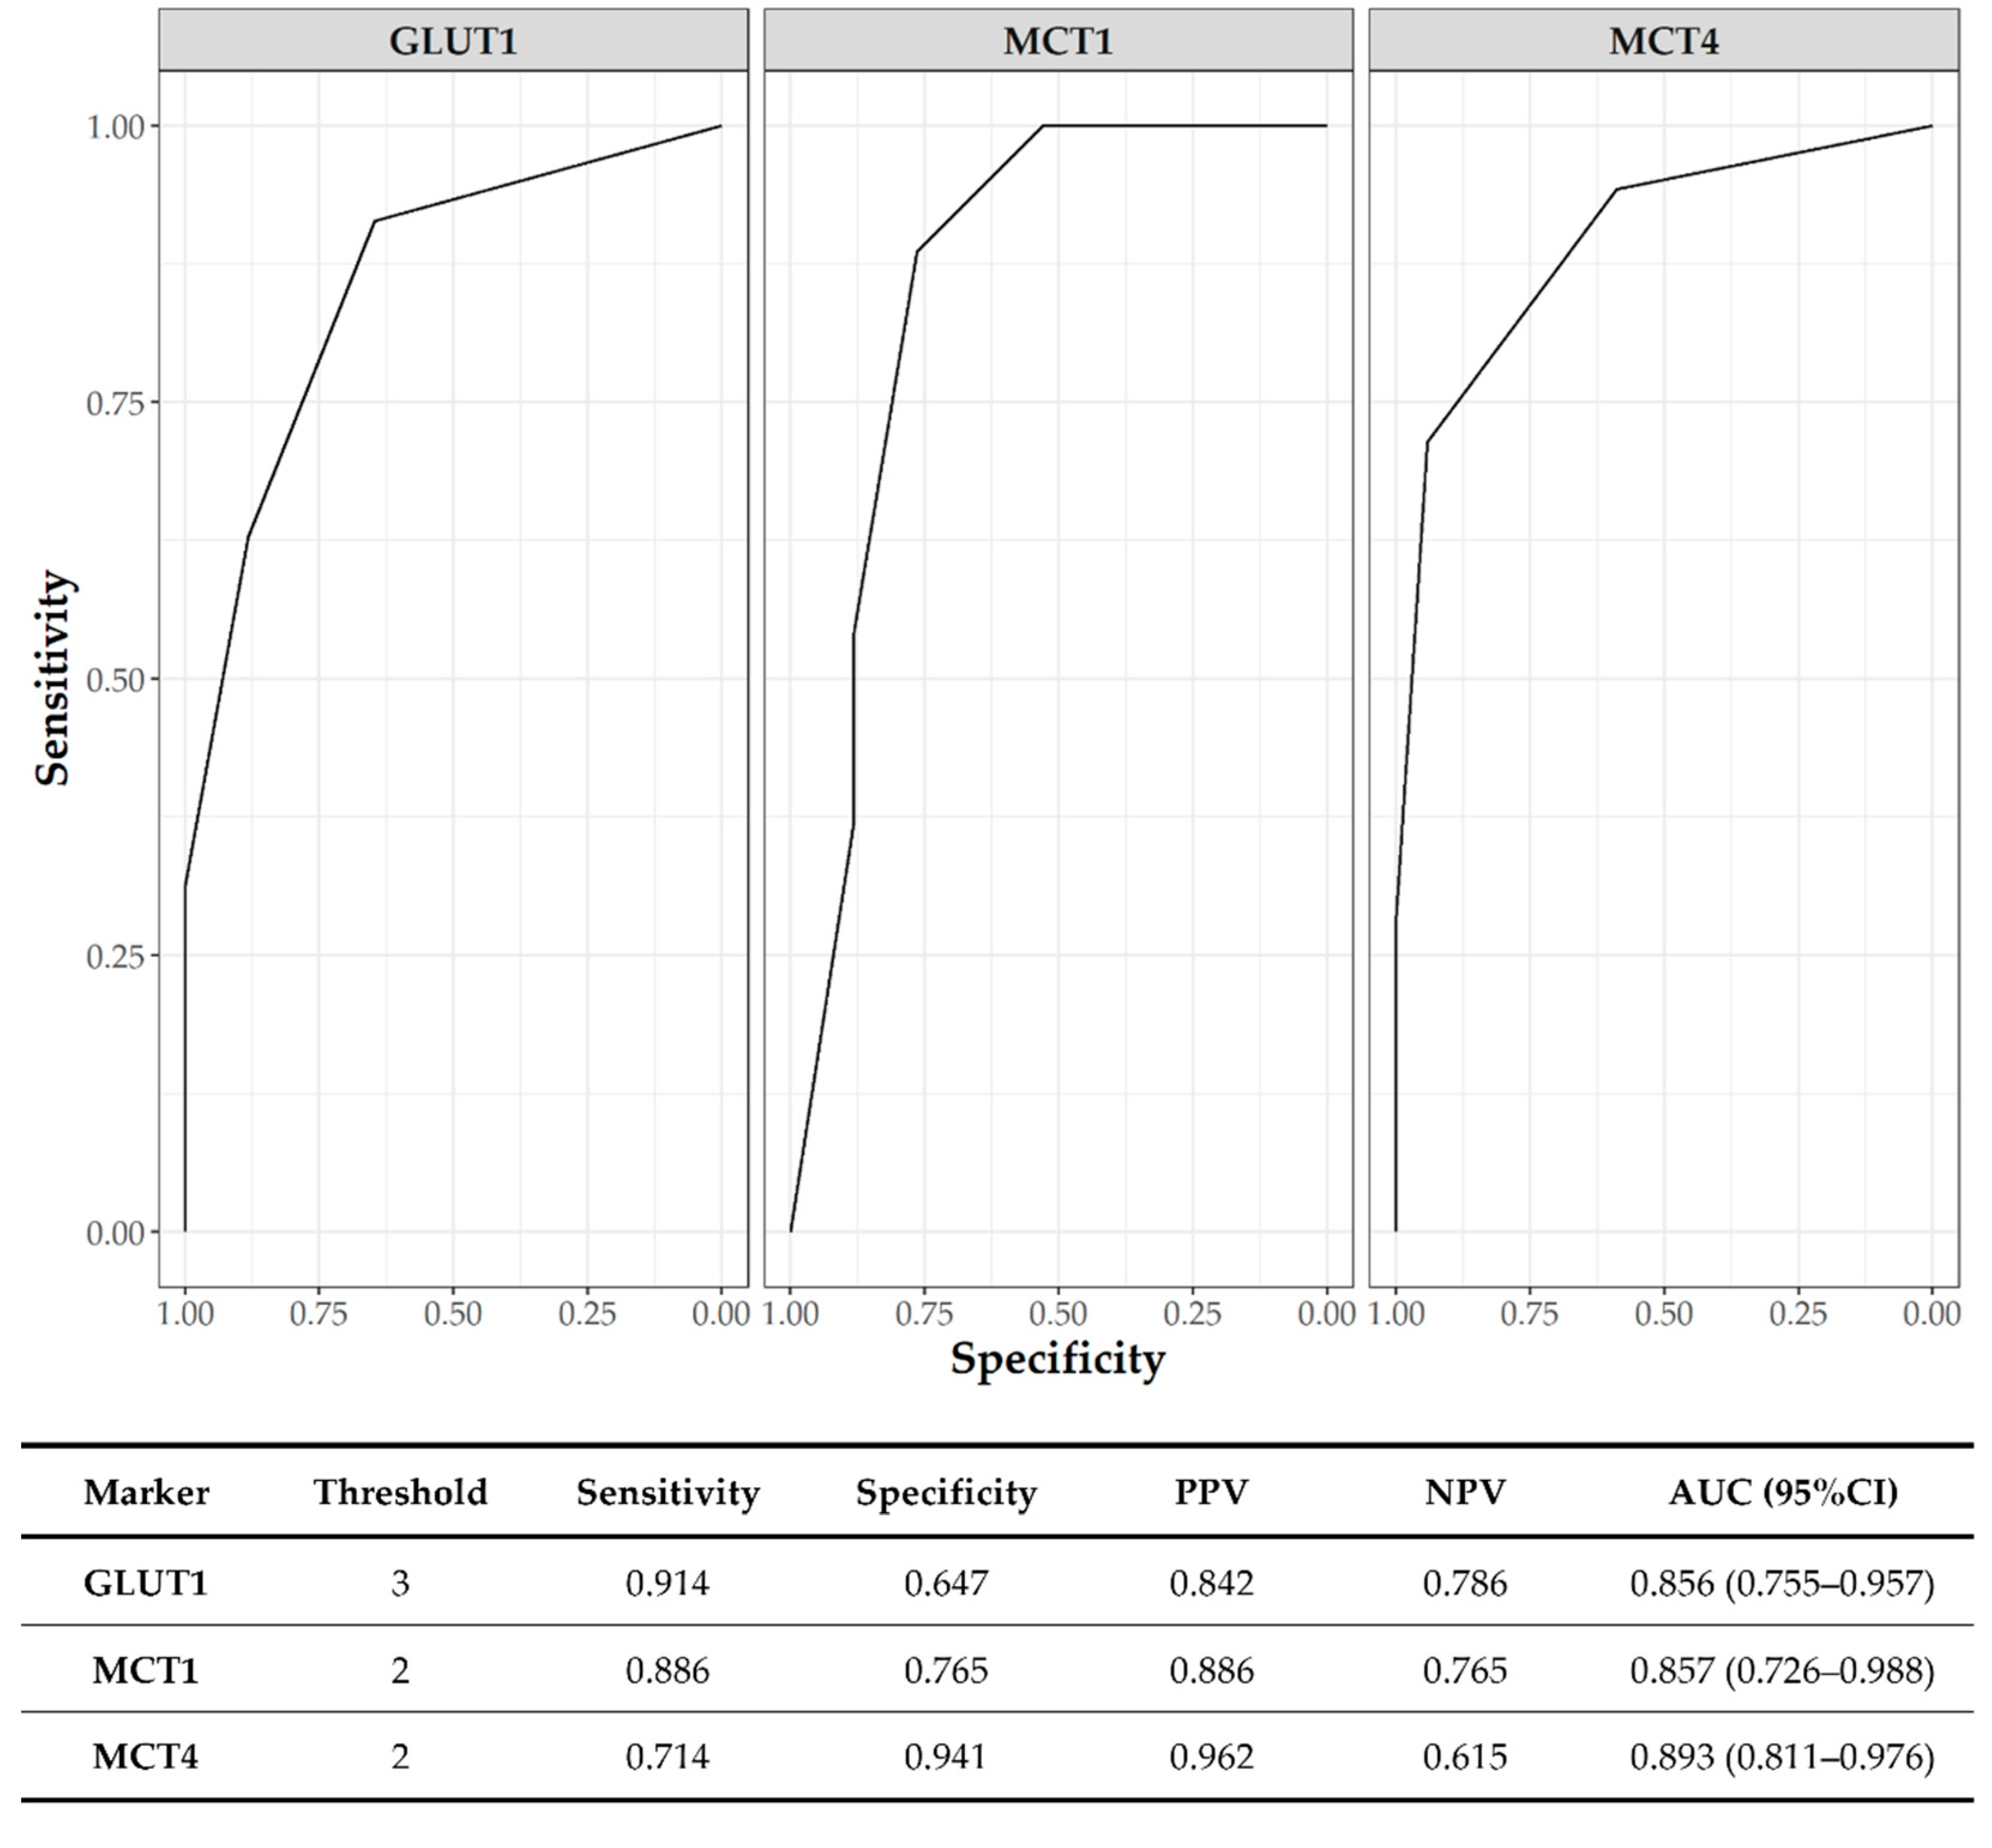
3.6. Clinicopathological Significance of GLUT1 and MCTs

Compared to the control samples (Figure 6), both SE and EC significantly overexpressed GLUT1 and MCT4 (p < 0.05). MCT1 expression was significantly increased in the EC samples compared to the SE and the controls (p < 0.05).
Table 5 shows the associations between GLUT1, MCT1, and MCT4 expression and the patients’ clinicopathological parameters. All of the metabolism-related proteins showed a statistically significant association with SE histology; for EC, the association resulted in being significant only for GLUT1 and MCT4. Finally, our analysis revealed that the glucose and MTC transporters showed higher expressions regardless of tumor T stage, even if the number of samples of T3/4 samples was insufficient to draw meaningful conclusions.
Figure 7 shows the ROC curve analysis of GLUT1, MCT1, and MCT4 on tumor samples for the discrimination of SE from EC. All of the markers showed an AUC > 0.85. The best score threshold defined by the ROC curves was 3 for GLUT1 and 2 for both MCTs.

4. Discussion

In this study, we have shown the different expression patterns of key proteins involved in the metabolic reprogramming between pure seminoma and pure embryonal carcinoma, highlighting that EC exhibits a higher expression of markers of active aerobic glycolysis compared to SE, suggesting that the aggressive phenotype is associated with a higher glycolytic rate.
It is well-known that, in cancer cells, the Warburg effect leads to an overproduction of lactate that can be used by cells as fuel and potent signaling molecules, leading to cancer metastasis [9,18,19,20]. The significance of the overexpression of glucose and monocarboxylase transporters in glycolytic tumors has been extensively studied, demonstrating that it is associated with tumor aggressiveness and poor prognosis [21,22,23,24,25,26].
Few authors have investigated the expression levels of key markers involved in the metabolic reprogramming in TGCTs, and the currently available immunohistochemical studies have shown an increased expression of GLUT1, CD44, MTC1, and MCT4, resulting in an association with characteristics of worse prognoses and shorter survival rates [15,16]. Our results are in agreement with these findings, and they highlight that, compared to SE, in EC, the overexpression of the different proteins regulating metabolic reprogramming, working together, strongly favors the Warburg effect. In particular, we observed that, compared to SE, EC overexpressed GLUT1, CD44, MCT1, and MCT4. However, conversely to SE [27], EC resulted as negative for p53. The latter finding is relevant because, in addition to promoting apoptosis, p53 can suppress GLUT1 and MCT1 transcription [28], suggesting that p53 down-regulation could favor the increased glycolytic rate observed in the more aggressive histotype. Furthermore, EC showed overexpression of PFK-1, the key regulator and rate-limiter of glycolysis steps, promoting the use of glucose in aerobic glycolysis, resulting in overexpression in many types of cancer, and correlating with shorter overall survival rates and the increased frequency of metastases [29]. Concomitantly, compared to SE, in EC we found a marked expression of the isozyme LDH-A, which exerts a critical contribution to aerobic glycolysis in testicular cancer cells [30], and the overexpression of which, in many cancer cells, results in an association with an increased rate of tumor invasion [31,32,33,34]. Furthermore, in tumor cells, the transcription of the LDHA gene, as well as that of glucose transporters, can be increased by PI3K signaling activation, occurring via pAKT-induced GSK3-β inhibition [12,35]. Interestingly, EC tissues overexpressed both pAKT and the inactive form of GSK3β, pGSK3βser9. Conversely, pGSK3βser9 was absent in normal tissue and poorly expressed in SE. These findings could have an important relevance in EC, as, apart from the role of GSK3β in metabolic reprogramming, some studies have demonstrated that active GSK3β can act as a tumor suppressor, and that the overexpression of inactive pGSK3βser9 could have a role in tumorigenesis and tumor progression [36,37,38]. Different studies have reported that, to fulfill the high energy requirement for anabolism [39], the mitochondrial function in cancer cells can be preserved [40,41,42]. Therefore, we investigated the expression of markers sustaining the mitochondrial mass and metabolic activity [43], including TOM20 which resulted in being overexpressed in different cancers [40,41,42]. In EC, we found an overexpression of PDH concomitantly with the downregulation of PDK1, indicating that pyruvate enters the oxidative phosphorylation pathway and is used by cancer cells. However, in EC we found lower TOM20 staining compared to that in SE, suggesting that in EC, the lower mitochondrial function and the high glycolytic behavior could represent a further marker of tumor aggressiveness.
Although our findings are in agreement with what has been reported by the Human Protein Atlas (https://www.proteinatlas.org/humanproteome/pathology/testis+cancer, accessed on 15 June 2022), we are aware that our study has some limitations. First of all, the sample size of the EC group is too small although it should be considered that TGCTs are rare tumors and that we have included only pure EC and SE. Therefore, the results emerging from the analysis of the clinicopathological significance of GLUT1, MCT1, and MCT4, mainly in EC, need confirmation via further research. That applies particularly to the findings showing that the glucose and MTC transporters have a higher expression regardless of tumor T stage because the number of T3/4 samples is insufficient to draw meaningful conclusions.

5. Conclusions

Collectively, our immunohistochemical evaluation could support the emerging role of metabolic rewiring in TGCTs’ pathogenesis and progression, even if we cannot provide a mechanistic explanation for our findings that may apply to the clinical context at present. However, mainly because of the low prevalence of TGCTs, multicentric studies are warranted to achieve a better understanding of the clinico-pathological significance of the expression of the metabolic-reprogramming proteins in both seminoma and non-seminoma, providing new evidence for future therapeutic strategies.

Author Contributions

Conceptualization, V.R. and A.P.; methodology, D.L., S.B., L.M. and I.C.; software, D.L.; investigation, V.R., S.B. and A.P.; resources, L.T. and A.A.; writing—review and editing, VR, A.P., D.L., S.A. and A.A.; supervision, S.L.V. and S.A. All authors have read and agreed to the published version of the manuscript.

Funding

This research received no external funding.

Informed Consent Statement

Informed consent was obtained from all subjects involved in the study.

Data Availability Statement

Not applicable.

Conflicts of Interest

The authors declare no conflict of interest.

References

  1. Schneider, D.T.; Calaminus, G.; Koch, S.; Teske, C.; Schmidt, P.; Haas, R.J.; Harms, D.; Göbel, U. Epidemiologic Analysis of 1,442 Children and Adolescents Registered in the German Germ Cell Tumor Protocols. Pediatr. Blood Cancer 2004, 42, 169–175. [Google Scholar] [CrossRef] [PubMed]
  2. Nallu, A.; Mannuel, H.D.; Hussain, A. Testicular Germ Cell Tumors: Biology and Clinical Update. Curr. Opin. Oncol. 2013, 25, 266–272. [Google Scholar] [CrossRef] [PubMed]
  3. Batool, A.; Liu, X.-M.; Zhang, C.-L.; Hao, C.-F.; Chen, S.-R.; Liu, Y.-X. Recent Advances in the Regulation of Testicular Germ Cell Tumors by MicroRNAs. Front. Biosci. Landmark Ed. 2019, 24, 765–776. [Google Scholar] [CrossRef] [PubMed]
  4. Ghazarian, A.A.; Rusner, C.; Trabert, B.; Braunlin, M.; McGlynn, K.A.; Stang, A. Testicular Cancer among US Men Aged 50 Years and Older. Cancer Epidemiol. 2018, 55, 68–72. [Google Scholar] [CrossRef]
  5. Berney, D.M.; Looijenga, L.H.J.; Idrees, M.; Oosterhuis, J.W.; Rajpert-De Meyts, E.; Ulbright, T.M.; Skakkebaek, N.E. Germ Cell Neoplasia in Situ (GCNIS): Evolution of the Current Nomenclature for Testicular Pre-Invasive Germ Cell Malignancy. Histopathology 2016, 69, 7–10. [Google Scholar] [CrossRef] [PubMed]
  6. Rajpert-De Meyts, E.; McGlynn, K.A.; Okamoto, K.; Jewett, M.A.S.; Bokemeyer, C. Testicular Germ Cell Tumours. Lancet Lond. Engl. 2016, 387, 1762–1774. [Google Scholar] [CrossRef]
  7. Piulats, J.M.; Jiménez, L.; García del Muro, X.; Villanueva, A.; Viñals, F.; Germà-Lluch, J.R. Molecular Mechanisms behind the Resistance of Cisplatin in Germ Cell Tumours. Clin. Transl. Oncol. Off. Publ. Fed. Span. Oncol. Soc. Natl. Cancer Inst. Mex. 2009, 11, 780–786. [Google Scholar] [CrossRef] [PubMed]
  8. Litchfield, K.; Levy, M.; Huddart, R.A.; Shipley, J.; Turnbull, C. The Genomic Landscape of Testicular Germ Cell Tumours: From Susceptibility to Treatment. Nat. Rev. Urol. 2016, 13, 409–419. [Google Scholar] [CrossRef]
  9. Pavlova, N.N.; Thompson, C.B. The Emerging Hallmarks of Cancer Metabolism. Cell Metab. 2016, 23, 27–47. [Google Scholar] [CrossRef] [PubMed] [Green Version]
  10. Warburg, O. On the Origin of Cancer Cells. Science 1956, 123, 309–314. [Google Scholar] [CrossRef] [PubMed]
  11. Hanahan, D.; Weinberg, R.A. Hallmarks of Cancer: The next Generation. Cell 2011, 144, 646–674. [Google Scholar] [CrossRef] [PubMed] [Green Version]
  12. DeBerardinis, R.J.; Lum, J.J.; Hatzivassiliou, G.; Thompson, C.B. The Biology of Cancer: Metabolic Reprogramming Fuels Cell Growth and Proliferation. Cell Metab. 2008, 7, 11–20. [Google Scholar] [CrossRef] [PubMed] [Green Version]
  13. Pinheiro, C.; Longatto-Filho, A.; Azevedo-Silva, J.; Casal, M.; Schmitt, F.C.; Baltazar, F. Role of Monocarboxylate Transporters in Human Cancers: State of the Art. J. Bioenerg. Biomembr. 2012, 44, 127–139. [Google Scholar] [CrossRef] [PubMed] [Green Version]
  14. Yang, Y.; Ren, P.; Liu, X.; Sun, X.; Zhang, C.; Du, X.; Xing, B. PPP1R26 Drives Hepatocellular Carcinoma Progression by Controlling Glycolysis and Epithelial-Mesenchymal Transition. J. Exp. Clin. Cancer Res. 2022, 41, 101. [Google Scholar] [CrossRef]
  15. Bonatelli, M.; Silva, E.C.A.; Cárcano, F.M.; Zaia, M.G.; Lopes, L.F.; Scapulatempo-Neto, C.; Pinheiro, C. The Warburg Effect Is Associated With Tumor Aggressiveness in Testicular Germ Cell Tumors. Front. Endocrinol. 2019, 10, 417. [Google Scholar] [CrossRef]
  16. Silva, E.C.A.; Cárcano, F.M.; Bonatelli, M.; Zaia, M.G.; Morais-Santos, F.; Baltazar, F.; Lopes, L.F.; Scapulatempo-Neto, C.; Pinheiro, C. The Clinicopathological Significance of Monocarboxylate Transporters in Testicular Germ Cell Tumors. Oncotarget 2018, 9, 20386–20398. [Google Scholar] [CrossRef] [Green Version]
  17. AIOM—Associazione Italiana di Oncologia Medica Tumore del Testicolo: Linee Guida 2021. Available online: https://www.aiom.it/wp-content/uploads/2021/11/2021_LGAIOM_TumoreTesticolo (accessed on 15 May 2022).
  18. Pavlides, S.; Whitaker-Menezes, D.; Castello-Cros, R.; Flomenberg, N.; Witkiewicz, A.K.; Frank, P.G.; Casimiro, M.C.; Wang, C.; Fortina, P.; Addya, S.; et al. The Reverse Warburg Effect: Aerobic Glycolysis in Cancer Associated Fibroblasts and the Tumor Stroma. Cell Cycle Georget. Tex 2009, 8, 3984–4001. [Google Scholar] [CrossRef] [Green Version]
  19. Sonveaux, P.; Végran, F.; Schroeder, T.; Wergin, M.C.; Verrax, J.; Rabbani, Z.N.; De Saedeleer, C.J.; Kennedy, K.M.; Diepart, C.; Jordan, B.F.; et al. Targeting Lactate-Fueled Respiration Selectively Kills Hypoxic Tumor Cells in Mice. J. Clin. Investig. 2008, 118, 3930–3942. [Google Scholar] [CrossRef] [Green Version]
  20. Romero-Garcia, S.; Moreno-Altamirano, M.M.B.; Prado-Garcia, H.; Sánchez-García, F.J. Lactate Contribution to the Tumor Microenvironment: Mechanisms, Effects on Immune Cells and Therapeutic Relevance. Front. Immunol. 2016, 7, 52. [Google Scholar] [CrossRef] [Green Version]
  21. Pertega-Gomes, N.; Felisbino, S.; Massie, C.E.; Vizcaino, J.R.; Coelho, R.; Sandi, C.; Simoes-Sousa, S.; Jurmeister, S.; Ramos-Montoya, A.; Asim, M.; et al. A Glycolytic Phenotype Is Associated with Prostate Cancer Progression and Aggressiveness: A Role for Monocarboxylate Transporters as Metabolic Targets for Therapy. J. Pathol. 2015, 236, 517–530. [Google Scholar] [CrossRef] [Green Version]
  22. García-Cañaveras, J.C.; Chen, L.; Rabinowitz, J.D. The Tumor Metabolic Microenvironment: Lessons from Lactate. Cancer Res. 2019, 79, 3155–3162. [Google Scholar] [CrossRef] [PubMed] [Green Version]
  23. Payen, V.L.; Mina, E.; Van Hée, V.F.; Porporato, P.E.; Sonveaux, P. Monocarboxylate Transporters in Cancer. Mol. Metab. 2020, 33, 48–66. [Google Scholar] [CrossRef]
  24. Pęcak, A.; Skalniak, Ł.; Pels, K.; Książek, M.; Madej, M.; Krzemień, D.; Malicki, S.; Władyka, B.; Dubin, A.; Holak, T.A.; et al. Anti-CD44 DNA Aptamers Selectively Target Cancer Cells. Nucleic Acid Ther. 2020, 30, 289–298. [Google Scholar] [CrossRef] [PubMed]
  25. Hao, J.; Chen, H.; Madigan, M.C.; Cozzi, P.J.; Beretov, J.; Xiao, W.; Delprado, W.J.; Russell, P.J.; Li, Y. Co-Expression of CD147 (EMMPRIN), CD44v3-10, MDR1 and Monocarboxylate Transporters Is Associated with Prostate Cancer Drug Resistance and Progression. Br. J. Cancer 2010, 103, 1008–1018. [Google Scholar] [CrossRef] [PubMed] [Green Version]
  26. Slomiany, M.G.; Grass, G.D.; Robertson, A.D.; Yang, X.Y.; Maria, B.L.; Beeson, C.; Toole, B.P. Hyaluronan, CD44, and Emmprin Regulate Lactate Efflux and Membrane Localization of Monocarboxylate Transporters in Human Breast Carcinoma Cells. Cancer Res. 2009, 69, 1293–1301. [Google Scholar] [CrossRef] [Green Version]
  27. Perri, A.; Rago, V.; Malivindi, R.; Maltese, L.; Lofaro, D.; Greco, E.A.; Tucci, L.; Bonofiglio, R.; Vergine, M.; Vignera, S.L.; et al. Overexpression of P75ntr in Human Seminoma: A New Biomarker? Life 2021, 11, 629. [Google Scholar] [CrossRef]
  28. Itahana, Y.; Itahana, K. Emerging Roles of P53 Family Members in Glucose Metabolism. Int. J. Mol. Sci. 2018, 19, 776. [Google Scholar] [CrossRef] [Green Version]
  29. Kotowski, K.; Rosik, J.; Machaj, F.; Supplitt, S.; Wiczew, D.; Jabłońska, K.; Wiechec, E.; Ghavami, S.; Dzięgiel, P. Role of PFKFB3 and PFKFB4 in Cancer: Genetic Basis, Impact on Disease Development/Progression, and Potential as Therapeutic Targets. Cancers 2021, 13, 909. [Google Scholar] [CrossRef]
  30. Zhou, S.; Min, Z.; Sun, K.; Qu, S.; Zhou, J.; Duan, H.; Liu, H.; Liu, X.; Gong, Z.; Li, D. MiR-199a-3p/Sp1/LDHA Axis Controls Aerobic Glycolysis in Testicular Tumor Cells. Int. J. Mol. Med. 2018, 42, 2163–2174. [Google Scholar] [CrossRef] [Green Version]
  31. Kennedy, K.M.; Dewhirst, M.W. Tumor Metabolism of Lactate: The Influence and Therapeutic Potential for MCT and CD147 Regulation. Future Oncol. Lond. Engl. 2010, 6, 127–148. [Google Scholar] [CrossRef] [Green Version]
  32. Brodsky, A.N.; Odenwelder, D.C.; Harcum, S.W. High Extracellular Lactate Causes Reductive Carboxylation in Breast Tissue Cell Lines Grown under Normoxic Conditions. PLoS ONE 2019, 14, e0213419. [Google Scholar] [CrossRef] [PubMed]
  33. Das, C.K.; Parekh, A.; Parida, P.K.; Bhutia, S.K.; Mandal, M. Lactate Dehydrogenase A Regulates Autophagy and Tamoxifen Resistance in Breast Cancer. Biochim. Biophys. Acta Mol. Cell Res. 2019, 1866, 1004–1018. [Google Scholar] [CrossRef] [PubMed]
  34. Jafary, F.; Ganjalikhany, M.R.; Moradi, A.; Hemati, M.; Jafari, S. Novel Peptide Inhibitors for Lactate Dehydrogenase A (LDHA): A Survey to Inhibit LDHA Activity via Disruption of Protein-Protein Interaction. Sci. Rep. 2019, 9, 4686. [Google Scholar] [CrossRef] [PubMed] [Green Version]
  35. MacDonald, B.T.; Tamai, K.; He, X. Wnt/Beta-Catenin Signaling: Components, Mechanisms, and Diseases. Dev. Cell 2009, 17, 9–26. [Google Scholar] [CrossRef] [PubMed] [Green Version]
  36. Ding, Q.; He, X.; Xia, W.; Hsu, J.-M.; Chen, C.-T.; Li, L.-Y.; Lee, D.-F.; Yang, J.-Y.; Xie, X.; Liu, J.-C.; et al. Myeloid Cell Leukemia-1 Inversely Correlates with Glycogen Synthase Kinase-3beta Activity and Associates with Poor Prognosis in Human Breast Cancer. Cancer Res. 2007, 67, 4564–4571. [Google Scholar] [CrossRef] [Green Version]
  37. Farago, M.; Dominguez, I.; Landesman-Bollag, E.; Xu, X.; Rosner, A.; Cardiff, R.D.; Seldin, D.C. Kinase-Inactive Glycogen Synthase Kinase 3beta Promotes Wnt Signaling and Mammary Tumorigenesis. Cancer Res. 2005, 65, 5792–5801. [Google Scholar] [CrossRef] [Green Version]
  38. Kunnimalaiyaan, M.; Vaccaro, A.M.; Ndiaye, M.A.; Chen, H. Inactivation of Glycogen Synthase Kinase-3beta, a Downstream Target of the Raf-1 Pathway, Is Associated with Growth Suppression in Medullary Thyroid Cancer Cells. Mol. Cancer Ther. 2007, 6, 1151–1158. [Google Scholar] [CrossRef] [Green Version]
  39. Hay, N. Reprogramming Glucose Metabolism in Cancer: Can It Be Exploited for Cancer Therapy? Nat. Rev. Cancer 2016, 16, 635–649. [Google Scholar] [CrossRef] [Green Version]
  40. Whitaker-Menezes, D.; Martinez-Outschoorn, U.E.; Flomenberg, N.; Birbe, R.C.; Witkiewicz, A.K.; Howell, A.; Pavlides, S.; Tsirigos, A.; Ertel, A.; Pestell, R.G.; et al. Hyperactivation of Oxidative Mitochondrial Metabolism in Epithelial Cancer Cells in Situ: Visualizing the Therapeutic Effects of Metformin in Tumor Tissue. Cell Cycle Georget. Tex 2011, 10, 4047–4064. [Google Scholar] [CrossRef] [Green Version]
  41. Zhao, Z.; Han, F.; He, Y.; Yang, S.; Hua, L.; Wu, J.; Zhan, W. Stromal-Epithelial Metabolic Coupling in Gastric Cancer: Stromal MCT4 and Mitochondrial TOMM20 as Poor Prognostic Factors. Eur. J. Surg. Oncol. J. Eur. Soc. Surg. Oncol. Br. Assoc. Surg. Oncol. 2014, 40, 1361–1368. [Google Scholar] [CrossRef]
  42. Johnson, J.M.; Lai, S.Y.; Cotzia, P.; Cognetti, D.; Luginbuhl, A.; Pribitkin, E.A.; Zhan, T.; Mollaee, M.; Domingo-Vidal, M.; Chen, Y.; et al. Mitochondrial Metabolism as a Treatment Target in Anaplastic Thyroid Cancer. Semin. Oncol. 2015, 42, 915–922. [Google Scholar] [CrossRef] [PubMed] [Green Version]
  43. Hensley, C.T.; Faubert, B.; Yuan, Q.; Lev-Cohain, N.; Jin, E.; Kim, J.; Jiang, L.; Ko, B.; Skelton, R.; Loudat, L.; et al. Metabolic Heterogeneity in Human Lung Tumors. Cell 2016, 164, 681–694. [Google Scholar] [CrossRef] [PubMed] [Green Version]
Figure 1. Hematoxylin and Eosin (HE) staining in control testis, Seminoma (SE), and Embryonal Carcinoma (EC). Scale bars: 25 μm.
Endocrines 03 00049 g001
Figure 2. Expression markers of aerobic glycolysis in control testis and TGCTs. Scale bars: 25 μm. Glucose transporter 1 (GLUT1); Type 1 transmembrane glycoprotein (CD44); Phosphofructokinase-1 (PFK-1).
Endocrines 03 00049 g002
Figure 3. Expression of monocarboxylate transporters 1 (MCT1), monocarboxylate transporters 4 (MCT4), and p53 in control testis and TGCTs Scale bars: 25 μm.
Endocrines 03 00049 g003
Figure 4. LDH-A expression in control testis and TGCTs. Scale bars: 25 μm. Lactate dehydrogenase-A (LDH-A); phospho-Glycogen synthase kinase 3β (pGSK-3β); phospho-protein kinase B (pAKT).
Endocrines 03 00049 g004
Figure 5. Oxidative mitochondrial expression in control testis and TGCTs. Scale bars: 25 µm.
Endocrines 03 00049 g005
Figure 6. Frequency of plasma membrane expression of Glucose transporter 1 (GLUT1); monocarboxylate transporters 1 (MCT1), and monocarboxylate transporters 4 (MCT4) in control testis and TGCTs. *: p < 0.05 vs. control; : p < 0.05 vs. SE.
Endocrines 03 00049 g006
Figure 7. ROC curve analysis for SE vs. EC discrimination; PPV: positive predictive value; NPV: negative predictive value; AUC: area under ROC curve; CI: confidence interval.
Endocrines 03 00049 g007
Table 1. Immunoreactivity of aerobic glycolysis markers in control and TGCTs.
ControlSEEC
GLUT10 (0–0)2 (1–3) *4 (3–4) *
CD440 (0–0)2 (1.5–2) *4 (3–4) *
PFK-11 (1–1)1 (1–1)2 (2–2) *
*: p < 0.05 vs. control; : p < 0.05 vs. SE. SE: seminoma; EC: embryonal carcinoma.
Table 2. Monocarboxylate transporters 1, 4, and p53 immunoreactivity in control and TGCTs.
ControlSEEC
MCT12 (2–3)1 (0–2)4 (3–4)
MCT41 (0–1)2 (0–3)4 (3–4) *
P531 (1–1)3 (2–3) *0 (0–0) *
*: p < 0.05 vs. control; : p < 0.05 vs. SE. SE: seminoma; EC: embryonal carcinoma.
Table 3. LDH-A and PI3K pathways in control and TGCTs.
ControlSEEC
LDH-A2 (2–2)3 (2–3) *4 (3–4) *
pAKT1 (1–1)1 (1–1)2 (2–2) *
pGSK3β0 (0–0)1 (0–1)2 (2–2) *
*: p < 0.05 vs. Control; : p < 0.05 vs. SE. SE: seminoma; EC: embryonal carcinoma.
Table 4. Oxidative mitochondrial protein expression in control and TGCTs.
ControlSEEC
TOM202 (2–2)3 (2.5–3) *0 (0–1) *
PDH0 (0–0)1 (1–1) *3 (3–3) *
PDK12 (2–2)0 (0–0) *1 (1–1) *
*: p < 0.05 vs. control; : p < 0.05 vs. SE. SE: seminoma; EC: embryonal carcinoma. Pyruvate dehydrogenase (PDH); Pyruvate dehydrogenase kinase 1 (PDK1); Mitochondrial import receptor subunit (TOM20).
Table 5. Association of GLUT1, MCT1, and MCT4 expression with clinico-pathological parameters.
NumberGLUT1MCT1MCT4
Positive (%)Positive (%)Positive (%)
Histology
SE3524 (68.6) *16 (45.7) *25 (71.4) *
EC1717 (100.0) *15 (88.2)17 (100.0) *
T stage
T13127 (87.0) *24 (77.4) *25 (80.6) *
T21211 (91.7) *8 (66.6) *10 (83.3) *
T365 (83.3) *4 (66.6) *5 (83.3) *
T432 (66.6) *1 (33.3) *2 (66.6) *
Vascular invasion
No4842 (87.5) *28 (79.0) *40 (83.3) *
Yes40 (0.0)0 (0.0)0 (0.0) *
*: p < 0.05 vs. control. SE: seminoma; EC: embryonal carcinoma.
Publisher’s Note: MDPI stays neutral with regard to jurisdictional claims in published maps and institutional affiliations.

