Article

Dynamic Behavior and Computational Investigation of Tunnel Blasting Subjected to Varying Geostresses

1
School of Civil Engineering, Central South University, Changsha 410075, China
2
Defense Engineering Institute, Academy of Military Science, People’s Liberation Army, Beijing 100850, China
3
College of Aerospace and Civil Engineering, Harbin Engineering University, Harbin 150001, China
4
School of Civil Engineering, Harbin Institute of Technology, Harbin 150090, China
5
School of Civil and Transport Engineering, Hebei University Technology, Tianjin 300401, China
*
Authors to whom correspondence should be addressed.
Modelling 2026, 7(3), 102; https://doi.org/10.3390/modelling7030102
Submission received: 16 April 2026 / Revised: 20 May 2026 / Accepted: 22 May 2026 / Published: 26 May 2026

Abstract

To examine the dynamic response of tunnel floor slabs subjected to blasting under varying stress conditions, a numerical model was developed to simulate blasting effects at different tunnel depths. This model integrated Hopkinson bar experiments conducted under confining pressure with the Riedel–Hiermaier–Thoma (RHT) constitutive framework. The study subsequently investigated the effects of geostress fields, tunnel depth and tunnel inclination on the propagation characteristics of stress waves. Additionally, the mechanisms stress wave transmission and the damage evolution within the rock mass were analyzed. Results from the numerical simulations reveal that increasing the charge depth diminishes the dissipation of post-blasting stress waves toward the free surface, thereby concentrating stress wave propagation within the rock mass and substantially amplifying shock wave intensity and impact loading. Moreover, elevated stress levels in the surrounding rock increase the peak stress wave amplitude, constrain damage propagation on the tunnel’s upper side, and redirect more stress waves toward deeper regions of the model. Increasing tunnel inclination was also found to intensify stress concentration and augment stress wave intensity. Notably, at a tunnel inclination of 5°, stress wave intensity attains its maximum; beyond this angle, the development of stress waves exhibits irregular patterns.

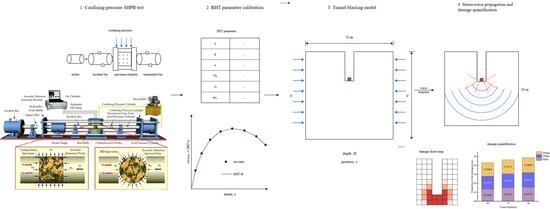
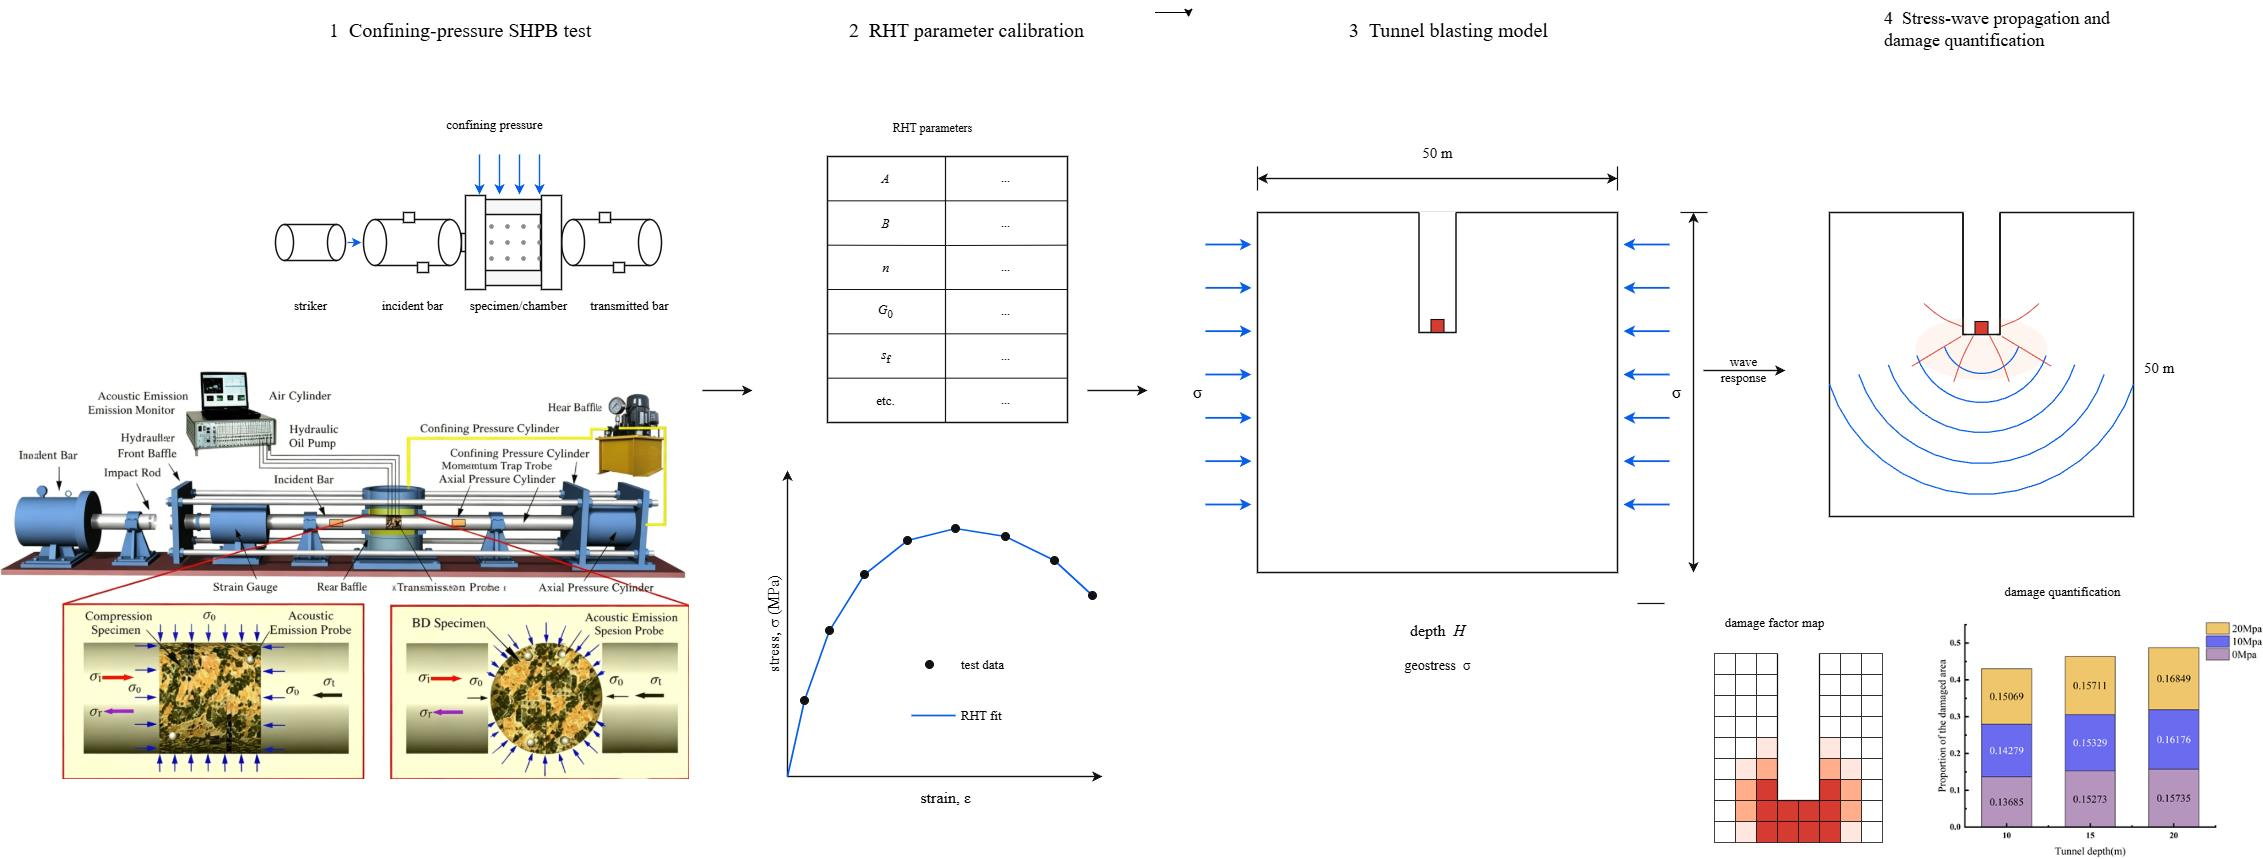
Graphical Abstract

1. Introduction

As deep underground engineering projects progress, blasting and excavation within rock masses frequently occur under complex mechanical conditions characterized by elevated stress levels and significant transient disturbances [1,2,3,4,5,6,7]. In contrast to shallow rock masses, the presence of an initial static stress field in deep rock formations partially counteracts the tangential tensile stresses generated by blasting. This interaction not only restricts the unrestricted propagation of radial cracks but also induces a geometric deflection in the initiation and propagation paths of cracks, which orients them toward the direction of the maximum principal stress [8,9]. In recent years, researchers both domestically and internationally have conducted extensive investigations into the dynamic behavior of rock masses subjected to blasting in high-stress environments. These studies have yielded substantial findings across various domains, including numerical simulation, laboratory experimentation, field monitoring and theoretical analysis. The progression of rock mass damage and the dynamic propagation of cracks serve as direct indicators of the effects induced by blasting.
Numerous engineering projects operate under conditions characterized by elevated stress and complex, variable geological settings. High stress levels can induce phenomena such as rock bursts within tunnels, initiate structural collapses, and alter the intrinsic properties of rock masses subjected to intense stress. The combined influence of high-stress environments and dynamic loads from blasting operations substantially modifies the mechanical response of rock masses, thereby challenging the applicability of conventional rock dynamics theories in accurately characterizing the intricate mechanical behavior observed under such conditions. In recent years, extensive and productive research efforts have been undertaken by scholars both domestically and internationally to investigate the dynamics of rock blasting in high-stress environments. Wang [10] conducted a theoretical investigation into the effects of a gradient stress field on the propagation of stress waves in deep rock masses. To this end, a segmented equivalent medium model was formulated, wherein the deep rock mass under a gradient stress field was divided into several segments, each segment being assumed to bear uniformly distributed stress. Following this, the governing equations for the equivalent medium model corresponding to each segment were derived and the nonlinear-discontinuity method was incorporated. Central to rock blasting processes in high-stress rock masses are the propagation of stress waves and the distribution of energy. To advance the understanding of these phenomena and further elucidate the governing patterns of stress wave propagation and energy distribution. Yang [11] investigated the differences in energy transfer mechanisms between water-coupled and air-coupled blasting techniques. Utilizing the principle of superposition of blasting-induced stresses and geostress, the study analyzed the failure characteristics and energy distribution patterns associated with both water-coupled and air-coupled blasting methods during deep rock excavation, considering various charging configurations and geostress conditions. Luo [12] investigates the mechanisms responsible for catastrophic failure in deep-seated granite by analyzing energy evolution, progressive damage and failure modes, with particular consideration of the cumulative damage effects resulting from repeated blasting operations. In addressing the particular risks associated with deep rock engineering, researchers have extended the breadth of their investigations. Liu [13] undertook a theoretical analysis of the mechanical processes governing rock fracture formation under the combined influence of blast-induced stress waves and geostress. Building upon this coupling effect, Liu developed a novel dynamic fracture drive model, elucidating the role of geostress in the generation of dynamic fractures during pre-cracked blasting operations. Dong [14] elucidated the mechanisms through which blasting loads, geostress and karst cave water pressure affect damage and seepage characteristics in the rock mass surrounding tunnels, utilizing a multi-field coupled constitutive model that integrates stress, damage and seepage phenomena. Building upon strain gradient theory and the damage characteristics inherent to rock masses, Gao [15] developed an elastoplastic damage model accompanied by a failure criterion. Through numerical simulation of the coupled influences of blasting loads and the transient unloading of initial geostress, Gao elucidated the dynamic mechanisms underlying the initiation and progression of banded caving phenomena in deep tunnel environments. Yuan [16,17] derived the distribution of the elastic stress field surrounding circular tunnels within deep isotropic rock masses and modified the Hoek–Brown failure criterion to incorporate the effects of blast-induced damage.
Within the domain of on-site monitoring and engineering validation, microseismic monitoring technology has emerged as a crucial approach for elucidating the progression of damage induced by blasting in deep rock formations. Lin [18] developed a microseismic (MS) monitoring system to examine the evolution characteristics of microseismic events during the excavation of underground chambers subjected to high geological stress and further assessed the damage inflicted on these chambers by blasting loads under elevated rock stress conditions. Zhao [19] implemented an in situ microseismic (MS) monitoring system to analyze the microseismic activity induced by blasting at the large underground powerhouse of the Baijiatang Hydropower Station. By differentiating the waveform features of blasting events from those associated with rock fracturing, the researchers derived isocontours representing the density of microseismic events induced by blasting excavation, alongside the spatial distribution of seismic deformation within the rock mass. Based on geostress data, Li [20] quantified the stored energy within a three-center arched tunnel subsequent to quasi-static excavation. Additionally, Li conducted monitoring of a series of in situ blasting-induced vibrations and computed the corresponding blasting vibration energy through the application of elastic vibration boundary equivalence theory. The dynamic damage behavior of rock subjected to geostress conditions. Zheng [21] introduced a realistic triaxial static–dynamic loading approach designed to capture the full progression of damage occurring during tunnel excavation, including the continuous fracturing triggered by micro-dynamic disturbances. In a related study, Peng [22] performed impact tests on granite specimens pre-damaged under different confining pressures (5, 10 and 15 MPa) and varying impact frequencies (1, 5, 10 and 15 impacts). Subsequently, uniaxial compression tests were conducted on these pre-damaged samples. The investigation employed the crack volume strain method alongside acoustic emission analysis to explore the evolution of stress thresholds, thereby elucidating the development patterns of microcracks within the rock specimens. Yang [23] employed a true triaxial split Hopkinson pressure bar (SHPB) apparatus to examine the dynamic mechanical properties and fracture behavior of red sandstone subjected to multiaxial confining pressure and impact loading. Xu [24,25] developed an experimental system to perform explosive photoelasticity tests under non-equiaxial confining pressure conditions. This research explored the propagation behavior of relative cracks and analyzed the effects of explosive stress waves and the stress field at crack tips on adjacent cracks at varying horizontal spacings. In the context of deep mining at the Sanshan Island gold mine, Chen [26] conducted a systematic investigation into the effects of blasting-induced vibrations on rockburst hazards in deep underground mines. Chen proposed an energy-accumulation-based rockburst hazard assessment model to evaluate the susceptibility of surrounding rock masses to rockbursts under the influence of geostress within deep tunnel environments. Wang [27] employed a triaxial loading apparatus integrated with nuclear magnetic resonance (NMR) technology to perform compression tests on specimens that were intact, vibration-damaged and blast-damaged under varying confining pressure conditions.
Conducting large-scale experiments is frequently challenging and produces limited data; consequently, to advance the understanding of damage mechanisms in rock subjected to geostress conditions, it is essential to employ numerical simulations to replicate the engineering damage processes. Zhai [28] developed a numerical model to investigate the dynamic response of fractured rock masses subjected to blasting under high rock stress conditions. This study explored the mechanisms through which varying initial rock stress fields and fracture configurations affect the propagation of stress waves. Tang [29] uses the numerical simulation capabilities of LS-DYNA, this study systematically evaluated the impact of rock pressure and blasting params on the resultant damage, which includes the cumulative effects arising from repeated blasting sequences. Chen [30] focused his research on a sandstone-type uranium deposit located in Xinjiang. Employing the finite discrete element method, he developed a coupled model integrating gas flow, temperature, mechanical forces and seepage phenomena. Through this model, he systematically examined the mechanisms of rock damage and the progression of permeability changes during the process of permeability enhancement induced by blasting.
To guarantee that the outcomes of numerical simulations are validated through empirical evidence. Dong [31] performed both experimental model tests and numerical simulations to examine rock blasting under varying magnitudes and orientations of principal stresses. This research concentrated on analyzing fragmentation volume, fragmentation morphology, crack quantity and the extent of damage during rock blasting within geostress environments. Drawing on field blasting vibration tests conducted in the Taohuazui mining area of Hubei Province, China and employing dimensional analysis, Zhang [32] uses the LS-DYNA dynamic finite element software, simulations were performed to assess the peak particle velocity at the sidewalls of an underground tunnel under various geostress conditions. Han [33] employs both experimental model tests and numerical simulation techniques to conduct a comprehensive investigation into the dynamic response of the maximum principal stress and deformation behavior of layered tunnel rock masses subjected to dynamic and static loading conditions, with varying geostress levels.
While certain researchers have investigated the impact of in situ stress on tunnel excavation through experimental studies and numerical simulations, there is still a notable gap in understanding regarding how variations in in situ stress at different depths and orientations influence the propagation of stress waves and the resulting rock damage subsequent to explosive detonation. Drawing upon existing experimental findings and numerical simulations, this study examines the mechanisms through which varying initial rock stress fields, tunnel depths and tunnel inclinations affect the propagation of stress waves. Furthermore, it analyzes the energy transfer processes associated with stress waves and the progressive damage characteristics within the rock mass. The primary objective is to advance understanding of the penetration and blast damage effects of ground-penetrating munitions under different initial stress conditions. This research aims to assess rock damage and stress wave propagation following penetration and detonation across diverse external environments and impact orientations, thereby providing critical reference data to inform the stability design and construction of deep underground engineering structures.

2. Theoretical Analysis

2.1. The Stress Field Arising from the Superimposition of Blasting-Induced and Geostress

In settings marked by high confining pressures, the stress distribution within the surrounding rock exhibits significant heterogeneity. This variability primarily arises from the interplay between transient dynamic stresses induced by explosive detonation and the pre-existing static stress field inherent to high-stress environments. Throughout the mechanical response, these two stress components demonstrate a notable superposition effect. Consequently, the development of a rock mass blasting damage model suitable for conditions of elevated confining pressure requires the establishment of a theoretical framework and computational approaches that effectively integrate the coupled dynamic and static stress fields [34].
σ r s = P y 2 ( 1 + K ) 1 r b 2 r a 2 ( 1 K ) 1 4 r b 2 r a + 3 r b 4 r a 4 cos 2 θ
σ θ s = P y 2 ( 1 + K ) 1 + r b 2 r a 2 + ( 1 K ) 1 + 3 r b 4 r a 4 cos 2 θ
In Equations (1) and (2), σ r s and σ θ s represent the radial and circumferential stresses, respectively, experienced by the rock mass under the action of earth pressure; P x denotes the horizontal earth pressure; P y denotes the vertical earth pressure; K is the lateral pressure coefficient, where K = P x / P y , r a is the distance from the blast center, and r b is the borehole radius.
When K = 1, i.e., under isotropic pressure conditions, the above equation can be simplified to:
σ r s = 1 r b 2 r a 2 P x
σ θ s = 1 + r b 2 r a 2 P x
Within the rock mass, the geostress field imposes bidirectional confinement in both the radial and circumferential directions. Under conditions of an isotropic geostress field, characterized by a lateral pressure coefficient (lateral pressure coefficient K = 1), the principal stress tensor within the rock mass demonstrates isotropic properties. Conversely, when the surrounding rock is exposed to an anisotropic geostress field (K ≠ 1), the particle elements experience anisotropic principal stresses, leading to pronounced disparities among the components of the principal stresses.
Assuming that the blast holes are situated within a homogeneous, elastic, isotropic rock medium and that a columnar charging technique is utilized, the governing equation describing the propagation of the stress wave induced by the blast can be formulated as follows [35]:
2 u r 2 + 1 r u r u r 2 = 1 C p 2 2 u t 2 σ r b ( r , t ) = ( λ + 2 G ) u r + λ u r σ θ b ( r , t ) = λ u r + ( λ + 2 G ) u r
u ( r , 0 ) = u ( r , 0 ) t = 0   ( r 0 , t > 0 )
In the equation, u ( r , t ) represents the displacement of a particle caused by the blast load, σ r b and σ θ b represent the radial and circumferential stresses induced by the blast load in the rock mass, C p is the P-wave velocity in the rock, λ and G are the Lame constants. Under uncoupled charging conditions, the dynamic load imposed on the rock by the explosion of explosives within the rock mass is:
P d = 1 8 ρ 0 D c 2 n K d 6
In the equation, n is the pressure increase factor, taken as n = 10, ρ 0 is the density of the explosive, K d is the decoupling factor and D c is the detonation wave propagation velocity.
Under the combined action of geostresses and blasting loads, the stress field in the rock should be:
σ r = σ r b + σ r s σ θ = σ θ b + σ θ s
σ r = P d r ¯ ( α ) ± P y 2 ( 1 + K ) 1 r b 2 r a 2 ( 1 K ) 1 4 r b 2 r a + 3 r b 4 r a 4 cos 2 θ
σ θ = b P d r ¯ ( α ) ± P y 2 ( 1 + K ) 1 + r b 2 r a 2 + ( 1 K ) 1 + 3 r b 4 r a 4 cos 2 θ
When rock masses are subjected to explosive loading, the inherent stress field within the rock interacts with the dynamic loads, resulting in a combined stress field. The pre-existing geostress in the rock mass modifies the distribution patterns of radial and circumferential stresses during the propagation of the blast-induced shock wave, leading to a stress field that exhibits non-equilibrium characteristics. In rock mechanics analyses, it is crucial to account for the interaction mechanisms between the static geostress field and the transient blasting loads. Due to spatial heterogeneity in geological structures, identical blasting loads can elicit varying mechanical responses in regions characterized by different geostress conditions, manifesting as either an amplification or attenuation of the local stress state.

2.2. Numerical Model

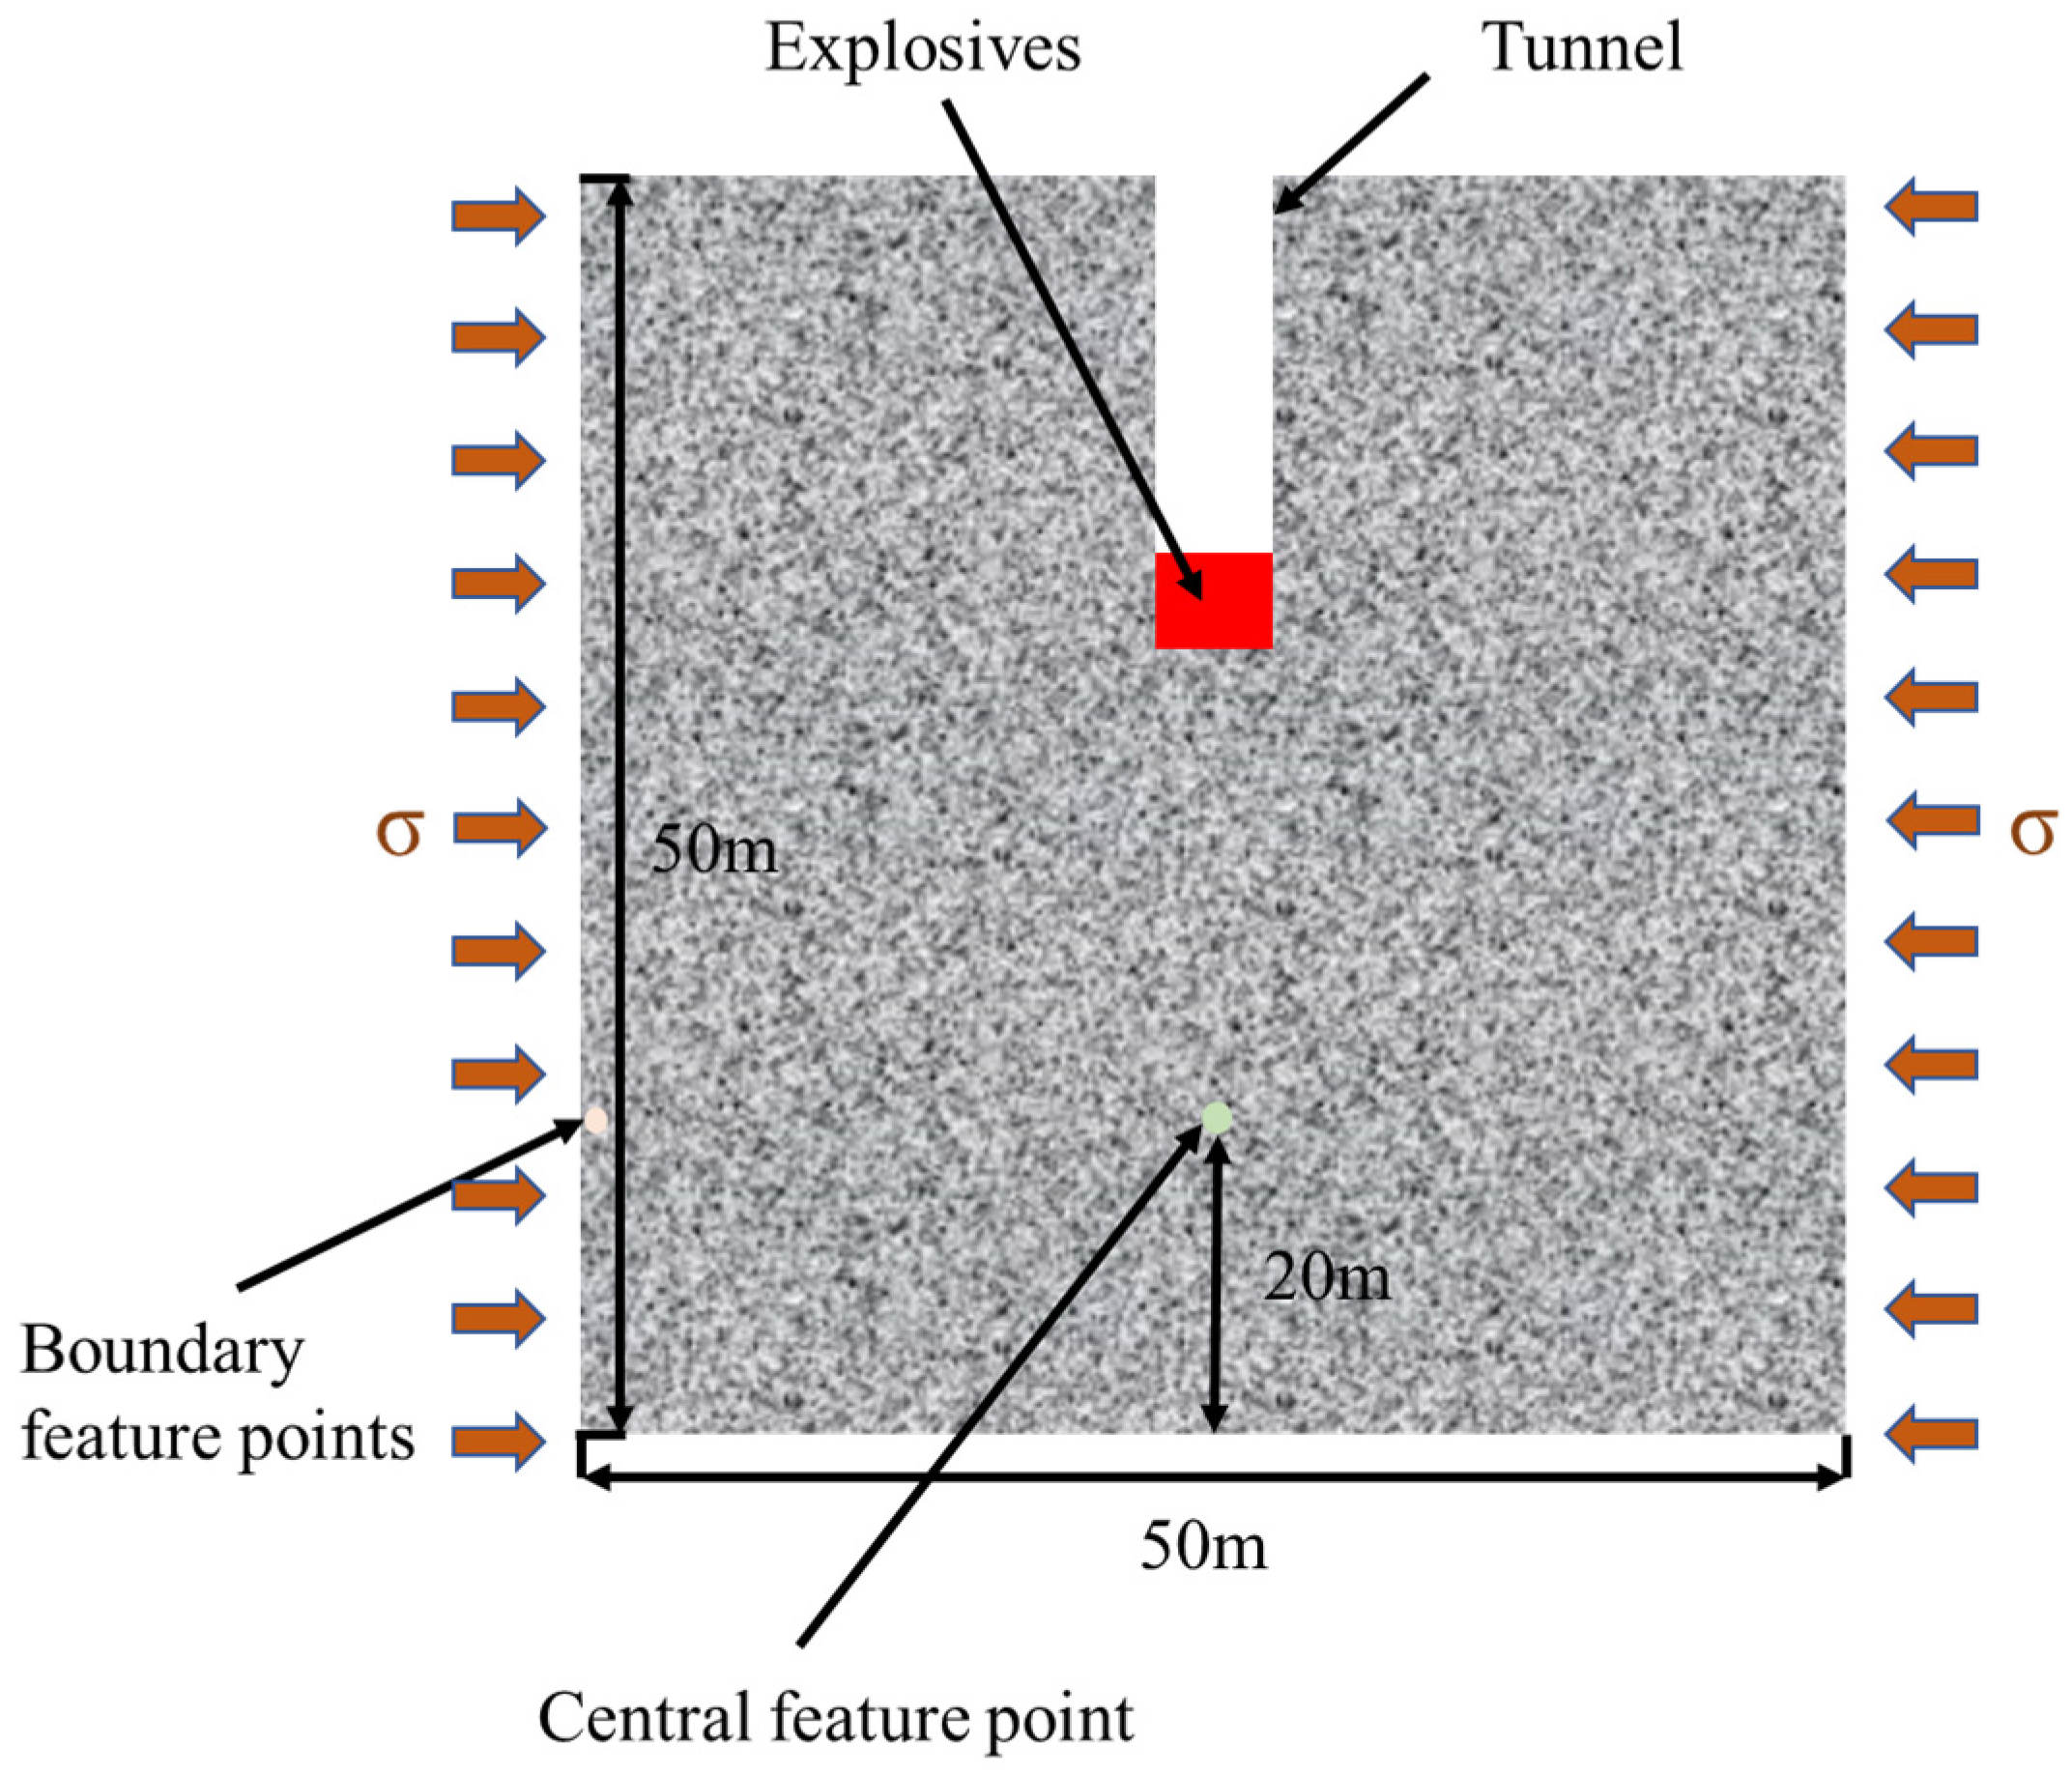
To examine the mechanisms governing the propagation of stress waves subsequent to a detonation at the base of a tunnel, this research developed a 50 m × 50 m quasi-two-dimensional (2D) numerical model to simulate the spread of two-dimensional plane stress waves caused by an explosive load. This quasi-2D model improves computational accuracy and enables a clearer visualization of damage crack propagation after the explosion. The aggregate quantity of grid cells amounts to one million. The mesh size was established through a mapping grid approach, utilizing cells with dimensions of 0.5 × 0.5 cm, thereby achieving an optimal balance between computational precision and efficiency. A uniform mesh density was maintained across all operating conditions to guarantee the consistency and comparability of the results. Moreover, a comparative analysis of four grid configurations revealed that the variations in metrics, including damage and penetration depth at 0.5 cm, were below 3%, thereby satisfying the convergence requirements. The peripheral regions of the model were represented using non-reflecting boundary conditions with a thickness equivalent to a single element. Tunnel depths were specified at 10 m, 15 m and 20 m, as illustrated in Figure 1, while maintaining a constant tunnel penetration depth. To facilitate a more detailed analysis of stress wave propagation within the model, two reference points were designated—one at the center and another at the boundary—to record pressure time–history curves. The feature points at the boundary are not situated on the model’s outermost boundary mesh. Although the boundary mesh has been designated as a non-reflective boundary to avoid distortion of the outermost mesh—which could result in data inaccuracies—the feature points are instead placed 10 cm inward from the boundary mesh. This approach enabled a comprehensive investigation of the pressure propagation characteristics following detonation at varying depths.

2.3. Dynamic and Static Mechanical Testing Under Geostress

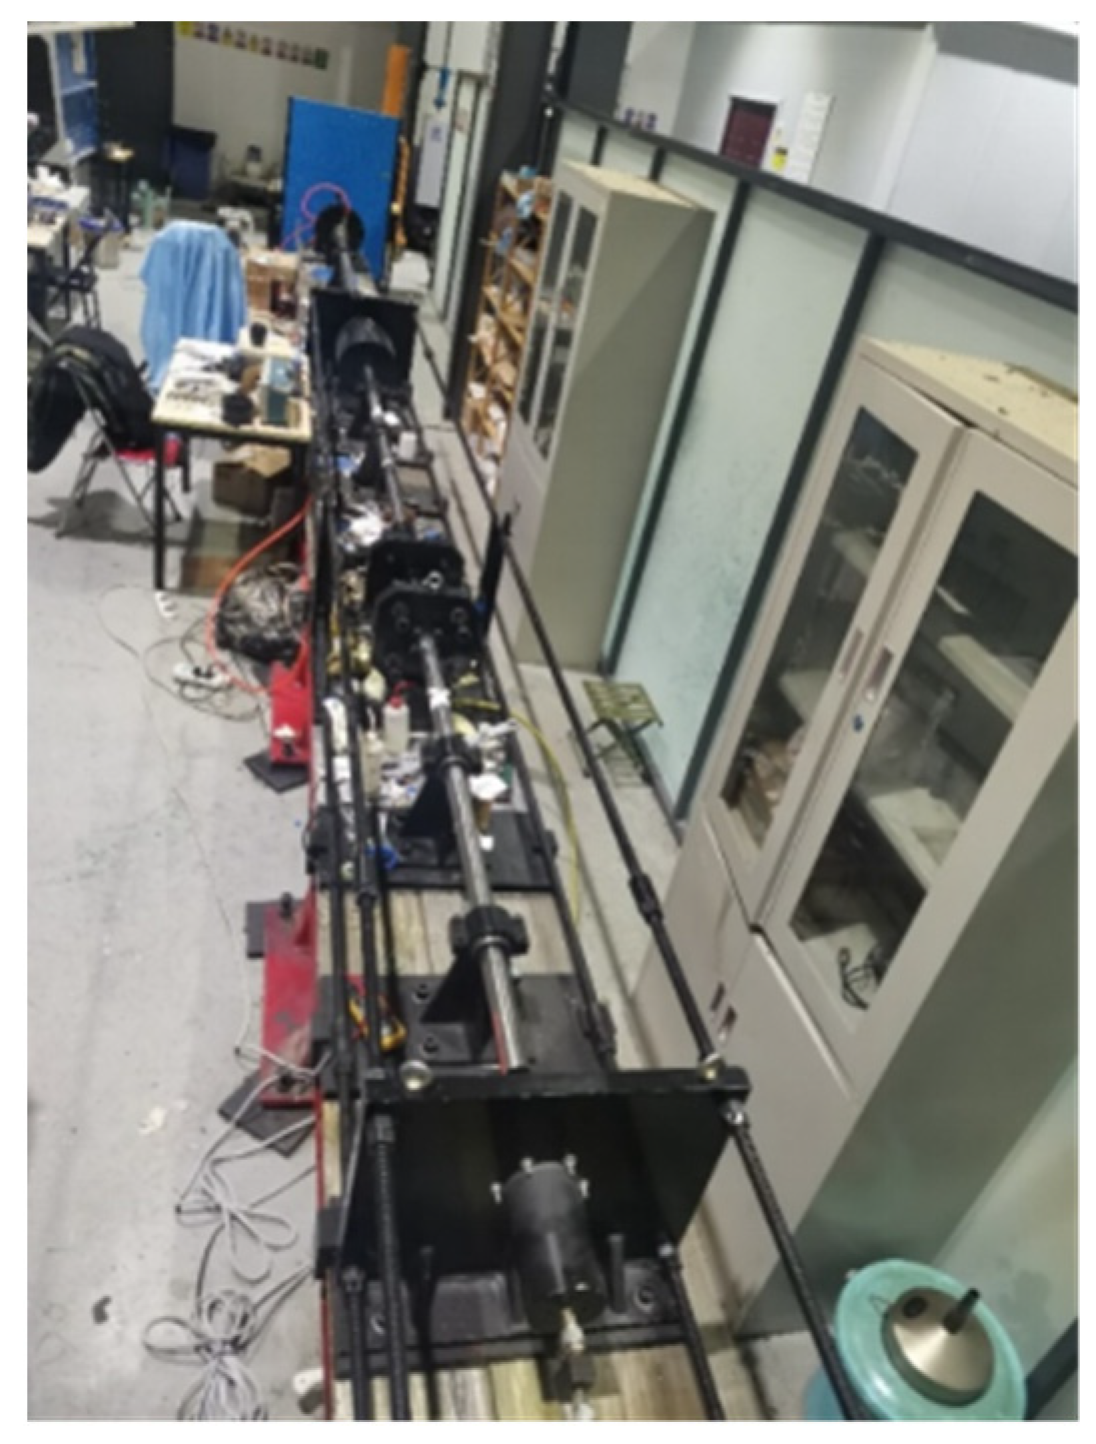
The Split Hopkinson Pressure Bar (SHPB) multi-functional dynamic loading apparatus, developed by the Institute of Geotechnical Engineering at the School of Civil Engineering, Tianjin University (refer to Figure 2) was utilized to perform dynamic compression and tension experiments under a range of hydrostatic pressure conditions and loading rates. This investigation aimed to elucidate the influence of hydrostatic pressure and dynamic loading rates on the dynamic mechanical behavior of rock materials.
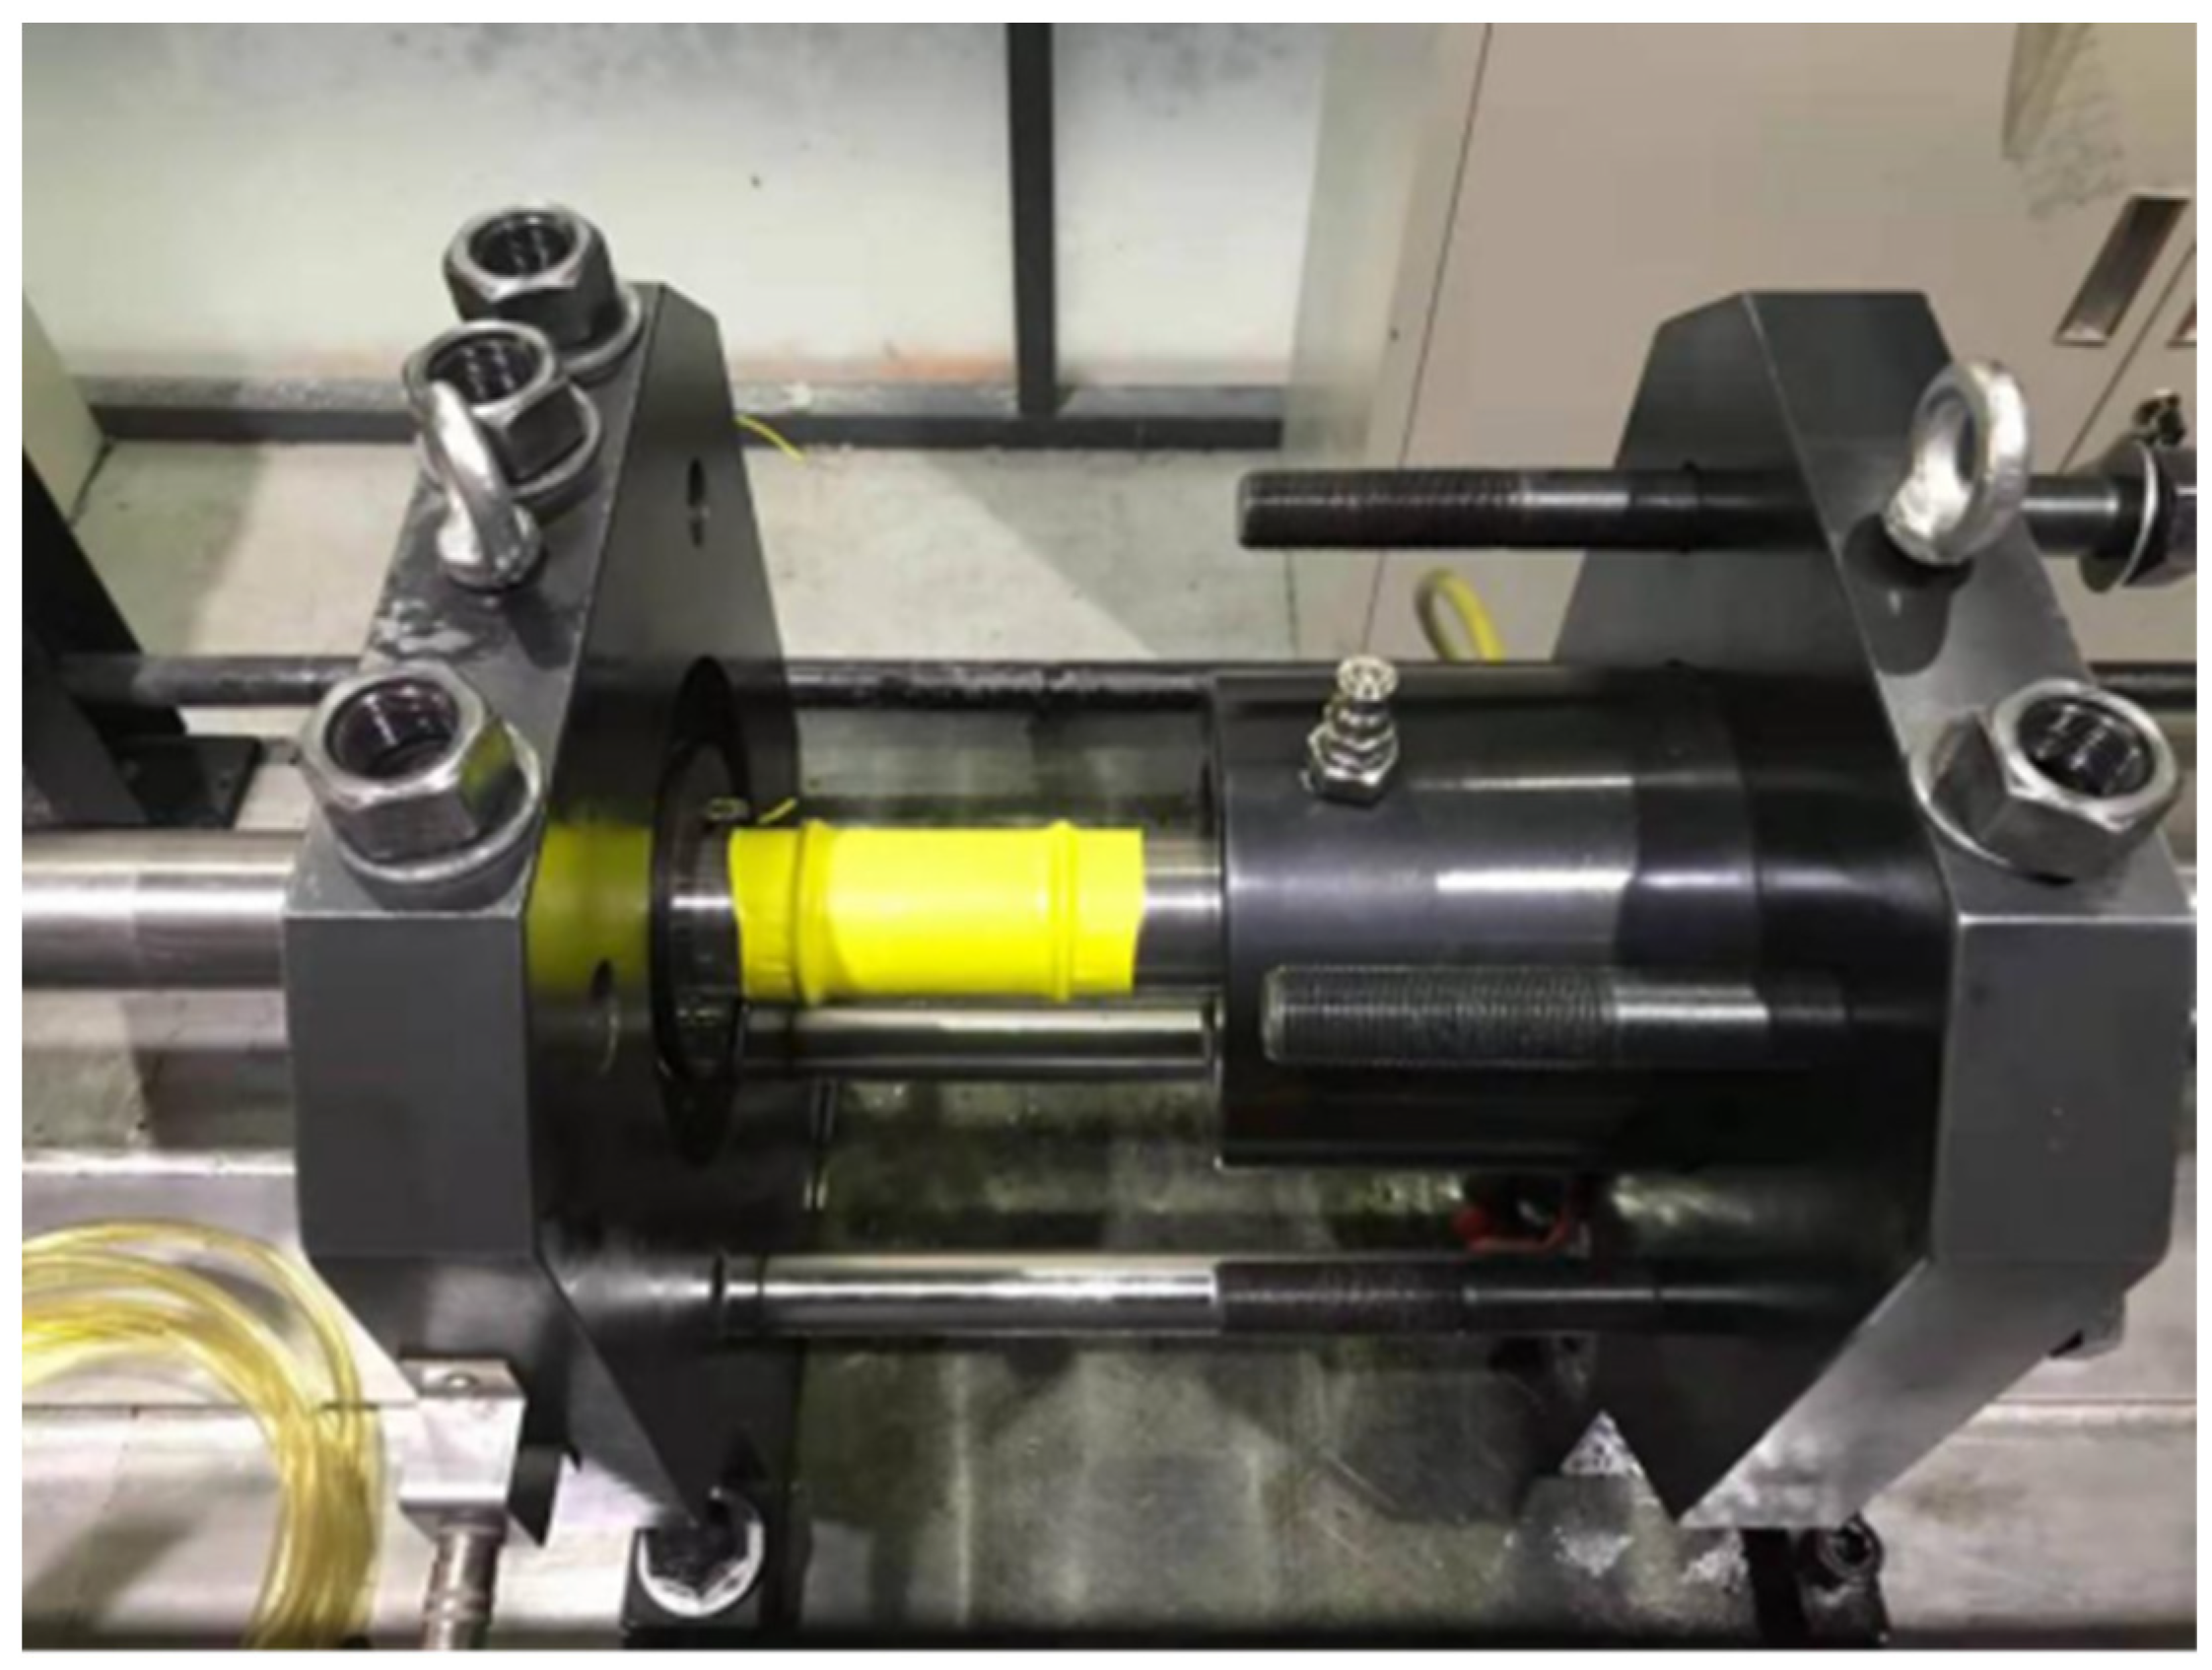
During the experimental procedure, dynamic loading at varying impact velocities is attained by modulating the cylinder pressure at the instant of projectile discharge. The high-stress environment within the rock specimen is replicated using a confining pressure apparatus (depicted in Figure 3), which operates at a maximum pressure of 60 MPa. Hydraulic oil is introduced into the confining pressure device through a hydraulic oil pump to ensure uniform application of load on the specimen. By regulating the oil pressures within both the axial pressure cylinder and the confining pressure cylinder, it is possible to simulate loading conditions under different hydrostatic pressures. To maintain the specimen securely positioned between the impact rod and the transmission rod, the axial pressure cylinder must exert a load marginally greater than that of the confining pressure cylinder. The signal acquisition system consists of strain gauges attached to the transmission rod, impact rod, and specimen end faces, a strain amplifier, an oscilloscope capable of real-time synchronous signal recording and storage, as well as an acoustic emission data acquisition system.
During the application of confining pressure, to prevent hydraulic oil infiltration into the rock pores—which could alter the rock’s dynamic strength—the specimen is promptly sealed with wax following the application of the temperature load (or alternatively, encased in a layer of heat-shrink tubing during compression testing). This procedure serves a dual purpose: firstly, it inhibits moisture ingress from the external environment during specimen storage; secondly, it prevents hydraulic oil from penetrating the specimen’s pore structure throughout the confining pressure application. Consequently, this approach preserves the specimen’s original integrity, thereby enhancing the representativeness of the test conditions relative to those encountered in deep rock formations.
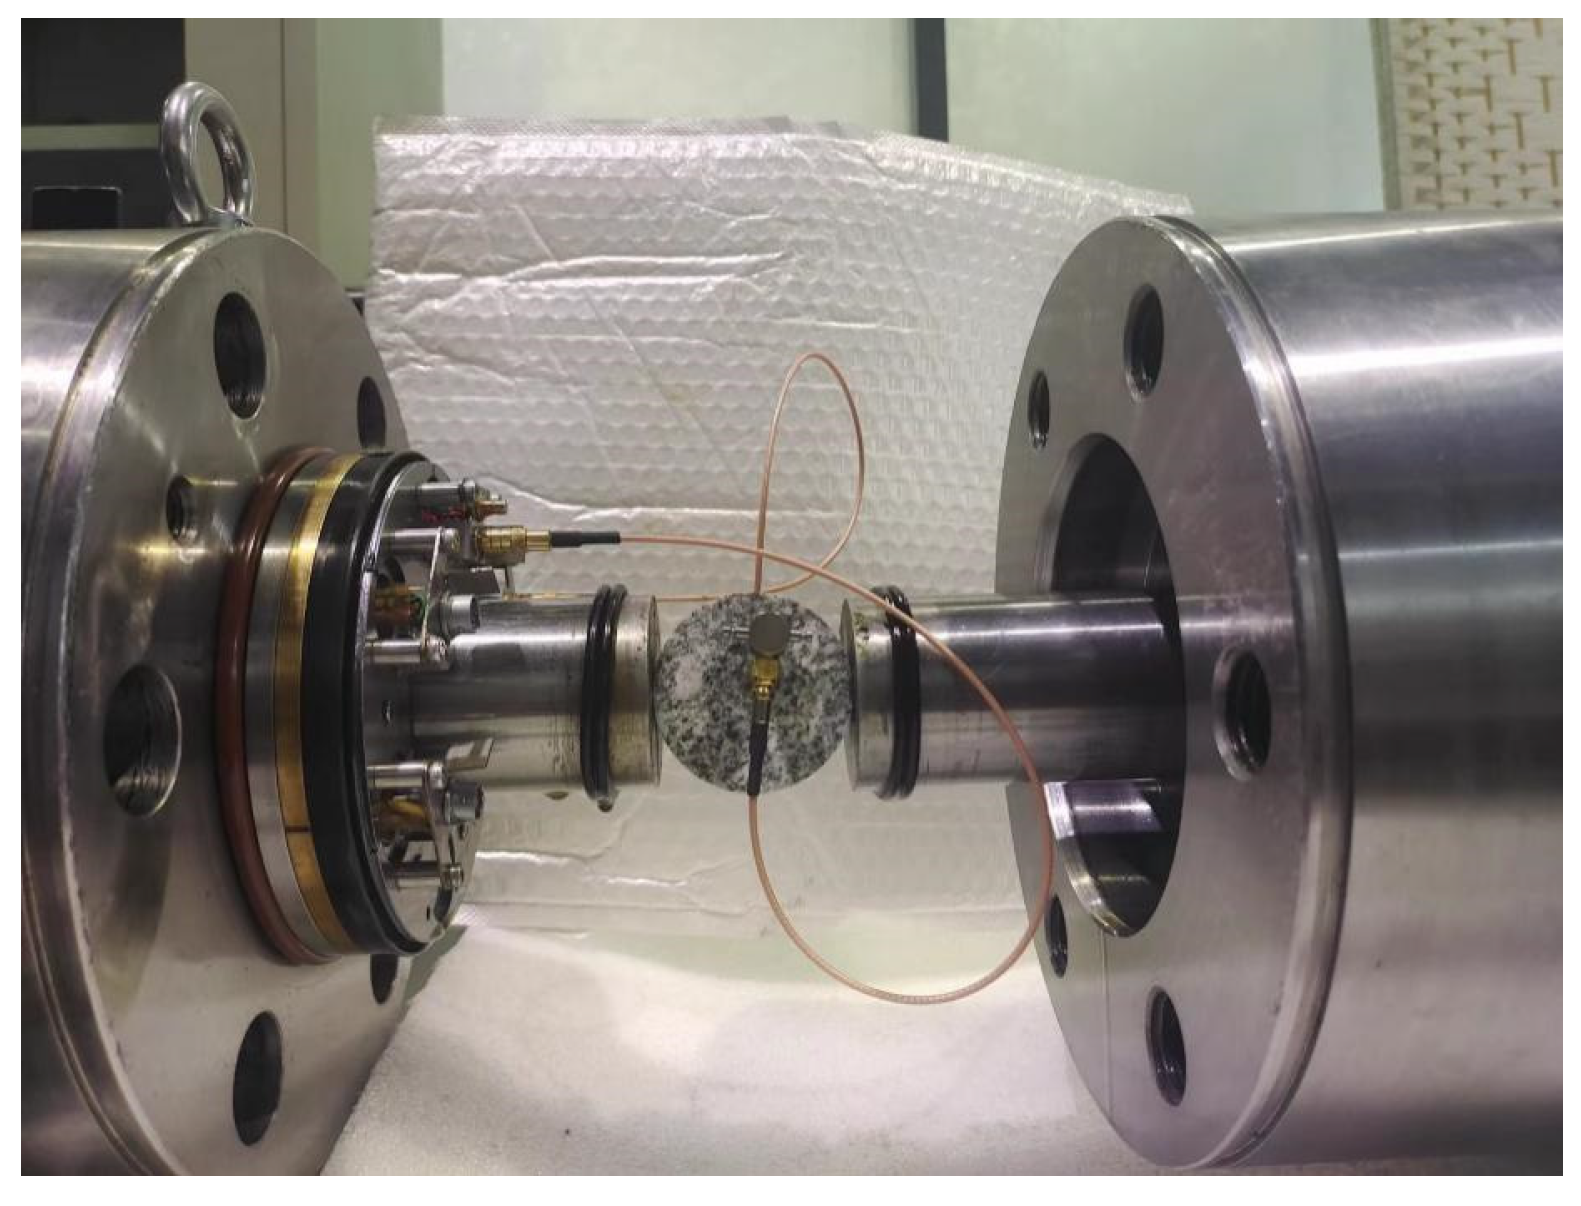
The impact rod should be inserted into the launch tube to the loading distance specified by the test protocol, with the gap between the impact rod and the muzzle adjusted accordingly. The specimen is then clamped between the impact rod and the penetration rod, as illustrated in Figure 4. The overall test loading setup is depicted in Figure 5. It is essential that the specimen’s centerline aligns precisely with that of the test rod. A lubricant, such as molybdenum disulfide, must be applied to the contact surfaces between the specimen and the test rod to reduce friction. Additionally, ensure firm contact between the absorption rod and the transmission rod, applying a layer of lubricant or grinding paste to their interface. The cylinder pressure should be regulated via the inlet and outlet valves to achieve the required injection pressure for the test. The data acquisition system must be configured to record the relevant data and verified to be in standby mode prior to testing. Following all safety precautions, the impact rod is released. The velocity of the impact rod is recorded, and the raw data—including waveform diagrams and data files—is saved for subsequent analysis. After the test, the specimen’s geometric dimensions are measured and documented; the specimen is then labeled and stored securely. Finally, the equipment condition is inspected and prepared for subsequent tests. Upon completion, the power supply and air source for the drive unit should be switched off, and the test area cleared.
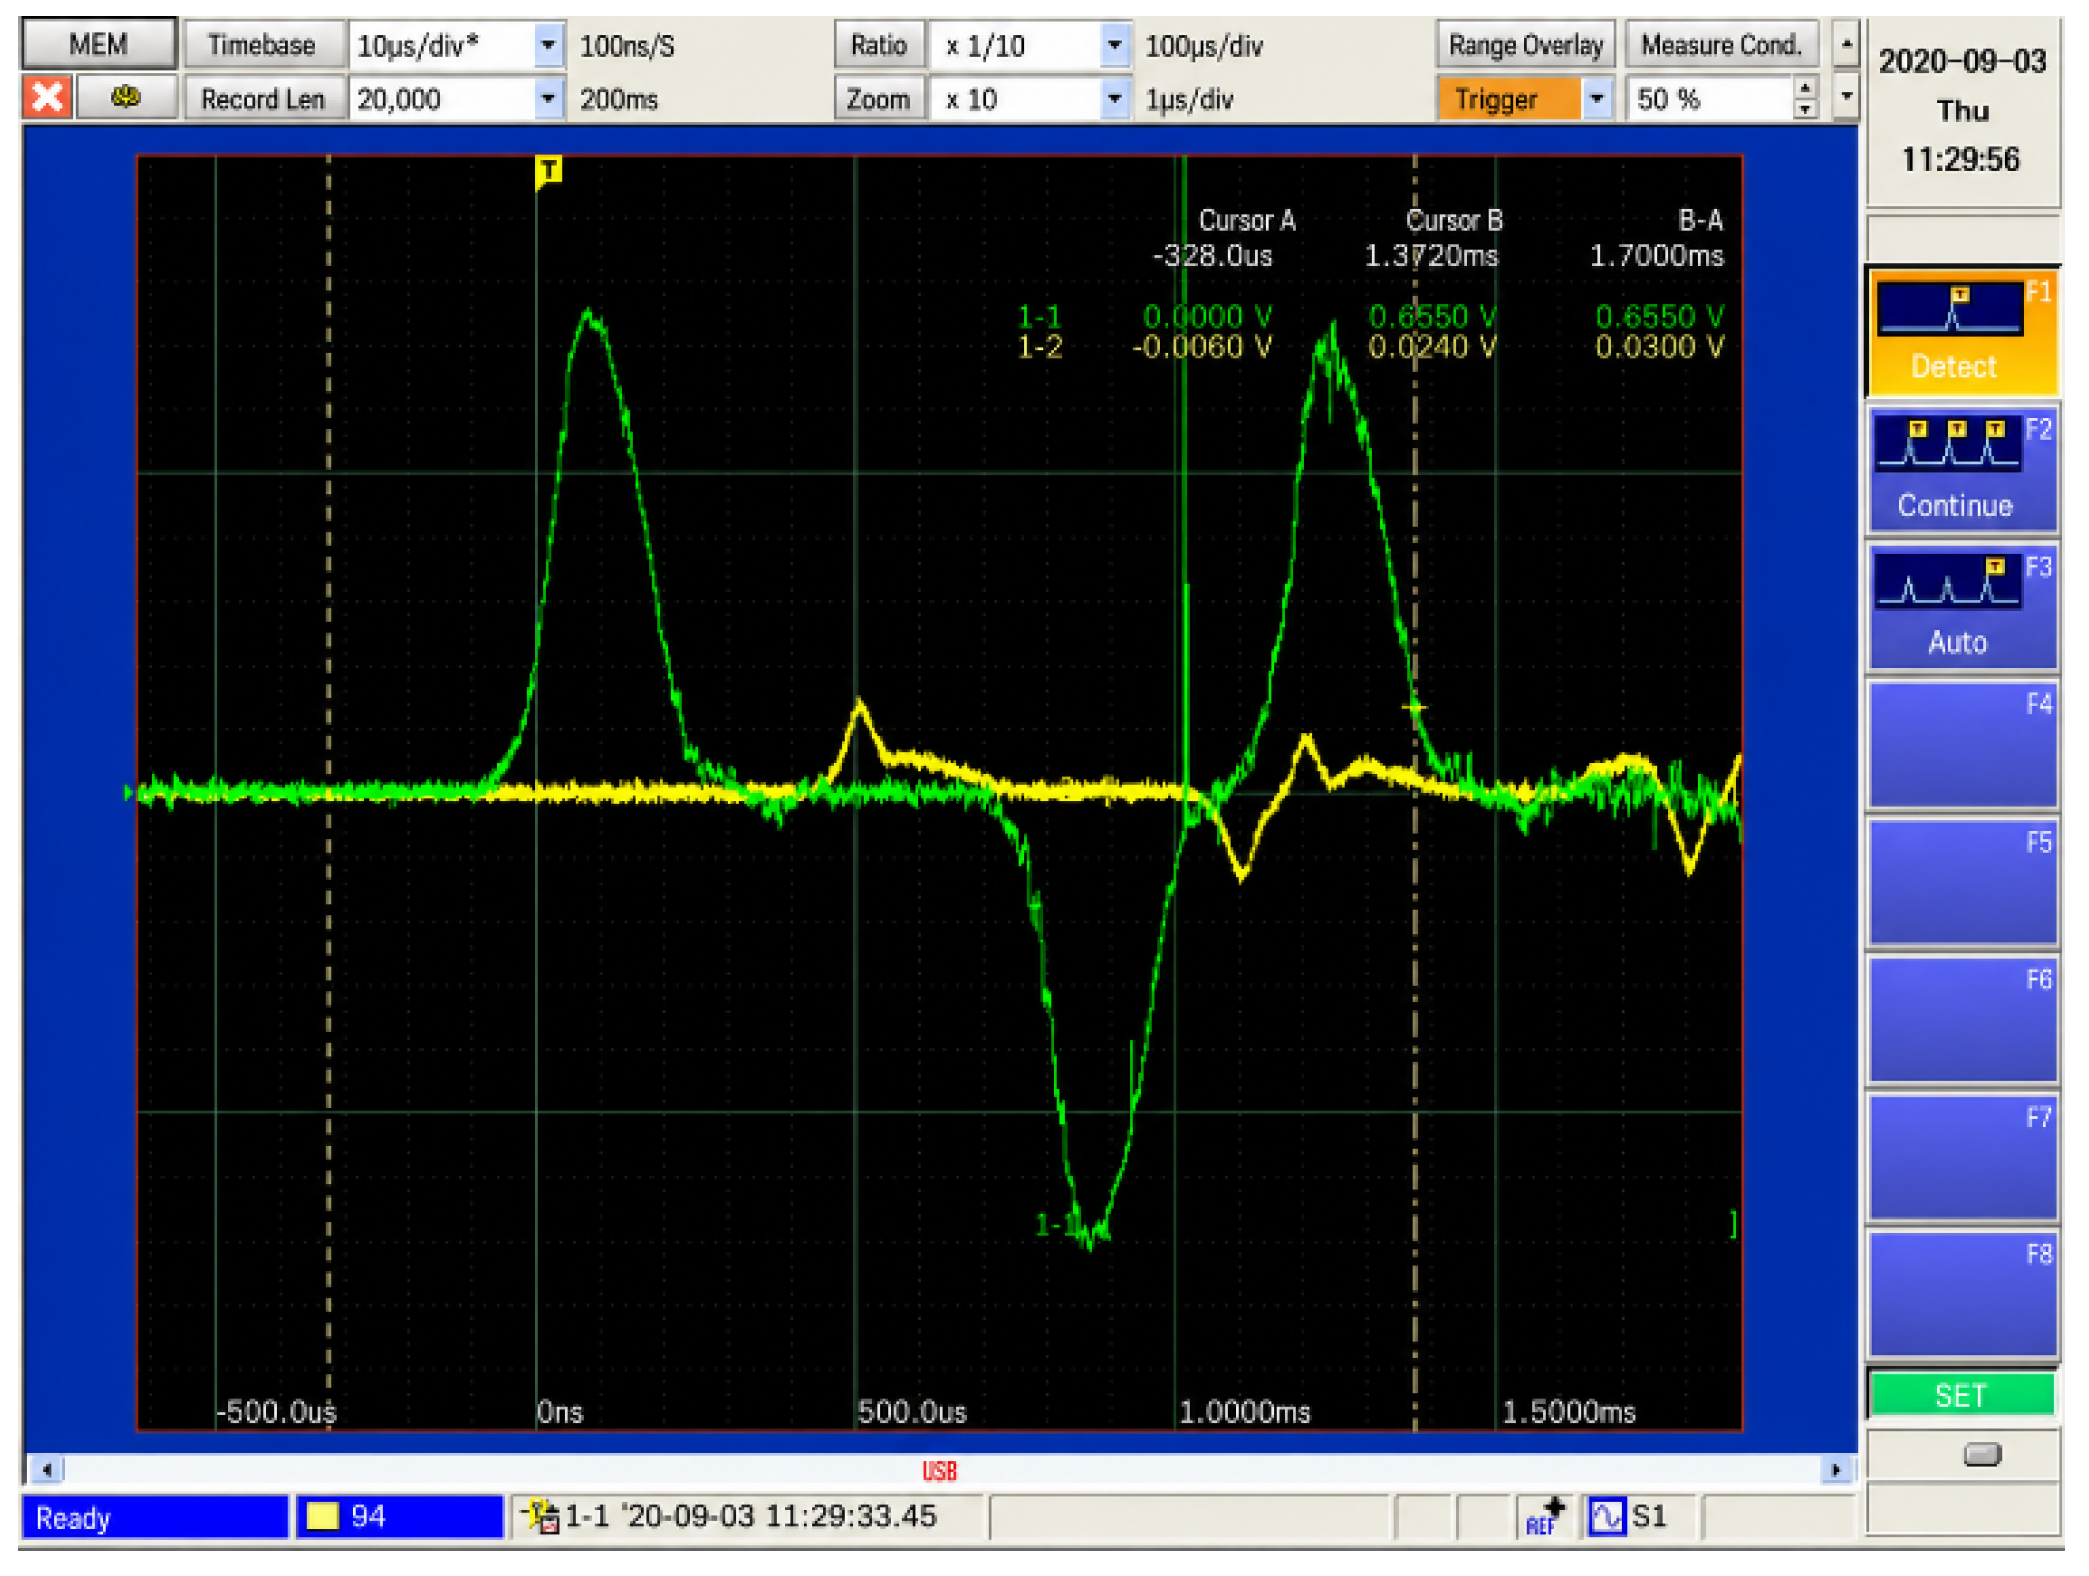
In the dynamic experiments, four hydrostatic pressure levels—0 MPa, 10 MPa, 20 MPa, and 30 MPa—were established to replicate the stress states encountered by rock under actual field conditions. For each pressure level, a minimum of eight valid data points were collected. Representative test waveforms are presented in Figure 6.
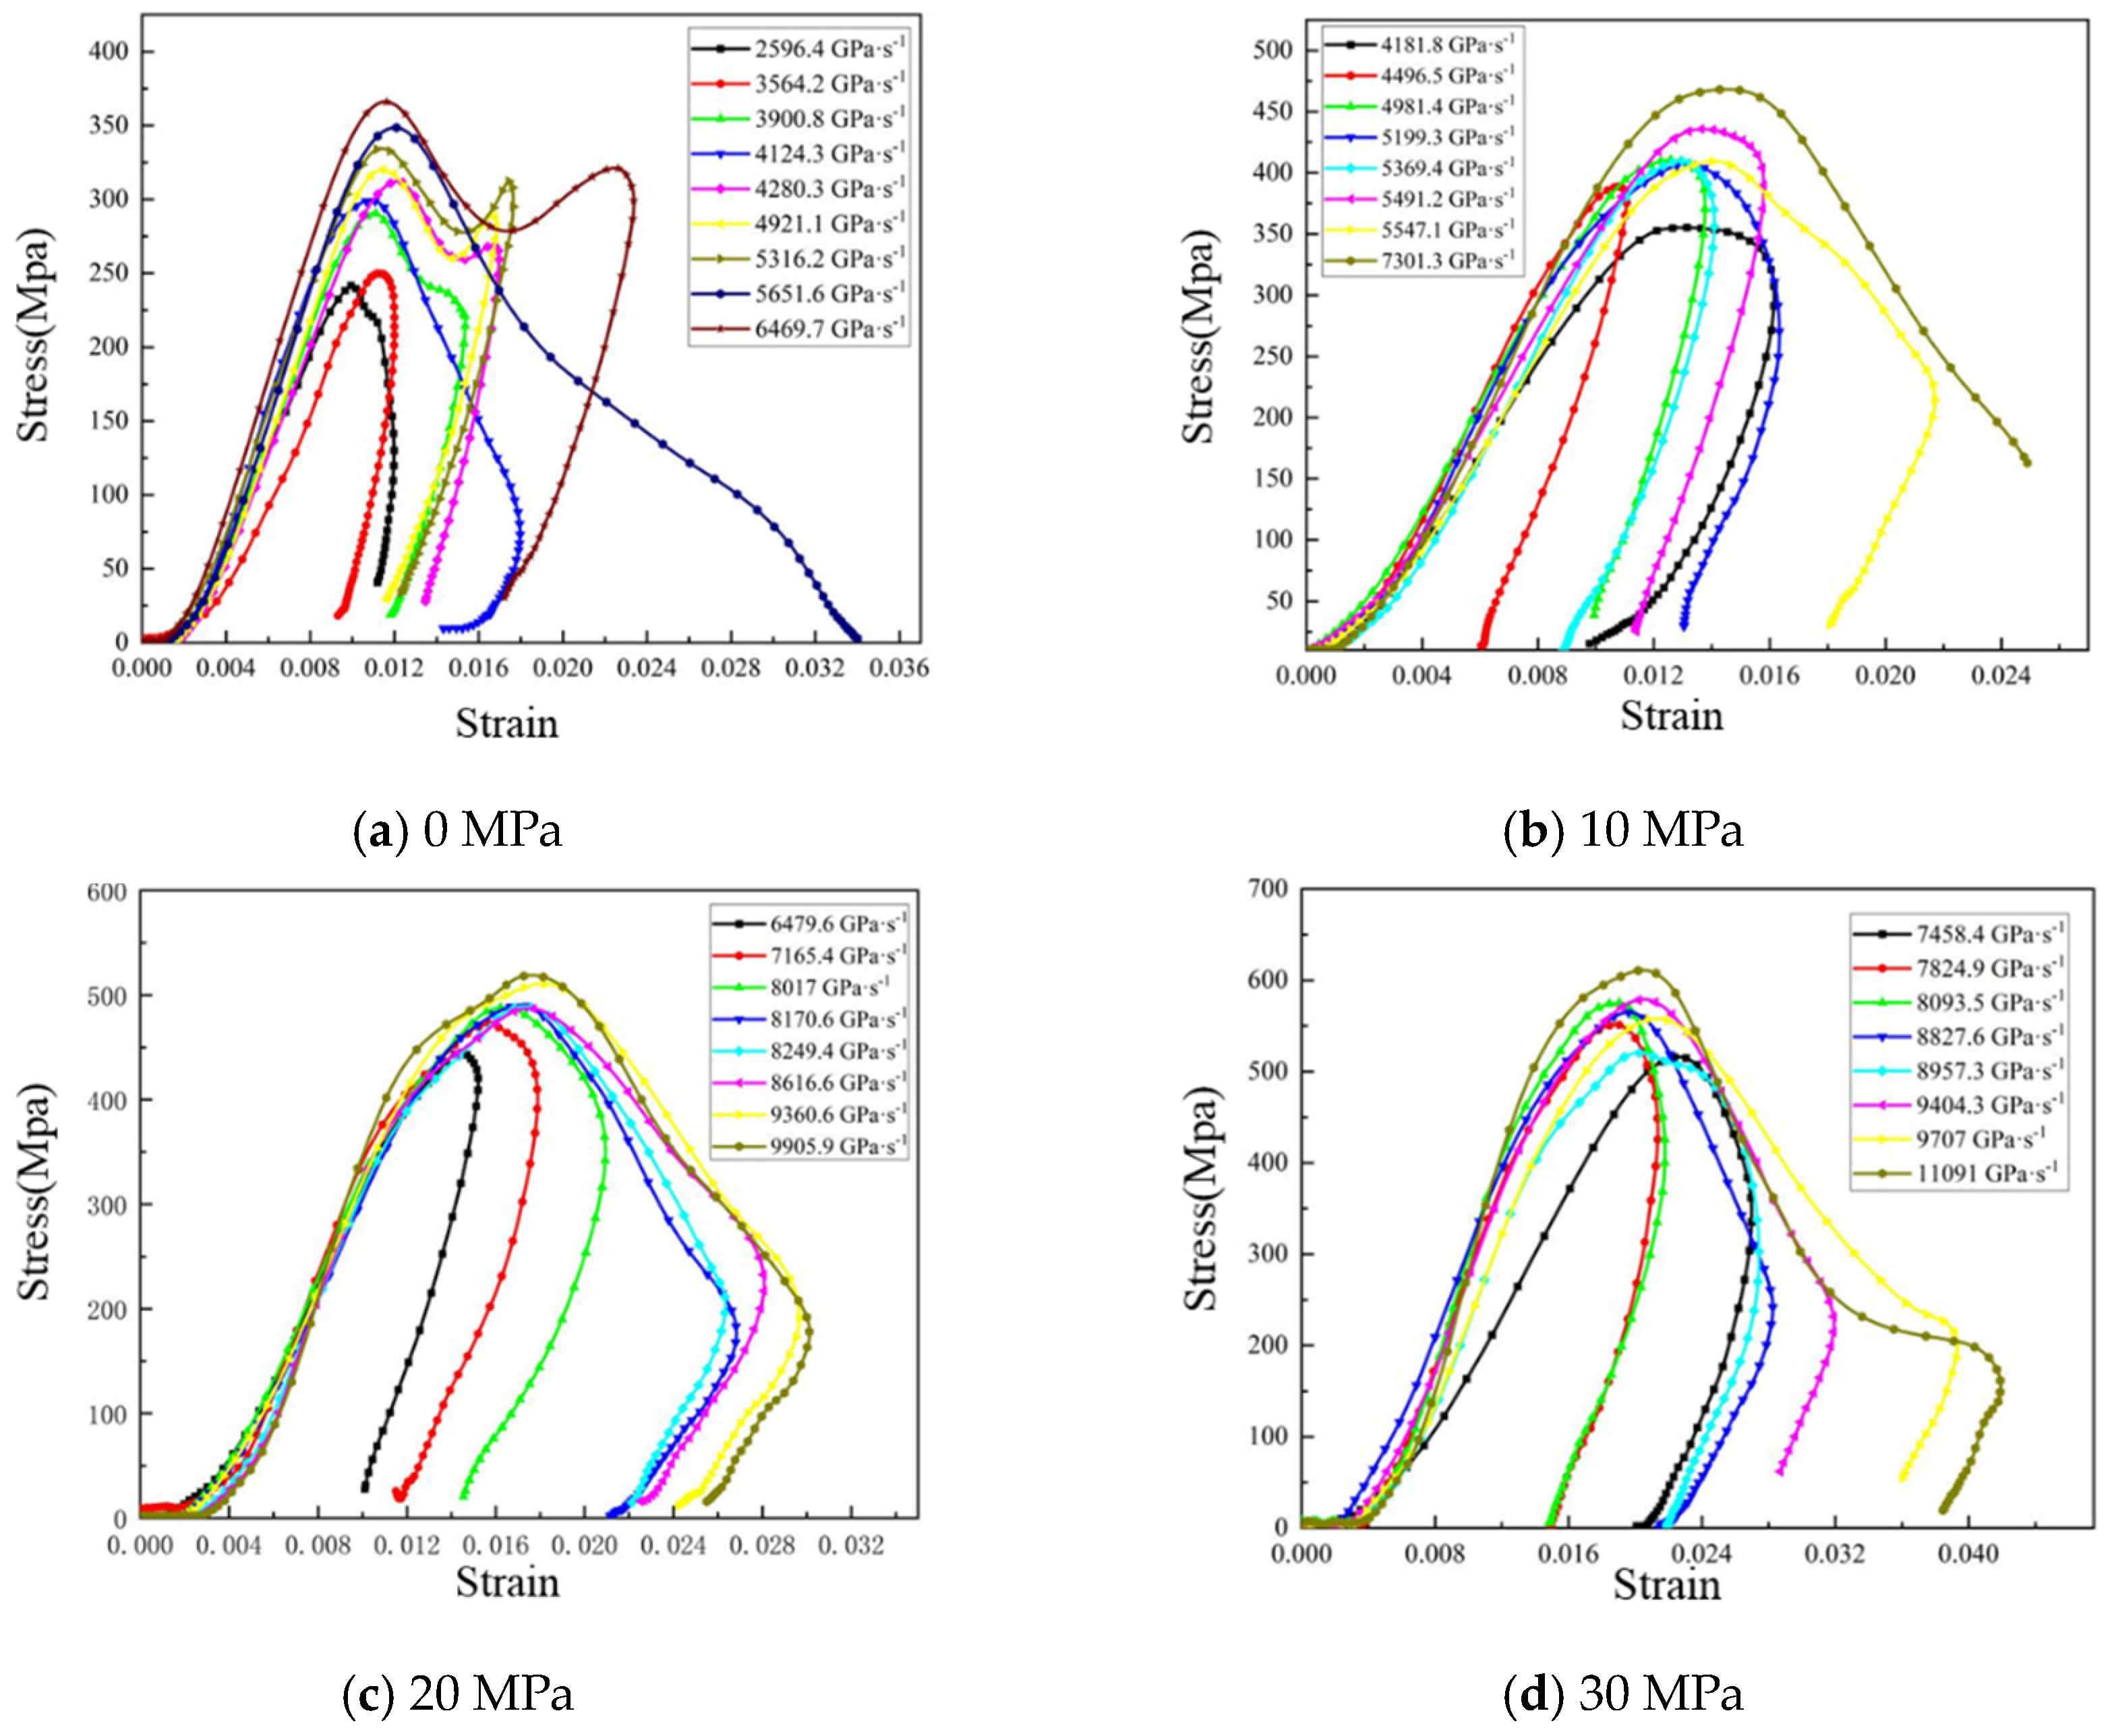
For the dynamic compression experiments, four groups of parallel tests were performed under varying confining pressures of 0 MPa, 10 MPa, 20 MPa, and 30 MPa. Within each confining pressure condition, a minimum of eight dynamic tests were carried out at different loading rates. Stress–strain curves were generated from the experimental data, and acoustic emission data were recorded from two channels throughout the specimen failure process under each testing condition. Utilizing the dynamic test results, stress–strain relationships for the rock at different loading rates were plotted corresponding to the various confining pressure levels, as illustrated in Figure 7.

Determination of Material Parameters

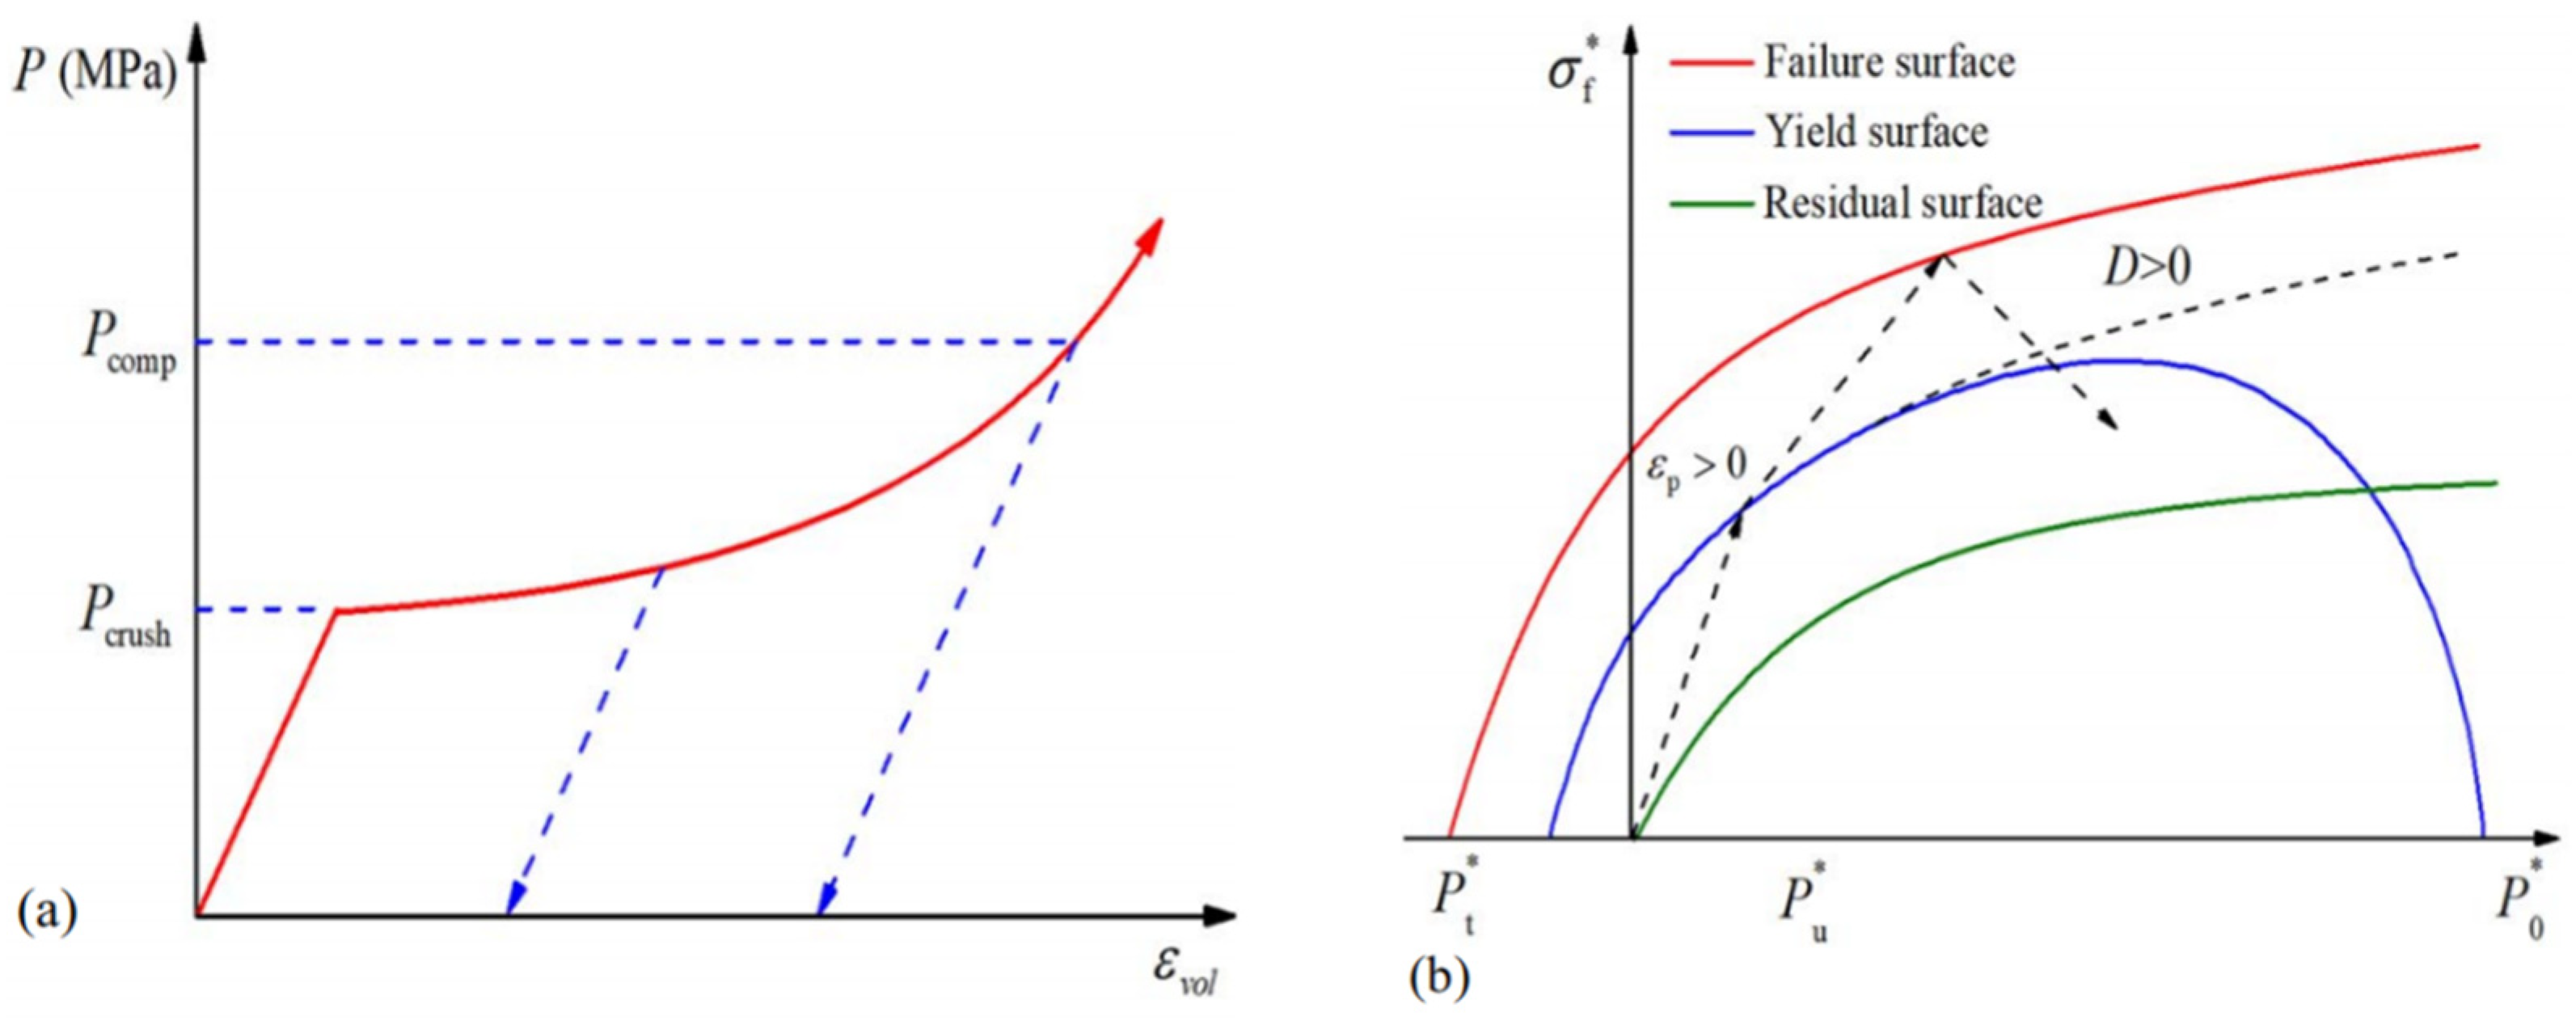
The Riedel–Hiermaier–Thoma (RHT) constitutive model implemented in the Ansys LS-DYNA19.0 software is extensively employed to characterize the dynamic behavior of rock and concrete-like materials subjected to large deformations and high strain rates, such as those encountered during blasting, impact and projectile penetration. Building upon prior studies, this research adopts the RHT constitutive model to represent granite. Under pressures below the pore collapse threshold, the material is modeled as an elastic solid; however, when the pressure surpasses this critical value, the pore structure undergoes collapse, leading to a marked decrease in the material’s effective bulk modulus. The yield surface within the RHT model is defined by the compressive strength, a normalized yield function and the William–Warnke function [36], as shown in Figure 8.
σ y ( P 0 , ε ˙ p , ε p ) = f c σ y ( P 0 , F r ( ε ˙ p ) , ε p ) R 3 ( θ l , P 0 )
where σ y = normalized yield function, f c = uniaxial compressive strength; R 3 = Lode angle factor, θ l = Lode angle, F r = dynamic increase factor, P 0 = normalized pressure ( P 0 = P 0 / f c ), P 0 = hydro static pressure [ P 0 = ( σ 1 + 2 σ 3 ) / 3 ], where σ 1 and σ 3 = maximum and minimum principal stresses, respectively; ε p = plastic strain rate, and ε p = effective plastic strain [37]. The material parameters for the granite RTH material discussed in this study were obtained through mechanical testing of rock specimens using the Split Hopkinson Pressure Bar (SHPB) apparatus under confining pressure conditions, as detailed in Section 2.2, as well as from data reported in the relevant literature. The Parameters are listed in Table 1.
The LS-DYNA software utilizes the Lagrangian framework and incorporates both the Arbitrary Lagrangian–Eulerian (ALE) and Eulerian approaches. In the present study, the rock model was simulated using the Lagrangian method, whereas the ALE method was applied to the explosive and air models. Fluid–structure interaction was established among the rock, explosive, and air domains. To model the detonation process of pentaerythritol tetranitrate (PETN), the *MAT_HIGH_EXPLOSIVE_BURN* material model was employed, and the Jones–Wilkins–Lee (JWL) equation of state (EOS) was adopted to characterize the explosive behavior.
P J = A J ( 1 ω / R 1 V ) e R 1 ν + B J ( 1 ω / R 2 V ) e R 2 ν + ω E J / V
where P J = detonation product pressure; V = relative volume of detonation products; E J = specific internal energy, A J , B J , R 1 , R 2 and ω are the JWL params, respectively. The air model is described using the keywords *MAT_NULL and Linear_Polynomial EOS, and the air pressure (Pa) under dynamic loads is expressed according to the formula given [28].
P a = C 0 + C 1 μ + C 2 μ 2 + C 3 μ 3 + ( C 4 + C 5 + C 6 μ 2 ) E a
where E a = specific internal energy, C 0 C 6 = material constant, C 4 and C 5 are defined as γ − 1 (where γ = specific heat ratio; for an ideal gas, γ = 1.4); the air compression parameter is expressed as μ = ( P a / P a 0 ) − 1 (where P a and P a 0 are the current and initial air densities, respectively).

3. Analysis of Damage to Tunnels Following Detonation Under Various Conditions

3.1. Geostress Model Stress Initialization

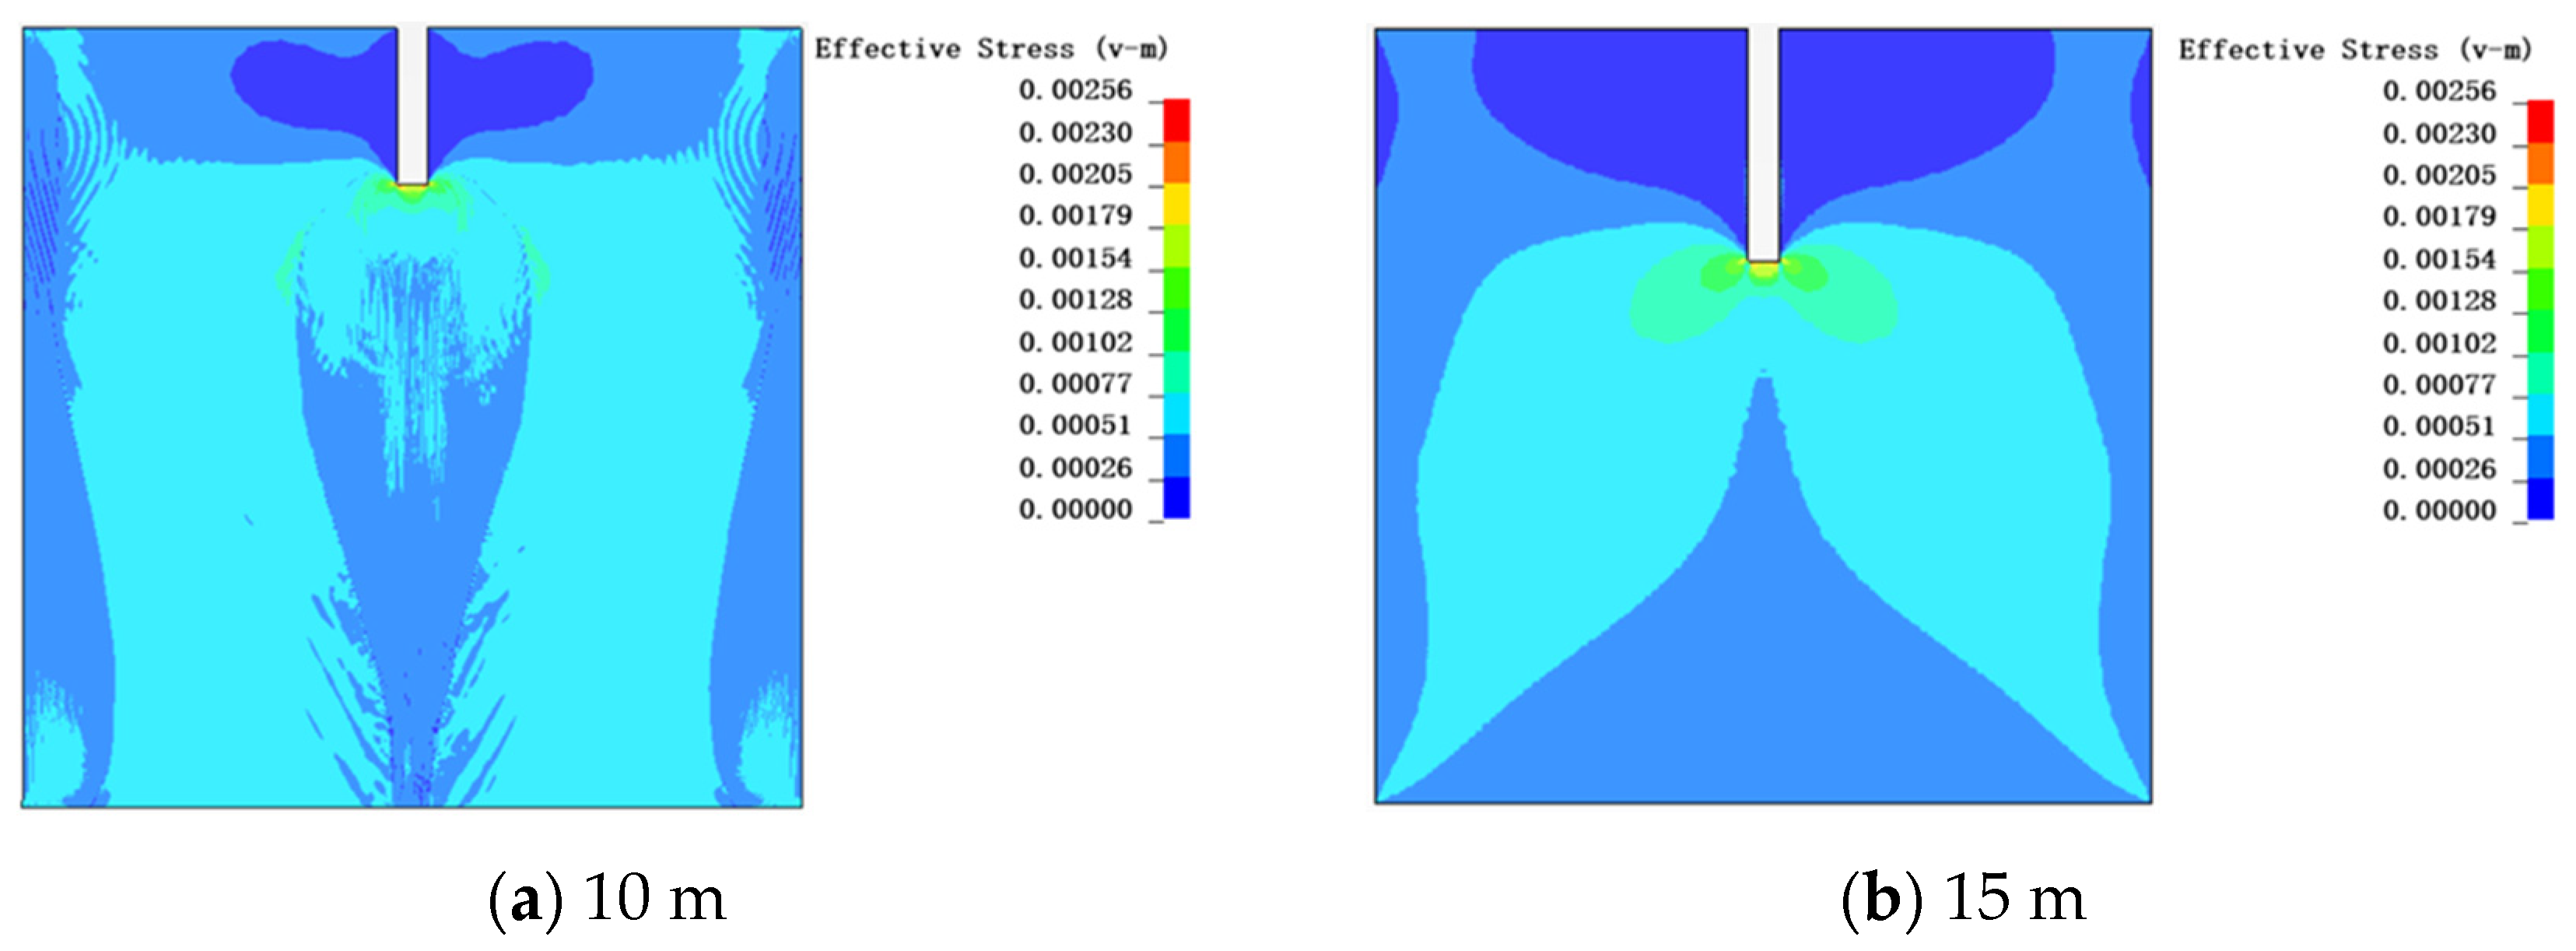
To effectively simulate the projectile penetration under geostress, the initial stress loading is performed using the dynain file method. This involves applying stress to the initial rock model, as illustrated in Figure 9 shows the initialization plots for two different depths of geostress at the 25 ms. The dynain file output provides the stress–strain state of the rock influenced by the initial stress. The remaining five surfaces are subjected to loading based on a stress–time curve, the total duration for this process is set at 90 ms.

3.2. Analysis of Explosion Effects Under Geostress at Different Depths

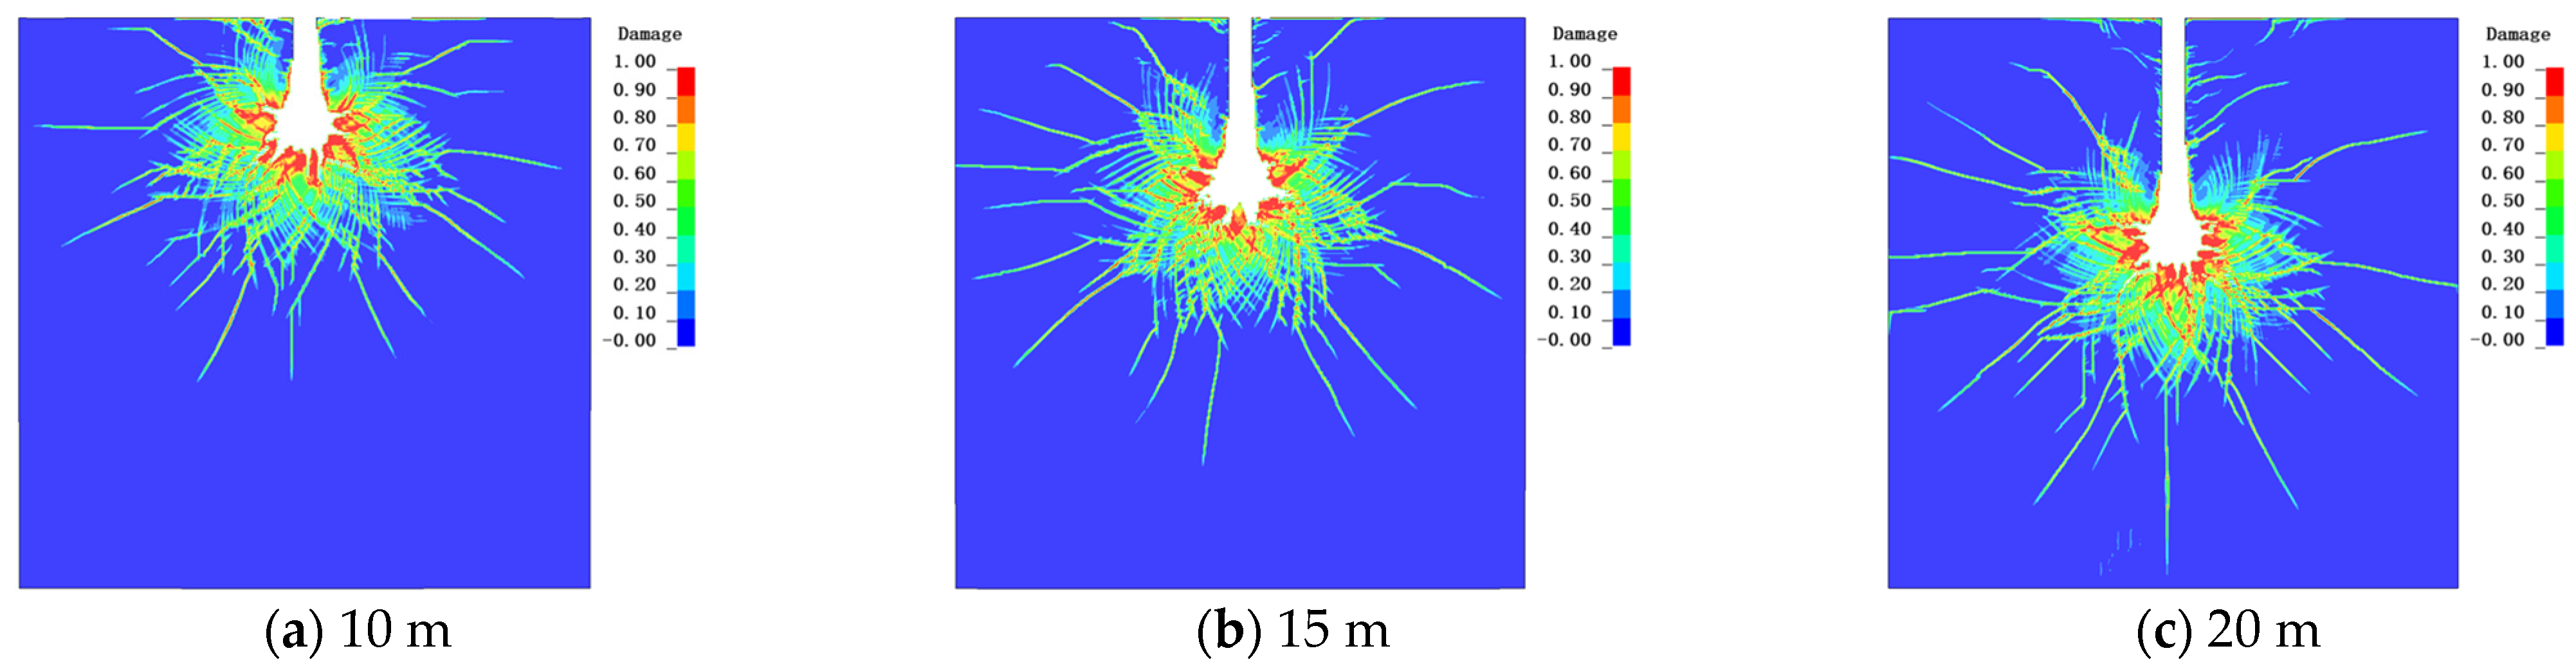
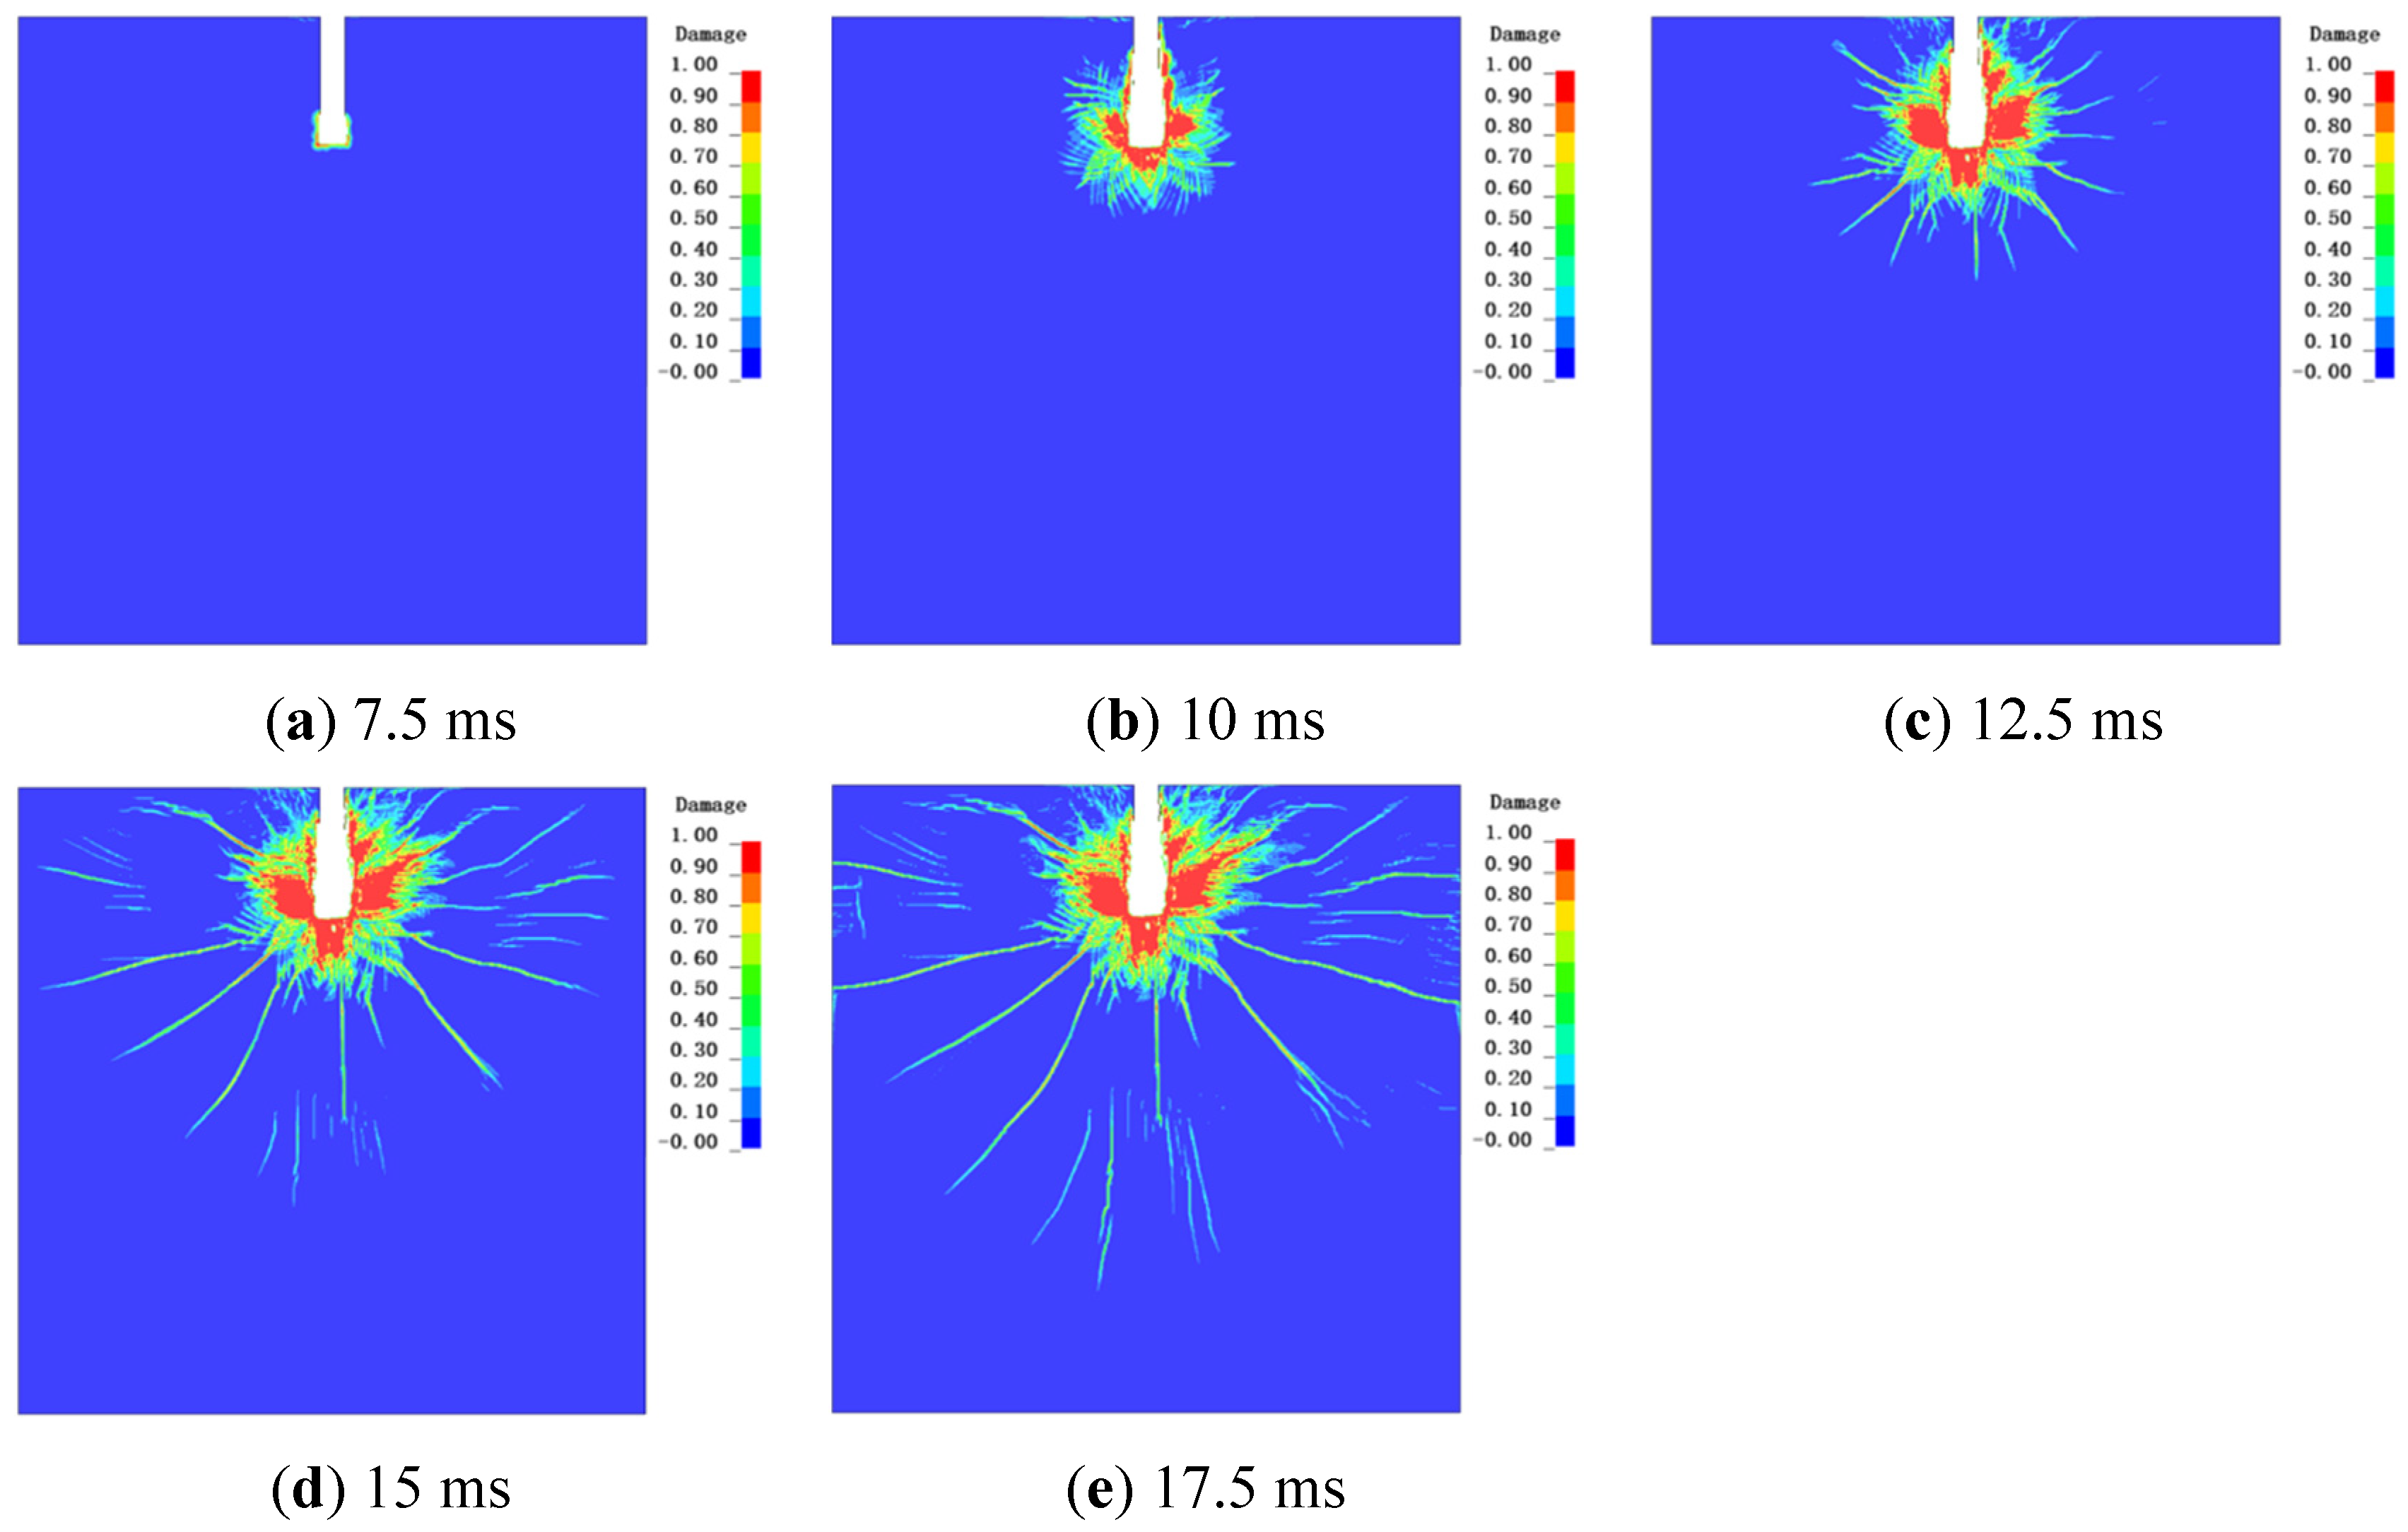
Figure 10 presents the damage cloud diagram corresponding to a penetration depth of 10 ms under a geostress condition of 0 MPa. At this stress level, damage initiation at the base of the model occurs approximately 7.5 ms following the detonation of the explosive charge. By 10 ms, the damaged region at the base of the penetration path has expanded, characterized by the formation of a crushing zone and a crack zone proximal to the explosive source. As time advances to 12.5 ms, the damage zone further enlarges, accompanied by the emergence of tensile cracks along the periphery of the damaged area. At this stage, the primary explosive activity concludes, and the spatial extent of the principal fragmentation damage zone stabilizes without further expansion. Progressing to 15 ms, the explosion-induced cracks continue to propagate under the influence of the stress wave; concurrently, the density of micro-cracks near the damage zone increases and the primary tensile cracks elongate. Beyond 17.5 ms, residual stress waves facilitate additional extension of the primary tensile cracks, after which the overall damage evolution attributable to the explosion ceases.
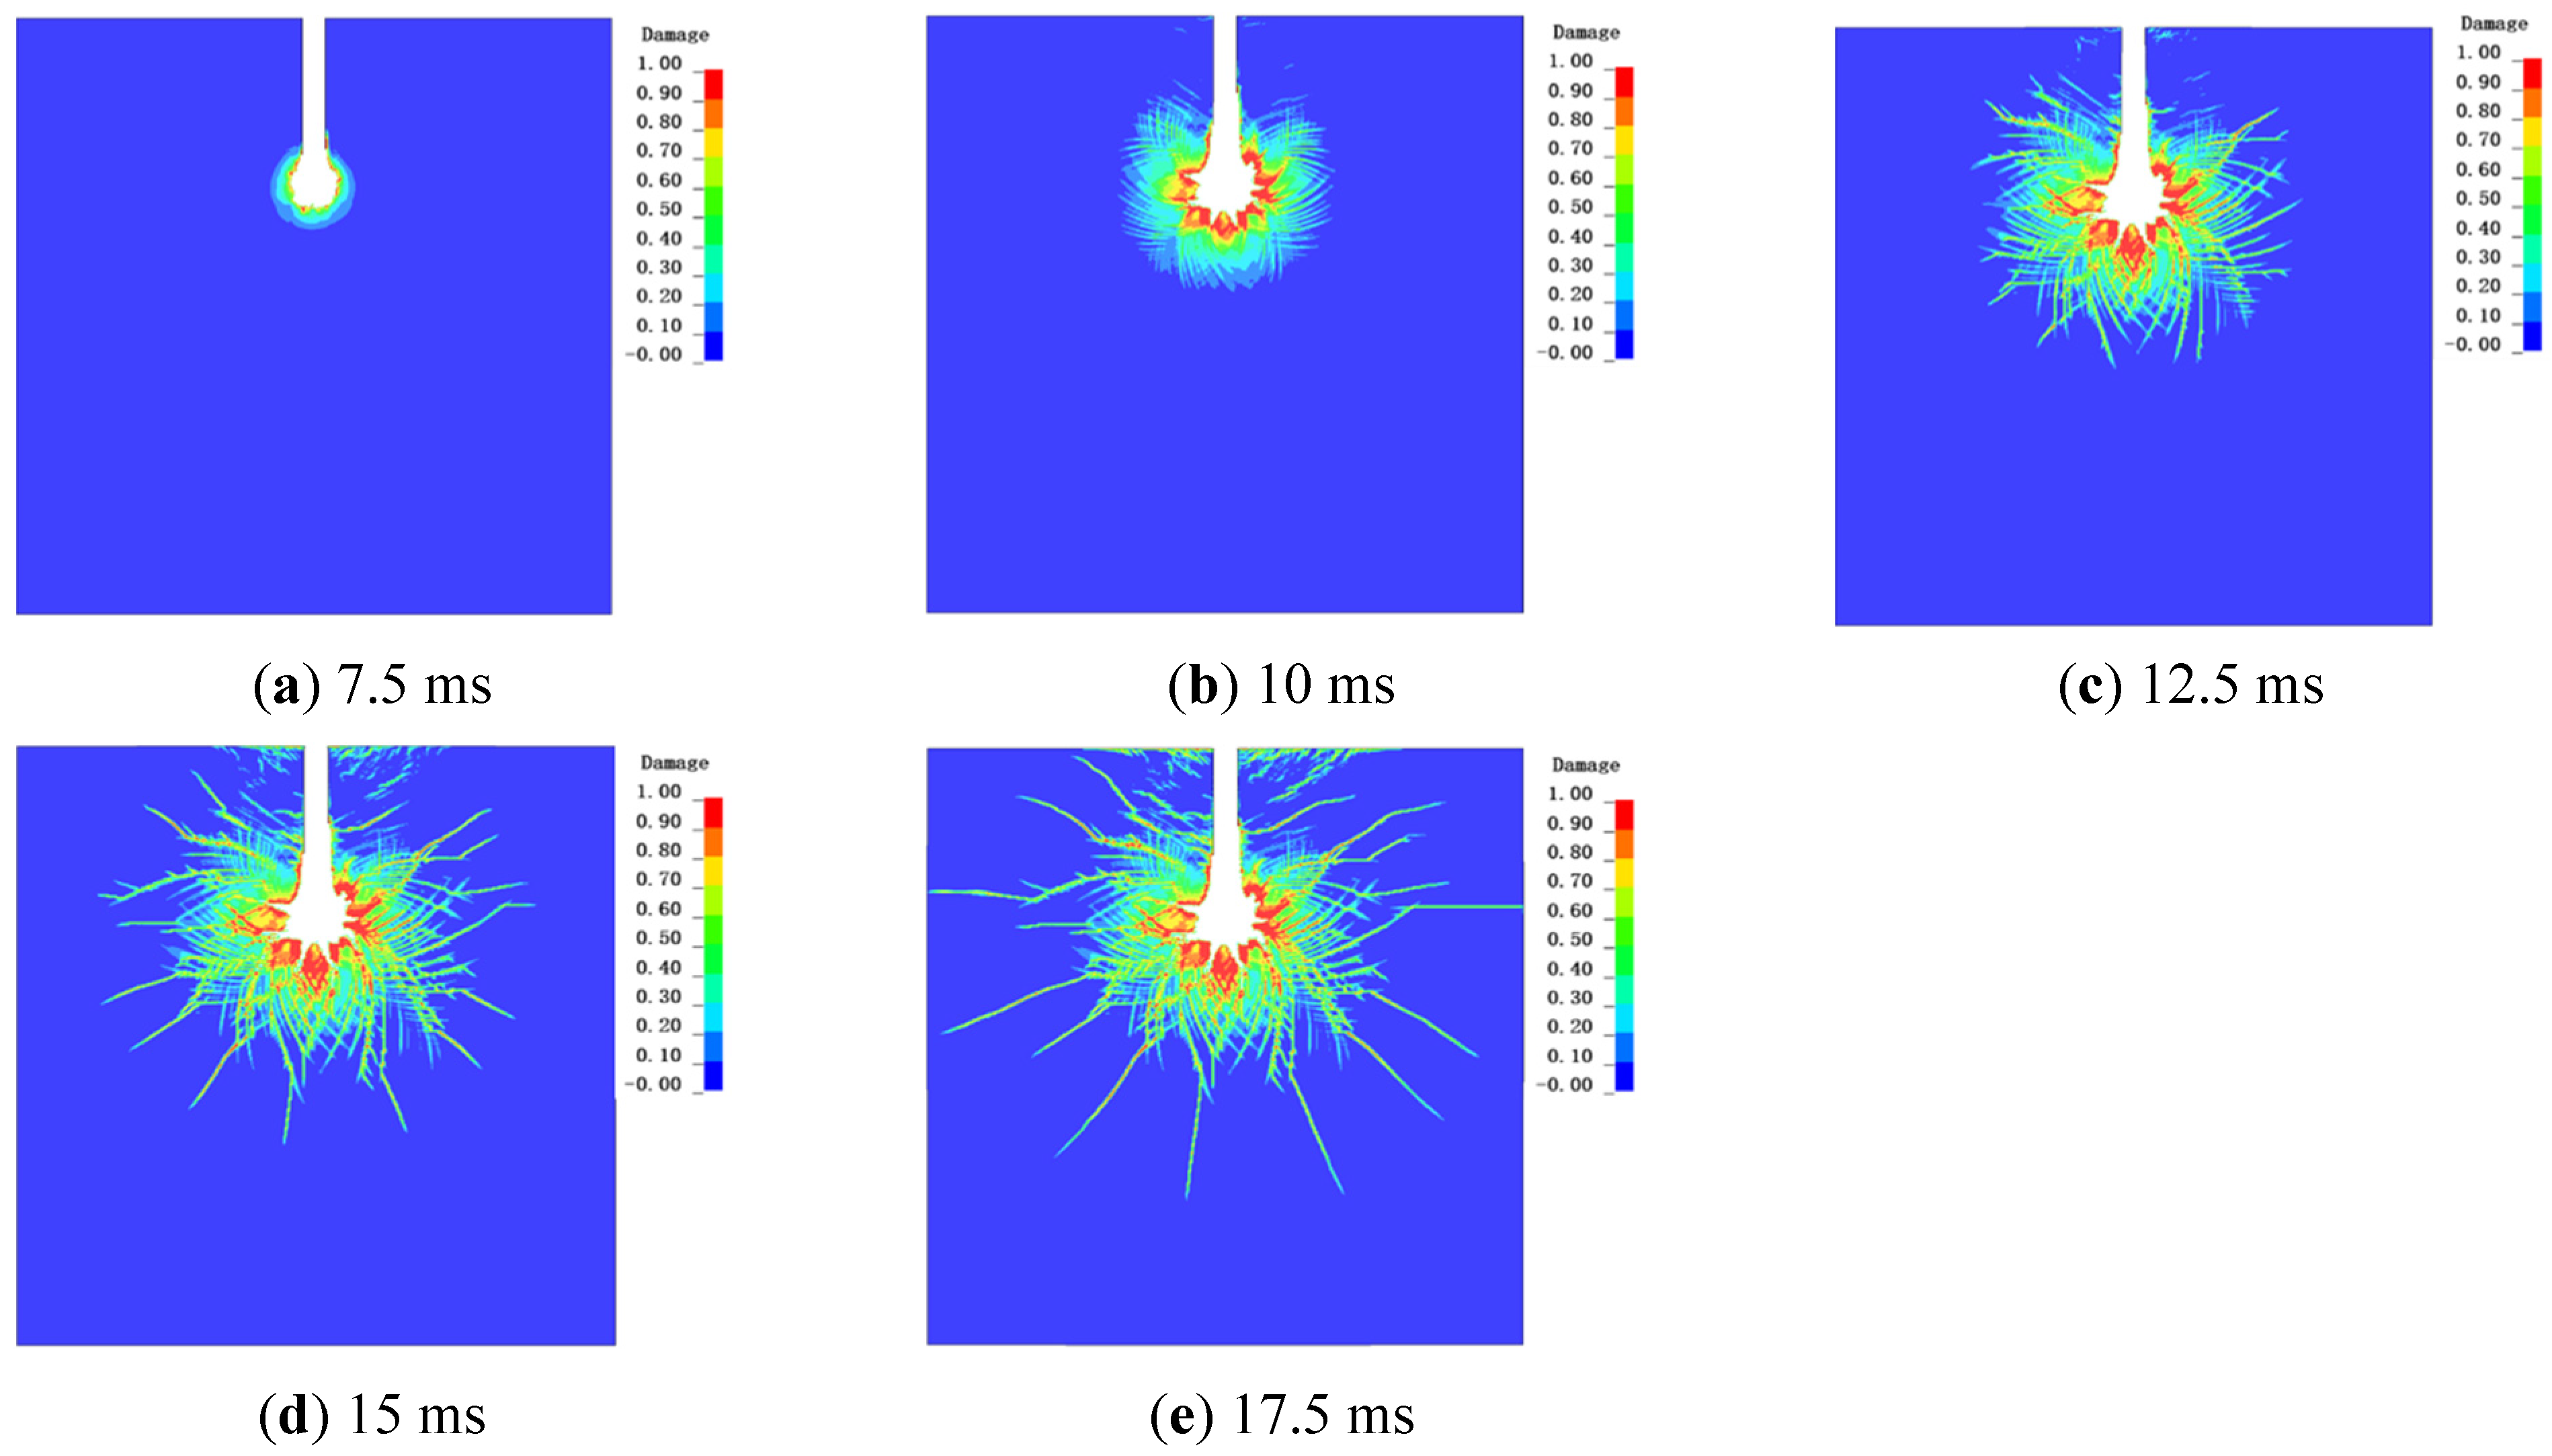
Figure 11 presents the damage cloud diagram corresponding to a penetration depth of 15 m under a geostress condition of 0 MPa. When compared to the damage cloud diagram at a depth of 10 m the progression of damage at these two depths can be categorized into three distinct stages: fragmentation, crack initiation, and crack propagation. However, the extent of damage development at equivalent time intervals differs between the two depths. At 15 m depth, a circular damage zone emerges at the base of the blast pit during the initial post-explosion phase, whereas at 10 ms depth, the damage zone is smaller and exhibits a rectangular shape. By 7.5 ms, the circular damage zone at 15 m demonstrates a greater degree of rock fragmentation in proximity to the explosives relative to the damage zone at 10 m. At 10 ms, both the overall fragmentation zone and the severity of fragmentation have increased, accompanied by the formation of numerous micro-cracks adjacent to the fragmentation zone. By 12.5 ms, the fragmentation zone ceases to expand further; however, micro-cracks in its vicinity continue to propagate. Under the influence of blast gases, these existing fissures further extend by 15 ms, with crack propagation ultimately.
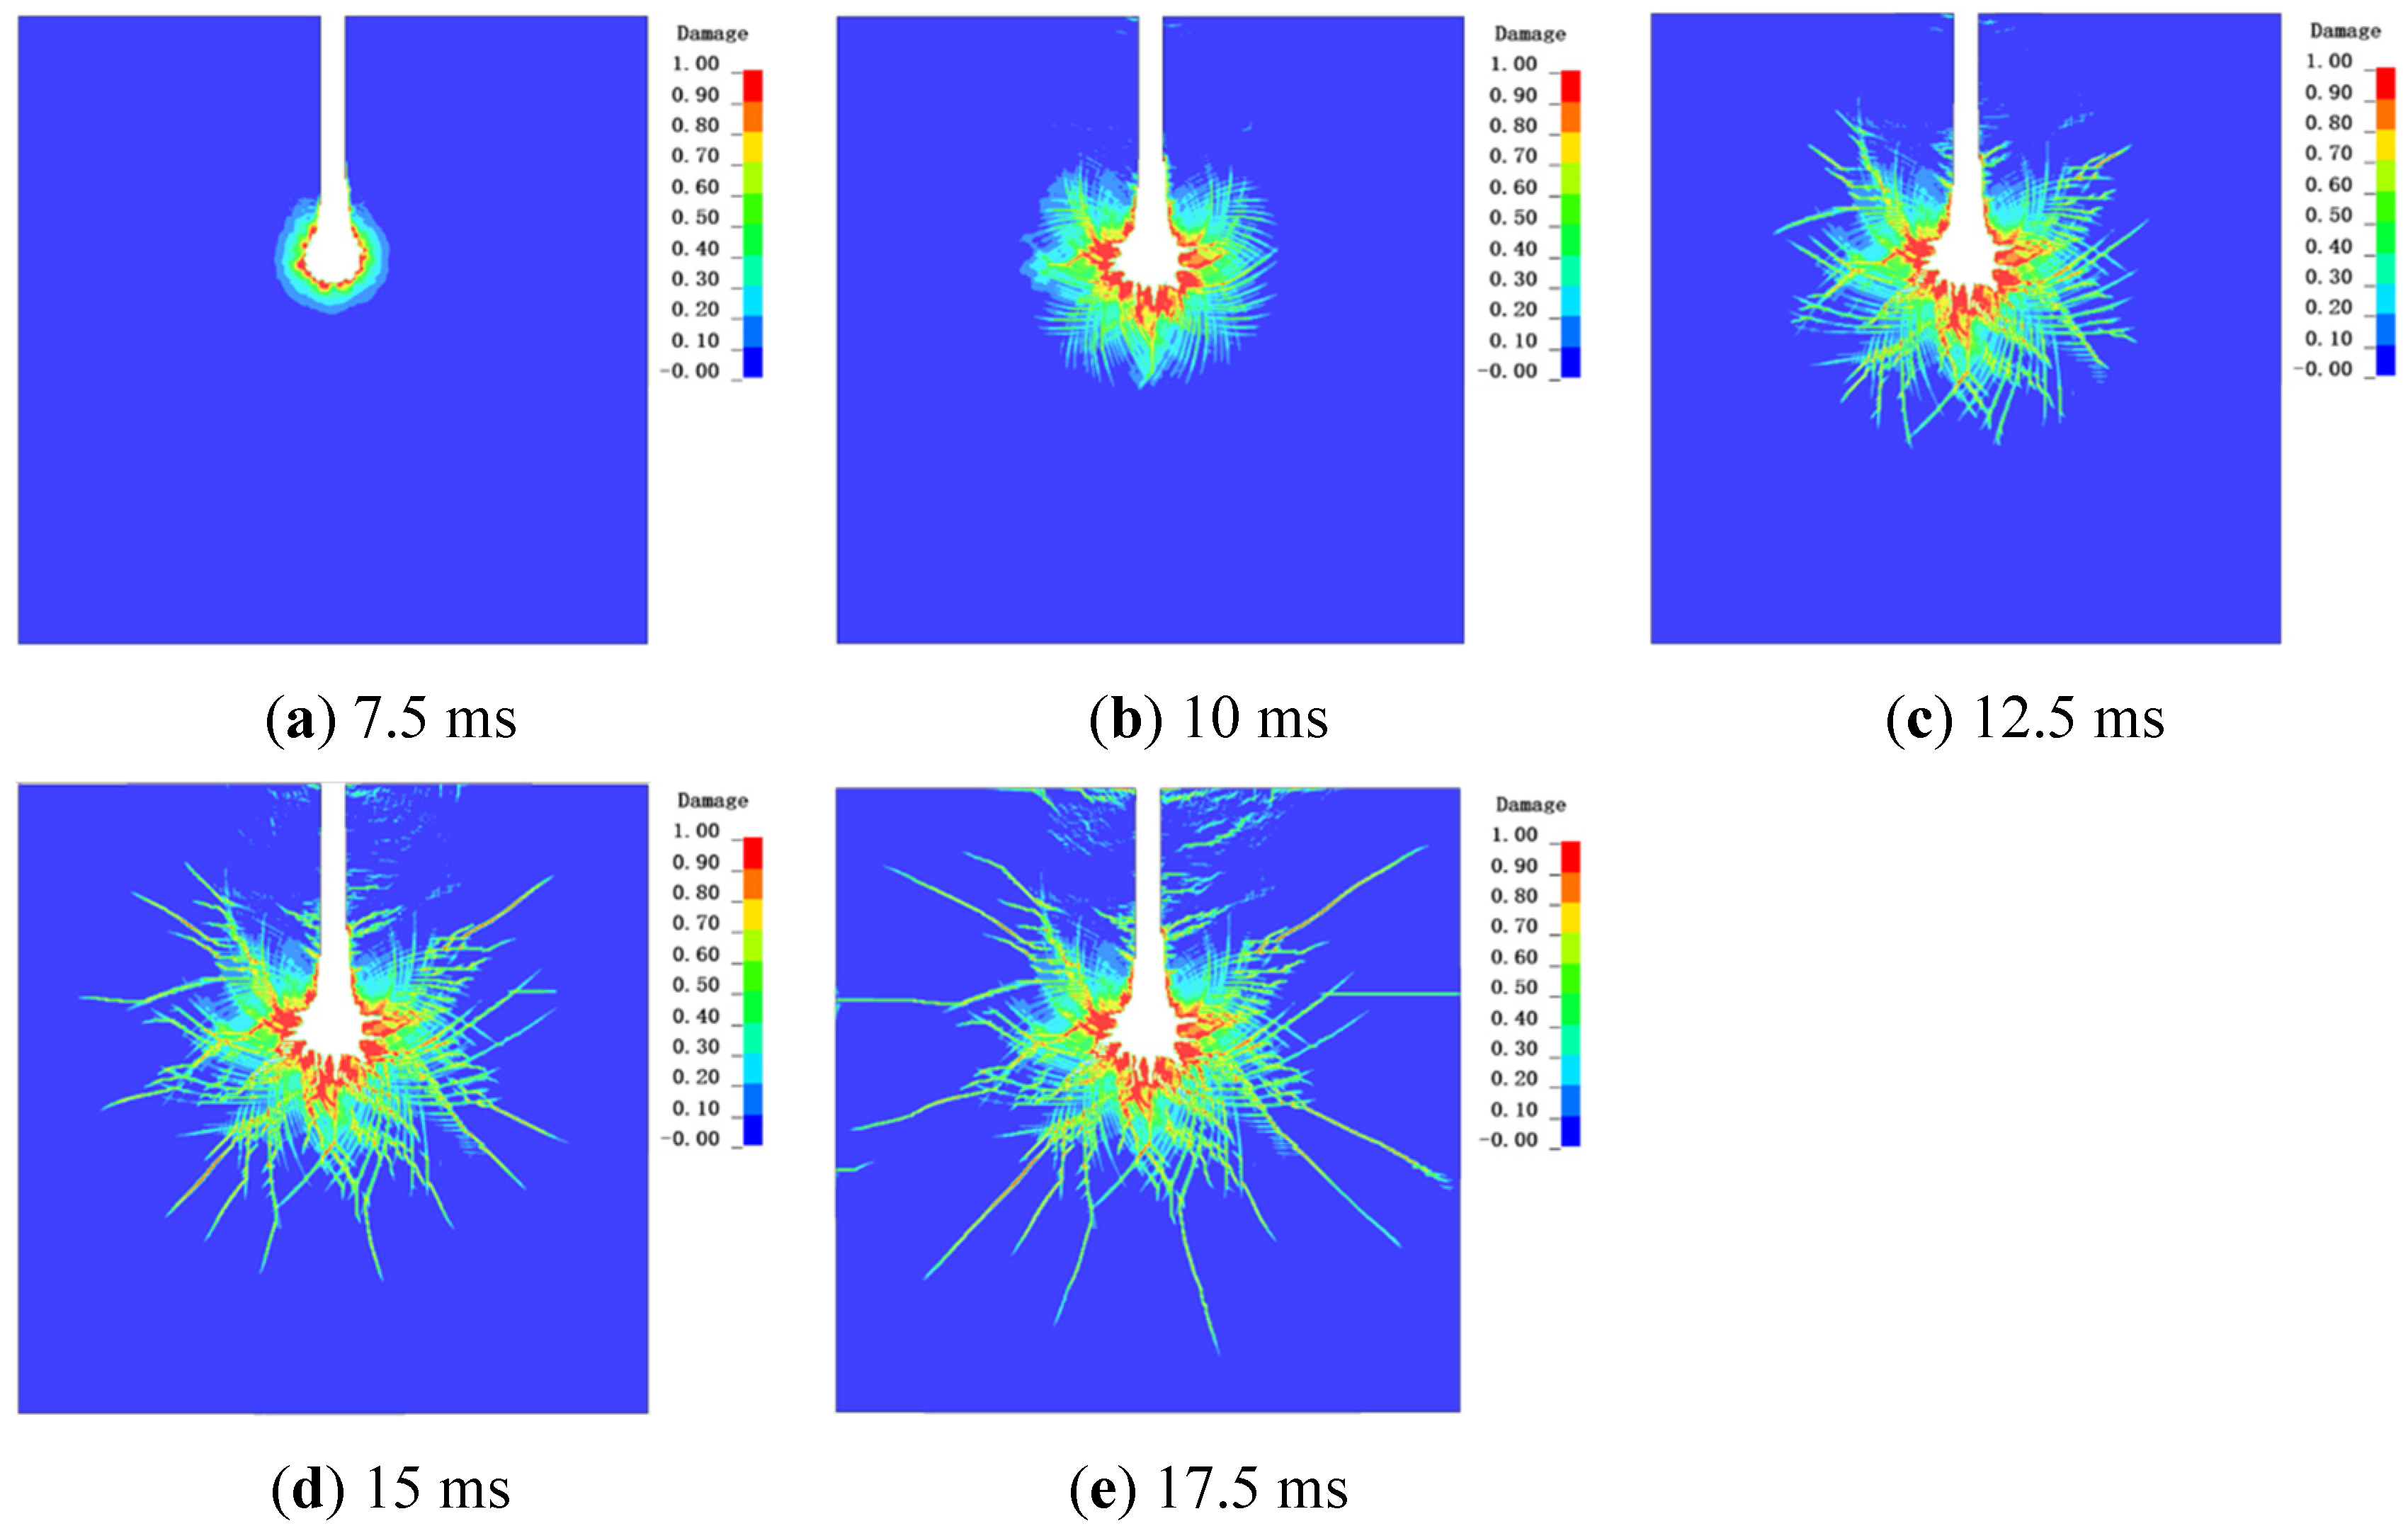
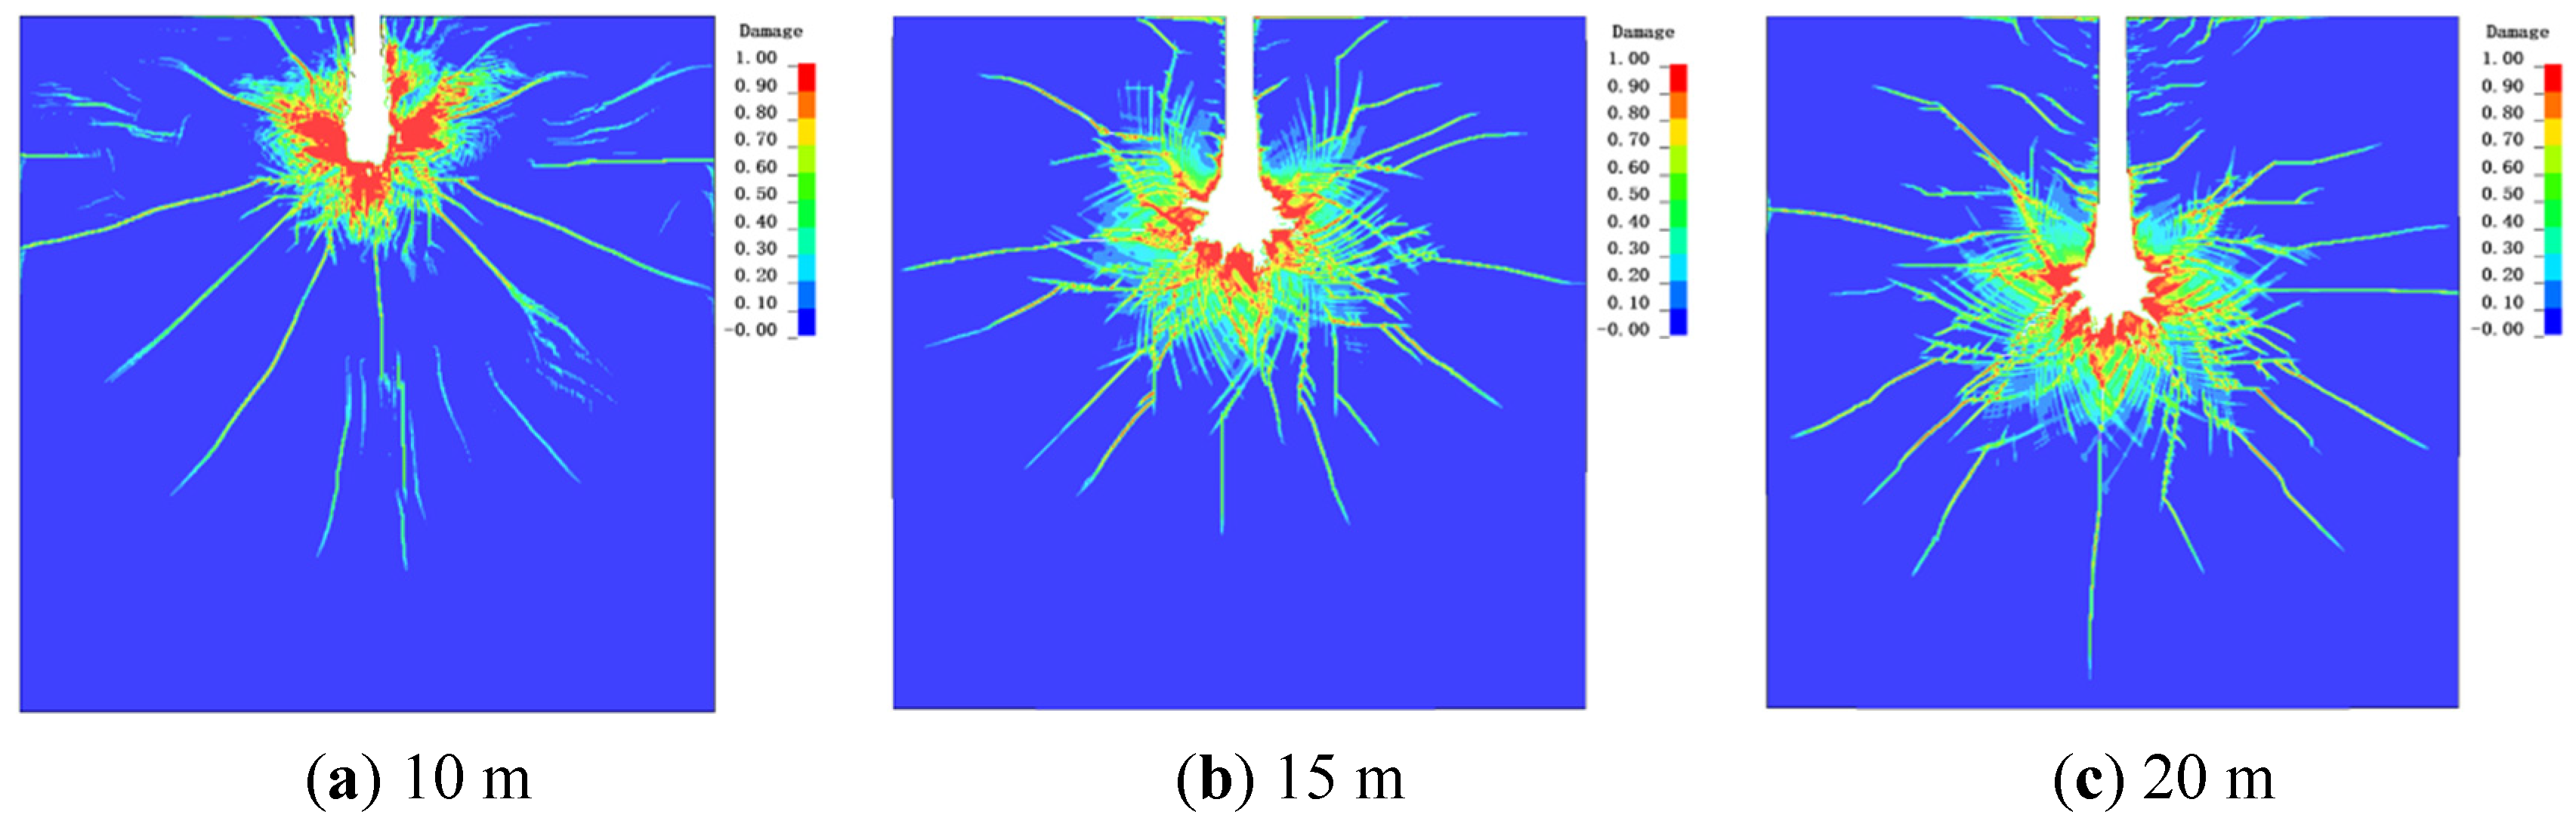
A comparative analysis of damage patterns at depths of 10 m and 15 m, as depicted in Figure 12, reveals that the damage zone induced by the shock wave generated during the initial explosion phase is more extensive at a depth of 20 m. When explosives are placed at shallower depths, a significant portion of the gases and shock waves produced by the detonation escape toward the free surface, resulting in a loss of shock waves and consequently reduced damage to the model. Conversely, increasing the burial depth of the explosive confines the shock wave within the surrounding medium. This confinement compels the shock waves to act more directly on the rock mass, producing stronger seismic waves and greater impact forces, which intensify the resultant damage. Accordingly, greater explosive depths correspond to larger blast crater formations due to the more effective shock waves transfer. Within the crack propagation zone, the damage cloud pattern following detonation at 20 m depth exhibits a trend similar to the primary crack observed at 15 m. However, the damage zone at 20 m is characterized by a higher density of finer crack branches, indicating a more complex interaction between the stress wave and boundary conditions at this depth, which leads to increased material fragmentation. Furthermore, both the tensile phase of shock wave reflection and the expansion phase of explosive gases are more pronounced at 20 m depth.
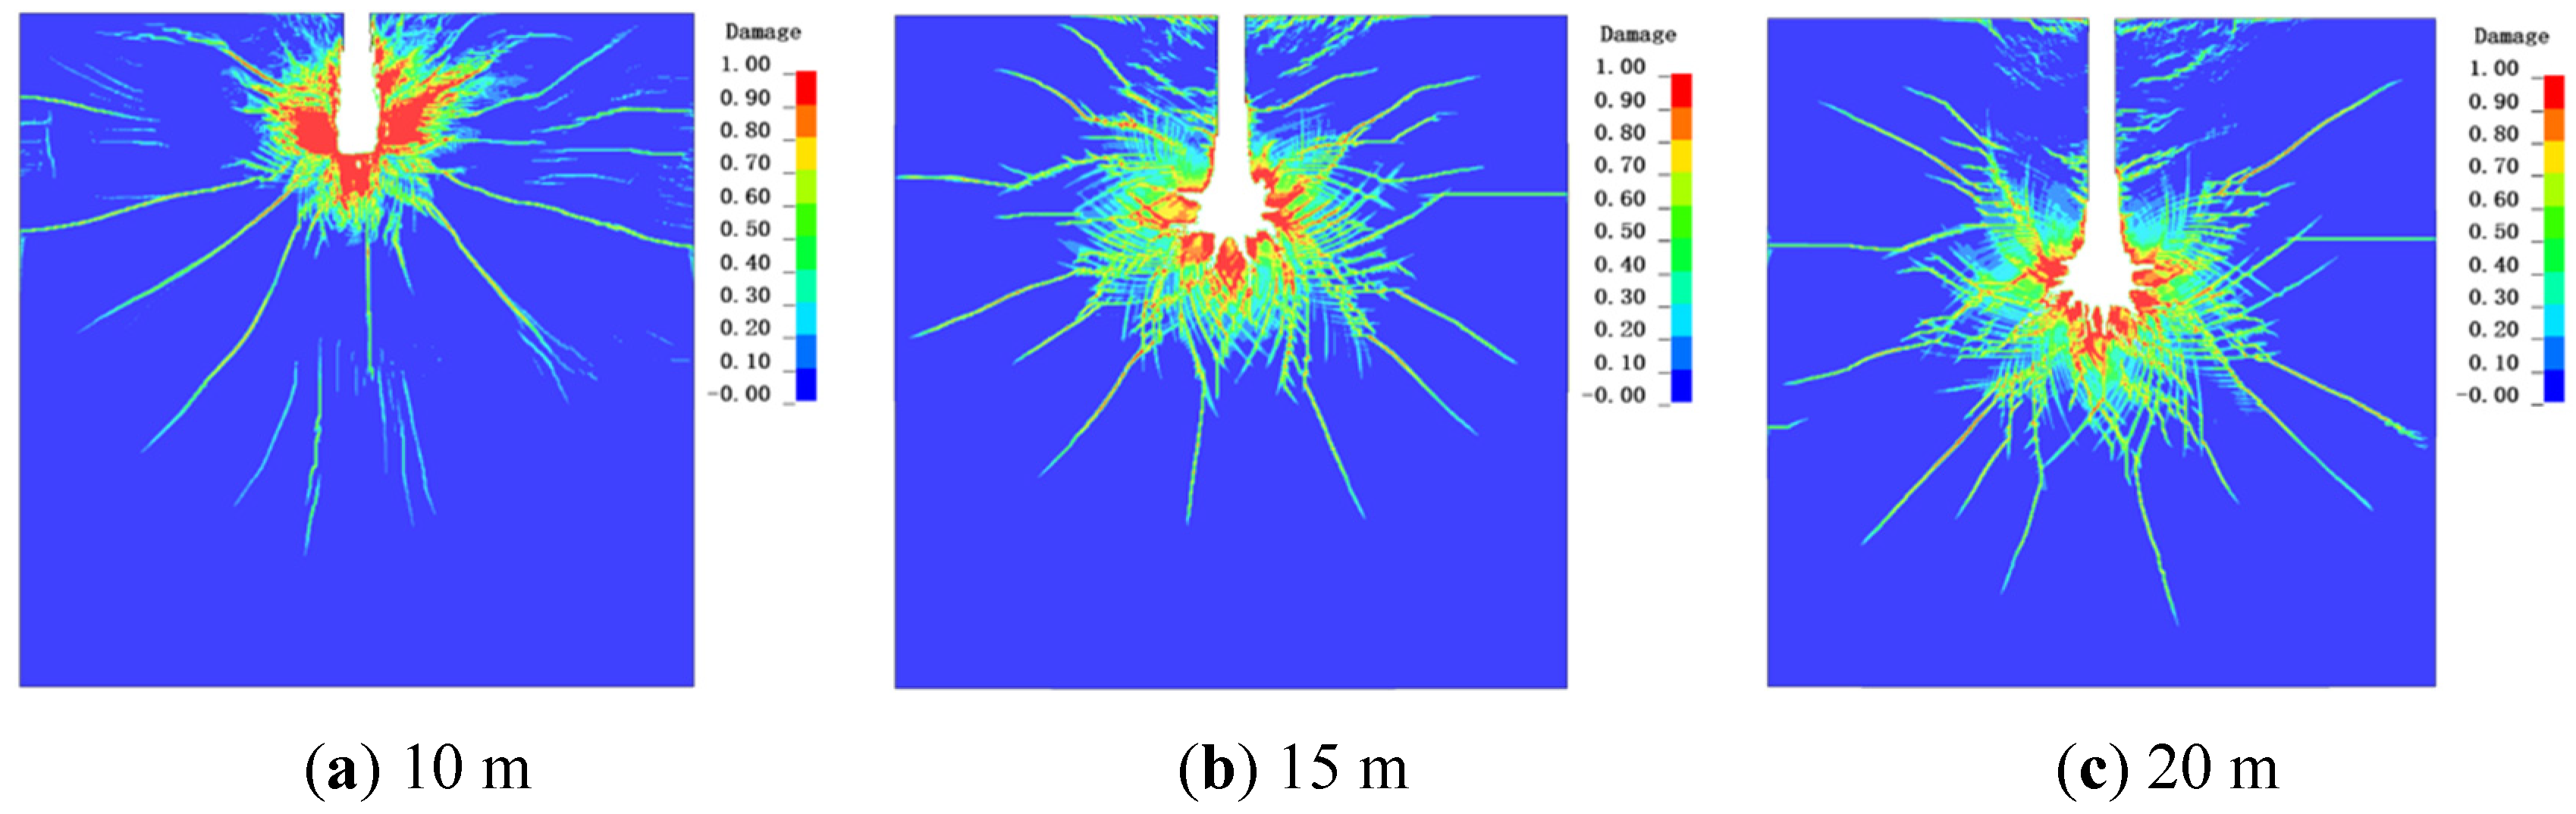
To further investigate the effects of geostress on damage at varying depths, explosion models were developed for multiple depths and geostress conditions, as illustrated in Figure 13. A comparative analysis of the damage cloud diagrams following detonation at a depth of 10 m under three distinct geostress levels reveals that, at 0 MPa and 10 MPa, the damage zone at the tunnel bottom assumes a wing-like morphology, characterized by relatively few micro-cracks and a pronounced propagation of primary fractures. This suggests that the shock waves predominantly induce directional splitting failure within the rock mass. Conversely, when the geostress is elevated to 20 MPa, the damage zone exhibits a diffuse fragmentation pattern, lacking a clear orientation of primary cracks and displaying a dense network of secondary fractures. The damage near the tunnel bottom in this scenario is primarily pulverization in nature. These observations imply that the interaction between explosion-induced stress waves and the geostress field generates a more complex stress environment, thereby altering the failure mode of the material. Additionally, the gases and shock waves produced by shallow detonations are largely impeded from escaping toward the free surface, resulting in an overall increase in fragmentation of the model.
Figure 13, Figure 14 and Figure 15 present a comparative analysis of damage cloud diagrams at a distance of 15 m post-detonation under three distinct geostress conditions. The results indicate that the primary crack development exhibits similar characteristics across all conditions, with no preferential propagation direction and comparable damage zone dimensions. Nevertheless, an increase in geostress intensity corresponds with a higher number of micro-crack branches within the damage zone, as well as an elevated crack density. Additionally, when the geostress is 0 MPa, the damage zone extends beyond the immediate vicinity of the detonation point, encompassing numerous cracks near the tunnel entrance and its surrounding area. This observation suggests that some of the gas and shock waves generated by the buried explosive detonation propagate toward the free surface, thereby inducing damage at the tunnel entrance and adjacent regions. In contrast, as the geostress intensifies, the quantity of damage cracks near the tunnel entrance and surrounding areas markedly decreases following detonation. This implies that increased geostress reduces the shock waves escaping toward the tunnel’s free surface, concentrating it instead on the formation of the damage zone proximal to the detonation site.
A comparison of damage cloud diagrams following detonation at a tunnel depth of 20 m under different geostress, as shown in Figure 15, reveals that as the depth of the explosives increases, the degree of fragmentation in the damage zones formed after detonation under different geostress follows a similar pattern. At 0 MPa, no main crack is observed following detonation; the cracks generated by the explosion propagate radially. However, as the stress increases—for instance, at 10 MPa and 20 MPa—whilst the cracks continue to propagate radially, the main cracks also expand distinctly in both horizontal and vertical directions; Furthermore, a comparison of the damage severity at the tunnel entrance and its surroundings across the three models reveals that, similar to the damage development patterns observed at a depth of 15 m, the damage severity at the tunnel entrance gradually decreases with increasing geostress. This indicates that higher geostress reduces the shock waves escaping towards the free face of the tunnel following detonation, thereby resulting in a smaller damage zone near the tunnel.
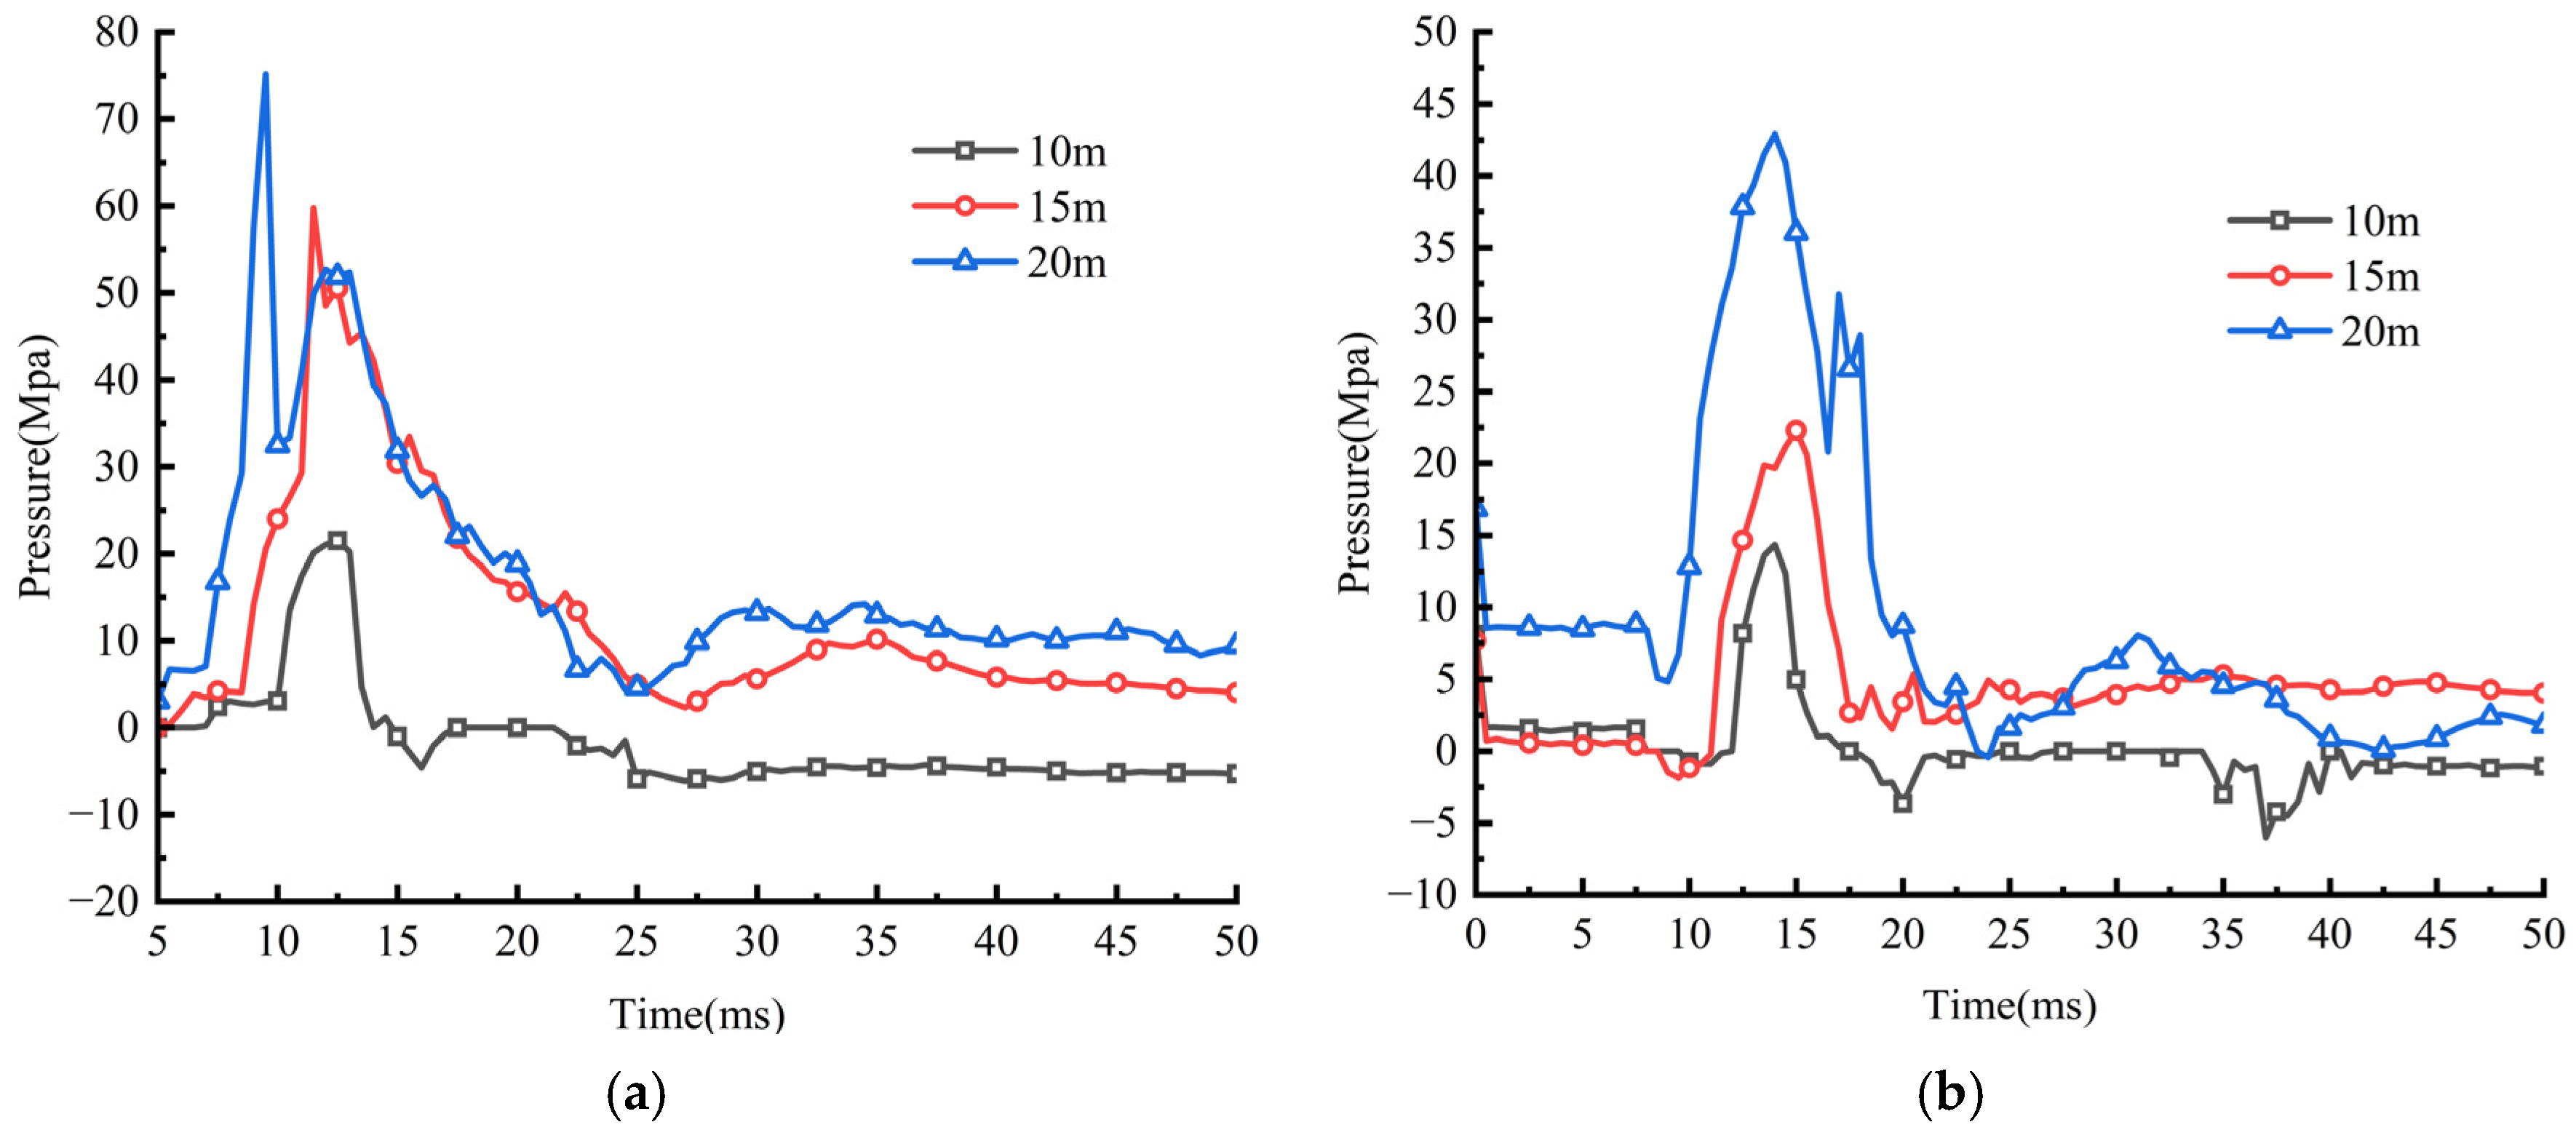
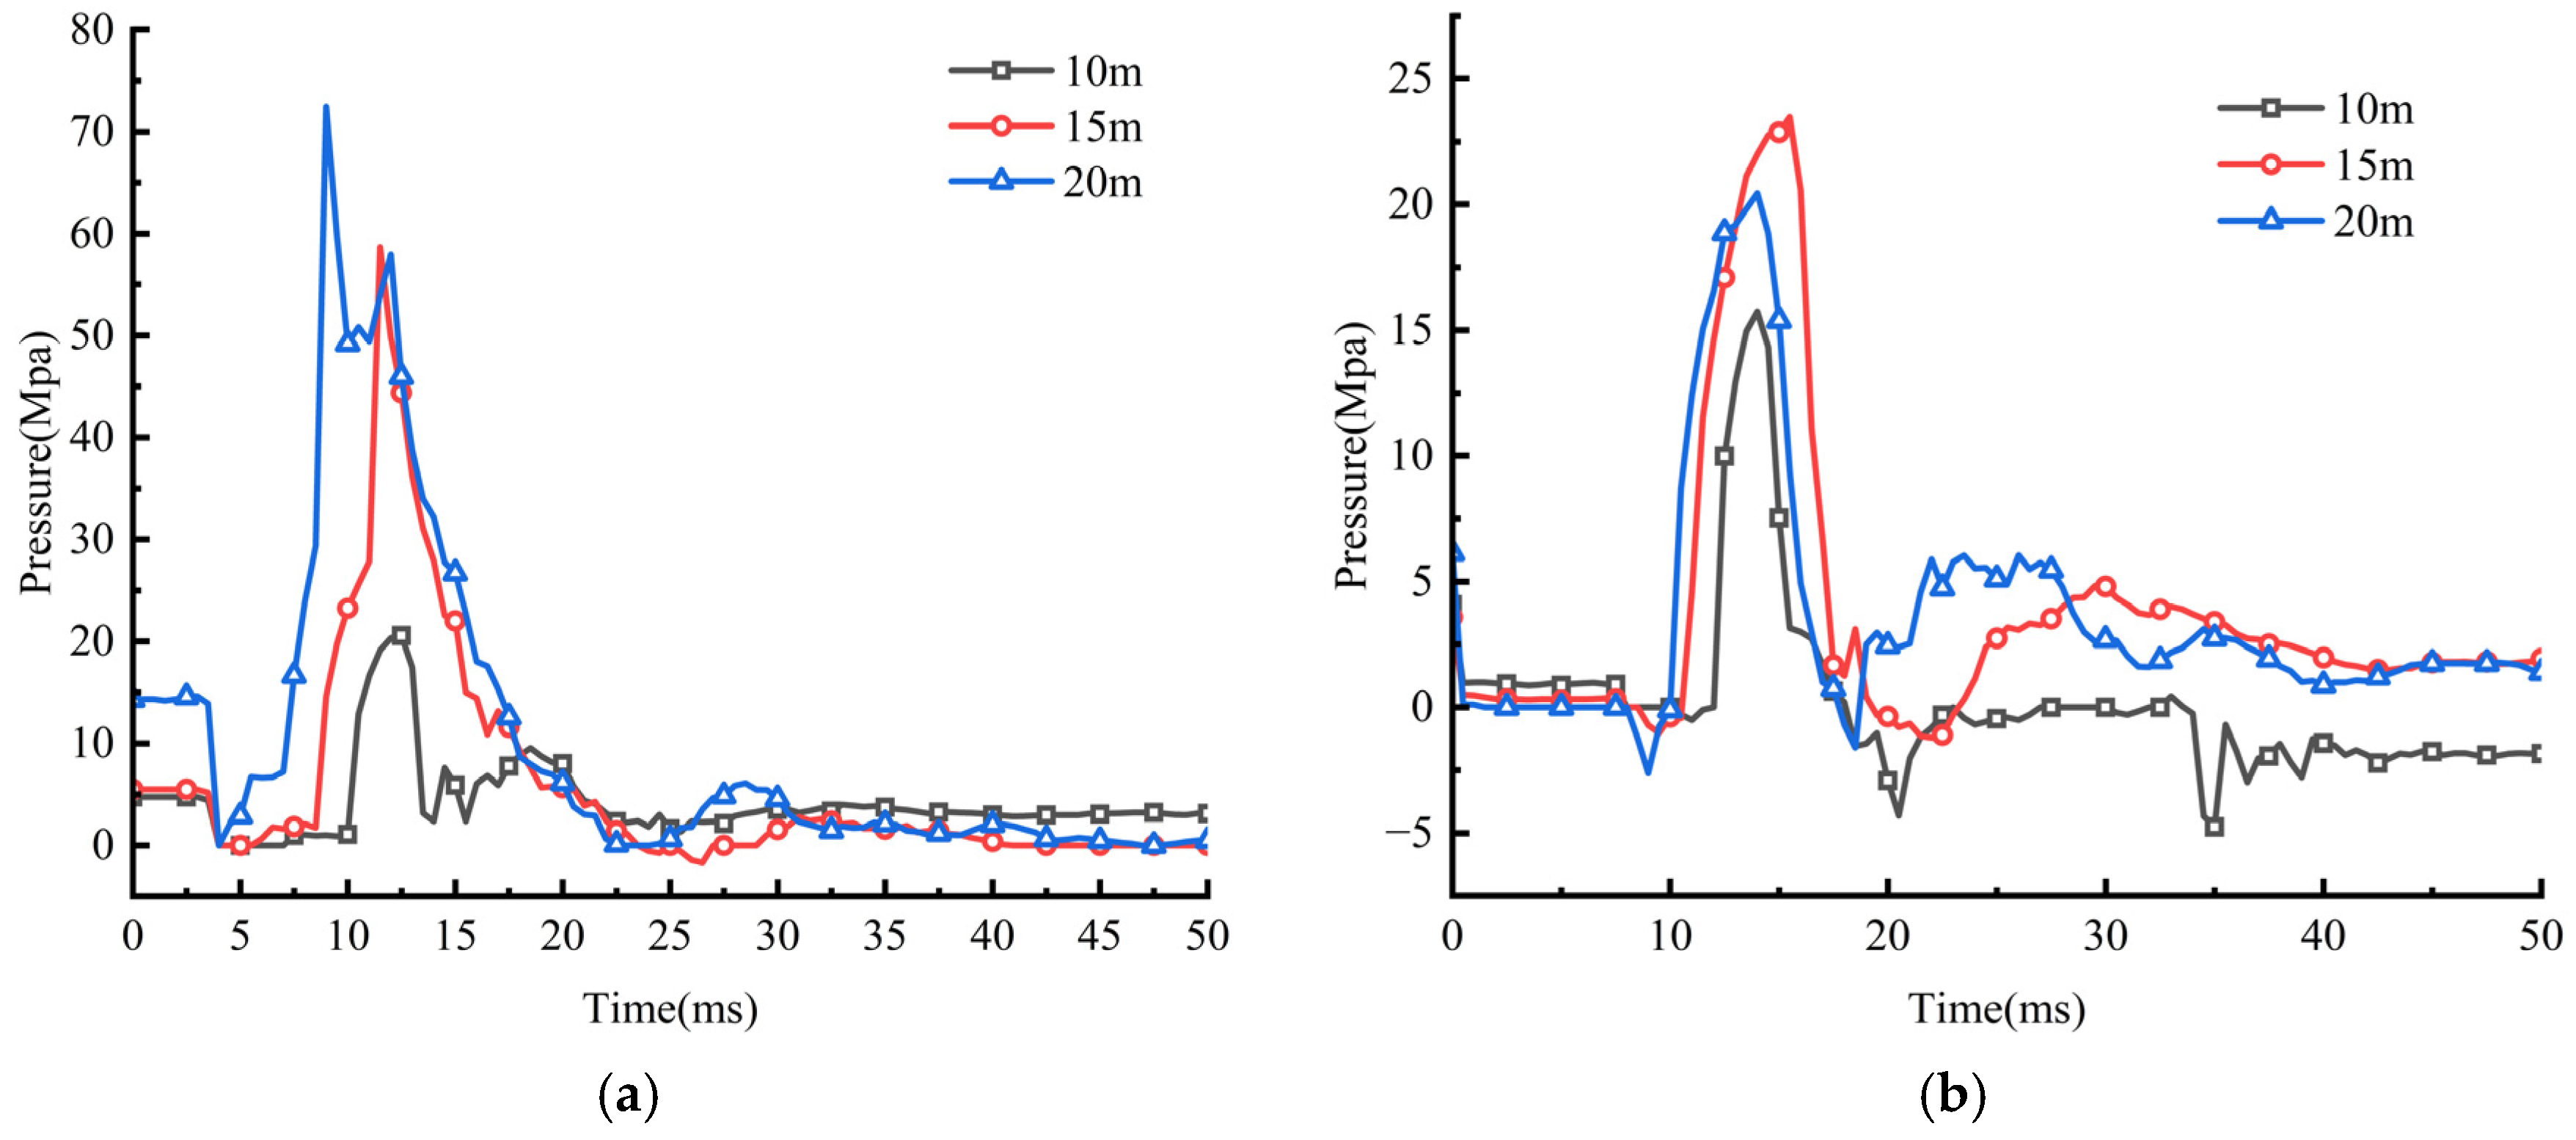
Figure 16 presents the pressure time–history curves recorded at two representative points located at varying depths under a confining pressure of 0 MPa. As illustrated, in the absence of geostress, an increase in the depth of the detonation point corresponds to higher pressure values at both the central and boundary characteristic points. Additionally, the time to reach the pressure peak at the central point occurs earlier with increasing depth. This phenomenon can be attributed to the reduced travel distance of the stress wave from the explosive source to the characteristic points as the tunnel depth increases, resulting in diminished shock waves dissipation during wave propagation. When comparing these results to the pressure time–history curves obtained at the same characteristic points under a confining pressure of 10 MPa shown in Figure 17, it is evident that the central point exhibits a similar trend and peak pressure under both stress conditions. This similarity suggests that the damage zones generated under the two different geostress states are largely comparable. However, the stress time–history curves at the boundary characteristic point demonstrate distinct variations. Specifically, following detonation at a depth of 20 m under 10 MPa, the peak stress at the boundary point is markedly reduced, and the propagation of stress in the 45° direction is notably inhibited.
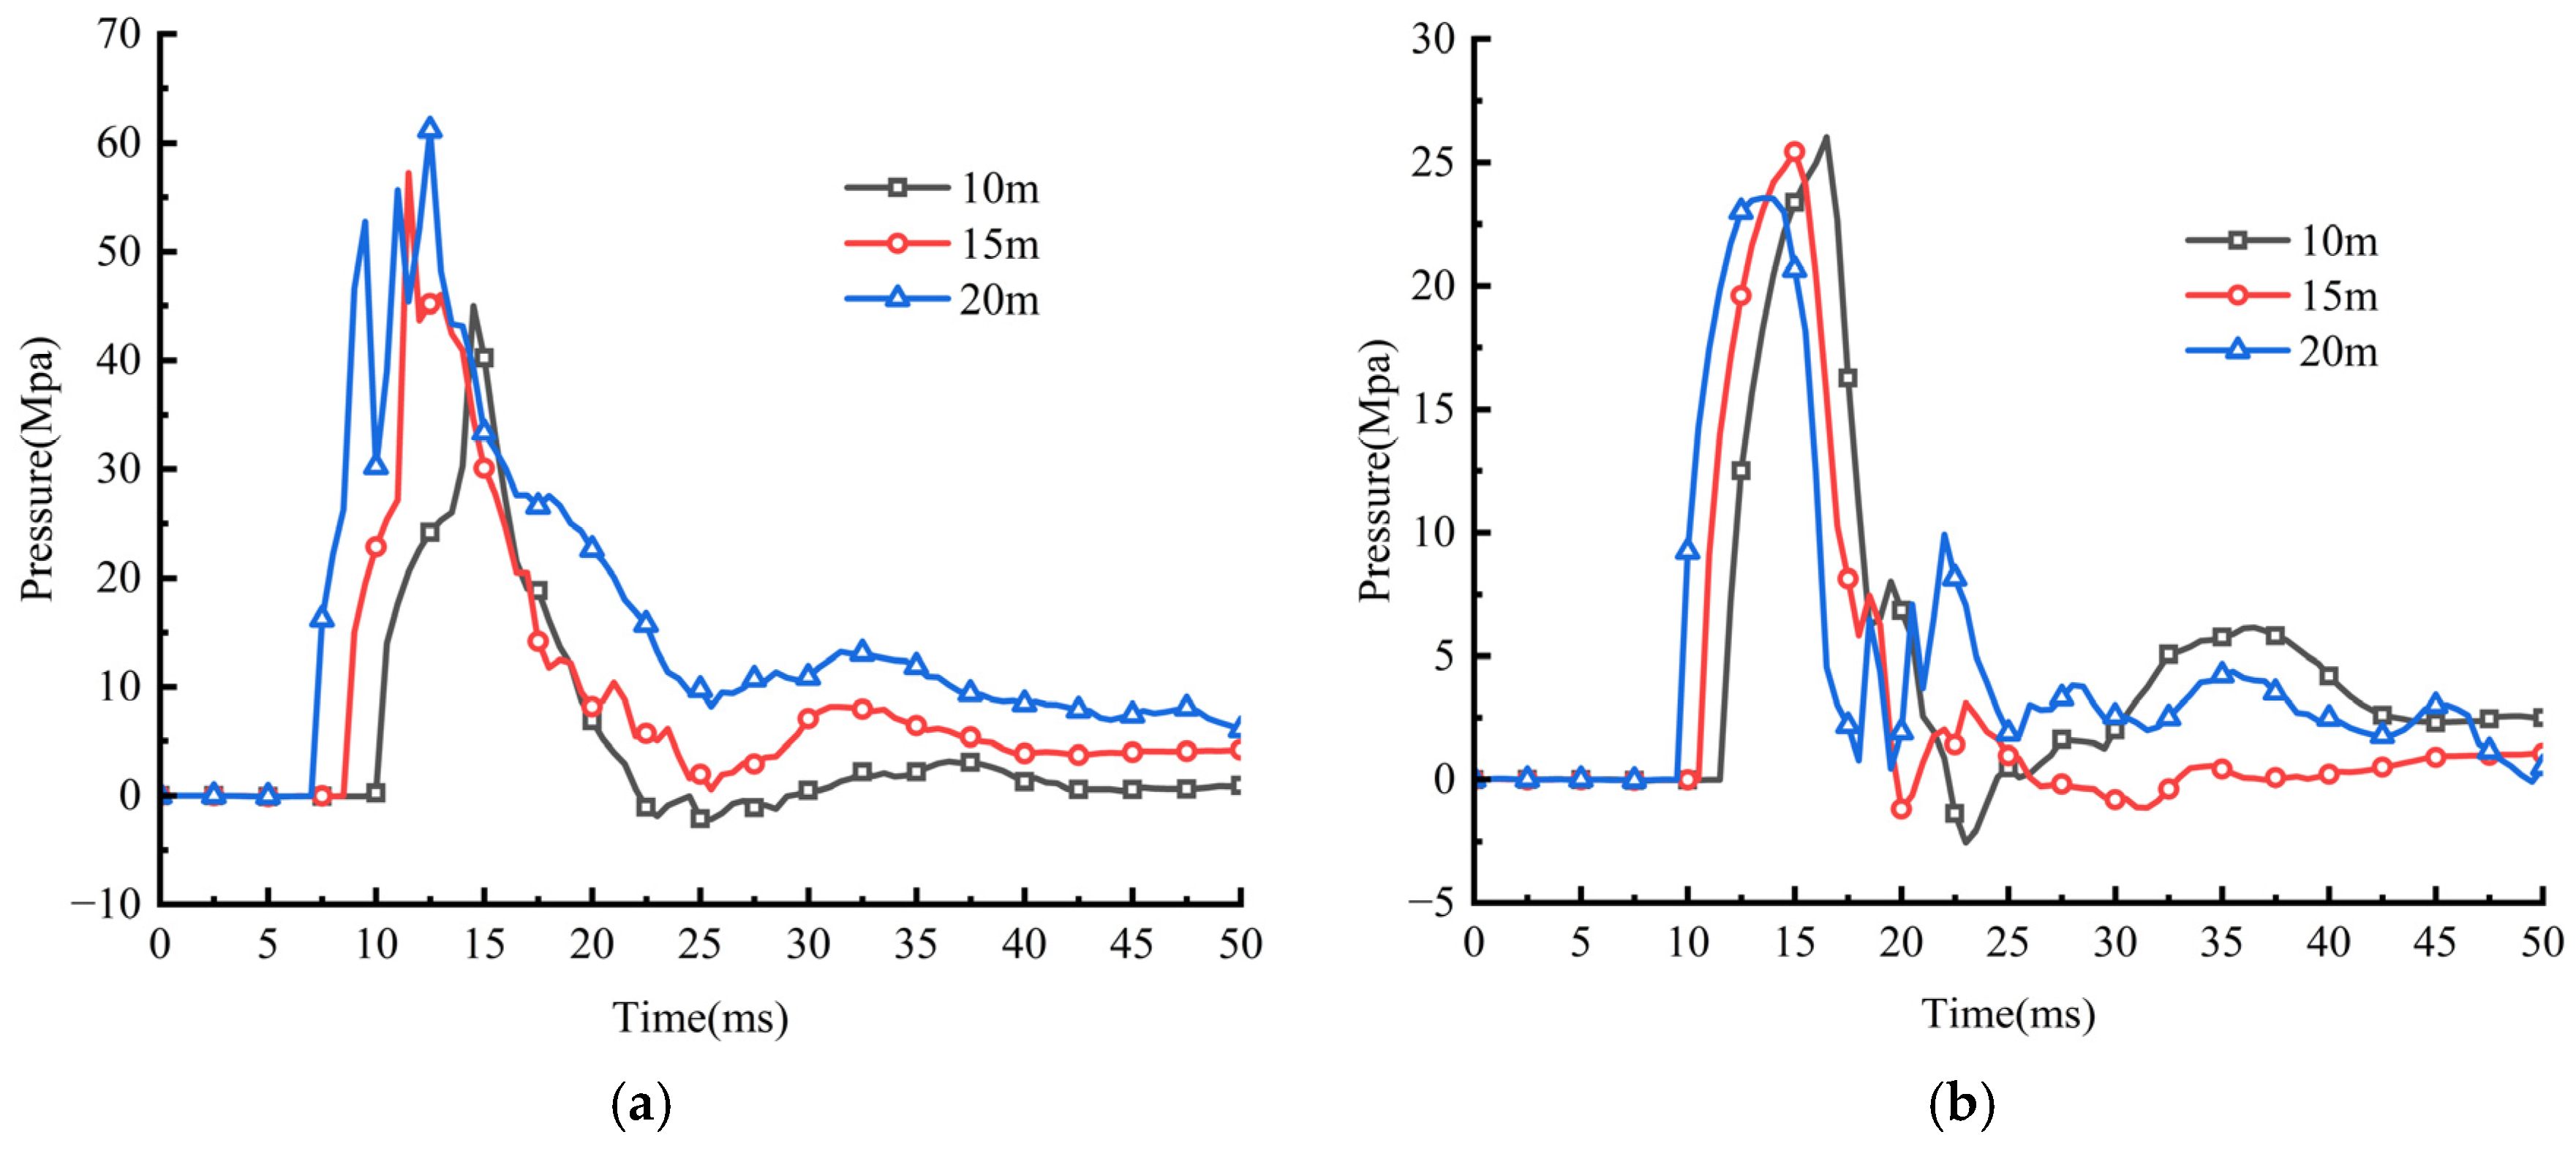
Figure 18 presents the pressure profiles at characteristic points located at various depths under a geostress of 20 MPa. When these profiles are compared with those obtained under geostresses of 0 MPa and 10 MPa, it becomes apparent that an increase in geostress corresponds to elevated peak pressure values at both the central and boundary characteristic points at a depth of 10 m post-detonation. This observation suggests that a geostress of 20 MPa amplifies the intensity of stress wave propagation toward these characteristic points following detonation. Furthermore, the damage cloud diagram illustrates a marked increase in the extent of damage at the 10 m tunnel depth under 20 MPa geostress, indicating that such stress conditions significantly enhance the explosive damage effects on shallow-buried tunnels.
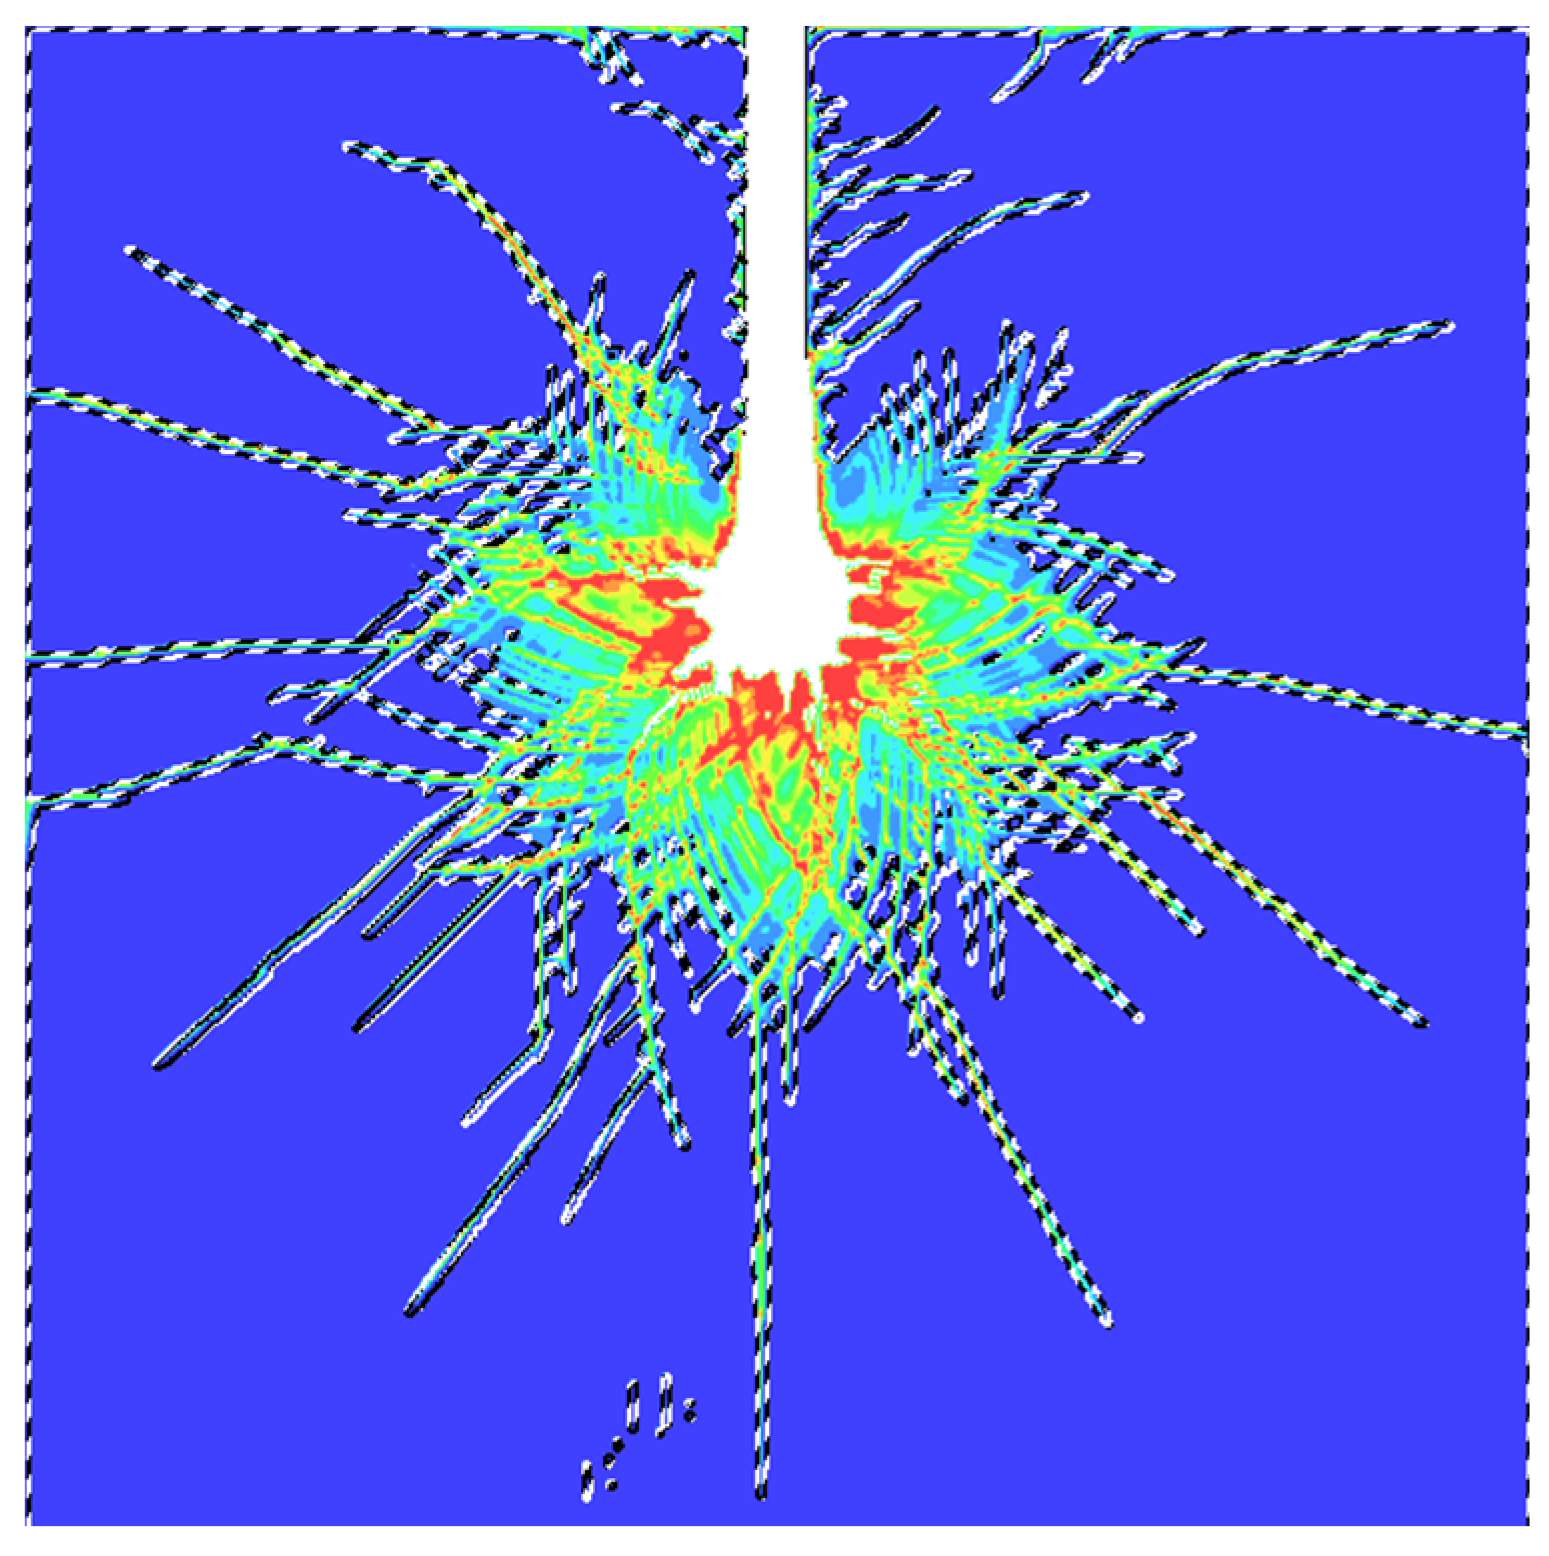
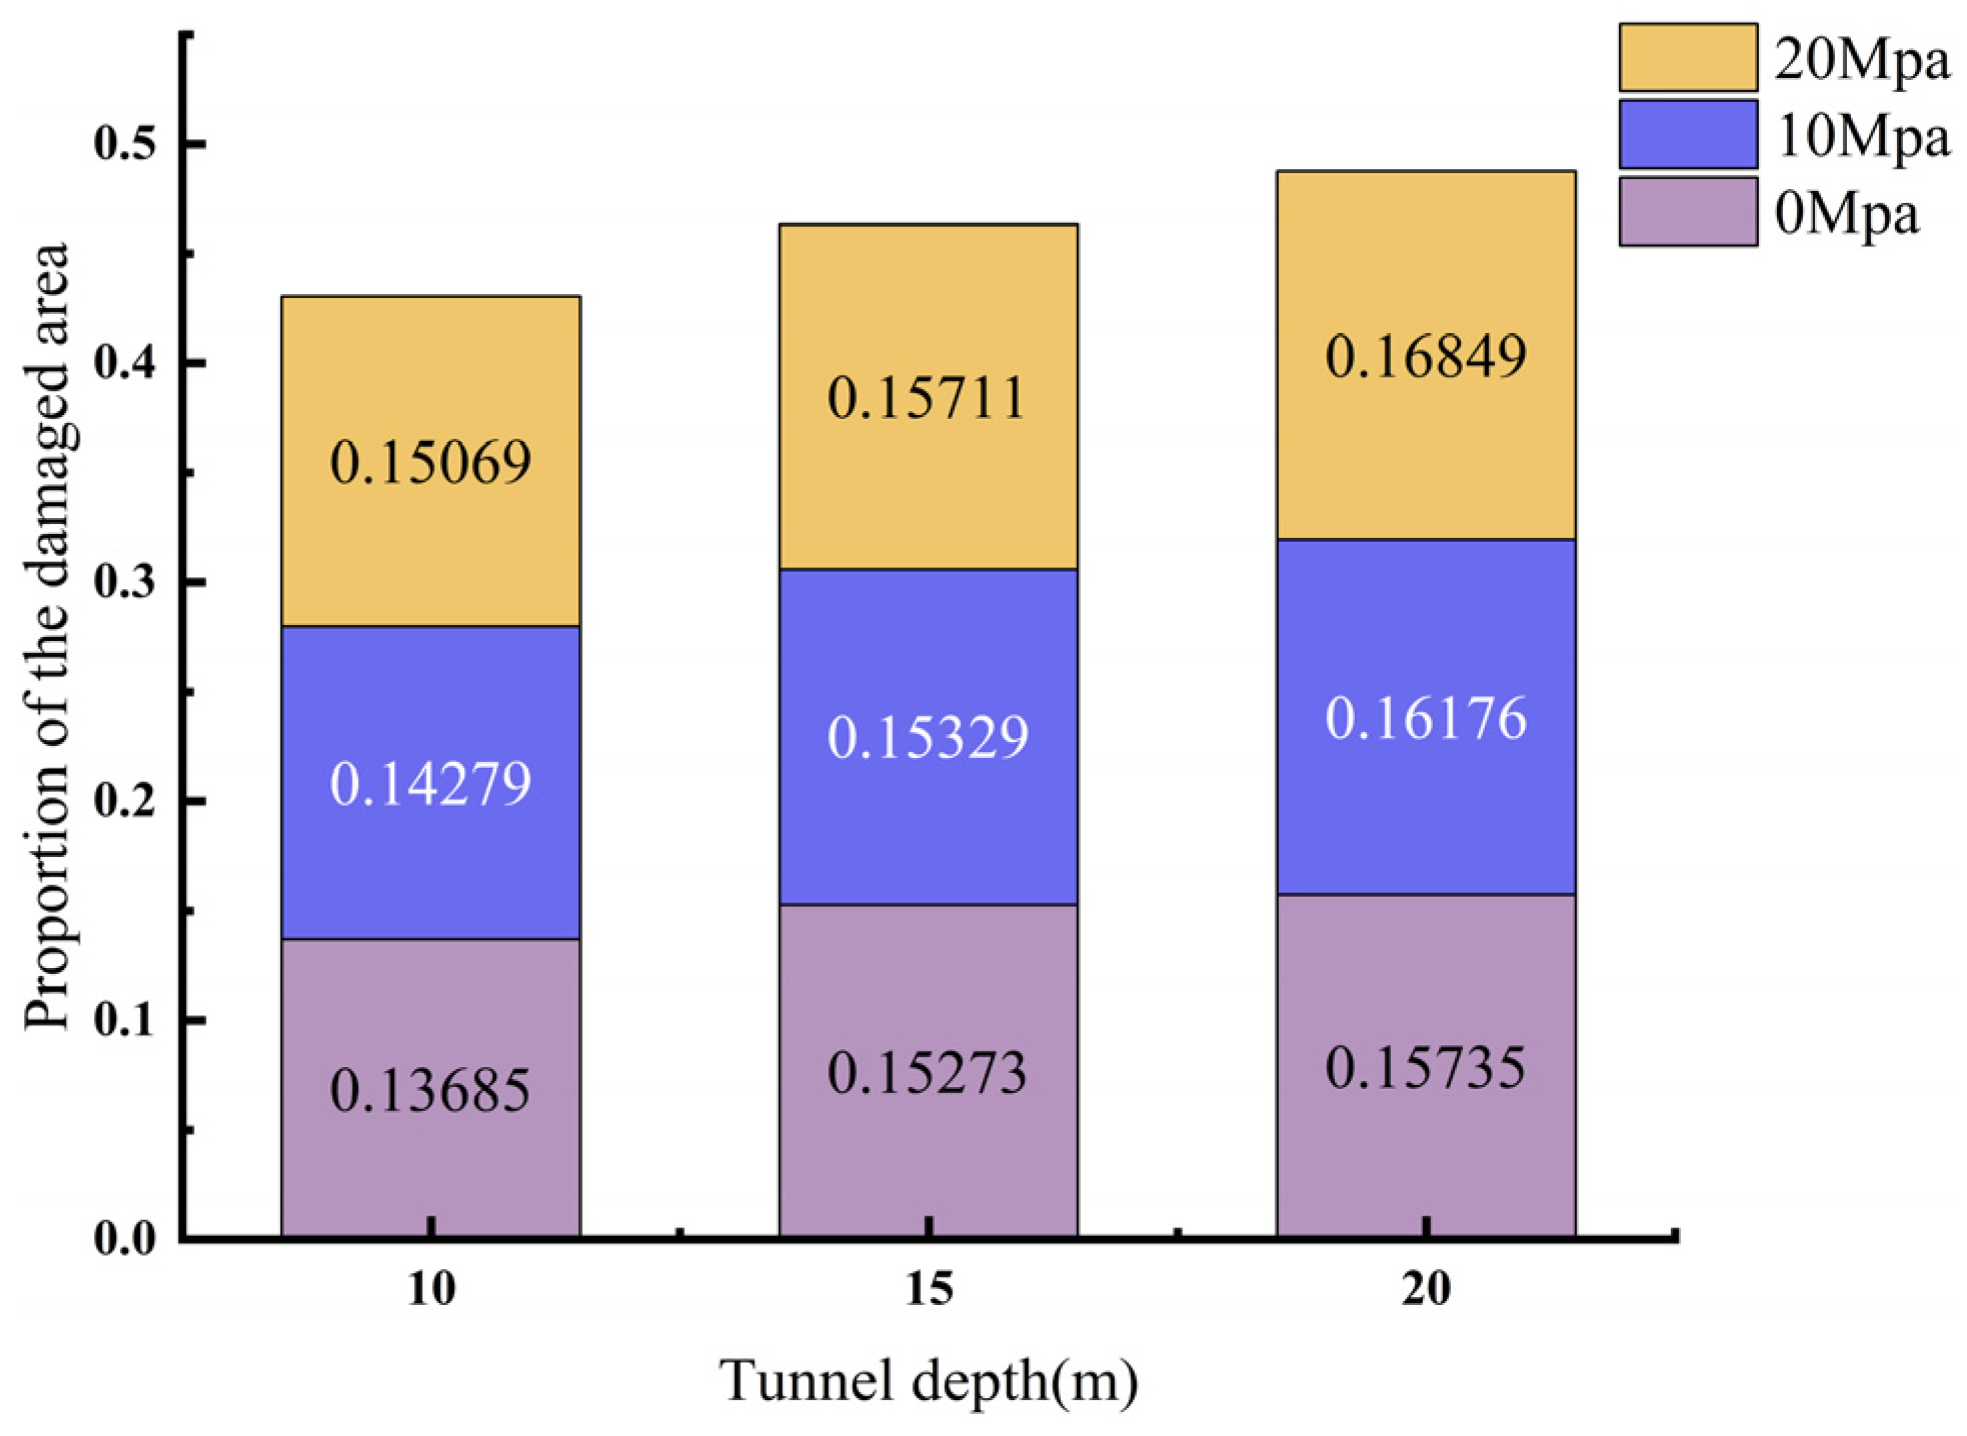
To achieve a more intuitive understanding of the damage extent induced by blasting in tunnels at varying depths and under different geostress intensities, damage factors of differing magnitudes were derived through pixel sampling from the damage cloud map as shown in Figure 19, thereby enabling quantification of damage across distinct operational conditions. The accompanying Figure 20 depicts the proportion of the damaged area corresponding to these varying conditions. The results demonstrate that as both geostress and tunnel depth increase, the proportion of the damaged area correspondingly rises, suggesting that elevated geostress and greater tunnel depth at the moment of detonation exacerbate the damage inflicted by stress waves on the model. This conclusion aligns with the findings presented in the theoretical framework outlined in Section 2.1.

3.3. Study of Explosion Effects from Different Angles

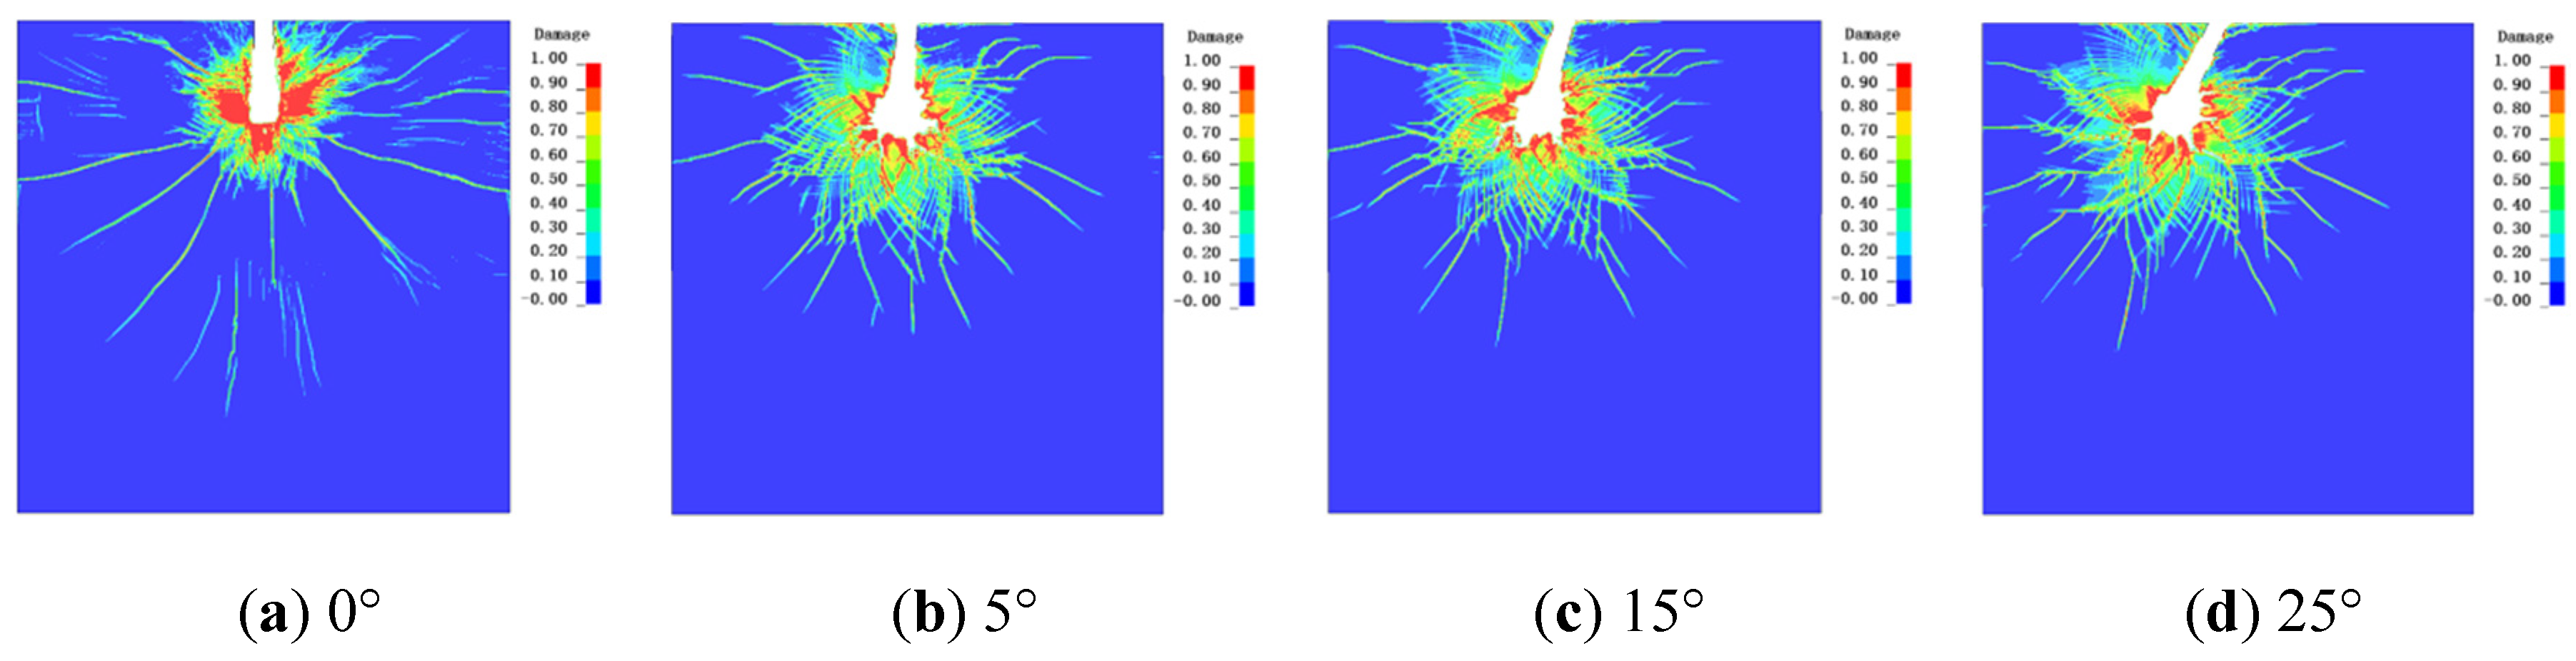
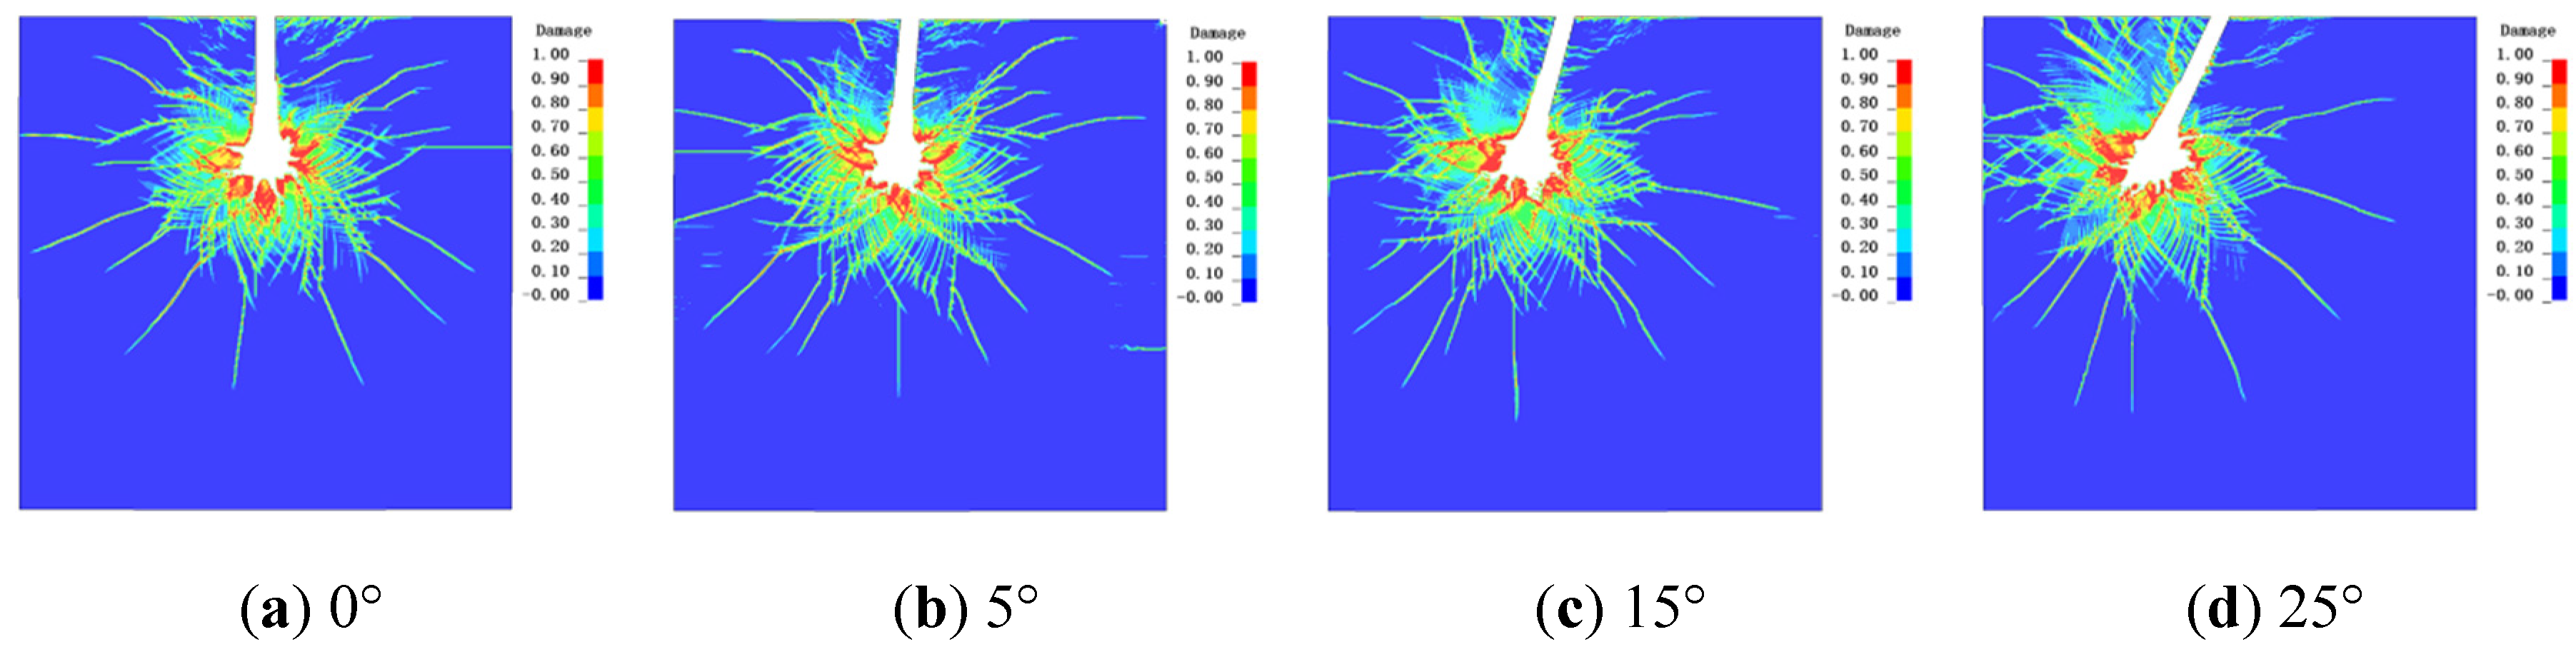
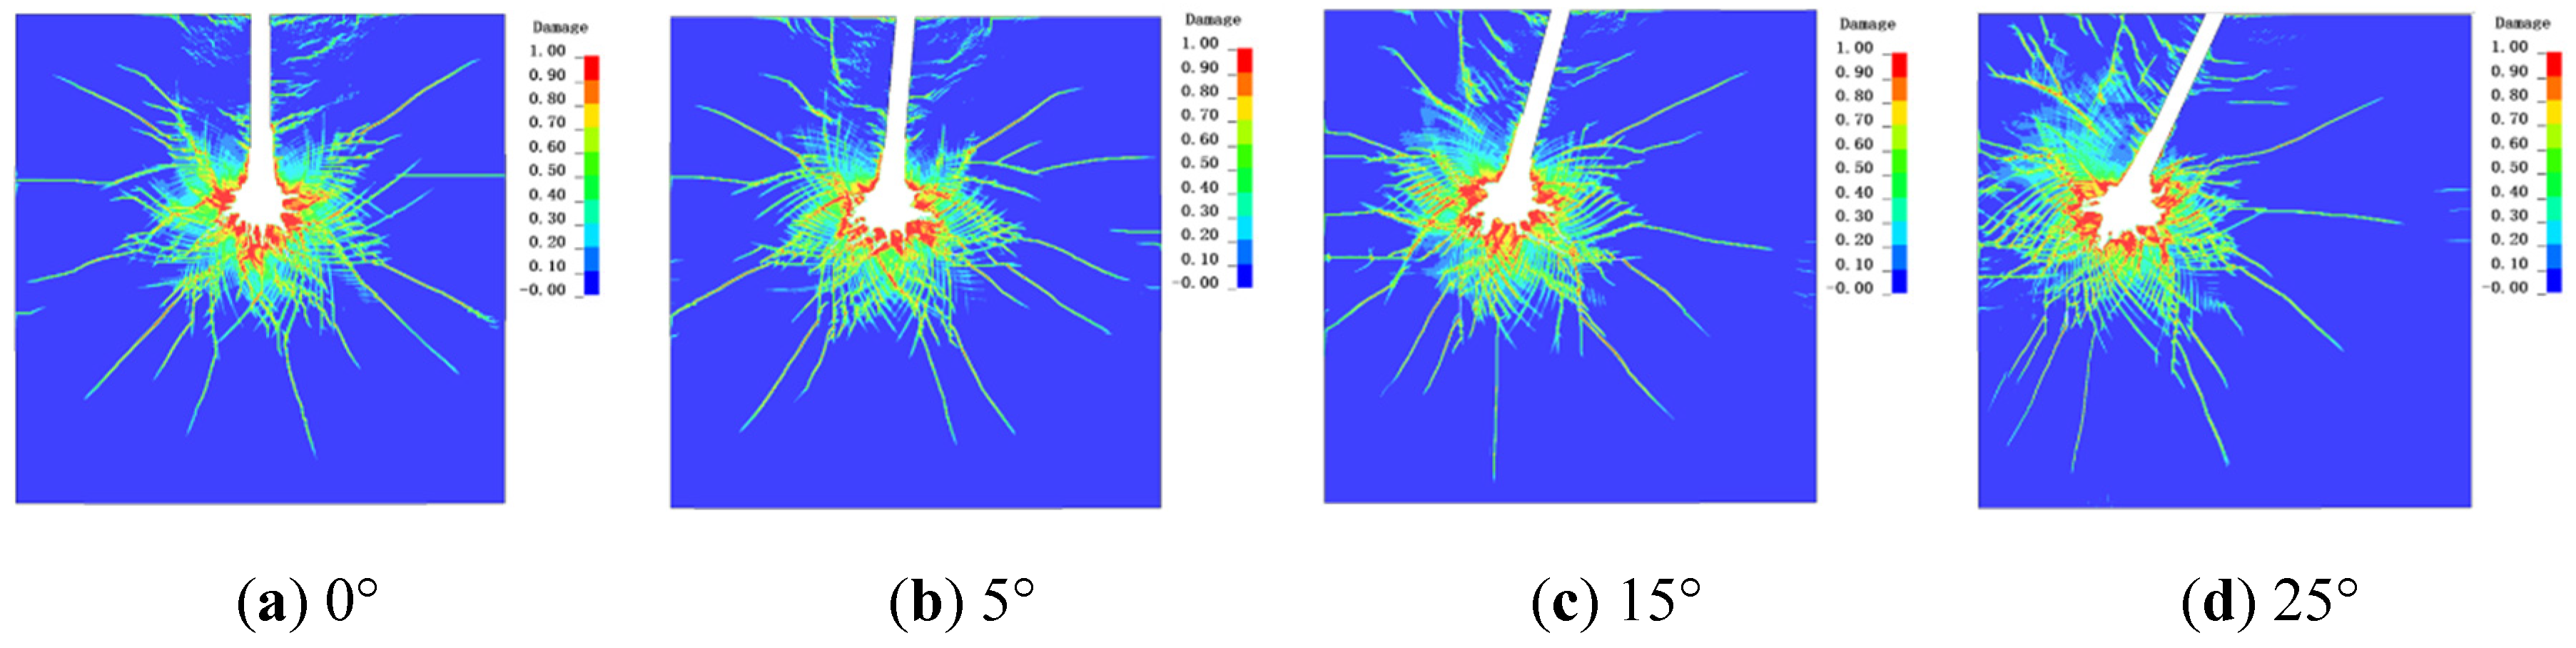
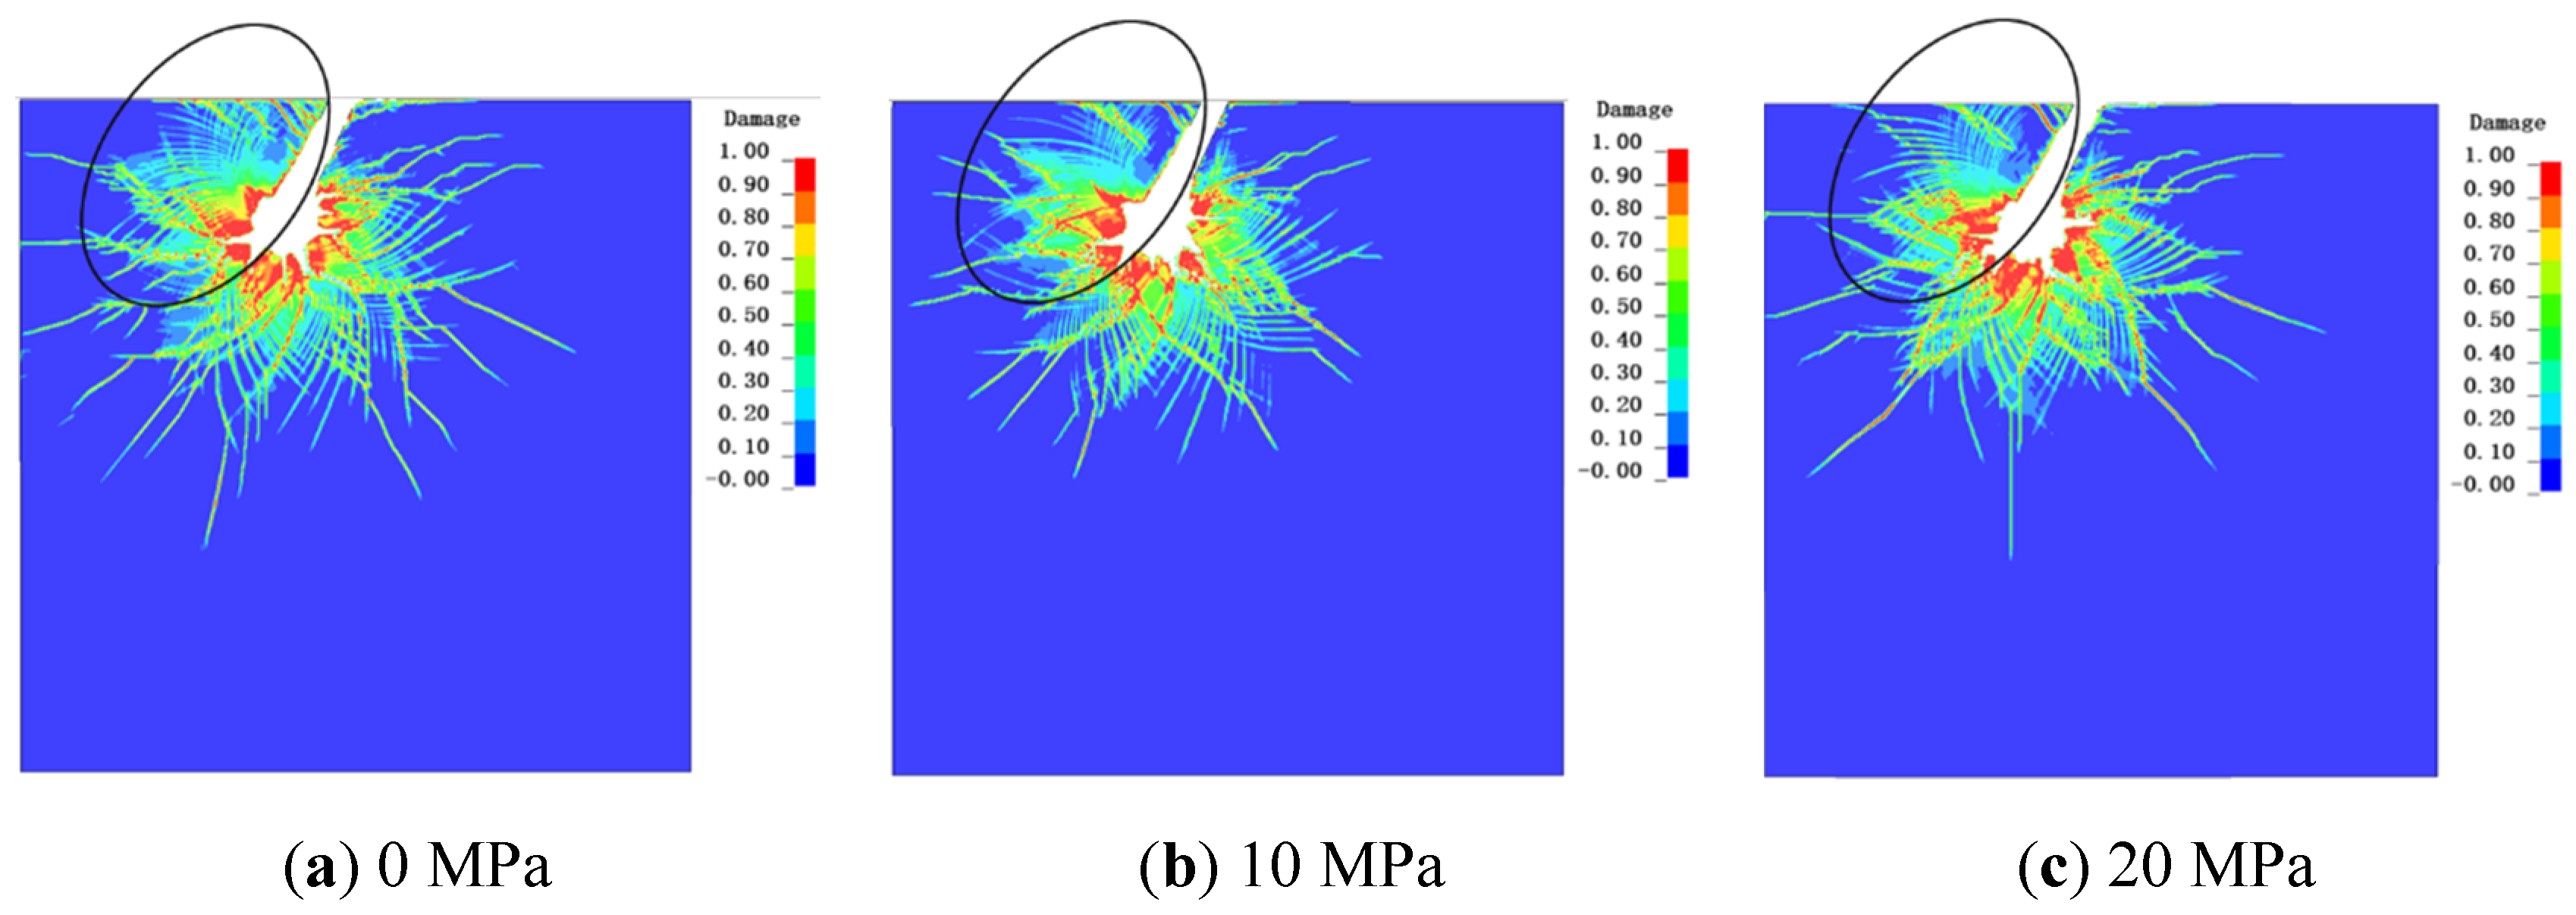
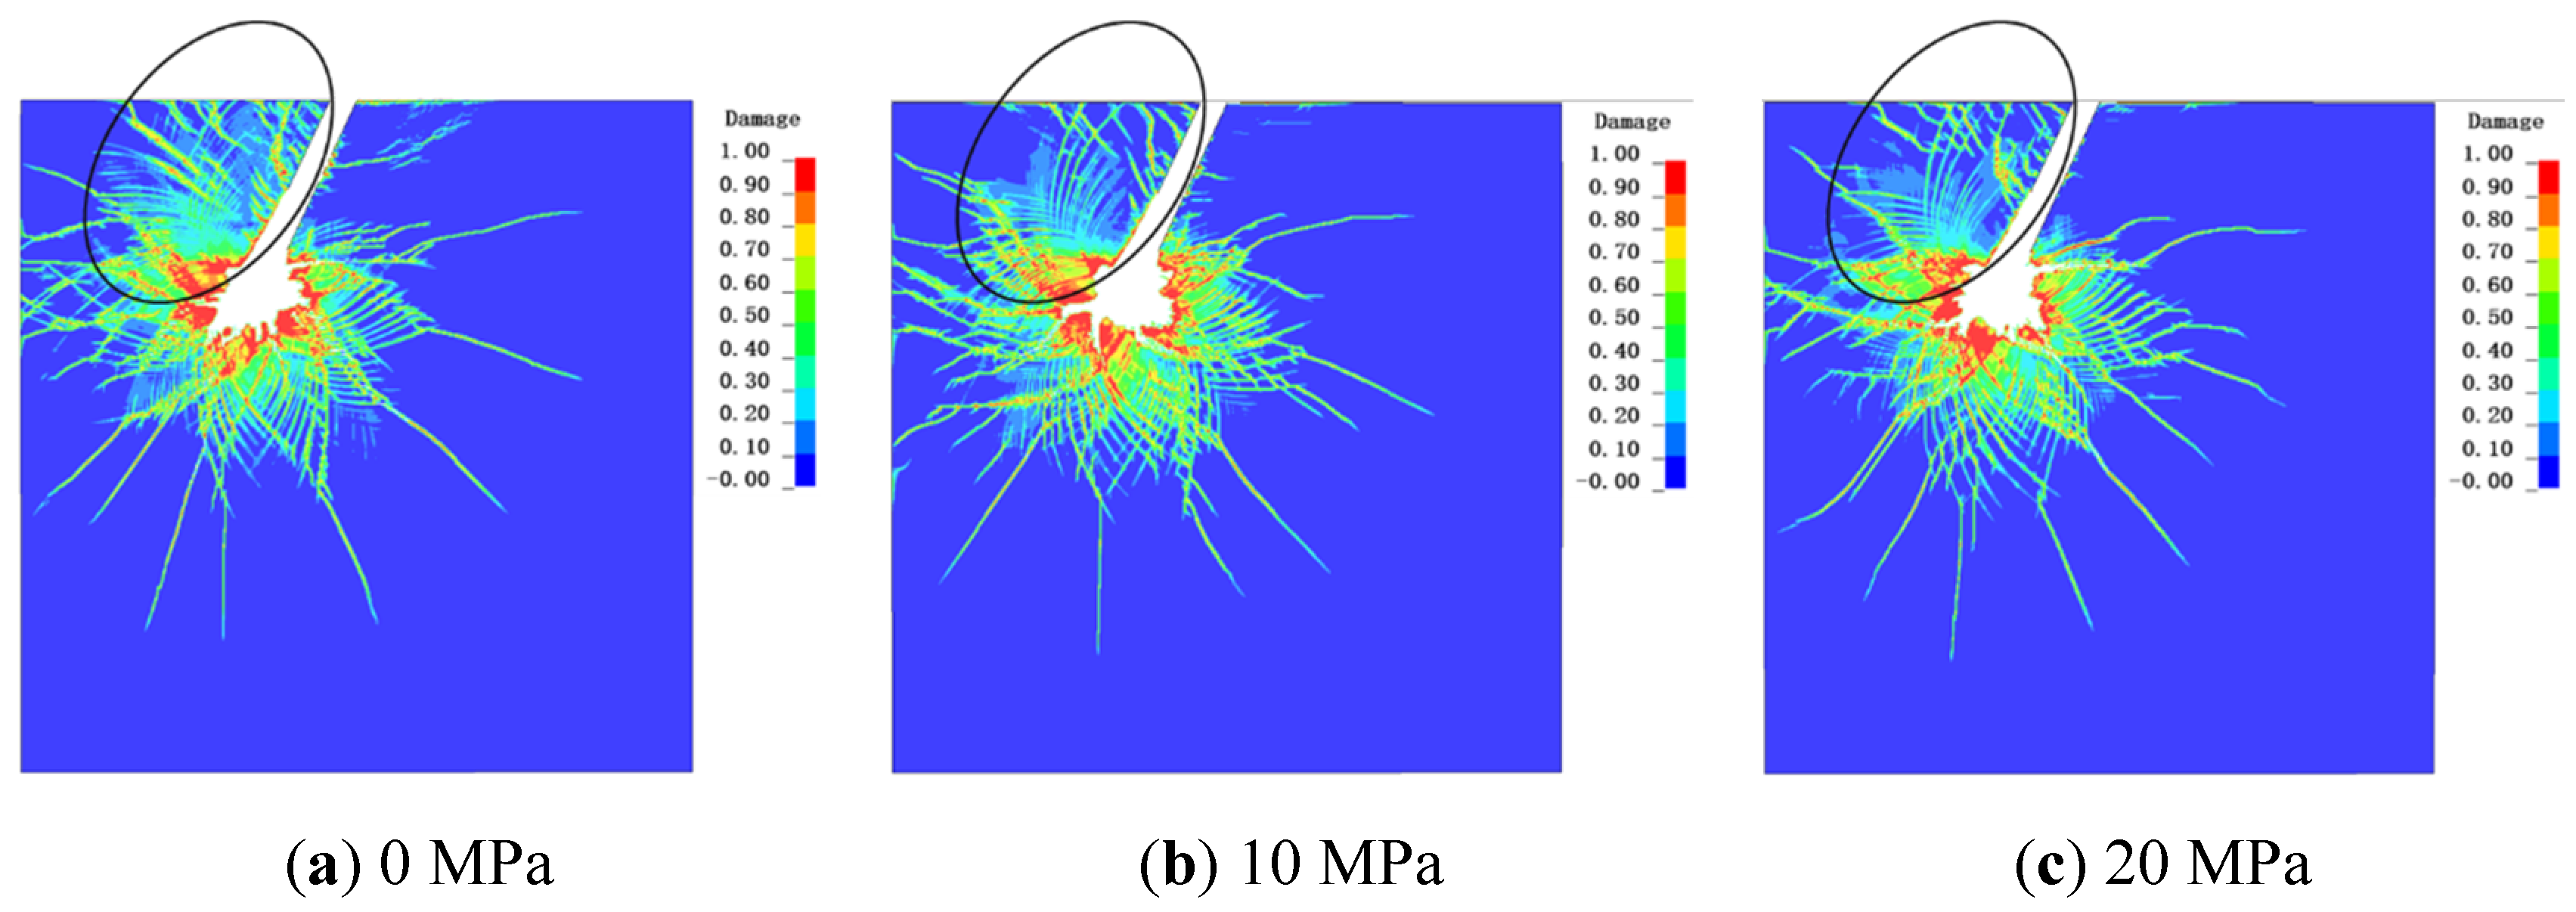
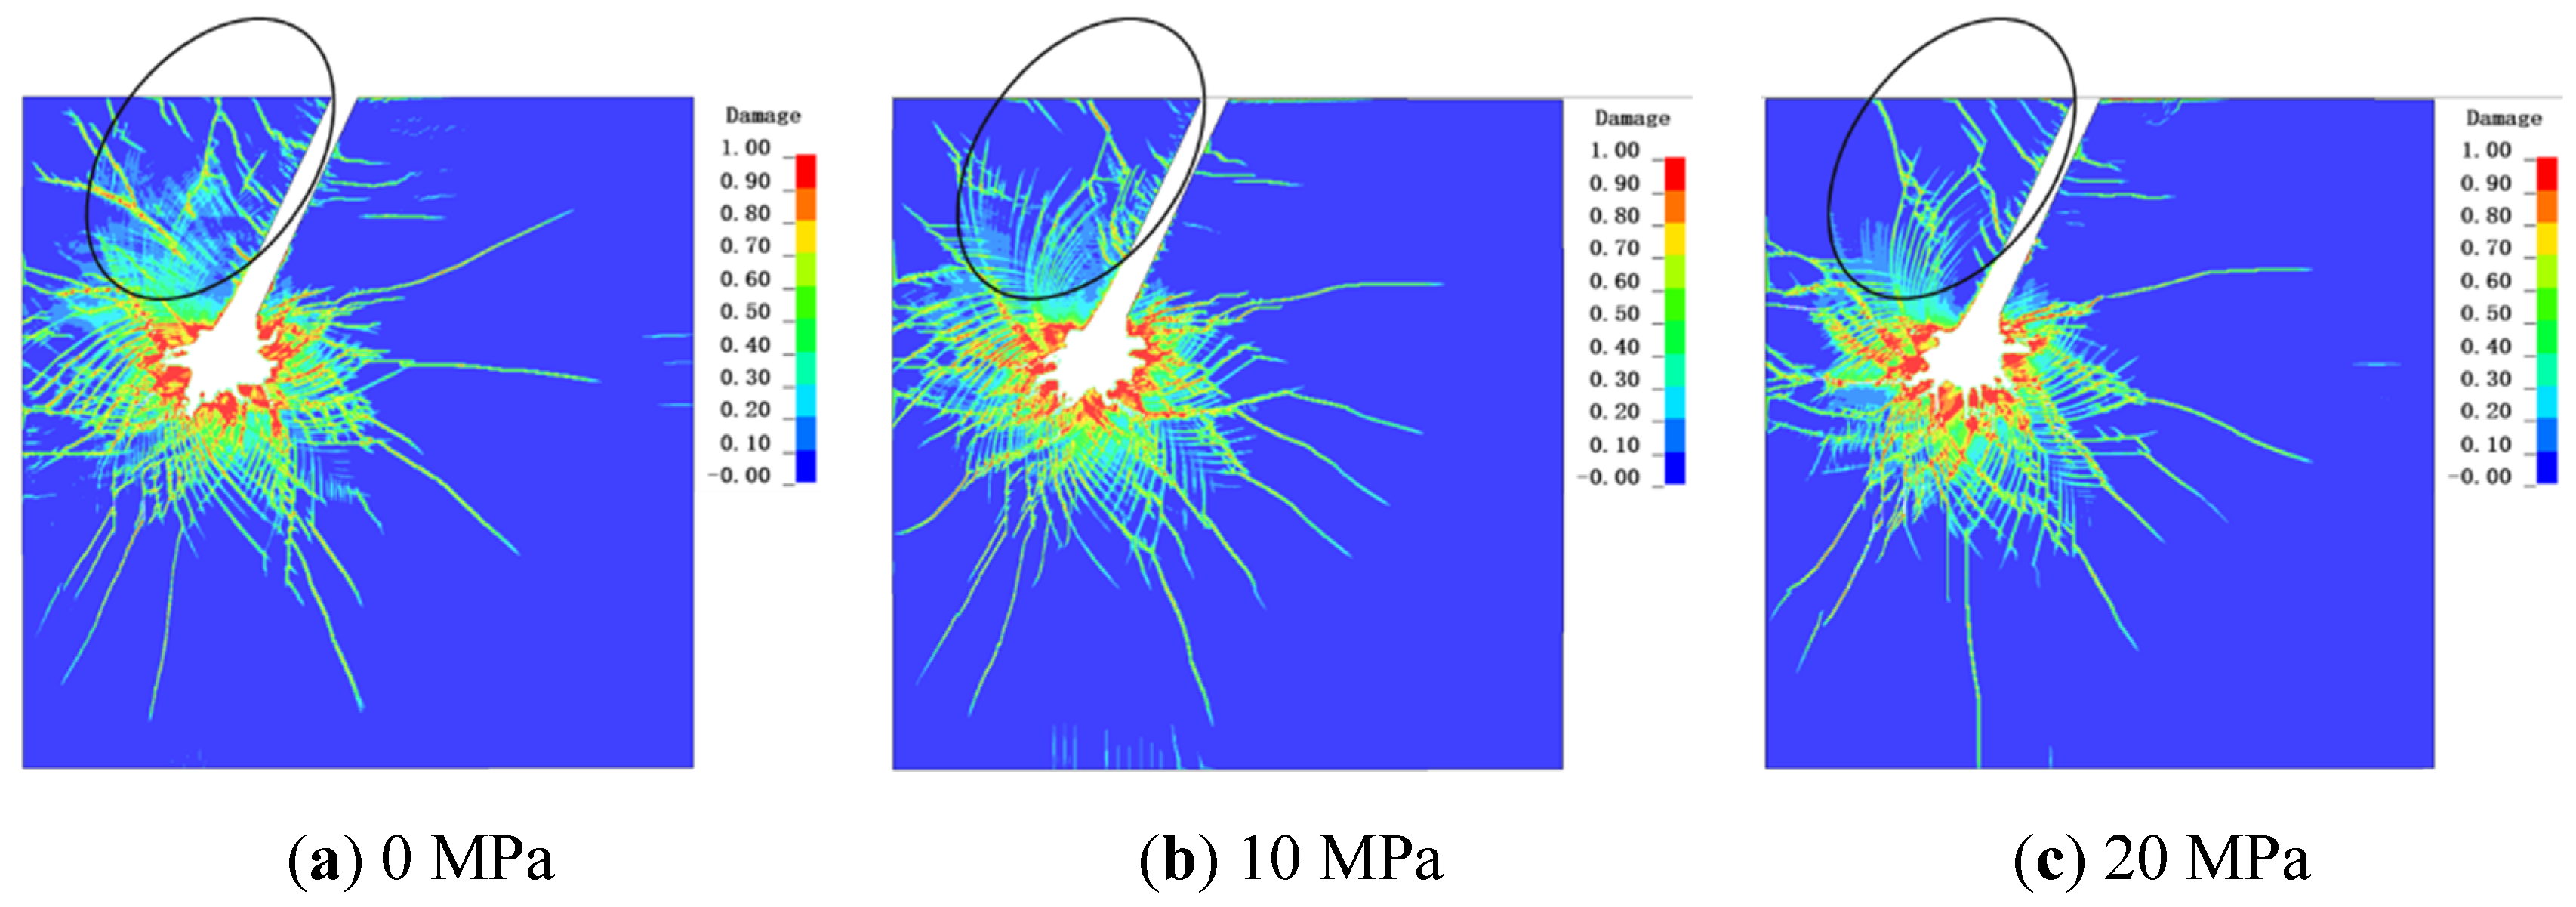
The damage cloud diagrams presented in Figure 21, Figure 22 and Figure 23 illustrate the distinct developmental patterns of the damage zone under explosive loading at varying angles of incidence. These variations primarily arise from differences in the evolution of the fragmentation and crack zones. At an incidence angle of 0°, both the fragmentation and crack zones within the damage model exhibit a predominantly symmetrical distribution along the axial direction. Similarly, at a 5° angle, the damage zone maintains a symmetrical development aligned with the penetration trajectory, attributable to the minimal deviation in incidence angle. However, at increased inclination angles of 15° and 25°, the altered penetration trajectory induces a stress concentration region at its base, resulting in an asymmetric distribution of fracture and crack zones proximal to the explosive charge. Post-detonation, the radially outward-propagating spherical compressive stress wave emanating from the gun port generates relatively regular damage cracks oriented away from the non-free surface. In contrast, damage zones extending toward the free surface display progressively irregular patterns. This irregularity is attributed to the substantial inclination of the gun port relative to the free surface, which causes the stress wave propagation direction to deviate from perpendicularity with the free surface, thereby inhibiting the effective focusing of reflected tensile waves. Consequently, the compressive stress wave undergoes chaotic reflections en route to the free surface, inducing irregular shear fractures within the material and resulting in a more dispersed crack distribution in this direction.
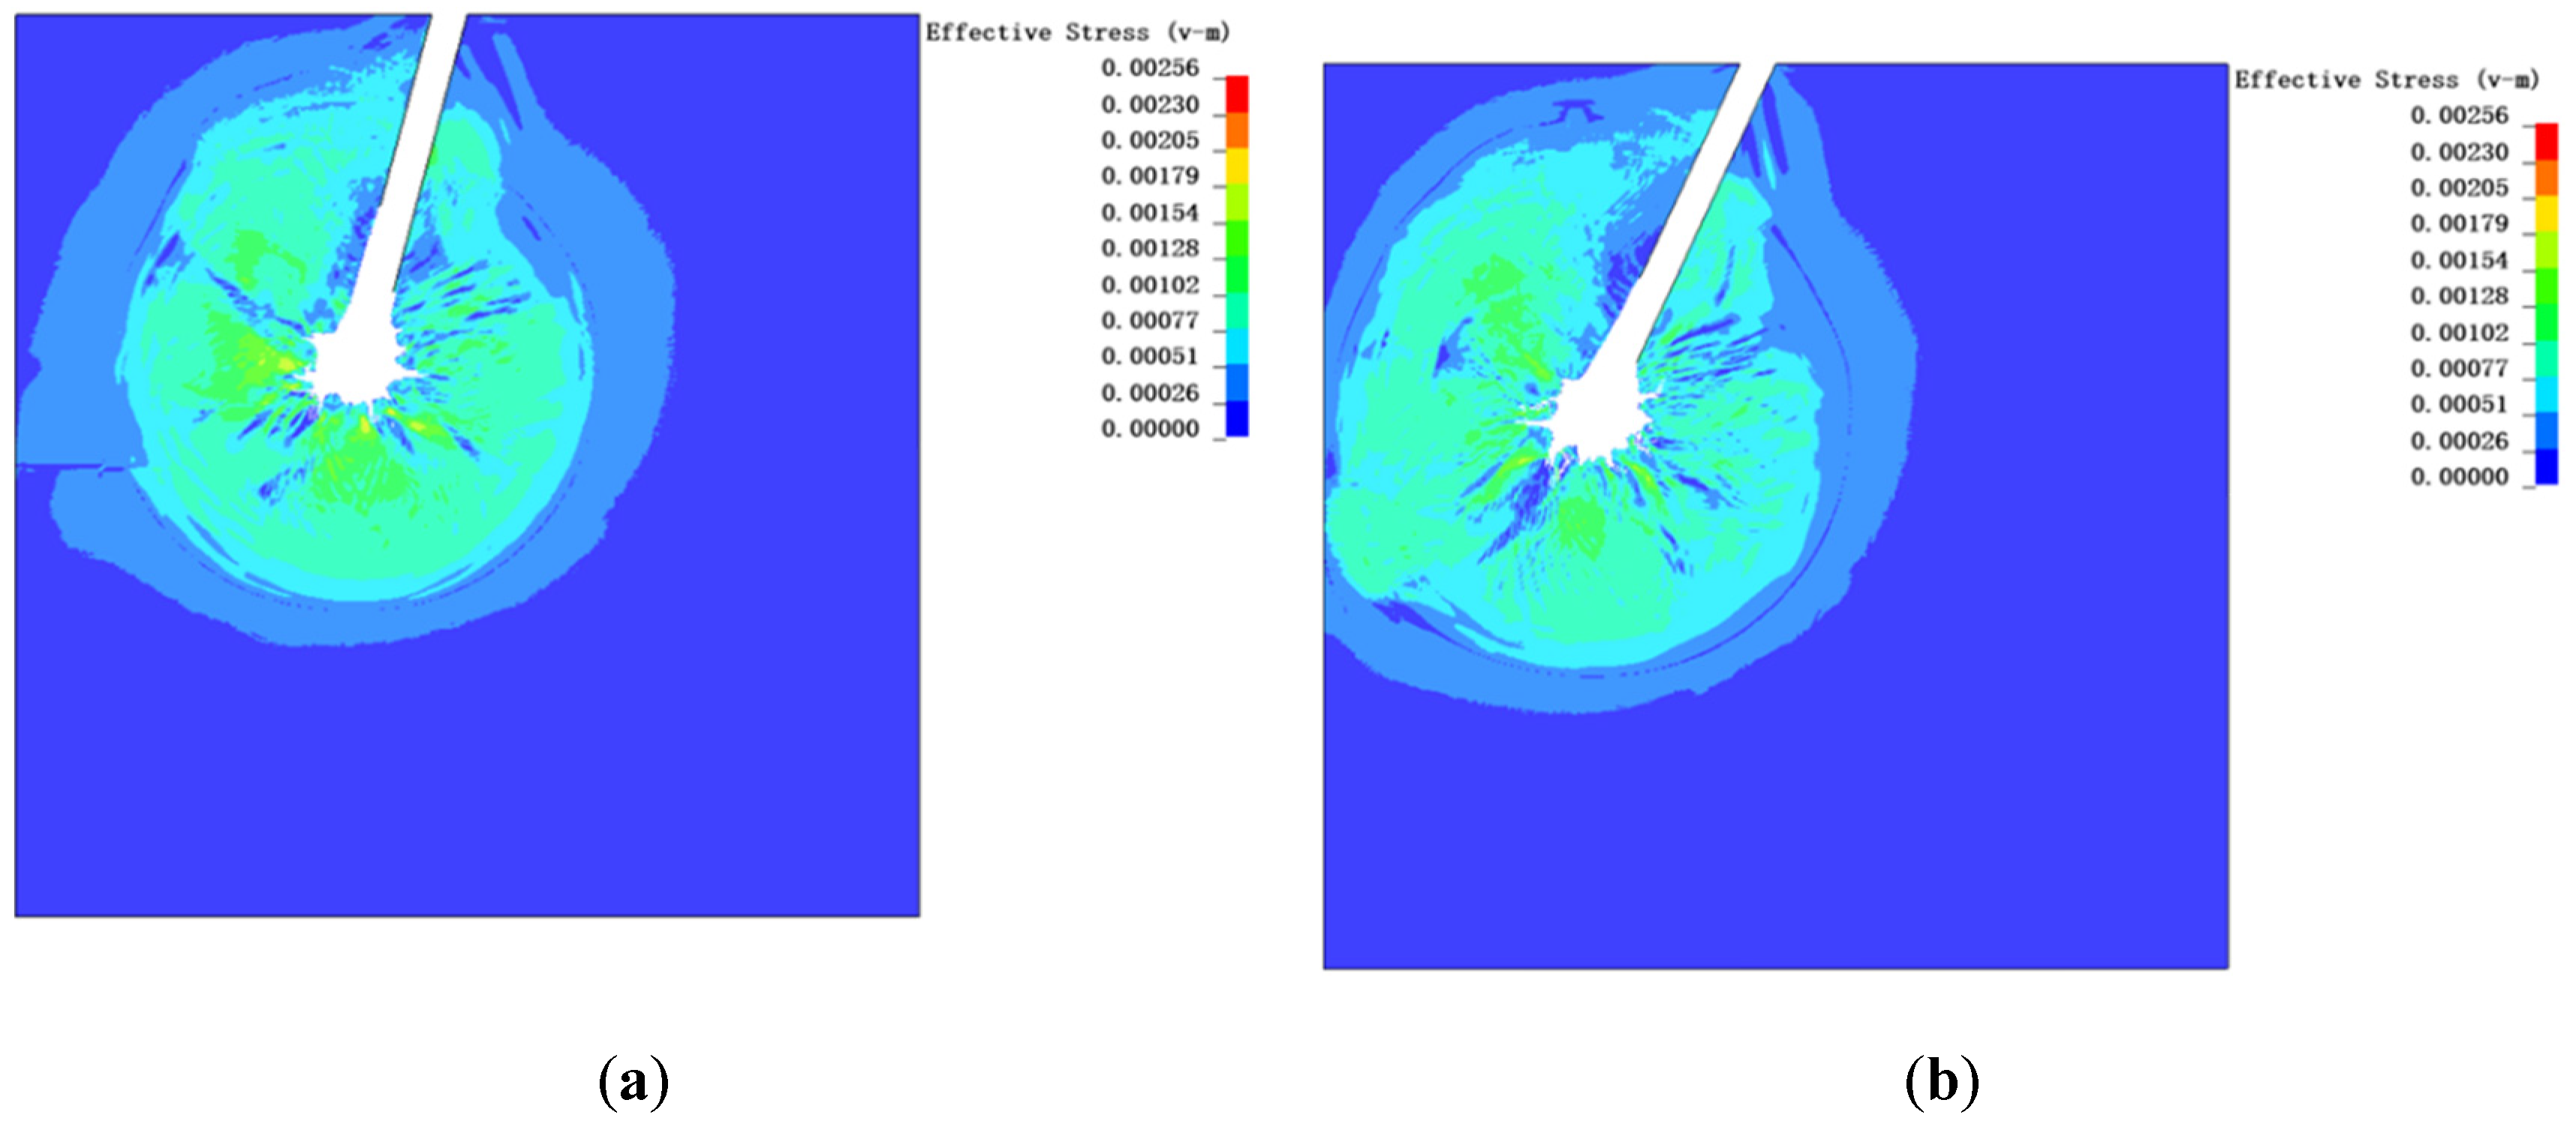
Figure 24 presents stress contour plots subsequent to the detonation of explosives positioned at inclinations of 15° and 25° within a tunnel situated 20 m below the surface. At 20 ms post-detonation, the specified inclinations induce a markedly non-uniform propagation of the stress waves generated by the explosion. This phenomenon leads to heterogeneous damage distributions both above and below the detonation locus at the tunnel’s base.
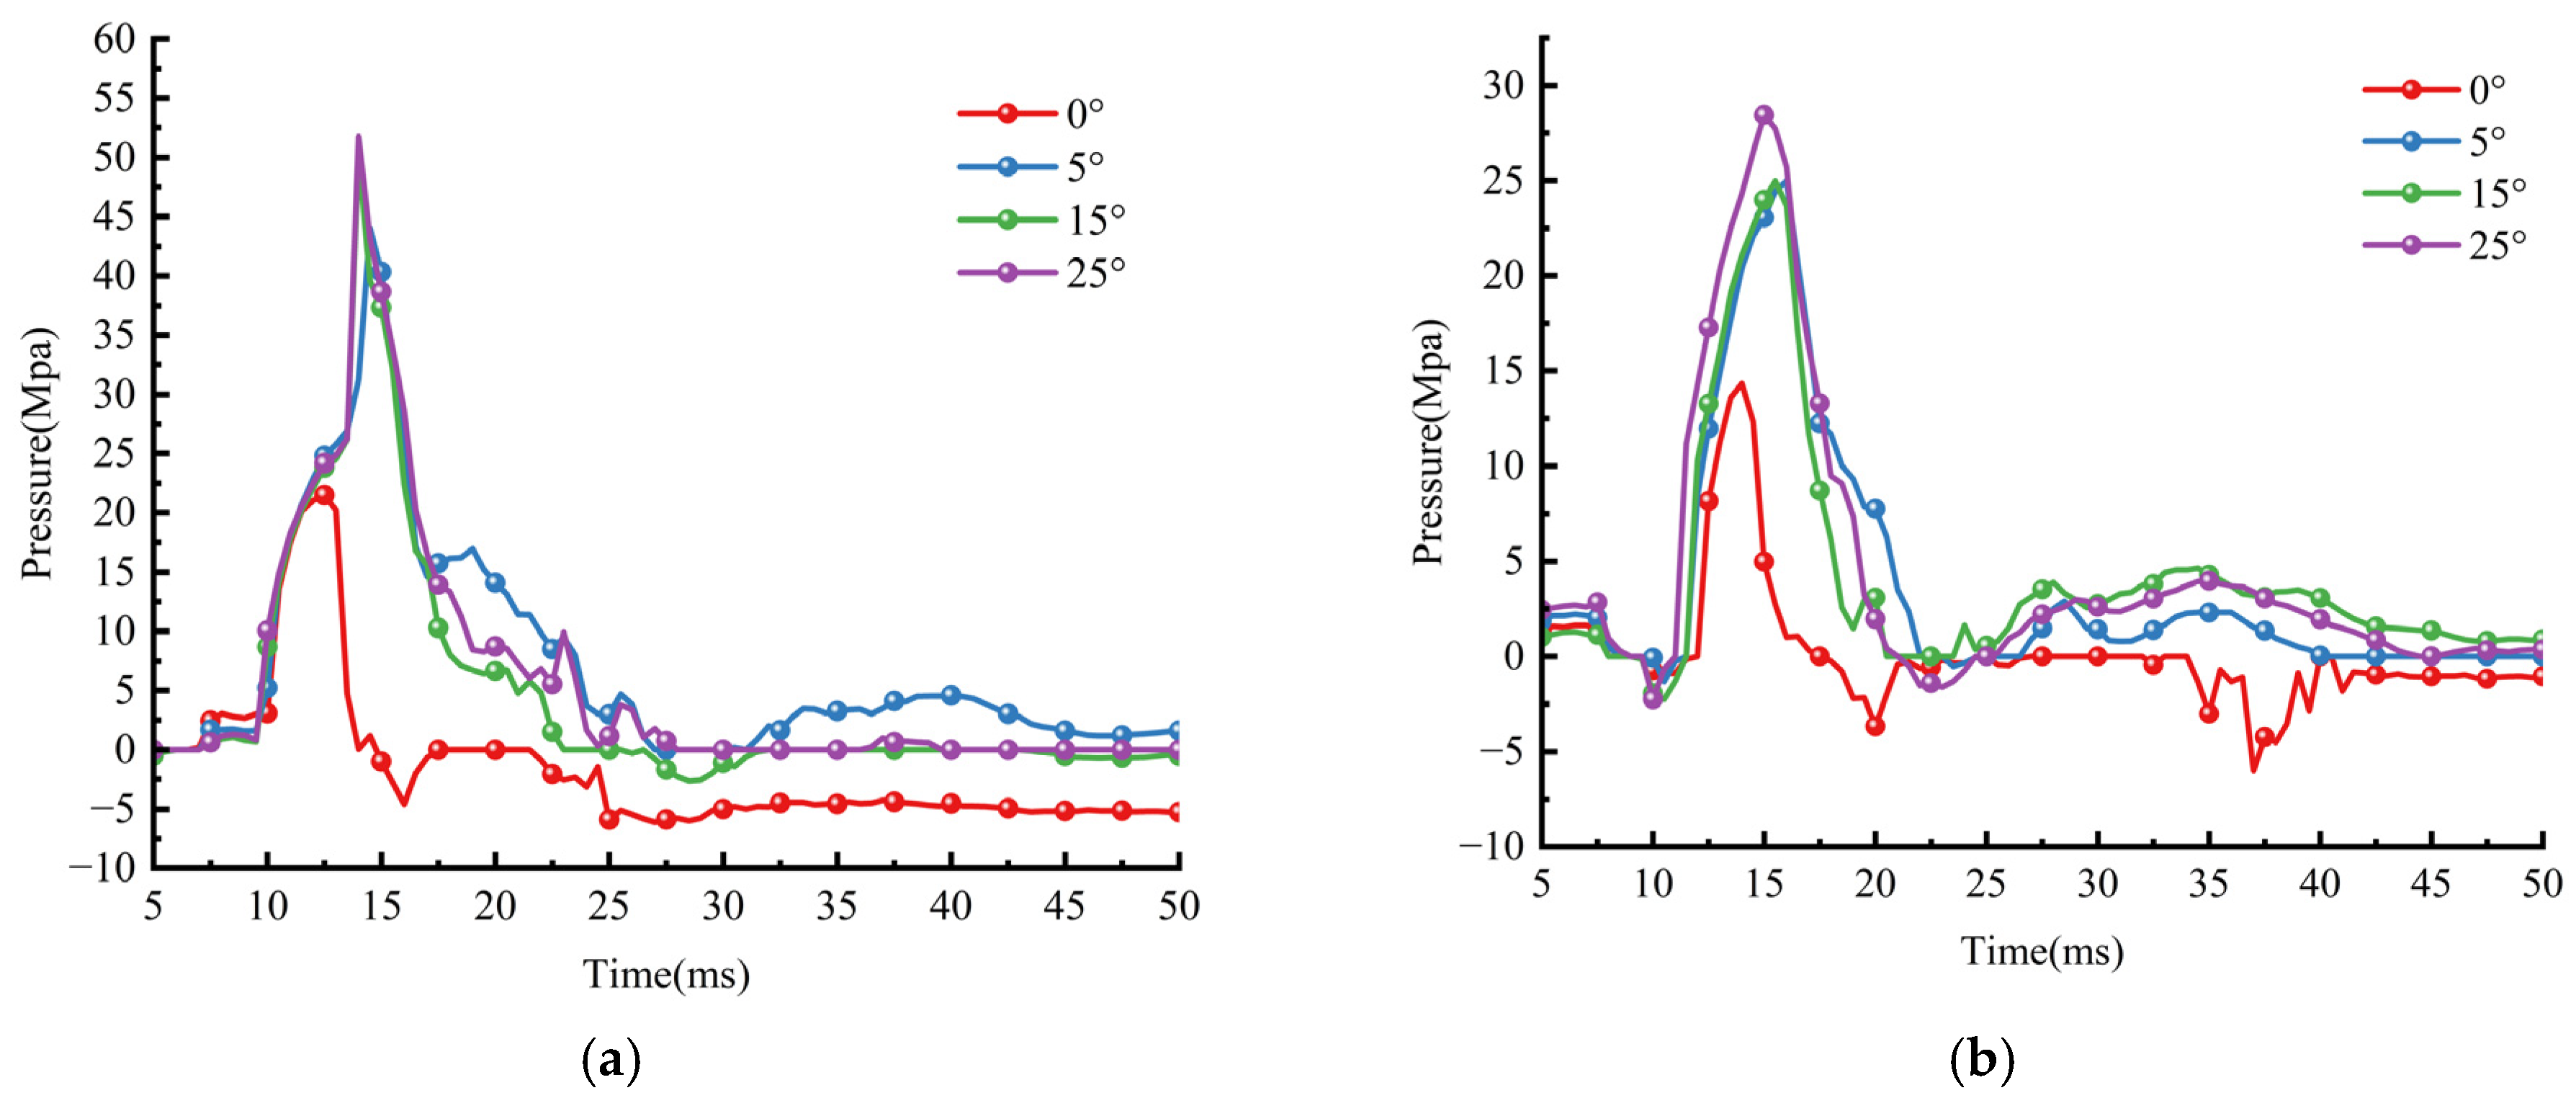
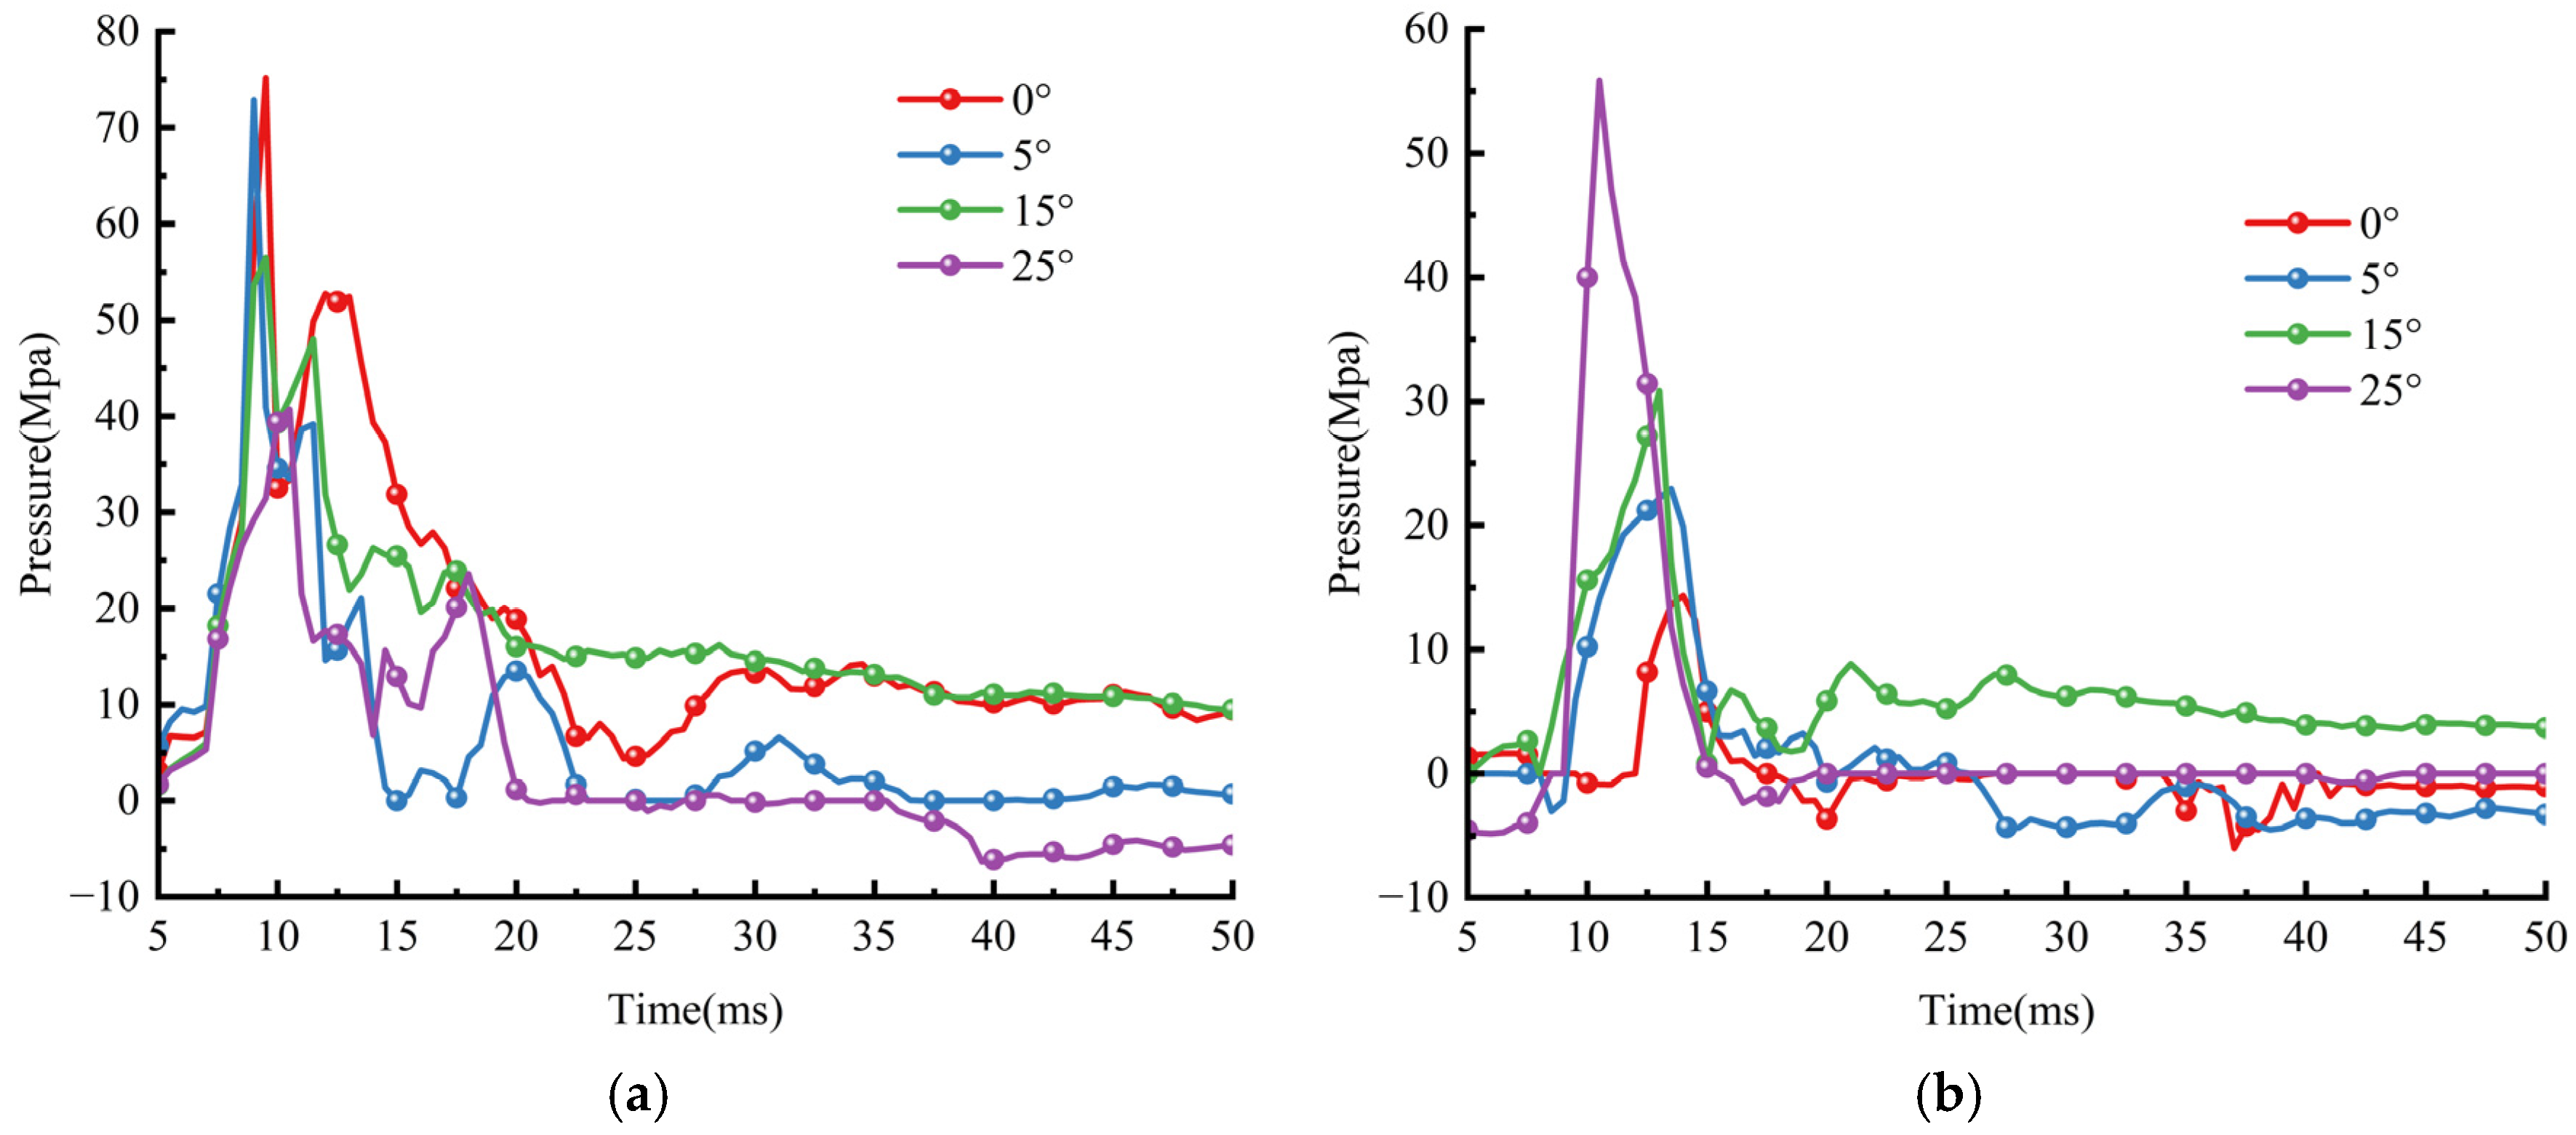
As illustrated in Figure 25, when the local stress is zero, the intensity of the stress wave at characteristic points both at the center and along the boundary increases with the inclination angle following the detonation of the explosive. This observation suggests that, at shallow excavation depths, modifying the trajectory inclination enhances the propagation intensity of stress waves within the model post-detonation. Furthermore, damage contour plots reveal that the extent of damage proximal to the explosive escalates as the inclination angle increases after detonation. This implies that a greater penetration angle corresponds to more efficient shock waves utilization. The underlying mechanism is attributed to the alteration in the direction of stress wave propagation caused by changes in inclination, which diminishes the escape of gases and shock waves generated by a shallow detonation toward the free surface, thereby resulting in a more extensive fragmentation of the entire model.
Figure 26 presents the pressure–time curves at characteristic points located at a depth of 15 m and 0 MPa, following detonation events conducted at varying tunnel dip angles. Analysis of the figure reveals that, at this depth, the peak pressure values at central characteristic points exhibit significant variation compared to those observed at a depth of 10 m. Specifically, the highest peak pressure occurs at a tunnel inclination of 25°, followed sequentially by 0° and 15°. Conversely, the boundary characteristic points demonstrate the greatest peak pressure at 15°, with the lowest observed at 0°. Notably, the time required to reach peak pressure remains consistent across all four dip angles examined. When comparing central characteristic point pressures at different depths, the maximum peak pressure recorded at 10 m depth is 22 MPa, whereas at 15 m depth, it increases substantially to 52 MPa. These findings suggest that with increasing depth, the attenuation of shock waves diminishes, resulting in a greater degree of damage to the model subsequent to the explosion.
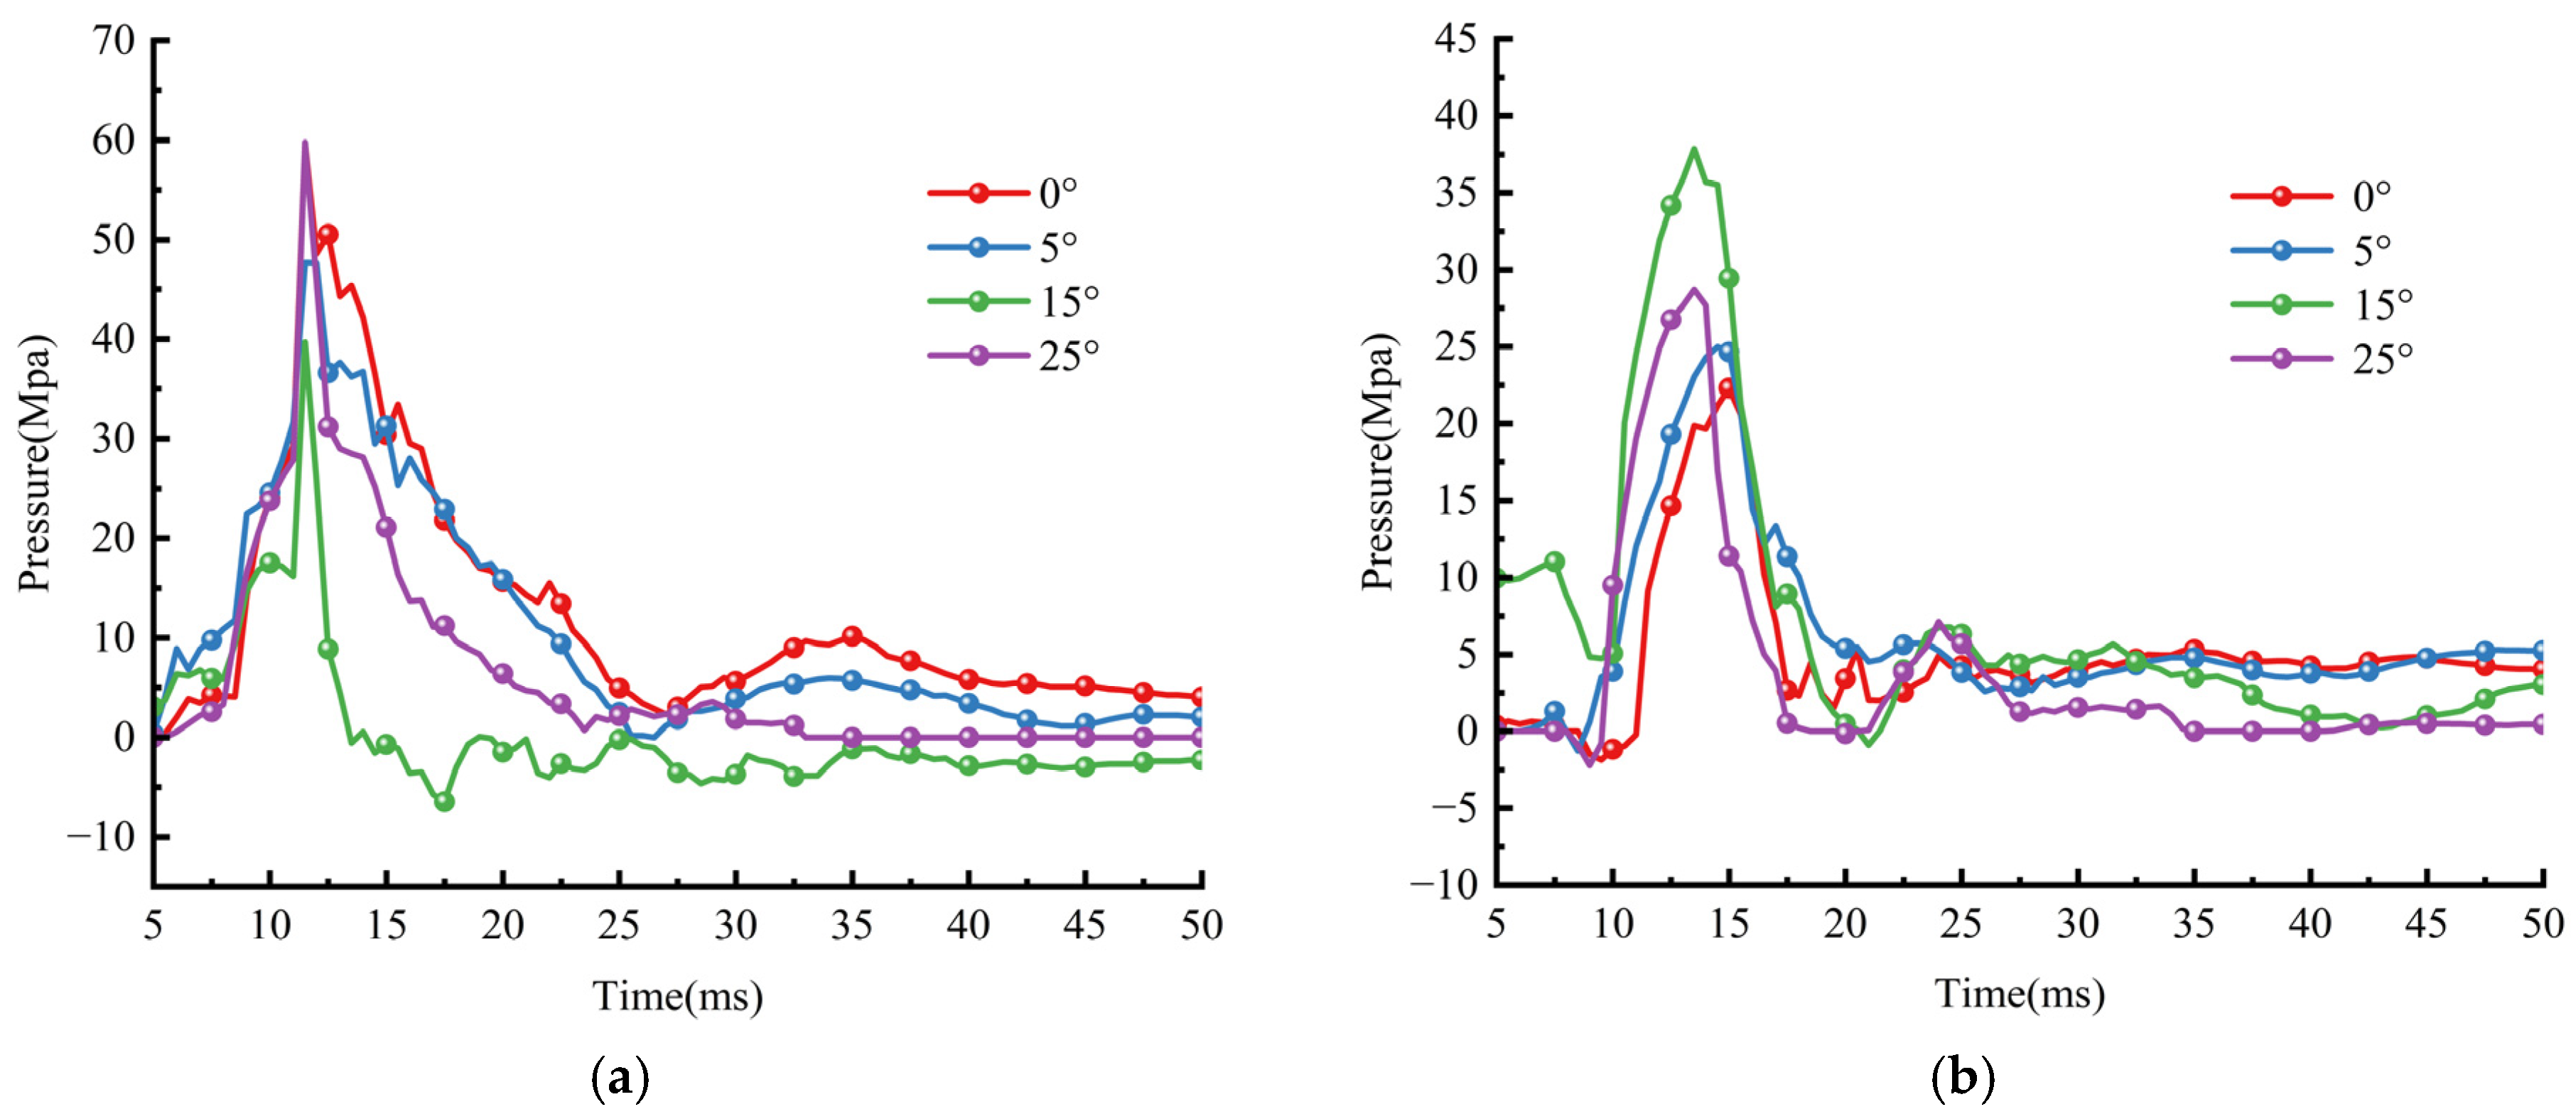
At a depth of 20 m as shown in Figure 27, the maximum stress observed at the central characteristic point is greatest for an explosion occurring at a tunnel inclination of 0°, followed sequentially by inclinations of 5° and 25°. With increasing inclination, the amplitude of the stress wave propagating in the vertical direction diminishes. Conversely, the stress wave produced by an explosion at the 25° inclination exhibits the highest intensity, suggesting that at this angle, the stress wave predominantly propagates in the transverse direction. These findings imply that the magnitude of stress waves reaching the characteristic point is chiefly influenced by the distance between the detonation location and the characteristic point. At this stage, the attenuation of pressure waves generated by explosions at varying angles remains relatively minimal.

3.4. Study of Explosion Effects in Oblique Penetration Under Different Geostresses

The preceding section analyzed the damage and pressure time–history curves resulting from explosive effects at varying depths and angles, demonstrating that both parameters substantially affect the propagation of geostresses. When a bunker-busting munition penetrates a mountainous target, its trajectory is frequently altered due to the presence of a shielding layer and aerodynamic drag during flight, leading to an oblique angle of entry into the mountain’s main body. Additionally, the mountain’s inherent structural stresses can impact the propagation of the pressure wave generated upon detonation. Therefore, investigating the damage mechanisms and stress wave propagation associated with oblique penetration of such munitions, particularly under the influence of geostress, is of critical importance.
Figure 28 presents damage cloud diagrams resulting from explosive detonations at a tunnel inclination of 25° across varying depths. At a depth of 10 m and an inclination angle of 25°, the evolution patterns of the primary damage zones differ under three distinct geostress conditions. When the geostress is 0 MPa, the damaged and fractured region above the tunnel inclination, closer to the free surface, is more extensive than the damage zone below the tunnel. However, as the geostress increases to 10 MPa and 20 MPa, the damage and fragmentation zone above the tunnel near the free surface diminishes, particularly in proximity to the tunnel entrance. These observations suggest that elevated geostress levels can effectively reduce damage at the tunnel entrance following explosive detonation.
Figure 29 and Figure 30 present damage cloud diagrams corresponding to a dip angle of 25° at depths of 15 m and 20 m, respectively, under varying geostress conditions. Compared to the damage cloud diagrams at a depth of 10 m for different dip angles, the overall damage severity at depths of 15 m and 20 m is notably greater, particularly during the crack propagation phase. Additionally, the total crack length increases at these greater depths, suggesting that increased penetration depth enhances shock waves utilization and amplifies the extent of damage caused by the explosives within the model. Furthermore, consistent with the damage zone development patterns observed on the upper side of the tunnel at 10 m depth, elevated geostress diminishes the extent of damage near the free surface above the tunnel’s dip angle, leading to a significant reduction in damage proximal to the tunnel entrance. In contrast, the damage zone on the lower side of the tunnel appears less influenced by geostress, with the progression of damage and crack zones on this side exhibiting similar characteristics across all three tested conditions.
In summary, as geostress intensifies, the upper portion of the tunnel, which is proximal to the free surface, experiences a suppression of tensile cracking effects induced by the free surface due to the counteracting influence of the geostress. This interaction serves to constrain both the extent of the damage zone and the propagation of cracks. In contrast, the lower portion of the tunnel, being situated farther from the free surface, is not affected by the free surface phenomenon; thus, the impact of geostress on internal fracturing in this region is comparatively limited. Consequently, the overall degree of damage remains relatively stable under varying geostress conditions, with this pattern becoming more pronounced as depth increases.
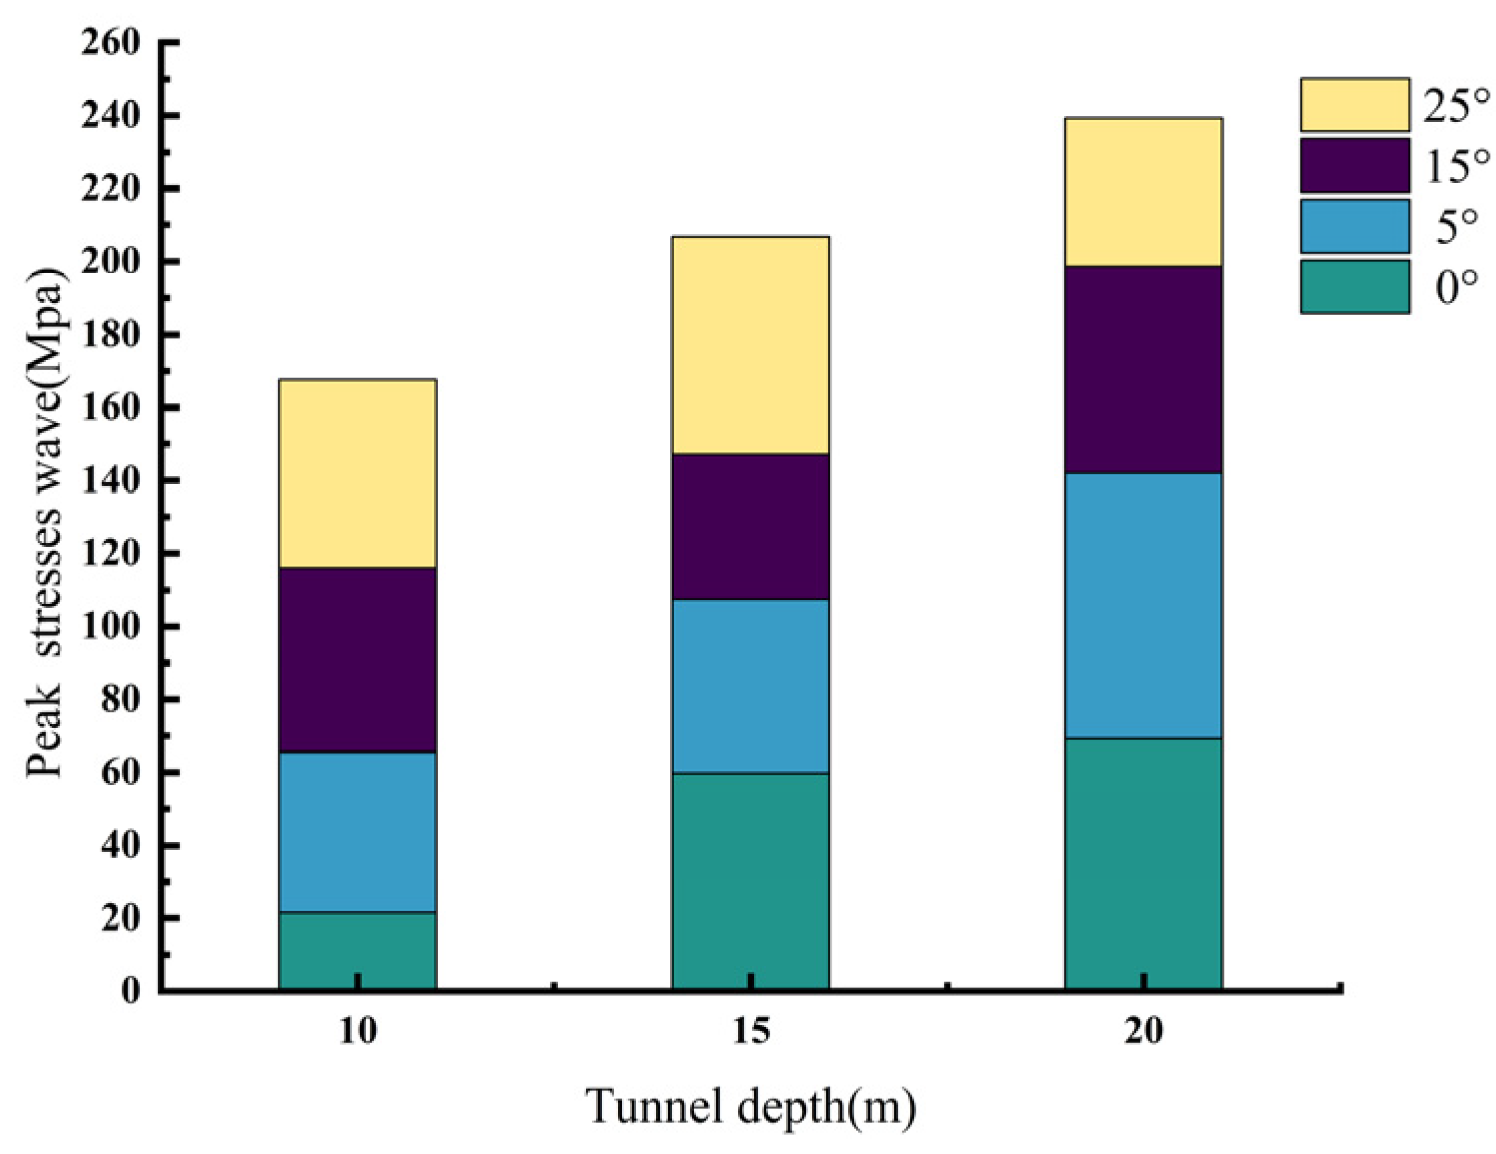
Figure 31 presents a scatter plot illustrating the peak values at the central characteristic point under geostress conditions of 0 MPa, across varying tunnel inclinations and depths. The data indicate that as both inclination and depth change, the peak geostress values exhibit a gradual variation, with the majority of stress wave peaks concentrated within the range of 40 to 60 MPa. Specifically, for tunnel inclinations of 0° and 5°, the stress wave peaks tend to increase progressively with depth, reaching a maximum peak at a 5° inclination under the overall operating conditions. Blasting-induced stress waves are reflected at the tunnel face, generating a reflected wave that propagates in the direction opposite to that of the incident wave. When the phases of these two wave trains coincide precisely at a characteristic point located centrally, constructive interference arises. Concurrently, the geostress functions not only as a static background field but also interacts with and superimposes upon the dynamic blasting stress waves. Notably, at an inclination angle of 5°, the superposition effect between the ground stress component and the blasting-induced stress wave component reaches its maximum efficacy. However, with further increases in inclination, the pattern of stress wave peaks alters, which can be attributed to changes in the travel distance of the stress wave to the central characteristic point, thereby producing an irregular trend in stress wave propagation.
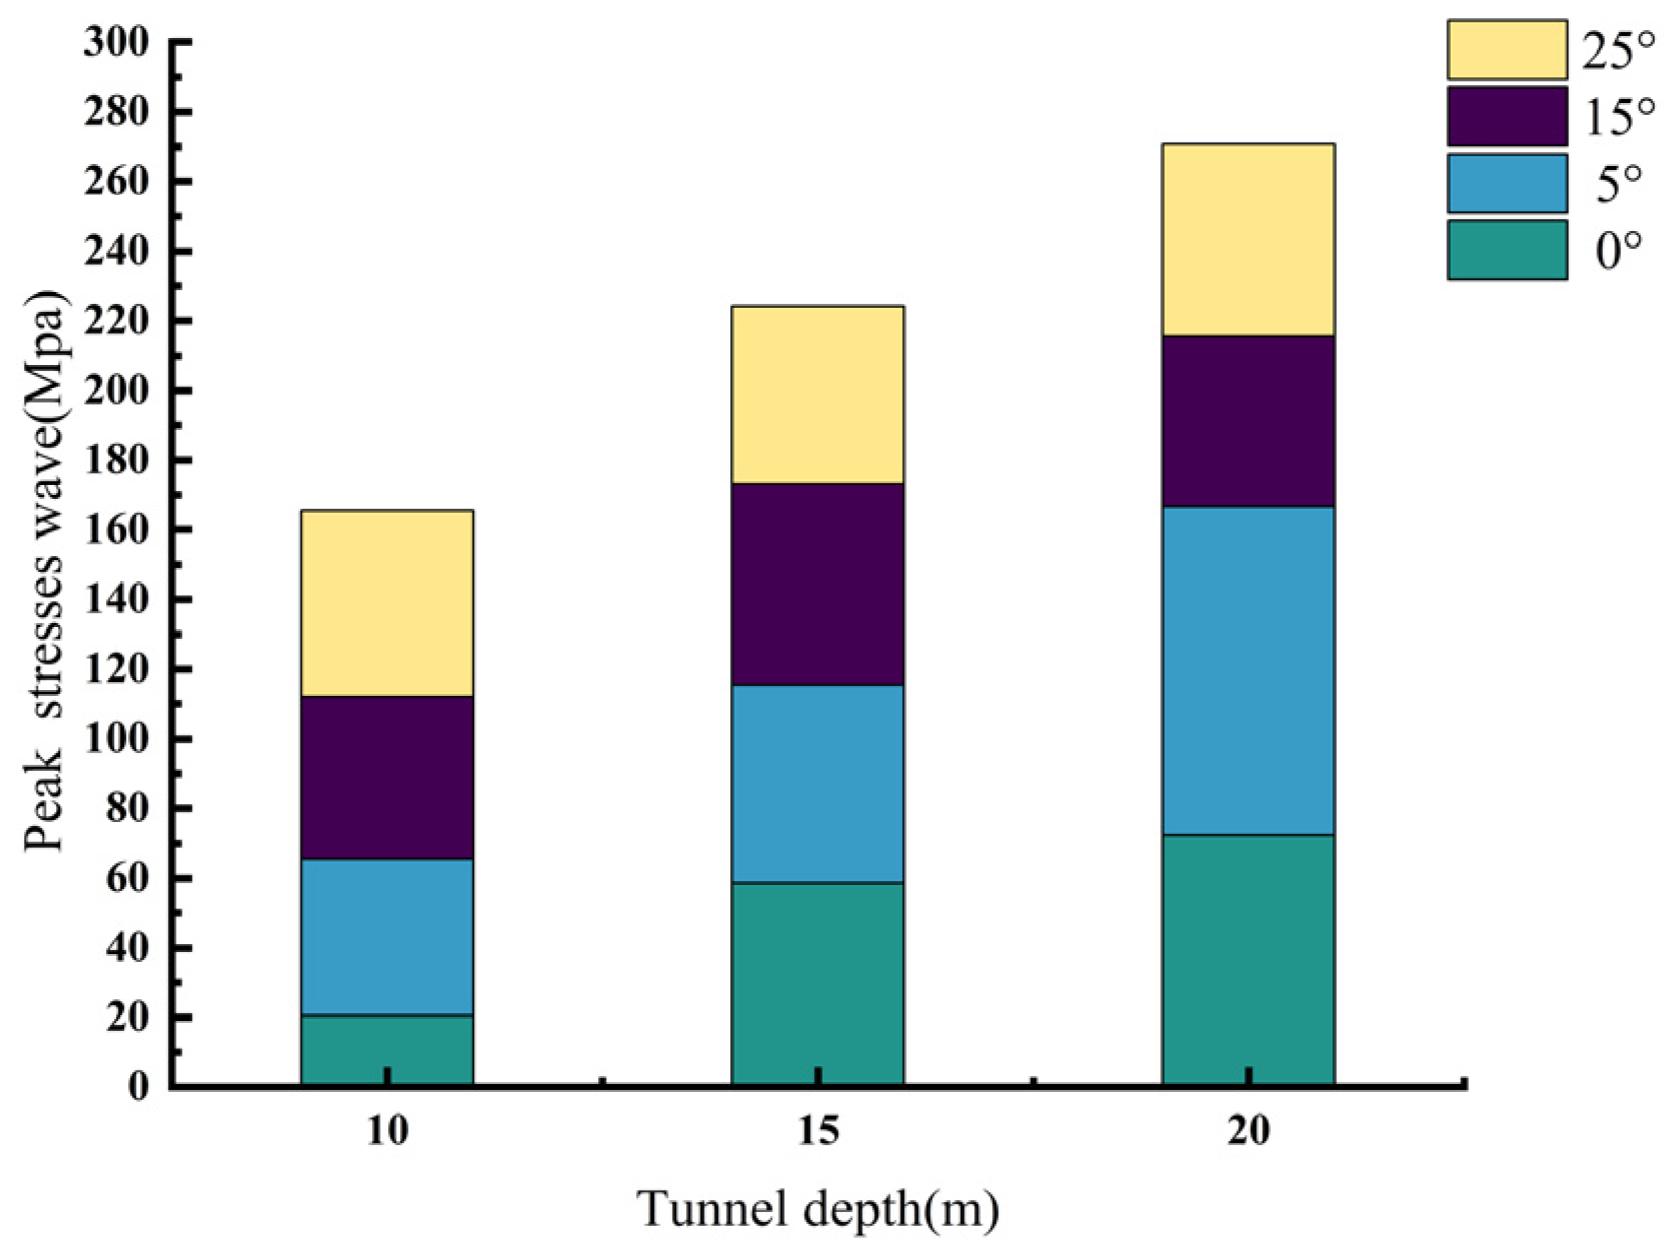
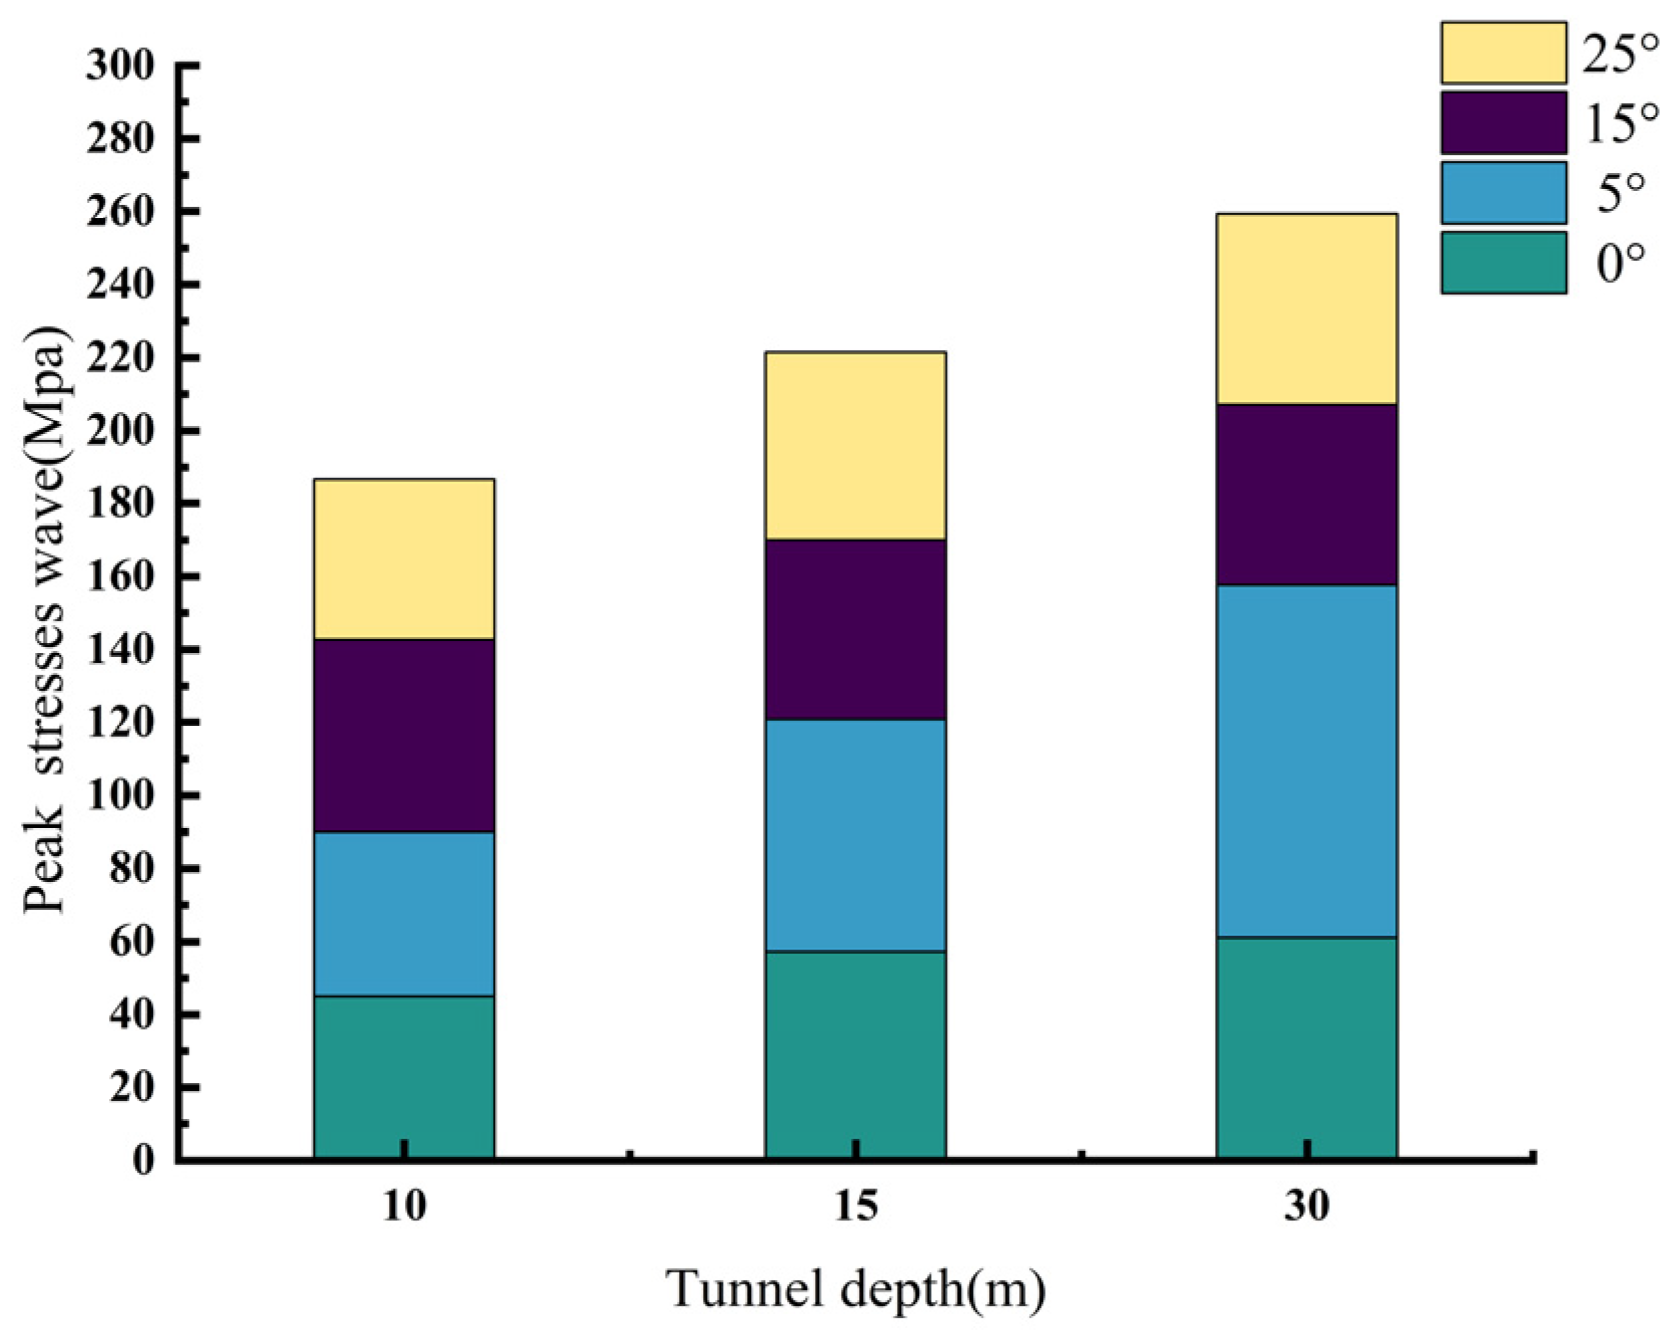
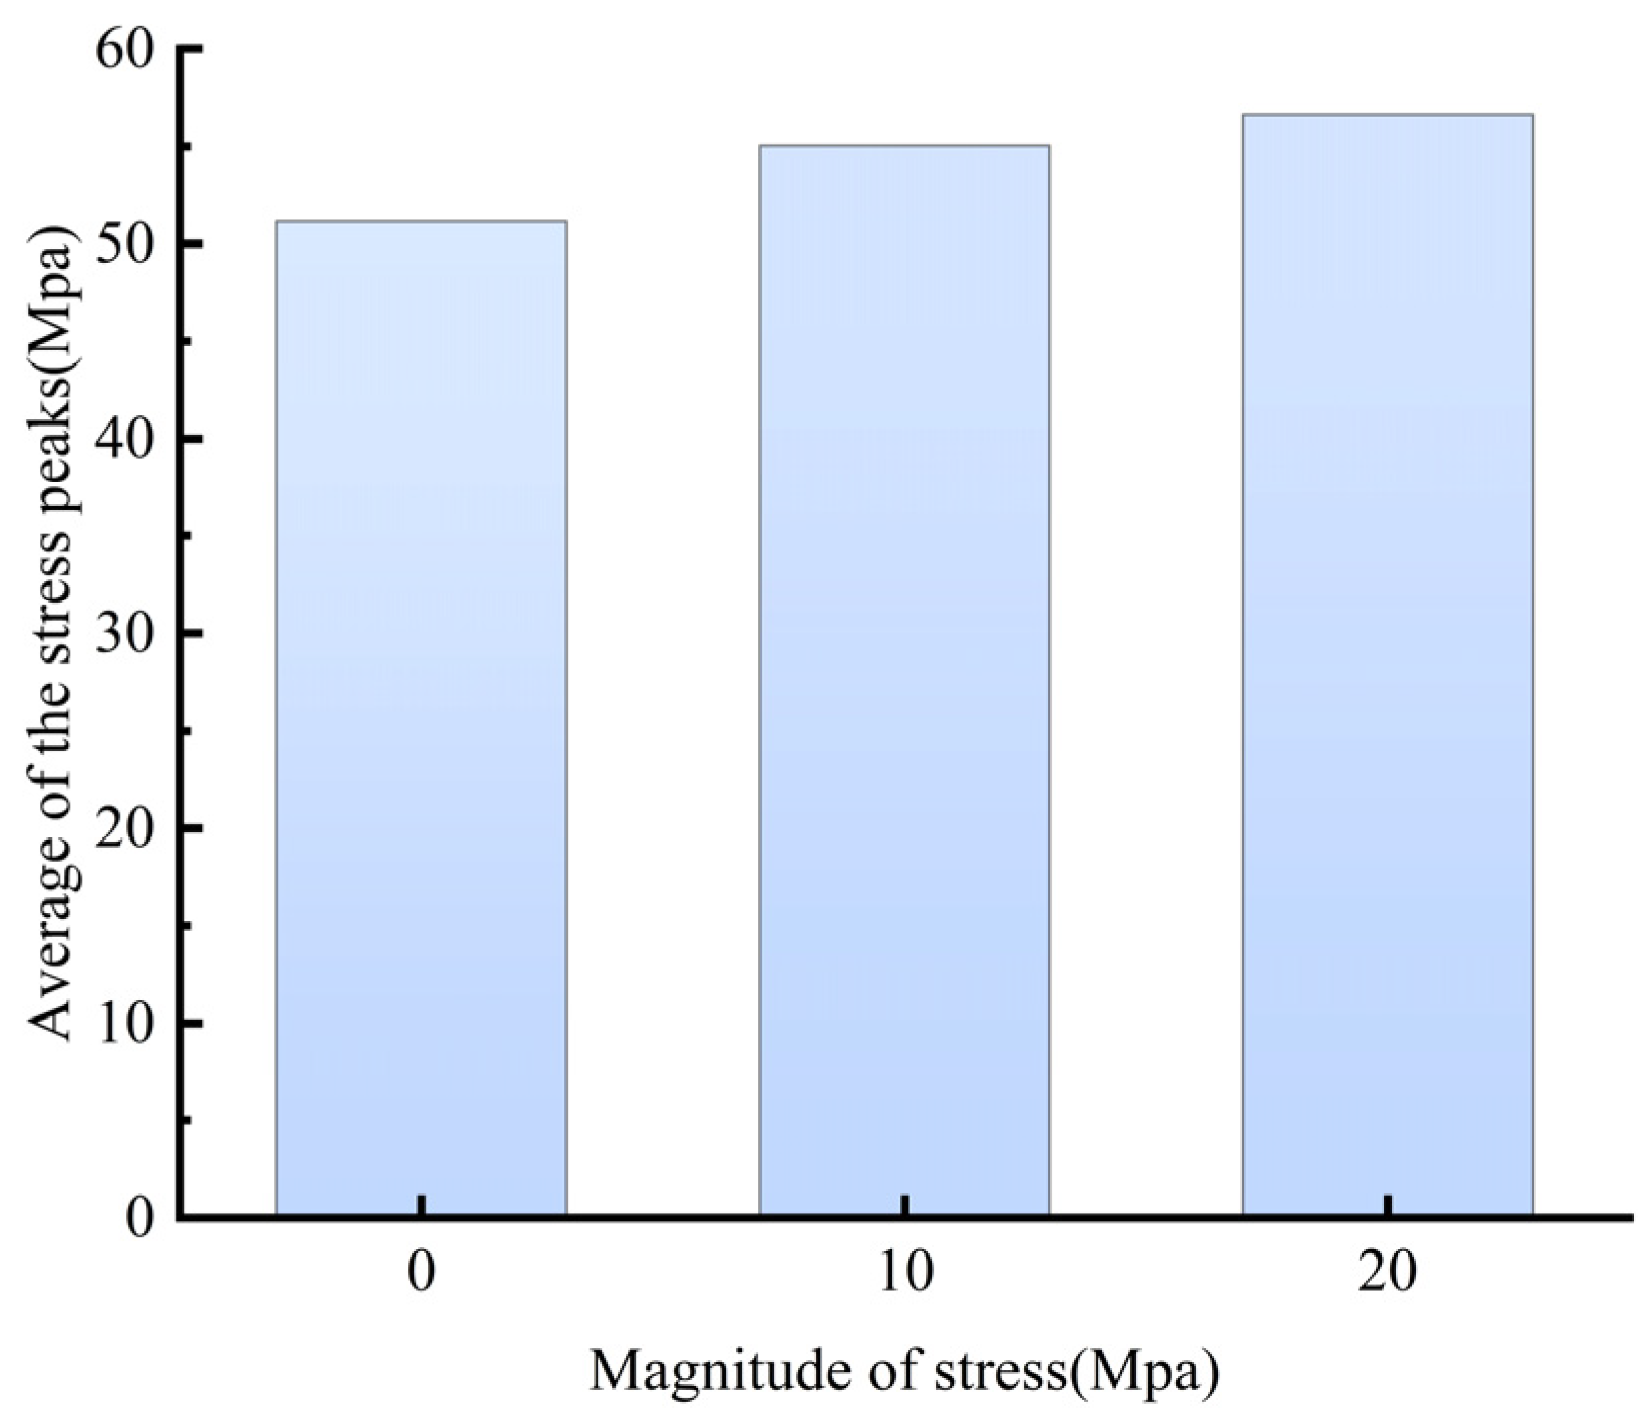
A comparative analysis of Figure 32 and Figure 33, which depict the development patterns of the stress wave midpoint at 10 MPa and 20 MPa, respectively, reveals that the highest stress wave peak occurs at a tunnel inclination of 5° and a depth of 20 m. This finding suggests that a 5° tunnel inclination enhances the pressure peak at the midpoint. Furthermore, Figure 34 illustrates the average pressure peaks at the central characteristic point under varying geostress levels, angles, and depths. The figure demonstrates that with increasing geostress, the average pressure peak correspondingly rises, indicating that elevated geostress intensifies the stress waves experienced at the central characteristic point. Consequently, following detonation, a larger proportion of shock waves propagates deeper into the model.

4. Conclusions

This research integrates SHPB experiments conducted under confining pressure, numerical modeling, and stress wave theory to examine the effects of varying initial stress states, tunnel depths, and tunnel inclinations on the propagation mechanisms of stress waves. Additionally, the research analyzed and compared the transfer processes of stress waves and the failure evolution characteristics of the rock mass. The findings can be summarized as follows.
When the tunnel is located at a shallow depth, the high-pressure gas and shock wave produced by the explosion tend to escape toward the open surface, causing a considerable reduction in the shock wave’s strength. In contrast, as the depth increases, the surrounding material provides effective confinement to the blasting shock wave, which increases both the shock wave’s intensity and the impact load.
Geostress effectively inhibits the dissipation of stress wave toward the tunnel’s free face, thereby facilitating the concentration of stress wave within the damage zone proximal to the detonation site. The rock mass situated above, being adjacent to the free surface, experiences a suppression of tensile cracking effects at this boundary due to geostress. Conversely, the rock mass below the tunnel, located farther from the free surface and thus unaffected by free-surface phenomena, demonstrates a diminished response to geostress in terms of internal fragmentation; as a result, the extent of damage remains relatively unchanged. This differential effect becomes increasingly pronounced with greater burial depth.
With an increase in the borehole inclination angle, pronounced stress concentrations develop at the tunnel base, accompanied by heterogeneous fracture zones and irregular crack distributions within the rock mass adjacent to the explosives. As the stress wave radiates outward along the borehole, it generates systematic damage cracks oriented away from the free surface. Elevating the inclination angle markedly amplifies the stress wave intensity at key points in both central and boundary regions post-detonation. Additionally, it mitigates the escape of gas and shock waves toward the free surface during shallow detonations, ultimately improving the overall fragmentation of the rock model. Specifically, at inclination angles of 0° and 5°, peak stress wave values progressively increase with burial depth, with the 5° inclination condition yielding the highest peak values across all experimental scenarios. This study clearly explains how stress waves propagate and how damage is evaluated when an explosion happens at the base of a tunnel subjected to geostress and different conditions, offering valuable guidance for tunnel blasting operations in areas with high geostress.


Author Contributions

H.L.: Writing—original draft, Validation, Investigation, Conceptualization; Y.M.: Writing—review and editing, Resources, Conceptualization; Y.S.: Visualization, Supervision; Z.W.: Software, Methodology; S.C. (Shengyi Cong): Formal analysis, Data curation; S.C. (Shaojun Cao): Formal analysis. All authors have read and agreed to the published version of the manuscript.

Funding

This research received no external funding.

Data Availability Statement

The datasets used or analysed during the current study are available from the corresponding author on reasonable request.

Conflicts of Interest

The authors declare no conflict of interest.

References

  1. Chen, X.C.; Mi, Y.; Shuai, X.R.; Zheng, Y.; Zhao, W.H. Geostress-Adaptive Charge Structure Design and Field Validation for Machinery Room Excavation. Sensors 2024, 24, 7738. [Google Scholar] [CrossRef] [PubMed]
  2. Fan, D.Y.; Liu, X.S.; Tan, Y.L.; Yan, L.; Song, S.L.; Ning, J.G. An innovative approach for gob-side entry retaining in deep coal mines: A case study. Energy Sci. Eng. 2019, 7, 2321–2335. [Google Scholar] [CrossRef]
  3. Huang, X.; Liu, Q.S.; Shi, K.; Pan, Y.C.; Liu, J.P. Application and prospect of hard rock TBM for deep roadway construction in coal mines. Tunn. Undergr. Space Technol. 2018, 73, 105–126. [Google Scholar] [CrossRef]
  4. Li, J.; Hu, B.; Sheng, J.L.; Zhong, Z.X. Shear Creep Behaviors of Carbonaceous Shale: Equivalent Simulation of Engineering Geological Environment Coupling of Geostress-Rainfall-Blasting Disturbance. Rock Mech. Rock Eng. 2025, 58, 10063–10084. [Google Scholar] [CrossRef]
  5. Qiao, P.Y.; Liu, Z.B.; Li, Y.P.; Lin, C.; Yan, G.Y. Research and application of comprehensive detection methods for geological structural planes in drill and blast tunnels. J. Appl. Geophys. 2024, 228, 105449. [Google Scholar] [CrossRef]
  6. Zhang, H.; Zhu, Y.M.; Chen, L.; Hu, W.D.; Chen, S.G. The Prevention and Control Mechanism of Rockburst Hazards and Its Application in the Construction of a Deeply Buried Tunnel. Appl. Sci. 2019, 9, 3629. [Google Scholar] [CrossRef]
  7. Zhao, Z.P.; Chen, J.X.; Fang, T.F.; Liu, W.W.; Luo, Y.B.; Wang, C.W.; Dong, J.L.; Li, J.; Wang, H.Q.; Huang, D.X. Deformation and Stress of Rock Masses Surrounding a Tunnel Shaft Considering Seepage and Hard Brittleness Damage. Symmetry 2024, 16, 1266. [Google Scholar] [CrossRef]
  8. Li, X.D.; Liu, K.W.; Sha, Y.Y.; Yang, J.C.; Ma, S.Z.; Hong, Z.X. Investigation on radial fracturing around borehole under combined static stress and blasting. Theor. Appl. Fract. Mech. 2023, 127, 104038. [Google Scholar] [CrossRef]
  9. Yi, C.P.; Johansson, D.; Greberg, J. Effects of in-situ stresses on the fracturing of rock by blasting. Comput. Geotech. 2018, 104, 321–330. [Google Scholar] [CrossRef]
  10. Wang, M.; Zhang, J.T.; Fan, L.F.; Wang, W.; Yuan, W. Theoretical Study on Stress Wave Transmission Through Deep Rock Masses Under a Gradient Geostress Field. Int. J. Numer. Anal. Methods Geomech. 2026, 50, 2502–2515. [Google Scholar] [CrossRef]
  11. Yang, J.H.; Peng, C.; Ye, Z.W.; Yao, C.; Zhang, X.B.; Ma, Y.L.; Zhou, C.B. Study on the efficiency of energy transfer in the blasting with different coupling mediums for deep rock mass excavation. Eng. Fract. Mech. 2025, 319, 111048. [Google Scholar] [CrossRef]
  12. Luo, Y.; Gong, H.L.; Huang, J.H.; Wang, G.; Li, X.P.; Wan, S. Dynamic cumulative damage characteristics of deep-buried granite from Shuangjiangkou hydropower station under true triaxial constraint. Int. J. Impact Eng. 2022, 165, 104215. [Google Scholar] [CrossRef]
  13. Liu, X.; Yan, P.; Lu, W.B.; Zhu, J.; Zhang, X.Y.; Lu, A.; Chen, M.; Wang, G.H. Investigation of dynamic crack formation mechanism based on a new crack dynamic driving model. Comput. Geotech. 2023, 159, 105471. [Google Scholar] [CrossRef]
  14. Dong, Q.; Liu, X.; Gong, H.L.; Luo, Y.; Li, X.P.; Wang, L.J. The Damage Induced by Blasting Excavation and Seepage Characteristics of Deep Rock under High Seepage Pressure. Geofluids 2023, 2023, 9159098. [Google Scholar] [CrossRef]
  15. Gao, Q.; Liu, C.A.X.; Zhang, J.; Cheng, G.T. Simulating the Formation of Blasting-Excavation-Induced Zonal Integration in Deep Tunnels with an Elastoplastic Damage Model. Shock Vib. 2021, 2021, 9991251. [Google Scholar] [CrossRef]
  16. Yuan, P.; Xu, Y. Zonal Disintegration Mechanism of Deep Rock Masses under Coupled High Axial Geostress and Blasting Load. Shock Vib. 2018, 2018, 4957917. [Google Scholar] [CrossRef]
  17. Yuan, P.; Xu, Y. Experimental Study on Unloading Effect of Drill and Blast Excavation in High Axial Geostress. Fresenius Environ. Bull. 2019, 28, 7795–7802. [Google Scholar]
  18. Lin, X.; Li, B.; Li, P.; Ding, Q.F.; Huang, M.T. Study of the Evolution Characteristics of Microseismic Events during the Excavation of Underground Caverns under High Geostress. Appl. Sci. 2022, 12, 12145. [Google Scholar] [CrossRef]
  19. Zhao, J.S.; Chen, B.R.; Jiang, Q.; Lu, J.F.; Hao, X.J.; Pei, S.F.; Wang, F. Microseismic Monitoring of Rock Mass Fracture Response to Blasting Excavation of Large Underground Caverns Under High Geostress. Rock Mech. Rock Eng. 2022, 55, 733–750. [Google Scholar] [CrossRef]
  20. Li, Q.W.; Xiang, B. Rockburst Prediction on the Superimposed Effect of Excavation Accumulation Energy and Blasting Vibration Energy in Deep Roadway. Shock Vib. 2021, 2021, 6644590. [Google Scholar] [CrossRef]
  21. Zheng, Z.; Li, S.X.; Zhang, Q.; Tang, H.; Liu, G.F.; Pei, S.F.; Lu, G.M. True triaxial test and DEM simulation of rock mechanical behaviors, meso-cracking mechanism and precursor subject to underground excavation disturbance. Eng. Geol. 2024, 337, 107567. [Google Scholar] [CrossRef]
  22. Peng, K.; Liu, X.; Yin, X.Y.; Zhang, Y.; Chang, Y.K.; Luo, S. Characteristics of stress thresholds of granite after triaxial dynamic impact treatment. J. Cent. South Univ. 2025, 32, 2553–2569. [Google Scholar] [CrossRef]
  23. Yang, J.H.; Yu, T.; Ye, Z.W.; Luo, Y.; Yao, C.; Zhang, X.B.; Zhou, C.B. Dynamic mechanical properties and fracture characteristics of red sandstone under multiaxial confining pressure and impact loading. Eng. Fract. Mech. 2024, 308, 110377. [Google Scholar] [CrossRef]
  24. Xu, S.N.; Yue, Z.W.; Wang, P.; Zhou, X.Y.; Ren, M.; Jiang, H.Y. The influence of biaxial loads on the dynamic crack interaction of two opposite propagating. Eng. Fract. Mech. 2025, 314, 110732. [Google Scholar] [CrossRef]
  25. Xu, S.N.; Yue, Z.W.; Zhou, X.Y.; Zhou, J.; Wang, P.; Xue, K.J. The influence of horizontal borehole spacing on the interaction of two dynamic cracks propagating towards each other under unequal biaxial confining pressure. Theor. Appl. Fract. Mech. 2025, 140, 105181. [Google Scholar] [CrossRef]
  26. Chen, L.; Yang, X.C.; Guo, L.J.; Yu, S.B. Analysis of Rock Mass Energy Characteristics and Induced Disasters Considering the Blasting Superposition Effect. Processes 2024, 12, 1089. [Google Scholar] [CrossRef]
  27. Wang, H.; Zong, Q.; Wang, H.B. Experimental Study on the Pore Structure of Sandstone Damaged by Blasting and Changes in Energy Dissipation Under Triaxial Loading. Arab. J. Sci. Eng. 2024, 49, 13897–13914. [Google Scholar] [CrossRef]
  28. Zhai, J.J.; Wang, Z.L.; Wang, J.G.; Feng, C.C.; Li, S.Y. Numerical Study on Blast Dynamic Response of Jointed Rock Mass under High Geostress Field. Int. J. Geomech. 2025, 25, 04025005. [Google Scholar] [CrossRef]
  29. Tang, M.Y.; Zhu, Y.F.; Wu, S.; Wei, X.; Qu, D.X.; Song, K.W.; Zhou, X.Z.; Li, X.P. Dynamic damage distribution in inclined shafts under high geostress during blasting excavation. Q. J. Eng. Geol. Hydrogeol. 2025, 58, qjegh2024-100. [Google Scholar] [CrossRef]
  30. Chen, Y.D.; Wang, Q.Z.; Yuan, W.; Wang, W.; Niu, Q.H.; Xu, Y.; Yao, W.; Wu, B.B. Permeability evolution of uranium reservoirs under multi-field coupling (gas-temperature-force-seepage) and artificial intelligence multi-parameter target optimization study. Phys. Fluids 2025, 37, 033626. [Google Scholar] [CrossRef]
  31. Dong, Q.; Wang, M.X. Experimental study on the external damage characteristics of rock blasting under confining pressure. AIP Adv. 2025, 15, 115113. [Google Scholar] [CrossRef]
  32. Zhang, T.S.; Huang, J.H.; Li, X.P.; Liu, T.T.; Bian, X.; Luo, Y. Characteristics of the elevation amplification effect of vibration velocity in rock surrounding underground cavities under different stress conditions. Soil Dyn. Earthq. Eng. 2023, 165, 107704. [Google Scholar] [CrossRef]
  33. Han, F.J.; Jiang, N.; Yao, Y.K.; Zhou, C.B.; Yang, Y.M. Dynamic response characteristics and instability mechanism of layered surrounding rock tunnels affected by geostress under dynamic and static loads. Eng. Fail. Anal. 2024, 160, 108202. [Google Scholar] [CrossRef]
  34. Ma, H.Y. A Study on the Propagation of Blasting Stress Waves and Crack Propagation Mechanisms in Rock under High Stress Conditions. Master’s Thesis, Shenyang University of Technology, Shenyang, China, 2023. (In Chinese) [Google Scholar]
  35. Wu, Z.N. Mechanisms of the Influence of Ground Stress on Rock Blasting Fracturing and the Propagation of Explosion-Induced Seismic Waves. Master’s Thesis, Nanchang University, Nanchang, China, 2020. (In Chinese) [Google Scholar]
  36. Johnson, G.R.; Holmquist, T.J. An improved computational constitutive model for brittle materials. AIP Conf. Proc. 1994, 309, 981–984. [Google Scholar] [CrossRef]
  37. Wang, H.; Wang, Z.; Wang, J.; Wang, S.; Wang, H.; Yin, Y.; Li, F. Effect of confining pressure on damage accumulation of rock under repeated blast loading. Int. J. Impact Eng. 2021, 156, 103961. [Google Scholar] [CrossRef]
Figure 1. Schematic diagram of geostress loading and the arrangement of characteristic points.
Modelling 07 00102 g001
Figure 2. Photograph of the multifunctional rock dynamic testing system.
Modelling 07 00102 g002
Figure 3. Photograph of the confining pressure apparatus.
Modelling 07 00102 g003
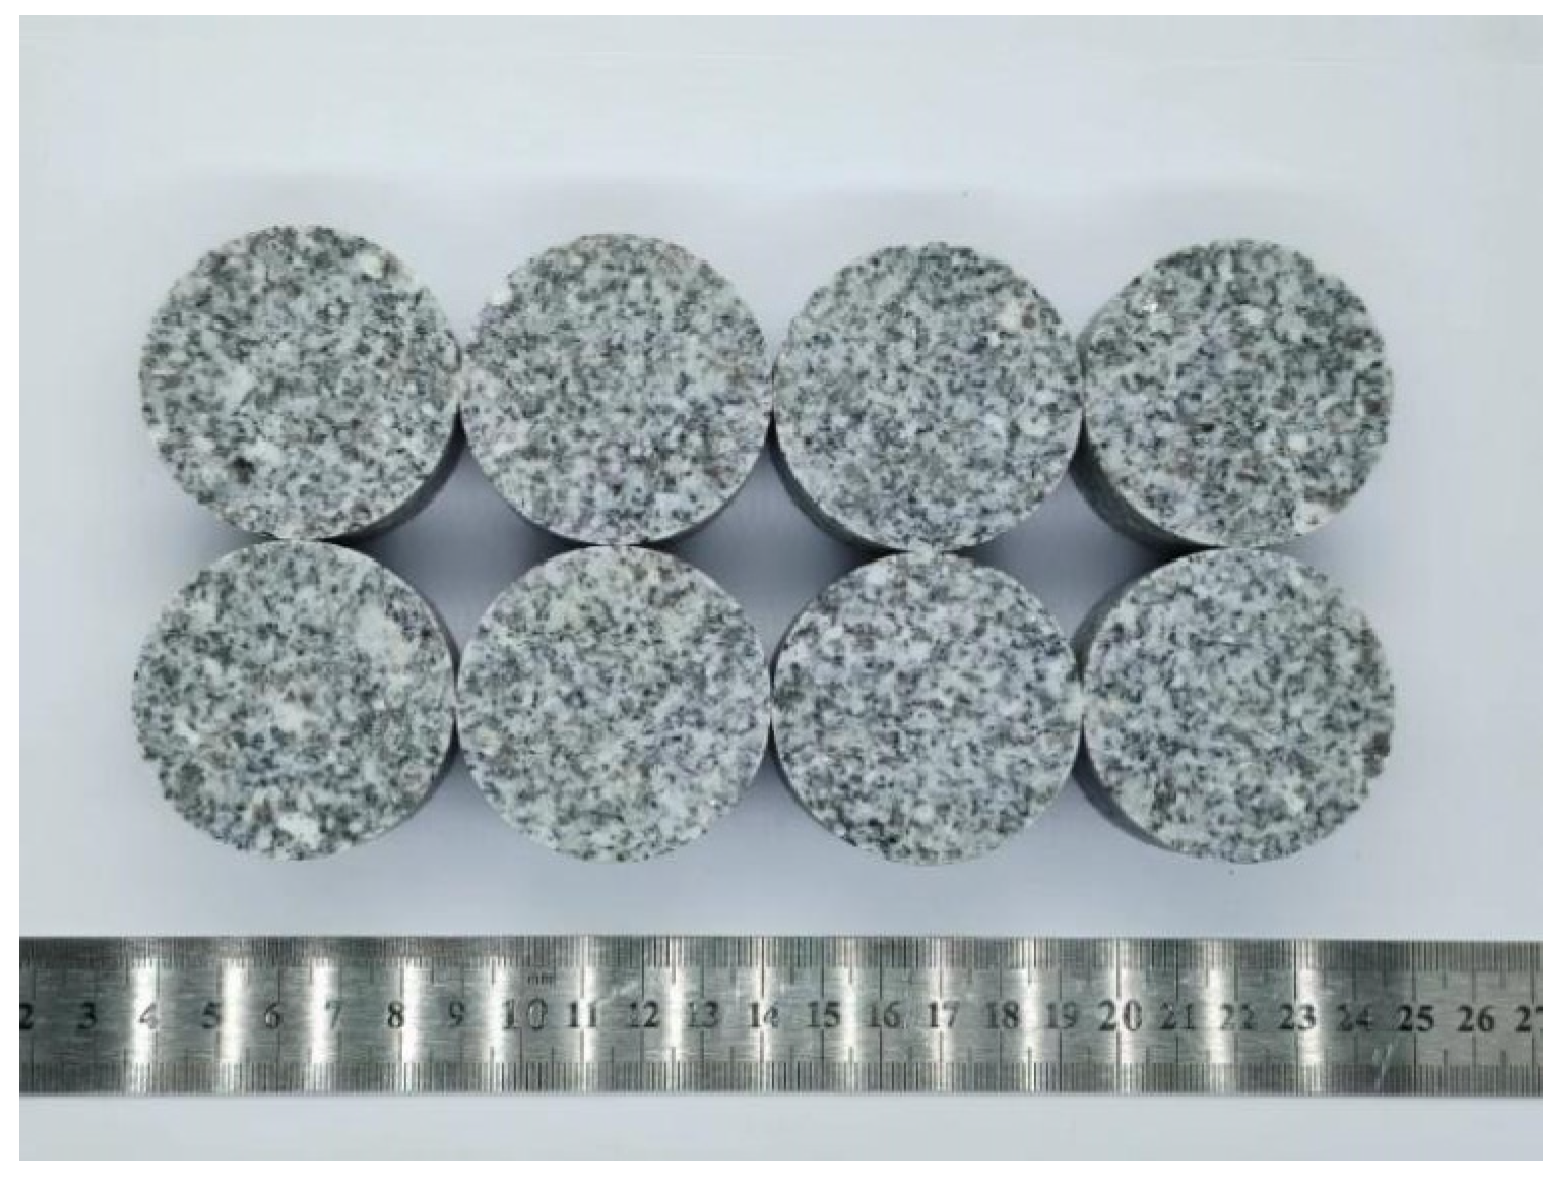
Figure 4. Image of the rock sample after processing.
Modelling 07 00102 g004
Figure 5. Loading of the specimen.
Modelling 07 00102 g005
Figure 6. Typical test waveform.
Modelling 07 00102 g006
Figure 7. Stress–Strain curves of rock under different loading rates.
Modelling 07 00102 g007
Figure 8. RHT constitutive model: (a) p − α EOS; and (b) stress limit surfaces and loading scenario.
Modelling 07 00102 g008
Figure 9. Initialisation of stress at different depths.
Modelling 07 00102 g009
Figure 10. Damage cloud diagram for a penetration depth of 10 m under a geostress of 0 MPa.
Modelling 07 00102 g010
Figure 11. Damage cloud diagram for a penetration depth of 15 m under a geostress of 0 MPa.
Modelling 07 00102 g011
Figure 12. Damage cloud diagram for a penetration depth of 20 m under a geostress of 0 MPa.
Modelling 07 00102 g012
Figure 13. Damage cloud diagrams following detonation at different depths at 0 MPa.
Modelling 07 00102 g013
Figure 14. Damage cloud diagrams following detonation at different depths at 10 MPa.
Modelling 07 00102 g014
Figure 15. Damage cloud diagrams following detonation at different depths under 20 MPa.
Modelling 07 00102 g015
Figure 16. Pressure curves for characteristic points at different depths under a geostress of 0 MPa. (a) Pressure contour plots for central feature points in models of different depths. (b) Pressure contour plots for boundary feature points in models of different depths.
Modelling 07 00102 g016
Figure 17. Pressure curves for characteristic points at different depths under a geostress of 10 MPa. (a) Pressure contour plots for central feature points in models of different depths. (b) Pressure contour plots for boundary feature points in models of different depths.
Modelling 07 00102 g017
Figure 18. Pressure curves for characteristic points at different depths under a geostress of 20 MPa. (a) Pressure contour plots for central feature points in models of different depths. (b) Pressure contour plots for boundary feature points in models of different depths.
Modelling 07 00102 g018
Figure 19. Pixel sampling method.
Modelling 07 00102 g019
Figure 20. Proportional distribution of damage zones at different depths under varying geostresses.
Modelling 07 00102 g020
Figure 21. Damage cloud diagrams at a depth of 10 m following detonation at different angles of inclination.
Modelling 07 00102 g021
Figure 22. Damage cloud diagrams at a depth of 15 m following detonation at different angles of inclination.
Modelling 07 00102 g022
Figure 23. Damage cloud diagrams at a depth of 20 m following detonation at different angles of inclination.
Modelling 07 00102 g023
Figure 24. Stress contour diagrams at a depth of 20 m corresponding to various inclination angles. (a) Stress contour plot at an inclination of 15°. (b) Stress contour plot at an inclination of 25°.
Modelling 07 00102 g024
Figure 25. Pressure curves for characteristic points at a depth of 10 m and 0 MPa following detonation at different angles of deviation. (a) Pressure curves for characteristic points in the center of the model at different angles of deviation. (b) Pressure curves for characteristic points at the boundary of the model at different angles of deviation.
Modelling 07 00102 g025
Figure 26. Pressure curves for characteristic points at a depth of 15 m and 0 MPa following detonation at different angles of deviation. (a) Pressure curves for characteristic points in the center of the model at different angles of deviation. (b) Pressure curves for characteristic points at the boundary of the model at different angles of deviation.
Modelling 07 00102 g026
Figure 27. Pressure curves for characteristic points at a depth of 20 m and 0 MPa following detonation at different angles of deviation. (a) Pressure curves for characteristic points in the center of the model at different angles of deviation. (b) Pressure curves for characteristic points at the boundary of the model at different angles of deviation.
Modelling 07 00102 g027
Figure 28. Damage cloud diagram for different geostress at a depth of 10 m and a dip angle of 25°.
Modelling 07 00102 g028
Figure 29. Damage cloud diagram for different geostress at a depth of 15 m and a dip angle of 25°.
Modelling 07 00102 g029
Figure 30. Damage cloud diagram for different geostress at a depth of 20 m and a dip angle of 25°.
Modelling 07 00102 g030
Figure 31. Scatter plot of peak compressive stresses under 0 MPa geostress.
Modelling 07 00102 g031
Figure 32. Scatter plot of peak compressive stresses under 10 MPa geostress.
Modelling 07 00102 g032
Figure 33. Scatter plot of peak compressive stresses under 20 MPa geostress.
Modelling 07 00102 g033
Figure 34. Average distribution of peak pressures at characteristic points under different geostresses.
Modelling 07 00102 g034
Table 1. Parameters of RHT model for rock [28].
ParameterValue
ρ0 (kg/m3)2600
G (GPa)28.7
fc (MPa)154
N0.697
βt0.0115
B01.68
B11.68
α01.0
T1 (GPa)30.64
Plock (GPa)6.0
Ft*0.08
Fs*0.40
A1 (GPa)30.64
A2 (GPa)51.47
A3 (GPa)31.46
Q00.6805
B0.01
EOC (s)3.0 × 10⁻⁵
EOT (s)3.0 × 10⁻⁶
A2.92
Pcrush (MPa)102
Gc0.4
Gt*0.7
XI0.5
D10.04
D21.0
βc0.0083
Af1.62
Nf0.6
NP3.0
Disclaimer/Publisher’s Note: The statements, opinions and data contained in all publications are solely those of the individual author(s) and contributor(s) and not of MDPI and/or the editor(s). MDPI and/or the editor(s) disclaim responsibility for any injury to people or property resulting from any ideas, methods, instructions or products referred to in the content.