
Article

Numerical Investigation of Masonry Walls Using Mega-Interlocking Concrete Blocks
Department of Civil and Environmental Engineering, University of Alberta, 9211-116 Street, Edmonton, AB T6G 1H9, Canada
*
Author to whom correspondence should be addressed.
Modelling 2026, 7(2), 66; https://doi.org/10.3390/modelling7020066
Submission received: 8 January 2026 / Revised: 15 February 2026 / Accepted: 10 March 2026 / Published: 29 March 2026
(This article belongs to the Section Modelling in Engineering Structures)

Abstract

Conventional concrete masonry construction consists of an assemblage of concrete blocks, mortar, grout, and steel reinforcement. While effective, this constructive method is constrained by its low productivity. In recent decades, advances in construction and manufacturing technologies now allow for the production of larger and more complex block typologies, enabling designers to reassess conventional designs to optimize structural performance and construction efficiency. As such, this study introduces the “mega-interlocking block”, a novel block that integrates the benefits of mega blocks (i.e., blocks with larger sizes) with a newly designed interlocking mechanism to enhance structural performance and expedite the construction of masonry walls in work sites where forklifts, scissor lifts and other smaller crane equipment are available. A numerical study was conducted to evaluate the in-plane (IP) and out-of-plane (OOP) behaviors of masonry walls constructed with mega-interlocking blocks, including both unreinforced masonry (URM) and reinforced masonry (RM) configurations, compared to standard block walls. A simplified micro-modeling approach was utilized to account for various possible failure modes associated with masonry structures. Results indicate that mega-interlocking blocks significantly improve wall stiffness and load-bearing capacity under IP loading, both with and without mortar, outperforming standard block walls. Under OOP loading, interlocking blocks provide moderate performance gains when mortar is present, though their effectiveness diminishes in mortarless configurations. For URM walls under IP loading, the implementation of mega-interlocking blocks yielded substantial improvements in stiffness and capacity, with the most notable benefits observed in walls with larger aspect ratios. Although the relative advantages in RM walls were less pronounced due to the homogenizing effects of grout and reinforcement, mega-interlocking blocks still demonstrated robust structural performance, making them a promising alternative to standard masonry units.

1. Introduction

Masonry walls are fundamental structural elements that resist both in-plane (IP) and out-of-plane (OOP) loads. Typically, masonry walls are assembled from units such as stones, clay bricks, or concrete blocks, which are bonded together with mortar. Modern masonry construction features steel reinforcement to enhance the tensile strength of the assembly and provide ductility. The physical characteristics of masonry units, such as material composition, strength, and geometry, play a crucial role in the IP and OOP behaviors of masonry walls [1].
The design of masonry units have evolved significantly over time, driven by the changing architectural trends and economic demands. In the late 19th and early 20th centuries, as the costs of traditional materials such as clay bricks and lumber increased, architects and builders sought more economical alternatives. Concrete blocks soon emerged as the predominant masonry unit due to their lower production costs, ease of use, and the ability to be mass-produced with standardized designs. One key feature of modern concrete blocks is their hollow-core design, typically produced using two-holed metallic molds. This configuration allows for the insertion of reinforcing steel bars, leading to the enhanced strength and stability of reinforced masonry structures. For instance, commonly used standard concrete blocks in the United States measure 406 × 203 × 203 mm (16 × 8 × 8 in.) [2], while in Canada, they typically measure 390 mm × 190 mm × 190 mm [3]. Both standard blocks include two hollow cavities designed to accommodate reinforcement. Internationally, similar modular concrete masonry units are used: in the United Kingdom, standard blocks measure 440 × 215 × 100 mm per BS EN 771-3 [4]; in Germany, 490 × 238 × 240 mm per DIN EN 771-3; in India, 390 × 190 × 200 mm per IS 2185-1 [5]; and in China and Japan, 390 × 190 × 190 mm per GB/T 8239 and JIS A 5406, respectively. The 390–400 × 190–200 × 190–200 mm modular format is the most globally prevalent.
With the advancement of construction and manufacturing technologies, such as robotics and additive manufacturing [6], new possibilities have emerged for the design and application of concrete blocks. However, current standard block designs, characterized by uniform dimensions and the absence of interlocking features, do not fully exploit these technological innovations. Advanced construction techniques now enable the production of more complex block typologies and significantly larger blocks, which are beyond the handling capabilities of traditional methods but can be efficiently managed through the use of forklifts, scissor lifts, and other relatively small crane equipment at worksites, while robotic arms can be used in offsite production facilities. These blocks offer substantial benefits in terms of construction efficiency and have great potential in enhancing the structural performance of masonry walls. For example, larger blocks could improve the construction efficiency by reducing the number of units required [7], and the integration of interlocking mechanisms can contribute to the structural integrity [8], while reducing the complexity of the traditional constructive process of masonry elements.
Despite the significant potential of larger block size in influencing the structural behavior of masonry structures, relevant research remains limited [9,10]. Chhetri and Feldman [9] investigated the impact of block geometry on the strength of masonry assemblies. The experimental results indicated that reducing the web geometry could yield several industry benefits, including lower transportation and construction costs, reduced construction time, a decreased likelihood of workplace injuries to masons, and potential for diversifying the masonry construction workforce. Yavartanoo et al. [10] explored the effects of block size on the IP behavior of masonry walls through a numerical parametric analysis, concluding that an increase in block size corresponded to greater IP initial stiffness.
In contrast to block size, interlocking mechanisms in masonry units have received more attention in the literature [11,12,13,14,15,16,17,18,19,20]. In conventional construction, mortar is used to reduce stress concentrations that would occur if the blocks are placed directly on top of another or next to each other in a dry connection; mortar also provides protection against environmental and insect attack. Construction with mortared masonry is time-consuming, however, and requires specialized workmanship. Properly designed mortarless masonry or dry-stack masonry offers an efficient way to reduce construction time—usually, this is done by incorporating interlocking systems using mechanical devices or using specialized block typologies. Thanoon et al. [11] developed several novel interlocking block masonry systems. A total of 21 different block models were investigated and analyzed in terms of weight, bearing and shear areas, shape, ease of production, ability to accommodate reinforcement, and efficiency of the interlocking mechanisms. Baneshi et al. [12] conducted an experimental study to examine the IP and OOP shear and flexural behaviors of small-scale masonry specimens constructed with interlocking blocks. Qu et al. [13] studied the OOP behavior of masonry walls built with interlocking compressed earth blocks, with test results demonstrating that these walls exhibited stable hysteretic behavior until ductile failure occurred. Kohail et al. [14] evaluated the cyclic IP behavior of shear walls built with interlocking concrete mortarless blocks. Afzal et al. [15] developed a sustainable interlocking burnt clay brick and compared the OOP performance of walls built with these interlocking bricks to those constructed with conventional bricks. The test results revealed that the interlocking burnt clay brick wall exhibited a 43% increase in OOP load capacity. Claudia et al. [16] investigated the torsion-shear behavior at the interfaces of rigid interlocking blocks in masonry assemblages through both numerical and experimental approaches. Thanoon et al. [17] also proposed a modeling strategy for simulating the interlocking mortarless block masonry system, accounting for key features such as geometric imperfection of shell beds, block interaction, progressive debonding between blocks and grouts, and material nonlinearity. Shuai et al. [18] explored the effects of axial compression load, horizontal steel bars, concrete tie columns, and mortar strength on the seismic behavior of interlocking concrete block walls. Shi et al. [19] conducted laboratory and numerical studies on the mechanical properties of a new type of interlocking brick, and the compressive strength of unit brick prisms is derived based on the fracture mechanics theory. Xie et al. [20] presented experimental and numerical studies on the cyclic behavior of mortarless interlocking brick masonry walls, showing that the interlocking brick walls exhibited good shear resistance and considerable deformation capability due to the inter-brick movement.
A review of the relevant literature reveals a significant gap in the understanding of the structural behavior of masonry walls constructed using larger blocks and/or interlocking blocks. Research on larger blocks is limited [9,10], and studies on interlocking blocks have primarily focused on small-scale masonry assemblages (e.g., prism, unit–mortar–unit assemblages) [11,12,16,17], or brick walls [15,19,20], with less attention given to concrete block masonry walls [17,18]. Moreover, the behavior of masonry walls built with larger blocks incorporating interlocking mechanisms has not been adequately compared with conventional masonry walls, despite the extensive research on the IP and OOP behaviors of conventional walls within the masonry research community [21,22,23,24,25,26].
To address this gap, this paper first introduces a new block as a potential alternative to the standard concrete block for masonry construction. This block, referred to as “mega-interlocking block”, combines the advantages of larger dimensions with newly developed interlocking mechanisms. The primary objective is to expedite the construction process, while maintaining or potentially improving the structural performance of masonry walls. To evaluate the effectiveness of mega-interlocking blocks, a comprehensive finite element (FE) study is performed. The structural performance of walls built using mega-interlocking blocks was compared to that of conventional masonry walls, including both unreinforced masonry (URM) and reinforced masonry (RM) walls. The numerical model employed in this study is developed based on the simplified micro-modeling strategy initially proposed by Page [27], in which individual masonry components are simulated explicitly. Although this technique is more computationally demanding than the macro-modeling strategy (e.g., fiber beam element model [28,29]), it was selected due to its ability to accurately capture the inherent heterogeneity of masonry structures and effectively model the complex failure mechanisms of masonry walls under various loading conditions.
To clearly delineate the contributions of this study, the key novelties are summarized as follows: (1) A new interlocking geometry is proposed that incorporates a dual-mechanism design prioritizing bed joint connections over head joints, informed by a systematic parametric investigation of joint contributions—this differs from existing designs (e.g., Hydraform, Putra Block [11], Versaloc) which typically employ uniform interlocking features. (2) The mega-block concept extends beyond simply scaling up unit size by combining larger dimensions with the tailored interlocking mechanism, thereby simultaneously reducing the number of weak interfaces and improving the structural quality of remaining joints. (3) This study provides the first systematic finite element comparison of standard, interlocking, and mega-interlocking blocks for full-scale masonry walls under both IP and OOP loading conditions—previous studies focused primarily on small-scale assemblages or single loading directions.
The remainder of this paper is structured as follows: Section 2 describes the finite element (FE) modeling strategy and its validation. Section 3 examines the influence of head and bed joints on the structural behavior of masonry walls, leading to the development of a novel interlocking mechanism. The structural performance of masonry walls constructed with these interlocking blocks is also analyzed. Section 4 introduces the proposed mega-interlocking block and investigates the behavior of associated masonry walls. Finally, Section 5 concludes the study with key findings and recommendations.

2. Finite Element Modeling and Validation

2.1. Simplified Micro-Modeling Strategy

The simplified micro-modeling approach initially proposed by Page [27] has been successfully used to predict the IP and/or OOP behavior of masonry walls, including URM walls [21,25,30,31] and RM walls [26]. In this strategy, mortar layers and block–mortar contacts are represented by zero-thickness interfaces (i.e., mortar joints), while blocks are modeled with expanded dimensions to maintain the overall geometry of the masonry wall. In this study, the finite element model is developed in the commercial FE package ABAQUS [32]. The mechanical behavior of mortar joints is simulated using a surface-based cohesive modeling technique. The elastic response of the joint interfaces follows a linear traction–separation law, as shown in Equation (1):
σ n σ s σ t = K n 0 0 0 K s 0 0 0 K t δ n δ s δ t
where σ is the traction stress, K is the stiffness, and δ is the separation. The subscripts n, s, and t denote the normal direction, the first shear direction, and the second shear direction, respectively of the mortar joints of the blocks. The stiffness of the mortar joint is derived from the moduli of elasticity of mortar and blocks, along with the thickness of the mortar, as shown in Equations (2) and (3) [33]:
K n = E u E m h m ( E u E m )
K s = K t = G u G m h m ( G u G m )
Here, Eu and Em are the elastic moduli of the blocks and mortar, respectively. Gu and Gm are the shear moduli of the blocks and mortar, respectively. hm is the mortar thickness.
After the initial elastic phase, cracks propagate when the damage initiation criterion is satisfied. This criterion is defined by the shear and tensile strength of the masonry joints and is modeled using a quadratic stress formulation. The criterion is satisfied when the quadratic stress ratios reach unity, effectively predicting mixed-mode loading damage, as expressed in Equation (4):
σ n σ n max 2 + σ s σ s max 2 + σ t σ t max 2 = 1
where σ n max , σ s max , and σ t max are the maximum allowable stresses in the normal direction, the first shear direction, and the second shear direction, respectively. The Macaulay bracket excludes compressive stresses in the normal direction. Tensile cracking is governed by the joints’ tensile strength, while critical shear stress is described by the Mohr–Coulomb failure criterion, as given in Equation (5):
σ s max = σ t max = c × ( 1 D ) + σ n × μ × D
where c and μ denote the cohesion and frictional coefficient, respectively. The damage evolution variable D characterizes the continuity of traction stresses following the initiation of damage. In this study, the evolution of D is defined as a function of the separation, as expressed in Equation (6):
D = δ e f f f ( δ e f f max δ e f f 0 ) δ e f f max ( δ e f f f δ e f f 0 )
where δ e f f max represents the maximum separation reached during the loading history, and δ e f f f and δ e f f 0 are the effective separations at complete failure and at the onset of damage, respectively. δ e f f f is defined in Equation (7):
δ e f f f = 2 G T C t e f f 0
The critical mixed-mode fracture energy G T C is calculated using the Benzeggagh-Kenane (BK) law, as shown in Equation (8). This law is particularly suitable for cases where the critical shear fracture energies (modes II and III) are equal [30].
G T C = G I C + ( G I I C G I C ) G I I + G I I I G I + G I I + G I I I η
In the BK law, the exponent η is assigned a value of 2, reflecting the assumption of brittle behavior in mortar joints, as noted in [34]. G I C and G I I C represent the critical fracture energies in the normal and shear directions, respectively. It should be noted that this value was originally calibrated from composite delamination tests [34,35] and has not been independently validated for masonry mortar interfaces [36]. However, a sensitivity analysis conducted in this study showed that varying η between 1.0 and 3.0 produced less than 3% variation in peak load predictions, as the dominant failure modes are primarily governed by Mode II fracture energy and compressive strength rather than the mixed-mode interaction exponent.
In addition to the mortar joints, the Concrete damage plasticity (CDP) model [37] is adopted to simulate the nonlinear behavior (i.e., tensile cracking, compressive crushing) of units and grout, as it is widely used for the computational modeling of quasi-brittle materials [25,26,38].
The masonry units are modeled with their actual geometry, including the external interlocking features and the internal hollow cavities, which are explicitly represented as geometric voids with no material assigned. For RM walls, the grouted cores are explicitly modeled as filled regions with grout material properties.

Concrete Damage Plasticity Model Parameters

The CDP model in ABAQUS requires five plasticity parameters and the definitions of uniaxial tension and compression constitutive laws. The dilation angle (ψ = 36°), the eccentricity (e = 0.1), biaxial-to-uniaxial compressive strength ratio (fb0/fc0 = 1.16), stress invariant ratio (K = 0.667), and viscosity parameter (μ = 0.0002) follow the widely adopted default values [37,39].
For the tension softening law, the fracture-energy-based stress–displacement approach is employed using the exponential Hordijk curve, ensuring mesh-objective results by automatically scaling the softening response with the characteristic element length. This follows the crack band theory of Bažant and Oh [40] and has been validated for masonry by Rainone et al. [39]. The tensile fracture energy is estimated as Gft ≈ 0.029 × fc (N/mm) [33]. The compression hardening follows a parabolic stress–strain relationship, with compressive fracture energy Gfc ≈ 1.6 × fc (N/mm) [33].
The masonry units and grout are discretized using 8-node solid elements with full integration (C3D8). A characteristic element size of 15–20 mm is adopted. To verify mesh objectivity, a sensitivity study was conducted using three mesh densities (coarse: ~25 mm, medium: ~15 mm, fine: ~10 mm) for a representative wall case. The load–displacement responses converged with the medium mesh. The Newton–Raphson solver with automatic stabilization is used, with the viscosity parameter of 0.0002 verified to not significantly affect results (less than 2% difference compared with μ = 0). A typical wall analysis requires approximately 2–8 h on a standard workstation (Intel i7, 32 GB RAM; University of Alberta, Edmonton, AB, Canada), depending on wall size and configuration.

2.2. Finite Element Validation

To comprehensively evaluate the modeling strategy discussed previously, four validation examples are presented: two URM walls and two RM walls, each subjected to IP and OOP loadings, respectively. The units and grout are modeled using 8-node solid elements with full integration (C3D8). The mechanical behavior of mortar joints is represented using contact-based cohesive surfaces as detailed earlier. The four validation cases were selected to cover the primary failure modes expected in the parametric study: (i) IP diagonal shear cracking (da Porto wall, AR ≈ 1.3), (ii) OOP flexural failure (Vaculik wall), (iii) IP shear in RM (Hoque wall), and (iv) OOP flexural-compression in RM (Mohsin wall). For each validation example, material parameters were obtained from: (1) experimental reference papers, (2) companion FE studies, or (3) established empirical relationships. The assumption ft = 15% fc is supported by ACI 318 [41] (ft = 0.56 f c , yielding 12–15% for fc = 15–20 MPa), EN 1992-1-1 [42] (fctm = 0.30 × fck(2/3), yielding 11–13%), and Lourenço [33] (ft/fc = 12.5–25%). No iterative calibration was performed.

2.2.1. URM Walls

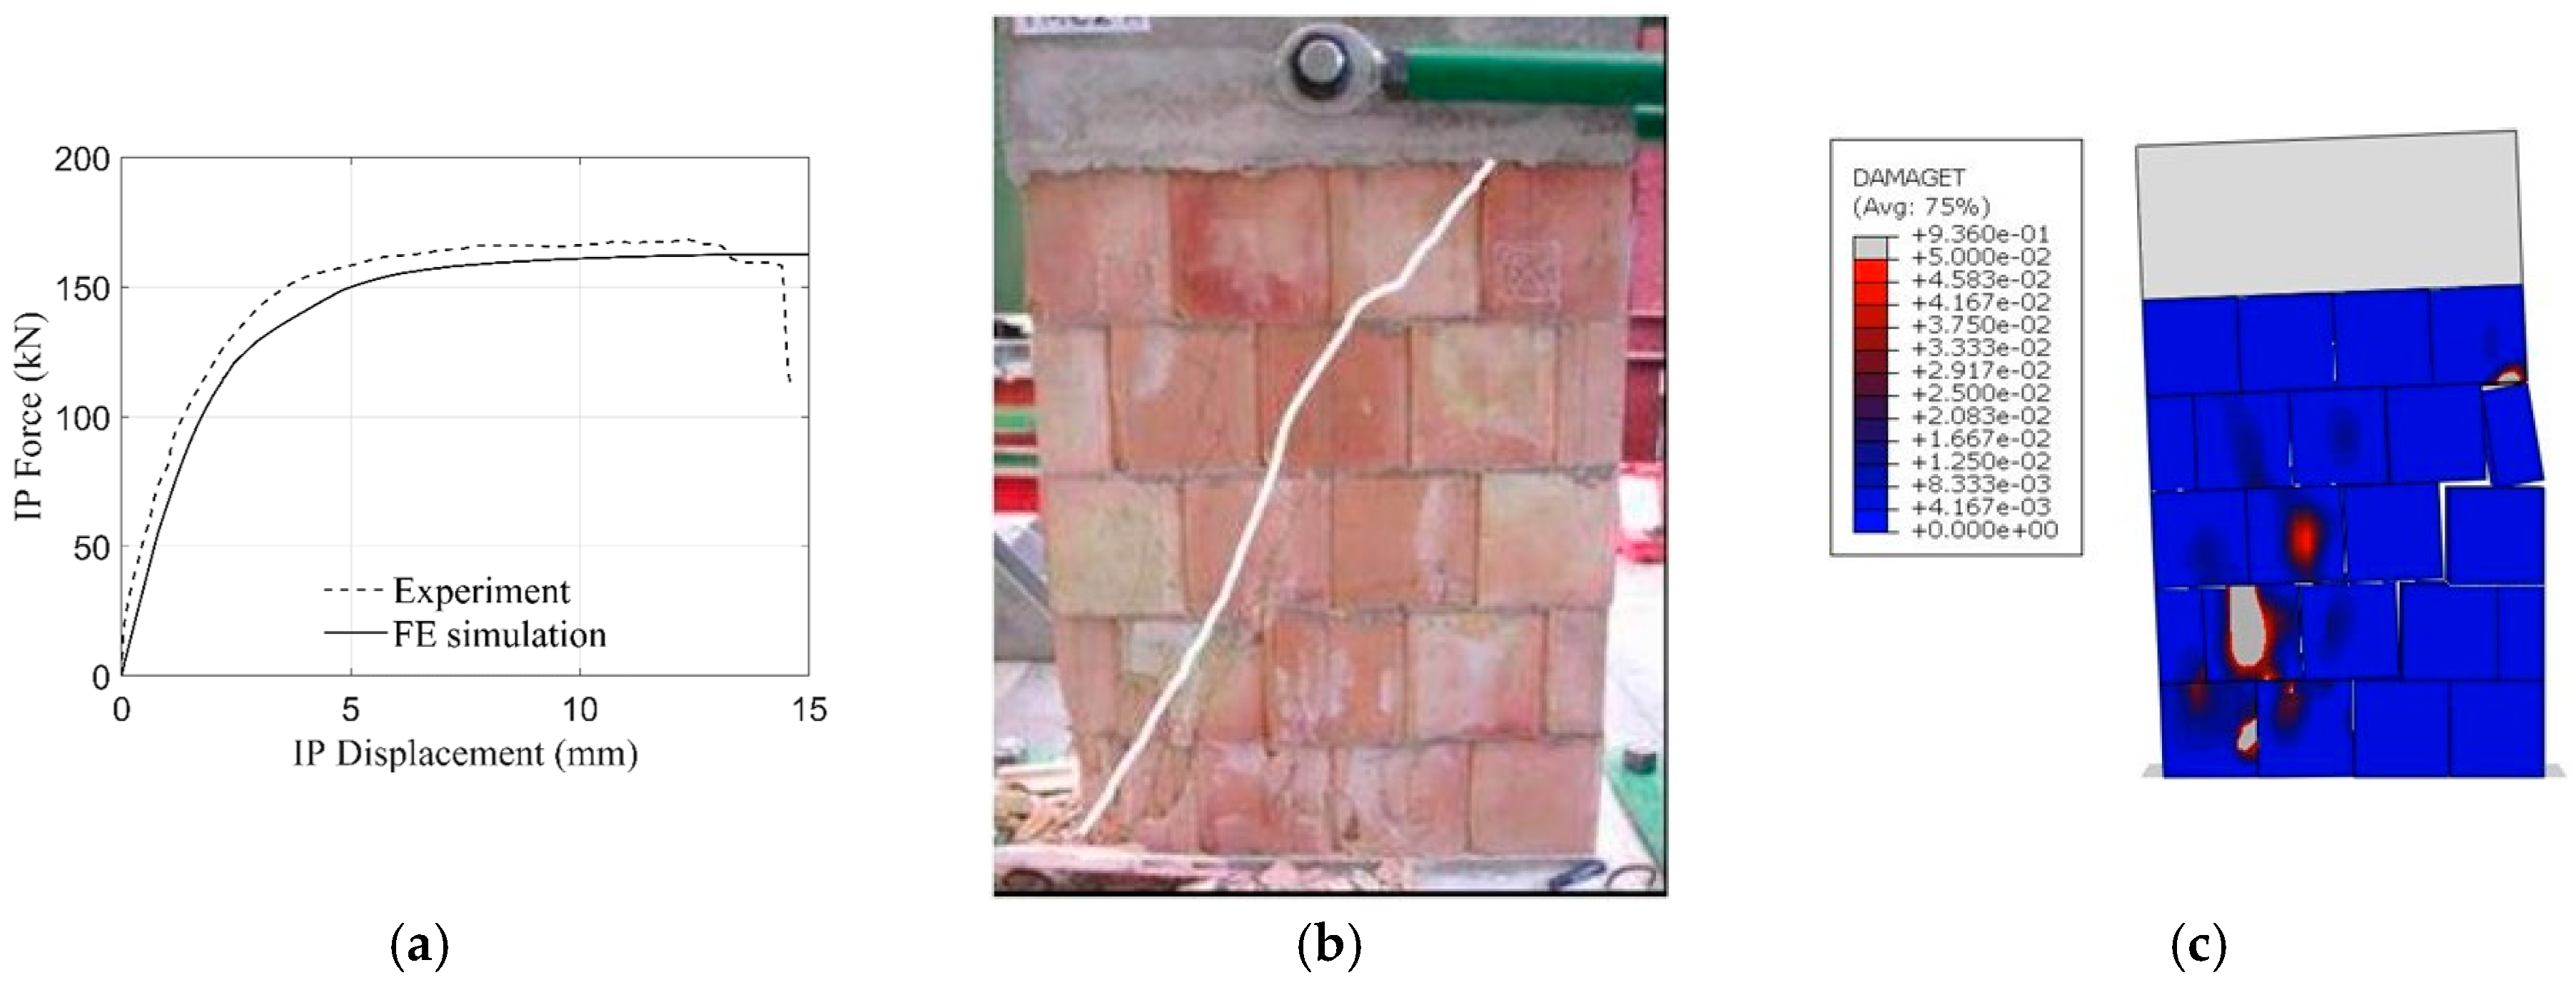
The URM wall under IP loading validated here was tested by da Porto [43]. The wall was constructed using perforated clay bricks, each with dimensions of 984 mm in length, 1250 mm in height, and 300 mm in thickness. The clay blocks had overall dimensions of 240 mm × 250 mm × 300 mm. Initially, the wall was subjected to a pre-compression load of 1.90 MPa. This pre-compression value was directly adopted from the experimental test [43], representing approximately 10% of the masonry compressive strength, within the moderate range (0.25–2.5 MPa) used in masonry shear wall testing [44,45]. Subsequently, a displacement-controlled IP load was applied incrementally until failure. Regarding the material parameter required in the FE simulation, the compressive strength and tensile strength of brick units were 20.43 MPa and 1.391 MPa, respectively, as reported in [43]. The parameters of contact-based cohesive surfaces were obtained directly from the FE study [46] by the same author, as detailed in Table 1.
The simulated load–displacement curve is compared with the experimental result in Figure 1a. The FE model accurately reproduced the experimental IP capacity, with the simulated capacity of 162.5 kN closely matching the experimental value of 168.05 kN. Figure 1b,c present a comparison of the observed damage patterns from the experimental test and the FE simulation. The experimental failure mode, characterized by the diagonal crack, and highlighted by the white line in Figure 1b [43], is also well-captured by the FE simulation, as shown in Figure 1c.
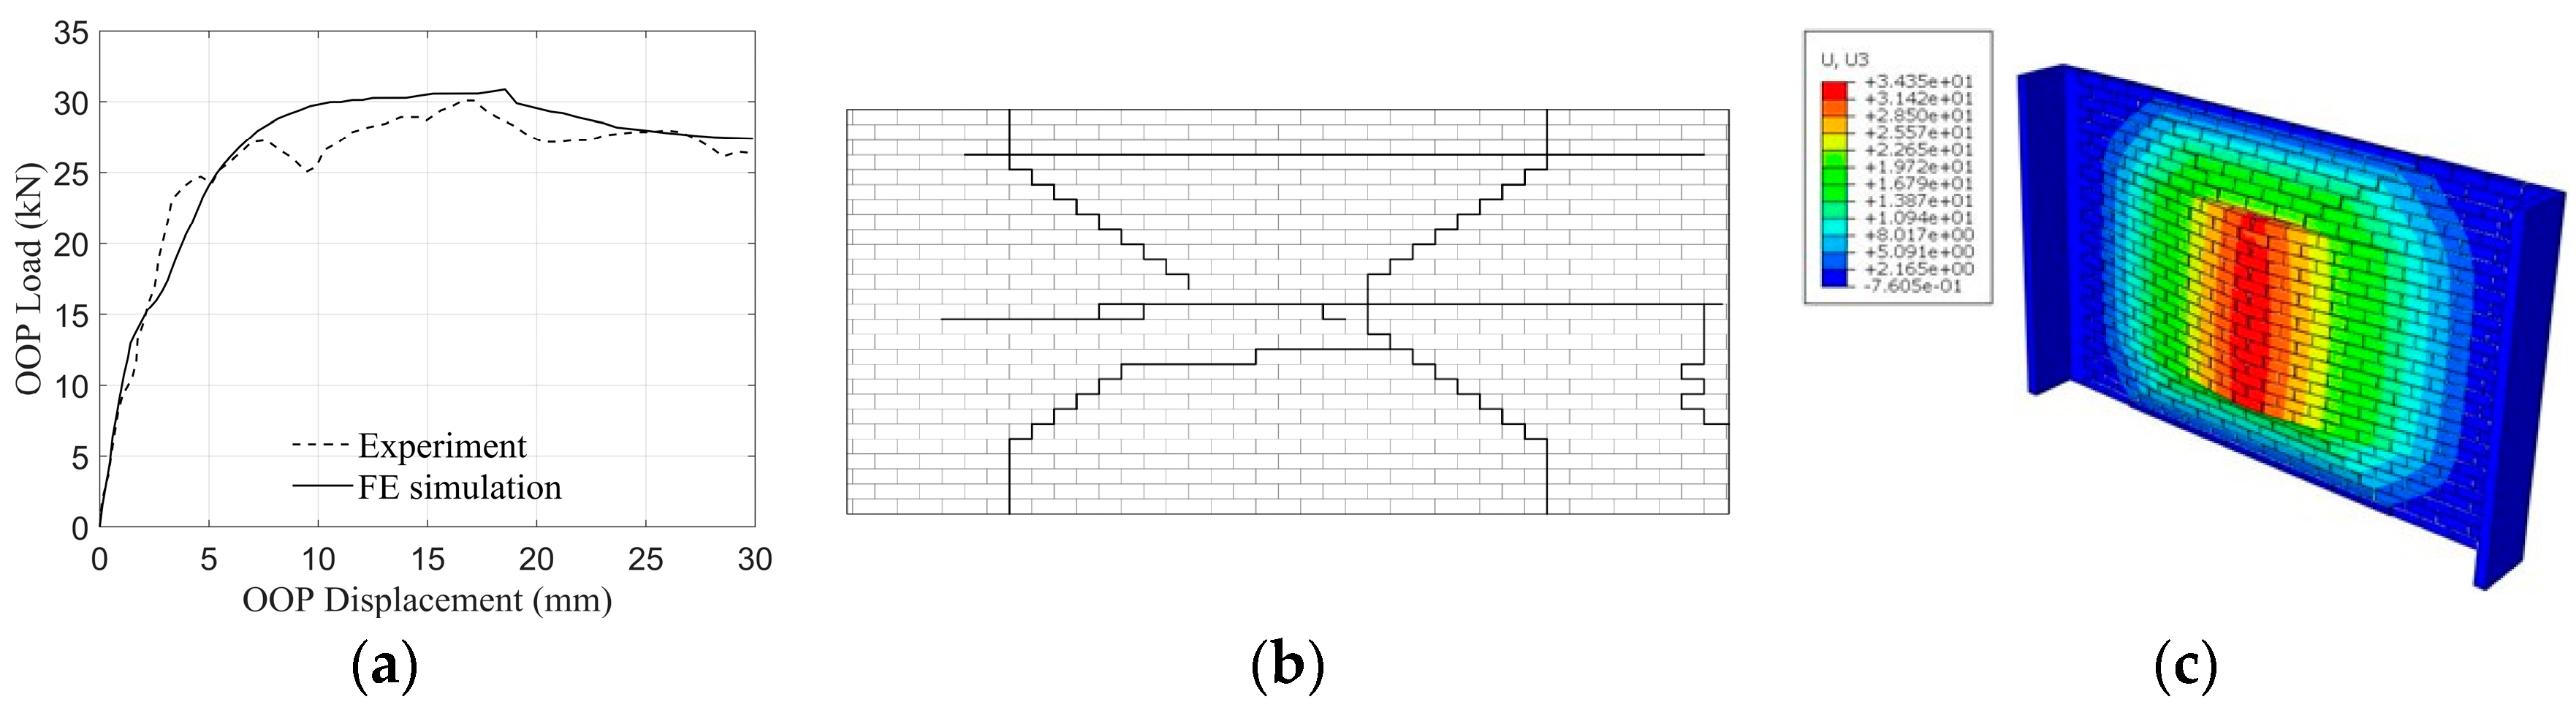
The URM wall subjected to OOP loading was selected from the experimental test reported in [47]. The wall was constructed using a half-overlap stretcher bond. The main section forming the webs measuring 4 m in length and 2.5 m in height, while the return walls forming the flanges were 0.45 m in length and 2.5 m in height. The wall was built using bricks with dimensions of 230 mm in length, 76 mm in height, and 110 mm in thickness, along with 10 mm thick mortar joints. The top and bottom edges of the wall were simply supported, while the left and right sides were fixed. The compressive strength of the brick units was reported as 16 MPa according to the experimental study [47]. Since the tensile strength of the brick units was not explicitly provided, it was assumed to be 15% of the compressive strength, as justified by ACI 318 [41], EN 1992-1-1 [42], and Lourenço [33]. The mechanical properties of mortar joints were derived from [30] in which the same URM wall was simulated, as summarized in Table 1.
Figure 2 presents the load–displacement curve obtained by the FE simulations and the experimental test. The results demonstrate good agreement in terms of the OOP capacity, with the experimental test showing a capacity of 30 kN and the FE simulation showing 31 kN. According to the experimental test [30], the failure mode was characterized by the development of horizontal cracks at the mid-height of the inner wall and stepped diagonal cracks extending from the center to the corners on the inner surface of the main wall, as depicted in Figure 2b. This failure pattern is also accurately captured in the numerical model shown in Figure 2c.

2.2.2. RM Walls

The capability of the simplified micro-modeling strategy to simulate the IP behavior of RM walls is validated using the experimental test conducted in [48]. The tested RM wall measured 1800 mm in height, 1800 mm in length, and 190 mm in thickness. It was constructed using Canadian standard concrete blocks with dimensions of 390 mm × 190 mm × 190 mm. Three 15M vertical reinforcing bars were spaced 800 mm on center, with only the reinforced cores filled with grout. Additionally, horizontal bed joint reinforcement consisted of hot-dipped galvanized wire in a ladder configuration, positioned every 400 mm. The tested wall was subjected to a pre-compression stress of 1.0 MPa.
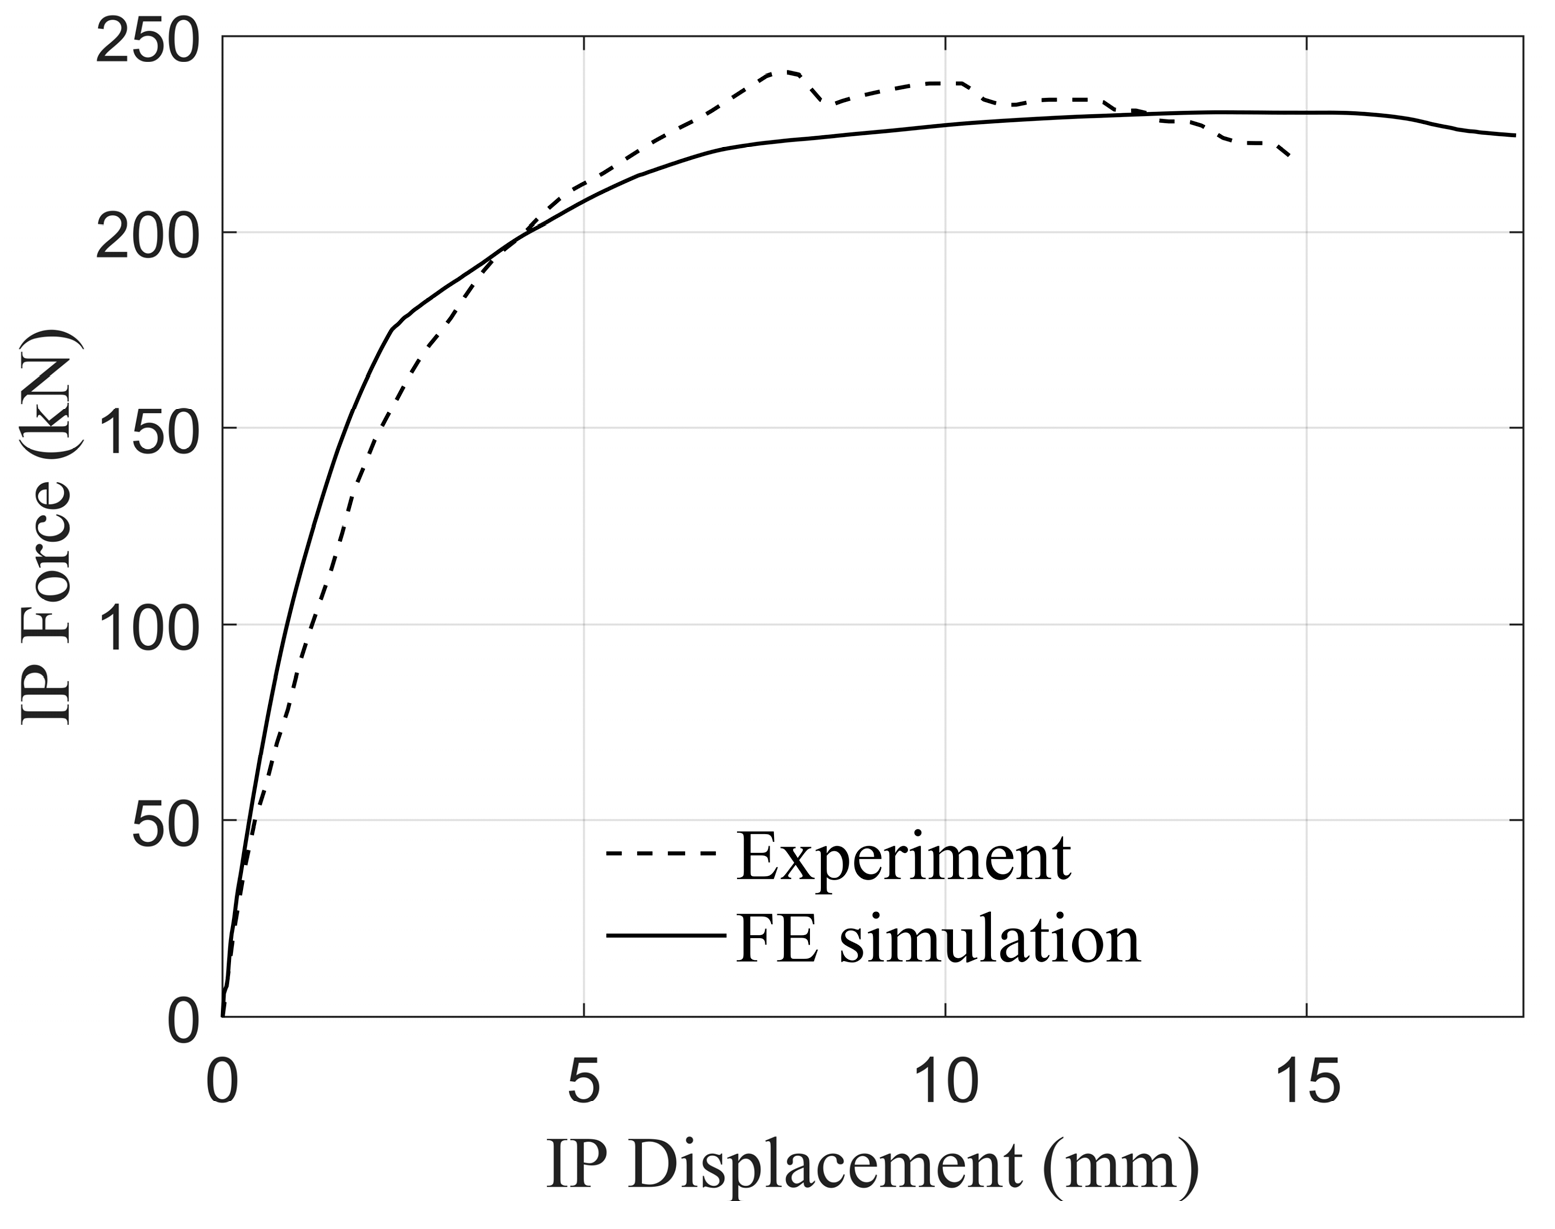
Similarly to the URM cases, the concrete blocks and grout are modeled using the C3D8 element. The vertical and horizontal reinforcing bars are represented with a 2-node linear 3D truss element (T3D2). The steel bars are embedded within both the grout and the bottom steel beam, with a perfect bond assumed between the grout and blocks, following the methodology suggested in [49]. According to the experimental results, the compressive strengths of concrete blocks and grout are determined as 16.5 MPa and 30.1 MPa, respectively. The tensile strengths of concrete and grout are assumed to be 15% of their compressive strengths. The yield strengths of the vertical and horizontal steel bars are 400 and 520.8 MPa, respectively. Due to the lack of experimental data reported in the study, the material parameters of mortar joints are assumed to be same as those in the URM walls under IP loading, as previously presented in Table 1. The numerical-experimental comparison in terms of the load–displacement curve is shown in Figure 3. The FE model accurately replicates the experimental test in terms of initial stiffness, with a close correlation IP capacity, i.e., 230 kN for the FE simulation and 242 kN for the experimental test. The assumption of assuming mortar joint properties of RM walls as URM walls represents a simplification, as mortar properties can differ between URM and RM systems. However, the good FE-experimental agreement confirms that grout and reinforcement dominate RM response, consistent with Bolhassani et al. [50].
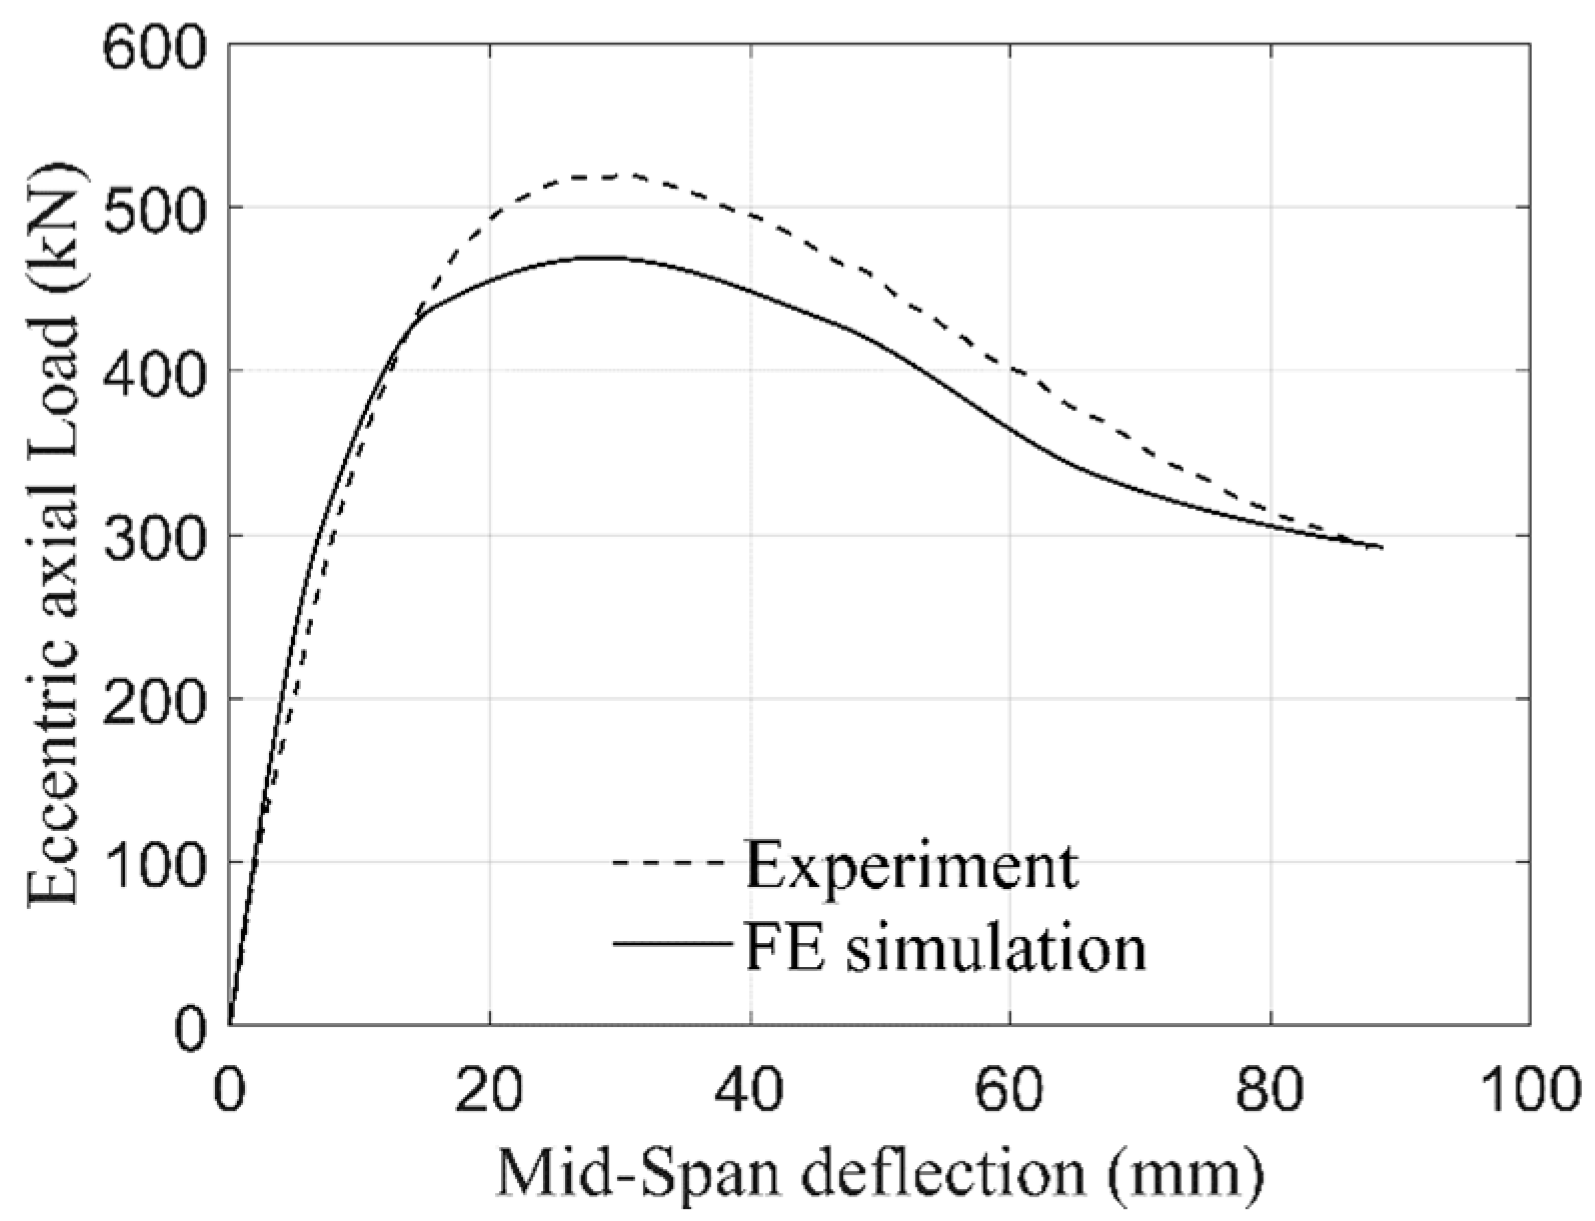
The validation example of an RM wall under OOP loading was experimentally investigated in [51]. The wall had dimensions of 1200 mm in length, 5000 mm in height, and 190 mm in thickness. It was partially grouted and reinforced two 15M vertical reinforcing bars spaced 600 mm on center. Horizontal bed joint reinforcement, consisting of No. 9 gauge wire in a ladder configuration, was placed every 400 mm. The bottom of the wall was pinned, and an eccentric load with an eccentricity equal to one-third of the block’s width (63 mm) was applied at the top. According to the experimental study [51], the compressive strengths of concrete blocks and grout were 15 MPa and 32.43 MPa, respectively. Due to the lack of experimental information, the yield strengths for vertical and horizontal bars are assumed to be 450 MPa and 520.8 MPa, respectively, identical to the RM wall under IP loading. The material parameters of mortar joints are assumed to be same as those in the URM wall subjected to OOP loading shown in Table 1.
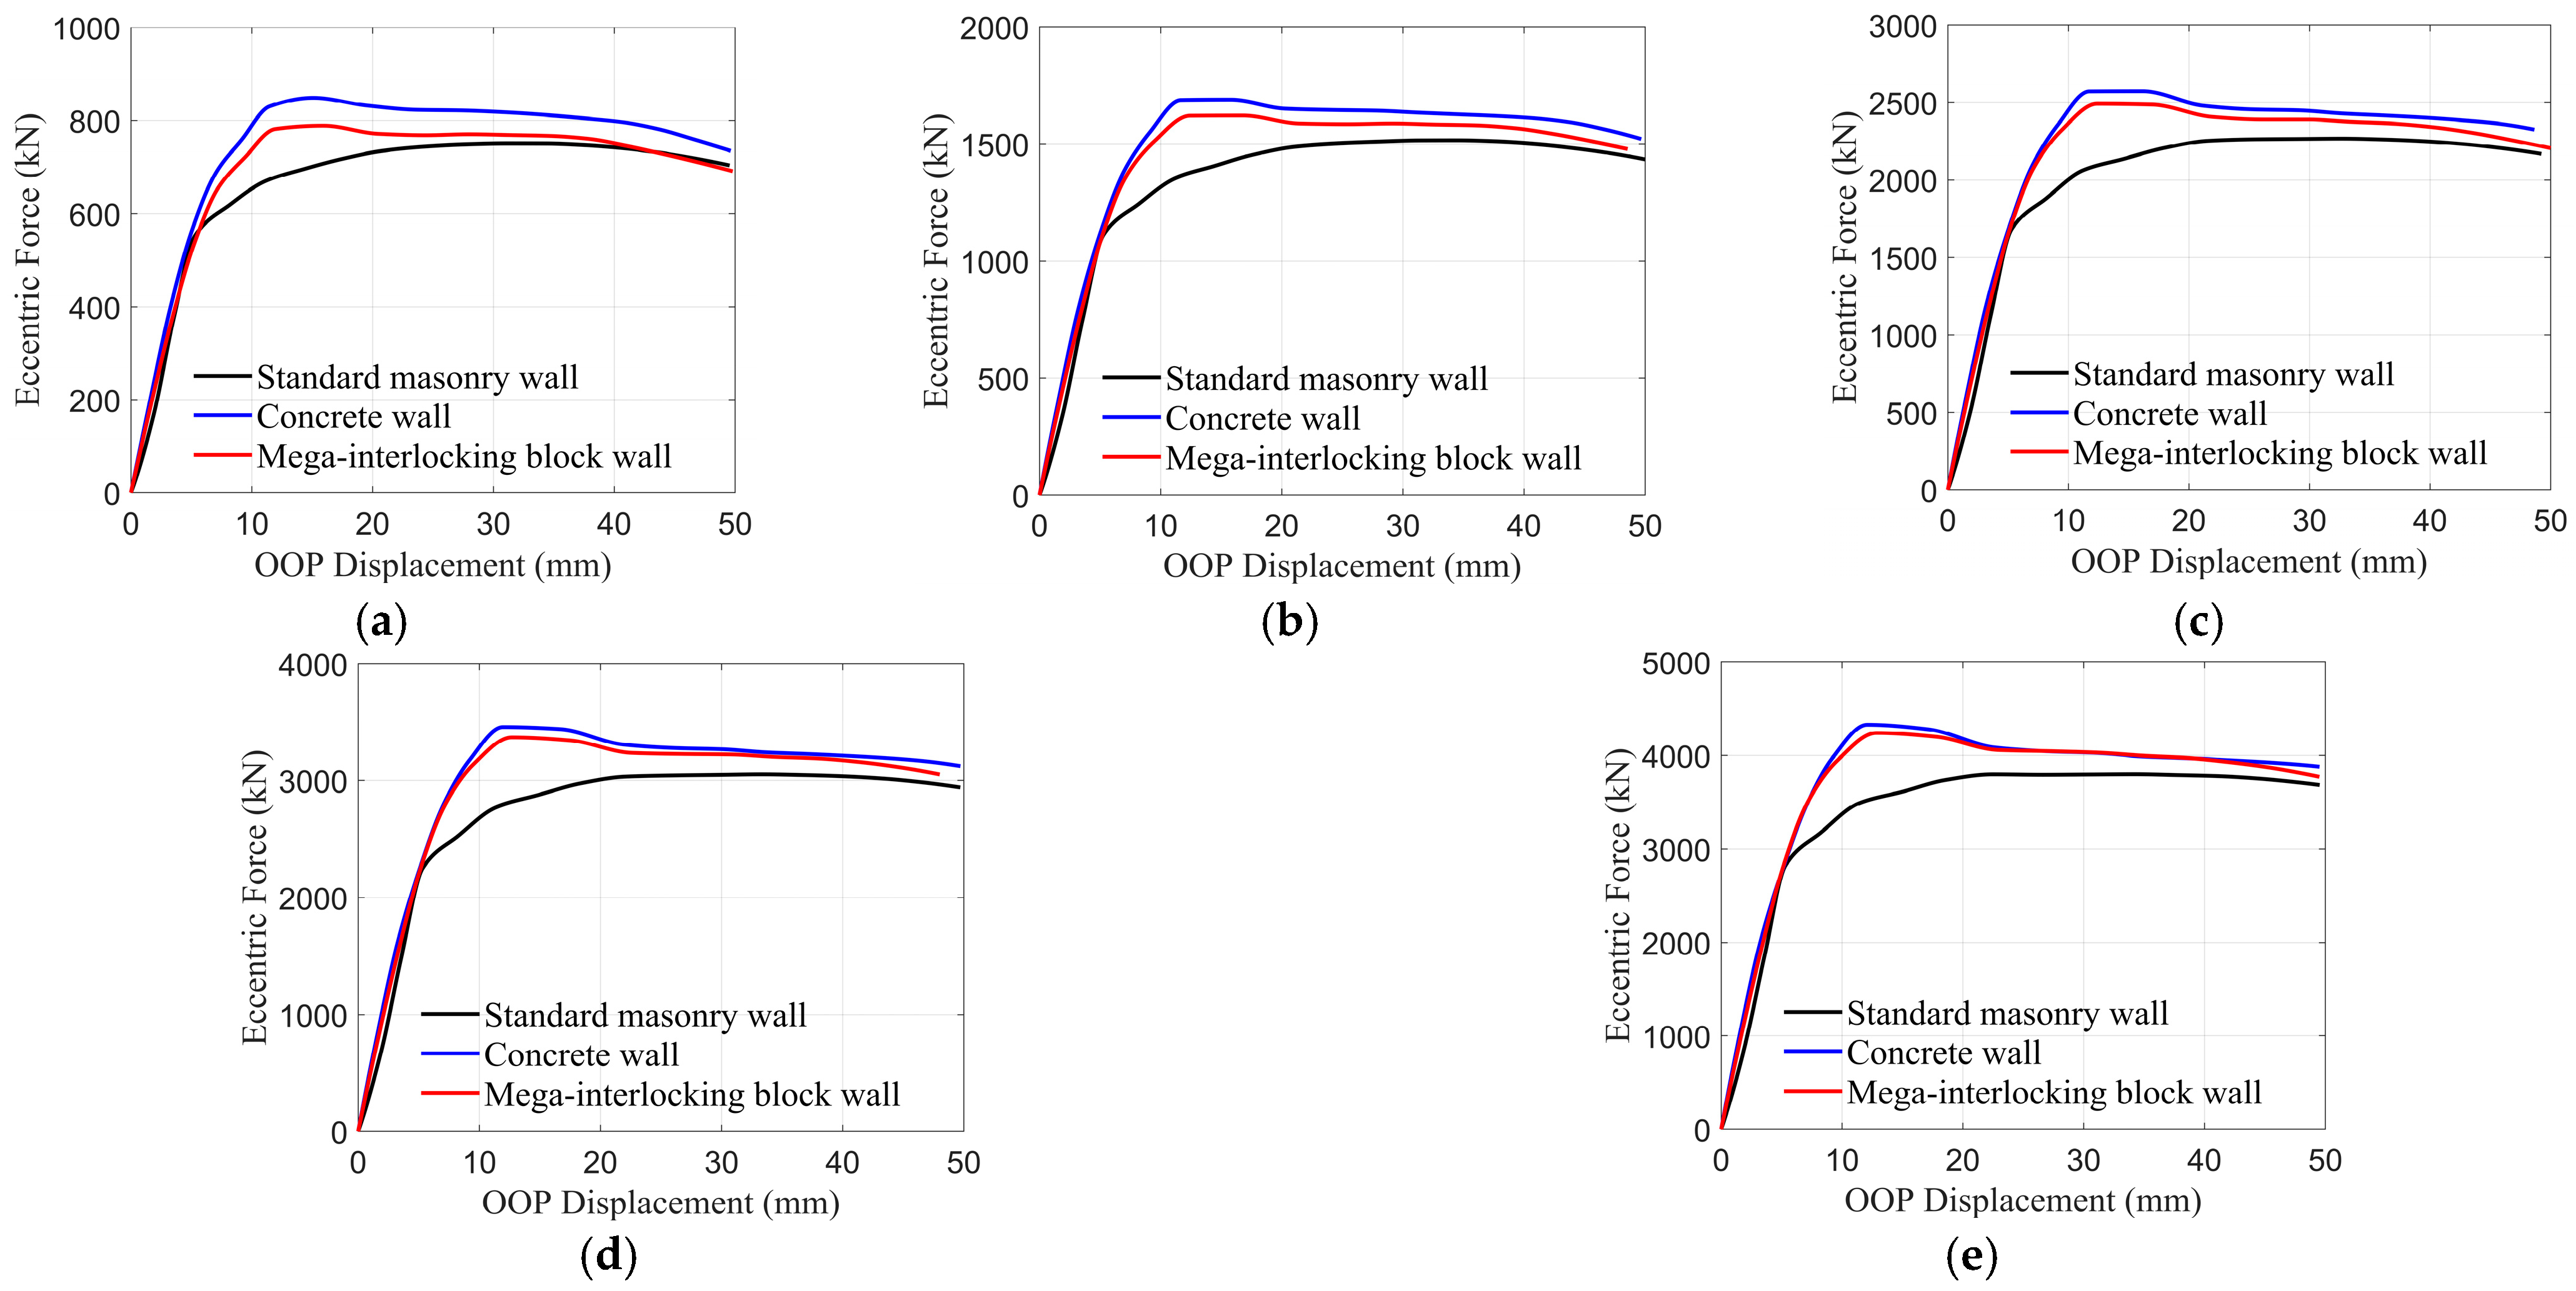
The results from the FE simulation are compared with experimental outcomes, as shown in the load–displacement curves in Figure 4. The FE model closely matches the experimental results in terms of initial stiffness. However, a slight discrepancy is observed in the OOP capacity, with the experimental test recording a capacity of 514.2 kN, while the FE predicted capacity is 490 kN. This discrepancy may be attributed to the use of the average compressive strength of the grout (i.e., 32.43 MPa) in the FE model. However, the tested compressive strength for the grout ranged from 26.4 to 38 MPa, suggesting that the actual grout strength in the experimental test may have been higher.

3. Interlocking Block

Masonry construction differs fundamentally from concrete wall construction, which forms a monolithic structure. The use of mortar in masonry not only distinguishes it from concrete but also plays a critical role in the structural behavior of masonry walls. Notably, the failures of masonry walls often initiate at the mortar joints [21]. The separation or weakening of these joints is a critical point of concern, highlighting the inherent vulnerability of the conventional masonry assembly methods. The vulnerability underscores the need to explore methods for enhancing unit cohesion within masonry walls. Prominent approaches include improving the cohesive properties of mortar, incorporating reinforcement, and integrating structural ties. Of particular relevance to this study is the development of interlocking mechanisms, which offer a promising alternative to traditional masonry techniques. These mechanisms have the potential to reduce or even eliminate the reliance on mortar for structural integrity, thereby addressing the shortcomings of conventional construction while introducing a novel pathway for improving the performance of masonry walls.
This section presents the systematic development through a stepwise approach: the relative contributions of bed and head joints are quantified (Section 3.1) to establish design priorities; a new interlocking geometry is introduced (Section 3.2); and structural performance is evaluated (Section 3.3). This intermediate step is essential to isolate the individual contributions of the interlocking mechanism and block size scaling (Section 4).

3.1. Effects of Head and Bed Joints

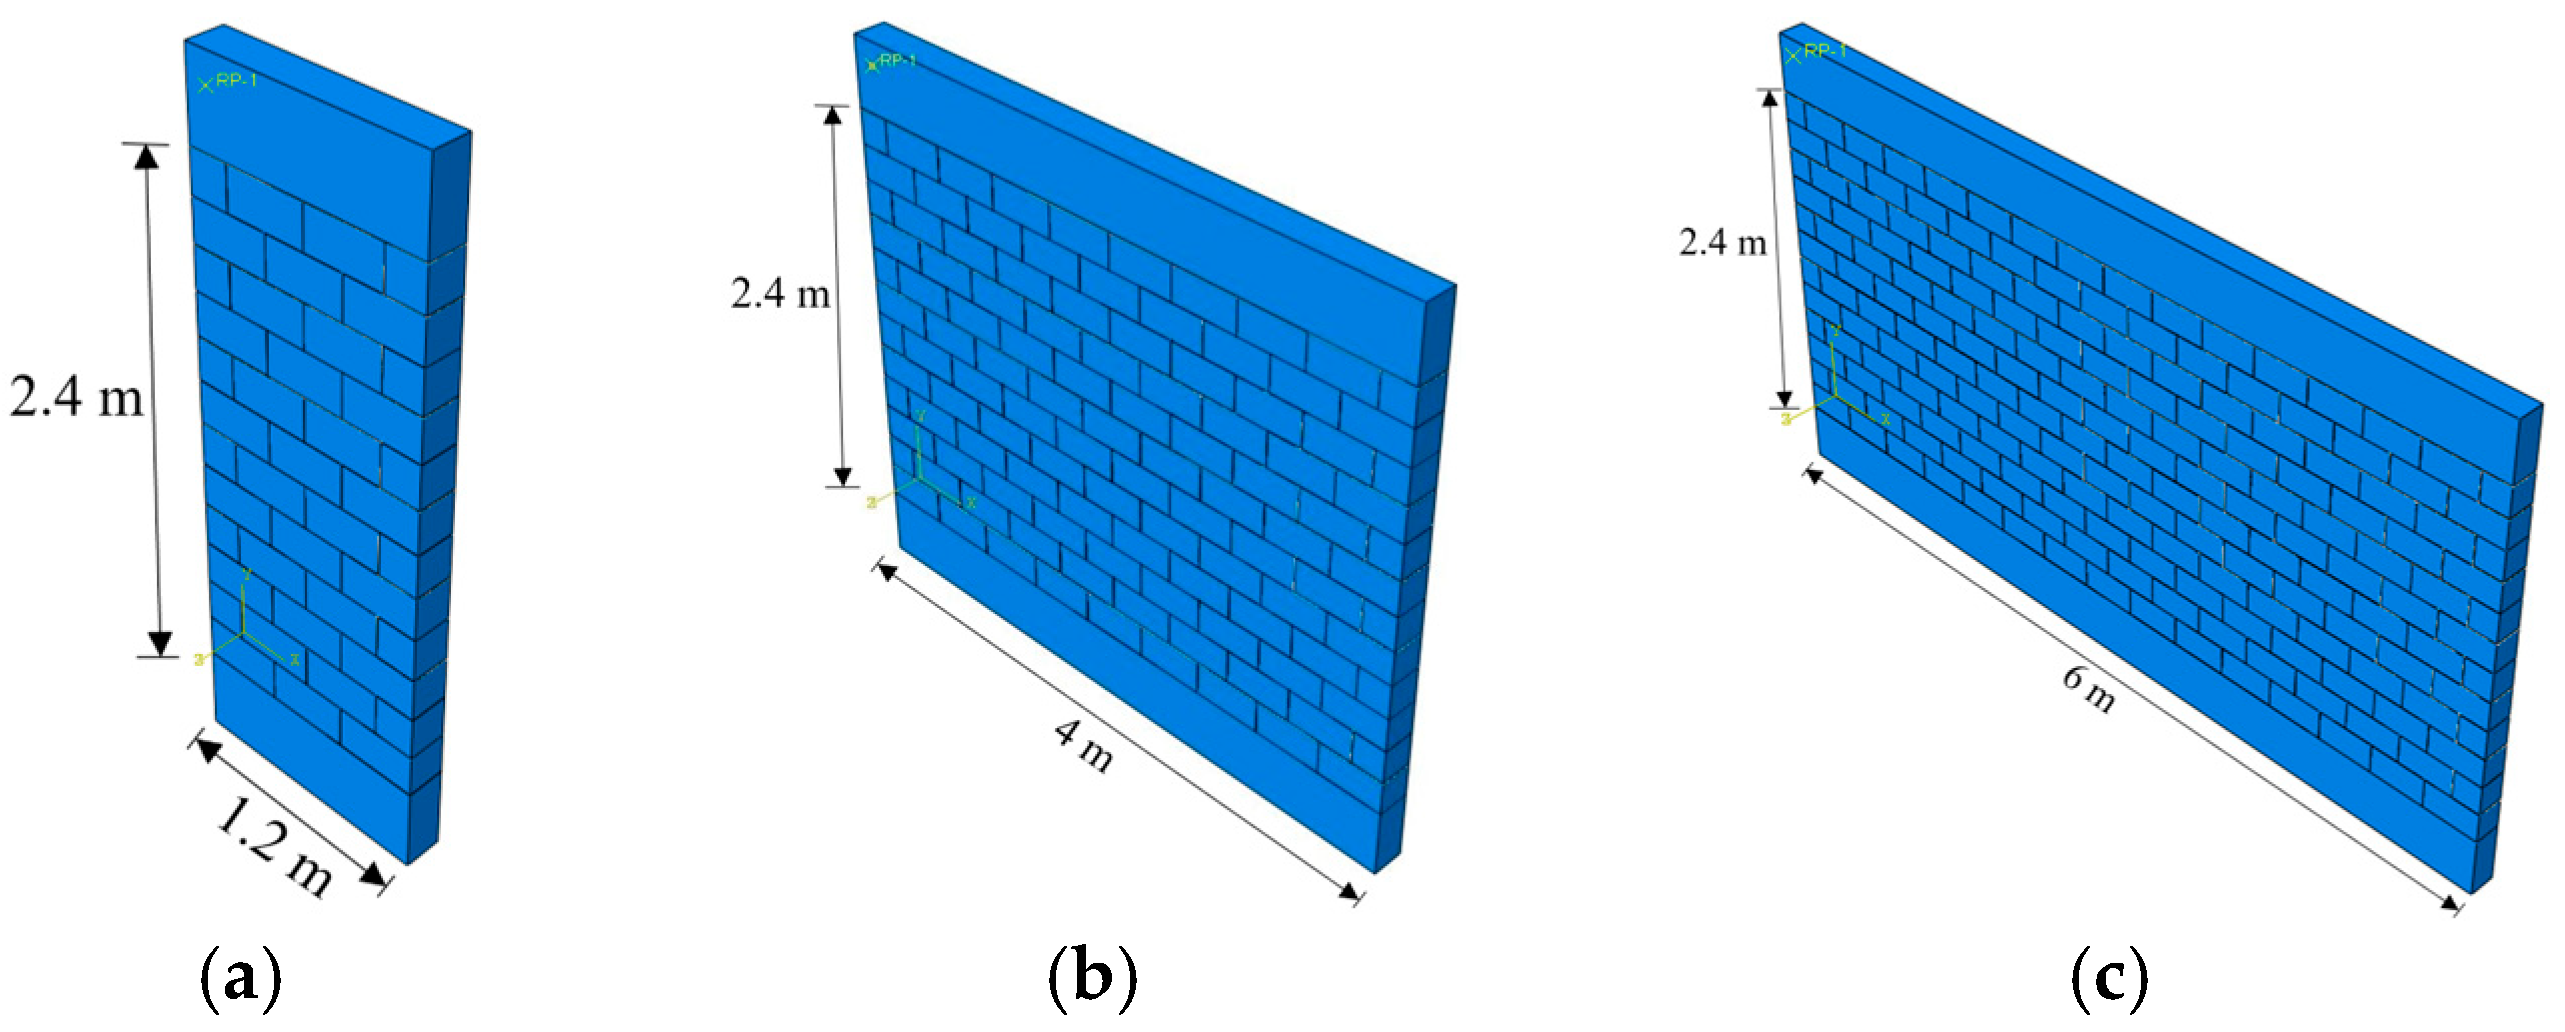
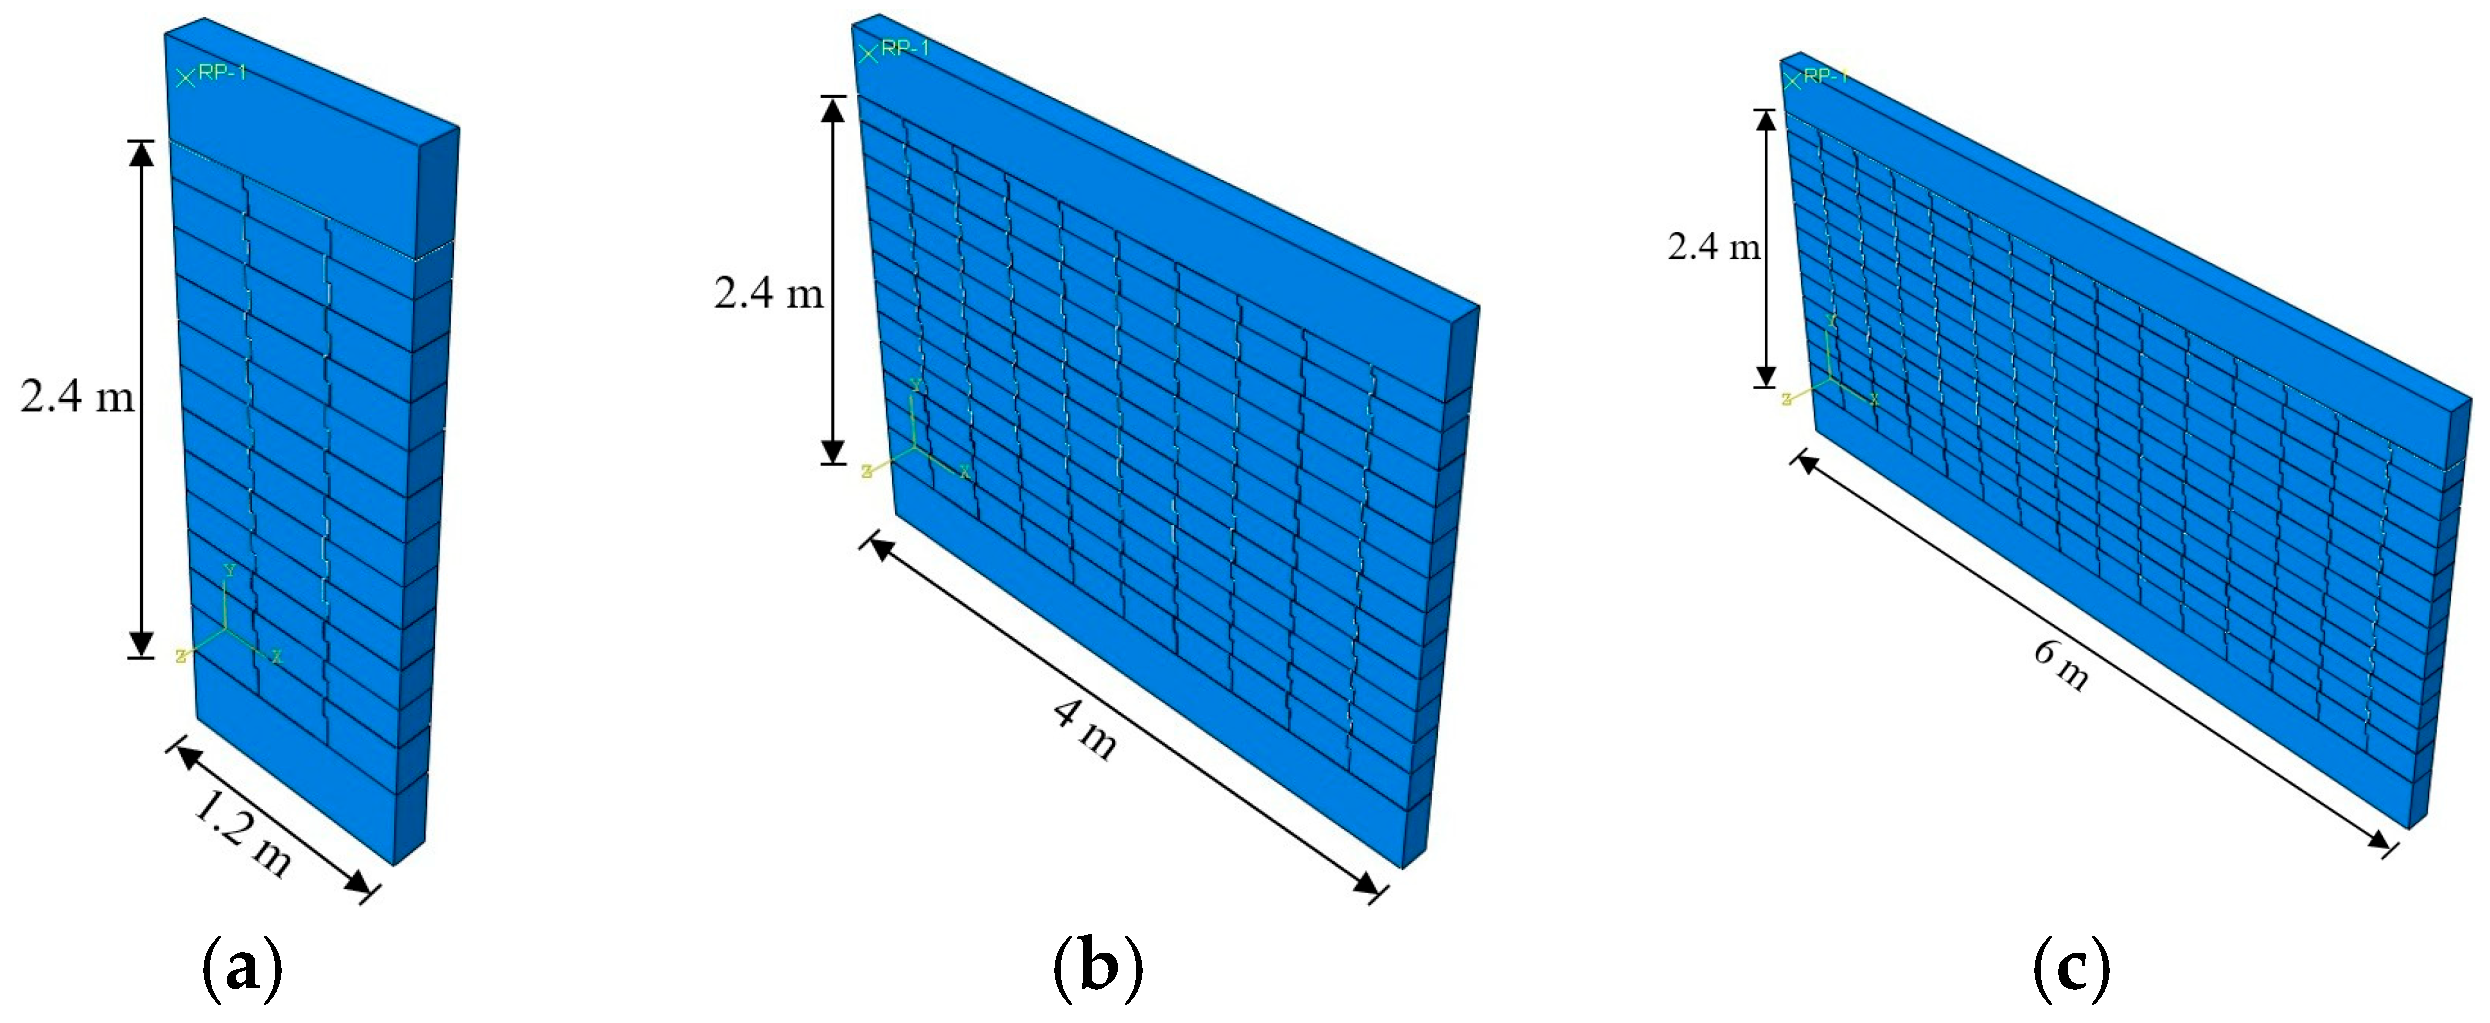
Before exploring the detailed aspects of interlocking mechanisms and their diverse geometrical configurations, it is essential to thoroughly understand the influence of mortar joints on the structural behavior of masonry walls. Furthermore, it is important to differentiate how mortar joints contribute to the structural behavior of masonry walls compared to their monolithic concrete counterparts. To facilitate this, a comprehensive numerical analysis is conducted on the URM walls with three aspect ratios (AR): 2 (slender wall), 0.6 (moderately squat wall), and 0.4 (squat wall). These three ARs are selected to highlight critical features, such as the different failure mechanisms (e.g., flexural, shear) associated with masonry walls. These aspect ratios corresponded to wall lengths of 1.2 m, 4 m, and 6 m, respectively, as illustrated in Figure 5. The heights of all tested walls are fixed at 2.4 m, a typical floor height for homes and apartments in Canada. Specifically, the investigation includes four distinct wall configurations:
(1)
A standard running bond wall, serving as a baseline.
(2)
A standard running bond wall where both head and bed joints are represented by tie constraints, effectively modeling a monolithic concrete wall to establish a theoretical upper limit for structural capacity under IP and OOP loadings.
(3)
A standard running bond wall with bed joints simulated using tie constraints, rather than contact-based cohesive surfaces, to isolate and assess the effects of head joints.
(4)
A standard running bond wall with head joints simulated using tie constraints, rather than contact-based cohesive surfaces, to isolate and assess the effects of bed joints.
Figure 5. URM walls considered to evaluate the effects of head and bed joints. (a) Slender wall. (b) Moderately squat wall. (c) Squat wall.
Modelling 07 00066 g005
All walls have a thickness of 190 mm, consistent with the Canadian standard block width. For the IP analysis, a monotonic displacement-controlled horizontal load is applied at the top via a rigid loading beam, with a pre-compression of 1.0 MPa. For the OOP analysis, a uniformly distributed pressure is applied under one-way vertical bending (top simply supported, bottom pinned, lateral edges free). Initial stiffness is defined as the secant stiffness at 40% of peak load (K_0.4Vmax), per Tomazevic [52] and ASTM E 2126 [53]. The tie constraint approach provides an extreme upper-bound (∼15–40% overestimation [54]).

3.1.1. IP Behavior

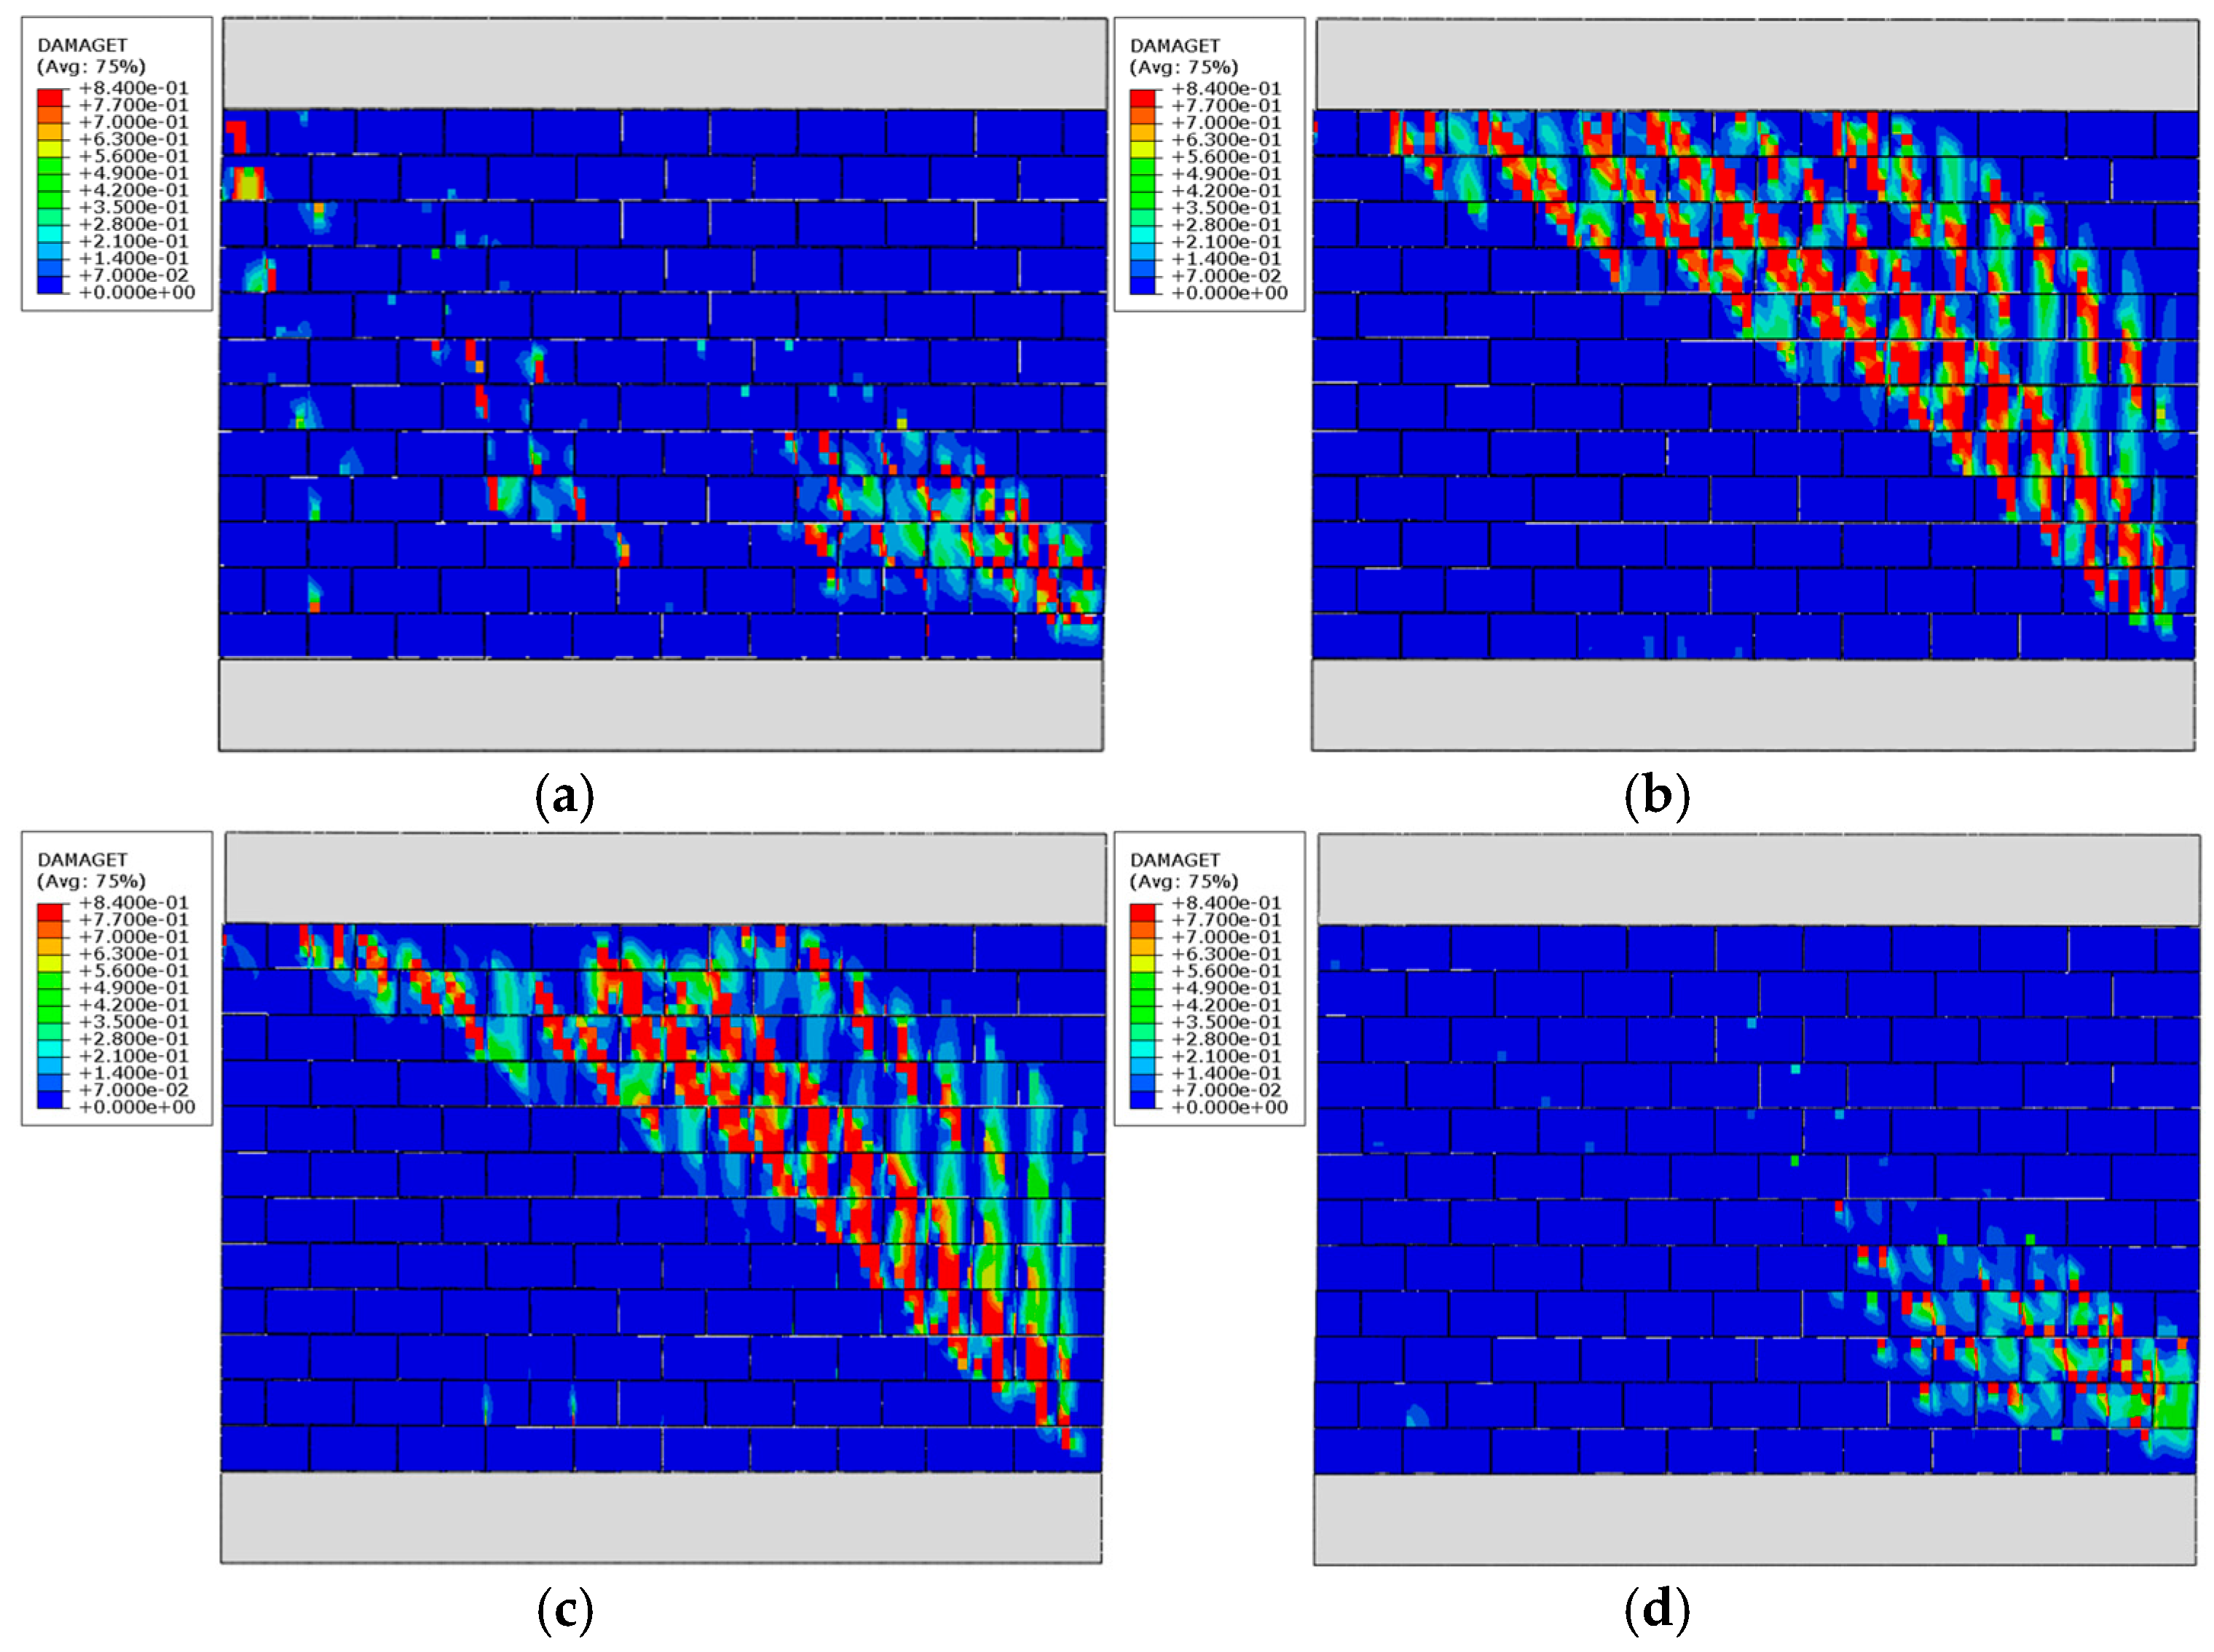
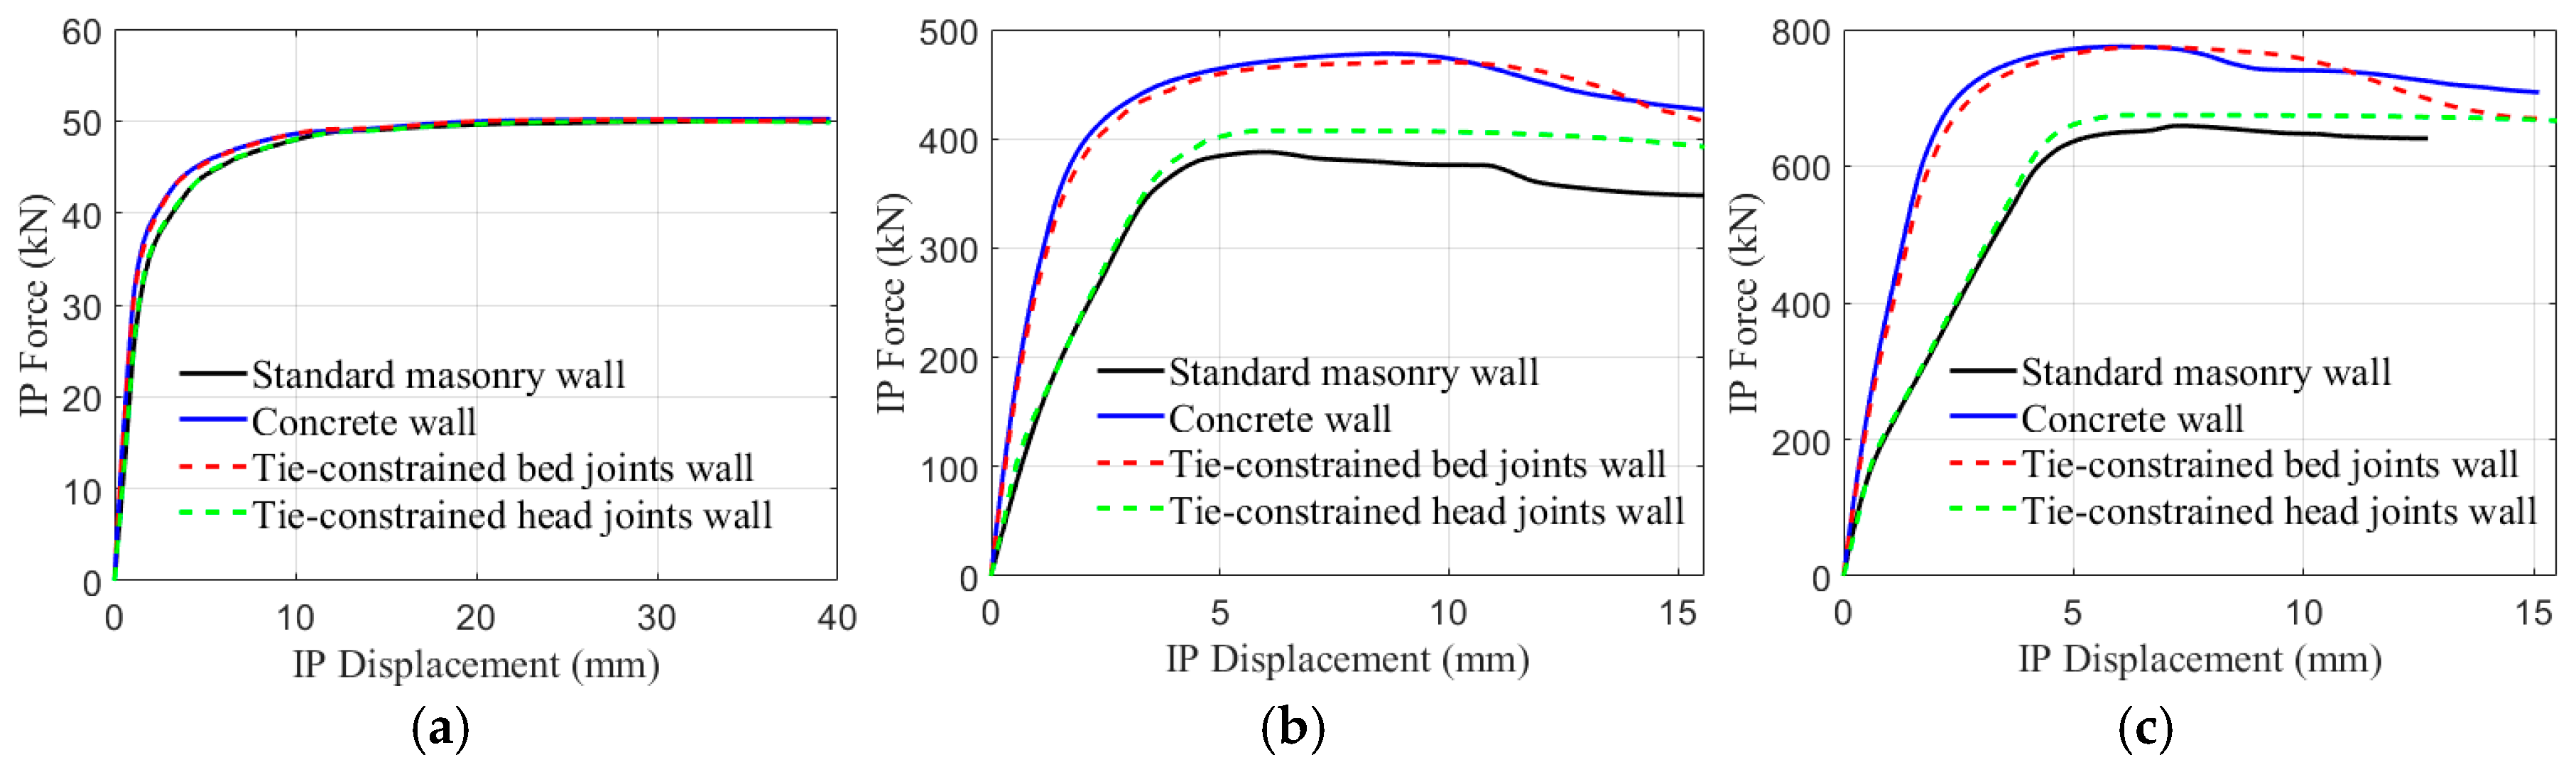
The load–displacement curves shown in Figure 6 illustrate the influence of mortar on the IP behavior of masonry walls with various aspect ratios. For walls with AR = 0.6 and AR = 0.4, the walls where all joints are tied (representing concrete walls) exhibited superior performance in both initial stiffness (quantified as the point on the load–displacement curve of the baseline masonry walls where the linear behavior stops and nonlinear characteristics begin to manifest) and IP capacity compared to standard masonry walls. In scenarios where only bed joints are tied, the wall’s performance closely resembles that of the concrete wall, albeit with a slight reduction in capacity attributable to the presence of head joints. Conversely, when only head joints are tied, the load–displacement curves align more closely with those of standard masonry walls, exhibiting modest improvements in capacity. These observations can be interpreted by examining the failure mechanisms of these walls. For example, Figure 7 illustrates the failure mechanism of walls with an aspect ratio of 0.6. In standard masonry walls and tie-constrained head joint walls, the failure mechanisms are nearly identical, characterized by diagonal cracking at the far ends of the walls. In contrast, for concrete walls and tie-constrained bed joint walls, the same diagonal cracking is observed but extends across the entire wall. This highlights the critical role of bed joints in masonry walls, particularly for walls with small aspect ratios where shear failure tends to govern. Regarding slender walls with AR = 2, the influence of mortar joints is negligible. All walls exhibited similar load–deformation behaviors. This is primarily due to the dominance of the flexural rocking failure mode, which is not significantly influenced by the presence or absence of head and bed joints. This is because the rocking capacity is primarily determined by the wall geometry (height-to-length ratio), axial load, and compressive strength of the units at the toe region, rather than by the bond strength or stiffness of the mortar joints.

3.1.2. OOP Behavior

All OOP analyses in this section consider one-way vertical bending about the horizontal axis (lateral edges free). Consequently, conclusions regarding head joint contributions are specific to this configuration; under two-way bending, head joints would play a more significant role.
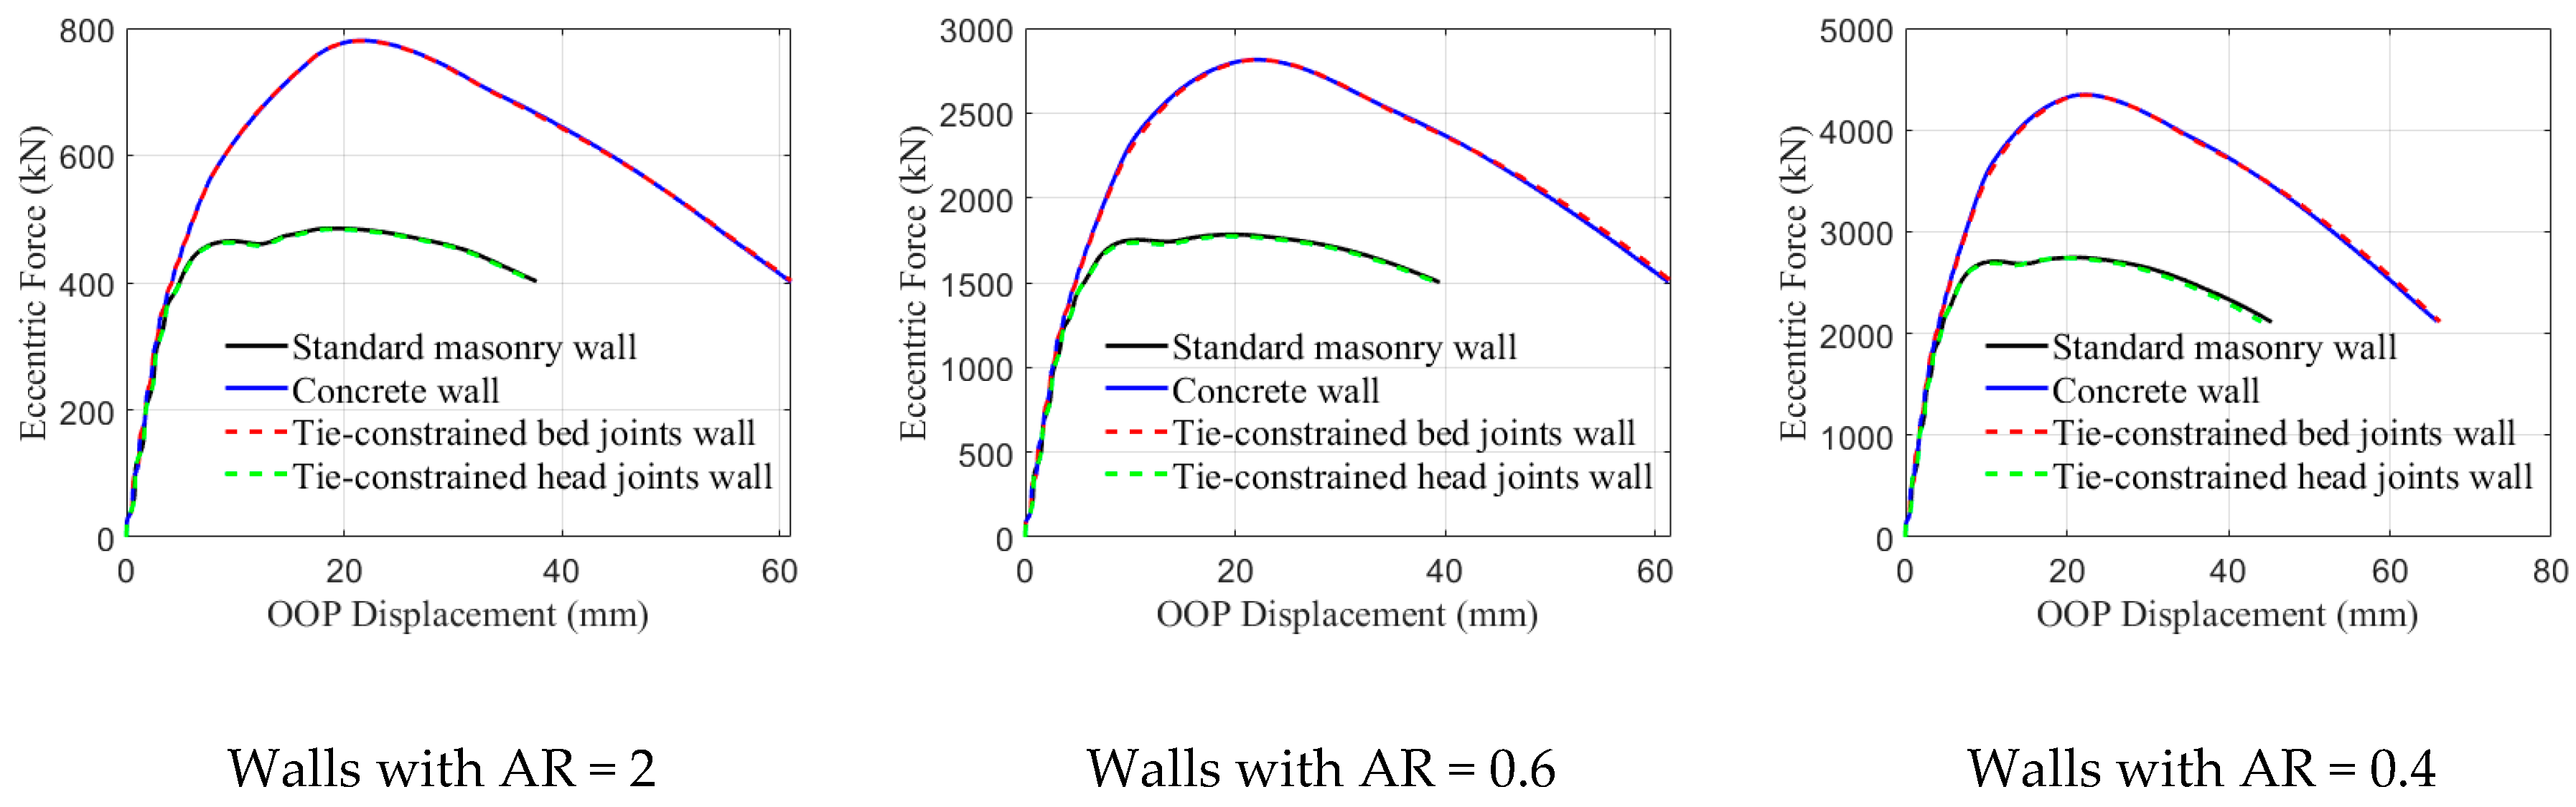
Figure 8 illustrates the load–displacement curves of numerically tested walls under OOP loading. Obviously, a more uniform trend across different wall configurations is observed. Walls with both head and bed joints tied show up to a 60% increase in OOP capacity compared to standard masonry walls. Notably, walls with tied bed joints alone exhibit behavior closely resembling that of fully tied walls, emphasizing the critical role of bed joints in enhancing the OOP structural capacity of masonry walls. Conversely, tying only the head joints has a negligible effect on the OOP capacity. Walls with tied head joints perform similarly to standard masonry walls, indicating their limited contribution to structural improvements under OOP loading. The results indicate a consistent increase in capacity across all aspect ratios for concrete walls and walls with tied bed joints, with concrete walls showing a slight advantage. However, no increase in capacity is observed for walls with only tied head joints.

3.2. Newly Proposed Interlocking Block

The study on the effects of mortar joints provides valuable insights into the distinct contributions of bed and head joints in masonry walls. The results reveal that bed joints play a more critical role than head joints in increasing the capacity of the wall. These findings offer essential guidance for the development of interlocking mechanisms in block design, emphasizing the prioritization of horizontal (bed joint) connections over vertical (head joint) connections.
Rather than introducing an entirely new block design, the existing Canadian standard block design has been retained with the incorporation of a new interlocking feature. For reference, the Canadian standard block has nominal dimensions of 390 mm × 190 mm × 190 mm (length × height × width) per CSA A165/S304-14 [3]. This decision is informed by several considerations. First, the current standard block design has been extensively studied with regard to its structural, thermal, and soundproofing properties, making it a reliable and well-established foundation for further development. Additionally, retaining the existing design minimizes the learning curve for users and practitioners, facilitating ease of adoption and implementation. Moreover, maintaining the modularity of the existing design ensures seamless integration of interlocking features while preserving the inherent flexibility and compatibility of the system. This approach strikes a balance between innovation and practicality, ensuring that the proposed enhancements build upon a proven and effective framework.
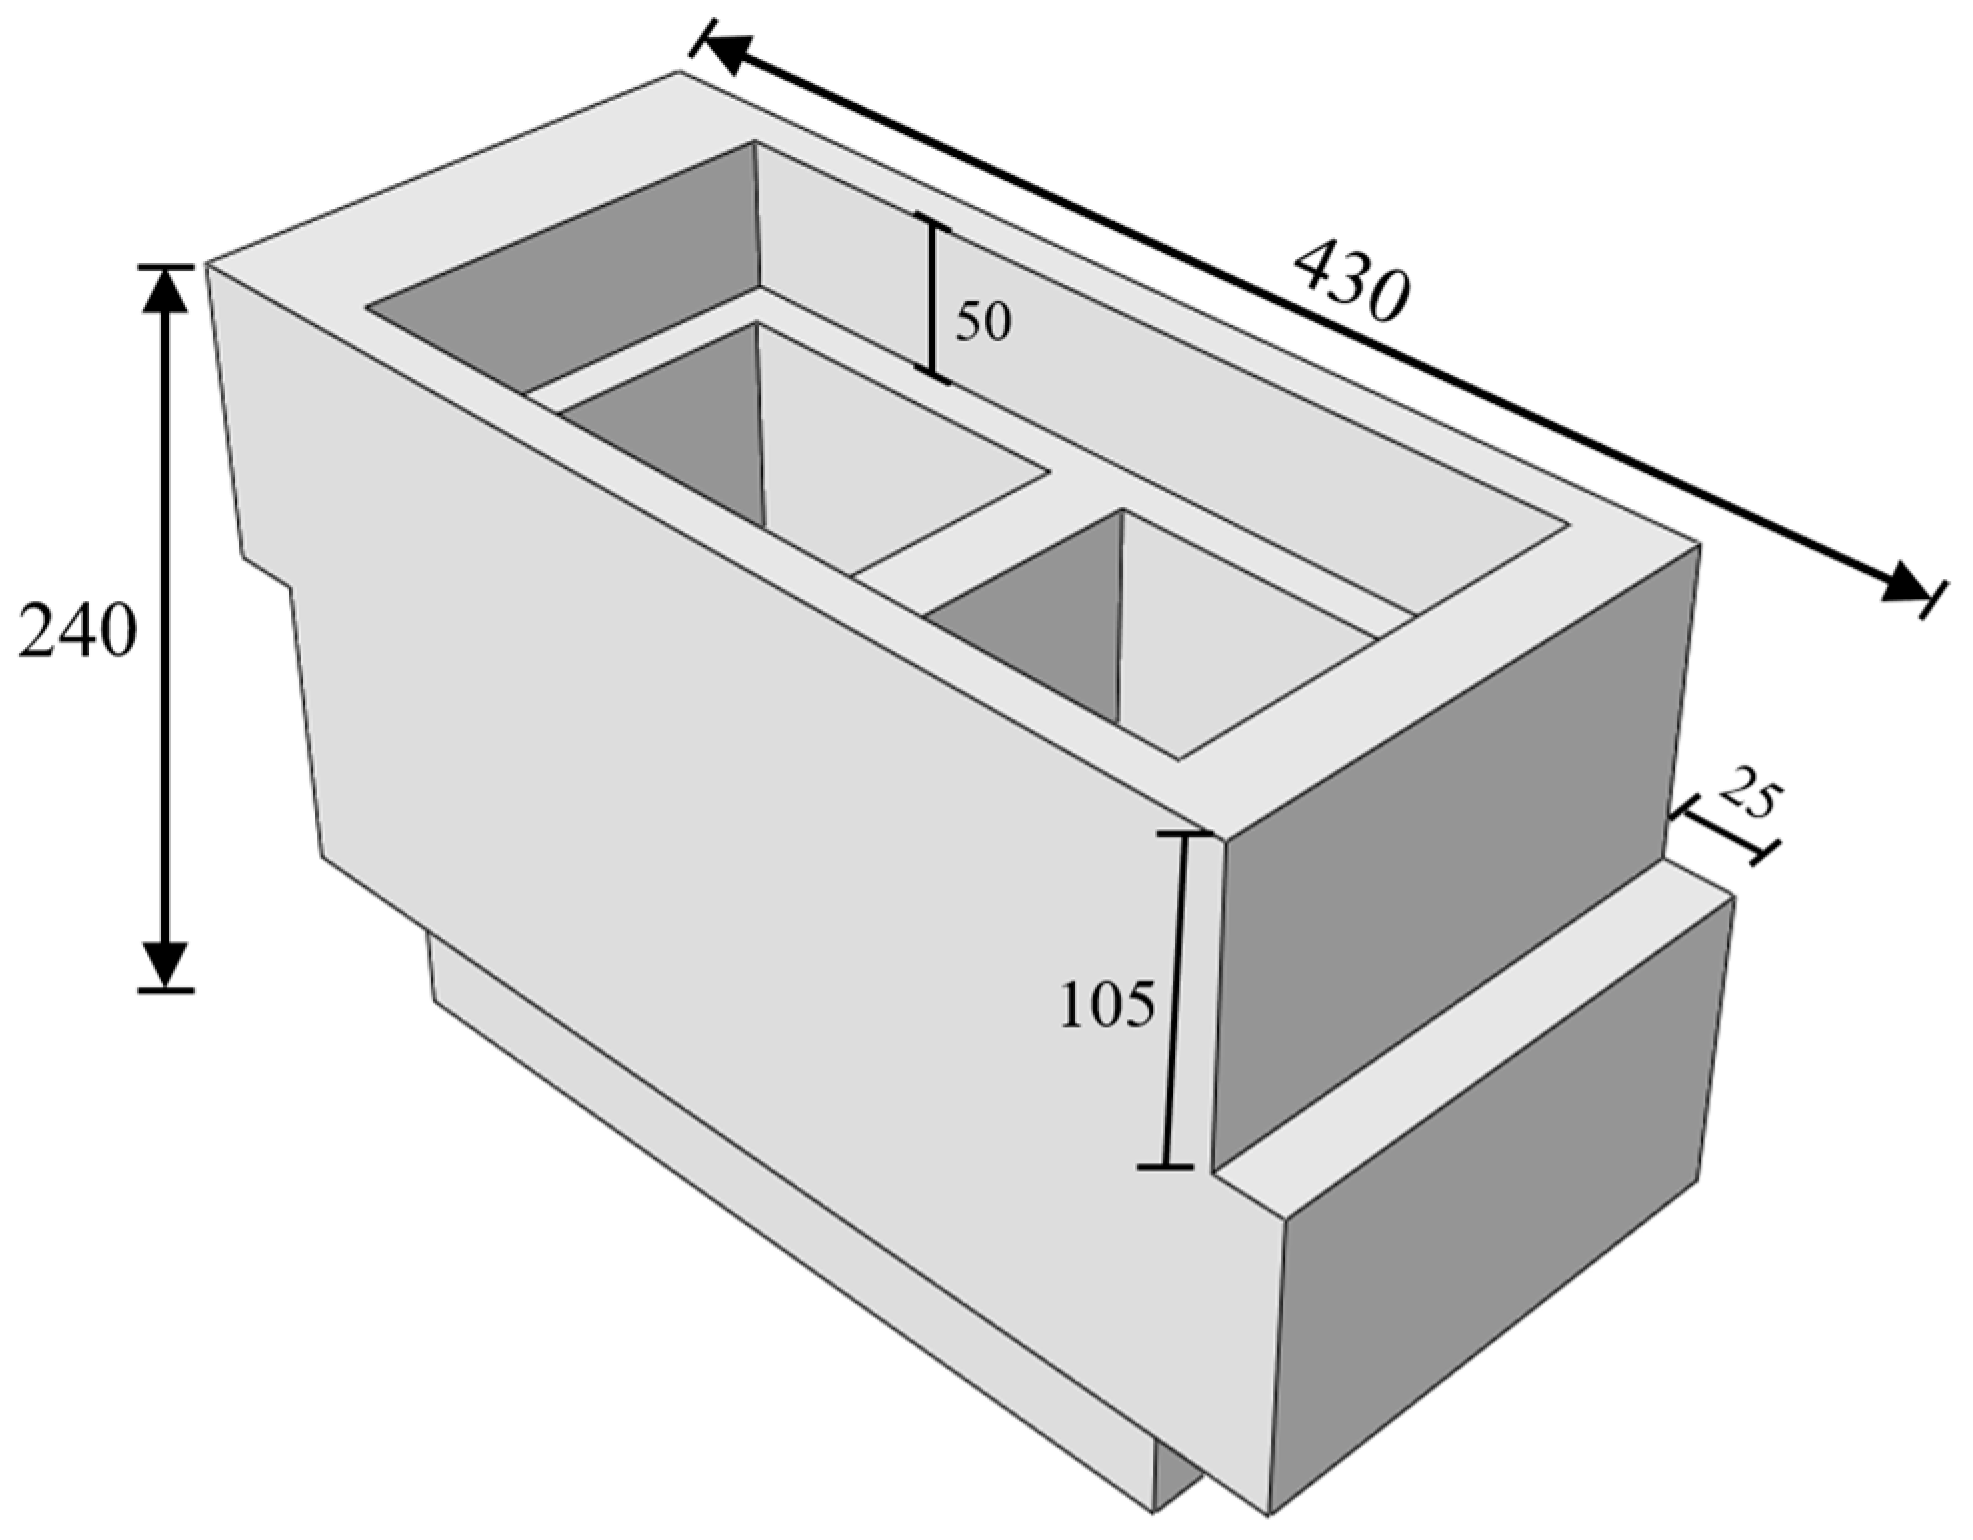
The development of the interlocking mechanism follows a structured design process aimed at achieving optimal performance, with a prioritization of bed joints over head joints, as previously discussed. Initially, the proposed interlocking block includes mechanisms for both bed joints [55] and head joints [56]. However, challenges in block placement prompt a revision of the design. The final design retains the bed joint mechanism while modifying the vertical head joints to incorporate a stepped shape mechanism with short “bed joints” at mid-height, as illustrated in Figure 9.
The dimensions of the interlocking mechanism are specified as a 50 mm protrusion and a 25 mm step thickness in the short “bed joints” at the head joint. Although these dimensions may initially appear modest, particularly for practical experimental work, the primary objective in this paper is to conceptually validate the interlocking principle. Future refinements and adjustments to these dimensions can be made for practical applications based on the results of this conceptual evaluation. It is also important to note that the addition of projections to the bed and head joints inevitably increases the overall volume of the block. However, this increase is intentionally minimized to ensure the added volume as low as possible. This consideration is essential for effective comparisons between the interlocking block and a standard block, as significant volume increases could complicate the quantification and analysis of results.

3.3. Structural Behavior of Masonry Walls with Newly Proposed Interlocking Block

The structural performance of the proposed interlocking block is numerically evaluated under both IP and OOP loading conditions. This evaluation compares the performance of walls constructed with the interlocking block, as shown in Figure 10, to those built with standard blocks. The same three URM walls previously analyzed in the ‘Effects of head and bed joints’ section are used but under two different construction scenarios: one with full bedding mortar (mortared wall) and the other in a dry-stack configuration (mortarless wall).
For the mortared walls, the material parameters of the mortar joints are assumed to be identical to those used in the validation studies, as detailed in Table 1. In contrast, for the mortarless walls with the proposed interlocking block, a contact surface is defined between blocks using the Coulomb friction model. A friction coefficient of 0.7 is applied to characterize the tangential behavior as suggested by [3], while a hard contact model is employed for the normal behavior, assuming that only compressive forces can be transmitted but providing no resistance when two surfaces separate. This modeling strategy has been proven to be effective for dry-stacking walls, as demonstrated in similar studies [20,57,58].

3.3.1. IP Behavior

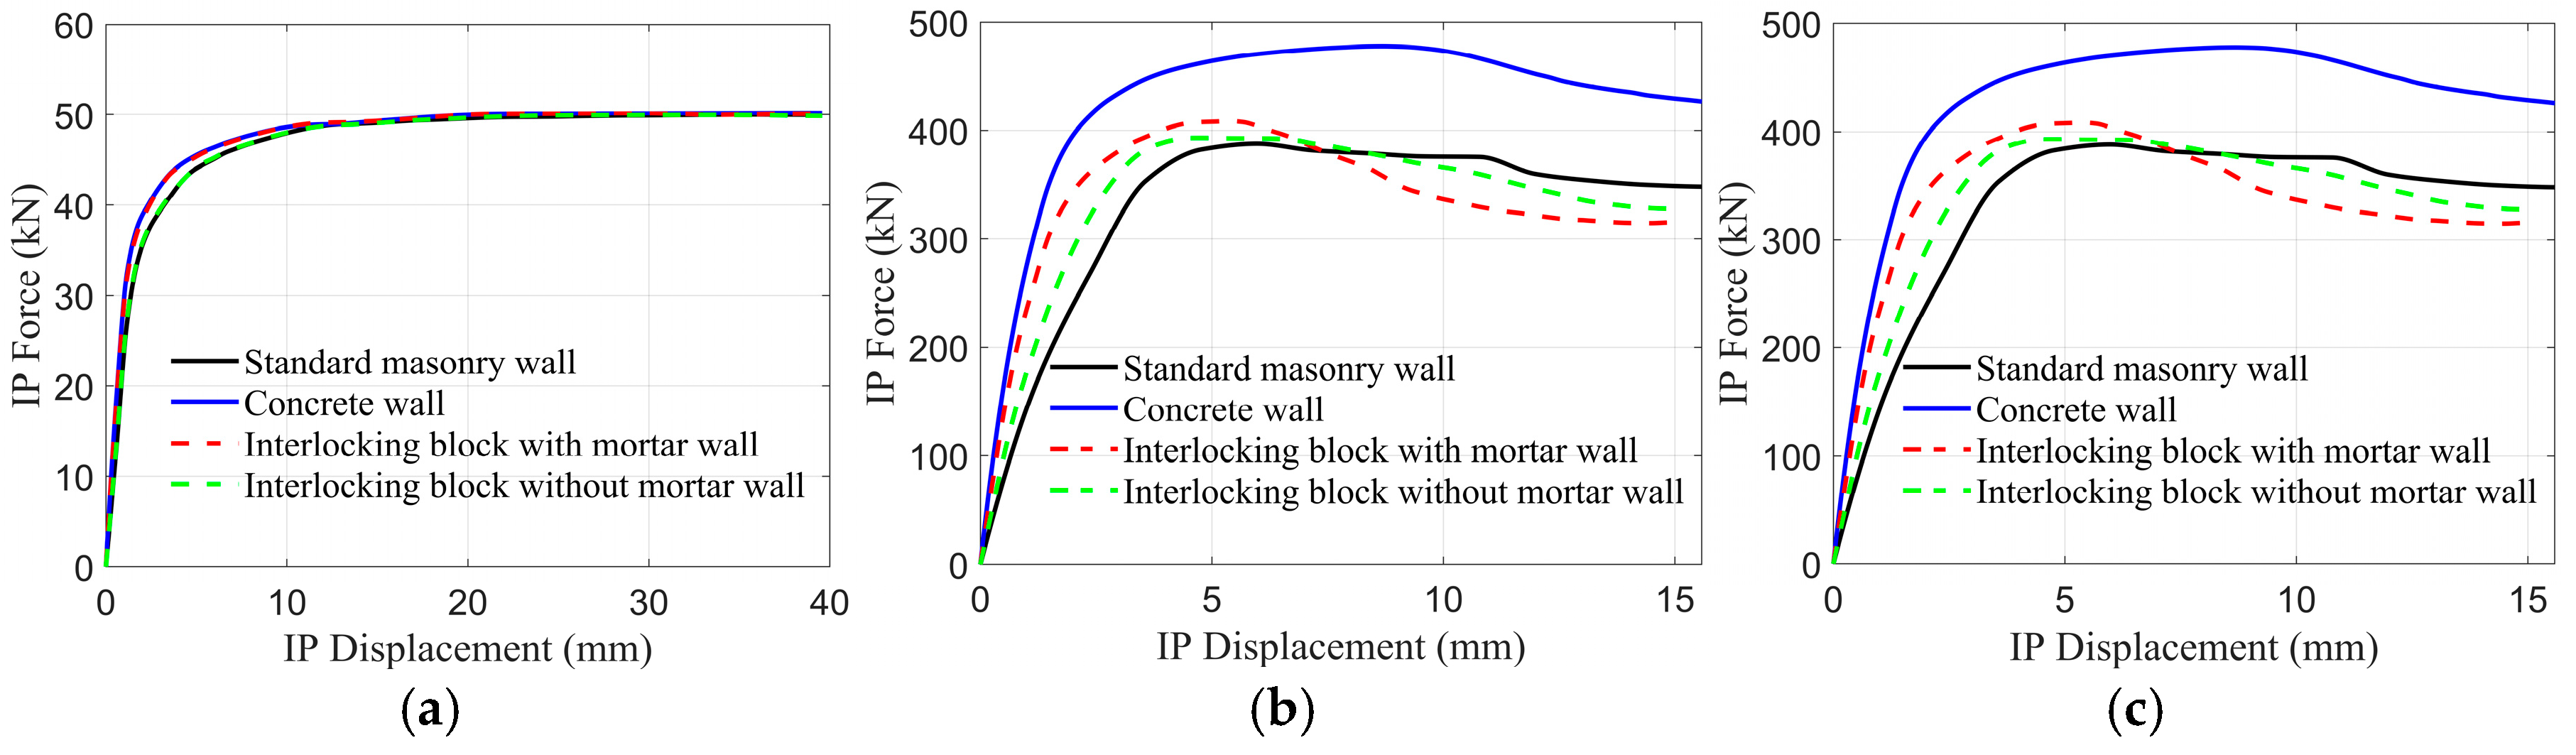
The load–displacement curves in Figure 11 reveal how interlocking blocks can improve the structural performance of masonry walls. The results reveal that for slender walls (AR = 2), the load–displacement behavior remains similar across all wall types, with no significant improvement in stiffness or capacity compared to standard masonry walls. This is attributed to the dominant failure mode of toe crushing, which is unaffected by the addition of interlocking mechanisms or mortar. For (moderately) squat walls (AR = 0.6 and AR = 0.4), interlocking block walls demonstrate higher initial stiffness and load capacity compared to standard masonry walls. Walls constructed with interlocking blocks and mortar exhibit the greatest improvements, achieving up to 53% and 51.5% increases in initial stiffness for AR = 0.6 and AR = 0.4, respectively. These walls also achieve notable gains in load capacity, with increases of 6.4% and 8% for the same aspect ratios. In contrast, mortarless interlocking block walls show modest improvements, with stiffness gains of 9.6% and 19% for AR = 0.6 and AR = 0.4, respectively, and limited capacity increases of 0.8% and 4%.

3.3.2. OOP Behavior

In the context of OOP loading, the load–displacement curves presented in Figure 12 illustrate the structural performance of various wall configurations. Similarly, interlocking block walls with mortar exhibit significant increases in loading capacity compared to standard masonry walls, while interlocking block walls without mortar show either negligible improvement or only marginal increases in capacity. As expected, concrete walls achieve the highest loading capacities among all configurations. This observation can be interpreted by the effective thickness of masonry walls. For standard masonry walls, the effective thickness is defined as the block thickness resisting separation, typically the face shells on the loading side. The interlocking mechanism enhances this effective thickness by extending it from the face shells near the loading side to include portions of the far face shells of the block. This enhancement significantly contributes to the improved OOP performance observed in interlocking block walls. More specifically, interlocking block walls with mortar achieve capacity increases of up to 15.8% for slender walls (AR = 2) and approximately 14% for squat walls (AR = 0.6), highlighting the combined action of mortar and interlocking mechanisms. In contrast, interlocking block walls without mortar show minimal capacity improvements, reaching only 2.4% for slender walls (AR = 2) and up to 1% for squat walls (AR = 0.4). These findings underscore the critical role of mortar in maximizing the structural advantages of interlocking mechanisms under OOP loading.

4. Proposed Block: Mega-Interlocking Block

Historically, the size and weight of masonry units have been constrained by the physical capabilities of masons in handling and placing them. However, with the advent of advanced construction technologies (e.g., robot), this limitation could be effectively alleviated. As noted earlier, a key advantage of using larger blocks, referred to hereafter as “mega blocks”, is the acceleration of construction as fewer blocks are required.
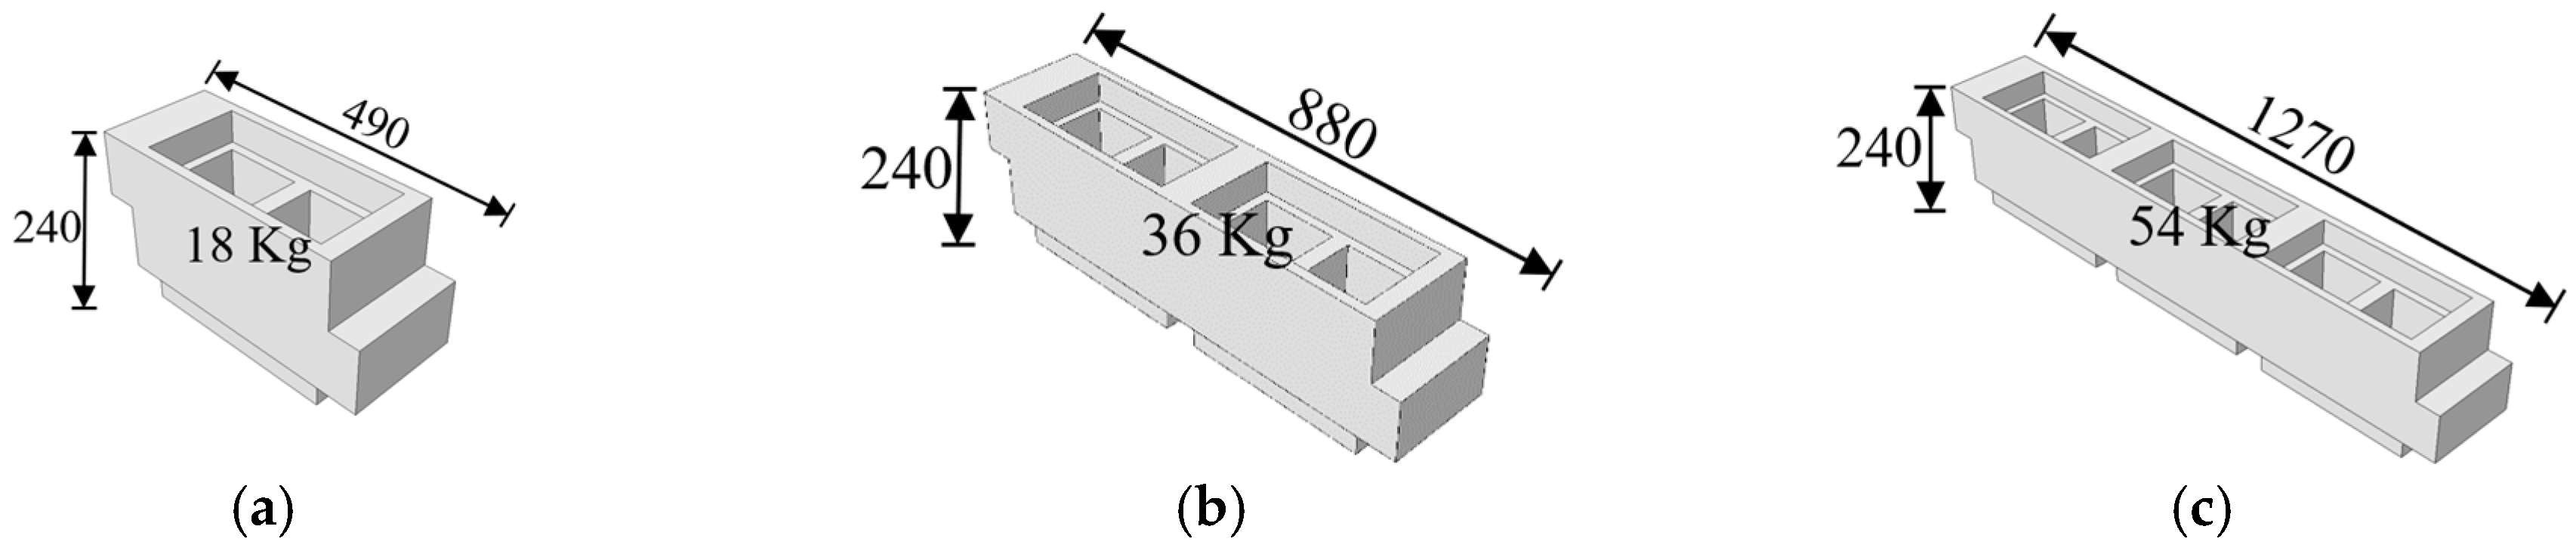
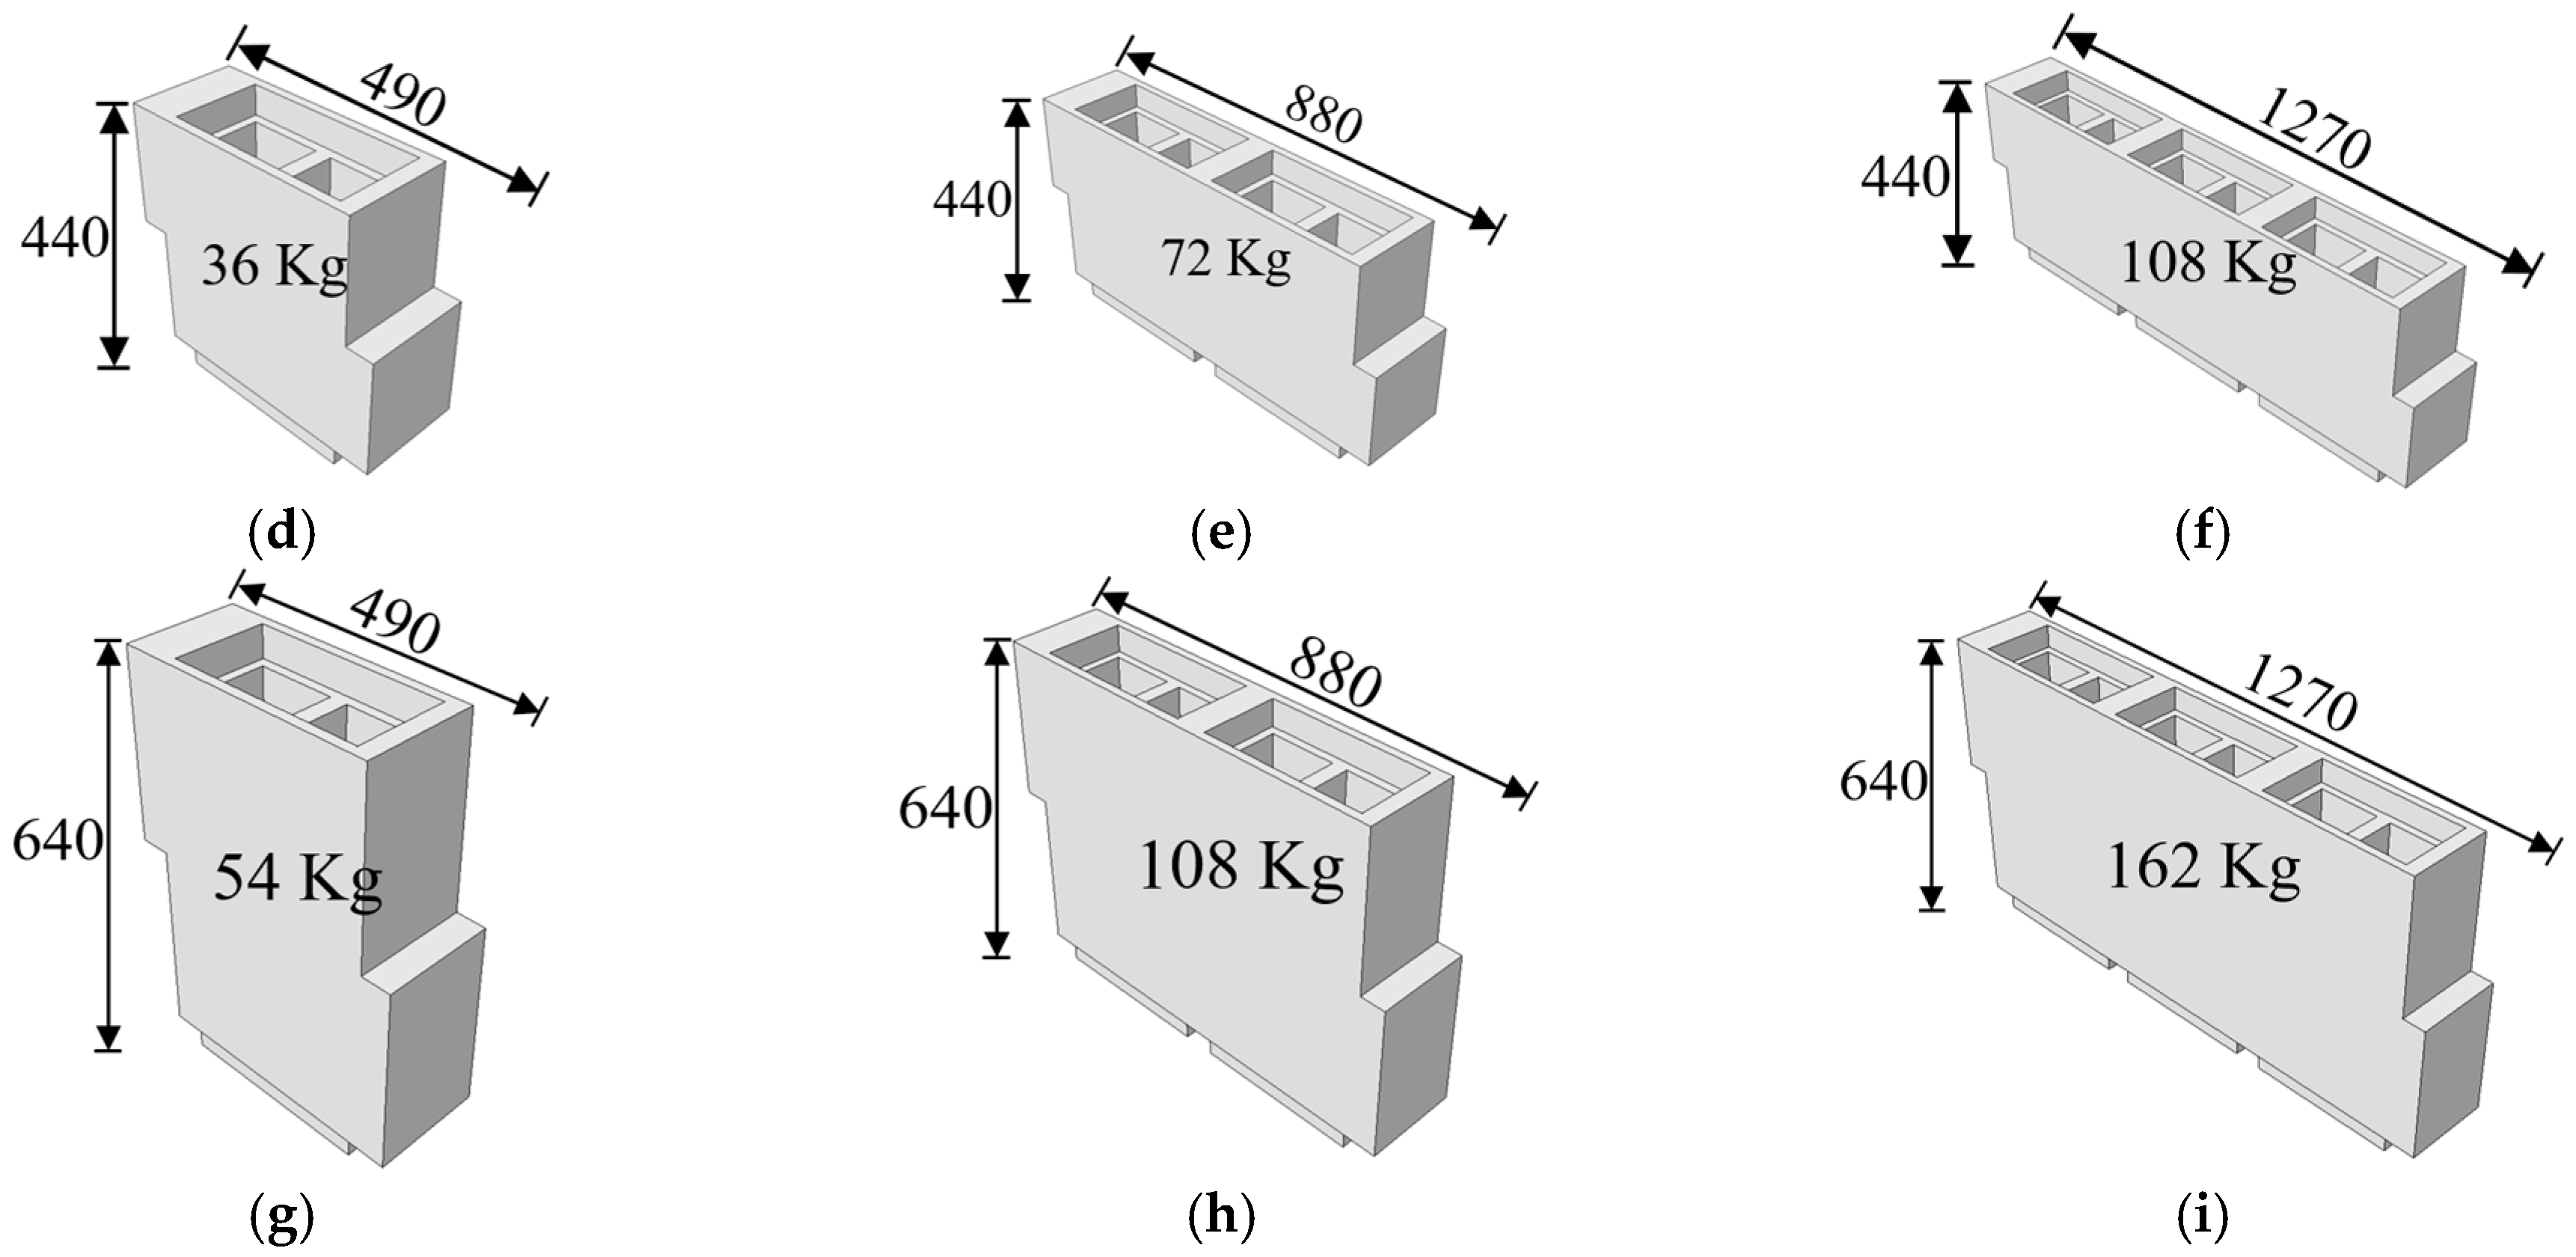
Mega blocks can be designed in various topologies or shapes. In this study, mega blocks are simply defined as multiples of Canadian standard blocks. This approach facilitates an examination of the impact of block size and the feasibility of using mega blocks in masonry wall construction by comparing their performance to traditional walls built with standard blocks. The mega blocks are denoted using “A × B”, where “A” represents the number of standard blocks stacked vertically, and “B” indicates the number of standard blocks joined horizontally. Notably, the dimensions of mega blocks maintain the dimensions of the combined standard blocks, with an additional 10 mm accounting for each mortar layer in conventional masonry wall construction when using standard blocks. To harness the benefits of both interlock blocks and mega blocks, a new series of blocks, referred to as “mega-interlocking blocks”, is proposed. A slight alteration has been introduced on the basis of interlocking blocks. Specifically, the step thickness of the short “bed joints” is increased from 25 mm to 50 mm to be more practical. The main aim is to compare the behavior of mega-interlocking blocks to standard blocks, ensuring a consistent baseline using the same amount of concrete. These blocks, shown in Figure 13, integrate the scalability of mega blocks with the enhanced structural performance provided by interlocking mechanisms.

4.1. Block Configuration Summary

To provide a clear framework for comparison and to isolate the individual contributions of the interlocking mechanism and block size, three block configurations are investigated: (1) standard block (390 × 190 × 190 mm, conventional hollow block, ~18 kg); (2) interlocking block (390 × 190 × 190 mm, bed + head joint interlock, ~18 kg); and (3) mega-interlocking block (1200 × 600 × 190 mm, 3 × 3 + interlock mechanism, ~162 kg).
All five walls in the parametric study (Section 4.2 and Section 4.3) use the 3 × 3 mega-interlocking block. Wall thickness is 190 mm for all configurations. Pre-compression is 1.0 MPa for all parametric walls. The reinforcement for RM walls consists of 15M vertical bars (fy = 400 MPa) at 600 mm c/c and No. 9 gauge wire (fy = 520.8 MPa) in a ladder configuration every 400 mm, modeled as T3D2 truss elements with perfect bond [49].
To maximize the construction efficiency (i.e., using the largest block), the feasibility of using 3 × 3 mega-interlocking blocks, as shown in Figure 13i, is evaluated under IP and OOP loading conditions. It is important to note that the large block size, which results in a heavy weight (162 kg), was chosen with consideration of the robotic construction process. Using fewer blocks per construction round is expected to reduce the total number of rounds, thereby accelerating the construction process.
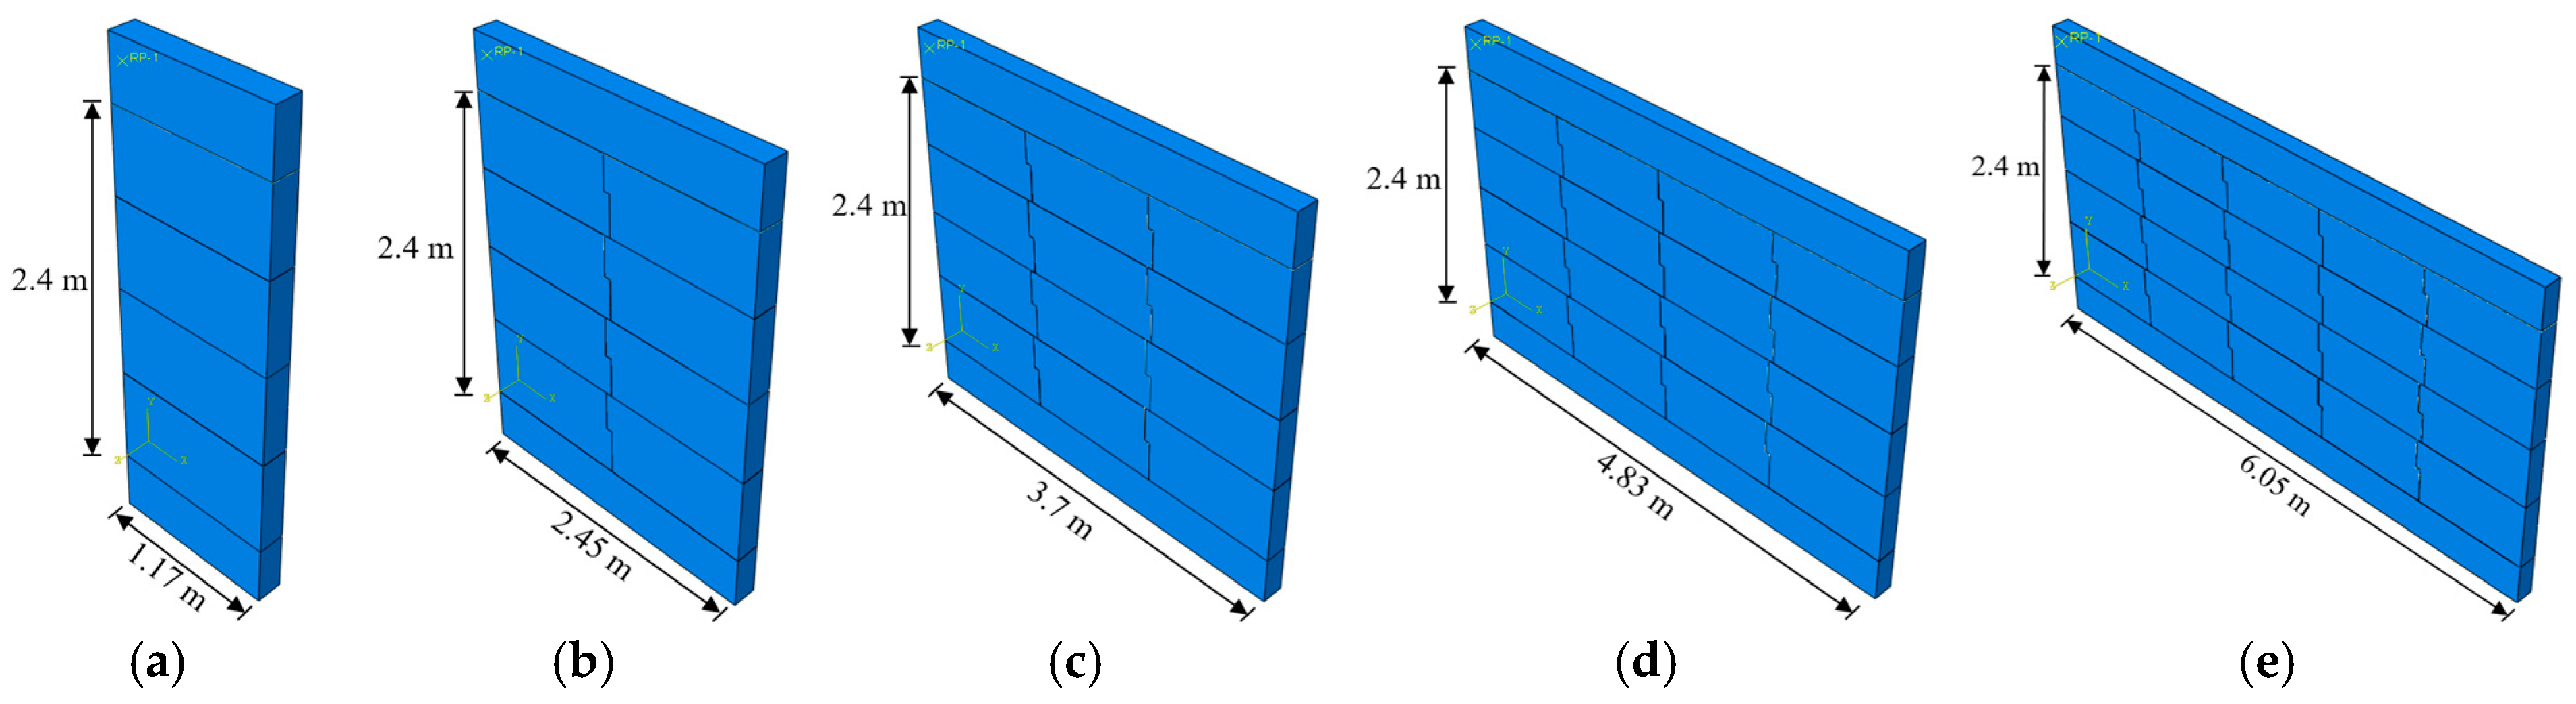
The study focuses on five walls constructed with 3 × 3 mega-interlocking blocks, each with a fixed height of 2.4 m. The lengths of these walls are scaled proportionally to be 1, 2, 3, 4, and 5 times the length of a single 3 × 3 mega-interlocking block, as illustrated in Figure 14.
To ensure a comprehensive analysis, URM walls are evaluated in both mortared and mortarless configurations, while RM walls are assessed exclusively with mortar. For comparison, walls constructed with standard blocks are used as baselines. Additionally, concrete walls are simulated to establish theoretical upper limits for walls’ capacities. To streamline the discussion, all walls IDs are identified by their dimensions. To be more specific, the five walls shown in Figure 14 are referred to as the 1200 × 2400 Wall, 2400 × 2400 Wall, 3600 × 2400 Wall, 4800 × 2400 Wall, and 6000 × 2400 Wall, respectively.

4.2. IP Behavior

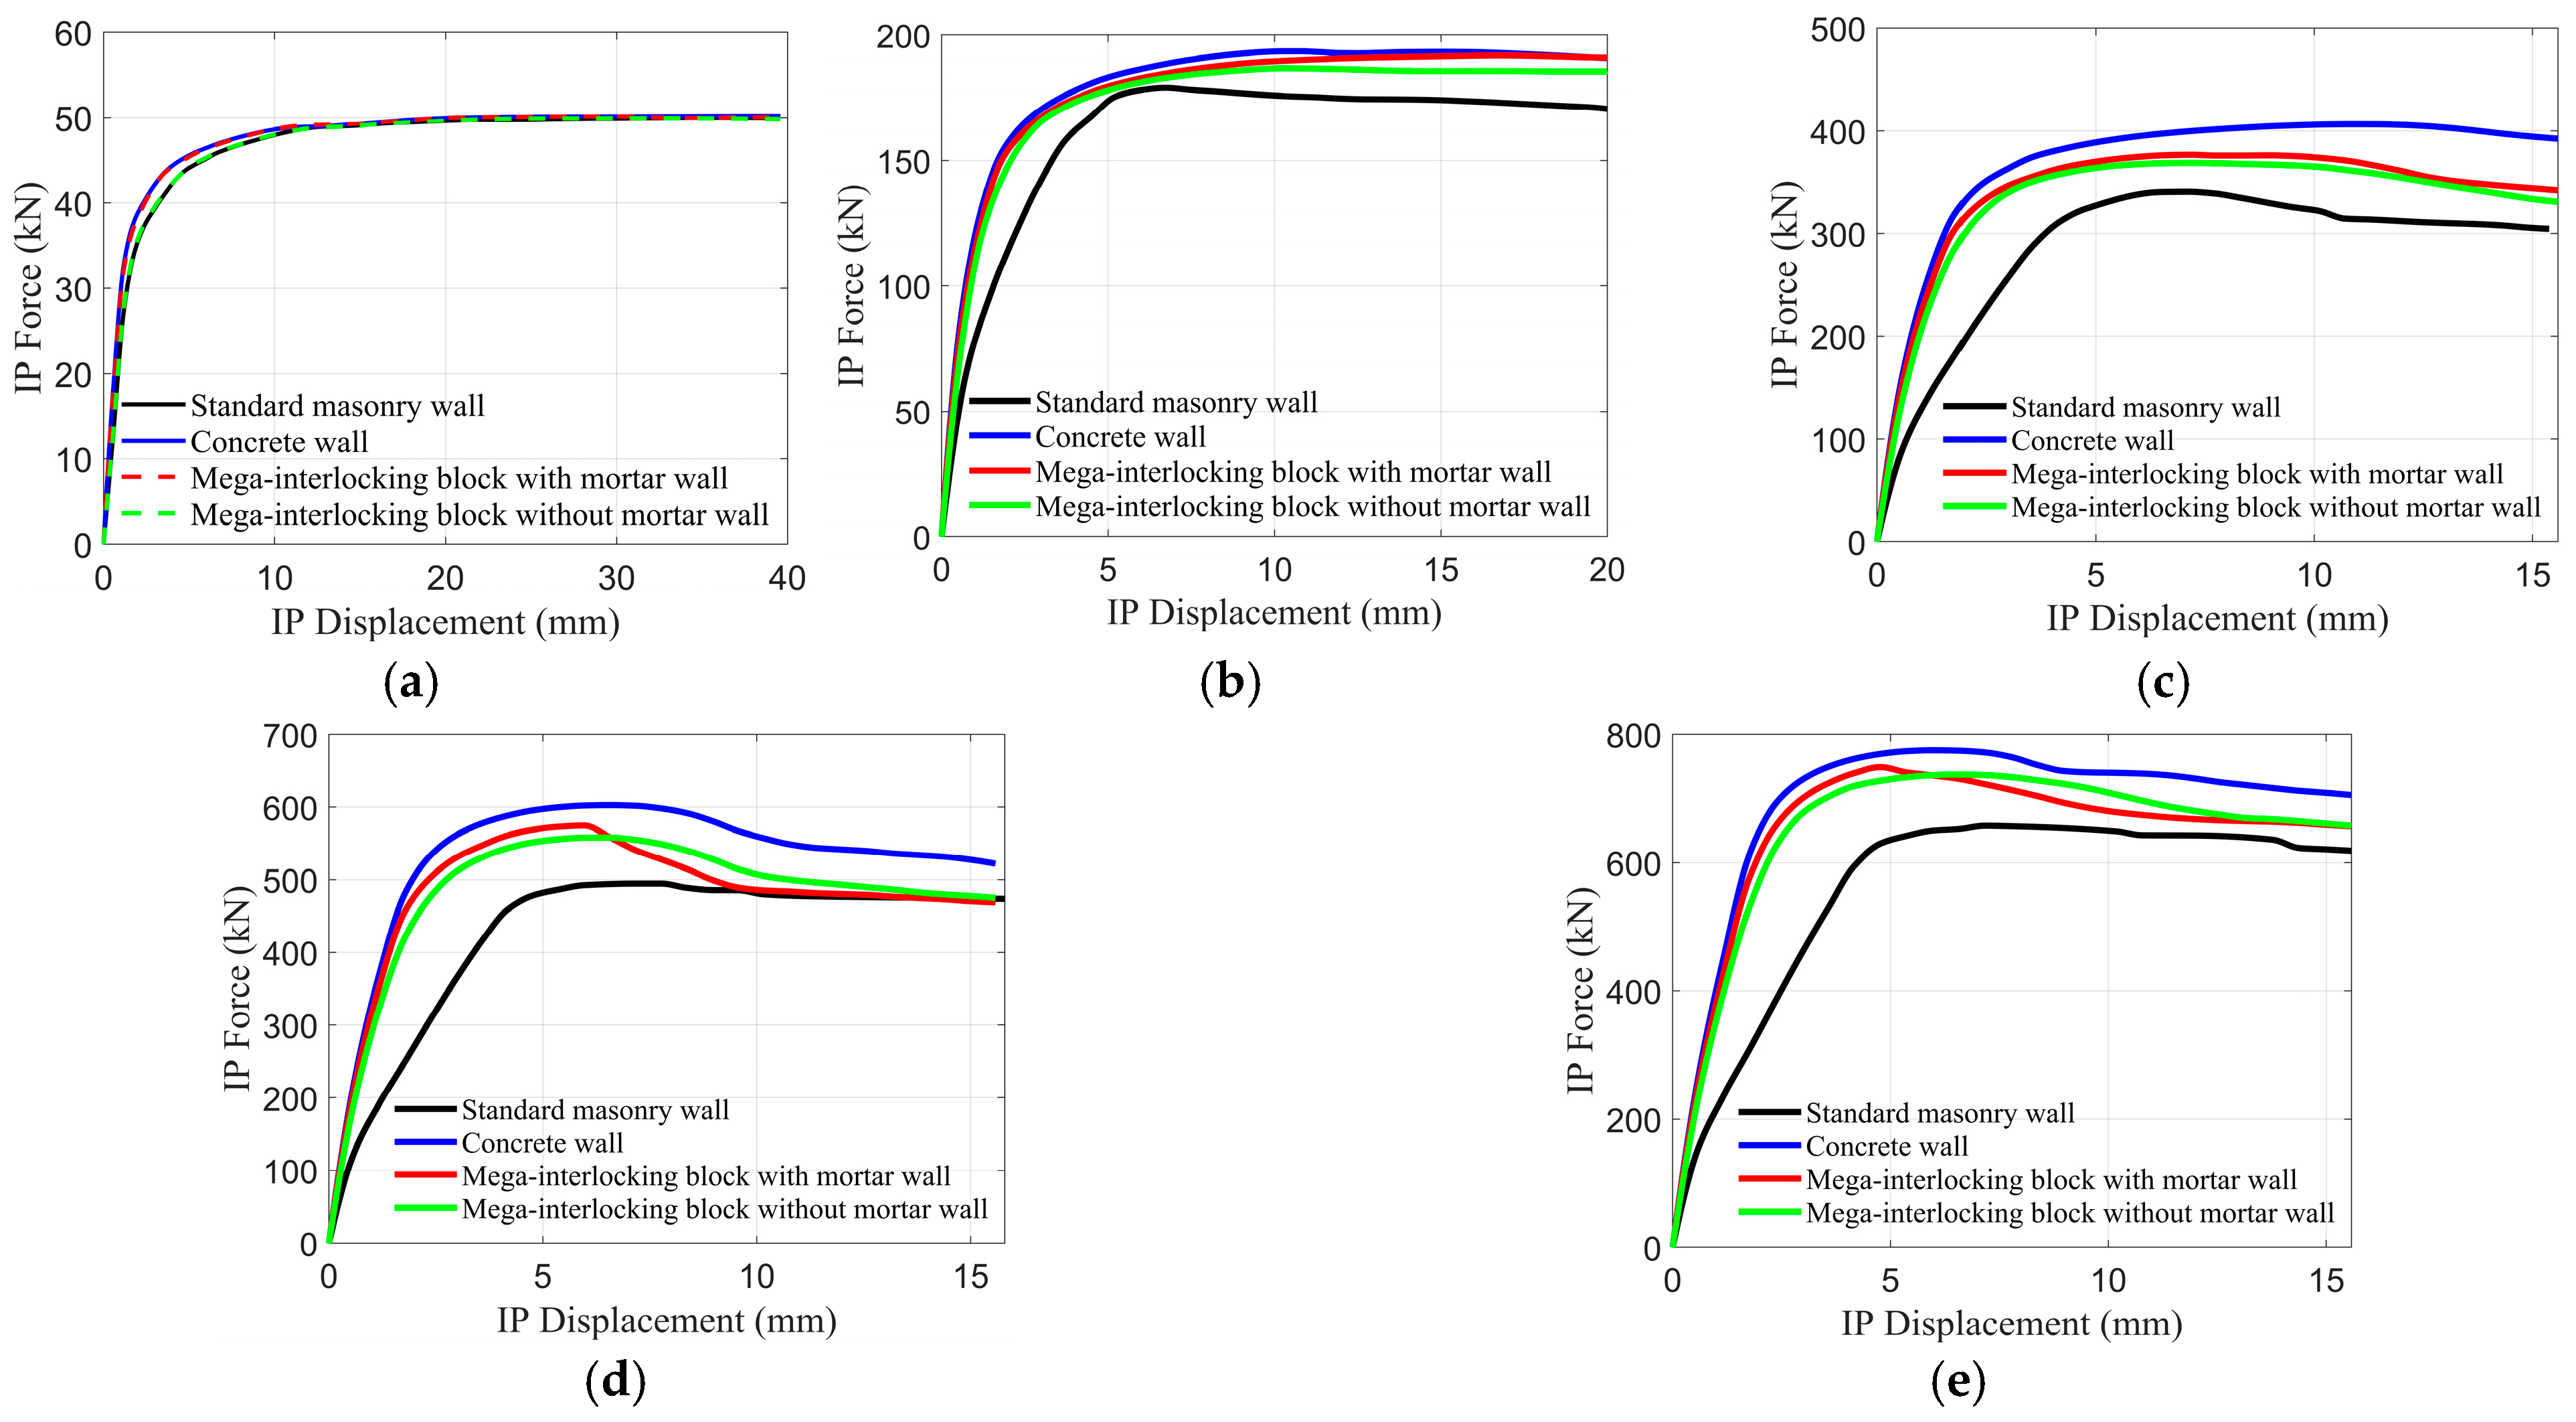
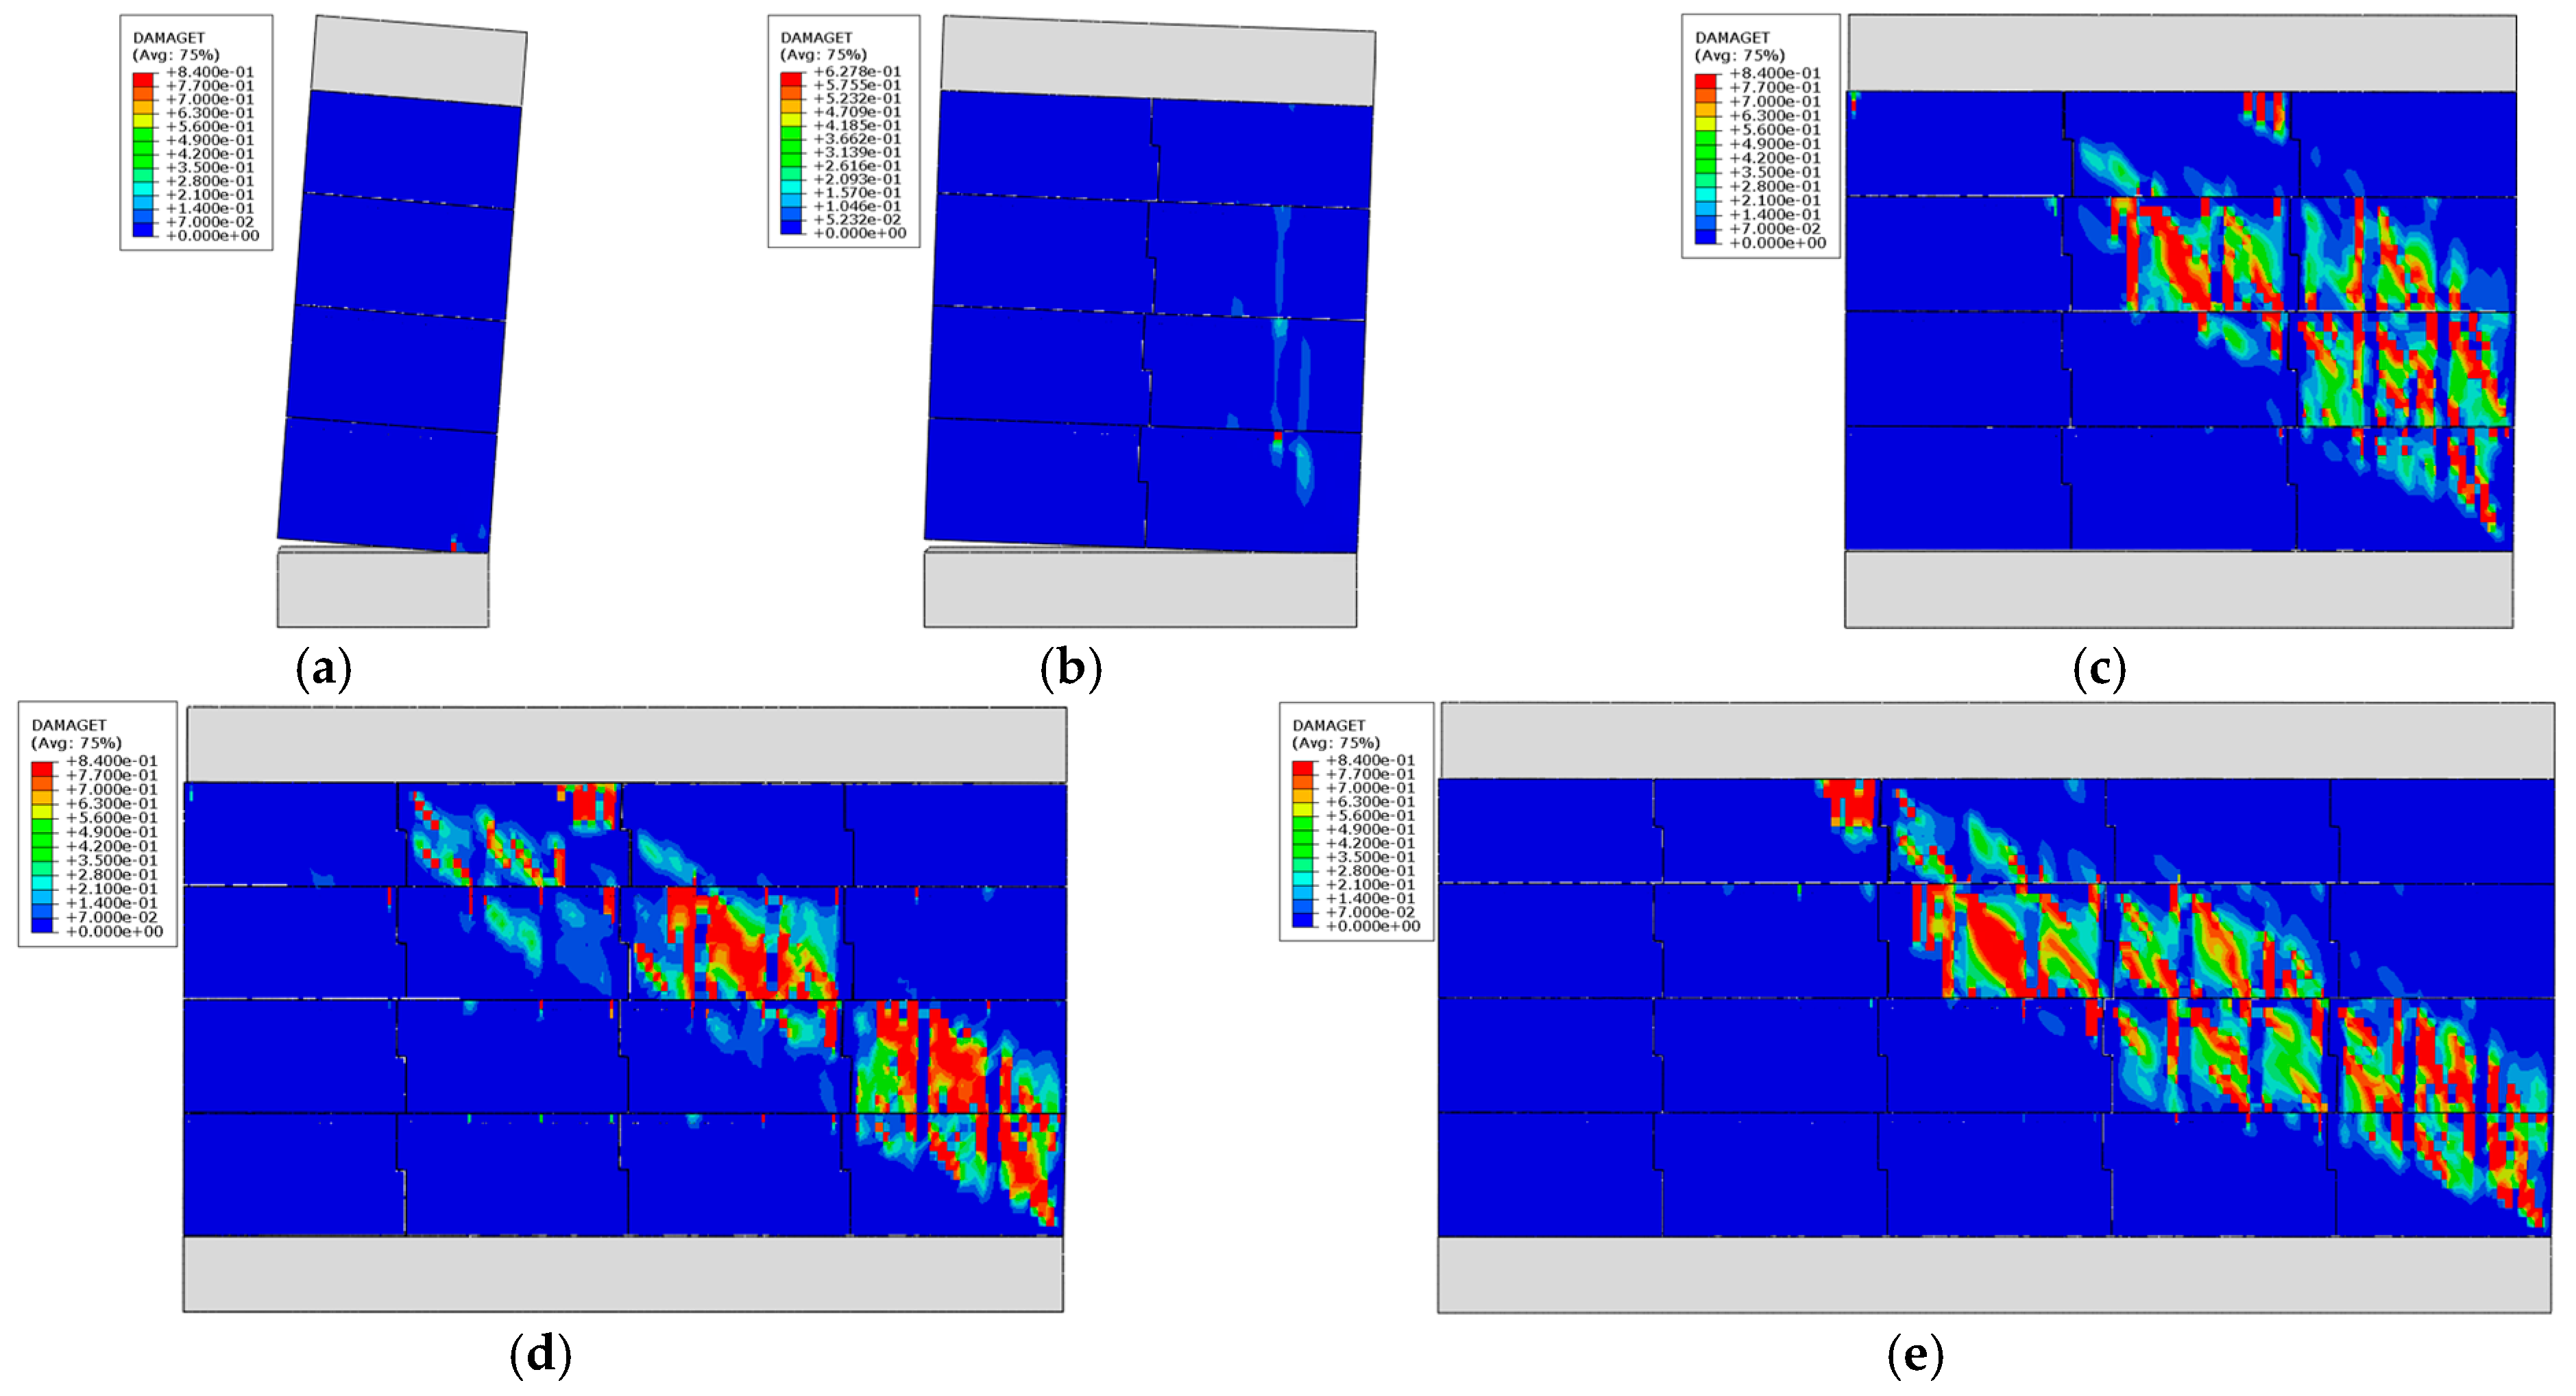
The load–displacement curves in Figure 15 demonstrate the enhancements in initial stiffness and IP capacity achieved by the proposed mega-interlocking block for URM walls. For the 1200 × 2400 Wall, the mega-interlocking block wall with mortar and the concrete wall exhibit negligible structural improvements compared to the standard block wall. However, for URM walls with lengths exceeding 2.4 m, the mega-interlocking block walls (both with and without mortar) consistently outperform standard masonry walls in terms of the initial stiffness and IP capacity. This phenomenon can be attributed to the failure mechanisms illustrated in Figure 16. The 1200 × 2400 Walls are primarily governed by flexural rocking failure, which minimizes the contribution of interlocking mechanisms and thus results in limited improvements. In contrast, larger walls exhibit shear-dominated failure mechanisms, where the interlocking mechanism plays a significantly more critical role.
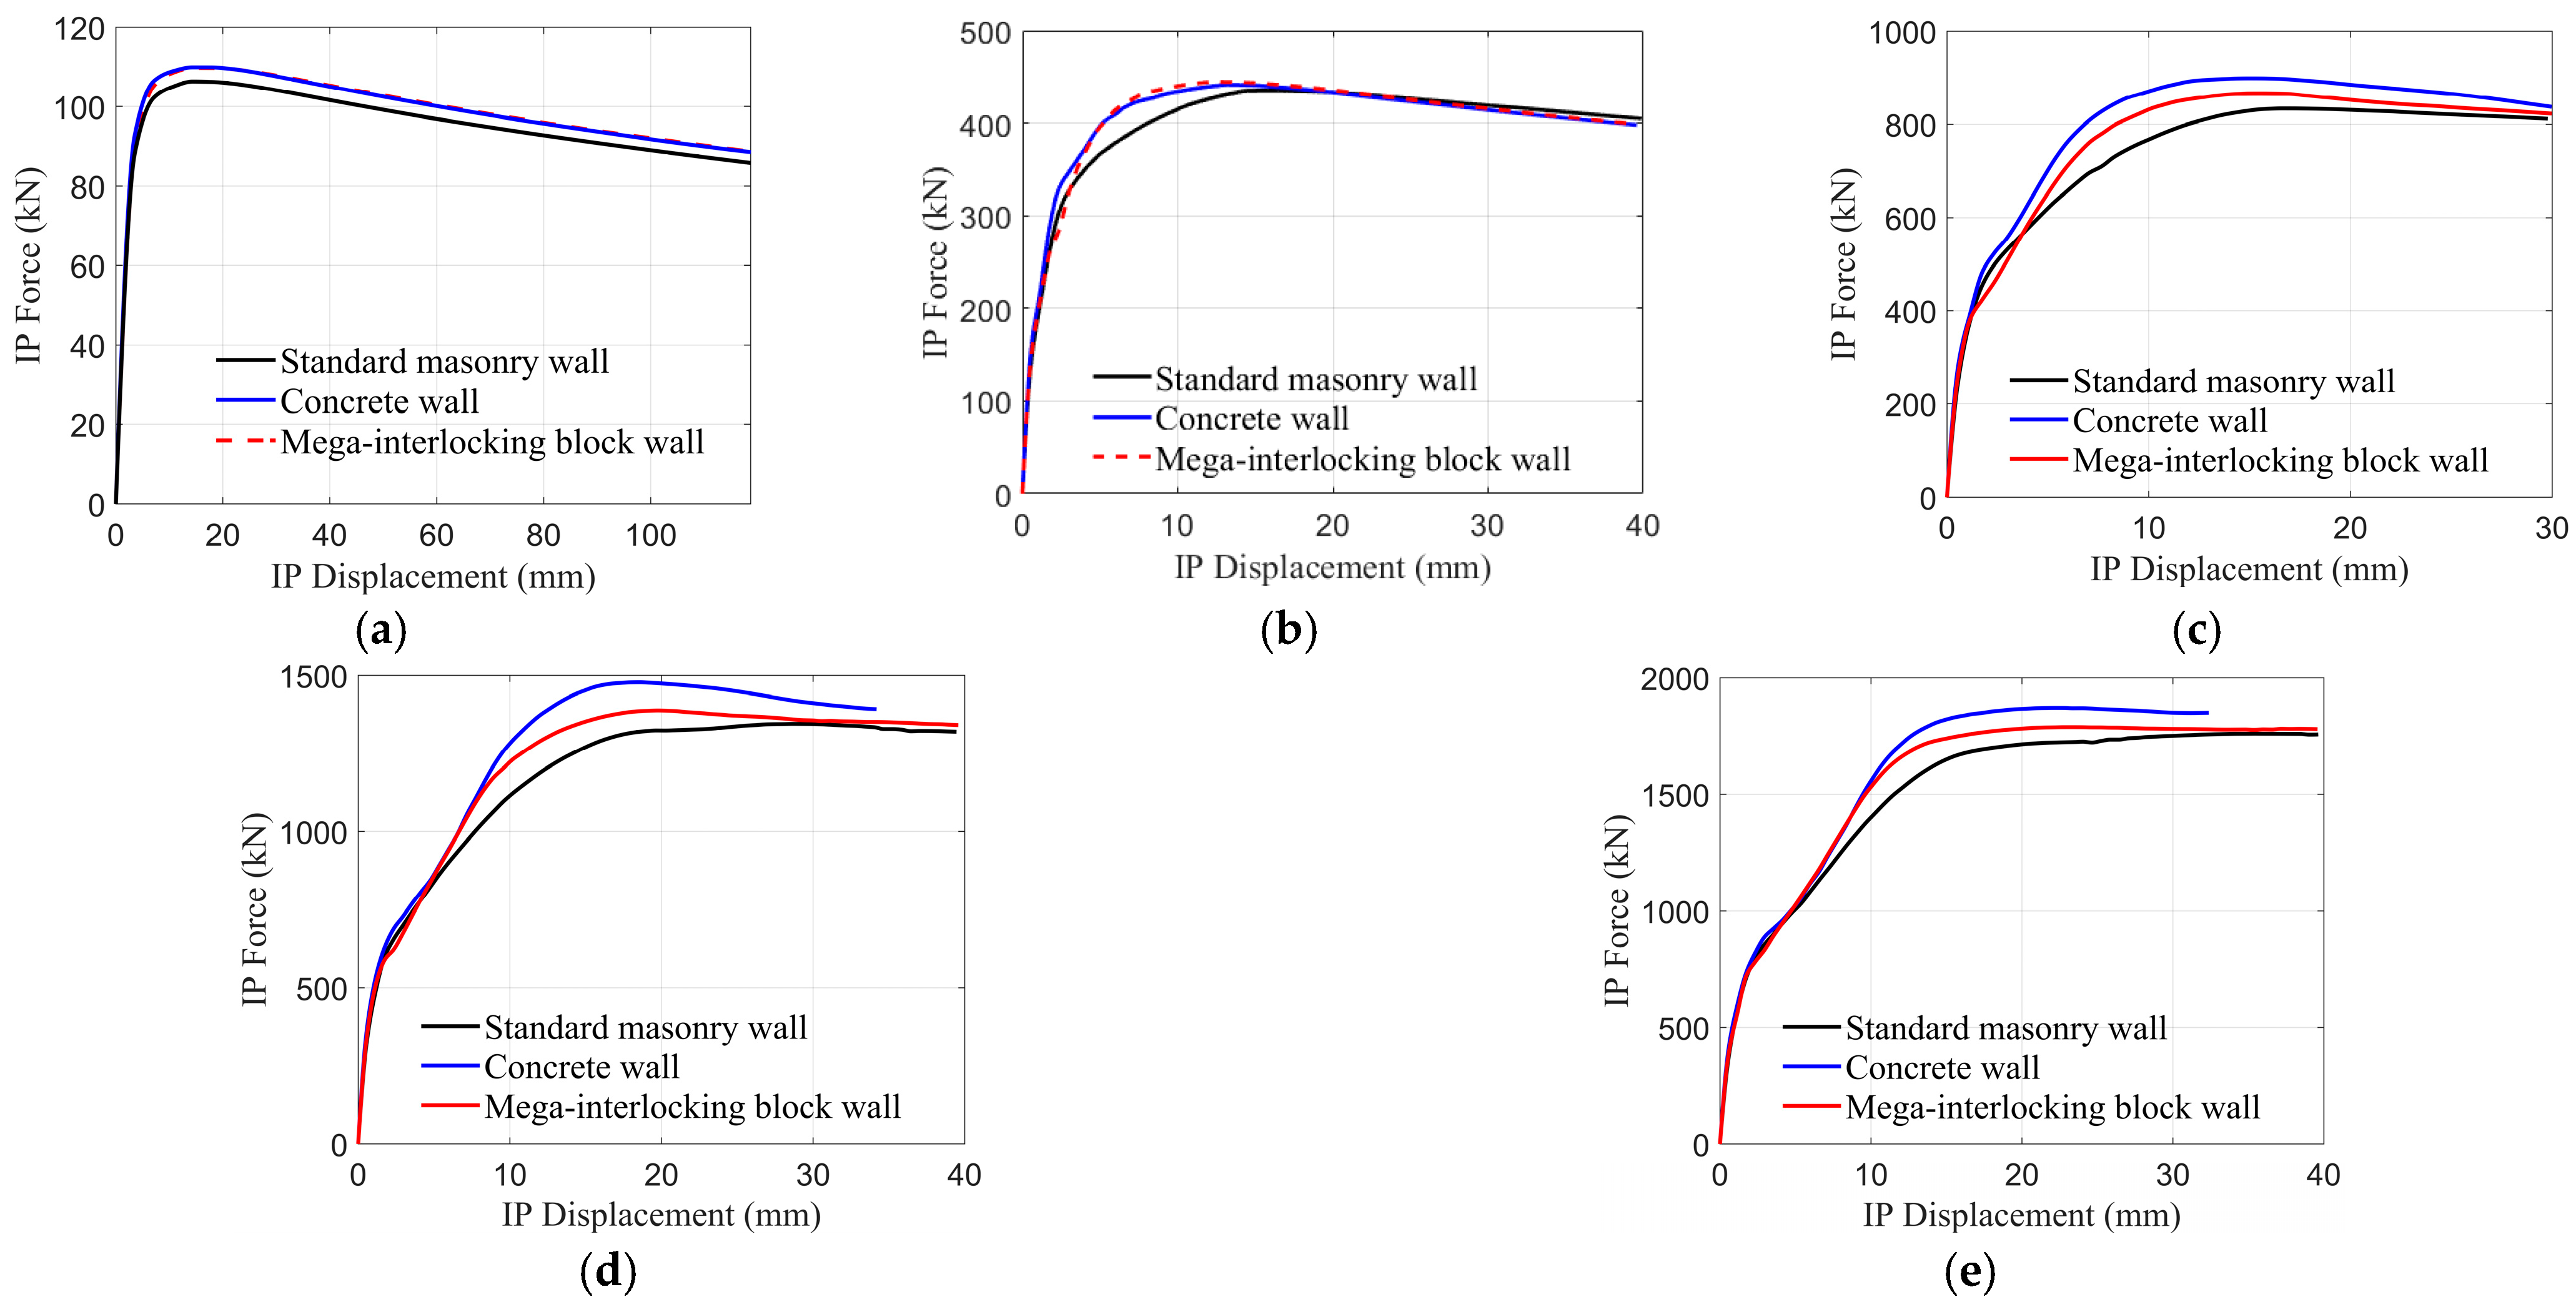
For RM walls shown in Figure 17, a similar trend is observed; however, the improvements introduced by the interlocking mechanisms and block size are less pronounced. This reduced impact is due to the effects of grout and reinforcement, which enable the walls to behave as a single unit, regardless of block size or integration. Consequently, the greater stiffness provided by the interlocking blocks and concrete walls in the URM walls diminishes in RM walls due to the enhanced structural integrity imparted by the reinforcement and grout.
Table 2 provides a quantitative summary of the initial stiffness and IP capacity for URM walls. Among the evaluated configurations, the 4800 × 2400 Wall demonstrates the maximum increase, achieving a 69.8% improvement in stiffness and a 16.2% increase in capacity. Moreover, walls constructed with mega-interlocking blocks consistently outperform their mortarless counterparts, highlighting the structural advantages of mortar in improving block integration. Additionally, these results demonstrate higher stiffness and capacity values compared to those reported in Section 3.1.1. This improvement is attributed to the size effect, where the reduction in the number of mortar joints in mega-interlocking blocks offers a distinct advantage over interlocking mechanisms alone. The results of RM walls are shown in Table 3, which excludes initial stiffness values as all walls exhibit similar performance in this aspect. As expected, the improvements in stiffness and capacity are generally less pronounced than those observed for URM walls. This is due to the contributions of grout and reinforcement, which enhance the overall structural performance of all wall types, thereby diminishing the relative advantages of mega-interlocking blocks when compared to standard masonry walls.
The mega-interlocking walls in the parametric study exhibit the same failure modes of the validated walls depending on aspect ratio and loading: flexural rocking for slender walls (AR = 2), diagonal shear cracking for squat walls (AR = 0.4–0.6), and toe crushing at high pre-compression. The flexural rocking mode is inherently well-captured by the CDP model, as it depends primarily on compressive/tensile block failure rather than joint behavior.

4.3. OOP Behavior

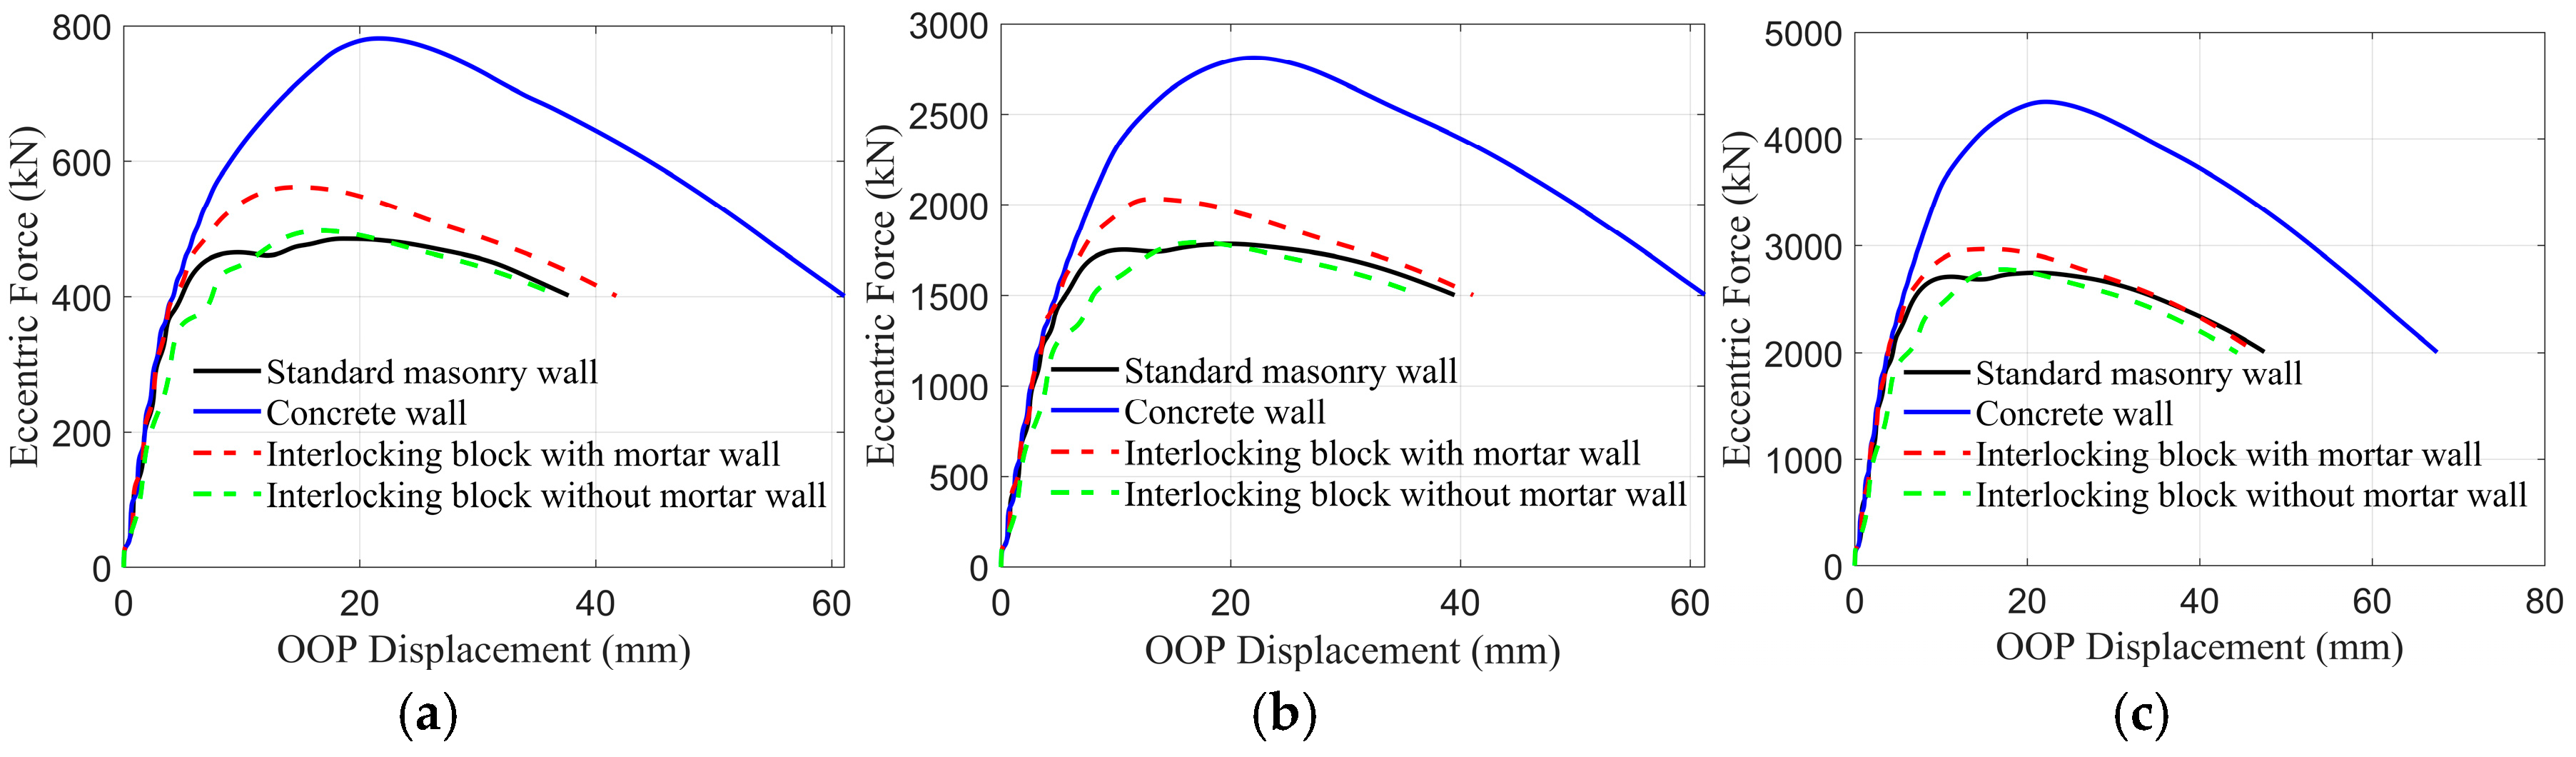
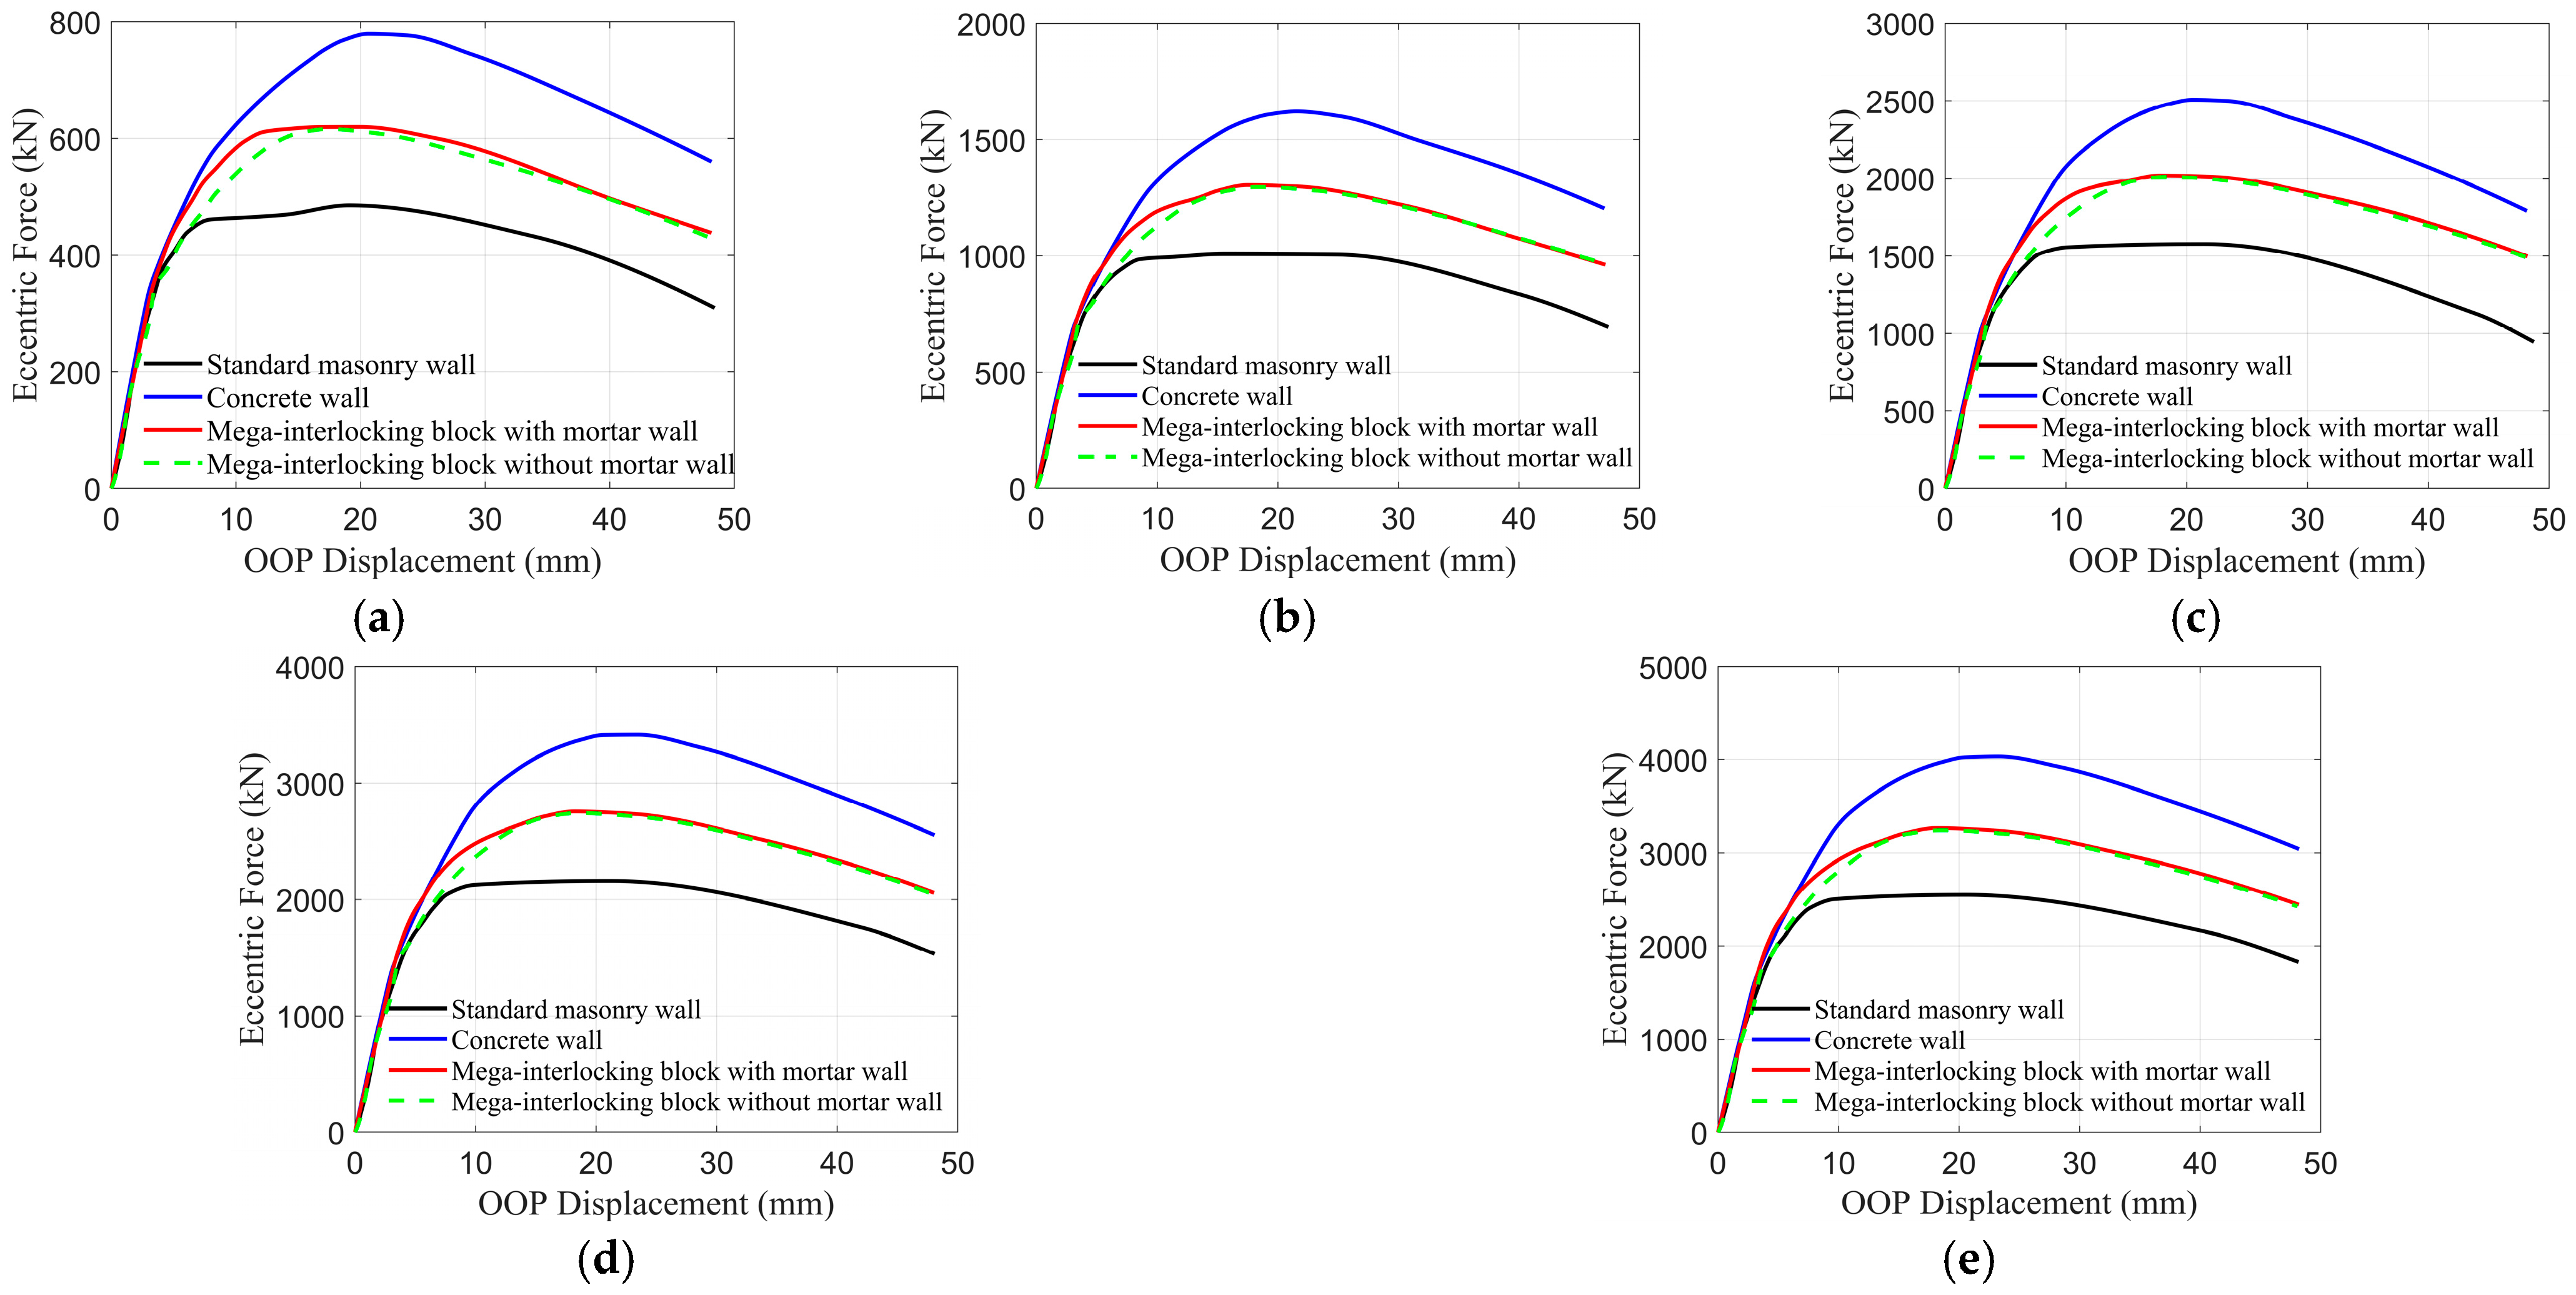
For URM walls under OOP loading, the load–displacement curves in Figure 18 demonstrate consistent performance trends across various wall configurations. Mega-interlocking block walls, whether with or without mortar, consistently outperform the standard masonry walls in terms of OOP capacity. The quantitative data in Table 4 indicates that mega-interlocking block walls with mortar achieve OOP capacity improvements ranging from 27.6% to 29.5%, slightly surpassing their mortarless counterparts, which show improvements ranging from 26.9% to 28.7%. Moreover, consistent with the trends observed in the IP loading scenario, the capacity increases associated with mega-interlocking block walls are substantially greater than those achieved with interlocking blocks alone, as detailed in Section 3.3.2. This finding underscores the structural advantages of mega blocks.
For RM walls subjected to OOP loading, the load–displacement curves and relevant data are presented in Figure 19 and Table 5. Similar to the IP loading scenario, mega-interlocking block walls and concrete walls outperform standard masonry walls. As shown in Table 5, the increases in OOP capacities for RM walls constructed with mega-interlocking blocks and concrete walls compared to standard masonry walls are relatively modest, compared to URM walls.

4.4. Sensitivity Discussion

To assess the robustness of the reported performance improvements, a sensitivity study was conducted on three key parameters.
Friction coefficient: The adopted μ = 0.7 from CSA S304 [3] is supported by experimental data from Lin et al. [59] (μ = 0.58–0.61 from 36 tests on dry-stack joints) and the JCSS Probabilistic Model Code [60] (mean μ = 0.8). Analyses with μ = 0.5 and μ = 0.9 showed capacity variation of ±8–12%, while the relative ranking of configurations remained unchanged.
Interface cohesion and tensile strength: Parametric variation of ±30% from baseline values show peak load sensitivity of 5–15%, with higher sensitivity for squat walls (AR = 0.4–0.6) where shear failure dominates. For slender walls (AR = 2), sensitivity is less than 5%.
Block compressive strength: A ±20% variation produces less than ±7% change in IP capacity for shear-governed walls, confirming that joint properties are more influential than unit strength. This is consistent with Metwally et al. [29] and Zeng and Li [21]. While absolute capacity values are sensitive to parameter assumptions, the relative performance improvements in mega-interlocking blocks over standard blocks are robust.

4.5. Practical Considerations

While this study focuses on numerical performance, several practical aspects are important for potential implementation.
Lifting and placement: The 3 × 3 mega-interlocking block weighs approximately 162 kg, exceeding manual handling limits but within the capacity of standard forklifts (1–5 tons) and scissor lifts. Robotic systems such as the Hadrian X [61] handle large masonry units at 300–500 blocks/hour with sub-millimeter accuracy. The self-aligning interlocking mechanism reduces positional precision requirements.
Manufacturing tolerances: Dry-stack masonry requires tolerances of ±1.6 mm per TMS 1430-21 [62]. Ngapeya et al. [63] demonstrated that height imperfections significantly affect load distribution in dry-stack walls. Modern CNC-controlled manufacturing processes can achieve the required tolerances.
Stress concentration: Furukawa and Masuda [64] showed through diagonal compression tests that strain concentrates at corners of interlocking protrusions, with right-angle features producing higher stress concentration factors. Future design refinement should consider filleted or obtuse-angle corners to mitigate this effect.
Connection to transversal walls: A conceptual connection detail features alternating block orientation at T-junctions, horizontal reinforcement extending across the junction every two courses, and grouted vertical cores at all T-positions. This connection detail requires experimental validation.

5. Conclusions

This study introduces the “mega-interlocking block” as a novel alternative to standard concrete units for masonry construction. Both unreinforced masonry (URM) and reinforced masonry (RM) configurations constructed with mega-interlocking blocks were compared to conventional standard block walls using a simplified micro-modeling approach.
The research first highlighted the critical role of bed joints in maintaining wall integrity, which informed the development of the interlocking mechanism. This mechanism prioritizes horizontal (bed joint) connections and incorporates a stepped configuration for vertical (head joint) connections. Finite element (FE) simulations revealed that interlocking blocks significantly enhanced wall stiffness and load-bearing capacity under IP loading, particularly for squat walls. Mortared walls demonstrated superior performance compared to dry-stack configurations, underscoring the importance of mortar in improving block integration. However, under OOP loading, the benefits of interlocking blocks were less pronounced, especially when mortar was absent.
Building on these findings, the mega-interlocking block was developed to address the limitations of interlocking blocks to further improve construction efficiency and structural performance. The results showed that mega-interlocking blocks outperformed standard masonry units and interlocking blocks in most scenarios, particularly for URM walls. The URM walls constructed with mega-interlocking blocks exhibited substantial improvements in the IP initial stiffness and IP and OOP capacity, with the most notable benefits observed in walls with larger aspect ratios. In RM walls, while the relative advantages of mega-interlocking blocks were less pronounced due to the homogenizing effects of grout and reinforcement, they still provided a robust structural solution.
The mega-interlocking block represents a numerically demonstrated potential in masonry design, providing a viable and efficient alternative to standard blocks. Its advanced design enhances construction efficiency while improving structural integrity, marking a promising structural performance in meeting the demands of modern masonry construction. Future work should focus on experimental validation of the proposed block and further investigation into the structural behavior of masonry walls constructed with these blocks.
The following limitations should be acknowledged: (a) the study is entirely numerical and requires experimental validation; (b) mortar joint parameters for RM cases were assumed identical to URM cases; (c) tensile strength was assumed as 15% of compressive strength based on empirical relationships [33,41,42], which should be verified experimentally per ASTM C1006 [65]; (d) OOP loading was limited to one-way bending; (e) the BK exponent η = 2 was adopted from composite testing [34,35]; and (f) practical implementation aspects require further investigation. Future work should prioritize experimental testing, two-way OOP bending, cyclic loading behavior, and design guidelines for mega-interlocking masonry construction.

Author Contributions

Conceptualization, A.L. and Y.L.; investigation, A.L., B.Z. and Y.L.; resources, A.L., B.Z. and Y.L.; writing—original draft preparation, A.L.; writing—review and editing, A.L., B.Z., C.C.-N. and Y.L.; supervision, Y.L.; funding acquisition, C.C.-N. and Y.L. All authors have read and agreed to the published version of the manuscript.

Funding

This study is funded by the Natural Sciences and Engineering Research Council (NSERC) in Canada through the Alliance Grant ALLRP 567205-21.

Data Availability Statement

Data will be available upon reasonable request.

Conflicts of Interest

The authors declare no conflicts of interest. The funders had no role in the design of the study; in the collection, analyses, or interpretation of data; in the writing of the manuscript; or in the decision to publish the results.

References

  1. Dauda, J.A.; Iuorio, O.; Muhit, I.B.; da Silva, L.C.M. Systematic review of experimental testing of masonry walls’ failure: Comparative analysis and future directions. Eng. Fail. Anal. 2024, 163, 108571. [Google Scholar] [CrossRef]
  2. TMS. Building Code Requirements and Specification for Masonry Structures (TMS 402/602-22); The Masonry Society Boulder: Longmont, CO, USA, 2022. [Google Scholar]
  3. CSA S304-14; Design of Masonry Structures. CSA Group: Toronto, ON, Canada, 2014.
  4. BS EN 771-3:2011+A1:2015; Specification for Masonry Units—Part 3: Aggregate Concrete Masonry Units. BSI: London, UK, 2015.
  5. IS 2185-1:2005; Concrete Masonry Units—Specification, Part 1: Hollow and Solid Concrete Blocks. Bureau of Indian Standards: New Delhi, India, 2005.
  6. Xiao, B.; Chen, C.; Yin, X. Recent advancements of robotics in construction. Autom. Constr. 2022, 144, 104591. [Google Scholar] [CrossRef]
  7. Ramamurthy, K.; Kunhanandan Nambiar, E.K. Accelerated masonry construction review and future prospects. Prog. Struct. Eng. Mater. 2004, 6, 1–9. [Google Scholar] [CrossRef]
  8. Foraboschi, P. Masonry does not limit itself to only one structural material: Interlocked masonry versus cohesive masonry. J. Build. Eng. 2019, 26, 100831. [Google Scholar] [CrossRef]
  9. Chhetri, N.; Feldman, L.R. Impact of concrete masonry unit geometry on masonry assemblage strength. Can. J. Civ. Eng. 2023, 50, 994–1004. [Google Scholar] [CrossRef]
  10. Yavartanoo, F.; Kang, J.; Kang, T.H.K. Numerical parametric study of dry-stack masonry walls with varied dimensional and loading configurations. Structures 2024, 61, 106050. [Google Scholar] [CrossRef]
  11. Thanoon, W.A.; Jaafar, M.S.; Abdul Kadir, M.R.; Abang Ali, A.A.; Trikha, D.N.; Najm, A.M.S. Development of an innovative interlocking load bearing hollow block system in Malaysia. Constr. Build. Mater. 2004, 18, 445–454. [Google Scholar] [CrossRef]
  12. Baneshi, V.; Dehghan, S.M.; Hassanli, R. An experimental study on the behavior of interlocking masonry blocks manufactured using 3D printed mold. Adv. Struct. Eng. 2023, 26, 360–380. [Google Scholar] [CrossRef]
  13. Qu, B.; Stirling, B.J.; Jansen, D.C.; Bland, D.W.; Laursen, P.T. Testing of flexure-dominated interlocking compressed earth block walls. Constr. Build. Mater. 2015, 83, 34–43. [Google Scholar] [CrossRef]
  14. Kohail, M.; Elshafie, H.; Rashad, A.; Okail, H. Behavior of post-tensioned dry-stack interlocking masonry shear walls under cyclic in-plane loading. Constr. Build. Mater. 2019, 196, 539–554. [Google Scholar] [CrossRef]
  15. Afzal, Q.; Abbas, S.; Abbass, W.; Ahmed, A.; Azam, R.; Rizwan Riaz, M. Characterization of sustainable interlocking burnt clay brick wall panels: An alternative to conventional bricks. Constr. Build. Mater. 2020, 231, 117190. [Google Scholar] [CrossRef]
  16. Casapulla, C.; Mousavian, E.; Argiento, L.; Ceraldi, C.; Bagi, K. Torsion-shear behaviour at the interfaces of rigid interlocking blocks in masonry assemblages: Experimental investigation and analytical approaches. Mater. Struct. Constr. 2021, 54, 134. [Google Scholar] [CrossRef]
  17. Thanoon, W.A.; Alwathaf, A.H.; Noorzaei, J.; Jaafar, M.S.; Abdulkadir, M.R. Nonlinear finite element analysis of grouted and ungrouted hollow interlocking mortarless block masonry system. Eng. Struct. 2008, 30, 1560–1572. [Google Scholar] [CrossRef]
  18. Shuai, L.; Zhang, J.; Wu, T.; Zhang, Z.; Liu, S.; Liu, B. Seismic behavior of load-bearing horizontal-hole interlocking concrete block masonry walls: An experimental investigation of variable configurations. Eng. Struct. 2024, 307, 117939. [Google Scholar] [CrossRef]
  19. Shi, T.; Zhang, X.; Hao, H.; Chen, C. Experimental and numerical investigation on the compressive properties of interlocking blocks. Eng. Struct. 2021, 228, 111561. [Google Scholar] [CrossRef]
  20. Xie, G.; Zhang, X.; Hao, H.; Shi, T.; Cui, L.; Thomas, J. Behaviour of reinforced mortarless interlocking brick wall under cyclic loading. Eng. Struct. 2023, 283, 115890. [Google Scholar] [CrossRef]
  21. Zeng, B.; Li, Y.; Cruz Noguez, C. Modeling and parameter importance investigation for simulating in-plane and out-of-plane behaviors of un-reinforced masonry walls. Eng. Struct. 2021, 248, 113233. [Google Scholar] [CrossRef]
  22. Zeng, B.; Li, Y. Towards Performance-Based Design of Masonry Buildings: Literature Review. Buildings 2023, 13, 1534. [Google Scholar] [CrossRef]
  23. El-Dakhakhni, W.; Ashour, A. Seismic Response of Reinforced-Concrete Masonry Shear-Wall Components and Systems: State of the Art. J. Struct. Eng. 2017, 143, 03117001. [Google Scholar] [CrossRef]
  24. Salem, S.; Ezzeldin, M.; El-Dakhakhni, W.; Tait, M. Out-of-Plane Behavior of Load-Bearing Reinforced Masonry Shear Walls. J. Struct. Eng. 2019, 145, 04019127. [Google Scholar] [CrossRef]
  25. Zeng, B.; Li, Y. In-plane and out-of-plane one-way vertical bending behavior interaction analysis of unreinforced masonry walls with newly developed load capacity interaction curve. Eng. Struct. 2024, 305, 117729. [Google Scholar] [CrossRef]
  26. Zeng, B.; Li, Y. Numerical Investigation of Fully Grouted Reinforced Concrete Masonry Walls under Bi-directional Loading: In-plane Capacity Reduction due to Out-of-plane Loading. J. Struct. Eng. 2024, 150, 04024167. [Google Scholar] [CrossRef]
  27. Page, A.W. Finite Element Model for Masonry. ASCE J. Struct. Div. 1978, 104, 1267–1285. [Google Scholar] [CrossRef]
  28. Metwally, Z.; Li, Y.; Zeng, B. Finite element-based reliability analysis of reinforced concrete masonry walls under eccentric axial loading considering slenderness effects. Eng. Struct. 2024, 304, 117597. [Google Scholar] [CrossRef]
  29. Metwally, Z.; Zeng, B.; Li, Y. Probabilistic Behavior and Variance-Based Sensitivity Analysis of Reinforced Concrete Masonry Walls Considering Slenderness Effect. ASCE-ASME J. Risk Uncertain. Eng. Syst. Part A Civ. Eng. 2022, 8, 04022051. [Google Scholar] [CrossRef]
  30. Abdulla, K.F.; Cunningham, L.S.; Gillie, M. Simulating masonry wall behaviour using a simplified micro-model approach. Eng. Struct. 2017, 151, 349–365. [Google Scholar] [CrossRef]
  31. Zeng, B.; Li, Y. Formulation, Implementation, and Validation of a 3D Damage-Plasticity Cohesive-Interface Model with Multiple Yield Surfaces for Cyclic Modeling of Mortar Joints. J. Struct. Eng. 2024, 150, 04024054. [Google Scholar] [CrossRef]
  32. Dassault Systemes. Abaqus/Standard 2017; Dassault Syst SIMULIA, Provid RI 2017; Dassault Systems Simulia Corp.: Johnston, RI, USA; Dassault Systemes: Waltham, MA, USA, 2017. [Google Scholar]
  33. Lourenço, P.B. Computational Strategies for Masonry Structures. Ph.D. Thesis, Delft University of Technology, Delft, The Netherlands, 1996. [Google Scholar]
  34. Benzeggagh, M.L.; Kenane, M. Measurement of mixed-mode delamination fracture toughness of unidirectional glass/epoxy composites with mixed-mode bending apparatus. Compos. Sci. Technol. 1996, 56, 439–449. [Google Scholar] [CrossRef]
  35. Camanho, P.P.; Dávila, C.G. Mixed-Mode Decohesion Finite Elements for the Simulation of Delamination in Composite Materials; NASA/TM-2002-211737; NASA: Washington, DC, USA, 2002.
  36. Nie, Y.; Sheikh, A.; Visintin, P.; Griffith, M.C. A robust computational strategy for failure prediction of masonry structures using an improved multi-surface damage-plasticity model. Int. J. Numer. Methods Eng. 2023, 124, 2498–2528. [Google Scholar] [CrossRef]
  37. Lee, J.; Fenves, G.L. Plastic-damage model for cyclic loading of concrete structures. J. Eng. Mech. 1998, 124, 892–900. [Google Scholar] [CrossRef]
  38. Li, Y.; Zeng, B. Modeling of masonry structures using a new 3D cohesive interface material model considering dilatancy softening. Eng. Struct. 2023, 277, 115466. [Google Scholar] [CrossRef]
  39. Rainone, L.S.; Tateo, V.; Casolo, S.; Uva, G. About the Use of Concrete Damage Plasticity for Modeling Masonry Post-Elastic Behavior. Buildings 2023, 13, 1915. [Google Scholar] [CrossRef]
  40. Bažant, Z.P.; Oh, B.H. Crack band theory for fracture of concrete. Matériaux Constr. 1983, 16, 155–177. [Google Scholar] [CrossRef]
  41. ACI 318-19; Building Code Requirements for Structural Concrete. American Concrete Institute: Farmington Hills, MI, USA, 2019.
  42. EN 1992-1-1:2004; Eurocode 2: Design of Concrete Structures—Part 1-1: General Rules and Rules for Buildings. CEN: Brussels, Belgium, 2004.
  43. da Porto, F. In-Plane Cyclic Behaviour of Thin Layer Joint Masonry Walls. Ph.D. Thesis, Universita’ Degli Studi di Trento, Trento, Italy, 2005. [Google Scholar]
  44. Magenes, G.; Calvi, G.M. In-plane seismic response of brick masonry walls. Earthq. Eng. Struct. Dyn. 1997, 26, 1091–1112. [Google Scholar] [CrossRef]
  45. Haach, V.G.; Vasconcelos, G.; Lourenço, P.B. Experimental analysis of reinforced concrete block masonry walls subjected to in-plane cyclic loading. J. Struct. Eng. 2010, 136, 452–462. [Google Scholar] [CrossRef]
  46. da Porto, F.; Guidi, G.; Garbin, E.; Modena, C. In-Plane Behavior of Clay Masonry Walls: Experimental Testing and Finite-Element Modeling. J. Struct. Eng. 2010, 136, 1379–1392. [Google Scholar] [CrossRef]
  47. Vaculik, J. Unreinforced Masonry Walls Subjected to Out-of-Plane Seismic Actions. Ph.D. thesis, University of Adelaide, Adelaide, Australia, 2012. [Google Scholar]
  48. Hoque, N. In-Plane Cyclic Testing of Reinforced Concrete Masonry Walls to Assess the Effect of Varying Reinforcement Anchorage and Boundary Conditions. Master’s Thesis, University of Calgary, Calgary, AB, Canada, 2013. [Google Scholar] [CrossRef]
  49. Janaraj, T.; Dhanasekar, M. Finite element analysis of the in-plane shear behaviour of masonry panels confined with reinforced grouted cores. Constr. Build. Mater. 2014, 65, 495–506. [Google Scholar] [CrossRef]
  50. Bolhassani, M.; Hamid, A.A.; Lau, A.C.W.; Moon, F.L. Simplified micro modeling of partially grouted masonry assemblages. Constr. Build. Mater. 2015, 83, 159–173. [Google Scholar] [CrossRef]
  51. Mohsin, E. Support Stiffness Effect on Tall Load Bearing Masonry Walls. Ph.D. Thesis, University of Alberta, Edmonton, AB, Canada, 2005. [Google Scholar]
  52. Tomazevic, M. Earthquake-Resistant Design of Masonry Buildings; Imperial College Press: London, UK, 1999. [Google Scholar]
  53. ASTM E 2126; Standard Test Methods for Cyclic (Reversed) Load Test for Shear Resistance of Vertical Elements of the Lateral Force Resisting Systems for Buildings. ASTM International: West Conshohocken, PA, USA, 2025.
  54. Lourenço, P.B.; Pina-Henriques, J. Validation of analytical and continuum numerical methods for estimating the compressive strength of masonry. Comput. Struct. 2006, 84, 1977–1989. [Google Scholar] [CrossRef]
  55. Fay, L.; Cooper, P.; De Morais, H.F. Innovative interlocked soil-cement block for the construction of masonry to eliminate the settling mortar. Constr. Build. Mater. 2014, 52, 391–395. [Google Scholar] [CrossRef]
  56. Thallon, R. Dry-Stack Block; Fine Homebuilding: Newtown, CT, USA, 1983; pp. 50–57. [Google Scholar]
  57. Yavartanoo, F.; Kang, T.H.-K. Dry-Stack Masonry Wall Modeling Using Finite-Element Method. J. Struct. Eng. 2022, 148, 04022176. [Google Scholar] [CrossRef]
  58. Lin, K.; Liu, H.; Wei, C.; Huang, Q. Effects of shear rate on cyclic behavior of dry stack masonry joint. Constr. Build. Mater. 2017, 157, 809–817. [Google Scholar] [CrossRef]
  59. Lin, K.; Totoev, Y.Z.; Liu, H.; Wei, C. Experimental Characteristics of Dry Stack Masonry under Compression and Shear Loading. Materials 2015, 8, 8731–8744. [Google Scholar] [CrossRef]
  60. JCSS. Probabilistic Model Code, Part 3: Resistance Models, Chapter 3.30: Masonry Properties; Joint Committee on Structural Safety: Zurich, Switzerland, 2011. [Google Scholar]
  61. FBR Ltd. Hadrian X® Automated Construction Robot. Available online: https://www.fbr.com.au (accessed on 15 January 2025).
  62. TMS 1430-21; Standard Specification for Dry-Stacked, Surface-Bonded Concrete Masonry. The Masonry Society: Longmont, CO, USA, 2021.
  63. Ngapeya, G.G.C.; Waldmann, D.; Scholzen, F. Impact of the height imperfections of masonry blocks on the load bearing capacity of dry-stack masonry walls. Constr. Build. Mater. 2018, 165, 898–913. [Google Scholar] [CrossRef]
  64. Furukawa, A.; Masuda, K. Diagonal Compression Test of Mortar Interlocking Masonry Walls with Various Block Shapes. Front. Built Environ. 2020, 6, 579366. [Google Scholar] [CrossRef]
  65. ASTM C1006/C1006M-19; Standard Test Method for Splitting Tensile Strength of Masonry Units. ASTM International: West Conshohocken, PA, USA, 2019.
Figure 1. Experimental–numerical comparison for the URM wall under IP loading. (a) Load–displacement curve. (b) Crack pattern (Experiment [43]). (c) Crack pattern (FE model).
Modelling 07 00066 g001
Figure 2. Experimental–numerical comparison for the URM wall under OOP loading. (a) Load–displacement curve. (b) Crack pattern (Experiment [47]). (c) Crack pattern (FE model).
Modelling 07 00066 g002
Figure 3. Load–displacement curve for the RM wall under IP loading.
Modelling 07 00066 g003
Figure 4. Load–displacement curve for the RM wall under OOP loading.
Modelling 07 00066 g004
Figure 6. Load–displacement curves for walls subjected to IP loading with different connections at the head and bed joints. (a) Walls with AR = 2. (b) Walls with AR = 0.6. (c) Walls with AR = 0.4.
Modelling 07 00066 g006
Figure 7. Failure mechanisms of walls with AR = 0.6 subjected to IP loading with different connections at the bed and head joints. (a) Standard masonry wall. (b) Concrete wall. (c) Tie-constrained bed joints wall. (d) Tie-constrained head joints wall.
Modelling 07 00066 g007
Figure 8. Load–displacement curves for walls subjected to OOP loading with different connections at the head and bed joints.
Modelling 07 00066 g008
Figure 9. Proposed interlocking block (unit: mm).
Modelling 07 00066 g009
Figure 10. Walls constructed with the proposed interlocking block. (a) Slender wall. (b) Moderately squat wall. (c) Squat wall.
Modelling 07 00066 g010
Figure 11. Load–displacement curves for interlocking block walls, standard block walls, and concrete walls subjected to IP loading. (a) Walls with AR = 2. (b) Walls with AR = 0.6. (c) Walls with AR = 0.4.
Modelling 07 00066 g011
Figure 12. Load–displacement curves for interlocking block walls, standard block walls, and concrete walls subjected to OOP loading. (a) Walls with AR = 2. (b) Walls with AR = 0.6. (c) Walls with AR = 0.4.
Modelling 07 00066 g012
Figure 13. Proposed mega-interlocking blocks (dimension unit: mm). (a) Standard interlocking block. (b) 1 × 2 mega-interlocking block. (c) 1 × 3 mega-interlocking block. (d) 2 × 1 mega-interlocking block. (e) 2 × 2 mega-interlocking block. (f) 2 × 3 mega-interlocking block. (g) 3 × 1 mega-interlocking block. (h) 3 × 2 mega-interlocking block. (i) 3 × 3 mega-interlocking block.
Modelling 07 00066 g013aModelling 07 00066 g013b
Figure 14. Walls considered to evaluate the behavior of 3 × 3 mega-interlocking block. (a) Single-block wall. (b) Two-block wall. (c) Three-block wall. (d) Four-block wall. (e) Five-block wall.
Modelling 07 00066 g014
Figure 15. Load–displacement curves for URM walls constructed with mega-interlocking blocks, standard blocks, and concrete walls under IP loading. (a) 1200 × 2400 Wall. (b) 2400 × 2400 Wall. (c) 3600 × 2400 Wall. (d) 4800 × 2400 Wall. (e) 6000 × 2400 Wall.
Modelling 07 00066 g015
Figure 16. Failure mechanisms of URM walls constructed with mega-interlocking blocks with mortar under IP loading. (a) 1200 × 2400 Wall. (b) 2400 × 2400 Wall. (c) 3600 × 2400 Wall. (d) 4800 × 2400 Wall. (e) 6000 × 2400 Wall.
Modelling 07 00066 g016
Figure 17. Load–displacement curves for RM walls constructed with mega-interlocking blocks, standard blocks, and concrete walls under IP loading. (a) 1200 × 2400 Wall. (b) 2400 × 2400 Wall. (c) 3600 × 2400 Wall. (d) 4800 × 2400 Wall. (e) 6000 × 2400 Wall.
Modelling 07 00066 g017
Figure 18. Load–displacement curves for URM walls constructed with mega-interlocking blocks, standard blocks, and concrete walls under OOP loading. (a) 1200 × 2400 Wall. (b) 2400 × 2400 Wall. (c) 3600 × 2400 Wall. (d) 4800 × 2400 Wall. (e) 6000 × 2400 Wall.
Modelling 07 00066 g018
Figure 19. Load–displacement curves for RM walls constructed with mega-interlocking blocks, standard blocks, and concrete walls under OOP loading. (a) 1200 × 2400 Wall. (b) 2400 × 2400 Wall. (c) 3600 × 2400 Wall. (d) 4800 × 2400 Wall. (e) 6000 × 2400 Wall.
Modelling 07 00066 g019
Table 1. Material parameters of mortar joints for the URM walls.
ParameterIP ModelOOP Model
Head JointBed Joint
K n (MPa)25.1034.9042
K s (MPa)10.3614.4217
K t (MPa)10.3614.4217
μ 0.750.750.75
σ t max (MPa)0.000250.360.00025
c (MPa)0.050.440.17
G I C (N/mm)0.000020.0260.012
G I I C (N/mm)0.0050.0440.04
Table 2. Increase in IP loading stiffnesses (capacity) % of URM walls constructed with mega-interlocking blocks, standard blocks, and concrete walls relative to standard block walls.
Wall IDConcrete WallMega-Interlocking Block with Mortar WallMega-Interlocking Block Without Mortar Wall
1200 × 2400 Wall0 (0)0 (0)0 (0)
2400 × 2400 Wall59.7% (8.1%)52.2% (7.1%)44% (4.3%)
3600 × 2400 Wall79.5% (19.3%)70.5% (10.6%)53.3% (8.2%)
4800 × 2400 Wall77.1% (21.9%)69.8% (16.2%)55% (12.8%)
6000 × 2400 Wall70.2% (17.6%)64% (13.6%)51.5% (11.8%)
Table 3. Increase in IP capacity % of RM walls constructed with mega-interlocking blocks, standard blocks, and concrete walls relative to standard block walls.
Wall IDConcrete WallMega-Interlocking Block Wall
1200 × 2400 Wall00
2400 × 2400 Wall2%2%
3600 × 2400 Wall7.8%4%
4800 × 2400 Wall9.9%3.2%
6000 × 2400 Wall6.3%1.6%
Table 4. Increase in OOP capacity of URM walls constructed with mega-interlocking blocks, standard blocks, and concrete walls compared to standard block walls.
Wall IDConcrete WallMega-Interlocking Block with Mortar WallMega-Interlocking Block Without Mortar Wall
1200 × 2400 Wall60.8%27.8%27%
2400 × 2400 Wall71%29.5%28.7%
3600 × 2400 Wall59%28%27.5%
4800 × 2400 Wall58.3%27.8%27.2%
6000 × 2400 Wall58.3%27.6%26.9%
Table 5. Increase in OOP capacity of RM walls constructed with mega-interlocking blocks, standard blocks, and concrete walls compared to standard block walls.
Wall IDConcrete WallMega-Interlocking Block Wall
1200 × 2400 Wall00
2400 × 2400 Wall2%2%
3600 × 2400 Wall7.8%4%
4800 × 2400 Wall9.9%3.2%
6000 × 2400 Wall6.3%1.6%
Disclaimer/Publisher’s Note: The statements, opinions and data contained in all publications are solely those of the individual author(s) and contributor(s) and not of MDPI and/or the editor(s). MDPI and/or the editor(s) disclaim responsibility for any injury to people or property resulting from any ideas, methods, instructions or products referred to in the content.