Article

Spirally Coiled Tube Flocculators: A New Hydrodynamic Design for Water Treatment

by
Danieli Soares de Oliveira
1,
Maurício Sartori
2 and
Clainer Bravin Donadel
2,*
1
Federal Institute of Espírito Santo—Campus Cariacica, Cariacica 29150-410, Espírito Santo, Brazil
2
Federal Institute of Espírito Santo—Campus Vitória, Vitória 29040-780, Espírito Santo, Brazil
*
Author to whom correspondence should be addressed.
Modelling 2025, 6(4), 139; https://doi.org/10.3390/modelling6040139
Submission received: 30 September 2025 / Revised: 21 October 2025 / Accepted: 28 October 2025 / Published: 30 October 2025

Abstract

The design of tubular flocculators has advanced in the pursuit of more efficient and compact water treatment systems. Helically coiled tube flocculators (HCTFs) are known for generating stable secondary flows and uniform hydrodynamic patterns after the development length. However, their constant geometry restricts the hydrodynamic variability required for optimized flocculation. This study introduces the spirally coiled tube flocculator (SCTF), characterized by a winding diameter that varies along its length. CFD simulations and laboratory-scale experiments compared HCTFs and SCTFs in terms of turbidity removal capacity, axial velocity profiles, secondary flows, streamlines, and global velocity gradients. The SCTF outperformed the HCTFs under all evaluated configurations, achieving up to 98.2% turbidity removal. The results emphasize the potential of spiral geometries to enhance process efficiency and highlight the need to reconsider hydrodynamic strategies in the design of tubular flocculators.

1. Introduction

Access to safe drinking water remains a global challenge, affecting billions of people, particularly in rural and peri-urban regions. Water security, understood as reliable and equitable access to safe water, is a multidimensional concept that integrates environmental, social, and economic factors and is widely recognized as a cornerstone of sustainable development [1]. This reality underscores the urgency of sustainable and affordable solutions [2]. Promising alternatives include low-cost water treatment technologies designed for rural contexts [3], compact systems for decentralized applications [4], and sustainable approaches that support vulnerable communities [5]. Historical perspectives confirm that water quality concerns and treatment practices have long shaped societal development [6]. Water insecurity directly threatens public health, driving the spread of disease and deepening social inequalities, with inadequate water, sanitation, and hygiene identified as major contributors to the global burden of disease, particularly in low- and middle-income countries [7,8]. Governance and water resource management issues further intensify exclusion [9].
Evidence from rural regions reveals that infrastructure deficits, water quality concerns, and socioeconomic barriers continue to limit progress, highlighting the challenges of achieving universal and equitable access to safe water and sanitation [10]. Within this landscape, researchers increasingly focus on natural coagulants in simplified systems as environmentally friendly and accessible options [11,12]. At the same time, contamination by heavy metals and emerging compounds underscores the need for adaptable treatment strategies [13].
Treating water for human consumption requires efficient removal of suspended particles and colloidal matter, with flocculation playing a central role. Large-scale systems often rely on mechanized flocculators, while baffled channels remain common in developing countries. Both approaches face limitations: mechanized units demand high costs, energy, and maintenance, while baffled channels create intense mixing zones that break flocs and reduce process efficiency. Against this backdrop, helically coiled tube flocculators (HCTFs) have emerged as cost-effective alternatives. They harness curved flow to generate centrifugal forces that promote particle collisions, enhancing floc formation and improving performance [14,15,16,17]. Although HCTFs achieve high turbidity removal rates [16], their constant tube geometry generates uniform flow patterns, which restrict hydrodynamic variability and limit adaptability under changing raw water conditions. Recent studies emphasize their relevance in the search for more compact and efficient units, particularly through hydrodynamic analyses and probabilistic assessments of process efficiency [18].
Computational fluid dynamics (CFD) has become an essential tool to analyze hydrodynamic parameters and guide optimization, complementing large-scale trials and experimental validations. A broad body of research demonstrates that hydrodynamic conditions—such as residence time, velocity gradient, and mixing patterns—play a decisive role in flocculation efficiency, directly shaping floc formation, stability, and growth. Large-scale experimental trials, such as those conducted in [19], provide strong evidence of the effectiveness and feasibility of tubular flocculators compared with conventional purification methods. Their results showed average turbidity and color removal efficiencies of 98.07% and 98.50%, respectively. They also demonstrated that raw water turbidity, residence time, and velocity gradient act as critical factors that govern flocculator performance.
Within this context, researchers increasingly rely on computational models—especially computational fluid dynamics (CFD)—to optimize these parameters and improve system hydraulics [15,17,20,21]. Studies on nanofiltration [22] and produced water management [23] further illustrate how mathematical modeling supports process optimization and decision-making, reinforcing the relevance of CFD in flocculation research. Recent advances in reuse and advanced treatment technologies also highlight the role of modeling in guiding safe water provision [24]. Despite the progress achieved with HCTFs, researchers still need to develop strategies that introduce greater hydrodynamic variability throughout the flocculation process.
This study introduces spirally coiled tube flocculators (SCTFs), a novel configuration where the coil diameter gradually increases along the tube, generating variable shear intensities and secondary flows. Although coils with variable diameters or conical geometries have been previously explored in other engineering fields, particularly in heat exchangers and thermal systems, their use for water treatment purposes—specifically in coagulation and flocculation processes—has not been reported. Therefore, the novelty of this study lies in applying this geometry to enhance hydrodynamic conditions and improve flocculation efficiency in compact water treatment systems. By combining CFD simulations and laboratory experiments, the study demonstrates the hydrodynamic advantages of SCTFs and evaluates their potential as a more efficient and sustainable alternative to HCTFs.

2. Methodology

This study compared two flocculator configurations, one HCTF and one SCTF, using complementary approaches to evaluate performance and hydrodynamic behavior:
(a)
Experimental tests measured turbidity removal efficiency under controlled operating conditions. Identical inlet flow rates and coagulant dosages were applied to both geometries, enabling direct comparison of clarification performance.
(b)
CFD modeling simulated and analyzed internal flow behavior in each flocculator. The simulations provided detailed information on streamline distribution, axial and secondary flow patterns, and hydrodynamic indicators, clarifying the impact of geometric differences on flocculation potential.
The integration of experimental and numerical results delivered a comprehensive understanding of how progressive variation in coil diameter influences flow conditions and flocculation efficiency.

2.1. Geometry of the Flocculators

Three geometries were evaluated: (i) SCTF with a variable diameter of 8 cm at the top and 50 cm at the base (DT = 8 cm and DB = 50 cm), referred to as SCTF; (ii) HCTF with a constant diameter of 28 cm (DT = DB = 28 cm), referred to as HCTF1; and (iii) HCTF with a constant diameter of 50 cm (DT = DB = 50 cm), referred to as HCTF2. All units used the same tube (d = 3/8″, 9.5 mm) with a total length (L) of 36 m, divided into three equal segments of 12 m. The segments were color-coded in the schematic representation (red, yellow, and blue) to indicate different residence times (Figure 1). The models were arranged in a vertical orientation to promote downward flow, combining the effects of centrifugal force and gravity.

2.2. CFD Modeling

This section outlines the steps adopted in CFD modeling, including geometry construction, mesh generation and evaluation, selection of the physical model, boundary conditions, and applied numerical criteria.
Geometry and Mesh Generation
CFD simulations used ANSYS Fluent® 2023 R2 based on the finite volume method. Three-dimensional geometries of the flocculators were created in AutoCAD® 2023 and imported into ANSYS SpaceClaim® 2023 R2. The geometries were then processed in ANSYS Meshing® 2023 R2, where an unstructured mesh was generated with tetrahedral elements in the central region and prismatic elements near the walls, refined with an inflation layer of five layers and a growth rate of 1.2. The sweep method generated hexahedral and prismatic elements through face extrusion, producing meshes with greater regularity and numerical stability.
Mesh Independence and Quality
Mesh independence analysis followed the methodology proposed in [14], ensuring that the results did not depend on the adopted element density. The evaluation monitored the velocity profile along the tube centerline across three different refinement levels. Independence criteria were satisfied when the relative variation between successive results remained below 2%. Table 1 presents the general mesh characteristics for the three tested configurations, considering the total length of the units.
Table 1 shows skewness values below 0.15 and orthogonal quality above 0.97 for all geometries, indicating high numerical quality and suitability for CFD simulations [25].
Flow Conditions and Assumptions
The adopted flow model was laminar ( R e = 1250 ), since the defined hydraulic and geometric conditions produced Reynolds numbers consistent with this regime. In curved tubes such as those used in this study, natural turbulence damping reinforces the selection of the laminar model. Flow regime classification followed the equation proposed in [26].
Simulations ran under steady-state conditions, considering a single-phase, incompressible, and Newtonian fluid (water at room temperature, 998.2 kg/m3; 0.001003 Pa·s). In this context, the term incompressible refers both to the constant fluid density assumption and to the flow regime. The use of single-phase flow represents a methodological simplification that significantly reduces computational effort while maintaining valid and reliable results, since the presence of suspended particles at the turbidity levels evaluated in this study does not substantially affect the hydrodynamic behavior of the units. This approach is widely adopted in the literature for comparative hydrodynamic assessments of systems with different geometric configurations [17,27].
Boundary Conditions and Numerical Criteria
Pressure–velocity coupling applied the COUPLED algorithm, which solves the momentum and continuity equations simultaneously. Convergence was defined by a residual threshold of 10−4 for all equations, ensuring numerical stability and reliable results. Boundary conditions included: (i) uniform inflow across the flocculator inlet section (mass flow rate of 0.0083 kg/s); (ii) outflow with zero gauge pressure and equal flow rate to the inlet; and (iii) walls under a no-slip condition, assuming rigid flocculator surfaces. Temperature remained constant under isothermal conditions, with no heat transfer across boundaries.

2.3. Experimental Evaluation

The experimental stage took place at the Federal Institute of Espírito Santo (Ifes), in the NETRA Research Laboratory (Center for Studies on Water and Wastewater Treatment and Reuse), with the objective of validating the CFD results. HCTFs and SCTFs were tested under controlled laboratory conditions. Three prototypes, described in Section 2.1, were employed, resulting in nine distinct experiments. The characteristics of the tested units appear in Table 2.
The test water was prepared with controlled turbidity by adding bentonite to simulate typical natural water conditions (Section 2.3.1). The applied coagulant was derived from Moringa oleifera, obtained as described in Section 2.3.2. Experimental evaluation included Jar test assays (Section 2.3.3) and hydraulic circuit trials (Section 2.3.4).

2.3.1. Preparation of Synthetic Water

Synthetic water was prepared using natural sodium bentonite, a clay composed mainly of montmorillonite, widely applied in water treatment studies due to its ability to form stable colloidal suspensions and ensure reproducible experimental conditions. This material is characterized by very fine and heterogeneous particles, with a particle size distribution predominantly below 10 µm. Since the primary objective of this study was turbidity removal, turbidity served as the control variable and was adjusted exclusively during sample preparation. Each 2 L jar containing tap water received 0.246 g of bentonite, producing an average turbidity of 50 NTU; higher levels were obtained by proportionally increasing the bentonite dosage. After addition, the suspension underwent vigorous mixing for 30 min to ensure homogeneous particle dispersion. Each 2 L sample was stored in sealed containers for at least 24 h before testing to allow particle stabilization and provide uniform test conditions, followed by homogenization prior to each assay to guarantee proper distribution of suspended solids.

2.3.2. Preparation of the Natural Coagulant from Moringa oleifera

The natural coagulant from Moringa oleifera was prepared from previously de-hulled seeds. The seeds were ground in a mortar with pestle until obtaining a fine, homogeneous powder. One gram of the powder was then added to 100 mL of tap water and stirred on a magnetic stirrer for 10 min at 500 rpm to promote dispersion of the active compounds. The resulting suspension was filtered through filter paper to remove solid residues, producing the coagulant solution, which was immediately used in the experimental assays.
The natural coagulant obtained from Moringa oleifera seeds is mainly composed of water-soluble cationic proteins that promote turbidity removal through electrostatic attraction and adsorption–bridging between positively charged functional groups and negatively charged colloidal particles. Unlike conventional coagulants based on aluminum or iron salts, whose mechanism relies on hydrolysis and precipitation of metal hydroxides, Moringa oleifera acts through a purely organic mechanism, maintaining the pH stability of the treated water. Recent studies have shown that this bio-coagulant exhibits high efficiency in turbidity removal, in addition to being biodegradable, non-toxic, and suitable for applications in contexts with reduced infrastructure [28,29].

2.3.3. Jar Test Assays

Jar test assays with the natural coagulant were performed using dosages of 2, 4, 6, 8, 10, and 12 mL. Each test was conducted at 151 rpm, corresponding to an average velocity gradient (G) of 248 s−1, to ensure effective mixing between the coagulant and suspended particles, promoting colloidal destabilization and initial floc formation. After mixing, the samples were left to settle and were collected at 10 min intervals, for a total of 60 min, to determine residual turbidity. The G value adopted in the jar tests was the same applied in the hydraulic circuit experiments, ensuring comparable conditions between both systems. This equivalence allowed the jar test results to be used as a reliable reference for defining the optimal coagulant dosage in the hydraulic circuit, providing an integrated assessment of coagulant efficiency under similar mixing intensity.

2.3.4. Hydraulic Circuit Tests

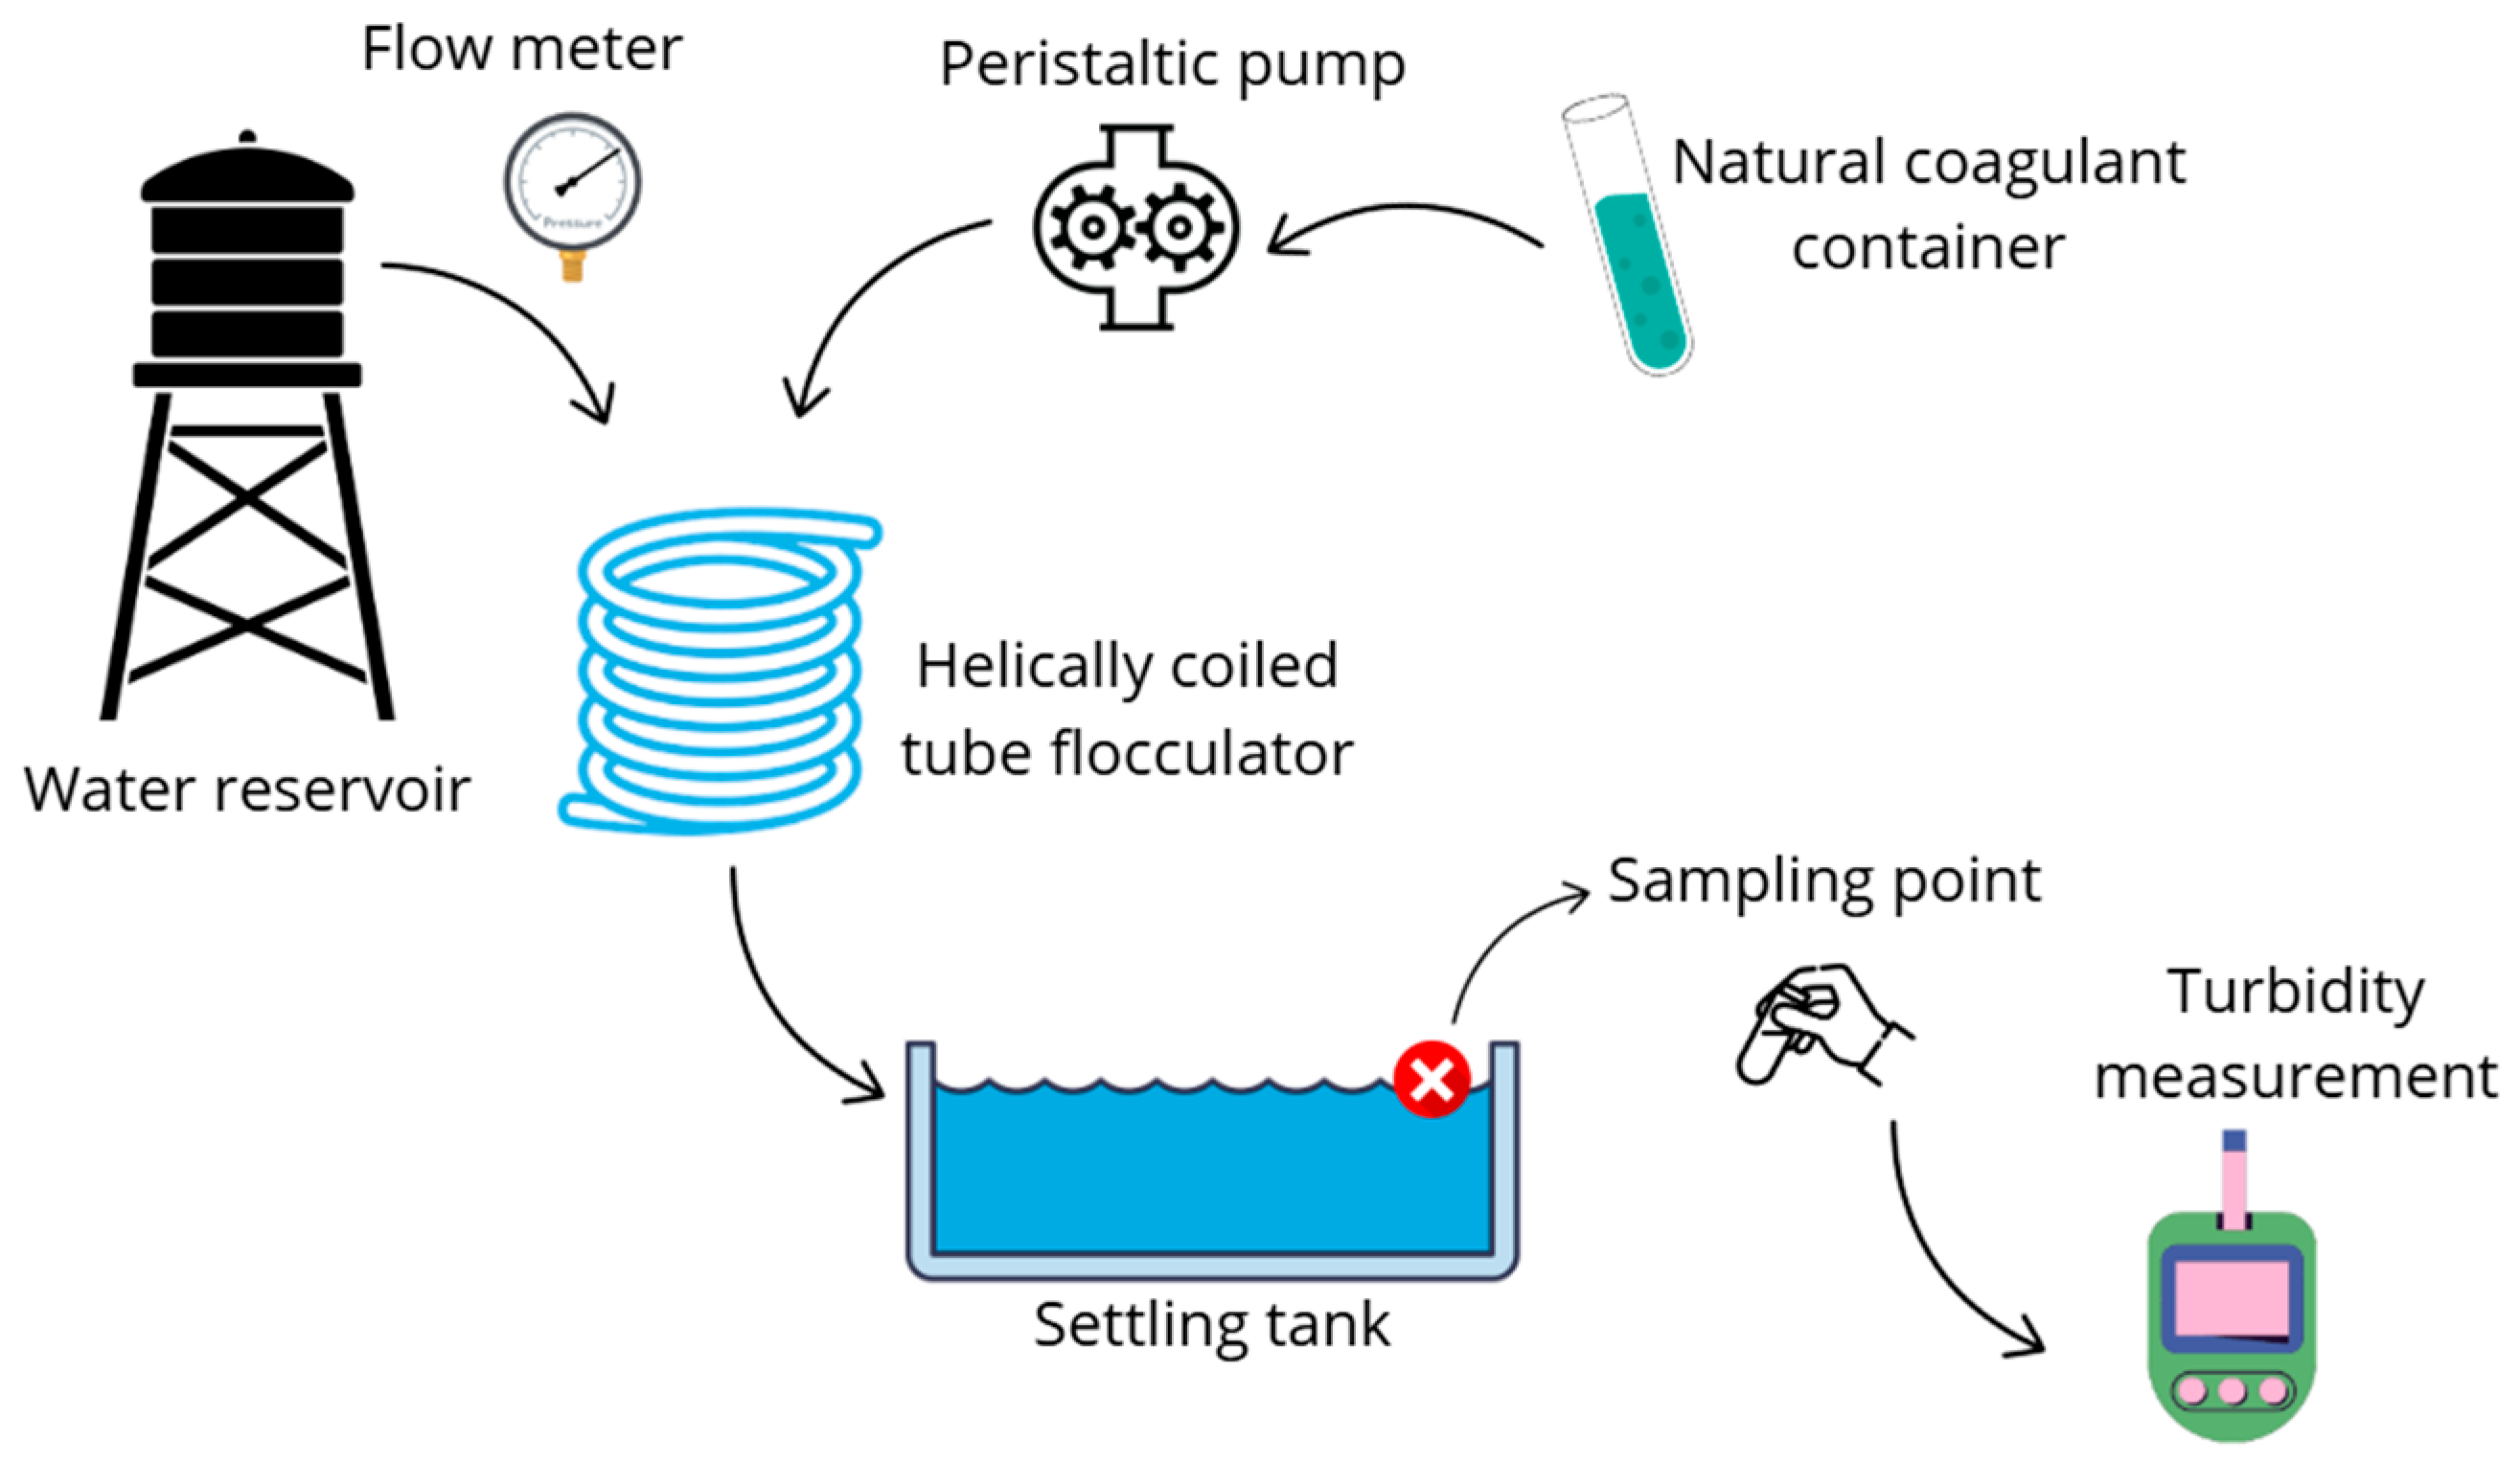
After determining the optimal concentration of the natural coagulant, tests were conducted in the hydraulic circuit, whose schematic representation is shown in Figure 2. The scheme presented for the HCTFs also applies to the SCTF configuration.
The experimental system consisted of a synthetic water reservoir, a tubular flocculator (HCTF or SCTF), and a conventional sedimentation unit. Synthetic water turbidity was fixed at 100 NTU, matching the value used in the Jar test assays, which allowed direct comparison between methods.
Once turbidity stabilized, the Moringa oleifera-based natural coagulant was dosed with a peristaltic pump to ensure precision and homogeneity. The system operated at a constant flow rate of 0.5 L/min, maintaining controlled and reproducible conditions throughout the entire test.
The mixture entered the flocculator, where the geometry induced liquid agitation and enhanced interaction between the coagulant and suspended particles, promoting floc formation and growth. The flow then reached the sedimentation unit, where flocculated particles were removed by gravitational settling. Samples were collected at 10 min intervals to determine residual turbidity, enabling evaluation of removal efficiency over time. The total sedimentation time considered was 60 min. Turbidity measurements were performed with an Akso TU430 turbidimeter, with each test carried out in triplicate.
Turbidity was adopted as the efficiency parameter because it represents a widely applied indicator in water treatment research and provides a reliable measure of clarification, as its reduction directly reflects the removal of suspended particles and colloids.

3. Results and Discussion

The results integrate experimental and numerical evidence to provide a comprehensive assessment of the hydrodynamic performance of the evaluated tubular flocculators. The discussion begins with the Jar test assays, which established the coagulant concentration applied in subsequent experiments. The following section presents the outcomes of experimental evaluation in the hydraulic circuit, highlighting the performance of HCTF1, HCTF2, and SCTF, along with comparisons among the different geometries. Next, the CFD simulations are detailed, including analyses of axial velocity profiles, streamlines, secondary flows, and velocity gradients. Finally, both approaches are integrated to correlate experimental observations with numerical predictions, leading to a critical discussion on the implications of hydrodynamic redesign for improving water treatment systems.

3.1. Experimental Evaluation Results

Experimental analysis was conducted in two stages: determination of the coagulant dosage through Jar test assays and evaluation of the performance of different tubular flocculators in the hydraulic circuit, with a focus on turbidity removal efficiency.

3.1.1. Jar Test Assays: Determination of Coagulant Concentration

Jar test assays aimed to establish the optimal dosage of the natural coagulant for subsequent experiments in the hydraulic circuit. Tested concentrations ranged from 2 to 12 mL/L in 2 L jars, starting with an average initial turbidity of approximately 100 NTU. Table 3 presents the initial and final turbidity values as well as the corresponding turbidity removal efficiencies.
The results showed that the lowest dosages, 2 and 4 mL/L, achieved efficiencies close to 90%, while a slight increase was observed at 6 mL/L, reaching 90.98%. The best performance occurred at 8 mL/L, with an average final turbidity of 4.26 NTU and a removal efficiency of 95.65%. Beyond this point, performance declined: efficiency decreased to 93.81% at 10 mL/L and to 88.95% at 12 mL/L.
These results demonstrate the presence of an optimal dosage that balances floc formation and stability; above this value, excess suspended material reduces process efficiency. This behavior can be explained by the progressive re-stabilization of colloidal particles that occurs when an excessive amount of coagulant is introduced into the system. At optimal dosages, the coagulant molecules effectively neutralize the negative charges of suspended particles, promoting interparticle attraction and floc growth through charge neutralization and adsorption–bridging mechanisms. However, when the dosage exceeds the optimal range, the surface of the particles becomes saturated with positively charged sites, which can lead to charge reversal. As a result, the particles regain electrostatic repulsion and remain dispersed in suspension, reducing the aggregation efficiency and producing smaller and less compact flocs. This trend has been similarly reported in studies employing natural coagulants, confirming that overdosing hinders the formation of stable aggregates and diminishes turbidity removal efficiency [30]. Based on these results, 8 mL/L was defined as the reference dosage for hydraulic circuit experiments.

3.1.2. Hydraulic Circuit Performance

With the coagulant dosage established from the Jar test assays, experiments in the hydraulic circuit evaluated the performance of different tubular flocculator geometries. The dosage remained constant in all experiments, as did the system feed flow rate. Table 4 summarizes the average values of initial turbidity, final turbidity, and turbidity removal efficiency for the helical configurations HCTF1 and HCTF2 and the spiral configuration SCTF at lengths of 12 m, 24 m, and 36 m. Removal efficiency provides a clear comparison among geometries, while the absolute values of final turbidity remain essential for assessing process performance.
HCTF1
HCTF1 consistently showed the lowest turbidity removal efficiencies: 87.1% at 12 m (13.04 NTU), 83.4% at 24 m (16.4 NTU), and 84.7% at 36 m (15.2 NTU). Extending the length did not improve performance, indicating that in this geometry longer exposure to mixing did not enhance floc consolidation but instead promoted floc breakup or the formation of less dense aggregates. In practical terms, HCTF1 would require operational adjustments (e.g., gradual reduction in mixing intensity along the flow path or process segmentation) to achieve competitive performance.
HCTF2
HCTF2 achieved excellent performance at 12 m, with 96.8% turbidity removal and a final turbidity of 3.42 NTU. However, efficiency declined sharply at 24 m (86.5%; 13.08 NTU) and remained at a similar level at 36 m (84.6%; 14.68 NTU). This behavior suggests high effectiveness when the flow remains under shorter exposure times but sensitivity to extended path lengths under the same dosage and hydraulic conditions. HCTF2 therefore shows promise, but its use at greater lengths demands optimization of mixing and/or coagulant dosage to avoid efficiency losses with longer processing times.
SCTF
SCTF delivered the best performance at 12 m, with 98.2% removal and a final turbidity of 1.89 NTU. Efficiency decreased at 24 m (91.6%; 8.61 NTU) and 36 m (87.9%; 11.85 NTU), but still exceeded that of the helical configurations at longer lengths. This trend indicates that the spiral arrangement promotes highly efficient initial aggregation; however, extending the path without operational adjustments increases the likelihood of floc breakup or the formation of less stable aggregates. Even so, SCTF maintained a relative advantage, including at 36 m.
Comparison of Geometries
Comparative analysis shows that at 12 m, SCTF achieved the highest turbidity removal efficiency (98.2%), followed by HCTF2 (96.8%) and HCTF1 (87.1%). At 24 m, SCTF maintained superior performance (91.6%), while the helical flocculators showed sharper reductions, with 86.5% for HCTF2 and 83.4% for HCTF1. At 36 m, although all configurations experienced efficiency losses compared to shorter lengths, SCTF continued to perform better (87.9%), whereas the helical units reached similar but lower levels (HCTF1: 84.7%; HCTF2: 84.6%).
Overall, the results indicate that SCTF provides higher efficiency across all tested lengths, particularly in compact units. HCTF2 performed well at shorter lengths but proved more sensitive to path extension, while HCTF1 consistently delivered the lowest results under all conditions. These findings suggest that the spiral configuration promotes hydrodynamic conditions more favorable to floc formation and stability, especially at reduced lengths, whereas helical geometries may require specific operational adjustments to optimize performance in longer paths.
Implications for Design and Operation
The results demonstrate that the performance of the different geometries is directly linked to the hydrodynamic conditions imposed by flocculator length. For SCTF, the high efficiency observed at shorter lengths indicates that the spiral arrangement creates favorable conditions for mixing and particle aggregation within the initial flow path. However, the efficiency decline at longer lengths suggests that maintaining high velocity gradients over extended paths promotes floc breakup, which limits overall performance.
For the helical flocculators, the results reveal greater variability: HCTF2 showed strong initial performance but experienced sharp declines at longer lengths, whereas HCTF1 consistently remained at lower levels. These outcomes suggest that helical geometries may require operational adjustments, such as implementing decreasing velocity gradients or segmenting the flow path into distinct mixing zones, to balance floc formation and preservation.
Overall, the differences among geometries highlight the importance of understanding the underlying hydrodynamic mechanisms. In this context, the fluid dynamic analysis detailed in Section 3.2 plays a central role by examining velocity profiles, streamlines, secondary flows, and velocity gradients that support the interpretation of the experimental results.

3.2. CFD Modeling Results

CFD simulations enhanced the understanding of the mechanisms driving the differences observed between geometries in the experimental stage. The analysis provided a detailed assessment of axial velocity profiles, streamlines, secondary flows, and velocity gradients in each configuration, offering a basis for interpreting the hydraulic circuit results and discussing the hydrodynamic implications of the evaluated geometries.

3.2.1. Axial Velocity Profiles

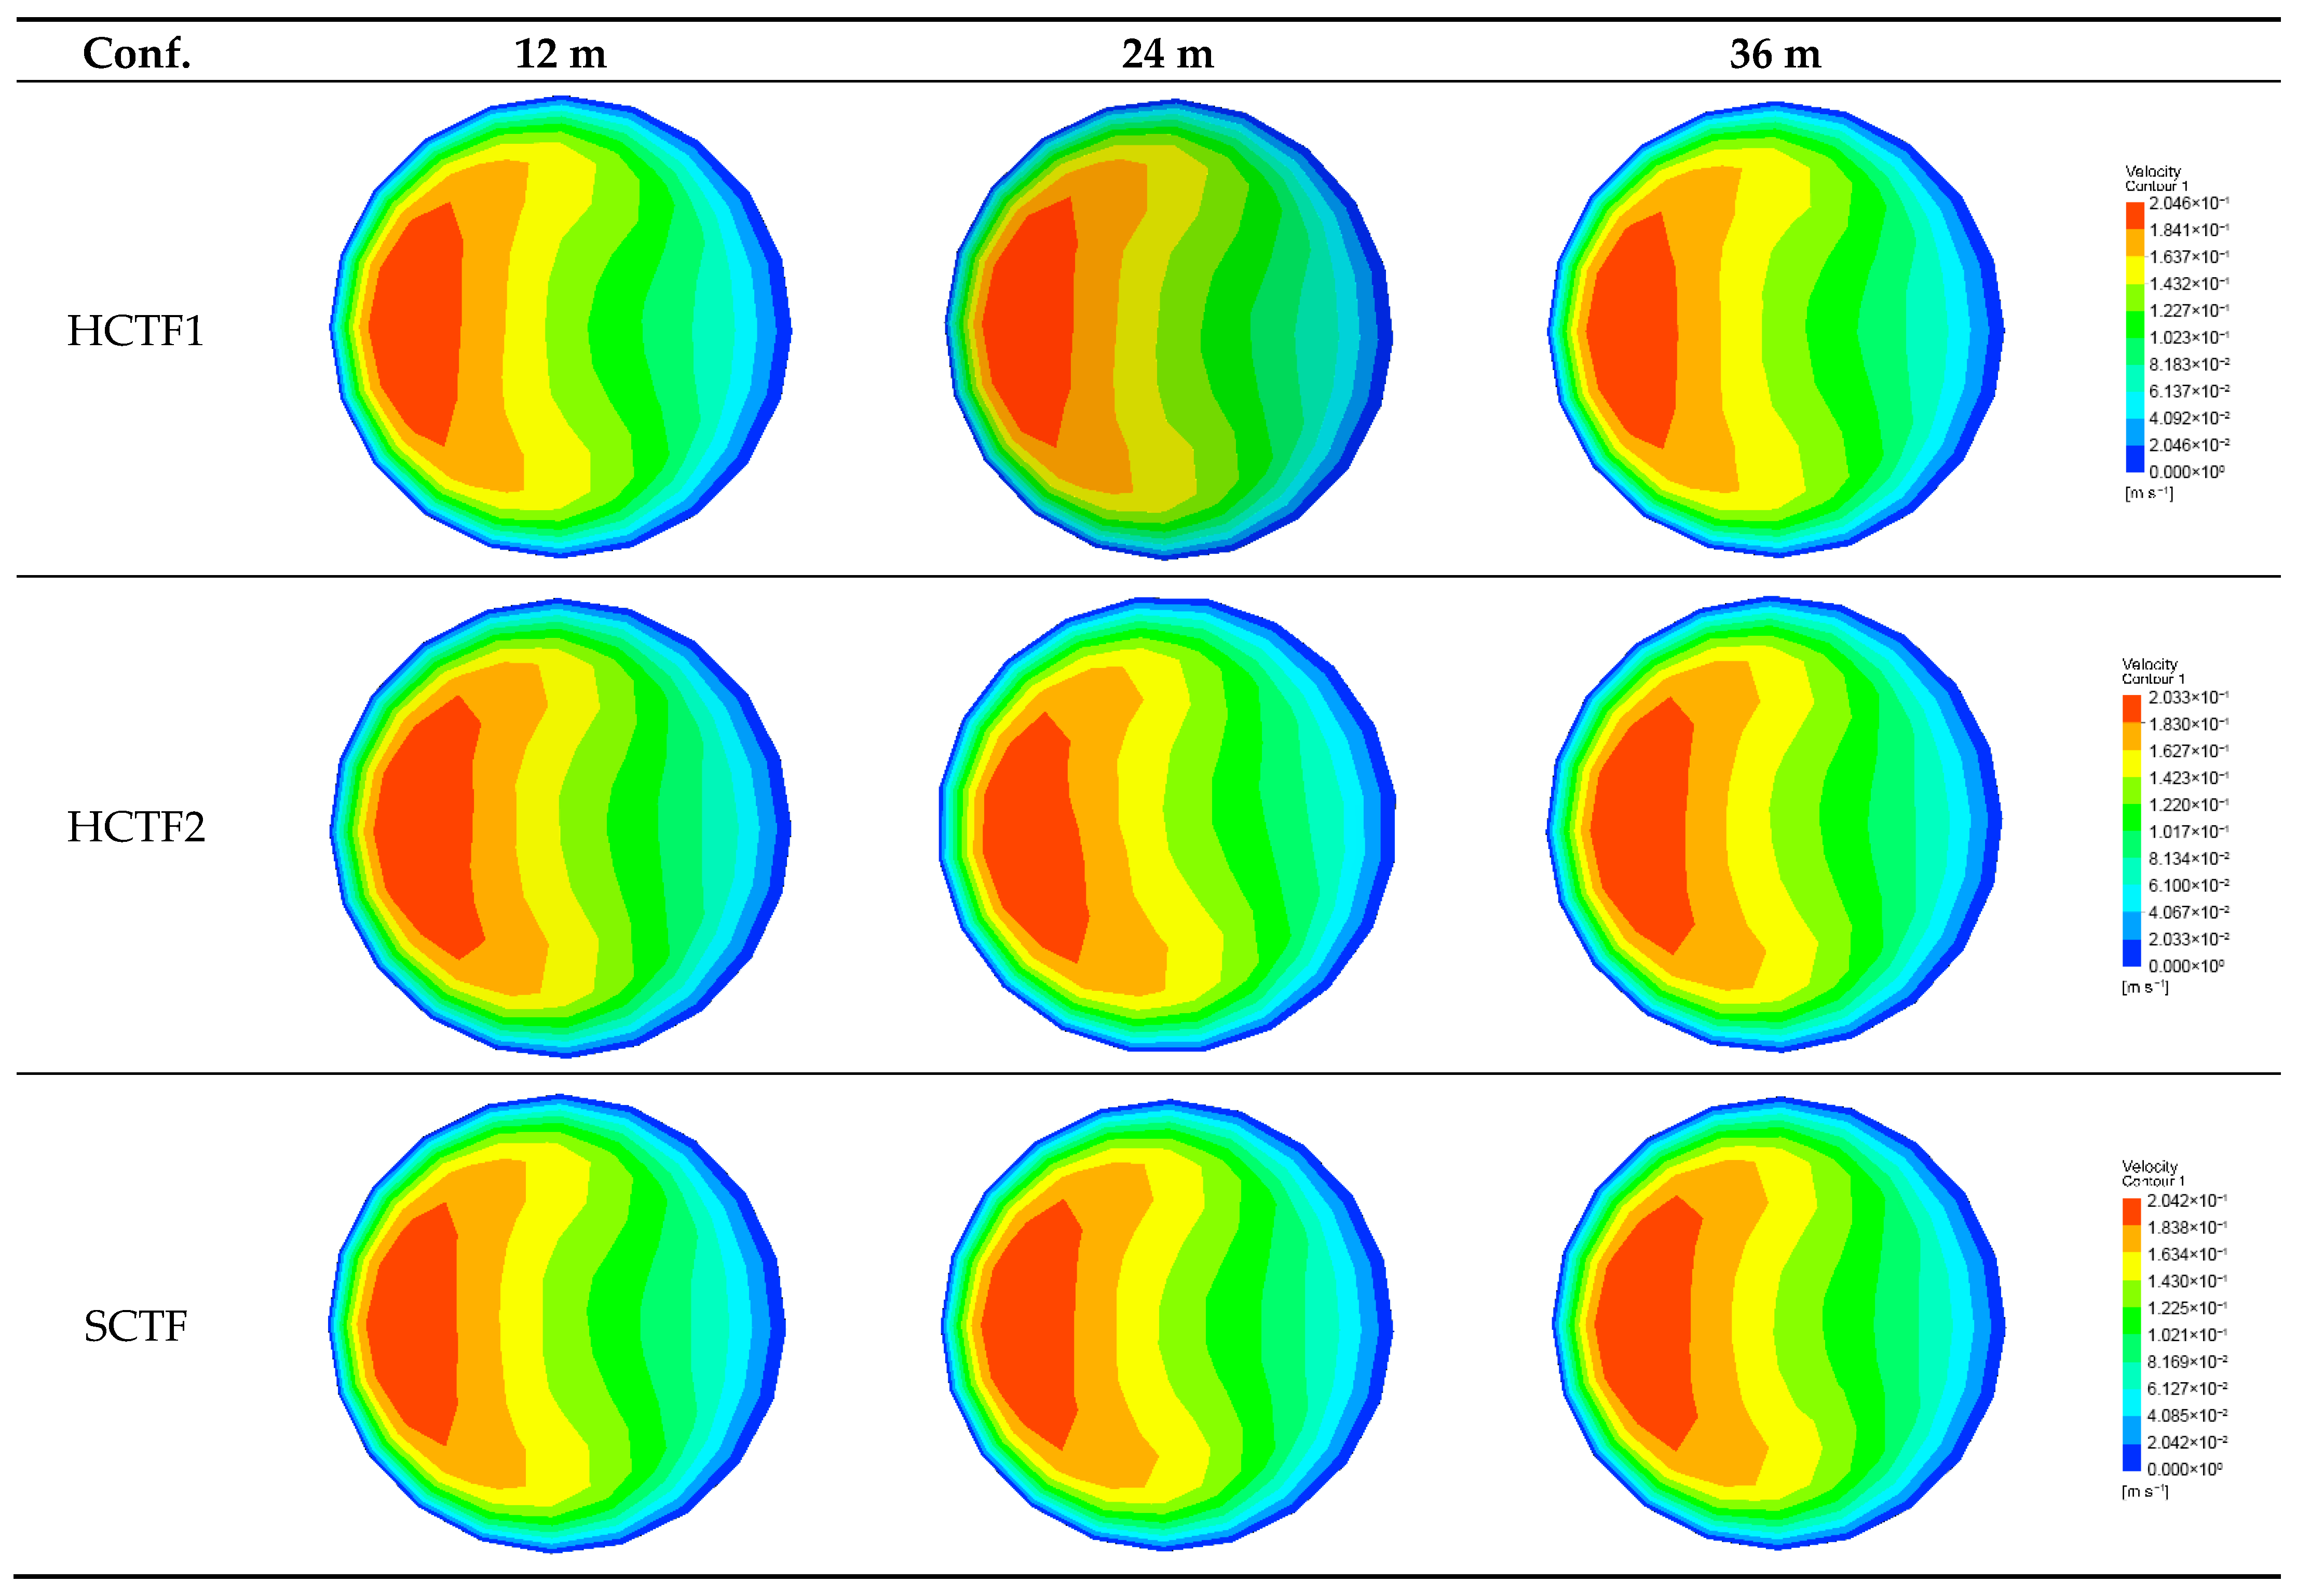
The analysis of axial velocity profiles at the outlet section provides essential information about the distribution of kinetic energy along the flow and its relationship with flocculation efficiency. To facilitate comparison among the evaluated geometries, the images were arranged in a grid where rows represent the geometric configurations (HCTF1, HCTF2, and SCTF) and columns represent different lengths (12 m, 24 m, and 36 m). This arrangement enables a systematic assessment of flow evolution in each setup and highlights the differences associated with pathway extension. The color scale remained constant across all images to ensure direct comparison between the simulated cases. The results for axial velocity profiles across the different geometries and lengths appear in Figure 3.
Figure 3 shows that the axial velocity profiles displayed very similar behavior among the three evaluated geometries and across the different flow lengths (12, 24, and 36 m). Variations in velocity distributions were minimal, and differences in maximum values did not exceed 1% in any of the simulated configurations. The results indicate that, regarding the axial component of the flow, geometry and pathway extension exert no significant influence. The experimental performance differences observed among the flocculators therefore cannot be attributed to the magnitude of axial velocity but are likely related to other hydrodynamic factors, such as the generation of secondary flows or the intensity of velocity gradients.

3.2.2. Secondary Flows

Analyzing secondary flows is essential to understanding cross-sectional mixing mechanisms and particle collision dynamics in tubular flocculators. Unlike axial velocity profiles, which showed only minor variations across geometries and lengths, secondary flow patterns more clearly demonstrate the influence of geometric configuration on internal hydrodynamics. These transverse motions, generated by flow curvature, redistribute the fluid within the cross-section, enhancing both the frequency of particle collisions and the stability or breakup of formed flocs. Comparative evaluation of the different geometries therefore provides a solid basis for explaining the performance differences observed in physical experiments and for identifying potential advantages of each configuration. Secondary flow patterns for the evaluated geometries and lengths are shown in Figure 4.
Evaluation of Figure 4, together with evidence reported in the literature, confirms the tendency for secondary flow intensity to remain nearly constant along helically coiled tubular flocculators once the hydrodynamic entrance length is exceeded.
For HCTF1, maximum velocities remained around 0.009 m/s (0.0091738; 0.0090044; 0.0092541) across the three lengths (12, 24, and 36 m), with no significant variation, reinforcing the stability of secondary flow. Linear correlation was very low (r = 0.31) with a reduced coefficient of determination (R2 = 0.10), indicating no significant alignment with flocculator length. Relative variability was small (CV = 1.39%) with a relative amplitude of only 2.7% around the mean, consistent with an essentially horizontal distribution of values.
For HCTF2, velocities also remained constant but at lower levels (0.007889–0.008032 m/s), approximately 12–15% below those of HCTF1. Results showed a moderate negative correlation (r = −0.66) and an intermediate coefficient of determination (R2 = 0.43), with CV = 0.91% and relative amplitude of 1.8%, again aligning horizontally. This difference can be attributed to the larger coil diameter, which reduces the relative curvature of the fluid trajectory and consequently the centrifugal force driving secondary vortex formation. Hydrodynamically, the smaller curvature radius of HCTF1 intensifies transverse pressure gradients and enhances particle interaction, whereas the broader geometry of HCTF2 attenuates these gradients, producing weaker but more stable vortices. This contrast is technically relevant, as HCTF1 tends to favor higher particle collision rates, while HCTF2 may reduce the risk of floc breakup, albeit with lower initial aggregation efficiency.
Findings reported in [31] corroborate that increased curvature—expressed as a lower ratio between coil diameter and reactor diameter—intensifies secondary flow. Consistently, the results confirm that reducing coil diameter while keeping tube diameter constant increases secondary flow intensity and thus transverse transport. In the case of HCTF1, secondary velocities were about 12–15% higher than those in HCTF2, reinforcing the role of curvature in hydrodynamic behavior. In [32] authors demonstrated that geometric variations along helically coiled tubes, such as adopting variable pitch, also affect vortex intensity and distribution, broadening the possibilities for hydrodynamic optimization. This perspective directly relates to SCTF, where the conical geometry produces a gradual transition in secondary flow intensity along the tube length.
For SCTF, the behavior diverged from that of constant-diameter flocculators due to its conical geometry, in which coil diameter increases progressively. In this configuration, secondary flow intensity varies with local diameter, reaching higher levels in the initial sections with smaller diameters and decreasing as the diameter increases. This trend was confirmed by the results: at 12 m, maximum secondary velocity reached 0.009681 m/s, significantly higher than in the subsequent sections. At 24 m, intensity decreased to 0.008455 m/s, representing a 12.7% drop from the initial value. At 36 m, maximum velocity declined further to 0.007895 m/s, an 18.5% reduction compared with 12 m. Unlike the helical flocculators, velocities in SCTF showed a strong negative linear correlation (r = −0.98) with a high coefficient of determination (R2 = 0.96), indicating strong collinearity along a downward trend. Relative amplitude reached 20.6% and CV 10.5%, demonstrating greater dispersion around the mean.
This progressive reduction is particularly relevant for flocculation efficiency: while stronger secondary flow at the beginning enhances particle collisions and promotes floc formation, lower intensities in later sections minimize excessive shear and prevent breakup of previously formed flocs. The variable geometry of SCTF therefore provides a hydrodynamic transition tailored to different flocculation stages, suggesting superior performance compared with HCTFs, whose coil diameters remain constant.

3.2.3. Streamlines

This section shows streamlines from steady-state simulations, obtained from points located at the center of the inlet profile and used to visualize flow patterns for each geometry. Figure 5 compiles the results for the three geometries at a length of 12 m. In these streamline plots, the variable “time (s)” on the x-axis refers to the particle travel time along the trajectory, not to the physical time of the simulation. Since the simulations were conducted under steady-state conditions, the results represent spatial variations in the velocity field rather than temporal variations.
In the helical flocculators (HCTF1 and HCTF2), the flow exhibited stable behavior after the hydrodynamic entrance length, marked by quasi-periodic (near-sinusoidal) spatial oscillations along the tube with an almost constant period. This behavior demonstrates the consistency of the hydrodynamic response in these configurations: despite geometric differences between the two models, both maintained similar patterns of stability and repeatability.
The spiral flocculator (SCTF), however, displayed a different behavior. Even beyond the entrance region, the oscillation period gradually increased along the flow path. This continuous and coherent process caused the oscillation frequency to decrease progressively, elongating the period of each cycle. The effect results from the variable winding diameter of the SCTF, which alters the strength of secondary vortices and redistributes the flow along the tube, contrasting with the uniformity observed in the HCTFs.
In [15] authors described quasi-periodic and near-sinusoidal streamlines in HCTFs. The HCTFs evaluated in this study reproduced that pattern; by contrast, the SCTF exhibited a progressive increase in the spatial period along the flow, disrupting quasi-periodicity—an effect attributed to the variable winding diameter.
The streamline analysis reinforces the role of geometry in shaping and evolving secondary vortices throughout the tube. Similar findings were reported in [32], who observed significant modifications in flow-line patterns in helical tubes with variable pitch, including vortex intensification followed by redistribution along the flow path. A comparable phenomenon emerged in the SCTFs, where the initial regions with smaller winding diameters generated more intense vortices and stronger transverse mixing. In the later sections, as the diameter increased, the streamlines redistributed more smoothly, and the vortex cycle period lengthened, reflecting a reduction in transverse pressure gradient intensity.
This evolution along the flow path shows that the conical geometry promotes an adjusted hydrodynamic transition, enhancing floc formation in the early stages while reducing the risk of floc breakup in the later stages, as illustrated in Figure 5. Therefore, the streamline analysis highlights how geometric features influence the internal dynamics of flocculators, broadening the understanding of hydrodynamics in helical units and pointing to design strategies capable of balancing aggregation efficiency and floc stability.

3.2.4. Head Loss and Global Velocity Gradient

The evaluation of head loss and global velocity gradient (G) provides a basis for assessing the hydraulic performance of different flocculator configurations, offering parameters to understand both the energy dissipation along the flow and the average shear intensity experienced by suspended particles. Head loss values were obtained for the three flocculators (HCTF1, HCTF2, and SCTF) at lengths of 12 m, 24 m, and 36 m, enabling the calculation of global velocity gradient from the operating flow rate and tube diameter. Table 5 and Table 6 present the results for head loss and global velocity gradient, respectively, under the conditions analyzed.
The evaluation of the data shows that the helical flocculators (HCTF1 and HCTF2) exhibited an almost linear increase in head loss with length, a behavior consistent with systems operating under stable hydrodynamic regimes and regular geometric characteristics. The spiral flocculator (SCTF) also displayed an increasing trend, but with slightly higher values, indicating greater hydraulic resistance imposed by the spiral geometry.
Regarding the global velocity gradient, the helical flocculators maintained nearly constant values across the three evaluated lengths, reflecting stability in the average shear level applied to the flow. This outcome confirms the hydrodynamic regularity previously identified in these configurations. In contrast, the SCTF showed a gradual reduction in G, with higher values at 12 m followed by a progressive decrease at 24 and 36 m. This behavior aligns with the observed lengthening of oscillation periods in the dynamic analyses, suggesting that the spiral geometry induces a systematic attenuation of global shear along the flow path.

3.3. Integration of Experimental and CFD Results

The integration of experimental results with CFD simulations demonstrates a direct relationship between hydrodynamic behavior and turbidity removal efficiency across the evaluated geometries. In hydraulic circuit tests, the SCTF achieved the highest efficiency at the shortest length and process time, reaching 98.2% turbidity removal, but its performance declined progressively at longer extensions, dropping to 91.6% at 24 m and 87.9% at 36 m. In contrast, the helical flocculators (HCTF1 and HCTF2) maintained more stable performance along the tested lengths, although at lower overall levels.
The CFD simulations confirmed these trends by showing that, in the HCTFs, both secondary flow and global velocity gradient remained nearly constant across different lengths, consistent with the experimental evidence of stability. In the SCTF, however, the global velocity gradient decreased steadily from 104 s−1 at 12 m to 98 s−1 at 36 m, accompanied by a gradual lengthening of oscillation periods. This continuous and coherent process explains the reduction in experimental efficiency, linked to the progressive weakening of shear intensity along the flow path.
Overall, the results show that SCTF achieves high efficiency at shorter lengths and suggest an optimal length below 12 m. Longer residence times can destabilize previously formed flocs, leading to reduced overall process performance.
These results highlight that hydrodynamic redesign based on variable geometries can enable more compact and efficient clarification systems, particularly in contexts with reduced infrastructure.

4. Conclusions

The results of this study demonstrate that transitioning from helically coiled tube flocculators (HCTFs) to spirally coiled tube flocculators (SCTFs) represents a significant advance in hydrodynamic redesign for water clarification systems. The integrated analysis of physical experiments and CFD simulations showed that the variable geometry of the SCTF promotes higher turbidity removal efficiency at shorter lengths, reaching 98.2% at 12 m, outperforming the tested helical configurations.
In the HCTFs, hydrodynamic patterns remained stable, with global velocity gradients and secondary flow intensities nearly constant across different lengths. This regularity resulted in lower efficiencies compared with the spiral arrangement. In contrast, the SCTF exhibited dynamic behavior: in the initial sections, the reduced diameter intensified the vortices of the secondary flows and enhanced floc formation, while in the later sections, the progressive increase in diameter attenuated shear gradients and reduced the risk of floc breakage. This adjusted hydrodynamic transition along the flow path represents a strategic advantage over constant-diameter geometries.
The experiments also indicated that longer residence times can reduce clarification efficiency in both SCTFs and HCTFs, suggesting an optimal length below 12 m for maximizing performance. This result underscores the need for operational and design adjustments, such as process segmentation or adaptation of velocity gradients, to balance floc formation and preservation.
In summary, the results confirm the potential of SCTFs as an innovative solution for compact water treatment systems, particularly in contexts with reduced infrastructure. The geometric flexibility offered by the spiral configuration expands opportunities for hydrodynamic optimization, enabling more efficient, stable, and sustainable processes. These results advance the understanding of the role of geometry in flocculation performance and provide practical guidance for designing clarification units better suited to contemporary demands for access to safe drinking water.

Author Contributions

Conceptualization, D.S.d.O.; methodology, D.S.d.O.; validation, D.S.d.O. and M.S.; formal analysis, D.S.d.O. and C.B.D.; investigation, D.S.d.O. and M.S.; writing—original draft preparation, D.S.d.O., M.S. and C.B.D.; writing—review and editing, D.S.d.O., M.S. and C.B.D.; supervision, D.S.d.O.; project administration, D.S.d.O.; funding acquisition, C.B.D. All authors have read and agreed to the published version of the manuscript.

Funding

APC was supported by the Federal Institute of Espírito Santo (IFES, notice 10/2025). The experimental apparatus was funded by Foundation for Research Support of Espírito Santo (FAPES), Federal Institute of Espírito Santo (IFES) and National Council for Scientific and Technological Development (CNPq).

Data Availability Statement

The data presented in this study are available on request from the corresponding author.

Acknowledgments

The authors thank the Foundation for Research Support of Espírito Santo (FAPES), the Federal Institute of Espírito Santo (IFES), and the National Council for Scientific and Technological Development (CNPq) for their financial and institutional support.

Conflicts of Interest

The authors declare no conflicts of interest.

References

  1. Mishra, B.K.; Kumar, P.; Saraswat, C.; Chakraborty, S.; Gautam, A. Water Security in a Changing Environment: Concept, Challenges and Solutions. Water 2021, 13, 490. [Google Scholar] [CrossRef]
  2. Li, X.; Yang, H.Y. A Global Challenge: Clean Drinking Water. Glob. Chall. 2021, 5, 2000125. [Google Scholar] [CrossRef]
  3. Pooi, C.K.; Ng, H.Y. Review of low-cost point-of-use water treatment systems for developing communities. npj Clean Water 2018, 1, 11. [Google Scholar] [CrossRef]
  4. Li, Q.; Zhang, H.; Tan, C.; Lian, B.; García-Pacheco, R.; Taylor, R.A.; Fletcher, J.; Le-Clech, P.; Ranasinghe, B.; Senevirathna, T.; et al. Numerical and experimental investigation of a DC-powered RO system for Sri-Lankan villages. Renew. Energy 2022, 182, 772–786. [Google Scholar] [CrossRef]
  5. Gwenzi, W.; Chaukura, N.; Noubactep, C.; Mukome, F.N. Biochar-based water treatment systems as a potential low-cost and sustainable technology for clean water provision. J. Environ. Manag. 2017, 197, 732–749. [Google Scholar] [CrossRef] [PubMed]
  6. Hartemann, P.; Montiel, A. History and Development of Water Treatment for Human Consumption. Hygiene 2025, 5, 6. [Google Scholar] [CrossRef]
  7. Adams, E.A.; Stoler, J.; Adams, Y. Water insecurity and urban poverty in the Global South: Implications for health and human biology. Am. J. Hum. Biol. 2019, 32, e23368. [Google Scholar] [CrossRef] [PubMed]
  8. Prüss-Ustün, A.; Wolf, J.; Bartram, J.; Clasen, T.; Cumming, O.; Freeman, M.C.; Gordon, B.; Hunter, P.R.; Medlicott, K.; Johnston, R. Burden of disease from inadequate water, sanitation and hygiene for selected adverse health outcomes: An updated analysis with a focus on low- and middle-income countries. Int. J. Hyg. Environ. Health 2019, 222, 765–777. [Google Scholar] [CrossRef]
  9. Joy, K.; Kulkarni, S.; Roth, D.; Zwarteveen, M. Re-politicising water governance: Exploring water re-allocations in terms of justice. Local Environ. 2014, 19, 954–973. [Google Scholar] [CrossRef]
  10. Bolatova, Z.; Sharapatova, R.; Kabiyev, Y.; Berndtsson, R.; Tussupova, K. Towards Sustainable Solutions: Assessing Rural Access to Safe Drinking Water and Sanitation in Atyrau, Kazakhstan. Water 2025, 17, 664. [Google Scholar] [CrossRef]
  11. Saritha, V.; Srinivas, N.; Vuppala, N.V.S. Analysis and optimization of coagulation and flocculation process. Appl. Water Sci. 2015, 7, 451–460. [Google Scholar] [CrossRef]
  12. Silva, J.R.; Oliveira, D.S. Water Treatment with Clean Technologies Using Moringa oleifera Seeds in Alternative Low-Cost Clarification Units. Clean Technol. 2024, 6, 625–645. [Google Scholar] [CrossRef]
  13. Sharma, S.; Bhattacharya, A. Drinking water contamination and treatment techniques. Appl. Water Sci. 2017, 7, 1043–1067. [Google Scholar] [CrossRef]
  14. Sartori, M.; Oliveira, D.S.; Teixeira, E.C.; Rauen, W.B.; Reis, N.C. CFD modelling of helically coiled tube flocculators for velocity gradient assessment. J. Braz. Soc. Mech. Sci. Eng. 2014, 37, 187–198. [Google Scholar] [CrossRef]
  15. Oliveira, D.S.; Teixeira, E.C. Hydrodynamic characterization and flocculation process in helically coiled tube flocculators: An evaluation through streamlines. Int. J. Environ. Sci. Technol. 2017, 14, 2561–2574. [Google Scholar] [CrossRef]
  16. Oliveira, D.S.; Teixeira, E.C. Experimental evaluation of helically coiled tube flocculators for turbidity removal in drinking water treatment units. Water SA 2017, 43, 378–386. [Google Scholar] [CrossRef]
  17. Oliveira, D.S.; Teixeira, E.C. Swirl number in helically coiled tube flocculators: Theoretical, experimental, and CFD modeling analysis. Int. J. Environ. Sci. Technol. 2018, 16, 3735–3744. [Google Scholar] [CrossRef]
  18. Oliveira, D.S.; Donadel, C.B. Helically Coiled Tube Flocculators in Water Clarification Systems: Optimal Length Evaluation and Process Efficiency Probabilistic Analysis. Sustainability 2024, 16, 2172. [Google Scholar] [CrossRef]
  19. Garcia-Avila, F.; Cadme-Tandazo, J.; Aviles-Anazco, A.; Valdiviezo-Gonzales, L.; Cabello-Torres, R.; Cadme-Galabay, M. Experimental approach and analysis of the effectiveness of a tubular helical flow flocculator for water supply in developing communities. Heliyon 2024, 10, e33101. [Google Scholar] [CrossRef]
  20. Ramesh, E.; Jalali, A. Machine-learning based multi-objective optimization of helically coiled tube flocculators for water treatment. Chem. Eng. Res. Des. 2023, 197, 931–944. [Google Scholar] [CrossRef]
  21. Zhan, M.; You, M.; Liu, L.; Zhang, Y.; Yuan, F.; Guo, B.; Cheng, G.; Xu, W. Numerical simulation of mechanical flocculation in water treatment. J. Environ. Chem. Eng. 2021, 9, 105536. [Google Scholar] [CrossRef]
  22. Lazarev, S.; Protasov, D.; Konovalov, D.; Khorokhorina, I.; Abonosimov, O. Modeling of the Nanofiltration Process Based on Convective Diffusion Theory. Modelling 2024, 5, 1729–1744. [Google Scholar] [CrossRef]
  23. Langarudi, S.P.; Sabie, R.P.; Bahaddin, B.; Fernald, A.G. A Literature Review of Hybrid System Dynamics and Agent-Based Modeling in a Produced Water Management Context. Modelling 2021, 2, 224–239. [Google Scholar] [CrossRef]
  24. Manyepa, P.; Gani, K.M.; Seyam, M.; Banoo, I.; Genthe, B.; Kumari, S.; Bux, F. Removal and risk assessment of emerging contaminants and heavy metals in a wastewater reuse process producing drinkable water for human consumption. Chemosphere 2024, 361, 142396. [Google Scholar] [CrossRef]
  25. Han, J.-R.; Kim, H.I.; Shim, H.-W.; Choi, J.-W.; Je, J. 3D-CFD based optimization of a mixer-settler: Part I. development of a model for efficient pump-mixer system in mixer-settler. Chem. Eng. Res. Des. 2025, 220, 610–622. [Google Scholar] [CrossRef]
  26. Cioncolini, A.; Santini, L. An experimental investigation regarding the laminar to turbulent flow transition in helically coiled pipes. Exp. Therm. Fluid Sci. 2006, 30, 367–380. [Google Scholar] [CrossRef]
  27. Oliveira, D.S.d.; Donadel, C.B. Global velocity gradient evaluation: An innovative approach using CFD modeling applied to water and wastewater treatment plants. J. Water Process Eng. 2019, 28, 21–27. [Google Scholar]
  28. Nhut, H.T.; Hung, N.T.Q.; Lap, B.Q.; Han, L.T.N.; Tri, T.Q.; Bang, N.H.K.; Hiep, N.T.; Ky, N.M. Use of Moringa oleifera seeds powder as bio-coagulants for the surface water treatment. Int. J. Environ. Sci. Technol. 2020, 18, 2173–2180. [Google Scholar] [CrossRef]
  29. Cobos, A.G.Z.; Gutiérrez, J.; Caballero, P. Use of Moringa oleifera as a Natural Coagulant in the Reduction of Water Turbidity in Mining Activities. Water 2024, 16, 2315. [Google Scholar] [CrossRef]
  30. Otálora, M.C.; Wilches-Torres, A.; Lara, C.R.; Castaño, J.A.G.; Cifuentes, G.R. Evaluation of Turbidity and Color Removal in Water Treatment: A Comparative Study between Opuntia ficus-indica Fruit Peel Mucilage and FeCl3. Polymers 2022, 15, 217. [Google Scholar] [CrossRef]
  31. Sigalotti, L.D.G.; Alvarado-Rodríguez, C.E.; Rendón, O. Fluid Flow in Helically Coiled Pipes. Fluids 2023, 8, 308. [Google Scholar] [CrossRef]
  32. Pourhemmati, S.; Mohammed, H.A.; Shafieian, A. The use of variable coil pitch of helical tube on the hydro-thermal performance improvement. Case Stud. Therm. Eng. 2023, 53, 103944. [Google Scholar] [CrossRef]
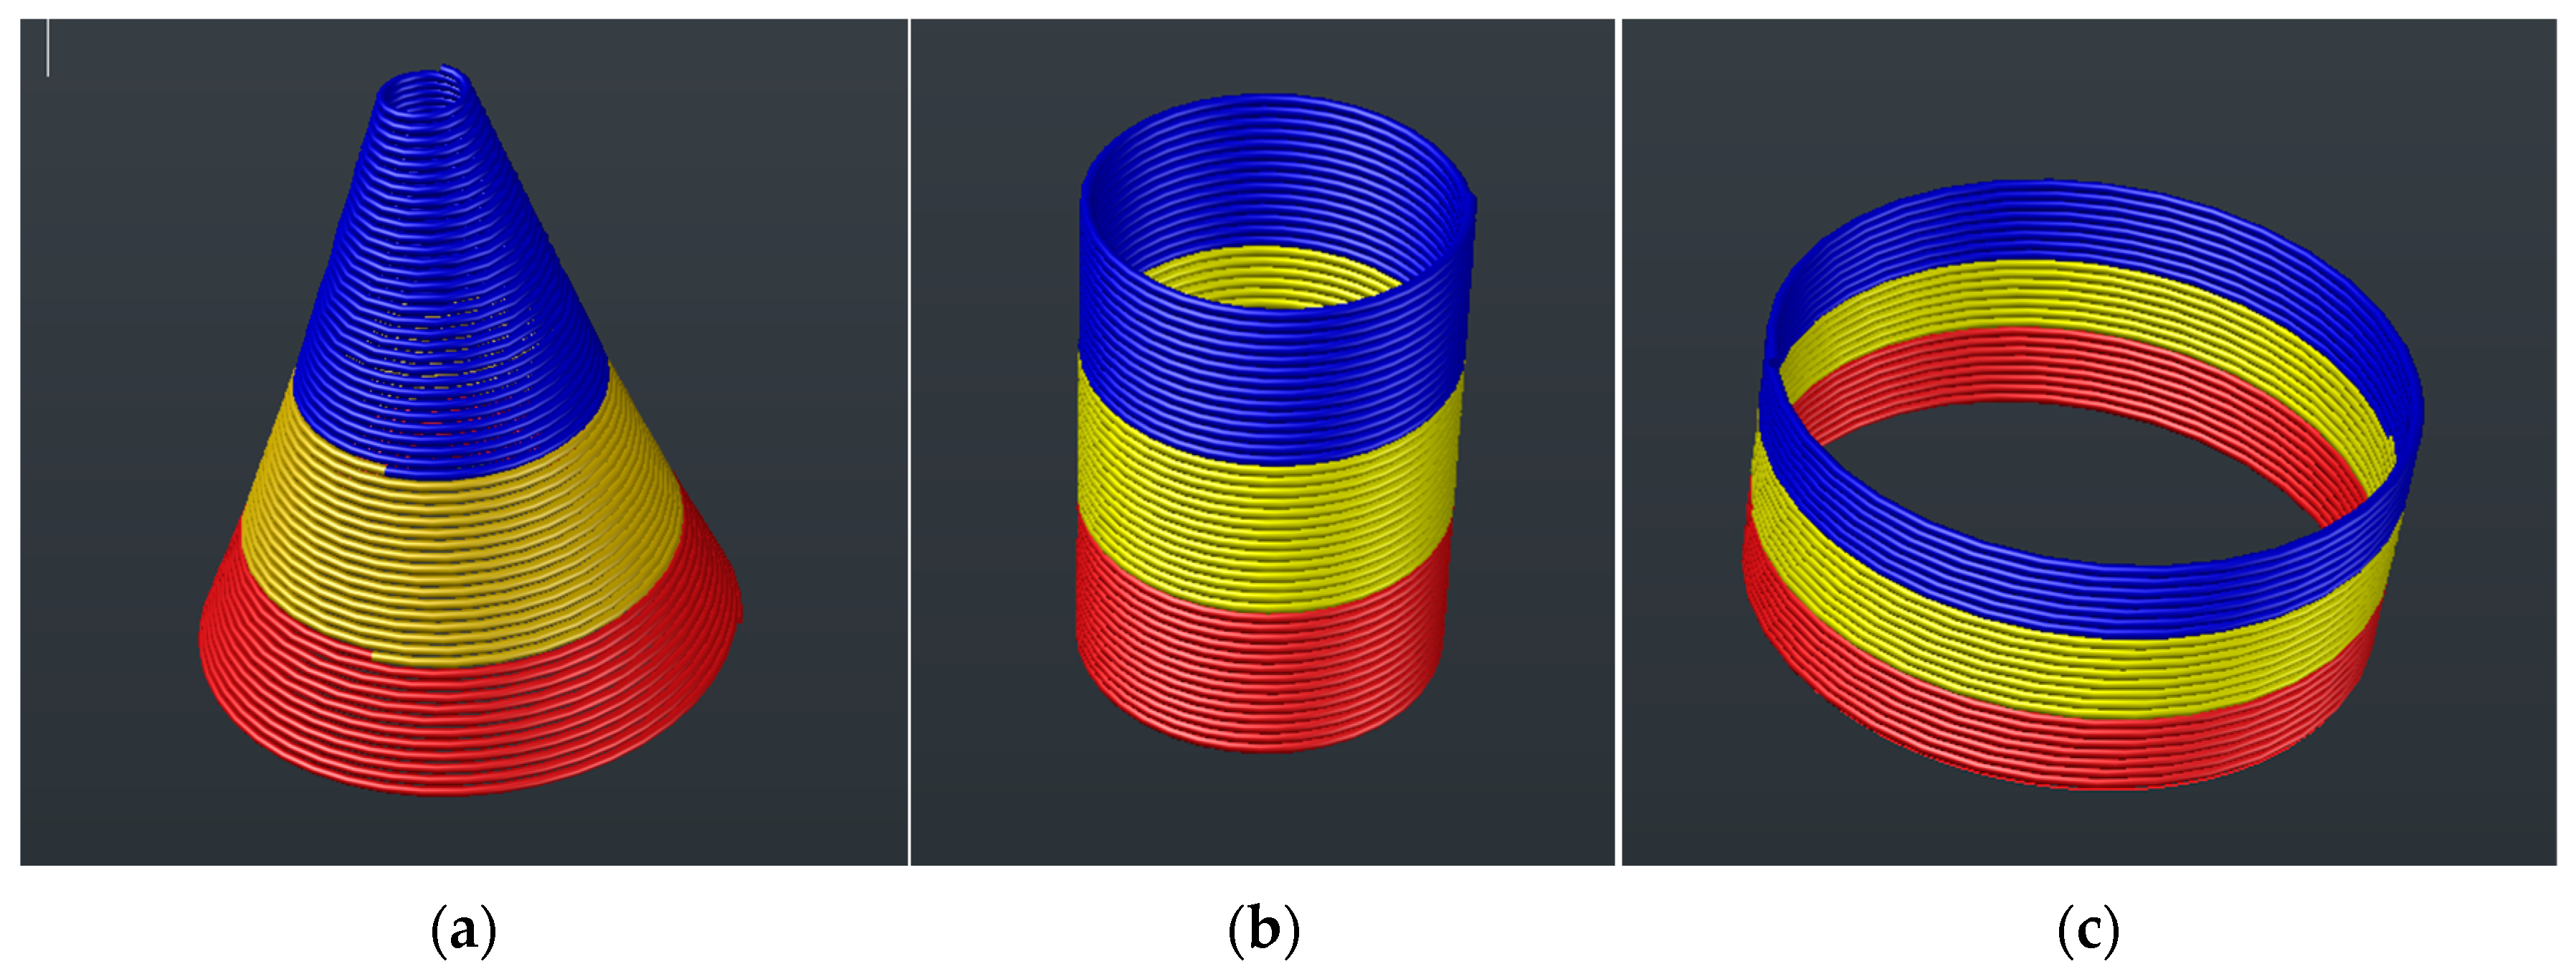
Figure 1. Geometric configurations of the flocculators: (a) SCTF, (b) HCTF1, and (c) HCTF2. Each configuration was divided into three 12 m segments.
Modelling 06 00139 g001
Figure 2. Schematic representation of the hydraulic circuit used for tests with HCTFs and SCTF.
Modelling 06 00139 g002
Figure 3. Axial velocity profiles obtained from CFD simulations for HCTF1, HCTF2, and SCTF at lengths of 12 m, 24 m, and 36 m.
Modelling 06 00139 g003
Figure 4. Secondary flow profiles from CFD simulations for HCTF1, HCTF2, and SCTF at lengths of 12 m, 24 m, and 36 m.
Modelling 06 00139 g004
Figure 5. Velocity profiles along streamlines obtained from steady-state CFD simulations for the flocculators: (a) HCTF1, (b) HCTF2, and (c) SCTF, each with a total length of 12 m. The x-axis represents the particle travel time along the streamline, while the y-axis shows the corresponding local velocity.
Modelling 06 00139 g005aModelling 06 00139 g005b
Table 1. Mesh characteristics (average values for the total length of the units).
ConfigurationNumber of Elements [-]Skewness [-]Orthogonal Quality [-]
SCTF4,201,7200.132600.97620
HCTF13,721,3800.141990.97831
HCTF24,127,9060.139850.97906
Table 2. Description of the experimental tests performed.
Test NumberConfiguration (SCTF/HCTF)Length (m)Diameter at the Top (DT, cm)Diameter at the Base (DB, cm)
1SCTF12830
22441
33650
4HCTF11228
524
636
7HCTF21250
824
936
Table 3. Jar test results for determining the optimal dosage of the natural coagulant, with average initial and final turbidity values and corresponding turbidity removal efficiencies.
JarCoagulant Dosage (mL/L)Average Initial Turbidity (NTU)Average Final Turbidity (NTU)Turbidity Removal Efficiency (%)
12100.2010.3289.70
2499.8110.0389.95
3698.548.8990.98
4897.934.2695.65
510102.206.3393.81
612101.8011.2588.95
Table 4. Average initial turbidity, final turbidity, and turbidity removal efficiency for HCTF1, HCTF2, and SCTF at lengths of 12 m, 24 m, and 36 m.
LengthConfigurationAverage Initial Turbidity (NTU)Average Final Turbidity (NTU)Turbidity Removal Efficiency (%)
12 mHCTF1101.1313.0487.1
HCTF2105.233.4296.8
SCTF103.231.8998.2
24 mHCTF198.9016.4083.4
HCTF296.5313.0886.5
SCTF102.908.6191.6
36 mHCTF199.7015.2084.7
HCTF295.1014.6884.6
SCTF97.7311.8587.9
Table 5. Head loss for HCTF1, HCTF2, and SCTF at lengths of 12 m, 24 m, and 36 m.
FlocculatorHead Loss (Hf, m)
12 m24 m36 m
HCTF10.1046090.2095190.313246
HCTF20.0954330.1904300.285053
SCTF0.1136280.2060970.303377
Table 6. Global velocity gradient for HCTF1, HCTF2, and SCTF at lengths of 12 m, 24 m, and 36 m.
FlocculatorGlobal Velocity Gradient (G, s−1)
12 m24 m36 m
HCTF199.8999.9699.80
HCTF295.4195.3095.20
SCTF104.1199.1498.21
Disclaimer/Publisher’s Note: The statements, opinions and data contained in all publications are solely those of the individual author(s) and contributor(s) and not of MDPI and/or the editor(s). MDPI and/or the editor(s) disclaim responsibility for any injury to people or property resulting from any ideas, methods, instructions or products referred to in the content.