Abstract
To clarify the potential failure modes of reinforced concrete (RC) beams under impact and understand their impact resistance safety, a comprehensive study was conducted by focusing on the failure mode discrimination and failure probability of RC beams under impact loads. This research utilized drop hammer impact tests, ABAQUS2022 software, and theoretical methods. The study examined three typical failure modes of RC beams under impact loads: flexural failure, flexural-shear failure, and shear failure. A discrimination criterion based on the flexural-shear capacity–effect curve was developed. Utilizing this criterion, along with the basic principles of structural reliability theory, the failure probability of RC beams under impact loads was calculated and analyzed using the Monte Carlo method. The results indicate that the criterion based on the flexural-shear capacity–effect curve can be used for discriminating failure modes of RC beams under impact loads. The impact velocity and stirrup ratio were identified as crucial factors that influenced the failure modes of RC beams under impact. Specifically, an increase in the stirrup spacing reduced the reliability of the RC beams under impact, while an increase in the stirrup ratio could significantly enhance their impact resistance. Furthermore, with a constant impact energy, an increase in beam span correlated with the improved reliability of RC beams under impact, where larger spans yielded a better impact resistance.
1. Introduction
During normal service, reinforced concrete (RC) structures may be subjected to various impact actions, such as explosions, vehicle collisions, ship impacts, and wave impacts, which can cause severe structural damage or failure and even catastrophic consequences. As a fundamental component of RC structures, the impact resistance of RC beams is crucial and has become a prominent area of focus in engineering research.
Experimental investigations into the mid-span impact of RC beams indicate that factors such as the impact velocity, impact energy, longitudinal reinforcement ratio, stirrup ratio, concrete strength, beam cross-sectional dimensions, and shear span ratio all influence the load-bearing capacity and failure modes of RC beams [1,2,3,4,5,6,7]. Among these, the impact velocity is a key factor affecting the failure modes of RC beams. As the impact velocity rises, the failure mode transitions from flexural failure to shear failure [8,9,10]. Under a high-speed impact, the higher strain rate increases the strength of concrete [11,12], while also improving the bond performance between the concrete and steel. However, due to the large stress gradient distribution on the cross-section, the steel reinforcement experiences excessive concentrated stress, which may lead to premature failure and a reduction in the component’s ductility [13]. As the impact velocity increases, the failure mode of RC beams changes and becomes more localized near the impact point. The response mechanisms of RC beams vary with different impact velocities: at lower velocities, the local inertial effect at the end of micro-cracks controls the beam response, whereas at higher impact velocities, the structural inertial effect controls the response [14]. Therefore, the response of RC beams under impact loads is significantly influenced by both the strain rate and inertial effects, resulting in highly complex behavior.
Under impact loads, the response of RC beams involves two stages: First, in the short period immediately after impact. Stress waves are generated at the loading point, causing a local response in the component. In the subsequent longer period, the component undergoes elastoplastic deformation, which affects its overall response and ultimately leads to failure. Studies have shown that shear failure in RC beams is prone to occur during the local response stage [15,16,17], while flexural failure typically arises during the overall response stage [18]. Under a high-speed impact, RC beams that experience shear failure have longitudinal tension reinforcement that fails to function fully, whereas the stirrups play a vital role. The presence of stirrups influences the crack morphology, resulting in a more uniform crack distribution [10,14]. Conversely, under a low-speed impact, increasing the reinforcement ratio of the tension steel can enhance the load-bearing capacity of RC beams [19]. However, when comparing beams with high-reinforcement-ratio RC beams, there is also significant local damage in the beam–hammer contact area, in addition to the overall deformation and failure [20]. Moreover, variations in the reinforcement ratio have a relatively minor effect on both the local and overall responses of RC beams [21].
Currently, the failure process and modes of RC beams under impact loads are relatively well understood; however, research on failure mechanisms and failure mode discrimination criteria remains insufficient. Moreover, in actual structural design, parameters such as the impact loads, structural materials, and geometric dimensions exhibit significant randomness, resulting in stochastic responses of the RC beams under impact loads. Research into addressing this uncertainty is still inadequate. To address these challenges, this study employed the finite element analysis software ABAQUS to examine the dynamic response characteristics of RC beams under impact loads. Considering three typical failure forms—flexural failure, flexural-shear failure, and shear failure—of RC beams under impact loads, a failure mode discrimination criterion based on the flexural-shear capacity–effect curve is proposed. By leveraging the fundamental principles of structural reliability theory and thoroughly considering the statistical characteristics of random variables under impact loads, the reliability characteristics of RC beams under impact loads were analyzed.
2. Model Establishment and Validation
2.1. Finite Element Model
The drop hammer impact test on RC beams conducted by Fujikake et al. [19] was selected as the analysis object for the numerical simulations. The test beam had a total length of 1.7 m, was supported at both ends with a clear span of 1.4 m, and had a cross-sectional size of 250 mm × 150 mm. The beam was symmetrically reinforced with two 16 mm diameter longitudinal rebars on both the top and bottom surfaces and possessed a measured yield strength of 426 MPa. The stirrups had a diameter of 10 mm and were spaced at 75 mm, with a measured yield strength of 295 MPa. The drop hammer weighed 400 kg with a head radius of 90 mm. The test was divided into four cases (Table 1), in which the hammer was freely released from heights of 0.15, 0.3, 0.6, and 1.2 m above the beam surface to impact the RC beam.

Table 1.
Drop hammer impact test conditions [19].
Based on the impact test parameters, an RC beam finite element model was established in ABAQUS, as shown in Figure 1. The concrete and hammer were modeled using the 8-node linear reduced integration solid element C3D8R from the Explicit element library, while the reinforcement was modeled using the 2-node three-dimensional truss element T3D2 from the Explicit element library. It is generally believed that under impact loading, due to the rapid nature of the loads, the bond between the reinforcement and the concrete has a minimal effect on the outcome. Additionally, considering the simplification of the model, the reinforcement was embedded in the concrete using the embedded method without considering the bond slip. Through mesh tests, the mesh size for all components in the model was set to 25 mm. To simulate the hinged supports at both ends of the RC beam, different degrees of freedom were released to allow the beam ends to assume a hinged configuration. At the same time, to ensure the stability of the hammer, only one vertical displacement degree of freedom was released, which allowed it to move solely in the downward vertical direction.
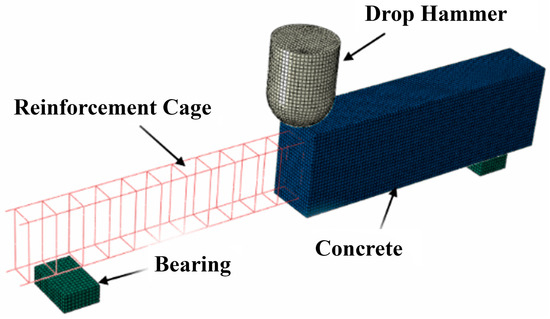
Figure 1.
Drop hammer impact finite element model [19].
To optimize the computational resources, the initial position of the hammer was set at the mid-span upper surface of the RC beam. Various initial velocities (, where h is the impact height) were assigned to the hammer through predefined fields to simulate impacts at different heights. The interaction between the hammer and the test beam was defined as general contact, with the normal contact attribute configured for hard contact and the tangential contact attribute friction coefficient set to 0. Furthermore, to account for the effect of gravity, gravitational acceleration was applied to the entire model.
2.2. Material Model
In the material model, concrete was modeled using the plastic damage model (CDP) available in ABAQUS finite element software, as suggested by Lee and Fenves [22], to simulate the dynamic response of concrete under impact. The model parameters are listed in Table 2. Furthermore, considering the effect of the strain rate, the dynamic amplification factor (DIF) proposed by Hao et al. [23] was incorporated to simulate the enhanced dynamic strength of the concrete.

Table 2.
Parameter values of the CDP model.
Reinforcement was modeled using the bilinear elastoplastic material model provided by ABAQUS. The longitudinal reinforcement and stirrups had a density of 7800 kg/m3, a Poisson’s ratio of 0.3, an elastic modulus of 200 GPa, and a hardening modulus of 1% of the elastic modulus. The hammer was modeled using an elastic material model, with its elastic modulus and Poisson’s ratio determined based on the mechanical properties of steel. To account for the strain rate effect of steel, the Cowper–Symonds [24] model was employed, as detailed in Equation (1):
where is the stress value of the material at the corresponding plastic strain rate ; is the stress value of the material under a static load; and D and p are parameters related to the material type and strain hardening, with D = 6844 and p = 3.91 for steel under large deformation.
2.3. Model Validation
The comparison of the impact force–time history curve and the mid-span deflection–time history curve of the RC beam under various impact conditions is illustrated in Figure 2. The numerical simulation results for both the impact force magnitude and variation trends of the impact force aligned closely with the experimental results in all cases. This consistency validated the reliability of the finite element model used in the study.
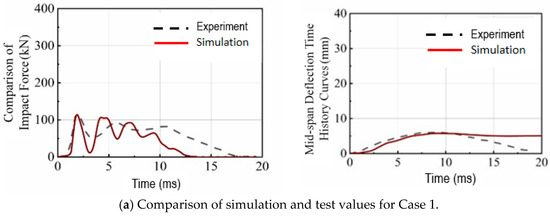
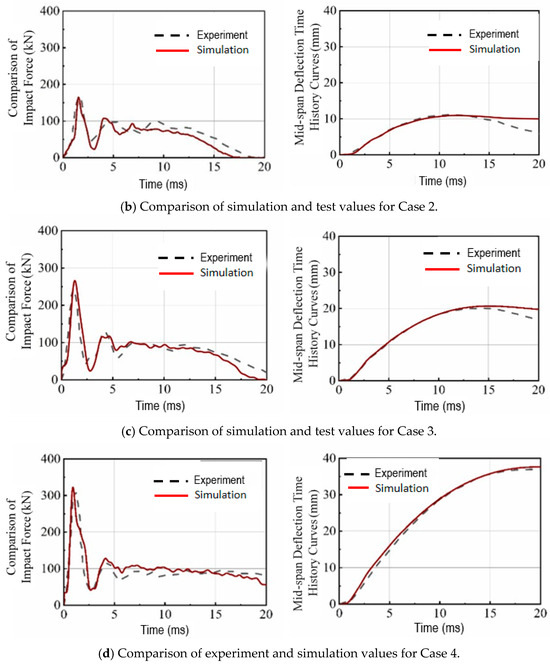
Figure 2.
Comparison of impact force– and mid-span deflection–time history curves.
In ABAQUS, PE, Max represents the maximum principal plastic strain of concrete, and the direction perpendicular to the maximum principal plastic strain is the direction of crack development [25]. Figure 3 shows the comparison of failure modes between the numerical simulation and experimental results. It can be observed that the crack distribution and failure conditions of the RC beam, as determined by numerical simulation and experiments, are generally consistent under various impact conditions. The comparison between the numerical simulation results and experimental results revealed that the finite element model accurately simulated the dynamic response of RC beams under impact loads.
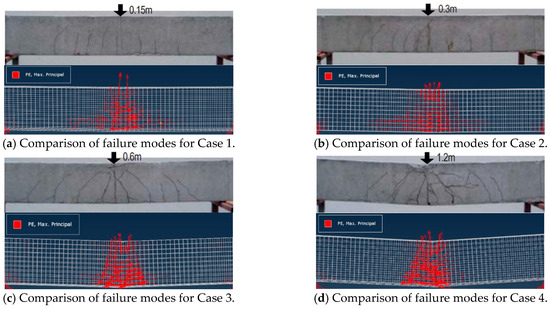
Figure 3.
Comparison of failure modes.
It must be emphasized that although this model can effectively simulate the performance of the beam under a hammer impact, when the boundary conditions, constituent materials, or loading conditions of the beam change, experimental validation of the new model should be conducted to ensure the reliability of the results.
3. Dynamic Response Result Analysis
Taking the finite element numerical simulation of Case 4 as an example, the load characteristics, deformation development, and distribution of the bending moment and shear force of the RC beam under an impact load were analyzed. A comparison also revealed that the overall trend of these indicator changes was similar to that observed in previous experimental studies [1,2,3]. However, the numerical simulation results provide detailed development data throughout the entire process, offering valuable insights for understanding the fundamental resistance of RC beams under impact.
3.1. Internal Force Characteristics
The primary failure cracks in the RC beam under an impact load were predominantly located near the impact point. Therefore, the mid-span location was identified as the critical failure surface. To further study the internal force characteristics of the RC beam under impact, the impact force–, shear force–, and reaction force–time history curves at this location are provided, as illustrated in Figure 4. In the initial stage of impact, both the impact force– and shear force–time history curves exhibited similar wave forms, where they rapidly rose to their peak value at the moment of impact. However, the impact force peak was significantly higher than that of the shear force. The reaction force–time history curve was significantly different from the impact force and shear force–time history curves, where it appeared later than the other two forces. This delayed response occurred because during their initial stage of impact, the impact force was first resisted by the inertial force before being transmitted to the support. In the later stages of impact, the overall trend of the impact force– and shear force–time history curves became similar, marked by rapid attenuation and brief oscillation before a stabilized plateau. In contrast, the reaction force continued to increase, where it ultimately reached a plateau stage with a value that was considerably higher than the other two forces. Therefore, reflecting the load-bearing capacity of the RC beam section under impact using only the impact force or reaction force did not provide a complete model.
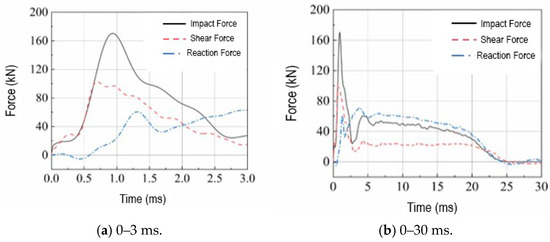
Figure 4.
Comparison of impact force–, shear force–, and reaction force–time history curves (Case 4).
3.2. Deformation Development
Figure 5 illustrates the deformation of the RC beam during the impact process, as determined through finite element calculations. Initially, the vertical deflection was primarily concentrated near the mid-span impact point. However, as time progressed, this deflection spread from the impact point area toward the supports, which eventually became more uniformly distributed along the entire span of the beam. According to the stress wave propagation principle, in the initial stage of impact, a transverse wave propagated from the mid-span impact point area to the supports. Subsequently, these waves were reflected at the boundary and continued to propagate within the beam, where they ultimately reached a uniform stress state across the span. Many researchers utilized the concept of “effective span” [26] to characterize the stress wave propagation effect during the local response stage, defining it as the effective distance traversed by the transverse wave at that stage. The deformation of the RC beam during the impact process, illustrated in Figure 5, reveals that the effective span gradually increased over time and ultimately encompassed the total span of the beam.
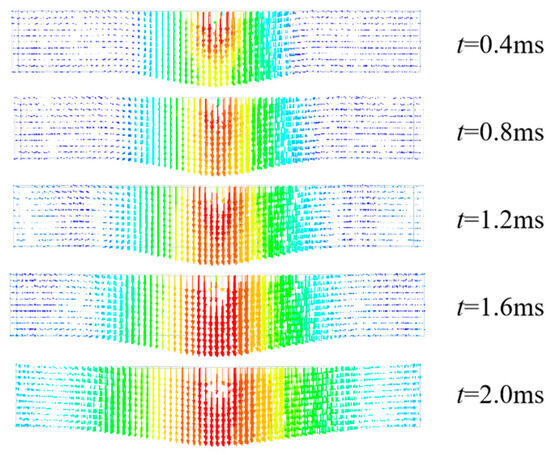
Figure 5.
Vertical deformation change of RC beam under impact (Case 4).
3.3. Distribution of Bending Moment and Shear Force
Figure 6 illustrates the variation curves of the shear force and bending moment at the critical section of the RC beam over time. In contrast to the static loading case, both the shear force and bending moment at the critical section fluctuated throughout the impact process. During the initial stage of impact, the values of the shear force and bending moment at the critical section rose rapidly to their peak in an elastic manner before swiftly transitioning into the plastic stage. The shear force growth rate was much higher than that of the bending moment. As time progressed, the shear force rapidly attenuated, experienced brief oscillation, and stabilized at a plateau stage. At the same time, the bending moment at the section briefly decreased and then recovered to a relatively stable state, which was accomplished by the overall deformation of the beam. In the later stage of impact, as the impact force began to attenuate, both the shear force and bending moment at the critical section decreased accordingly as the beam unloaded.
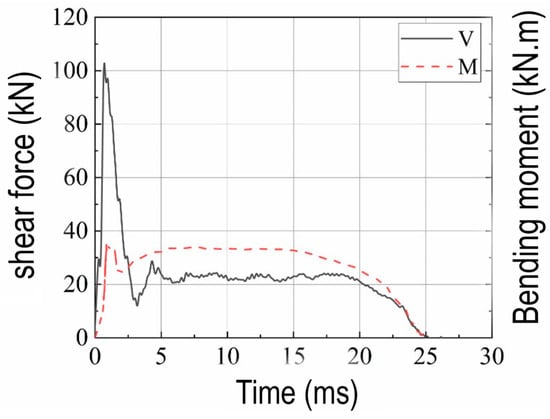
Figure 6.
Time history curves of shear force and bending moment at critical section (Case 4).
Figure 7 illustrates the distributions of the shear force and bending moment along the beam length during the impact process. It is evident that due to the effect of stress wave propagation, initially, there were no internal forces in the shear span area and at the ends of the beam, with the internal force distribution only evident in the localized area at the mid-span. In the subsequent impact process, the internal force distribution of the beam gradually began to resemble that experienced under static loading conditions. Initially, the shear force appeared at the mid-span, while it had not yet propagated to the supports. Over time, this shear force became more uniformly distributed across the entire span. At the onset of the impact, the bending moment at the mid-span section was positive. At the same time, the “effective span” support generated a negative bending moment because the reaction force exceeded the inertial force-generated bending moment. In regions closer to the supports and away from the mid-span, the bending moment values were minimal, where they showed no significant bending moment in these areas. The zero point of the bending moment gradually moved outward with time and eventually moved to the support. The bending moment distribution of the beam in the subsequent impact process was similar to that under static loading.

Figure 7.
Distribution of shear force and bending moment along beam length during impact (Case 4).
4. Failure Mode Discrimination Criterion Study
4.1. Discrimination Criterion
RC beams may exhibit various failure modes under impact loads, making the accurate assessment of deformation and failure modes essential for their impact-resistant design. Liu et al. [27] employed a single-degree-of-freedom system to examine the dynamic characteristics of RC beams under impact loads, focusing on structural failure probability and preliminarily identifying the failure modes of these beams through calculations. Shi et al. [28] proposed an improved equivalent single-degree-of-freedom method for the blast analysis of RC beams by assessing the failure modes of RC beams under blast loads based on displacement. Tang et al. [29] employed critical shear theory to investigate the analysis of the punching-shear failure of RC beams in the context of a near-field explosion. Based on existing research results, a discrimination criterion was proposed for the failure mode discrimination of RC beams under impact loads, utilizing the flexural-shear capacity–effect curve. The discrimination criterion includes two aspects: first, the calculation of the dynamic bending moment M and dynamic shear force V of the RC beam; second, the determination of the ultimate flexural capacity Mu and ultimate shear capacity Vu of the RC beam under dynamic loads. This analysis considers the strain rate effect of the material and incorporates a dynamic amplification factor in assessing the ultimate capacity. The ratio of the applied force to the ultimate capacity γ is then used as the basis for the failure mode discrimination of RC beams: γM = M/Mu, where γM > 1 indicates the flexural failure of the RC beam. Otherwise, no flexural failure occurs: γV = V/Vu, where γV > 1 indicates the shear failure of the RC beam. Otherwise, no shear failure occurs.
Compared with flexural and shear failures, the flexural-shear failure mode involves the coupling of two different failure characteristics, making it difficult to derive the conditions for the flexural-shear failure of RC beams theoretically. However, based on existing statistical results, the area of interaction defined by the 0.75yM–0.5yV curves is approximately regarded as the flexural-shear failure zone. Figure 8 illustrates the discrimination criterion for the failure modes of RC beams under impact loads, divided into the shear failure zone, flexural-shear failure zone, and flexural failure zone. The position of the failure point ultimately determines the failure mode for the RC beam. Curve 1 predicts the flexural failure of the RC beam, curve 2 predicts the flexural-shear failure, and curve 3 predicts the shear failure.
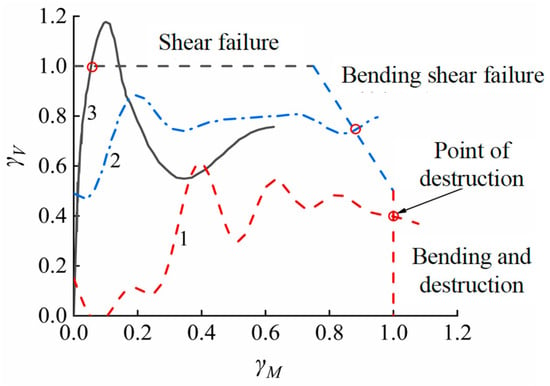
Figure 8.
Discrimination criterion for failure modes of RC beams under impact loads. γM and γV—the ratio of dynamic bending moment to ultimate flexural capacity and the ratio of dynamic shear force to ultimate shear capacity; 1, 2, and 3—curve numbers.
In evaluating the failure modes of RC beams under impact loading, previous single-degree-of-freedom methods require the RC beam system to be first equivalently reduced to a single degree of freedom, a complex process that is only effective for failure modes dominated by flexural failure [27,28]. As a result, some scholars have proposed evaluation methods based on shear theory indicators [29]. However, these methods cannot independently address the prediction of all possible failure modes. The criterion proposed in this paper, on the other hand, is suitable for all failure modes, providing a new approach for determining the failure of RC beams under impact.
4.2. Criterion Validation
The existing drop hammer impact tests [9,30] were utilized to calculate the ultimate capacity of RC beams and output their dynamic resistance. The discrimination criterion curves for distinguishing different failure modes are presented in Figure 9. In the initial stage of the impact, the γV of component B-868-7.14 exceeded 1, indicating that shear failure occurred in the critical section; conversely, for components A2-587-4.00 and Bb150-5.30, γV did not reach 1 in the initial stage of the impact. In the subsequent impact, the γM of component A2-587-4.00 exceeded 1, which resulted in flexural failure. Notably, component Bb150-5.30 reached the flexural-shear failure domain value and experienced flexural-shear failure; for component Ba070-3.46, neither γV nor γM exceeded 1, and this component did not fail. The predicted failure modes of the beam components under impact matched the experimental results, as shown in Figure 10.
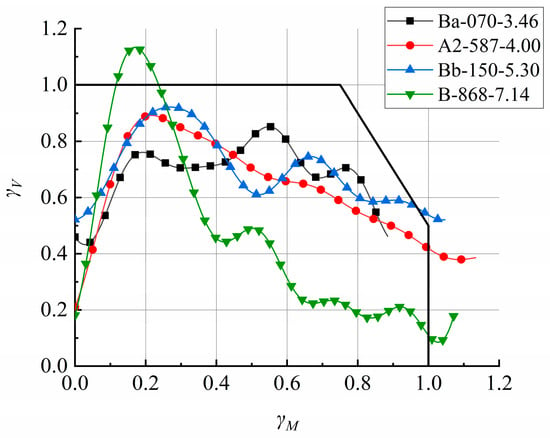
Figure 9.
Discrimination criterion curves for different failure modes.

Figure 10.
Discrimination diagrams for different failure modes: (a) component Ba070-3.46 [8]; (b) component A2-587-4.00 [29]; (c) component Bb150-5.30 [8]; (d) component B-868-7.14 [29].
Table 3 provides a summary of the prediction results based on the flexural-shear capacity–effect curve. The proposed failure mode discrimination method yielded results that closely matched the experimental results, demonstrating the correctness and feasibility of the discrimination criterion.

Table 3.
Summary of prediction results.
Due to the complexity of the flexural-shear failure mode response, the limit value of the flexural-shear failure zone in the proposed failure mode discrimination criterion was obtained through statistics. Therefore, there was a notable difference in SS3a as compared with Table 3, which warrants further research based on more comprehensive experimental data and accurate model analysis results.
4.3. Influence Factor Analysis
To further elucidate the factors influencing the failure modes of RC beams under impact loads, a failure mode discrimination criterion based on the flexural-shear capacity-effect curve was employed. This approach enabled the examination of various failure modes in RC beams subjected to different impact velocities and stirrup ratios to obtain the influence laws of different parameters.
- (1)
- Impact velocity
The impact velocity is a crucial factor that influences the failure modes of reinforced concrete (RC) beams subjected to impact loads. As illustrated in Figure 11, the same influence law appeared in different tests. As the impact velocity increased, the failure mode of the RC beams gradually shifted from flexural failure to shear failure.
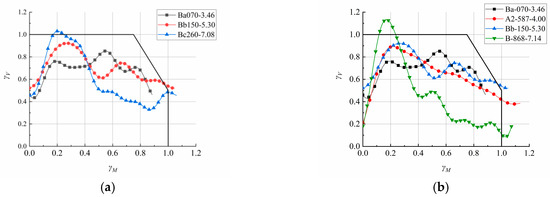
Figure 11.
Failure mode discrimination with increasing velocity. (a) failure mode discrimination of Huo’s test [9]; (b) failure mode discrimination of Zhao’s test [24].
- (2)
- Stirrup ratio
The load-bearing capacity of RC beams is closely related to the stirrup ratio. For a given load, a higher stirrup ratio can reduce the possibility of shear failure. Saatci [14] conducted drop hammer impact tests on eight RC beams, each with varying stirrup ratios. The stirrup ratios of the a- and b-series beams in the tests were 0.0%, 0.1%, 0.2%, and 0.4%. To predict the failure modes of the test beams under impact, a failure mode discrimination criterion based on the flexural-shear capacity–effect curve was employed. Figure 12 illustrates the discrimination results of the failure modes of RC beams under impact. The data indicate that as the stirrup ratio decreased, the beams were increasingly prone to shear failure; however, increasing the stirrup ratio effectively mitigated this risk.

Figure 12.
Failure mode discrimination with increasing stirrup ratio.
5. Failure Probability Study of RC Beams Under Impact Loads
Based on the established failure mode discrimination criterion for RC beams under impact loads, the failure probability of these beams under impact loads was calculated using the Monte Carlo method. This approach is grounded in the principles of structural reliability theory and fully considers the statistical characteristics of random variables, including the material strength, geometric dimensions, and impact loads of RC beams. The example RC beam was characterized by a cross-sectional size of 250 mm × 150 mm and was supported at both ends. The RC beam used C30 concrete, with symmetrical reinforcement in the beam section, longitudinal reinforcement of Φ16HRB400 steel bars, and stirrups of Φ8HPB400 steel bars. The failure probability of the RC beams under impact loads was calculated using the Monte Carlo method while fully considering the statistical characteristics of random variables, such as material strength, geometric dimensions, and impact loads. The characteristic parameters of RC beams are generally assumed to follow a normal distribution [35]. Table 4 shows the normal distribution statistical parameters of the RC beam resistance model.

Table 4.
Statistical parameters of RC beam resistance model.
The failure probability of RC beams under impact loads was calculated based on the flexural-shear capacity–effect curve failure mode discrimination criterion while considering the uncertainty of resistance and load action. The load case conditions were set as follows: the impact velocity ranged from 1 to 12 m/s and the impact mass ranged from 100 to 800 kg. The statistics of failure modes of RC beams with different stirrup spacings under impact loads are shown in Figure 13.
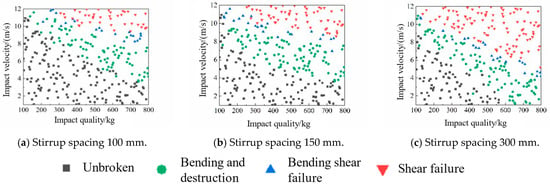
Figure 13.
Statistics of failure modes of RC beams with different stirrup spacing under impact.
As illustrated in Figure 13, the failure modes of the RC beams under impact loads were influenced by both the impact mass and impact velocity. As the impact velocity and impact mass increased, the failure modes of the RC beams shifted from flexural failure to flexural-shear failure, and ultimately, to shear failure. Notably, the transition of RC beams to shear failure was more sensitive to the impact velocity than to the impact mass.
Figure 14 illustrates the failure probability curves of the flexural failure, flexural-shear failure, and shear failure of RC beams with different stirrup spacings. An increase in the stirrup spacing corresponded to higher probabilities of various failure modes of the RC beams. Specifically, with a stirrup spacing of 100 mm, the failure probabilities of flexural failure, flexural-shear failure, and shear failure of the RC beams were 0.272, 0.069, and 0.136, respectively; when the stirrup spacing was 150 mm, the failure probabilities of flexural failure, flexural-shear failure, and shear failure of the RC beams were 0.322, 0.079, and 0.192, respectively. When the stirrup spacing was further increased to 300 mm, the failure probabilities of flexural failure, flexural-shear failure, and shear failure of the RC beams were 0.338, 0.083, and 0.368, respectively. The increases in the failure probabilities of flexural failure, flexural-shear failure, and shear failure modes as the stirrup spacing increased from 100 mm to 300 mm were 24.26%, 20.29%, and 170.59%, respectively. The increase in the stirrup spacing reduced the reliability of RC beams under impact, indicating that lowering the stirrup spacing and increasing the stirrup ratio could effectively enhance the shear capacity and impact resistance of RC beams.
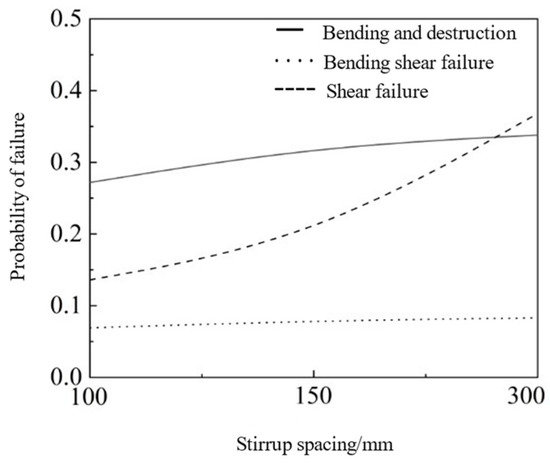
Figure 14.
Failure probability of RC beams with different stirrup spacings under impact.
Under different stirrup spacing conditions, both flexural failure modes and shear failure modes may occur. When the stirrup spacing was 100 mm and 150 mm, the flexural failure mode dominated, while when the stirrup spacing was 300 mm, the shear failure mode dominated. Since RC beams under impact loads may exhibit multiple failure modes, in practical engineering design, the stirrup spacing should be controlled to encourage RC beams to tend towards the more ductile flexural failure mode.
To investigate the influence of beam length on the failure probability of different failure modes of RC beams under impact loads, the failure probabilities of RC beams with different spans were calculated. The statistics of failure modes of RC beams with varying spans under impact loads are illustrated in Figure 15.
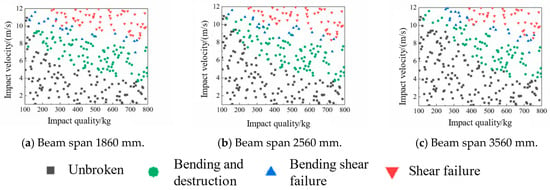
Figure 15.
Statistics of failure modes of RC beams with different spans under impact.
Figure 16 illustrates the failure probability curves of flexural failure, flexural-shear failure, and shear failure of RC beams with varying spans. Under constant input energy conditions, as the beam span increased, the probability of other failure modes of RC beams decreased. For instance, at a span of 1860 mm, the failure probabilities of flexural failure, flexural-shear failure, and shear failure were 0.332, 0.076, and 0.196, respectively. When the span was increased to 2560 mm, these failure probabilities changed to 0.318, 0.069, and 0.179, respectively. Furthermore, at a span of 3560 mm, the failure probabilities of flexural failure, flexural-shear failure, and shear failure were 0.265, 0.043, and 0.132, respectively. The reduction in the failure probabilities of flexural failure, flexural-shear failure, and shear failure modes as the beam span increased from 1860 mm to 3560 mm were 20.18%, 43.42%, and 32.65%, respectively. Under a constant energy condition, increasing the beam span improved the reliability of RC beams under impact, where larger spans yielded better impact resistance.
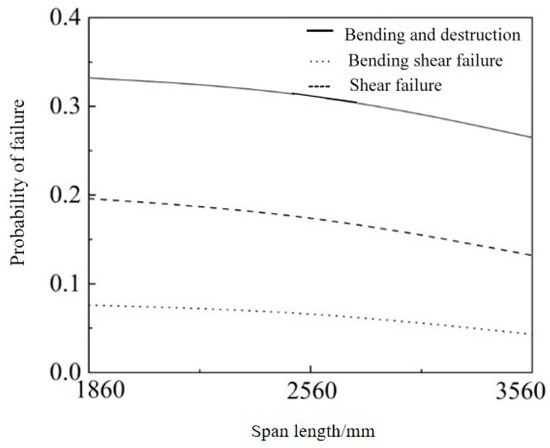
Figure 16.
Failure probability of RC beams with different spans under impact.
6. Conclusions
In this study, we comprehensively investigated the failure modes and stochastic behavior of reinforced concrete (RC) beams under impact loads through experimental validation, finite element modeling, and reliability analysis. The findings provide valuable insights into the dynamic response and failure mechanisms of RC beams subjected to impact, which are crucial for improving the impact resistance design of RC structures. The conclusions drawn from this research are summarized as follows:
- (1)
- The internal force distribution and deformation of RC beams under impact loads varied throughout the impact process. Initially, the internal forces were primarily concentrated at the mid-span, with shear failure being prone to occur during the local response stage. In contrast, flexural failure generally occurred during the subsequent overall response stage. During the local response stage, the deformation of RC beams spread from the impact point to the supports.
- (2)
- To address the occurrence of the flexural failure, flexural-shear failure, and shear failure of RC beams under impact loads, a failure mode discrimination criterion based on the flexural-shear capacity–effect curve was proposed. The feasibility of the criterion was verified through a series of experiments. Parameter analyses indicate that as the impact velocity increased, the likelihood of shear failure in RC beams also rose. A decrease in the stirrup ratio increased the probability of shear failure, while an increase in the stirrup ratio served to diminish this risk.
- (3)
- The reliability analyses revealed that as both the impact velocity and impact mass increased, the failure mode of RC beams under impact loads shifted from flexural failure to flexural-shear failure, and ultimately, to shear failure. This shift towards shear failure was more sensitive to changes in the impact velocity than to variations in the impact mass. Furthermore, increasing the stirrup spacing reduced the reliability of RC beams under impact, while lowering the stirrup spacing could effectively enhance the impact resistance of RC beams. Under the condition of constant impact energy, increasing the beam span improved the reliability in response to the impact, where larger spans yielded better impact resistance.
In conclusion, this study provided a robust framework for understanding and predicting the failure modes and stochastic behavior of RC beams under impact loads. The findings and proposed methods offer practical guidance for improving the impact resistance design of RC structures. Future research should focus on refining the discrimination criteria, exploring the impact resistance of new materials, and developing more comprehensive reliability models to address the challenges posed by complex loading conditions and material behaviors.
Author Contributions
Conceptualization, T.Y., Y.J., X.Z., Q.L. and Y.W.; methodology, T.Y., Q.L. and Y.W.; software, Y.J., X.Z. and Y.W.; validation, T.Y.; resources, T.Y. and Y.W.; data T.Y., Y.J. and Q.L.; writing—original draft preparation, T.Y., Y.J., X.Z. and Q.L.; writing—review and editing, T.Y., Q.L. and Y.W.; visualization, T.Y., Y.J., X.Z. and Q.L.; supervision, T.Y. and Y.W. All authors have read and agreed to the published version of the manuscript.
Funding
This work was supported by the Municipal and School Integration Development Strategic Project of Jinan City (JNSX2023023) and the National Natural Science Foundation of China (grant no. 52408534).
Data Availability Statement
The data that support the findings of this study are available from the corresponding authors upon reasonable request.
Acknowledgments
The authors would like to thank the associate editor and the reviewers for their useful feedback that improved this paper.
Conflicts of Interest
Author Xiaoyan Zhang was employed by the company Shandong Academy of Building Research Co., Ltd. The remaining authors declare that the research was conducted in the absence of any commercial or financial relationships that could be construed as a potential conflict of interest.
References
- Ohnuma, H.; Ito, C.; Nomachi, S.G. Dynamic response and local rupture of reinforced concrete beam and slab under impact loading. In Proceedings of the Transactions of the 8th International Conference on Structural Mechanics in Reactor Technology, Amsterdam, The Netherlands, 22–24 July 1985; North-holland Physics Publishing: Brussels, Belgium, 1985; pp. 179–184. [Google Scholar]
- Xu, B.; Zeng, X. Experimental study on the behaviors of reinforced concrete beams under impact loadings. China Civ. Eng. J. 2014, 47, 41–51+61. [Google Scholar]
- Dou, G.Q.; Du, X.L.; Li, L. Experimental Study on the Behavior of High Strength Reinforced Concrete Beams Under Impact Load. J. Tianjin Univ. Sci. Technol. 2014, 47, 1072–1080. [Google Scholar]
- Geng, J. The Study of the Size Effect on Reinforced Concrete Beam Under Impact Loading. M.Sc. Thesis, University of Jinan, Jinan, China, 2020. [Google Scholar]
- Fang, Q.; Wu, P.A. Main factors affecting failure modes of blast loaded RC beams. Chin. J. Comput. Mech. 2003, 20, 39–42+48. [Google Scholar]
- Wu, M.; Huang, Y.Q.; Pan, R.S. Numerical study on impact resistance of NC–UHPC composite beam. Chin. J. Eng. 2024, 46, 354–364. [Google Scholar]
- Wu, M.; Jin, L.; Du, X.L. Numerical investigation of precast RC beam with unbonded prestressing tendon under impact loads. Struct. Infrastruct. Eng. 2023, 19, 460. [Google Scholar] [CrossRef]
- Mei, F.L.; Dong, X.L.; Yu, X.L. On failure behavior of concrete and RC beam to different velocity impact. J. Ningbo Univ. NSEE 2017, 30, 83–88. [Google Scholar]
- Huo, J.S.; Hu, K.Y. Failure Mechanism of RC Beams under Impact Loading and Discussion on Prediction Methods of Residual Deflection. J. Hunan Univ. Nat. Sci. 2017, 44, 112–117. [Google Scholar]
- Travas, V.; Ozbolt, J.; Kozar, I. Failure of plain concrete beam at impact load: 3D finite element analysis. Int. J. Fract. 2009, 160, 31–41. [Google Scholar] [CrossRef]
- Sun, J.Y.; Li, G.Q. Development of Solid Material’s Constitutive Model on The Dynamic Load. Sichuan Build. Sci. 2006, 32, 144–149. [Google Scholar]
- CEB. CEB-FIP Model Code 1990; Design Code: London, UK, 1993. [Google Scholar]
- Fu, H.C.; Erki, M.A.; Seckin, M. Review of effects of loading rate on reinforced concrete. J. Struct. Eng. 1991, 117, 3660–3679. [Google Scholar] [CrossRef]
- Ozbolt, J.; Sharma, A. Numerical simulation of reinforced concrete beams with different shear reinforcements under dynamic impact loads. Int. J. Impact Eng. 2011, 38, 940–950. [Google Scholar] [CrossRef]
- Zhao, W.C.; Qian, J. Study on Local Response Characteristics of RC Beams under Impact Loadin. J. Hunan Univ. Nat. Sci. 2019, 46, 25–32. [Google Scholar]
- Krauthammer, T.; Shahriar, S.; Shanaa, H.M. Response of reinforced concrete elements to severe impulsive loads. J. Struct. Eng. 1990, 116, 1061–1079. [Google Scholar] [CrossRef]
- Wang, Y.H.; Shi, B.B.; Chen, C. Response and Failure Characteristics of Segmental Assembled Beams Under Impact Loading. China J. Highw. Transp. 2024, 37, 188–200. [Google Scholar]
- Yi, W.J.; Zhao, D.B.; Kunnath, S.K. Simplified approach for assessing shear resistance of reinforced concrete beams under impact loads. ACI Struct. J. 2016, 113, 747–756. [Google Scholar] [CrossRef]
- Mylrea, T.D. Effect of impact on reinforced concrete beams. Highw. Res. Board Proc. 1940, 36, 581–594. [Google Scholar]
- Fujikake, K.; Li, B.; Soeun, S. Impact response of reinforced concrete beam and its analytical evaluation. J. Struct. Eng. 2009, 135, 938–950. [Google Scholar] [CrossRef]
- Song, C.M.; Zhong, J.H.; Xu, J.W. Experimental study on dynamic response and failure mode transformation of reinforced concrete beams under impact. Explos. Shock Waves 2024, 44, 132–150. [Google Scholar]
- Lee, J.; Fenves, G.L. Plastic-damage model for cyclic loading of concrete structure. J. Eng. Mech. 1998, 124, 892–900. [Google Scholar] [CrossRef]
- Hao, Y.F.; Hao, H. Influence of the concrete DIF model on the numerical predictions of RC wall responses to blast loadings. Eng. Struct. 2014, 73, 24–38. [Google Scholar] [CrossRef]
- Cowper, G.R.; Symonds, P.S. Strain Hardening and Strain Rate Effects in the Impact Loading of Cantilever Beams; Division of Applied Mathematics Repor; Brown University: Providence, RI, USA, 1957. [Google Scholar]
- Hou, C.C. Study on Performance of Circular Concrete-filled Steel Tubular (CFST) Members Under Low Velocity Transverse Impact. M.Sc. Thesis, Tsinghua University, Beijing, China, 2012. [Google Scholar]
- Cotsovos, D.M. A simplified approach for assessing the load-carrying capacity of reinforced concrete beams under concentrated load applied at high rates. Int. J. Impact Eng. 2010, 37, 907–917. [Google Scholar] [CrossRef]
- Liu, T.Q.; Wang, X.G.; Ge, N. Investigation into Failure Mode of RC Column Subjected to Impulsive Load. J. Wuhan Univ. Technol. 2010, 32, 188–193. [Google Scholar]
- Shi, Y.C.; Zhang, H.; Li, Z.X. Improved equivalent single degree of freedom method for blast analysis of RC beams. J. Build. Struct. 2019, 40, 8–16. [Google Scholar]
- Tang, H.; Su, J.J.; Zhai, H.B. Prediction method of punching-shear failure of simply supported reinforced concrete beams subjected to close-in explosion. J. Ordnance Equip. Eng. 2022, 43, 117–123. [Google Scholar]
- Zhao, D.B. Response Characteristics and Design Method of Reinforced Concrete Beams Under Impacting Load. Ph.D. Thesis, Hunan University, Changsha, China, 2017. [Google Scholar]
- Kishi, N.; Mikami, H. Empirical formulas for designing reinforced concrete beams under impact loading. ACI Struct. J. 2012, 109, 509–519. [Google Scholar] [CrossRef]
- Saatci, S.; Vecchio, F.J. Effects of shear mechanisms on impact behavior of reinforced concrete beams. ACI Struct. J. 2009, 106, 78–86. [Google Scholar] [CrossRef] [PubMed][Green Version]
- Tachibana, S.; Masuya, H.; Nakamura, S. Performance based design of reinforced concrete beams under impact. Nat. Hazards Earth Syst. Sci. 2010, 10, 1069–1078. [Google Scholar] [CrossRef]
- Zeng, X. Experimental and Numerical Study of RC Beams and Columns Under Impact Loadings and Rrapid Loadings. Ph.D. Thesis, Hunan University, Changsha, China, 2014. [Google Scholar]
- Gong, J.X.; Wei, W.W. Principles of Engineering Structure Reliability Design; Mechanical Industry Press: Beijing, China, 2007; p. 165. [Google Scholar]
Disclaimer/Publisher’s Note: The statements, opinions and data contained in all publications are solely those of the individual author(s) and contributor(s) and not of MDPI and/or the editor(s). MDPI and/or the editor(s) disclaim responsibility for any injury to people or property resulting from any ideas, methods, instructions or products referred to in the content. |
© 2025 by the authors. Licensee MDPI, Basel, Switzerland. This article is an open access article distributed under the terms and conditions of the Creative Commons Attribution (CC BY) license (https://creativecommons.org/licenses/by/4.0/).