Article

Methodology for International Transport Corridor Macro-Modeling Using Petri Nets at the Early Stages of Corridor Development with Limited Input Data

by
Igor Kabashkin
1,* and
Zura Sansyzbayeva
2
1
Transport and Telecommunication Institute, 1 Lomonosov str., LV-1019 Riga, Latvia
2
Faculty of Transport and Energy, Eurasian National University, Satpajeva 2, Astana KZ-10000, Kazakhstan
*
Author to whom correspondence should be addressed.
Modelling 2024, 5(1), 238-264; https://doi.org/10.3390/modelling5010013
Submission received: 16 November 2023 / Revised: 8 February 2024 / Accepted: 16 February 2024 / Published: 17 February 2024

Abstract

:
International transport corridors (ITCs) are intricate logistical networks essential for global trade flows. The effective modeling of these corridors provides invaluable insights into optimizing the transport system. However, existing approaches have significant limitations in dynamically representing the complexities and uncertainties inherent in ITC operations and at the early stages of ITC development when data are limited. This gap is addressed through the application of Evaluation Petri Nets (E-Nets), which facilitate the detailed, flexible, and responsive macro-modeling of international transport corridors. This paper proposes a novel methodology for developing E-Net-based macro-models of corridors by incorporating key parameters like transportation time, costs, and logistics performance. The model is scalable, enabling analysis from an international perspective down to specific country segments. E-Nets overcome limitations of conventional transport models by capturing the interactive, stochastic nature of ITCs. The proposed modeling approach and scalability provide strategic insights into optimizing corridor efficiency. This research delivers a streamlined yet comprehensive methodology for ITC modeling using E-Nets. The presented framework has substantial potential for enhancing logistics system analysis and planning.

1. Introduction

In the ever-evolving landscape of global trade, the significance of transport and logistics cannot be overstated. The seamless movement of goods across international borders is pivotal to the functioning of modern economies.
Global trade has historically been a catalyst for economic development and international relations. However, the rapid shifts in geopolitical scenarios, such as regional conflicts, trade agreements, and even pandemics, have profoundly impacted the flow of goods worldwide. These shifts necessitate a reevaluation and redevelopment of existing international transport corridors (ITCs)—routes used for the passage of goods through various modes of transportation including road, rail, sea, and air.
One of the tools for such analysis is ITC macro-modeling [1]. The modeling of transport corridors refers to the large-scale analysis and modeling of these routes to assess and compare their efficiency. This approach considers a multitude of factors including geographical, economic, political, and technological aspects. The primary aim is to understand how goods can be transported more effectively, at lower costs, with higher reliability, and with minimal environmental impact.
The relevance of macro-modeling in today’s international transport landscape is underscored by the growing complexity of global supply chains [2]. With the rise of e-commerce and just-in-time delivery models, the demand for strategic planning and optimization of ITCs has soared. Countries and corporations alike recognize the need for a holistic understanding of transport networks to maintain competitiveness and ensure economic growth. Macro-modeling answers this call by enabling the simulation and analysis of large-scale transport systems, providing stakeholders with a complex view of the operational intricacies and potential improvements [3].
One of the foremost advantages of macro-modeling is its ability to synthesize vast amounts of data into coherent, actionable strategies. Macro-models can capture critical parameters—transportation time, costs, and logistics performance—across an entire transport corridor. This comprehensive approach allows for the identification of systemic inefficiencies and opportunities for cost reduction, which might otherwise be obscured in micro-level analyses.
Macro-modeling also offers unparalleled scalability [4]. It can be applied to an entire spectrum of analyses, from international down to specific country segments, allowing for both broad and targeted assessments. Such scalability is crucial for developing adaptive strategies that can accommodate diverse geographic, economic, and political contexts.
Furthermore, macro-modeling excels in scenario planning. By manipulating variables within the model, planners can predict the outcomes of various policies, infrastructure developments, or market changes. This foresight is invaluable for long-term strategic planning and risk management, ensuring that transport corridors can adapt to future challenges.
Macro-modeling, in the context of transport corridors, refers to the comprehensive analysis and strategic planning of trade routes on a large scale. As a tool, macro-modeling aids in deciphering the complexities and dynamics of global trade networks, offering invaluable insights for decision-makers in both the public and private sectors. It plays a significant role in enhancing the overall efficiency of supply chains, reducing costs, and ensuring the timely delivery of goods—aspects that are fundamentally essential in maintaining the competitive edge of businesses and economies alike.
The macro-modeling of international transport corridors has emerged as a crucial analytical approach in the face of globalizing economies and expanding trade networks. Despite its pivotal role in shaping the infrastructure that undergirds global trade, there remain discernible gaps in the methodologies currently employed. These gaps hinder the ability of macro-models to fully encapsulate the complexities of ITCs and, in turn, to produce comprehensive strategies for their development and optimization.
One of the most significant gaps in current macro-modeling methods is the inadequate representation of the complex dynamics of transport corridors. ITCs involve a multitude of interconnected variables, including traffic flow, logistical constraints, and cross-border regulatory frameworks, which are not always fully captured by existing models.
ITCs are multimodal by nature, incorporating various modes of transport such as rail, road, maritime, and air freight. However, current macro-modeling methods often fall short of integrating these modes into a cohesive framework. This limitation prevents a comprehensive analysis of the intermodal interfaces, which are critical junctures for efficiency and reliability in the transportation chain [5].
The effectiveness of macro-models is heavily contingent on the quality and harmonization of data across different regions and transport modes. Yet, there is a notable gap in the standardization of data collection and processing methodologies, which leads to inconsistencies and gaps in the data that inform these models. Such disparities can skew the results of macro-modeling exercises, making them less reliable for decision-making [2].
ITCs traverse multiple jurisdictions, each with its unique geopolitical realities that can affect transport efficiency and security. Current macro-modeling methods often do not adequately account for these factors, including trade policies, customs regulations, and political stability, which can dramatically influence the operation of transport corridors [6].
The dynamic nature of global trade demands that ITC models be capable of real-time responsiveness to changing conditions. However, many known macro-modeling methods are static and do not allow for real-time data integration, which limits their capacity to provide up-to-date recommendations and adapt to sudden shifts in the transport landscape.
To address these gaps, it is essential to develop macro-modeling methods that can handle the intricacies of ITCs with greater precision.
This article describes an approach to constructing macro-models of international transport corridors using Petri net applications. A methodology for constructing such models at the early stages of ITC analysis, in the absence of accurate data and detailed information on the functioning of the national segments of these transport corridors, is proposed. This paper introduces some novel contributions to the field of international transport corridor macro-modeling using Petri nets, particularly focusing on the early stages of development when data availability is limited. Firstly, we propose a novel methodology for constructing Evaluation Petri Net (E-net)-based macro-models that incorporate key parameters such as transportation time, costs, and logistics performance, offering a detailed, flexible, and responsive framework for ITC analysis. Secondly, we demonstrate the application of E-nets in overcoming the limitations of conventional transport models by capturing the interactive and stochastic nature of ITC operations, which is often overlooked in existing methodologies. Thirdly, our research introduces a scalable modeling approach that allows for analysis from an international perspective down to specific country segments, thus providing strategic insights into optimizing corridor efficiency across different scales. Lastly, by addressing the gaps in current macro-modeling methods, our work contributes to enhancing logistics systems analysis and planning, offering a comprehensive and pragmatic tool for stakeholders involved in the early development stages of ITCs.
The paper’s organization is as follows. Section 2 offers an in-depth review of existing research and methodologies related to international transport corridors, focusing on macro-modeling approaches and their applications. Section 3 describes the methodology employed in our study, including the development and application of the macro-modeling framework. The specifics of the E-net approach and its adaptations for the international transport corridor context are detailed. Section 4 presents a case study applying the proposed macro-modeling framework to a segment of an international transport corridor. This section illustrates the practical application of methodology and highlights key insights and findings. Section 5 analyzes the results obtained from the case study, discussing their implications for the efficiency and optimization of international transport corridors. Section 6 concludes with a summary of findings, their significance in the field of transport corridor analysis, and potential avenues for future research.

2. Related Works

The study of transport corridors and their modeling has attracted significant scholarly attention, given the critical role these corridors play in global trade, economic development, and regional integration. This review summarizes key works in this field, highlighting the various approaches, methodologies, and findings that have shaped our understanding of transport corridors and their modeling. It synthesizes relevant studies to establish a foundation for the proposed macro-modeling methodology. This review elucidates the evolution of macro-modeling practices and highlights the identified gaps in existing methods when applied to international transport corridors.

2.1. Foundational Theories and Methodologies in Transport Corridors

Geographical and economic aspects: Rodrigue [7] provides foundational insights into transport systems, particularly emphasizing the geographical aspects of transportation. This work lays the groundwork for understanding the basic principles and economic significance of transport corridors in global trade.
Transport modeling techniques: The comprehensive resource offered by Ortúzar and Willumsen in [8] delves into various transport modeling techniques. This resource is pivotal for understanding the broad range of methodologies applicable to transport corridor studies.

2.2. Specific Applications and Case Studies

Belt and road initiative: Study [9] presents a network economics analysis of the Belt and Road Initiative’s land corridors. It offers a unique perspective on how these corridors reshape economic centers and affect transport costs and market opportunities.
Economic perspectives in planning: Wang et al. in [10] introduce a novel planning approach for transport corridors from an economic viewpoint, focusing on travel demand and decision-making mechanisms.

2.3. Multimodal and Innovative Transport Solutions

Multimodal transport development: Kramarz et al. in [11] discuss multimodal transport, emphasizing its significance in balancing the predominance of vehicle transport within the European Community.
Advanced air mobility infrastructure: Muna et al. in [12] explore the concept of air corridors, vital for advanced air mobility, presenting insights into their efficient design and operation.

2.4. Logistics and Performance Analysis

Logistics corridors and urban growth: Boira et al. in [13] investigate the impact of the Mediterranean Railway Corridor on urban growth, highlighting the evolving relationship between rail networks and cities.
Corridor performance measurement: The corridor performance measurement and monitoring mechanism, developed by the Central Asia Regional Economic Cooperation Program [14], provides an empirical tool for assessing goods movement efficiency in corridors, offering valuable insights for reform efforts.

2.5. Analysis of the Economic Efficiency of Transport Corridors

Economic equilibrium in transport planning: The innovative economic equilibrium-based planning concept for optimizing transport passenger corridors is introduced in [15]. This approach employs a dynamic equilibrium analysis between supply and demand, leveraging a Gradient Descent algorithm to refine the supply structure. By targeting maximum global transportation demand and customer surplus, this model effectively reflects the economic dynamics of comprehensive transport corridors. It accounts for factors such as passenger flow, travel value, the scale rate of return, and travel time. This method demonstrates significant academic potential for optimizing passenger transportation structures, with applicability extending from regional specifics to wider urban transportation networks.
The role of corridors in economic development: Study [16] underscores the significance of transport corridors in bolstering economic growth, citing their crucial role in cultivating efficient and sustainable logistics systems. It articulates the definition of corridors as strategic links that facilitate trade, transport, and connectivity between various economic nodes. The study delineates various corridor types including development, economic, and multimodal transport corridors, and emphasizes their spatial function in connecting economic centers such as cities, ports, and industrial areas. The emphasis on multimodal transport corridors reveals their importance in the handling and transshipment of goods, highlighting their role as economic lifelines for cities and freight villages.

2.6. Policy and Regulatory Perspectives

Management system of transport corridors: Report [17] presents an in-depth review of transport corridors, examining their functions, management structures, performance assessment, and improvement strategies, with examples including those serving land-locked developing countries. It questions the extent to which corridors can be effectively managed, given the diversity of stakeholders involved, such as government agencies, shippers, transport companies, and logistics service providers. Recognizing the complexity and variety of corridor services, stakeholders, and dependent economic activities, the report develops a typology of corridors and potential management interventions, focusing on both organizational structures and the roles of public and private sectors. The primary goal is to connect this typology with suitable management structures for specific corridor scenarios.
Trade and transport corridor management: The Trade and Transport Corridor Management Toolkit [18] consolidates knowledge on corridor project implementation, serving as a resource for policymakers and the private sector.
European transport corridor regulation: Report [19] evaluates the guidelines for the development of the trans-European transport network (TEN-T). The assessment focuses on its relevance, effectiveness, efficiency, coherence, and EU-added value, utilizing a mixed-methods approach that includes desk research, surveys, and interviews with various EU, national, and local transport stakeholders.
Evaluation of trans-European transport network: Report [20] evaluates the guidelines for the development of the trans-European transport network, providing insights into its effectiveness and areas for improvement.

2.7. Socio-Economic Impacts and Development

Socio-economic energizers: Qaja in [21] delves into the socio-economic impacts of transport corridors, focusing on the issues they present in various regions and their effects on local and national development. The study emphasizes the vital role of roads in economic growth, facilitating the efficient transportation of people and goods, and enabling tourism development, particularly in areas with natural beauty. The research aims to explore the routes’ social and economic impacts on the residents of the affected areas.
The Trans-Caspian International Transport Route (TITR): TITR is a significant rail freight transport link connecting China with the European Union (EU), passing through Central Asia, the Caucasus, Turkey, and Eastern Europe [22]. Kenderdine et al. in [23] analyze the institutional development and economic potential of the TITR from three perspectives: policy and subsidy influences, the physical and political landscape of Central Asia, the Caucasus, and Turkey, and the limited demand-side drivers from the EU. While China’s policies indicate potential growth in transcontinental containerized rail transport, demand-side analysis suggests that trade development is mainly confined to enhancing regional connectivity, with limited economic justification for increased China–Europe freight movement.
Transport connections between Europe and Central Asia: A comprehensive report, funded by the EU and led by the European Bank of Reconstruction and Development [24], evaluates sustainable transport connections between Europe and Central Asia, focusing on the five Central Asian countries and their integration into the EU’s trans-European transport network (TEN-T). The study assesses these connections using stringent sustainability criteria and proposes key actions for development, considering both enabling environments and physical infrastructure. It highlights the central trans-Caspian network as the most sustainable option for regional connectivity and economic development. The study also emphasizes the importance of detailed assessments and compliance with lending institutions’ standards for each project.
Unfortunately, existing approaches to the analysis of ICTs and, especially, to their study using macro-models have a significant gap in comparison with the requirements of their rational development in modern conditions.
Existing studies primarily focus on conventional transport modeling techniques, including statistical analysis, linear programming, and simulation models. These methods are adept at handling specific types of data and scenarios but may not effectively capture the dynamic and stochastic nature of transport systems.
Many models deal with static scenarios and fail to dynamically represent the interactions and interdependencies within transport corridors, especially under varying conditions and disruptions.
Current models often overlook the complex interactions between different components of a transport corridor, such as infrastructure, vehicles, regulatory bodies, and environmental factors.
Existing approaches might not adequately address the uncertainty and variability inherent in transport corridors, particularly in international contexts with diverse regulatory, political, and economic environments.
This paper proposes a new approach for the macro-modeling of transport corridors based on Petri nets, which addresses a significant gap in existing transport corridor modeling methodologies. It introduces a more dynamic, interactive, and adaptable framework, capable of handling the complexities and uncertainties inherent in modern transport corridors. This would not only contribute a novel perspective to the field but also potentially offer more robust and versatile tools for planners and policymakers in managing and optimizing transport corridors.

3. Materials and Methods

3.1. Macro-Modeling Approach to Transport Corridors

The macro-modeling approach to transport corridors, particularly in the context of international corridors with national segments, is of paramount importance for several key reasons, especially when dealing with newly developed corridors where historical data may be limited or entirely absent:
  • Macro-modeling is crucial in the strategic planning and development of new transport corridors. Without historical data, planners and decision-makers rely on macro-modeling to simulate various scenarios, evaluate potential challenges, and foresee the economic and logistical implications of new routes. This approach allows for the assessment of feasibility, cost, and expected benefits, guiding investments and policy decisions [17].
  • Macro-modeling can integrate various types of data, including geographical, economic, and political information. This integration is particularly valuable in international corridors, where conditions can vary significantly across national sections. This approach helps in understanding the implications of these diverse factors on the overall functionality and efficiency of the corridor [21].
  • For new transport corridors, predicting future demand and planning capacity accordingly are challenging. Macro-modeling enables planners to estimate future traffic volumes and cargo types, aiding in designing infrastructure and logistics operations that are scalable and adaptable to changing demands [10].
  • International transport corridors require cooperation and coordination between different nations. Macro-modeling provides a common framework for dialogue and negotiation, helping countries align their policies, standards, and operational procedures, which is essential for the seamless movement of goods across borders [14].
  • Macro-modeling supports economic analysis by providing insights into the potential economic benefits of new transport corridors, such as trade facilitation, regional development, and job creation. This is crucial for attracting investment and securing funding from both public and private sources [21].
  • Macro-modeling allows for the adaptability and futureproofing of transport corridors. As conditions change and new data become available, the model can be updated and refined, ensuring that the corridor remains relevant and effective in meeting its long-term objectives [11].
The application of macro-modeling is invaluable in the development and management of international transport corridors, especially when dealing with new routes lacking historical data. It provides a comprehensive, predictive, and adaptive framework essential for strategic planning, risk mitigation, and ensuring the long-term success and sustainability of these critical components of global trade infrastructure.
Macro-level models are the dominating type of freight transport analysis models for supporting public authorities in their decision-making [4]. The following criteria are important when creating macro-models of international transport corridors:
  • Cost-Effectiveness—this remains a primary consideration, encompassing both direct and indirect transportation costs.
  • Time Efficiency—the speed and timeliness of shipments are crucial, especially for time-sensitive goods.
  • Logistics Competence and Quality of Trade and Transport-Related Infrastructure—this factor combines the expertise and quality of logistics services with the infrastructure’s ability to support efficient transport. It emphasizes the proficiency of logistics providers and the adequacy of the physical infrastructure for transportation.
  • Ease of Arranging Shipments and Tracking—this factor highlights the simplicity and reliability of organizing transport and the ability to track the consignment in real time. It encompasses aspects of logistical ease, including the facilitation of shipment arrangements and the efficiency of tracking systems.
  • Customs and Cross-Border Regulatory Efficiency—this factor applies when the focus is on the smoothness of customs procedures and the efficiency of international shipment regulations. This includes how effectively customs and other regulatory agencies manage the entry and exit of goods, ensuring minimal delays while maintaining security and compliance.
  • Domestic Logistics Quality and Timeliness—this factor covers the efficiency and reliability of inland transportation and the ability to deliver goods within a country promptly and reliably.
The above-mentioned criteria align closely with the multifaceted approach necessary for the comprehensive macro-modeling of transport corridors, mirroring factors similar to those evaluated by well-established logistics indices. This alignment ensures a holistic view of the factors impacting the efficiency and effectiveness of international trade routes.

3.2. Justification for a Macro-Modeling Approach of International Transport Corridors

The development of international transport corridors is a complex endeavor, encompassing a vast array of variables that range from infrastructural quality to regulatory environments and logistical services. In creating a macro-model for these corridors, the challenge lies in selecting parameters that effectively encapsulate the myriad factors impacting the flow of goods while maintaining model simplicity and usability. This section introduces the rationale behind the streamlined approach to macro-modeling, which leverages transport speed and costs as primary modeling parameters, while utilizing the World Bank’s Logistics Performance Index (LPI) as a comprehensive indicator to account for the broader spectrum of logistical and procedural nuances [25].
This approach is underpinned by the premise that while each component of the transport chain is significant, certain key factors disproportionately influence the performance and sustainability of transport corridors. By focusing on these pivotal elements, the model aims to provide actionable insights into the performance of each national segment within the corridor, thus enabling stakeholders to make informed decisions geared toward optimization and strategic development.
The introduction of the LPI as a supplementary factor serves not only to streamline the complexity of the model but also to align it with globally recognized benchmarks of logistical efficiency. As we delve into the justification for this methodological choice, we aim to elucidate the balance struck between comprehensive detail and strategic abstraction, ensuring that the macro-model remains a robust yet flexible tool in the hands of policymakers, economists, and logistics professionals.
The proposition of using transport speed and associated costs as primary factors, supplemented by the LPI for capturing the remaining variables, can be justified as follows.
1. Transport Speed and Costs as Primary Factors:
  • The speed of transport directly influences the efficiency of the corridor. It reflects the operational capacity and potential bottlenecks in the movement of goods. By prioritizing speed, the model inherently accounts for infrastructural and operational constraints along the segment.
  • Costs associated with transit through a corridor encapsulate a wide range of expenses, including fuel, labor, tolls, maintenance, and more. These costs are reflective of the economic conditions and the fiscal policies of the transit country, which are critical for assessing the financial feasibility of transport routes.
  • Simplifying the model to focus on speed and costs allows for the creation of a predictive tool that can be more readily updated and manipulated. This approach provides a clear and straightforward framework for simulating changes in corridor operations and assessing their impact on the overall transport chain.
2. LPI as a Supplementary Factor:
  • The LPI, provided by the World Bank, is a comprehensive metric that evaluates six key dimensions: the efficiency of the clearance process, the quality of trade and transport infrastructure, the ease of arranging competitively priced shipments, the competence and quality of logistics services, the ability to track and trace consignments, and the frequency with which shipments reach consignees within the scheduled or expected delivery times.
  • By incorporating the LPI into the macro-model, the complexity of logistics, including customs procedures, regulatory compliance, and service quality, is distilled into a single, quantifiable index. This allows the model to reflect these intricate processes without the need for detailed data on each aspect.
  • The LPI provides a country-specific benchmark that reflects the logistical capabilities and efficiencies. This is particularly useful in a macro-model where the heterogeneity of national systems can be challenging to quantify discretely.
  • Utilizing an internationally recognized index like the LPI ensures that the macro-model aligns with global standards. It also allows for comparability across different corridors and segments, facilitating benchmarking and best-practice sharing.
3. Practicality in Modeling:
  • Speed and cost data are generally more readily available and quantifiable, making them practical primary inputs for modeling. The LPI, updated biennially, provides a regularly refreshed snapshot of logistical performance, ensuring that the model remains current.
  • Stakeholders can more easily interpret models based on speed and costs, which can promote a broader acceptance and utilization of the model’s findings. The LPI serves as an efficient way to communicate complex logistical nuances in an accessible format.
  • Comprehensive modeling that individually accounts for every aspect of logistics and customs procedures would be resource-intensive and potentially less responsive to dynamic changes. The proposed macro-modeling approach provides an optimal balance between detail and agility.
In the context of macro-modeling international transport corridors at early development stages with limited data, the choice of transport speed, transport costs, and the Logistics Performance Index as KPIs is strategic and pragmatic. These indicators are selected for their direct impact on the efficiency and effectiveness of transport corridors, as well as their ability to provide a comprehensive overview of corridor performance with minimal data requirements.
  • Transport Speed: This indicator is critical as it directly impacts the efficiency of the transport corridor, reflecting the operational capacity and potential bottlenecks. Speed affects the overall competitiveness and attractiveness of the transport corridor for shippers and logistics companies.
  • Transport Costs: Costs encapsulate a wide range of expenses critical for assessing the economic feasibility of transport routes. This includes fuel, labor, tolls, maintenance, and more, which are reflective of the economic conditions and fiscal policies of the transit countries. Transport costs are a major factor in the decision-making process for route selection.
  • Logistics Performance Index: The LPI, provided by the World Bank, serves as a comprehensive metric that evaluates key dimensions of logistics performance, including the efficiency of the clearance process, the quality of trade and transport infrastructure, the ease of arranging competitively priced shipments, and the frequency with which shipments reach their destination within the expected delivery time. The LPI allows for the integration of a broad spectrum of logistics-related variables into the macro-model, providing a nuanced view of logistical efficiency and capability across different countries involved in the transport corridor.
By focusing on these KPIs, the macro-modeling approach provides actionable insights into the performance and potential areas for improvement within international transport corridors. This streamlined focus ensures that the model remains both practical and informative, facilitating strategic planning and decision-making even in scenarios with limited initial data availability.
While the detailed modeling of every logistical aspect of each national segment would provide a richer data set, the proposed macro-modeling approach using transport speed, cost, and the LPI is a pragmatic synthesis. It captures the essential elements necessary for strategic analysis and decision-making, providing a viable, streamlined, and effective tool for assessing and optimizing international transport corridors.

3.3. Development of a Macro-Model Using E-Nets for Global Transport Corridors

Evaluation Petri Nets, commonly referred to as E-nets [26], offer a robust mathematical framework ideally suited for constructing macro-models of complex systems such as international transport corridors. These corridors are inherently parallel, asynchronous, and subject to variability and uncertainties, making E-nets a fitting choice for their macro-modeling. An E-net is structured around a set of components denoted by
N = ( P , T , A , M )
where P represents the places within the network, T symbolizes the transitions, A is the set of arcs connecting the places and transitions, and M signifies the initial state or marking of the network.
The definition of E-nets is very similar to the standard definition of a Petri net [27]. However, it is pertinent to delineate the nuanced differences that set E-nets apart and justify their specific application in our model.
E-nets, an extension of the classic Petri net, offer additional features that are particularly suited to the modeling of asynchronous and parallel processes, a characteristic often encountered in transport corridor analysis. The key distinction lies in the intricacies of the marking system and the interaction between places and transitions.
In the realm of E-nets, a marking is not just a state representation but a dynamic element that evolves as the net operates. Each marking in an E-net signifies the presence or absence of certain conditions or resources at a specific node (place) within the network. This dynamic interpretation of markings allows E-nets to simulate real-world processes more accurately, such as the movement of goods or vehicles through a transport corridor, including delays, bottlenecks, and parallel processing.
While a Petri net provides a foundational structure for modeling discrete event systems, E-nets incorporate additional elements such as guards and time stamps on transitions. These elements enable the modeling of time-dependent behaviors and conditional flows, aspects that are crucial in transport corridor analysis but are not inherently represented in standard Petri nets.
To develop an E-net macro-model for a transport corridor, one must undertake the following strategic steps:
  • Initiate the process by pinpointing the fundamental elements of the corridor. This includes determining key nodes such as ports and logistics hubs, as well as the main transport routes spanning rail, road, or maritime paths.
  • Model each node and its connecting routes as individual sub-nets. Nodes consist of places and transitions that encapsulate operational activities (loading, storage, etc.), while the connecting routes are modeled as a progression of places and transitions to represent the flow and handling of goods.
  • Assign time delays and cost metrics to the transitions. These are crucial for capturing the dynamic nature of operations and for assessing the corridor’s economic and temporal efficiency.
  • Interlink the sub-nets with arcs to reflect the physical and operational network of the corridor, ensuring an accurate representation of the flow of goods and information.
  • Set the initial conditions, such as cargo presence at nodes, and simulate the movement of tokens through the network to observe and analyze the system’s behavior and logistics performance.
The process of E-net architecture building can be illustrated by the flowchart in Figure 1. The flowchart illustrates a logical progression, with a feedback loop indicating the iterative nature of the E-net model building.
The macro-modeling methodology can be broken down into the following steps.
Step 1—Identify key performance indicators.
The first step is to identify the key performance indicators that will form the foundation of the macro-model. As discussed earlier, the KPIs selected are the following:
  • Transport speed.
  • Transport costs.
  • Logistics Performance Index.
These KPIs represent the main factors that impact corridor efficiency and performance.
Step 2—Gather data on KPIs for each corridor segment.
With the KPIs defined, the next step is to collect relevant data for each corridor segment. This involves the following:
  • Determining average transport speeds based on distance and typical transit times.
  • Compiling applicable transport costs including fuel, tolls, labor, and fees.
  • Recording LPI scores for each country from the World Bank LPI rankings.
Step 3—Develop transition delay functions.
Using the transport speed and cost data, functions need to be developed to model the delay times for the transitions in the E-net model.
For transport speed, this may involve a linear function relating distance and speed to total transit time. For costs, it may require analyzing the relationship between specific cost components and resulting delays. Historical data can be used to statistically derive these functions.
Step 4—Incorporate LPI data.
The country-specific LPI scores need to be integrated into the model. An inverse linear function relating higher LPI to lower delays can be used for simplicity. The parameters can be estimated using regression analysis on historical LPI and delay data.
Step 5—Build an E-net model in accordance with the flowchart presented in Figure 1.
Step 6—Calibrate the macro-model.
The initial delay functions serve as estimates and need to be calibrated and validated using real data from corridor operations. The functions can be refined iteratively until the model outputs align closely with actual performance data.
Step 7—Simulate and optimize.
The calibrated model can now be used to run simulations for optimizing the transport corridor. Different scenarios adjusting speeds, costs, infrastructure, and policies can be tested to improve efficiency.
This methodology involves a systematic data-driven approach to construct a macro-model that distills the complex dynamics of a corridor into a versatile simulation tool focused on key performance levers.
This macro-modeling approach, underpinned by E-nets, provides a comprehensive representation of the transport corridor, facilitating a macroscopic analysis of its efficiency and potential areas for enhancement. It serves as a strategic tool for decision-makers aiming to optimize logistics and achieve sustainability in transport networks.

3.4. Elementary E-Net Model for the Modeling of Transport Corridors

The elementary E-net model serves as a macro-model to simplify the intricacies of international transport corridors (Figure 2). It distills the corridor into three essential components: the starting node ( P 1 ), the intermediate processing ( t 1 ), and the concluding node ( P 2 ). P 1 marks the inception of cargo transit from one country, t 1 captures the comprehensive transit process within a country, and P 2 denotes the juncture where goods exit to enter the next leg of their journey. This high-level abstraction is conducive to macro-analysis, focusing on overarching logistics performance rather than micro-level details. Through this macro-modeling lens, stakeholders gain a strategic viewpoint, allowing for targeted improvements and strategic planning in international transport operations.

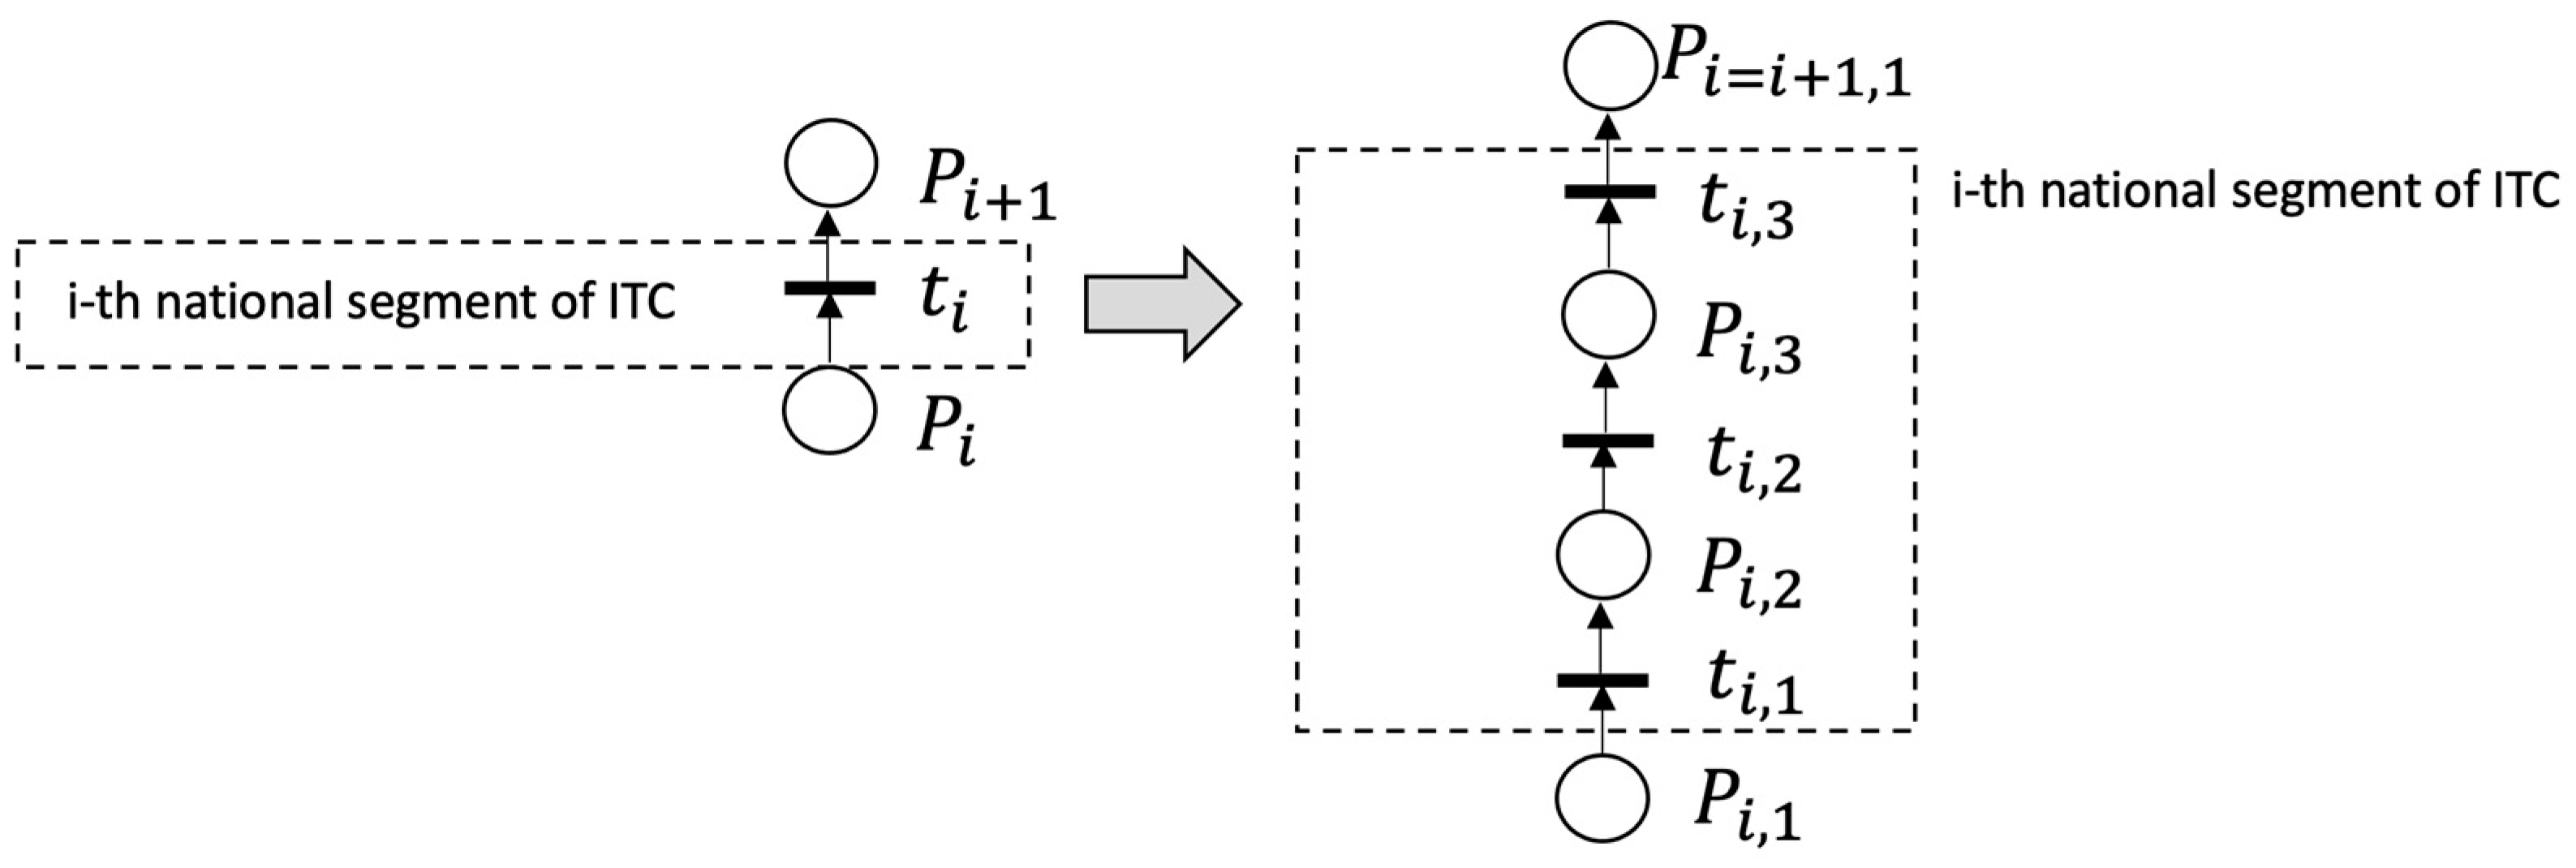
3.5. Transformation of the Elementary E-Net Model into the ITC Macro-Model

In this section, we elaborate on the refinement of an elementary E-net model into a macro-model of ITC that encapsulates the complexities of international transport corridors. This model is specifically enhanced by incorporating positions that reflect critical variables such as transportation time, cost, and LPI.
The foundational structure of the elementary E-net model, characterized by its primary positions and transitions, is expanded into a macro-model for national segments of transport corridors (Figure 3). This advanced model introduces designated positions that correspond to key operational metrics, thereby transitioning to a system that offers a macroscopic analysis of the transport corridor’s performance.
To mathematically describe the transformation of each i -th national segment of an international transport corridor from an elementary E-net into a macro-model with time, cost, and LPI factors, we will start with the basic structure of the elementary E-net and then augment it with additional nodes and transitions to incorporate the additional factors.
Macro-model expansion methodology:
  • Time-dependent position P i , 1 signifies the origination point in the transport corridor, incorporating initial transportation time delays as goods begin their journey.
  • Transportation time transition T i , 1 models the actual transportation time, factoring in the various elements that contribute to transit delays.
  • Cost evaluation position P i , 2 is introduced to account for cost-related variables that influence the movement of goods, reflecting the economic considerations at this stage of the supply chain.
  • Cost-associated transition T i , 2 captures the transition delays attributable to cost factors, such as fuel prices and toll fees, that directly affect the progression of goods.
  • Logistics Performance Index position P i , 3 models the impact of the country-specific LPI score, serving as a proxy for logistical efficiency that affects the flow of goods.
  • LPI-dependent transition T i . 3 translates the LPI’s implications into time delays, integrating the country’s logistical performance into the model.
  • End positions P i , 4 denote the culmination points within the transport corridor, where goods exit the modeled national segment and where the cumulative effects of time, cost, and LPI are fully realized.
Figure 4 demonstrates how the proposed model can be modified to real-world scenarios where transport planners and policymakers are faced with choices between multiple corridor options at a national segment of an ITC.
In instances where multiple alternative transport corridors are present within a national segment of an international transport corridor, the elementary E-net employed for the modeling of transport corridors (Figure 2) undergoes a transformation into a composite network (Figure 4). This network is composed of parallel transport corridors with identical sub-networks c = 1 , k . Each individual corridor in this model is augmented by the inclusion of initial positions P i , s , c , which denote the commencement of the transportation simulation for corridor c , and terminal positions P i , f , c , which represent the conclusion of the transportation simulation within the same corridor.
For the integration of these identical models of alternative corridors into a unified network structure, initiating transition t s and concluding transition t f are incorporated. These transitions are characterized by an absence of delay, thus functioning as the synchronizing elements that cohesively bind the discrete models of the alternative corridors into a single, consolidated E-net. This architectural arrangement enables a systematic comparison and analysis of the efficiency and performance across the spectrum of alternative transport corridors. With this macro-model E-net, each segment of the transport corridor is mathematically modeled, allowing for the simulation and analysis of the corridor’s performance with respect to time efficiency, cost-effectiveness, and logistics optimization.
The delay in transition t i , 1 , j within an E-net model, which represents the transportation process within a national segment of an international transport corridor, can be influenced by various factors, including distance, traffic conditions, transportation mode, and administrative processing times. The function describing this delay should encapsulate these factors, reflecting the real-world complexities of the transport process.
Here are several types of functions that could describe the delay for t i , 1 , j , along with examples for concrete case studies:
  • Linear Function
    • Function: T 1 t i m e = a + b · t i m e
    • Use Case: If the transportation time delay increases at a constant rate with the time variable, which could be the case with predictable traffic and road conditions.
  • Step Function
    • Function: T 1 t i m e = a ,   i f   t i m e t 1 b ,   i f   t i m e > t 1
    • Use Case: For scenarios with distinct phases of transportation, like urban and rural areas, where each has a different average speed or delay profile.
  • Piecewise Linear Function
    • Function: T 1 t i m e = a 1 + b 1 · t i m e ,   i f   t i m e t 1 a 2 + b 2 · t i m e ,   i f   t i m e > t 1
    • Use Case: When different segments of the route have different speeds due to varying conditions, resulting in different linear relationships between time and delay in each segment.
  • Polynomial Function
    • Function: T 1 t i m e = α + β · t i m e + γ · t i m e + + ω · t i m e k
    • Use Case: In cases where the relationship between time and delay is non-linear, possibly due to factors such as congestion that worsens non-linearly with increased transportation time.
  • Exponential Function
    • Function: T 1 t i m e = a · e b · t i m e
    • Use Case: If the delay increases rapidly with transportation time, which might be the case in areas with sudden bottlenecks or when approaching capacity limits.
  • Logarithmic Function
    • Function: T 1 t i m e = a · b · l o g ( t i m e )
    • Use Case: For situations where delay increases quickly at first (for short transportation times) but then levels off, reflecting a saturation point in delay increase.
  • Sigmoid Function
    • Function: T 1 t i m e = a 1 + e [ b · t i m e c ]
    • Use Case: If there is an initial rapid increase in delay with time, which then plateaus as the system reaches a maximum delay capacity.
  • Power Law Function
    • Function: T 1 t i m e = a · t i m e b
    • Use Case: When delay increases at a rate that is a power of the transportation time, possibly due to compounded effects like increased chances of incidents over longer periods.
When choosing the function to model t i , 1 , j , one should consider the most realistic reflection of how transportation time influences delay within the specific context of the corridor being modeled. It is also important to consider the availability of data to fit these functions; in many cases, a simpler model may be preferred due to its ease of understanding and calculation, provided it still offers a reasonable approximation of the real-world situation.
The delay in transition t i , 2 , j , which represents the impact of transportation cost on the national segment of a transport corridor, can be shaped by various factors including fuel prices, tolls, labor costs, vehicle depreciation, and maintenance. The function describing t i , 2 , j delay should reflect cost-related variables that could cause logistical delays, potentially due to budget constraints, payment processing, or cost optimization efforts.
Here are several types of functions that could describe the delay for t i , 2 , j , with examples for different case studies:
  • Linear Cost Function:
    • Function: T 2 c = a + b c
    • Explanation: Delay increases linearly with the cost, assuming that higher costs directly correlate with increased processing or waiting time.
    • Case Study Example: In a scenario where increased fuel costs lead to more frequent stops to optimize fuel consumption and routes, resulting in delays.
  • Inverse Function:
    • Function: T 2 c = a + b c
    • Explanation: Delay decreases as cost increases, representing situations where higher expenditures on premium services reduce transit times.
    • Case Study Example: When investing in more expensive, direct routes or express services that shorten delay times despite higher costs.
  • Quadratic Function:
    • Function: T 2 c = a + b c + k c 2
    • Explanation: Delay increases at an accelerating rate with cost, suitable for situations where higher costs due to inefficiencies lead to exponential increases in delay.
    • Case Study Example: For transport scenarios where vehicle maintenance is poor, leading to breakdowns that cause significant delays and repair costs.
  • Piecewise Function:
    • Function: T 2 c = a + b c ,                             i f   c c 1 a + b c + m ,           i f   c > c 1  
    • Explanation: Different cost thresholds have different delay implications, such as a flat rate up to a certain cost level, after which additional fees or services incur additional delays.
    • Case Study Example: For a corridor that includes a flat-rate toll road up to a certain weight limit, beyond which oversized or overweight fees significantly delay transport.
  • Step Function:
    • Function: T 2 c = a ,         i f   c c 1 b ,       i f   c > c 1
    • Explanation: Delay is constant within certain cost intervals, changing abruptly when a new cost bracket is reached due to different service levels or regulatory fees.
    • Case Study Example: For scenarios where transport vehicles face standard processing times until a certain cost threshold, beyond which premium processing applies, altering delay patterns.
  • Exponential Function:
    • Function: T 2 c = a e b c
    • Explanation: Delay increases exponentially with cost, depicting scenarios where costs balloon due to penalties, leading to rapidly increasing delays.
    • Case Study Example: When unexpected fines or surcharges due to regulatory non-compliance cause delays as logistics operators scramble to cover the additional expenses.
Just as with t i , 1 , j , the function for t i , 2 , j should be empirically grounded, relying on data related to transportation costs and their impact on delays. These data can be gathered from logistics records, transportation billing, and operational timelines and statistical information, for example [28,29]. The chosen function will depend on the specific characteristics of the transportation system and the nature of the costs involved, and should be validated against actual transportation operations to ensure it accurately models the relationship between cost and delay within the corridor.
In the development of the E-net model, transitions t i , 1 , j and t i , 2 , j represent critical stages in the transportation process, each influenced by a complex set of variables. Recognizing the need for a systematic approach to parameterize these transitions, we can establish a consistent set of consideration factors. These factors will include, but not be limited to, fuel prices, labor costs, vehicle depreciation, maintenance expenses, and tolls or tariffs applicable to the transport corridors in question.
Furthermore, each type of transition within the network model may be associated with a specific subset of these consideration factors, relevant to the operational characteristics it represents. For instance, transition t i , 1 , j , which may denote the commencement of a journey, will factor in initial fuel prices, labor costs at the point of origin, and any preliminary administrative fees. Conversely, transition t i , 2 , j , may incorporate variables such as cross-border tariffs, labor cost differentials, and additional fuel expenses incurred due to idling or rerouting.
These consideration factors can be quantified based on a combination of real-time market data, historical trends, and predictive analytics to ensure that the model remains responsive to the dynamic economic conditions affecting transport corridors.
The inclusion of these standardized consideration factors not only enhances the robustness and reliability of the model but also allows for a more nuanced analysis of the transport corridors’ operational efficiency.
The Logistics Performance Index by the World Bank provides a comprehensive score that reflects a country’s logistics efficiency based on factors like customs performance, infrastructure quality, international shipments, logistics quality and competence, tracking and tracing, and timeliness. If we are to describe the transition delay t i , 3 , j as a function of the LPI, we can assume that higher LPI scores (which indicate better performance) would be associated with lower delays in the logistics process, and vice versa.
A practical approach would be to use an inverse linear function or an exponential decay function. These types of functions are often chosen for their simplicity and the intuitive relationship they represent between improved logistics performance (higher LPI) and reduced delays.
Here is a more detailed look at these two function types:
  • Inverse Function:
    • Function: T 3 L P I = a + b L P I
    • Explanation: This function suggests that delay is inversely proportional to the LPI; as the LPI score increases, the delay decreases. Here, b is a scaling factor that determines the sensitivity of delay to the LPI, and a is the base delay that accounts for other fixed delays not reflected by the LPI.
    • Rationale: This function is easy to understand and implement. The inverse relationship means that as the LPI score increases, the delay decreases, but not at a fixed rate—the delay reduction becomes less pronounced as the LPI score gets higher, which corresponds to the real-world scenario where initial improvements in logistics may lead to significant gains, but further improvements may offer diminishing returns.
  • Exponential Decay Function:
    • Function: T 3 L P I = a · e b · L P I
    • Explanation: Delay decreases exponentially with higher LPI scores, indicating that improvements in logistics performance rapidly reduce delays. This function would capture the substantial impact of logistics improvements in higher performing countries.
    • Rationale: Exponential decay captures the concept that improvements in logistics performance rapidly decrease delays initially, but the rate of improvement tapers off as the LPI score increases. This reflects the reality that it is often easier to make large gains from a low baseline than to squeeze out incremental improvements from a system that is already highly efficient.
Each of these functions has parameters that would need to be empirically estimated to fit the historical data on LPI scores and corresponding logistics delays for the countries in question. The choice of function should be informed by the nature of the logistics performance data, the distribution of LPI scores, and the observed impact of logistics performance on delays. Statistical analysis and regression techniques can be used to fit these functions to data and validate their predictive power.
To use the LPI effectively in a singular function for t i , 3 , j across all national segments, the following steps should be considered:
  • Collect and analyze historical data to understand the relationship between LPI scores and logistics delays in different countries.
  • Use regression analysis to estimate the parameters of the chosen function. The goal is to find the values of a and b that best fit the observed data.
  • Validate the function by comparing its predictions against known logistics performance outcomes. Adjust the function parameters as necessary to improve its predictive accuracy.
  • Normalize the LPI scores if necessary to ensure consistency and comparability across different years or versions of the LPI.
  • Apply the validated function uniformly across all national segments to estimate delays. Remember that while the function provides a general estimate, the actual delays can still be influenced by local conditions and may require further adjustment.
  • Regularly review and update the function as new LPI data become available or as changes in global logistics practices occur.
Choosing between the inverse linear function and the exponential decay function may ultimately depend on the distribution of LPI scores and the observed impact of logistics performance on delays. The chosen function should provide a good fit for the data with reasonable predictive power while being simple enough for stakeholders to understand and use in practice.
By transforming the elementary E-net of national segments i = 1 , n ¯ for an ITC with n such segments into a macro-model that considers time, cost, and LPI, we gain a powerful analytical tool. This macro-model assists policymakers and logistics companies in optimizing international transport corridors for improved performance, cost-effectiveness, and alignment with global standards of sustainable logistics.
The Petri net model is designed with a focus on controllability, which is achieved through strategically placed control points, guard conditions, and adaptive feedback mechanisms. These features ensure that the model not only accurately represents the dynamics of transport corridors but also provides the means to manage and optimize these systems effectively. In cases where control is lacking, it serves as an opportunity for model enhancement, thus contributing to the ongoing development of a robust and effective transport corridor modeling tool.
The proposed E-net has different mechanisms of controllability:
  • The model designates specific transitions and places as control points. These points are strategically chosen based on their influence over key operational aspects of the transport corridor, such as traffic flow, resource allocation, and schedule adherence.
  • The E-net structure of the model employs guard conditions on transitions. These conditions act as control mechanisms, allowing the system to proceed only when certain criteria are met, thereby ensuring that the system evolves in a controlled and predictable manner.
  • The model can be equipped with feedback loops that monitor system performance and adjust operational parameters in real-time. This adaptive control mechanism ensures that the system remains responsive to changes and maintains desired performance levels.
There are some mechanisms for controlling the model:
  • Using the applied software tools, simulations are run to observe the system’s behavior under various scenarios. Adjustments are then made to the control points to steer the system towards optimal performance states.
  • The model can leverage predictive analytics to foresee potential disruptions or inefficiencies. By preempting these issues, we can adjust control parameters proactively, maintaining system control.
  • Control is also exerted through scenario-based planning, where different operational scenarios are modeled, and the system’s response is evaluated. This approach allows for pre-emptive control strategies to be developed and implemented.
In scenarios where the model exhibits uncontrollable behavior, it typically indicates either a lack of adequate control points or insufficient guard conditions. Such instances are crucial for model refinement. They prompt a reassessment of the model’s structure, leading to the introduction of additional control mechanisms or the reconfiguration of existing ones to enhance controllability.

4. Results

Let us look at a real case study.
In the contemporary geopolitical climate, the three key transport corridors facilitating trade between Europe and Asia have gained renewed significance (Figure 5) [24]. These corridors are not only commercial routes, but also strategic geopolitical assets affected by shifting alliances, regional stability, and global economic policies.
The Northern Corridor, running from China through Kazakhstan, Russia, and Belarus to Poland, serves as a primary route for Eurasian land trade. In the new geopolitical situation, characterized by heightened tensions and sanctions involving some of the countries along the route, there is both risk and opportunity. On one hand, the corridor faces potential disruptions due to political standoffs; on the other, it could benefit from the redirection of trade flows seeking to bypass troubled waters. The durability of this corridor will depend on diplomatic negotiations and the ability of countries to uphold trade agreements despite political pressures.
The Trans-Caspian International Transport Route (Middle Corridor), connecting Asia and Europe via Kazakhstan, the Caspian Sea, Azerbaijan, Georgia, and onward to Turkey or across the Black Sea to Bulgaria or Romania, has emerged as a promising alternative that mitigates reliance on the Northern Corridor. Its development has been accelerated by the new geopolitical situation, which demands the diversification of trade routes to ensure resilience. With varying transit times and the involvement of multiple modes of transportation, this corridor’s success hinges on enhanced infrastructural investments and improved logistic services to ensure it remains a reliable and competitive route.
The Southern Corridor, stretching through Central Asia, traversing countries such as the Kyrgyz Republic or Tajikistan, Uzbekistan, Turkmenistan, Iran, and Turkey, before entering Europe, stands as the most direct land route that bypasses Russia. Its relevance has been amplified by the new geopolitical situation, presenting a viable alternative for trade between Europe and Asia. However, it requires significant development to meet the increased demand and to overcome challenges related to infrastructure, regulatory coherence, and political stability.
Let us take a closer look at the Middle Corridor up to the Black Sea as a case study.
The Middle Corridor, also known as the Trans-Caspian International Transport Route, serves as a crucial link between Asia and Europe, passing through several countries with varying logistics profiles.
This transport corridor includes five elements: four national segments (China, Kazakhstan, Azerbaijan, and Georgia) and one Caspian Sea crossing segment. This ITC can be presented using E-nets with an elementary E-net model, as shown in Figure 6.
Below is a detailed description of the positions and transitions within the E-net macro-model for the Middle Corridor, reflecting the individual characteristics of each national segment after the transformation of each elementary E-net of national segments into the macro-model (Figure 7).
China Segment:
P11—Marks the entry position into the Middle Corridor, beginning in China, which is the starting point of the goods’ journey to Europe.
T11—Represents the transportation time transition within China, capturing the duration it takes for goods to traverse the Chinese segment, influenced by the vast and varied landscape as well as the efficiency of the Chinese rail network.
P12—Intermediate position for assessing the transportation costs within China, which includes logistics expenses such as loading, inland transportation, and administrative fees.
T12—Transition for cost-induced delays specific to China, where financial considerations could affect the speed of logistics operations.
P13—LPI assessment position within China, evaluating the performance of the logistics services, infrastructure quality, and customs efficiency.
T13—LPI-influenced delay transition for China, correlating China’s LPI score with the expected efficiency and speed of goods movement.
P21—Exit position from China, signaling the end of the Chinese segment and the transition into Kazakhstan for the next leg of the Middle Corridor journey.
Kazakhstan Segment:
P21—Also serves as the entry point into Kazakhstan from China, where the journey along the Middle Corridor continues.
T21—Transportation time transition within Kazakhstan, considering factors like route directness, rail and road quality, and border crossing times.
P22—Cost assessment position for the Kazakhstan segment, reflecting the expenses incurred across this vast country, from fuel to potential tariffs and transport fees.
T22—Transition for cost-related delays within Kazakhstan, possibly due to the long distances and the need for multimodal transport switches.
P23—LPI assessment position for Kazakhstan, incorporating the logistics performance which could impact corridor throughput.
T23—LPI-influenced delay transition within Kazakhstan, where the LPI score is used to anticipate and model potential delays.
P31—Exit position from Kazakhstan, marking the move towards the Caspian Sea crossing or onward land travel.
Caspian Sea Crossing Segment:
P31—Entry into the maritime segment of the Middle Corridor, which entails the crossing of the Caspian Sea.
T31—Models the time taken for goods to be transported across the sea, which can vary greatly depending on the shipping schedule, ferry availability, and weather conditions.
P32—Assesses the additional costs associated with sea transportation, including shipping fees, port handling charges, and any delays due to logistical bottlenecks.
T32—Transition for maritime cost-induced delays, which may result from the complex logistics of sea transport and port efficiency.
P33—Reflects the maritime LPI assessment, evaluating the efficiency of port logistics and customs processes.
T33—LPI-influenced delay transition for the maritime crossing, where logistical performance at seaports influences the overall transit time.
P41—Marks the completion of the maritime crossing and the entry into Azerbaijan.
Azerbaijan Segment:
P41—Denotes the start of the overland journey through Azerbaijan, which serves as a critical link in the Middle Corridor.
T41—Transportation time transition within Azerbaijan, considering the efficiency of transit through this key junction point.
P42—Intermediate position for Azerbaijan’s transport cost evaluation, including any fees or charges associated with crossing this segment.
T42—Transition for cost-induced delays within Azerbaijan, capturing the fiscal factors that could slow down logistics operations.
P43—LPI assessment position for Azerbaijan, measuring the effectiveness of the logistics and customs infrastructure.
T43—LPI-influenced delay transition within Azerbaijan, where the LPI score helps predict the smoothness of the transition through the country.
P51—Exit position from Azerbaijan, which may lead to Georgia or directly to a maritime route towards Europe.
Georgia Segment:
P51—Signifies the entry into Georgia, continuing the Middle Corridor’s journey towards Europe.
T51—Represents the transportation time within Georgia, which might be influenced by the condition of transport infrastructure and border crossings.
P52—Cost assessment position for the Georgian segment, considering the country’s specific transport costs and policies.
T52—Transition for cost-related delays within Georgia, influenced by economic and administrative aspects of transportation.
P53—LPI assessment position for Georgia, reflecting the country’s logistics performance and impact on the corridor’s efficiency.
T53—LPI-influenced delay transition within Georgia, utilizing the LPI score to anticipate logistics performance.
P60—Exit position from Georgia, which typically leads to the final leg of the journey.
By selecting functional dependencies for the delays of all transitions (for example, by expert means) and determining cost and time indicators for each national segment based on business and statistical information (for example, using [28,29]), as well as the LPI value of each national segment from [25], one can obtain a set of numerical values for modeling.
Applied software tools [30] make it possible to carry out experiments for Petri nets of various configurations. These experiments are instrumental in understanding the practical implications and operational dynamics of the proposed Petri net models, specifically in the context of transport corridor analysis.
The experiments conducted using these software tools have different purposes and can be categorized into several types, each addressing different aspects of transport corridor management and optimization:
  • Simulation of transport corridor dynamics: Utilizing the software to simulate the flow of goods and vehicles within various configurations of transport corridors. These simulations provide insights into traffic patterns, potential delays, and the overall efficiency of different corridor layouts.
  • Stress testing under variable conditions: Testing the resilience and adaptability of the Petri net models under varying conditions such as peak traffic periods, unexpected delays, and resource limitations. This helps in assessing the robustness of the transport networks.
  • Resource allocation optimization: Analyzing the optimal allocation of resources such as vehicles, fuel, and manpower within the corridor. The software tools enable experimentation with different allocation strategies to identify the most cost-effective and efficient approaches.
  • Bottleneck identification and resolution strategies: Identifying potential bottlenecks in the transport corridors through simulations. Subsequent experiments focus on testing various strategies for resolving these bottlenecks, such as rerouting, capacity enhancement, or schedule adjustments.
  • Impact analysis of policy changes: Simulating the impact of potential policy changes or infrastructure developments on the transport corridor. This includes changes in toll rates, the implementation of new traffic regulations, or the introduction of new transport links.
  • Comparative analysis of different corridor configurations: Conducting comparative analyses between different Petri net configurations representing various corridor structures. This comparison helps in determining the most effective corridor design from the perspectives of time, cost, and overall efficiency.
The results derived from these experiments offer valuable recommendations for transport corridor planners and policymakers, aiding in the development of more efficient and reliable transport networks.

5. Discussion

Currently, Petri net applications are actively used in manufacturing systems [31], for business process modeling and simulation [32], for maintenance process evaluation [33], for the risk assessment of subway fire accidents [34], for the verification of current-state opacity for discrete event systems [35], in cybersecurity [36], and elsewhere.
In this section, we will discuss the advantages of the proposed approach to modeling transport corridors using E-nets compared to other types of Petri nets.

5.1. Comparative Analysis of E-Nets with Other Petri Nets

This subsection provides a comparative analysis to elucidate how Evaluation Petri Nets (E-nets) offer enhanced capabilities over other Petri net variants, particularly in scenarios relevant to transport corridors. The comparison focuses on aspects such as temporal modeling, conditional flows, and complex system interactions, which are critical in transport networks.
1. Temporal dynamics
E-nets: E-nets enable the incorporation of time stamps and delays within transitions, allowing for a detailed representation of time-dependent processes. This feature is particularly useful in modeling transport corridors where timing is a crucial factor, such as in scheduling and delay analysis.
Ordinary Petri Nets: While capable of process representation, ordinary Petri nets lack built-in mechanisms for time-based modeling, requiring additional constructs or extensions to represent temporal aspects.
Case Study: A comparative analysis of a congested transport corridor using both E-nets and ordinary Petri nets demonstrates the superior capability of E-nets in accurately capturing delay patterns and their impact on corridor efficiency.
2. Conditional flows and decisions
E-nets: E-nets allow the modeling of conditional flows and decision-making processes within the network through guard conditions and branching transitions. This adaptability is essential for simulating dynamic routing decisions in transport corridors.
Workflow Petri Nets: While Workflow Petri Nets are designed to handle conditional flows, they are more oriented towards business process management and may not adequately capture the complexity of transport network decisions.
Theoretical Example: A theoretical model of a transport corridor with multiple routing options, subjected to varying conditions, illustrates how E-nets effectively model these decision points compared to Workflow Petri Nets.
3. Complex system interactions
E-nets: The structure of E-nets facilitates the representation of complex interactions within systems, such as asynchronous processes and parallel operations found in transport networks.
Other Petri Net Variants: Other Petri net types, while useful for specific applications, may oversimplify or inadequately represent the multi-faceted interactions typical in transport corridors.
Case Study: An analysis of a multi-modal transport corridor, incorporating road, rail, and sea transport, showcases the E-net’s ability to model complex intermodal interactions more effectively than other Petri net types.
This comparative analysis underscores the superiority of E-nets in specific scenarios pertinent to transport corridors. The temporal and conditional complexities, along with the intricate system interactions inherent in transport networks, are more accurately and comprehensively captured by E-nets. These capabilities make E-nets a more suitable tool for transport corridor analysis and optimization, addressing nuances that are either simplified or overlooked in other Petri net variants.

5.2. Scalability in E-Nets vs. Other Petri Nets

In the comparative analysis of Petri net models, especially focusing on scalability, it is essential to evaluate how different types of Petri nets handle the expansion of model size and complexity, particularly in relation to transport corridor simulations. An overview of the scalability aspect for different Petri net models is given in Table 1.
The scalability of a Petri net model in the context of transport corridors depends largely on the specific requirements of the system being modeled. E-nets, with their advanced capabilities, offer significant scalability advantages, particularly for complex and large-scale transport networks. They balance detailed modeling with manageability, a crucial factor in scalability.

5.3. Advantages of Using E-Nets for ITC Modeling

In exploring the innovative use of Evaluation Petri Nets (E-nets) for the macro-modeling of transport corridors, it is imperative to recognize the specific strengths that this approach brings to the table. The E-net framework, known for its robustness in handling complex systems, offers distinct advantages that are particularly suited to the intricate and dynamic nature of transport corridors. From the enhanced detail and dynamism of its modeling capabilities to its inherent flexibility and precise quantification of system delays, the E-net approach stands out as a powerful tool in the realm of transport corridor analysis.
Petri nets, especially E-nets, are well suited for modeling dynamic systems with stochastic behaviors. This approach can represent the complex interactions and state changes within a transport corridor more effectively than traditional models.
E-nets facilitate both quantitative and qualitative analyses of transport corridors. They can be used to evaluate performance metrics and to understand the qualitative behavior of the system under different scenarios.
This approach allows for scalable models that can be adjusted or expanded to include new components or scenarios, making it highly adaptable for evolving transport corridors. The last feature deserves special attention. Scalability in this context refers to the ability of the model to adapt and expand in detail and scope, transitioning from a broad, generalized view to a finer, more specific analysis. This process involves incorporating granular data at the level of individual segments between transport hubs like cities, logistics centers, ports, and railway stations.
The scalability of the proposed model from a macro- to a micro-level involves a systematic methodology of segmenting the corridor, integrating detailed data, defining specific parameters, and refining the overall model. The mathematical approach combines segment-specific variables and functions with an overarching model structure that considers the interconnectivity and cumulative impact of all segments. This scalable and detailed approach allows for a more nuanced understanding and optimization of transport corridors, tailored to the specific operational realities of each segment.
The general methodology of scalability can be broken down into the following steps:
  • Divide the transport corridor into segments, creating specific positions in the E-net for each operational state within these segments. Each segment corresponds to a part of the journey between transport hubs, with each hub potentially represented by multiple positions for different stages of processing or waiting.
  • Establish transitions to represent the activities or events between these positions. In the context of transport corridors, this might include border crossings, the loading and unloading of cargo, or changes in transport modes.
  • Unlike traditional Petri nets, E-nets allow us to assign a delay time to each transition, representing the time taken for an event to occur. This delay can be a crucial factor in modeling transport corridors, as it directly impacts transit time and efficiency.
  • Refine the E-net model by adjusting the positions and transitions, particularly focusing on the delay times. Evaluate the performance of the transport corridor by analyzing the flow of tokens (representing cargo or vehicles) and the cumulative delay times. Adjust the model iteratively to optimize corridor performance.
These actions are accompanied by the following transformations of the E-net:
  • E-net structure definition: Define the E-net for the transport corridor as N = ( P , T , D ) , where P is the set of positions, T is the set of transitions, and D is the set of delay times associated with each transition.
  • Transition functions with delay: For each transition t in T , assign a delay function d t , which represents the time delay associated with that transition. This delay reflects processing times, transit times, or waiting times.
  • Flow rules and performance metrics: Implement flow rules for tokens, which move through the network according to the transitions. Measure the performance of the transport corridor using metrics such as total transit time, bottlenecks, and throughput efficiency.
  • System optimization: Use the E-net to simulate the operation of the transport corridor, focusing on identifying and minimizing delays. Adjust the structure of the E-net and the delay times to achieve optimal performance, reflecting real-world operational improvements.
By integrating E-net components into the scalability and detailing of a transport corridor model, we can create a dynamic and responsive representation of the corridor. This approach allows for a detailed and nuanced understanding of each segment and its interactions within the broader system. The use of E-nets not only enhances the model’s ability to simulate complex processes and events but also provides a robust framework for iterative improvement and optimization.
While the use of E-nets in the macro-modeling of transport corridors offers a range of significant advantages, it is equally important to acknowledge and understand the potential limitations and challenges inherent in this approach:
  • One potential limitation is the complexity involved in setting up and calibrating an E-net model, especially for corridors with extensive and diverse segments. Ensuring accurate transition timings and positioning requires in-depth knowledge and significant data collection efforts.
  • The effectiveness of the E-net model is highly dependent on the quality and availability of data. In scenarios where data are limited, outdated, or inaccurate, the model’s reliability may be compromised. This is particularly challenging in international corridors with varying data collection standards and transparency.
  • While E-nets excel in handling quantifiable aspects such as time and volume, adapting the model to incorporate qualitative factors like political stability, regulatory changes, or environmental impacts might require additional layers of analysis or supplementary modeling techniques.
Having explored the strengths and confronted the potential limitations of using E-nets for macro-modeling transport corridors, it becomes essential to look forward—to identify and articulate the areas where further research can enhance, refine, and possibly revolutionize this approach.
Future research could explore the integration of E-nets with other modeling approaches, such as Geographic Information Systems or simulation software, to enhance their capability in handling spatial data and simulating real-world scenarios more comprehensively.
Developing methodologies for the automated calibration of the E-net model and integrating real-time data feeds could significantly enhance its responsiveness and accuracy, making it more adaptable to dynamic operational environments.
Applying the E-net-based approach to real-world scenarios through case studies can provide valuable insights into its practical applications and limitations. This would also help in refining the model based on empirical evidence.
The use of E-nets in the macro-modeling of transport corridors presents a promising approach, offering detailed, dynamic, and scalable modeling capabilities. While challenges such as complexity and data dependence exist, the potential benefits in terms of enhanced operational insights and optimization are significant. Future research should focus on addressing these challenges and exploring the integration of E-nets with other modeling methodologies to further enhance their applicability in the ever-evolving domain of transport and logistics.

6. Conclusions

This paper presented a comprehensive exploration of using Evaluation Petri Nets (E-nets) for the macro-modeling of transport corridors, a critical component in the framework of global logistics and trade. The strengths of the E-net approach, particularly its capacity for the dynamic representation, flexibility, and detailed analysis of transport systems, highlight its potential as a powerful tool in addressing the complexities of modern transport corridors. These qualities make E-nets particularly suited for modeling the multifaceted and evolving nature of these corridors, offering valuable insights for both strategic planning and operational optimization.
The proposed macro-modeling methodology is marked by its ability to capture and simulate the complex interactions and various states within transport corridors.
One of the most striking advantages of the proposed macro-modeling methodology is its dynamic representation capabilities. By accurately modeling the transitions and delays within transport systems, E-nets provide a more realistic portrayal of these corridors. This feature is crucial for effectively managing and optimizing the flow of goods, especially in scenarios where timing and synchronization are critical.
Furthermore, the scalability of the E-net model ensures its applicability across different scales—from large, international networks to more localized, national segments. This scalability is essential in a world where transport corridors are continually evolving due to changes in trade patterns, technological advancements, and geopolitical shifts. It allows for the model to be responsive and relevant, adapting to both macro-level trends and micro-level operational details.
While the use of E-nets in the macro-modeling of transport corridors offers a range of significant advantages, it is equally important to acknowledge and understand the potential impact of this approach on the field and its contributions to the state of the art.
Impact of the proposed methodology:
  • It provides a more realistic and responsive modeling framework that accounts for the stochastic and dynamic nature of transport corridors, overcoming limitations of static modeling techniques.
  • It enables the detailed analysis of interactions and interdependencies between corridor components that drive optimization. This facilitates a system perspective rather than looking at factors in isolation.
  • It allows for scalable and adaptable models that can adjust to changing conditions and information availability. This is crucial for the evolution of corridors over time.
  • It offers the ability to simulate a range of scenarios and identify optimal solutions, leading to data-driven decision making and planning.
  • It serves as a common modeling platform for collaboration between stakeholders across national borders to enhance corridor integration.
  • It provides actionable insights coupled with global benchmarking to key decision makers in both public and private sectors.
Contributions to the state of the art:
  • It introduces a novel approach to transport corridor modeling using E-nets, overcoming static model limitations.
  • It develops a robust yet adaptable methodology tailored to the needs of international corridor analysis.
  • It incorporates globally recognized indicators like the LPI into the model for compatibility and comparability.
  • It demonstrates the application of a cutting-edge simulation technique to a real-world logistics challenge.
  • It provides a case study template for the E-net-based modeling of transport systems and networks.
  • It opens up potential new research directions for applying E-nets in the transportation, logistics, and supply chain domains.
The proposed macro-modeling methodology represents an evolution of the state of the art for the dynamic modeling of complex transport corridors. By highlighting its multifaceted impact and contributions, the conclusion can provide deeper insight into the importance of this work for both theory and practice.
The ability of the proposed approach to provide detailed, dynamic, and scalable models makes it an invaluable tool in the quest for more efficient, reliable, and adaptable transport networks. As the global landscape of trade and logistics continues to evolve, methodologies such as this one will be instrumental in navigating the complexities and capitalizing on the opportunities presented by ITCs as crucial factors of economic development.

Author Contributions

Conceptualization, I.K.; methodology, I.K.; software, Z.S.; validation, I.K. and Z.S.; formal analysis, I.K.; investigation, I.K.; resources, Z.S.; data curation, Z.S.; writing—original draft preparation, I.K.; writing—review and editing, I.K. and Z.S.; visualization, I.K.; supervision, I.K.; project administration, I.K.; funding acquisition, I.K. All authors have read and agreed to the published version of the manuscript.

Funding

This research received no external funding.

Data Availability Statement

No new data were created or analyzed in this study. Data sharing is not applicable to this article.

Conflicts of Interest

The authors declare no conflicts of interest.

References

  1. Nuzzolo, A.; Coppola, P.; Comi, A. Freight Transport Modeling: Review and Future Challenges. Int. J. Transp. Econ. 2013, 40, 151–181. Available online: http://www.jstor.org/stable/42748308 (accessed on 22 January 2024).
  2. Pompigna, A.; Raffaele, M. Input/Output Models for Freight Transport Demand: A Macro Approach to Traffic Analysis for a Freight Corridor. Arch. Transp. 2020, 54, 21–42. [Google Scholar] [CrossRef]
  3. Kronbak, J. East West Transport Corridor Macro-Level Modeling: East West—Activity 5.15 & 5.16; Region Blekinge: Blekinge, Sweden, 2007; Available online: https://portal.findresearcher.sdu.dk/en/publications/east-west-transport-corridor-macro-level-modeling-east-west-activ (accessed on 22 January 2024).
  4. Holmgren, J.; Ramstedt, L.; Davidsson, P.; Edwards, H.; Persson, J.A. Combining Macro-Level and Agent-Based Modeling for Improved Freight Transport Analysis. Procedia Comput. Sci. 2014, 32, 380–387. [Google Scholar] [CrossRef]
  5. The ITF Modelling Framework (PASTA 2023). Available online: https://www.itf-oecd.org/itf-modelling-framework-pasta-2023 (accessed on 22 January 2024).
  6. Liu, J.; Lu, H.; Chen, M.; Wang, J.; Zhang, Y. Macro Perspective Research on Transportation Safety: An Empirical Analysis of Network Characteristics and Vulnerability. Sustainability 2020, 12, 6267. [Google Scholar] [CrossRef]
  7. Rodrigue, J.-P. The Geography of Transport Systems, 5th ed.; Routledge: London, UK, 2020. [Google Scholar] [CrossRef]
  8. Ortúzar, J.D.D.; Willumsen, L.G. Modeling Transport, 4th ed.; Wiley: Washington, DC, USA, 2011. [Google Scholar]
  9. Derudder, B.; Liu, X.; Kunaka, C. Connectivity Along Overland Corridors of the Belt and Road Initiatives; World Bank: Washington, DC, USA, 2018. [Google Scholar]
  10. Wang, X.; Song, J.; Wu, Q. An Economic Equilibrium Model for Optimizing Passenger Transport Corridor Mode Structure Based on Travel Surplus. Sustainability 2021, 13, 4024. [Google Scholar] [CrossRef]
  11. Kramarz, M.; Dohn, K.; Przybylska, E.; Knop, L. Scenarios for the Development of Multimodal Transport in the TRITIA Cross-Border Area. Sustainability 2020, 12, 7021. [Google Scholar] [CrossRef]
  12. Muna, S.I.; Mukherjee, S.; Namuduri, K.; Compere, M.; Akbas, M.I.; Molnár, P.; Subramanian, R. Air Corridors: Concept, Design, Simulation, and Rules of Engagement. Sensors 2021, 21, 7536. [Google Scholar] [CrossRef] [PubMed]
  13. Boira, J.V.; Berzi, M. Liberalization, Trans-European Corridors and EU Funds: A New Scenario in the Relationship between Rail Networks and Mediterranean Cities. Land 2023, 12, 1986. [Google Scholar] [CrossRef]
  14. Asian Development Bank. CAREC Corridor Performance Measurement and Monitoring: Annual Report; Asian Development Bank: Mandaluyong, Philippines, 2019. [Google Scholar] [CrossRef]
  15. Song, J.; Chen, F.; Wu, Q.; Liu, W.; Xue, F.; Du, K. Optimization of Passenger Transportation Corridor Mode Supply Structure in Regional Comprehensive Transport Considering Economic Equilibrium. Sustainability 2019, 11, 1172. [Google Scholar] [CrossRef]
  16. Un ESCAP. Learning Materials on Transport Corridors; Un ESCAP. 2020. Available online: https://www.unescap.org/sites/default/files/Learning%20Material%20-%20Transport%20Corridors.pdf (accessed on 10 November 2023).
  17. Arnold, J. Best Practices in Management of International Trade Corridors; World Bank, 2006; Paper 38459. Available online: https://documents1.worldbank.org/curated/pt/441171468315291413/pdf/384590Internat1e0corridors01PUBLIC1.pdf (accessed on 10 November 2023).
  18. Kunaka, C.; Carruthers, R. Trade and Transport Corridor Management Toolkit Trade and Development; World Bank: Washington, DC, USA, 2014. [Google Scholar] [CrossRef]
  19. European Commission, Directorate-General for Mobility and Transport. Support Study for the Evaluation of Regulation (EU) N° 1315/2013 on Union Guidelines for the Development of the Trans-European Transport Network—Final Report. 2021. Available online: https://data.europa.eu/doi/10.2832/106561 (accessed on 10 November 2023).
  20. Aritua, B.; Cheng, L.; van Liere, R.; de Leijer, H. Blue Routes for a New Era: Developing Inland Waterways Transportation in China; International Development in Focus; World Bank: Washington, DC, USA, 2021. [Google Scholar] [CrossRef]
  21. Qaja, B. Transport Corridors as a Socio-Economic Energizer. Eur. J. Multidiscip. Stud. 2020, 5, 2. Available online: https://revistia.com/files/articles/ejms_v5_i2_20/Qaja.pdf (accessed on 10 November 2023). [CrossRef]
  22. Palu, R.; Hilmola, O.-P. Future Potential of Trans-Caspian Corridor: Review. Logistics 2023, 7, 39. [Google Scholar] [CrossRef]
  23. Kenderdine, T.; Bucsky, P. Middle Corridor—Policy Development and Trade Potential of the Trans-Caspian International Transport Route; ADBI Working Paper 1268; Asian Development Bank Institute: Tokyo, Japan, 2021; Available online: https://www.adb.org/publications/middle-corridor-policy-development-trade-potential (accessed on 11 November 2022).
  24. European Bank for Reconstruction and Development (EBRD). Sustainable Transport Connections between Europe and Central Asia; EBRD: London, UK, 2023; Final Report, Contract No. ACA/2020/414-374; Available online: https://transport.ec.europa.eu/system/files/2023-06/Sustainable_transport_connections_between_Europe_and_Central_Asia.pdf (accessed on 10 November 2023).
  25. World Bank. Logistics Performance Index. Available online: https://lpi.worldbank.org/report (accessed on 10 November 2023).
  26. Nutt, G.J. Evaluation Nets for Computer System Performance Analysis. In Proceedings of the Fall Joint Computer Conference, Part I, New York, NY, USA, 5–7 December 1972; pp. 279–286. [Google Scholar]
  27. Reisig, W. Understanding Petri Nets: Modeling Techniques, Analysis Methods, Case Studies; Springer: Berlin/Heidelberg, Germany, 2016. [Google Scholar] [CrossRef]
  28. Della. Transportation Prices. Available online: https://della.eu/price/71/ (accessed on 10 November 2023).
  29. Statista. Container Freight Rate Index from China to Europe. Available online: https://www.statista.com/statistics/1266631/china-eastern-asia-to-northern-europe-container-freight-rates/ (accessed on 10 November 2023).
  30. Petri Nets Tools Database. Available online: https://www.informatik.uni-hamburg.de/TGI/PetriNets/tools/quick.html (accessed on 10 November 2023).
  31. Grobelna, I.; Karatkevich, A. Challenges in Application of Petri Nets in Manufacturing Systems. Electronics 2021, 10, 2305. [Google Scholar] [CrossRef]
  32. Medina-Garcia, S.; Medina-Marin, J.; Montaño-Arango, O.; Gonzalez-Hernandez, M.; Hernandez-Gress, E.S. A Petri Net Approach for Business Process Modeling and Simulation. Appl. Sci. 2023, 13, 11192. [Google Scholar] [CrossRef]
  33. Orlov, S.P.; Susarev, S.V.; Uchaikin, R.A. Application of Hierarchical Colored Petri Nets for Technological Facilities’ Maintenance Process Evaluation. Appl. Sci. 2021, 11, 5100. [Google Scholar] [CrossRef]
  34. Zhang, C.; Tian, G.; Fathollahi-Fard, A.M.; Wang, W.; Wu, P.; Li, Z. Interval-Valued Intuitionistic Uncertain Linguistic Cloud Petri Net and Its Application to Risk Assessment for Subway Fire Accident. IEEE Trans. Autom. Sci. Eng. 2022, 19, 163–177. [Google Scholar] [CrossRef]
  35. Zhu, H.; El-Sherbeeny, A.M.; El-Meligy, M.A.; Fathollahi-Fard, A.M.; Li, Z. Verification of Current-State Opacity in Discrete Event Systems by Using Basis Coverability Graphs. Mathematics 2023, 11, 1798. [Google Scholar] [CrossRef]
  36. Zaitsev, D.A.; Shmeleva, T.R.; Probert, D.E. Applying Infinite Petri Nets to the Cybersecurity of Intelligent Networks, Grids and Clouds. Appl. Sci. 2021, 11, 11870. [Google Scholar] [CrossRef]
Figure 1. Flowchart of E-net building.
Modelling 05 00013 g001
Figure 2. Elementary E-net for the modeling of transport corridors.
Modelling 05 00013 g002
Figure 3. Transformation of the elementary E-net model into a macro-model for a national segment of an ITC.
Modelling 05 00013 g003
Figure 4. Transformation of the elementary E-net model into a macro-model for a national segment of an ITC with alternative transport corridors.
Modelling 05 00013 g004
Figure 5. Main Europe–Asia land-based corridors.
Modelling 05 00013 g005
Figure 6. E-net of transport corridor with an elementary E-net model.
Modelling 05 00013 g006
Figure 7. Macro-model of the Trans-Caspian International Transport Route.
Modelling 05 00013 g007
Table 1. Scalability of different types of Petri nets.
Type of Petri NetScalabilityCase Study
E-nets (Evaluation Petri Nets)E-nets are highly scalable due to their advanced features like time stamps and guard conditions, which allow for detailed and complex modeling without a significant loss of manageability or clarity. This scalability is essential in modeling extensive transport networks with numerous nodes and varying conditions.Consider a sprawling international transport network with multiple intersecting routes and varying operational conditions. E-nets can efficiently scale up to model this complexity, maintaining accuracy in temporal and conditional aspects.
Ordinary Petri NetsOrdinary Petri Nets, while straightforward in simpler models, can become cumbersome and less intuitive as the system’s complexity increases. The lack of advanced features like time-dependent transitions can lead to an overly simplified representation of complex transport corridors.For a large-scale transport network, Ordinary Petri Nets may require a disproportionately large number of places and transitions to represent the same level of detail as E-nets, potentially making the model unwieldy and difficult to interpret.
Workflow Petri NetsWorkflow Petri Nets are designed to handle complex business processes and can scale effectively in such environments. However, when applied to transport corridors, their focus on business process flows might not align seamlessly with the operational intricacies of transport systems.In modeling a multi-modal transport system with various decision-making points and conditional flows, Workflow Petri Nets might scale well but may not fully capture the operational nuances specific to transport logistics.
Colored Petri NetsColored Petri Nets, which allow for the inclusion of data and information within the tokens, can offer significant scalability advantages, especially in complex systems where different types of data need to be processed.When modeling a transport corridor with diverse types of cargo, vehicles, and routes, Colored Petri Nets can efficiently scale up by incorporating varied data types within the model without significantly increasing its complexity.
Disclaimer/Publisher’s Note: The statements, opinions and data contained in all publications are solely those of the individual author(s) and contributor(s) and not of MDPI and/or the editor(s). MDPI and/or the editor(s) disclaim responsibility for any injury to people or property resulting from any ideas, methods, instructions or products referred to in the content.

