
Modeling of a Three-Stage Cascaded Refrigeration System Based on Standard Refrigeration Compressors in Cryogenic Applications above 110 K


Abstract
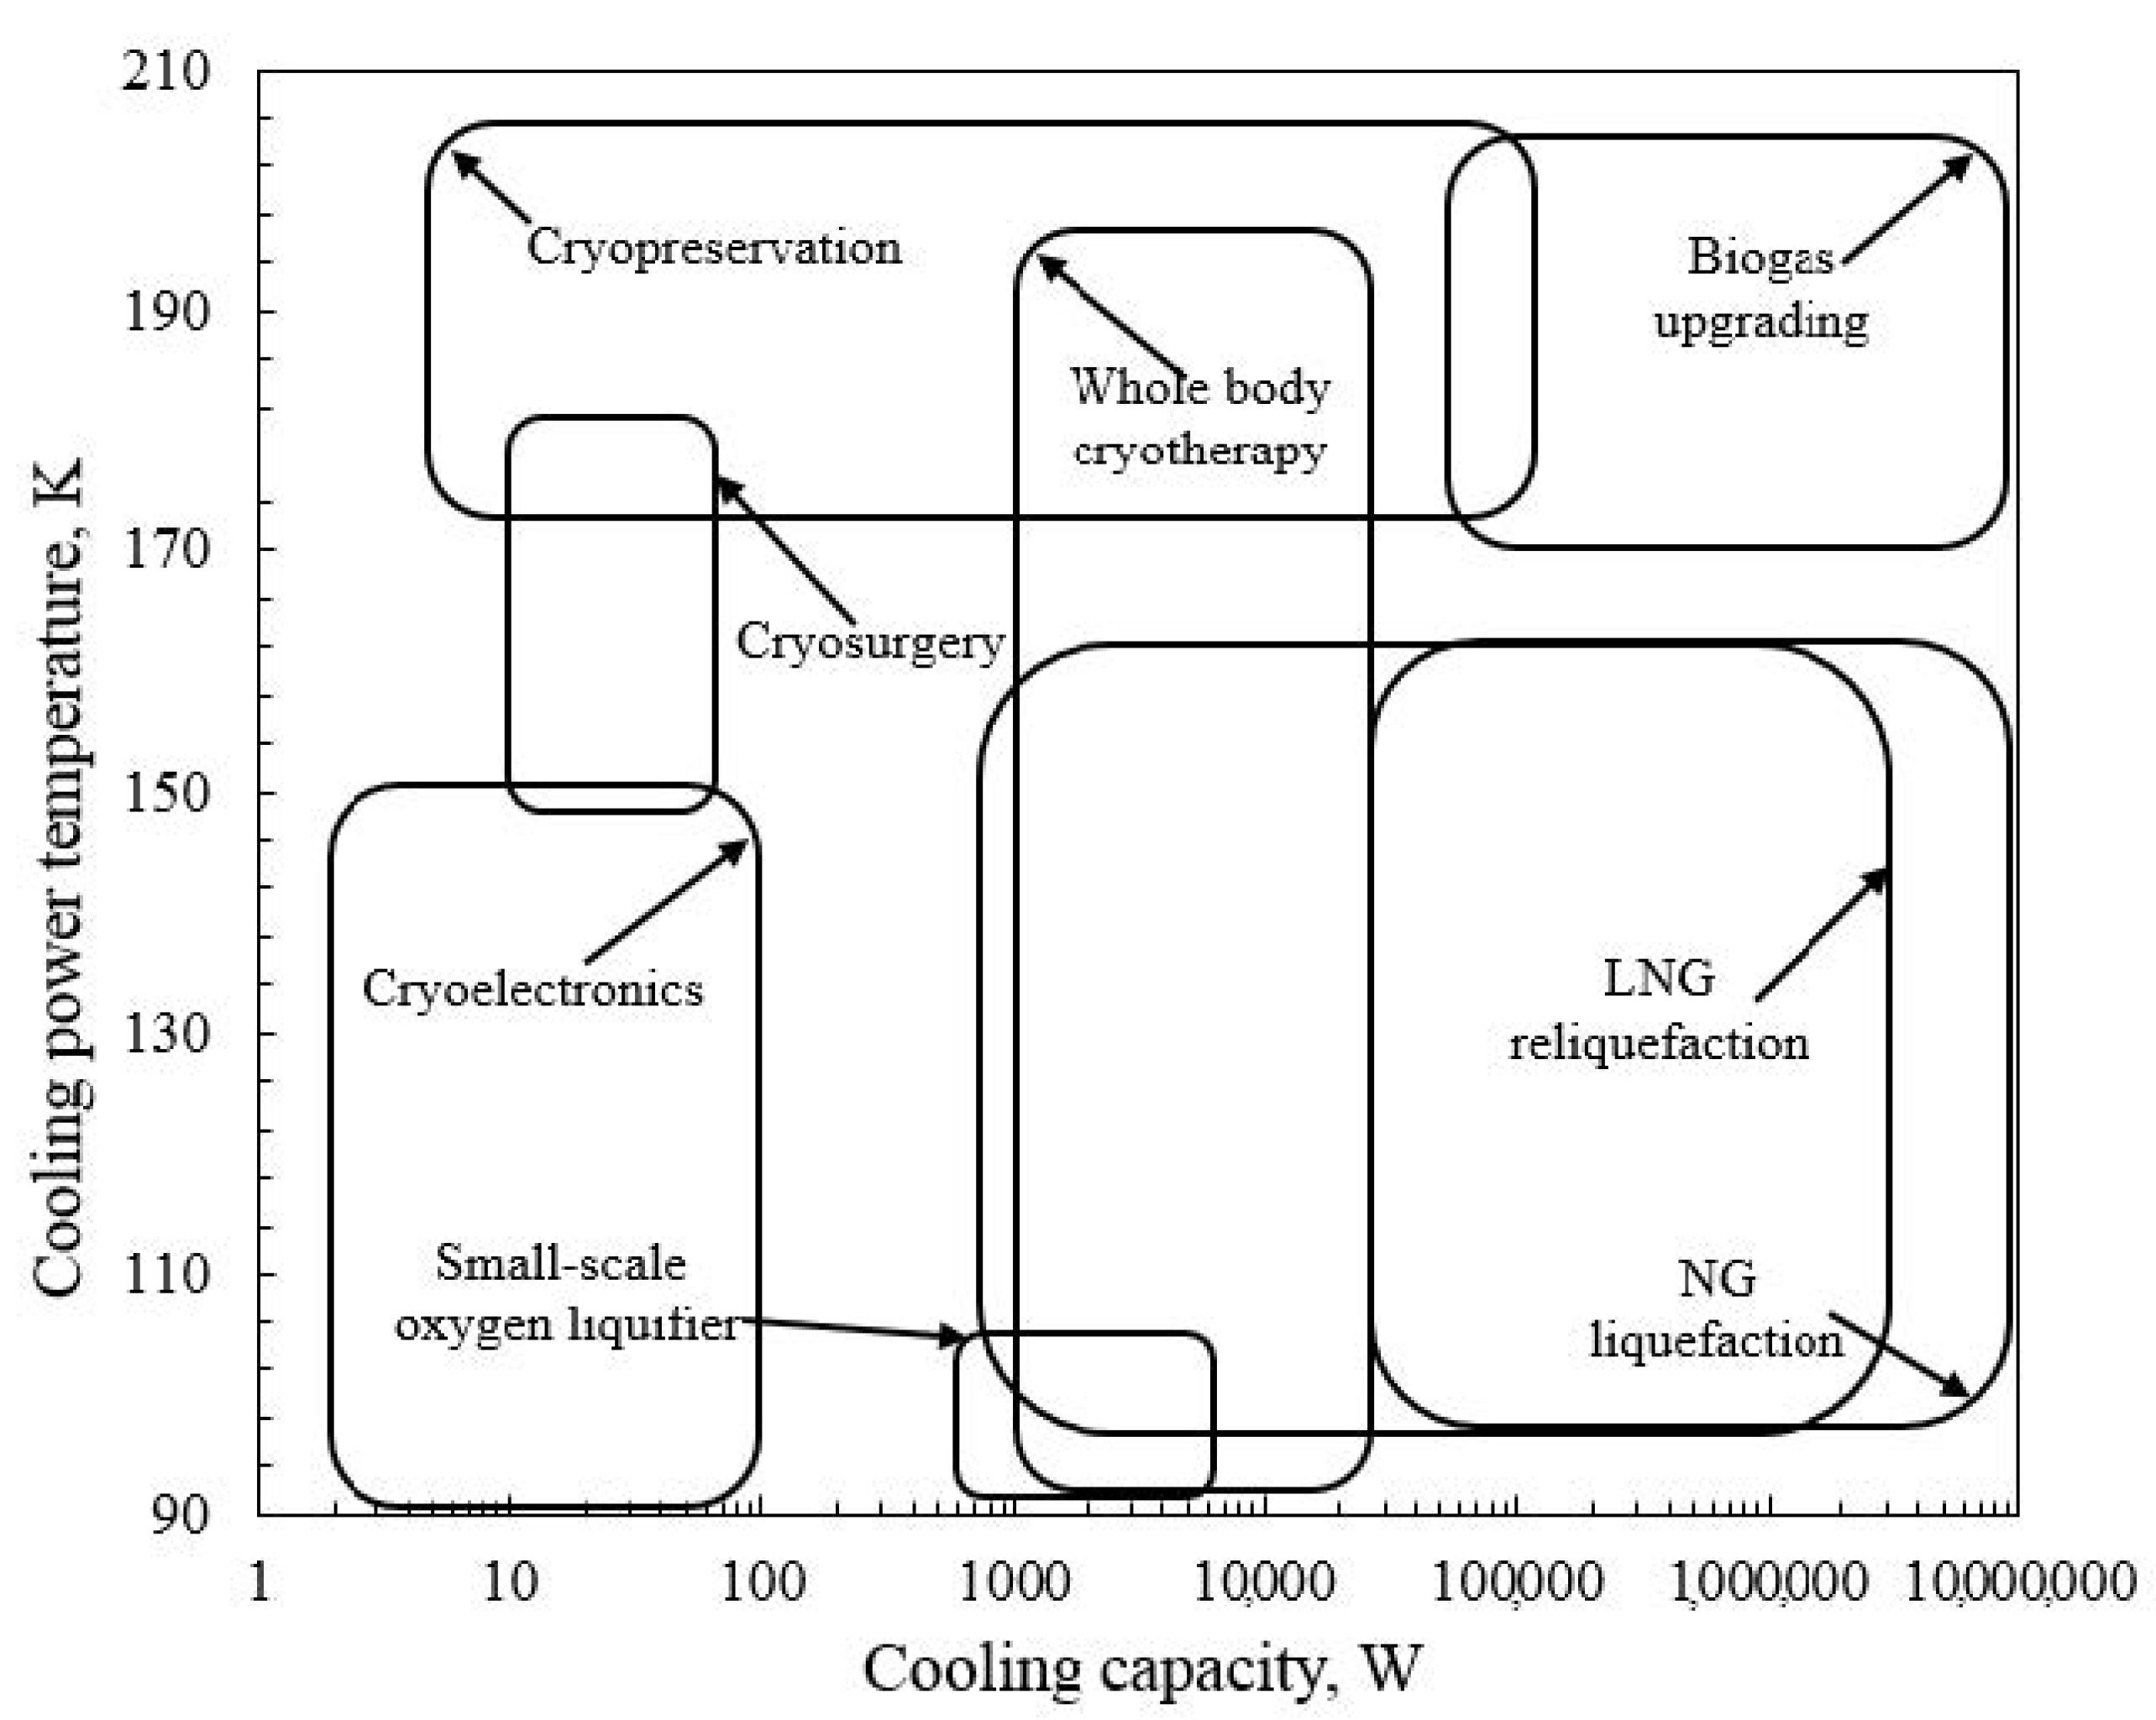
1. Introduction
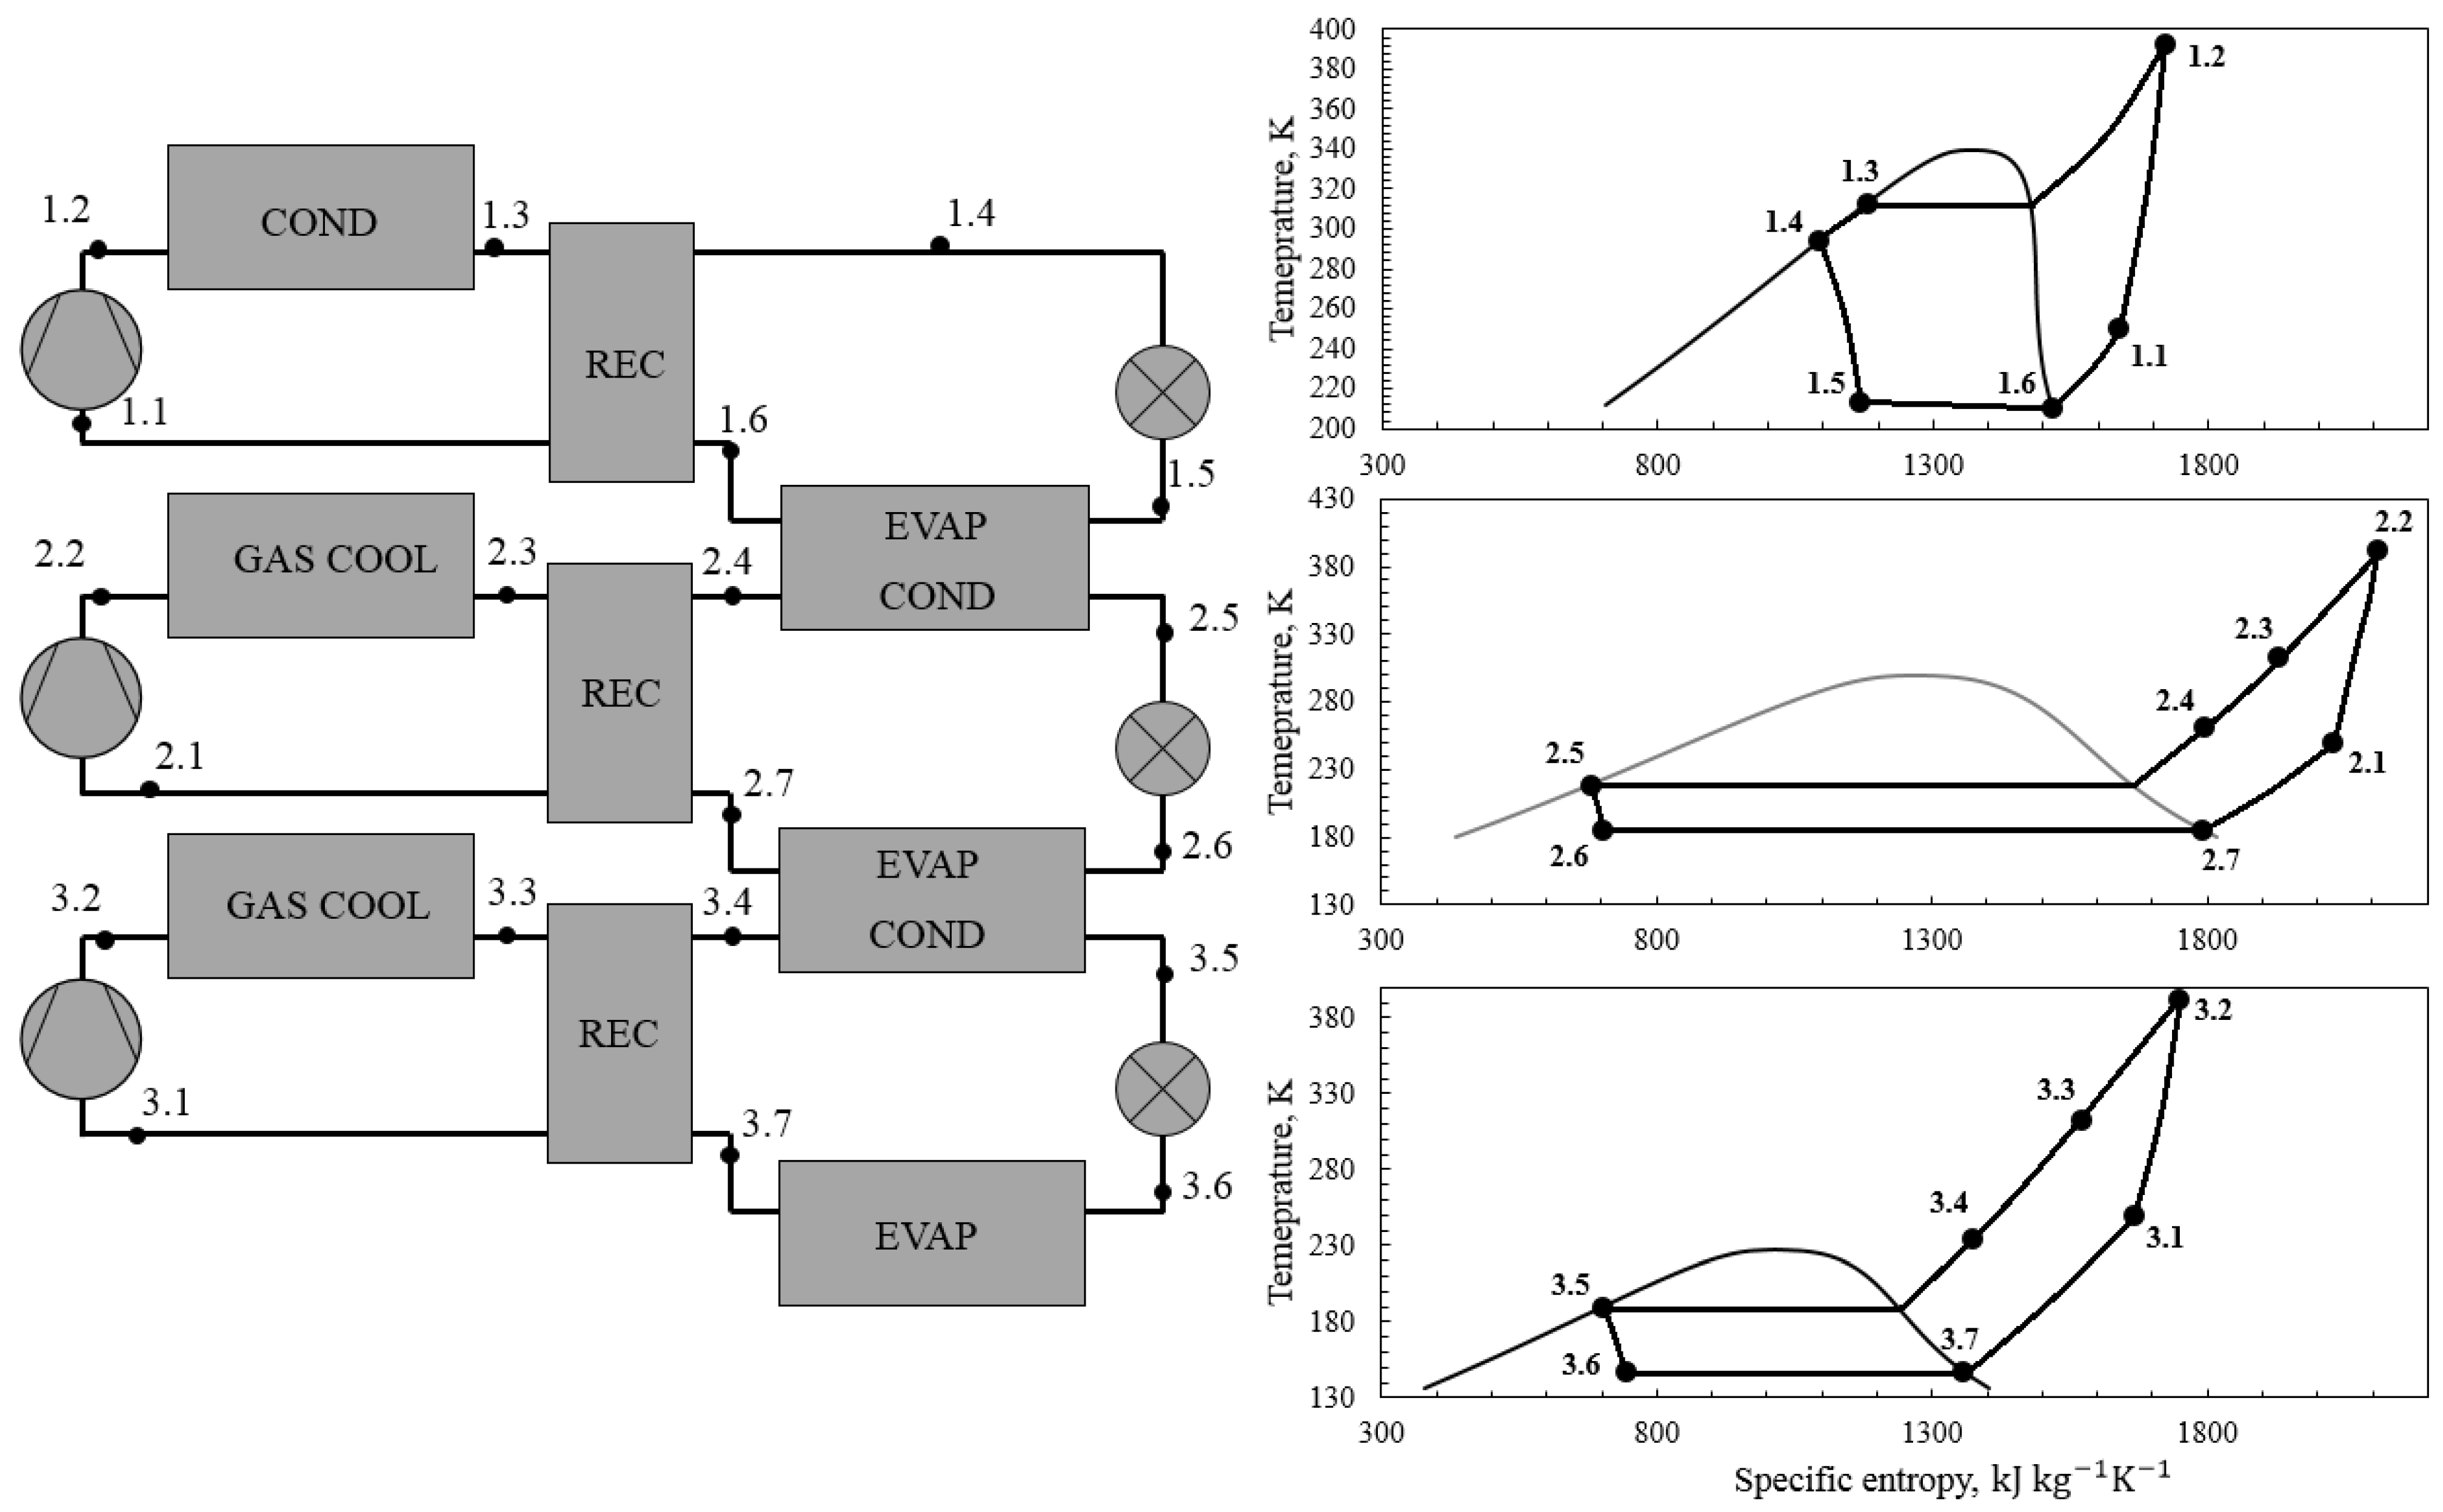
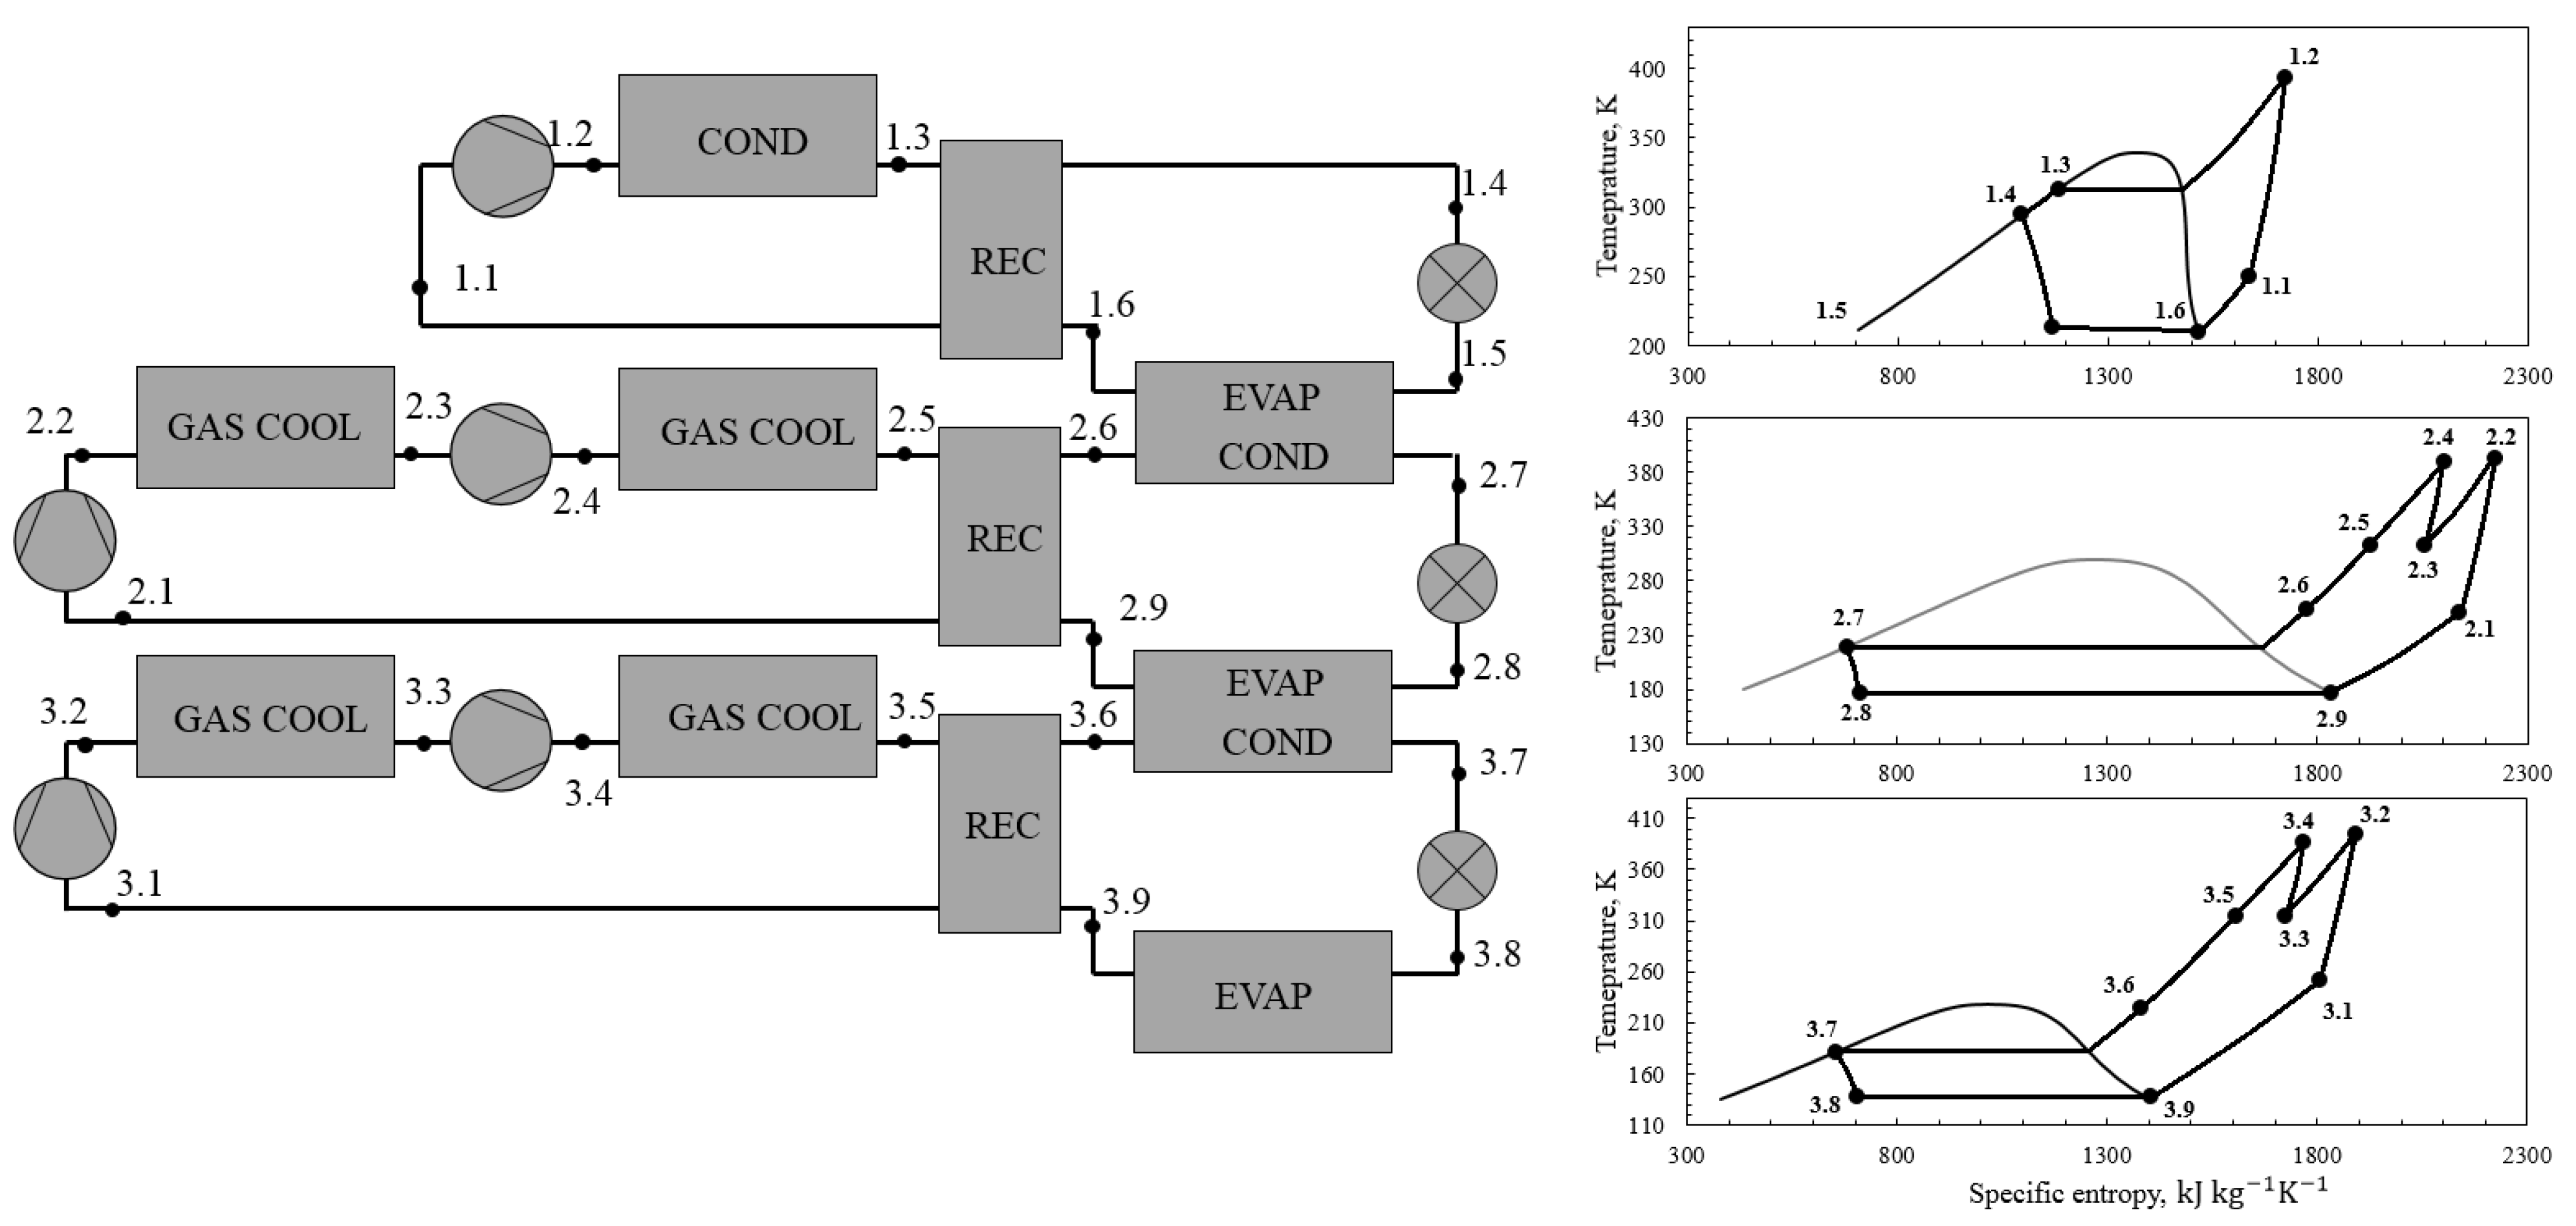
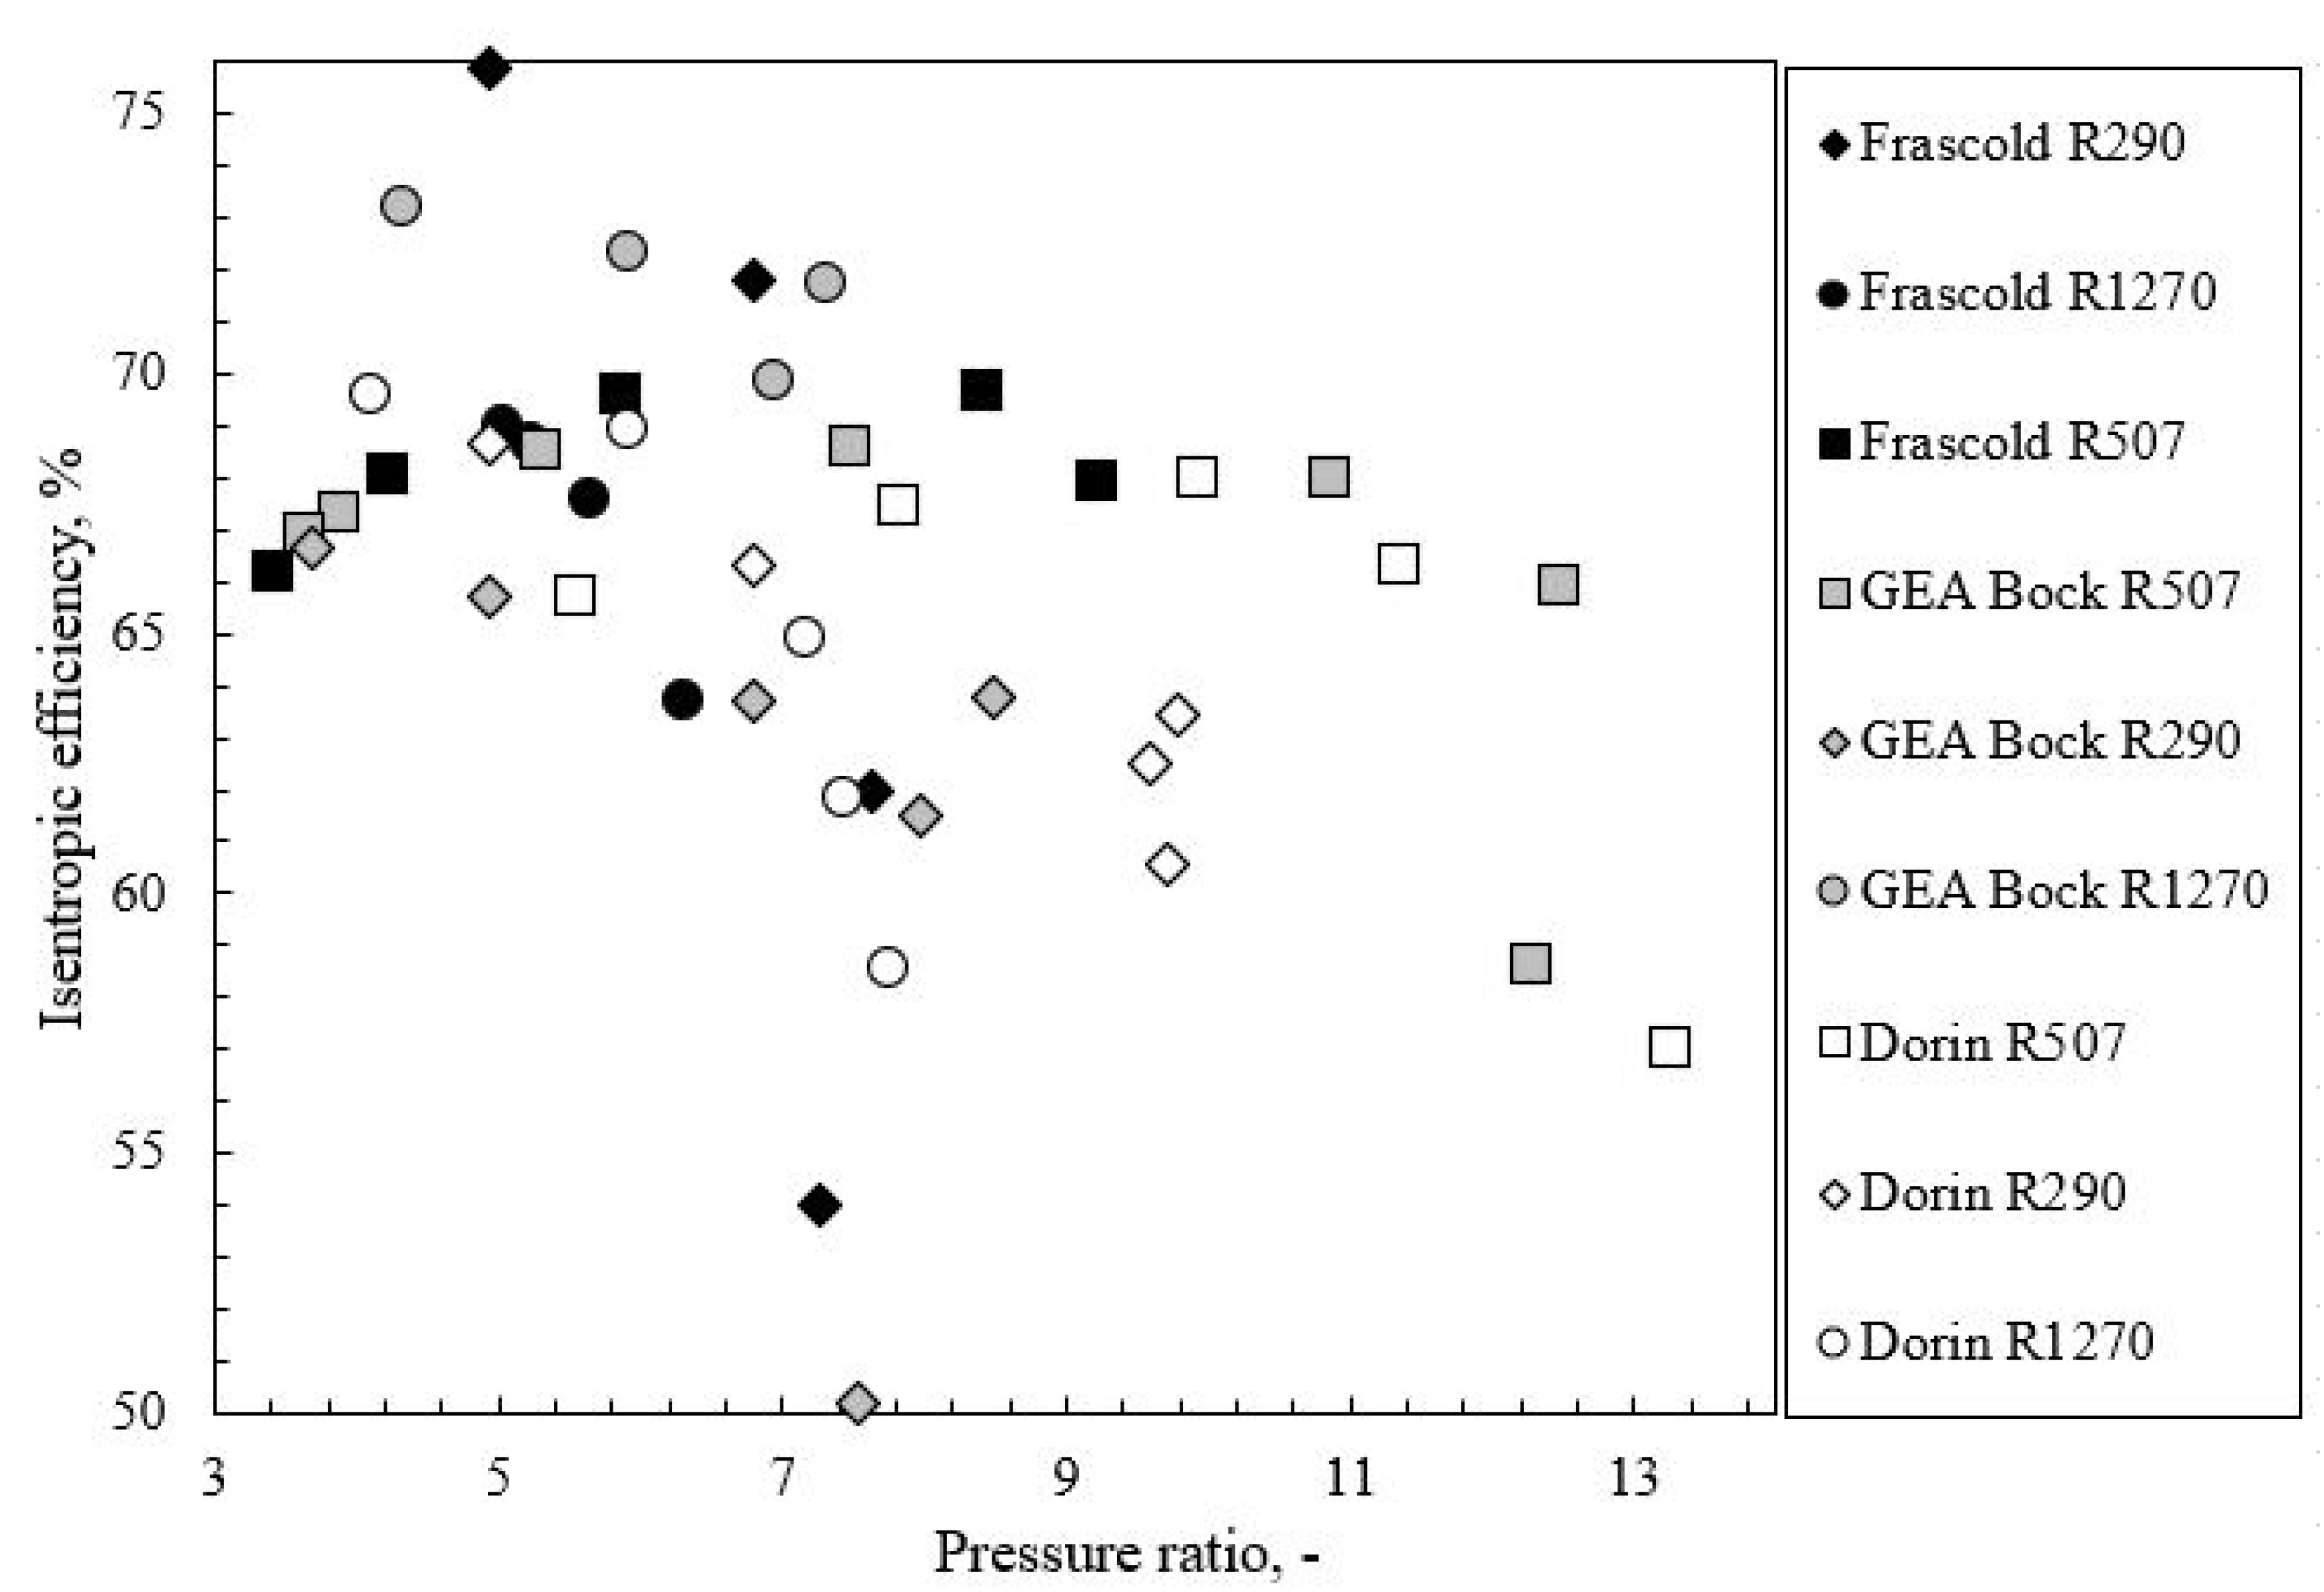
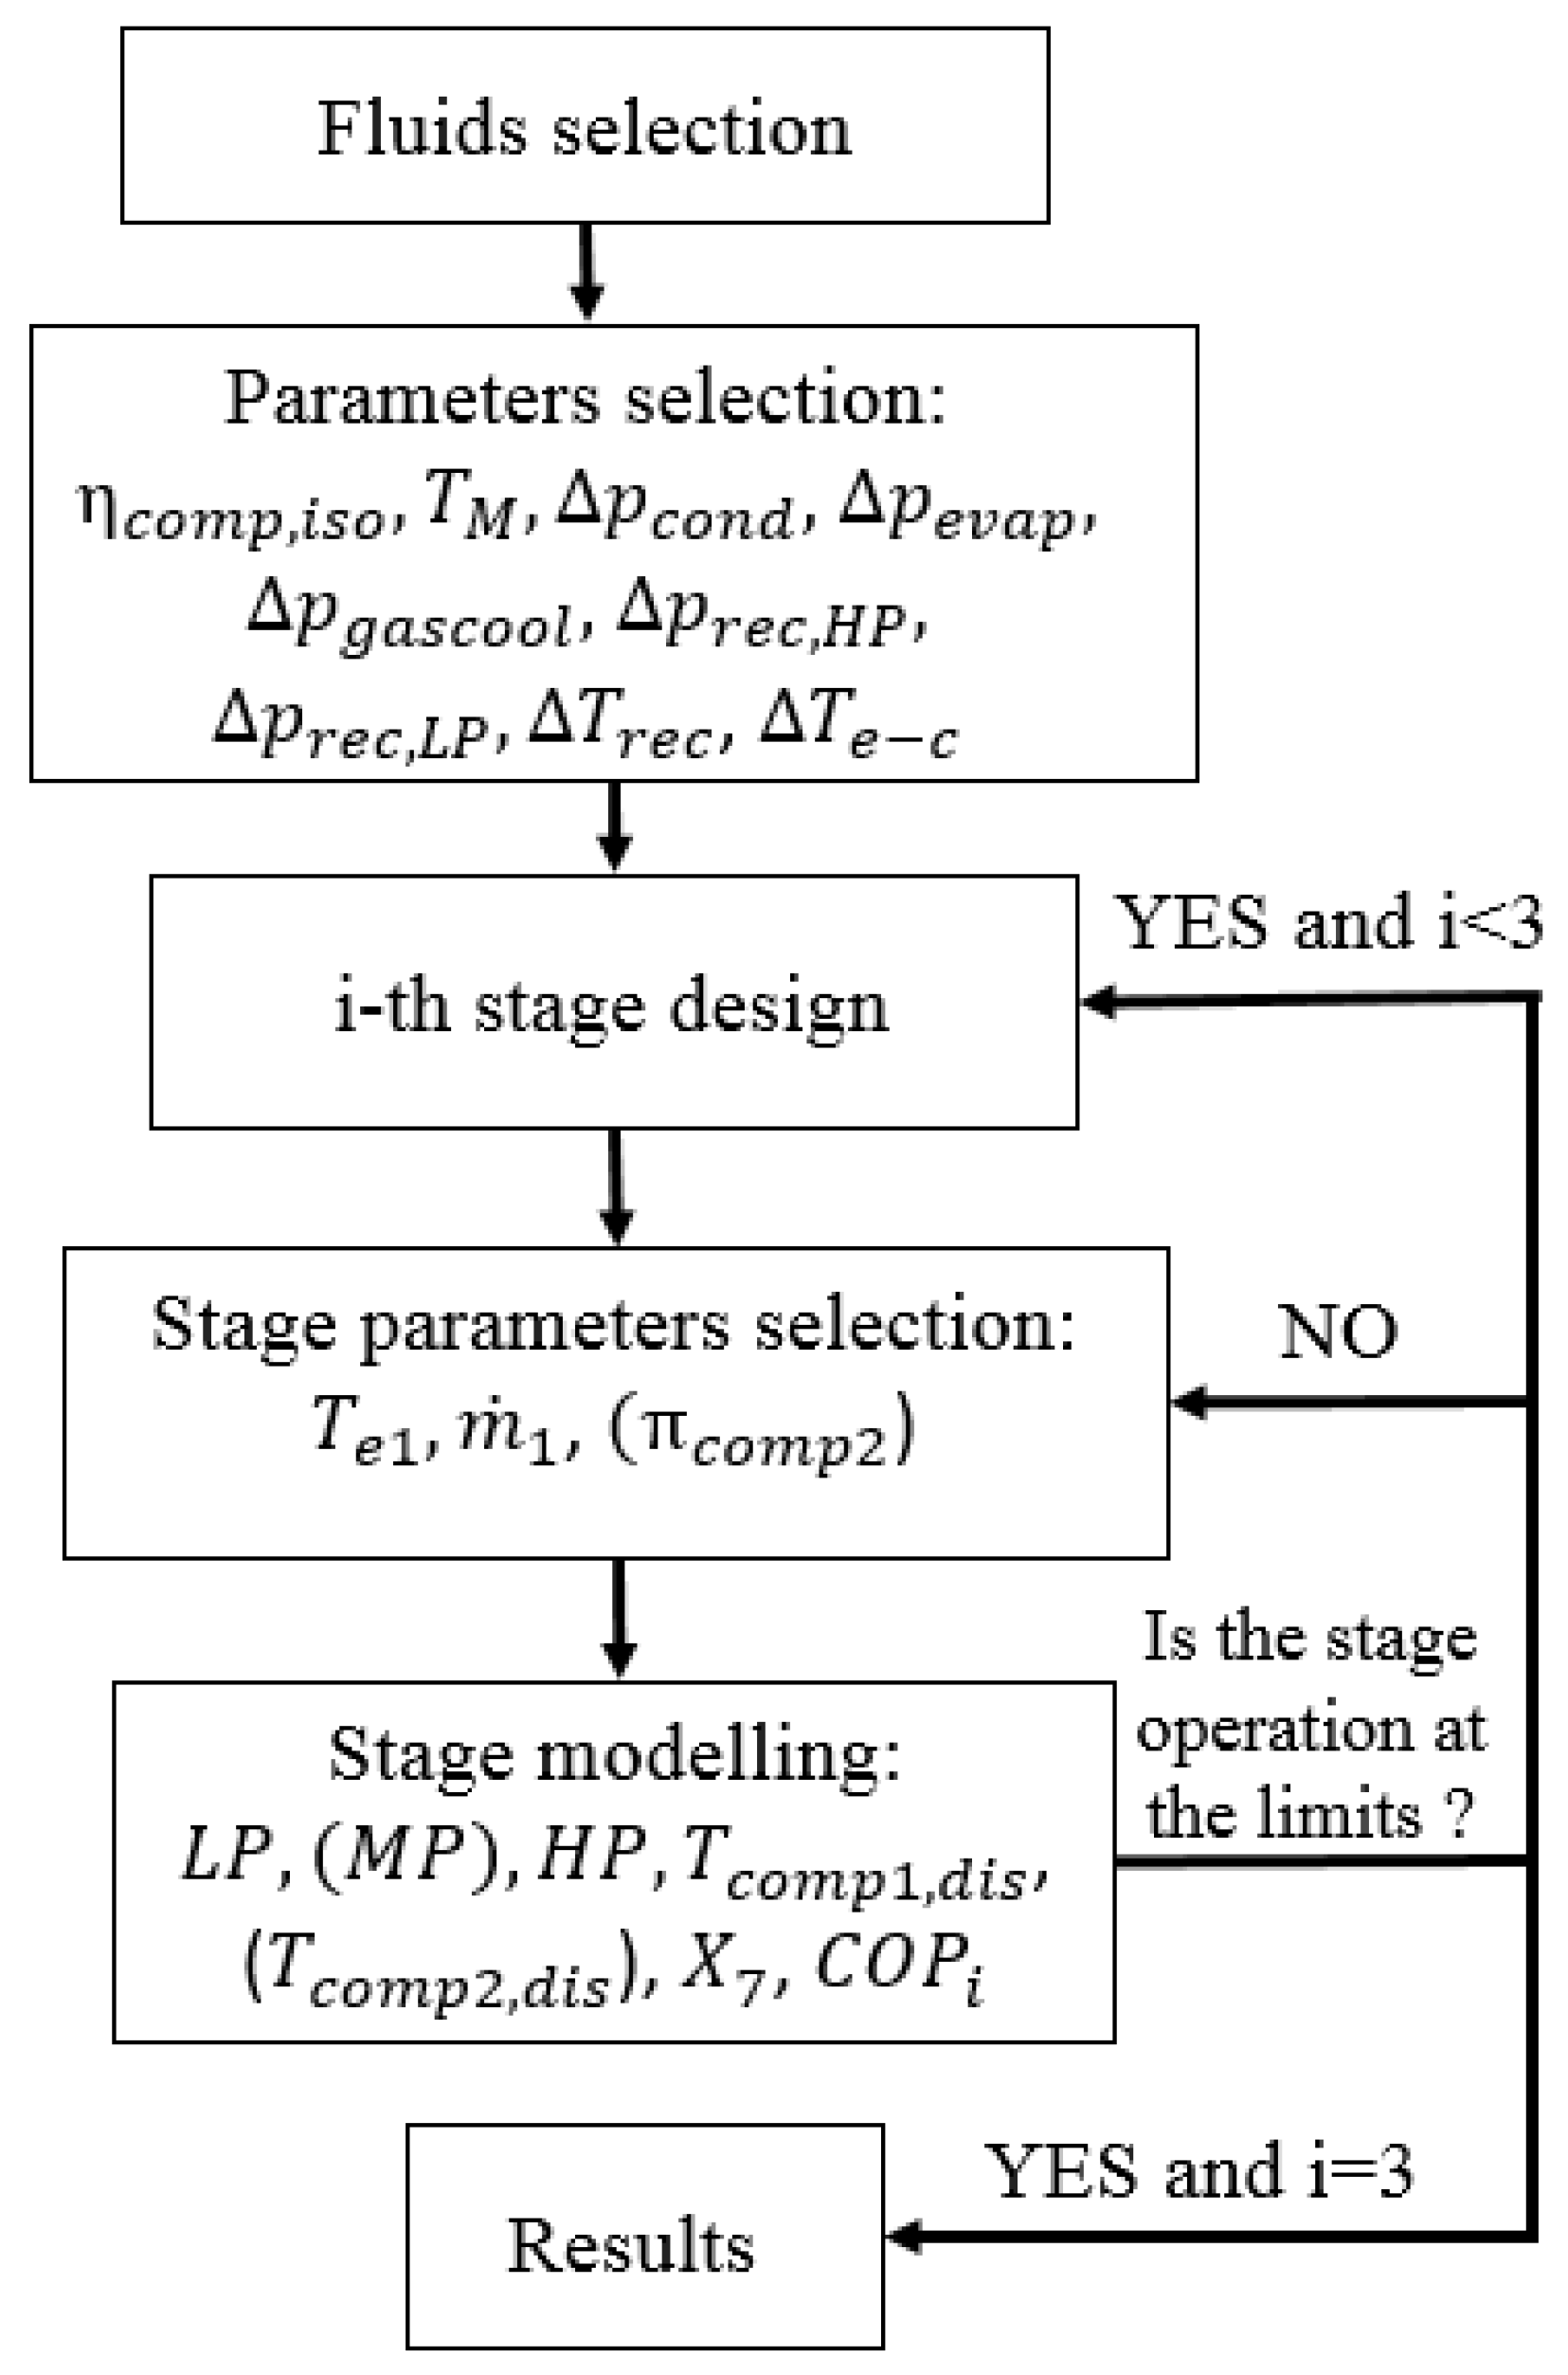
2. Materials and Methods
- Gas temperature at the compressor suction cannot be less than 240 K [37].
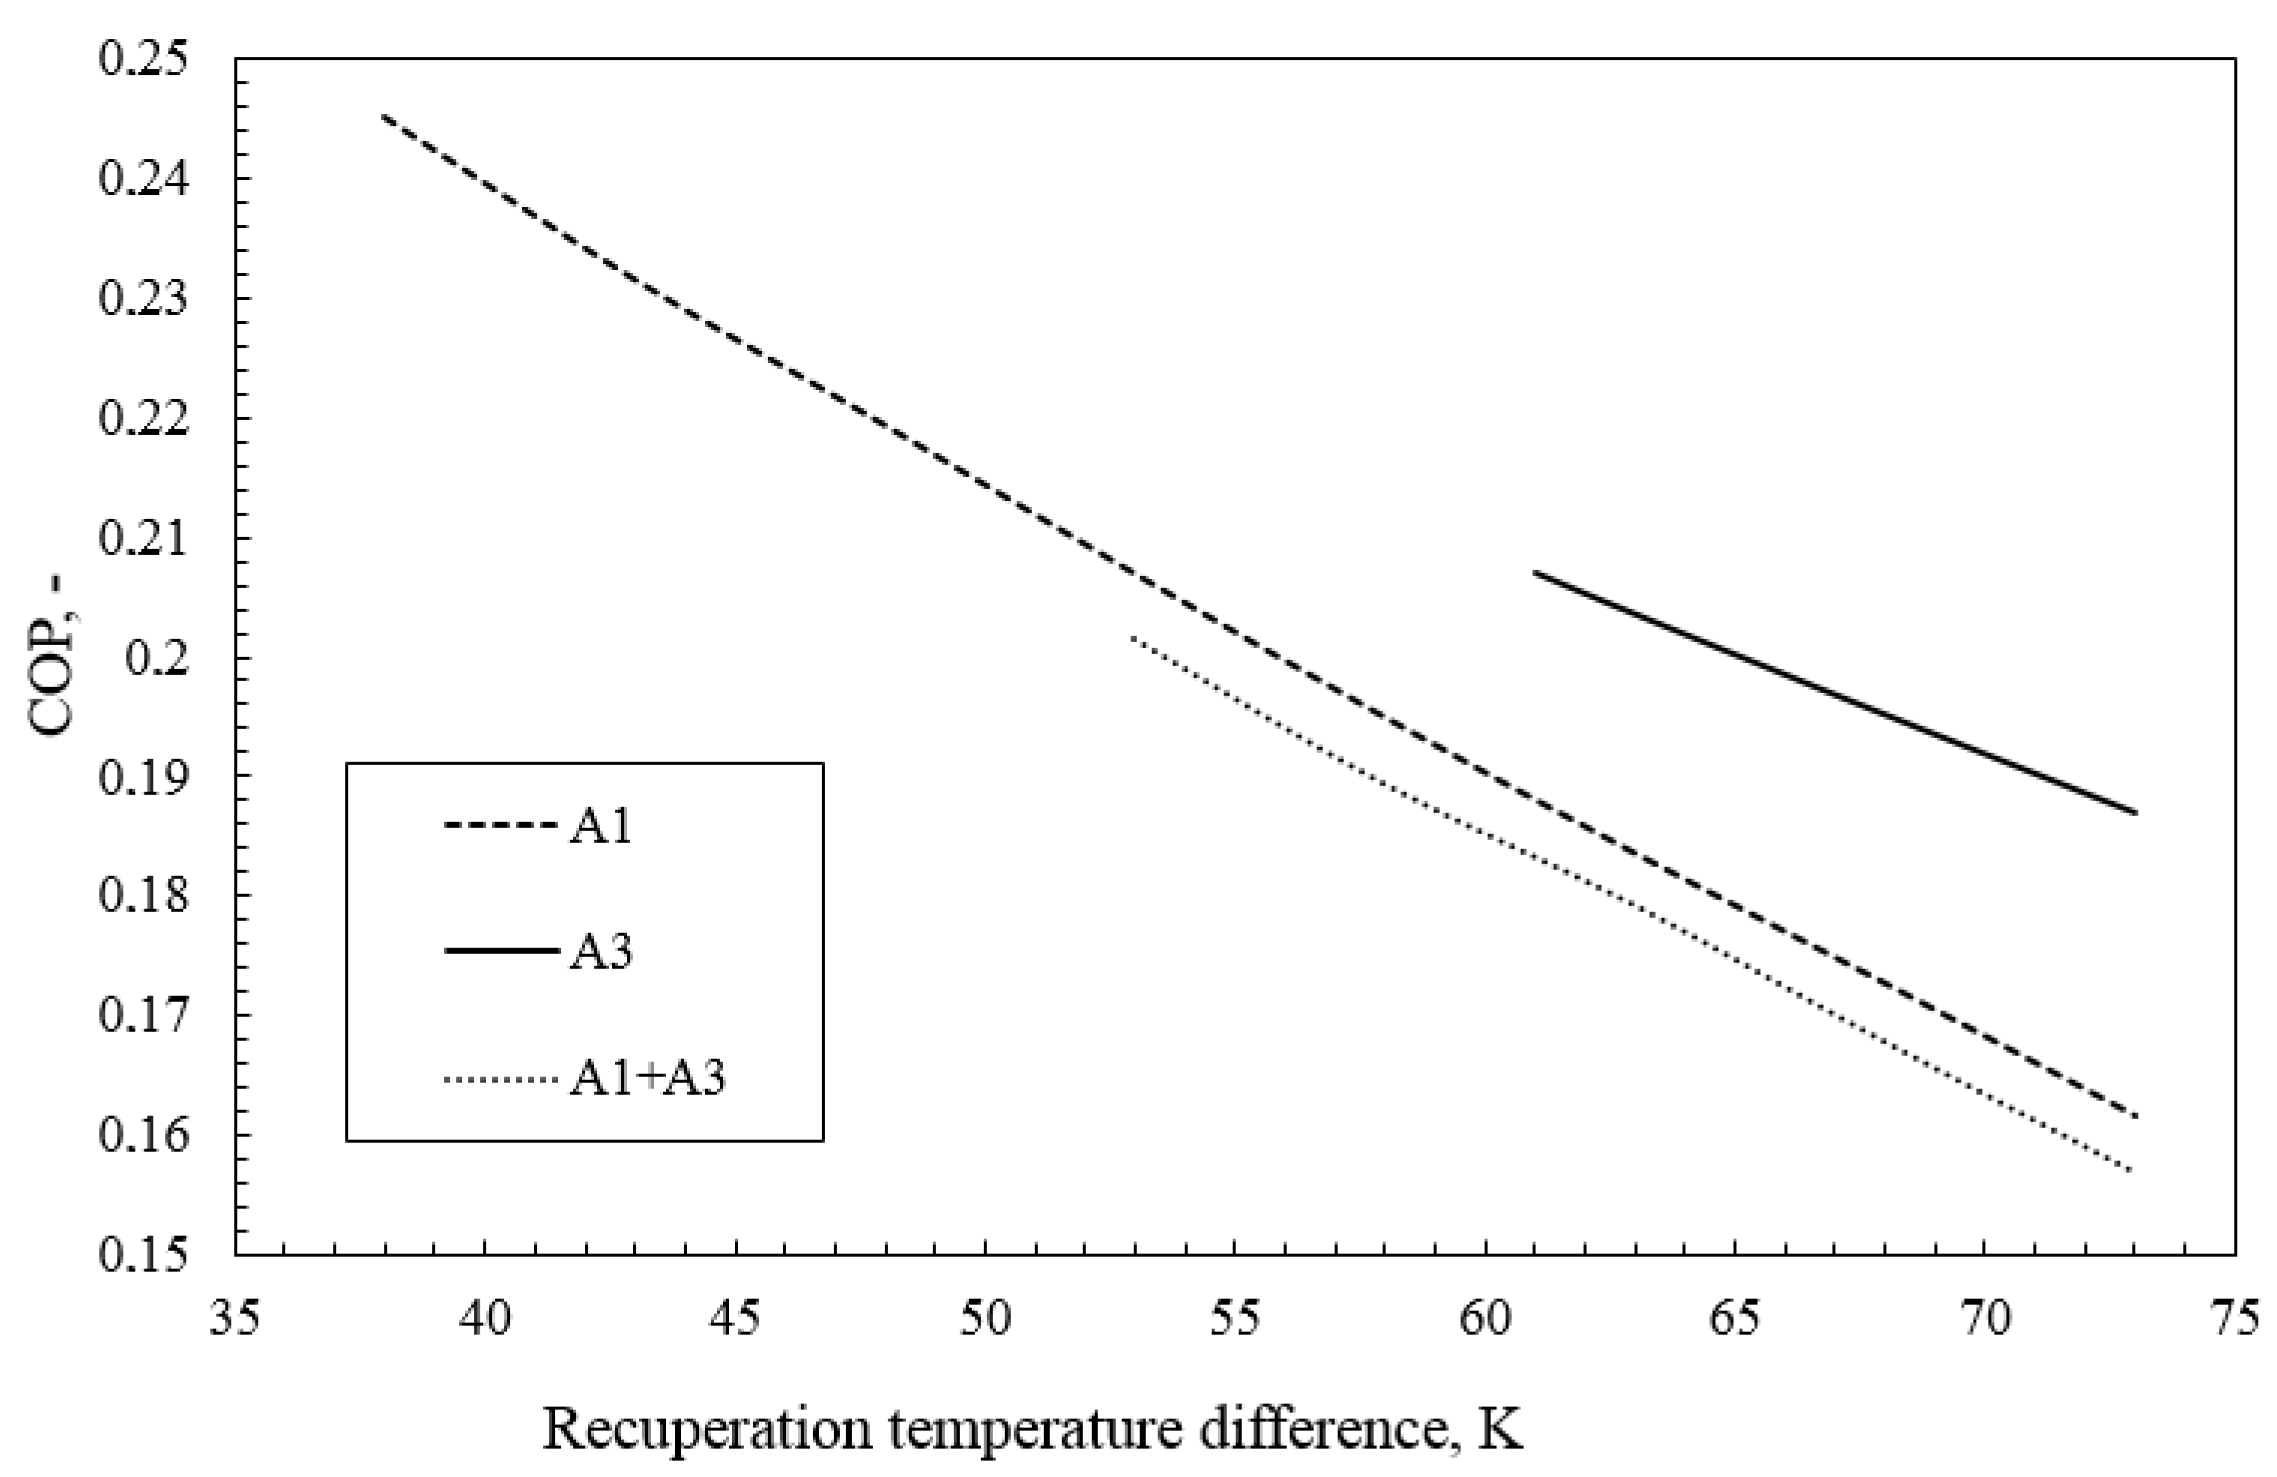
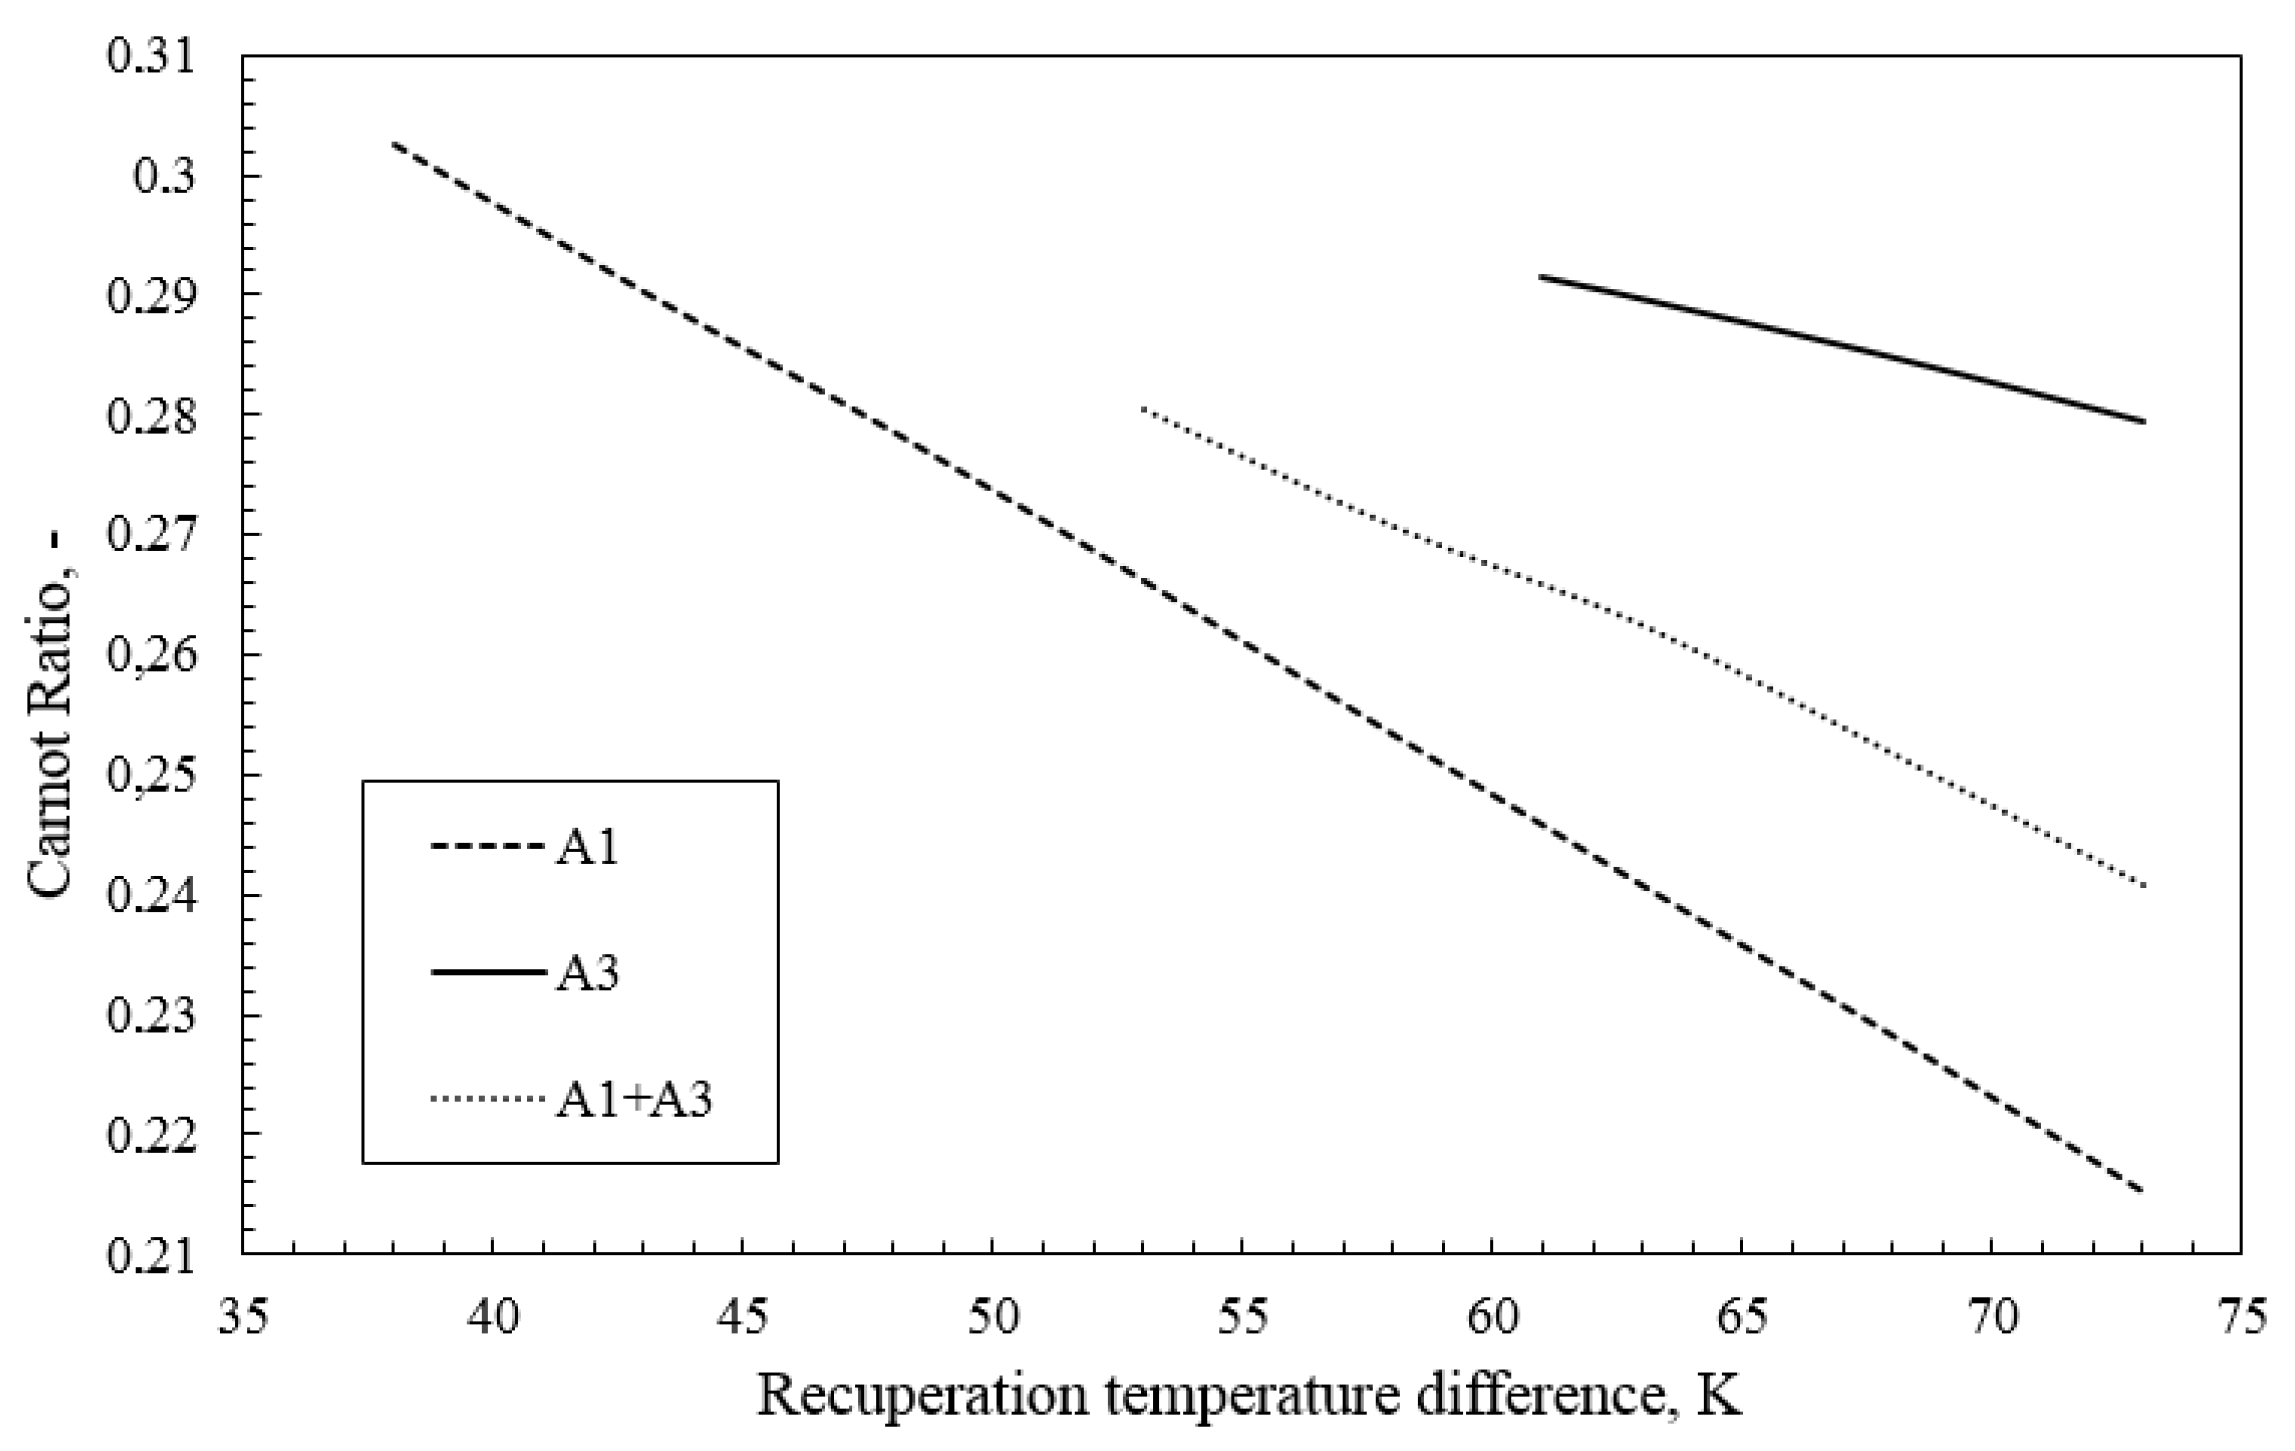
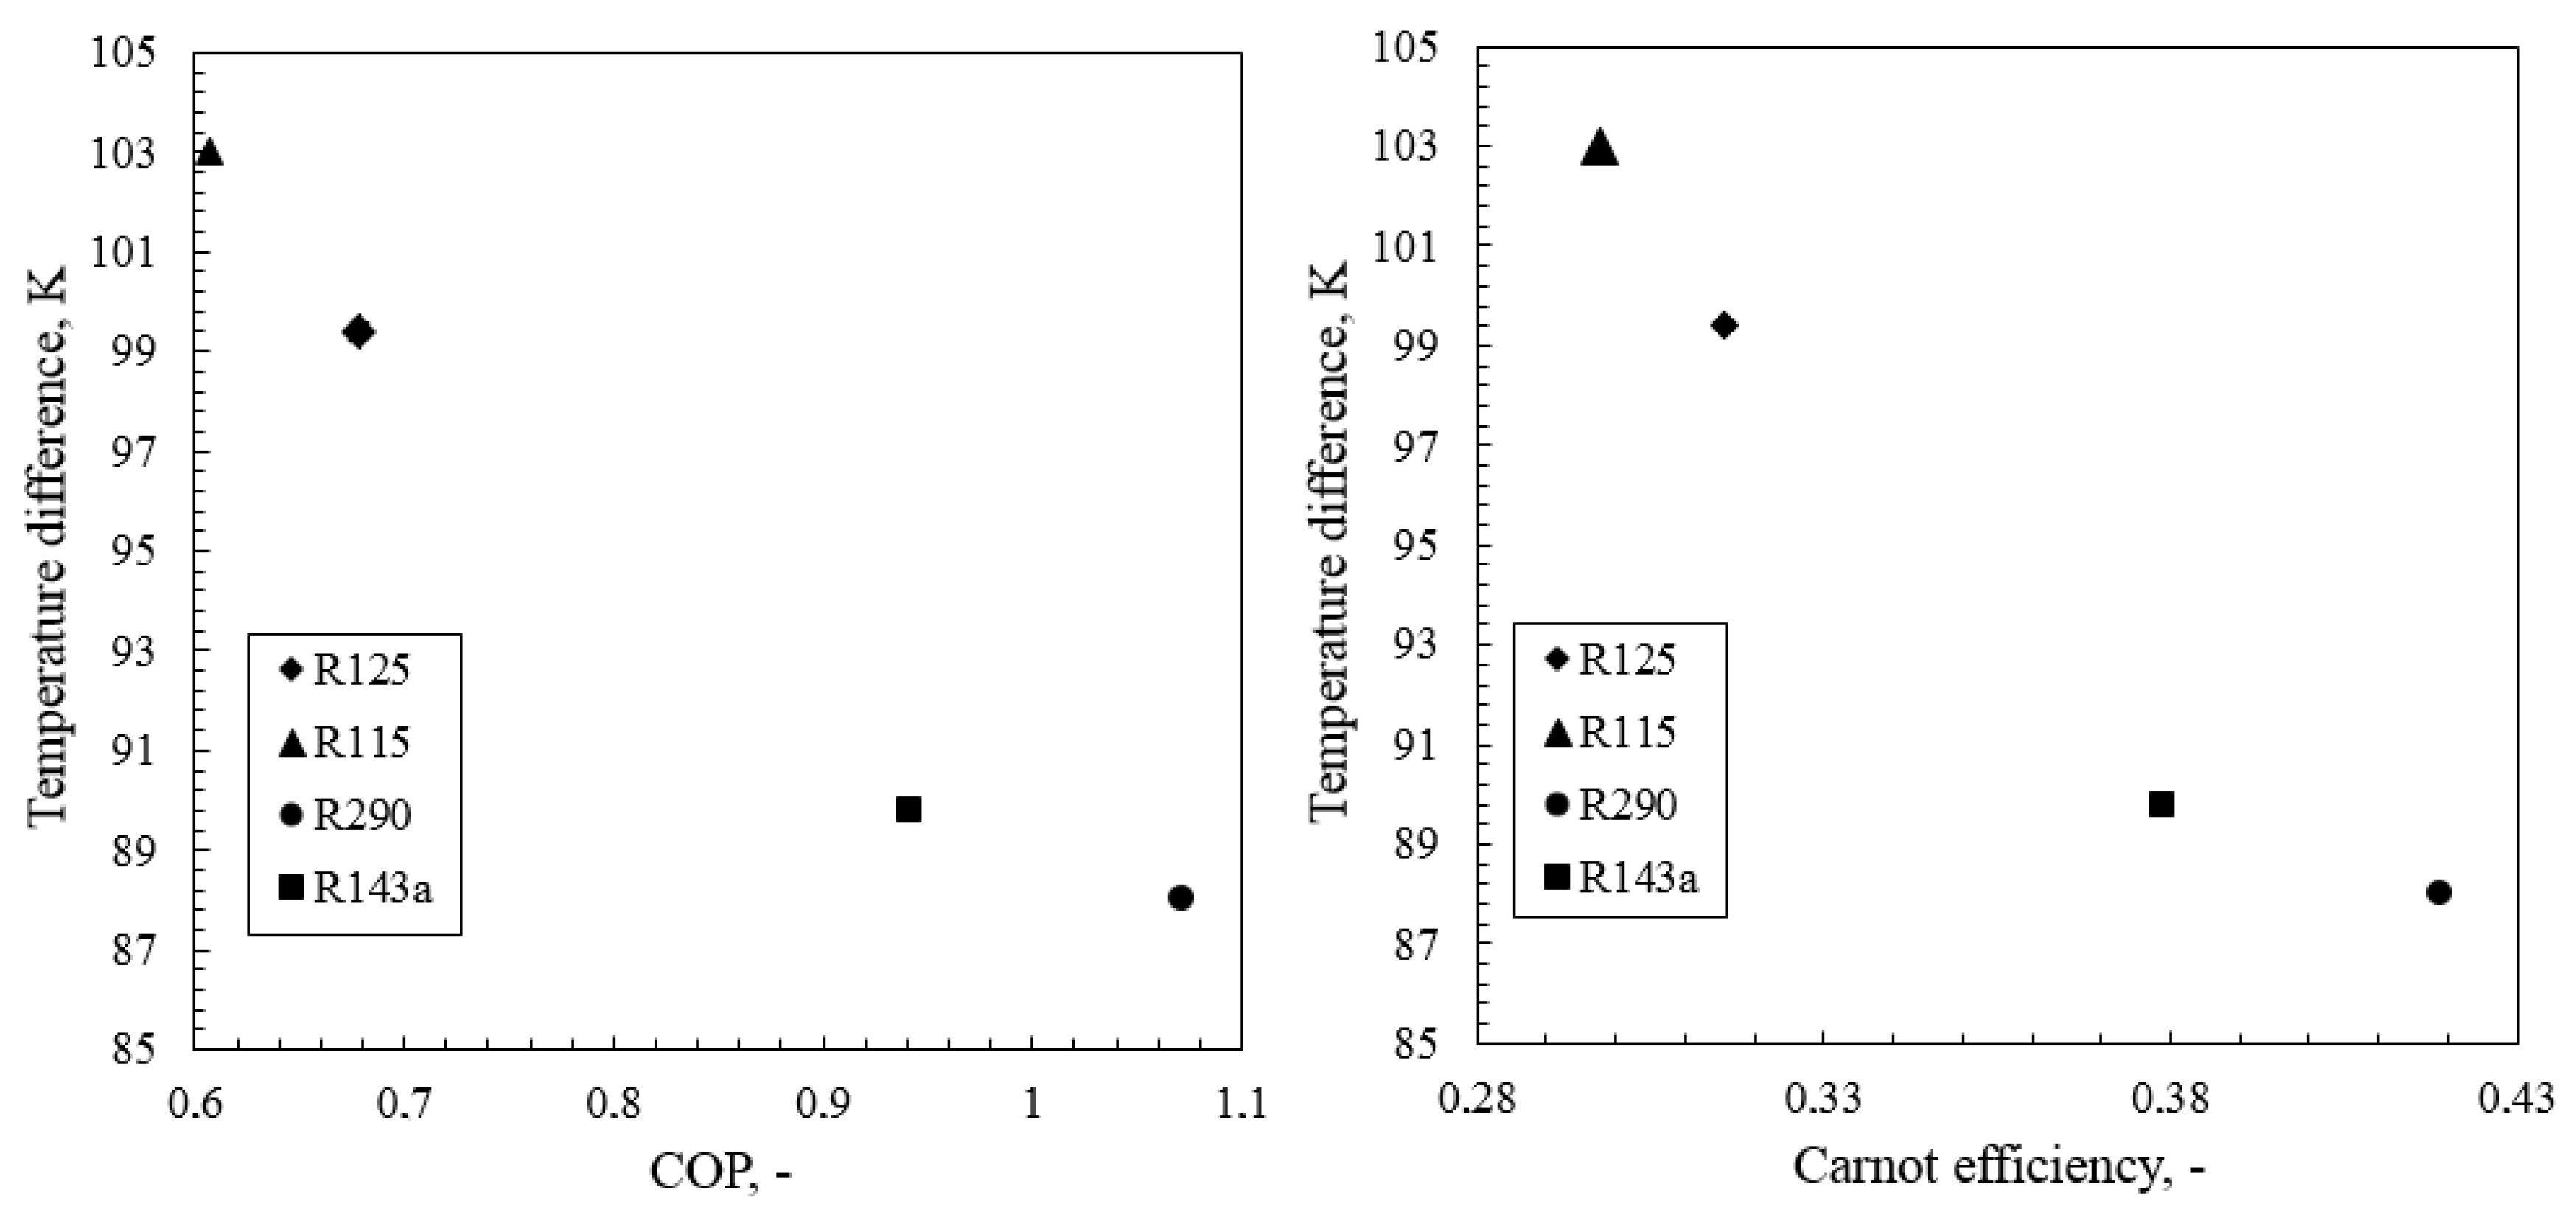
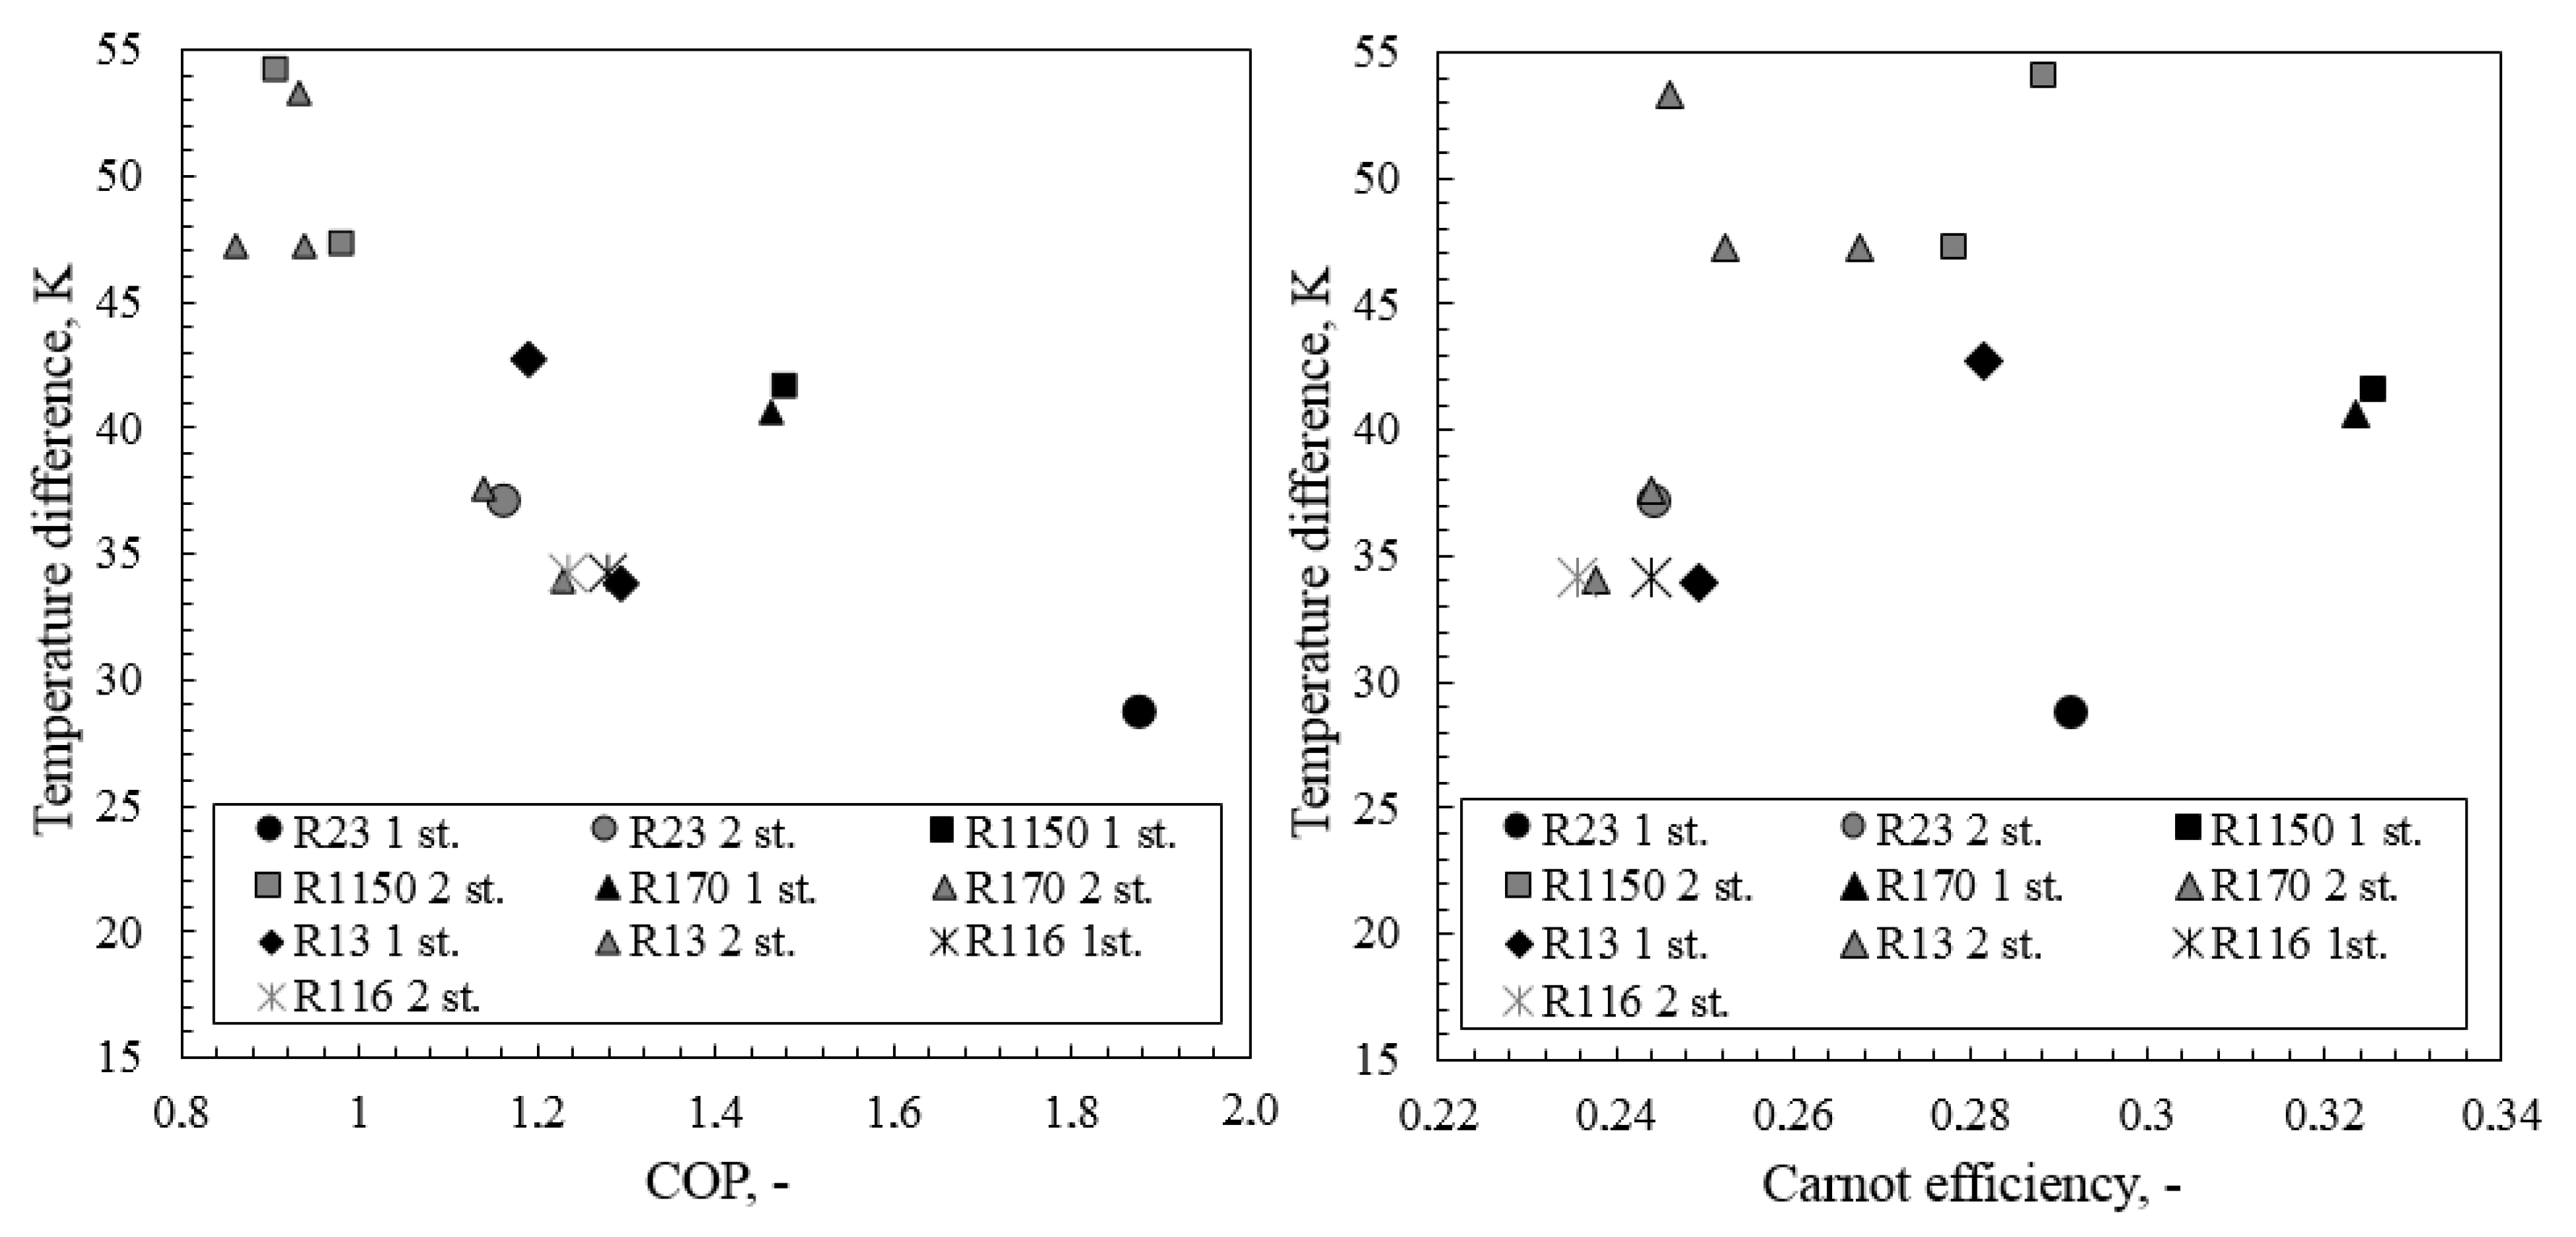
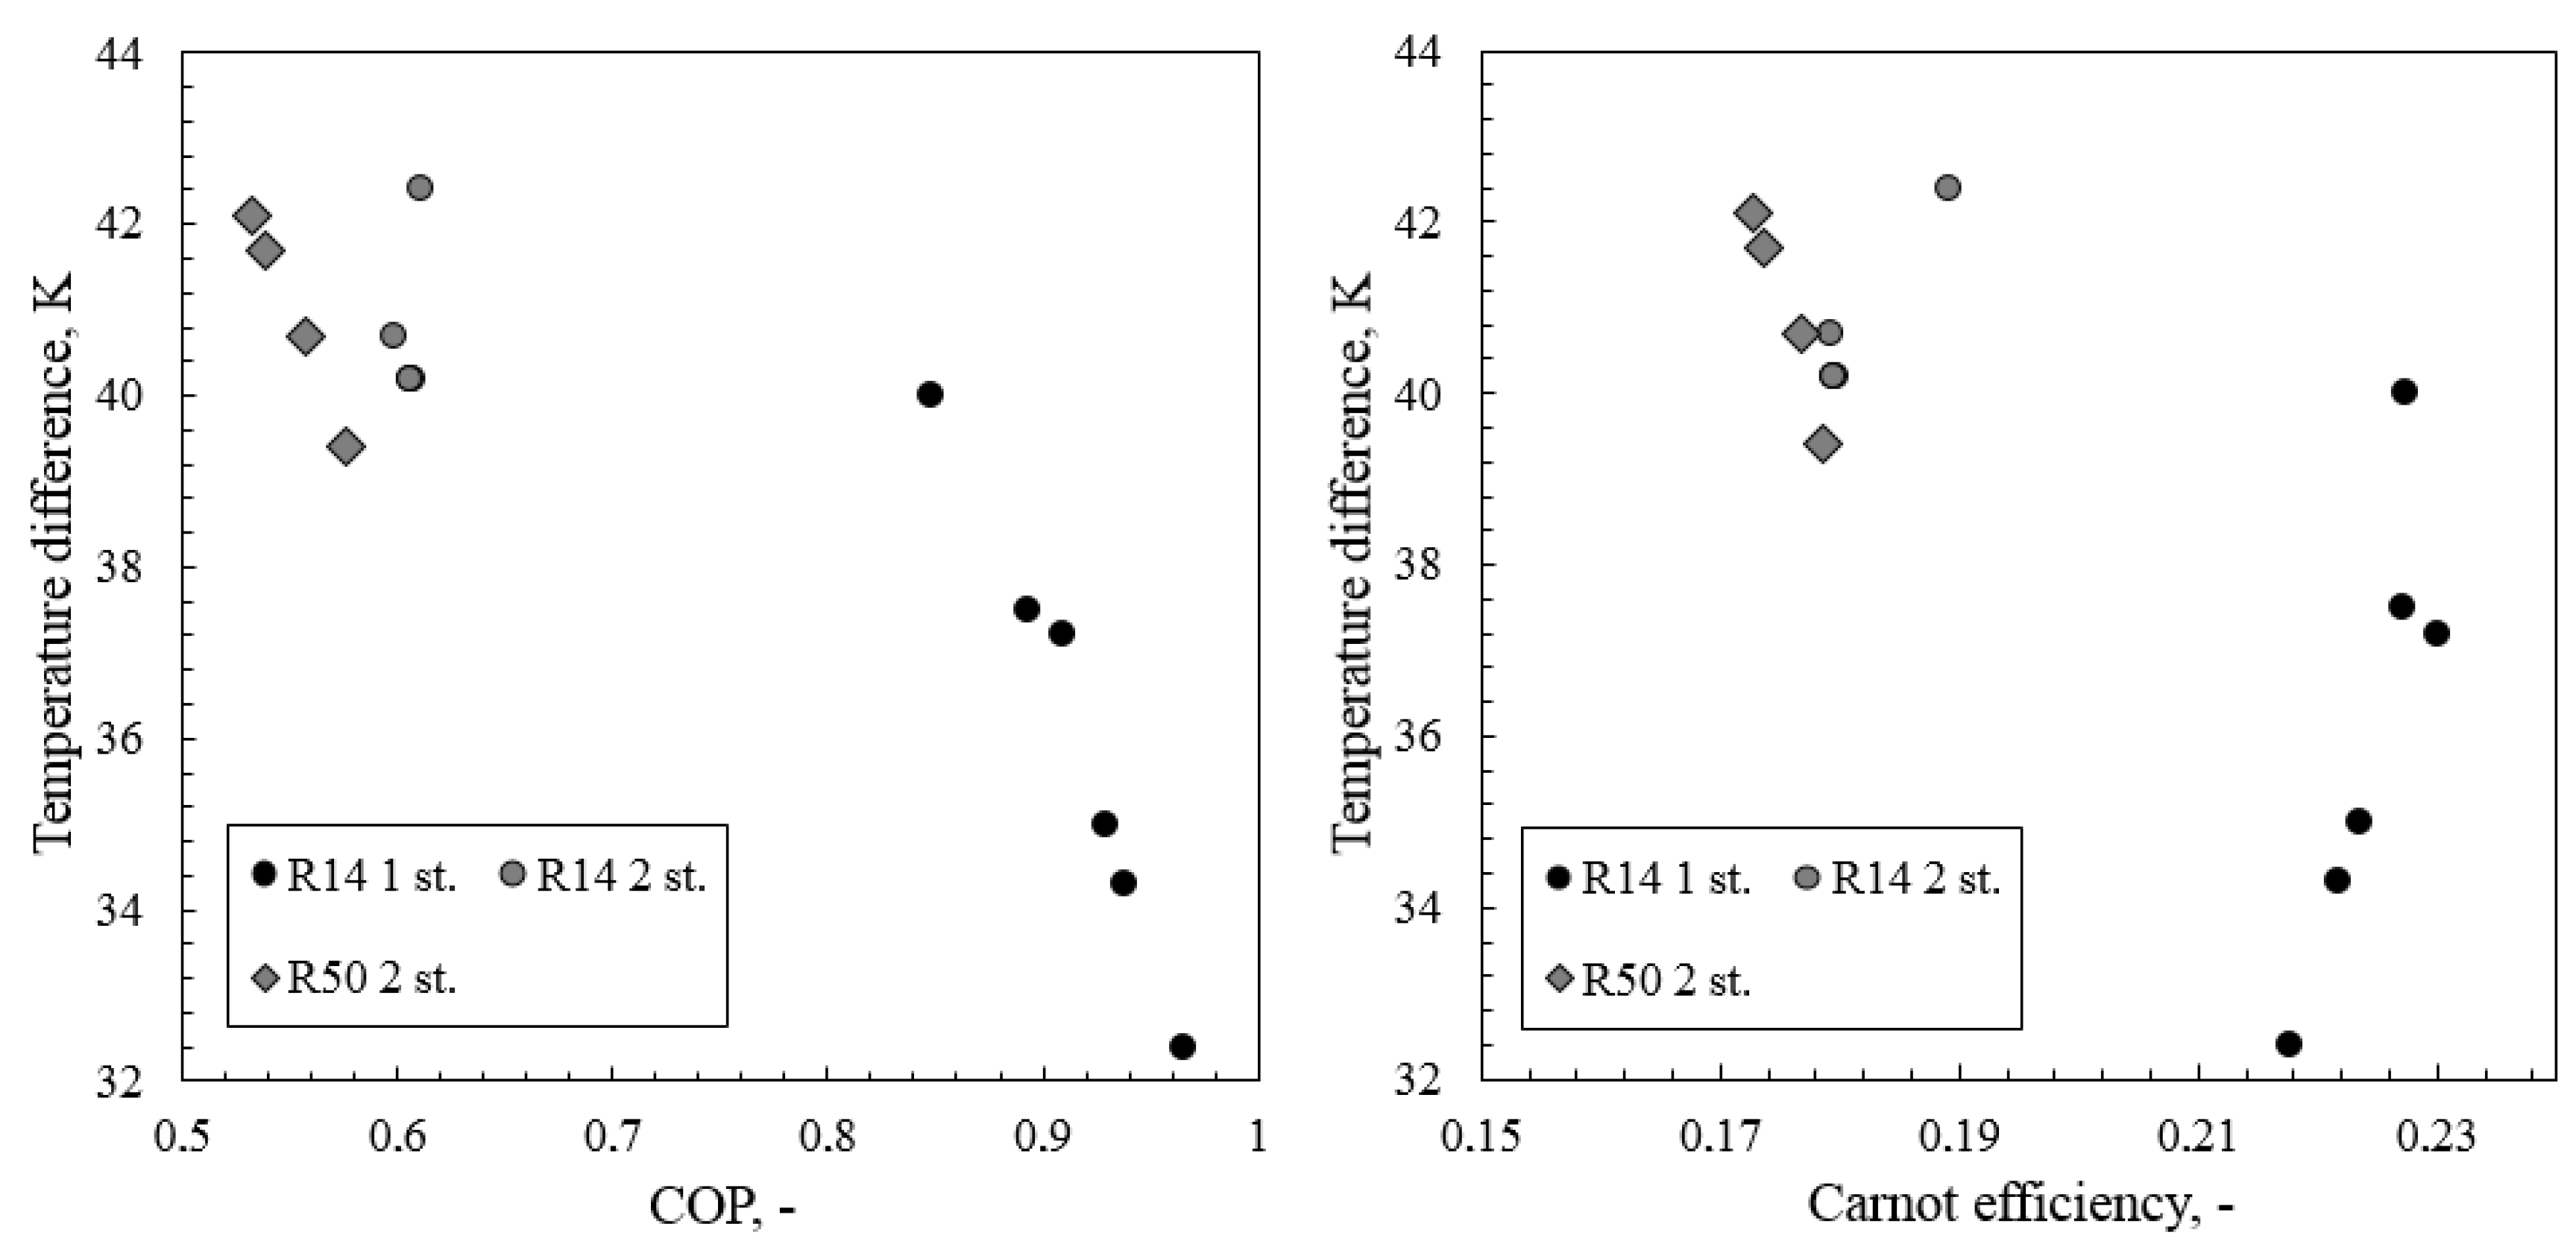
3. Results
- Limit the cooling power temperature to the saturation temperature corresponding to 1 bar. This approach is applicable only to R14 and would limit the cooling power temperature to 144.9 K.
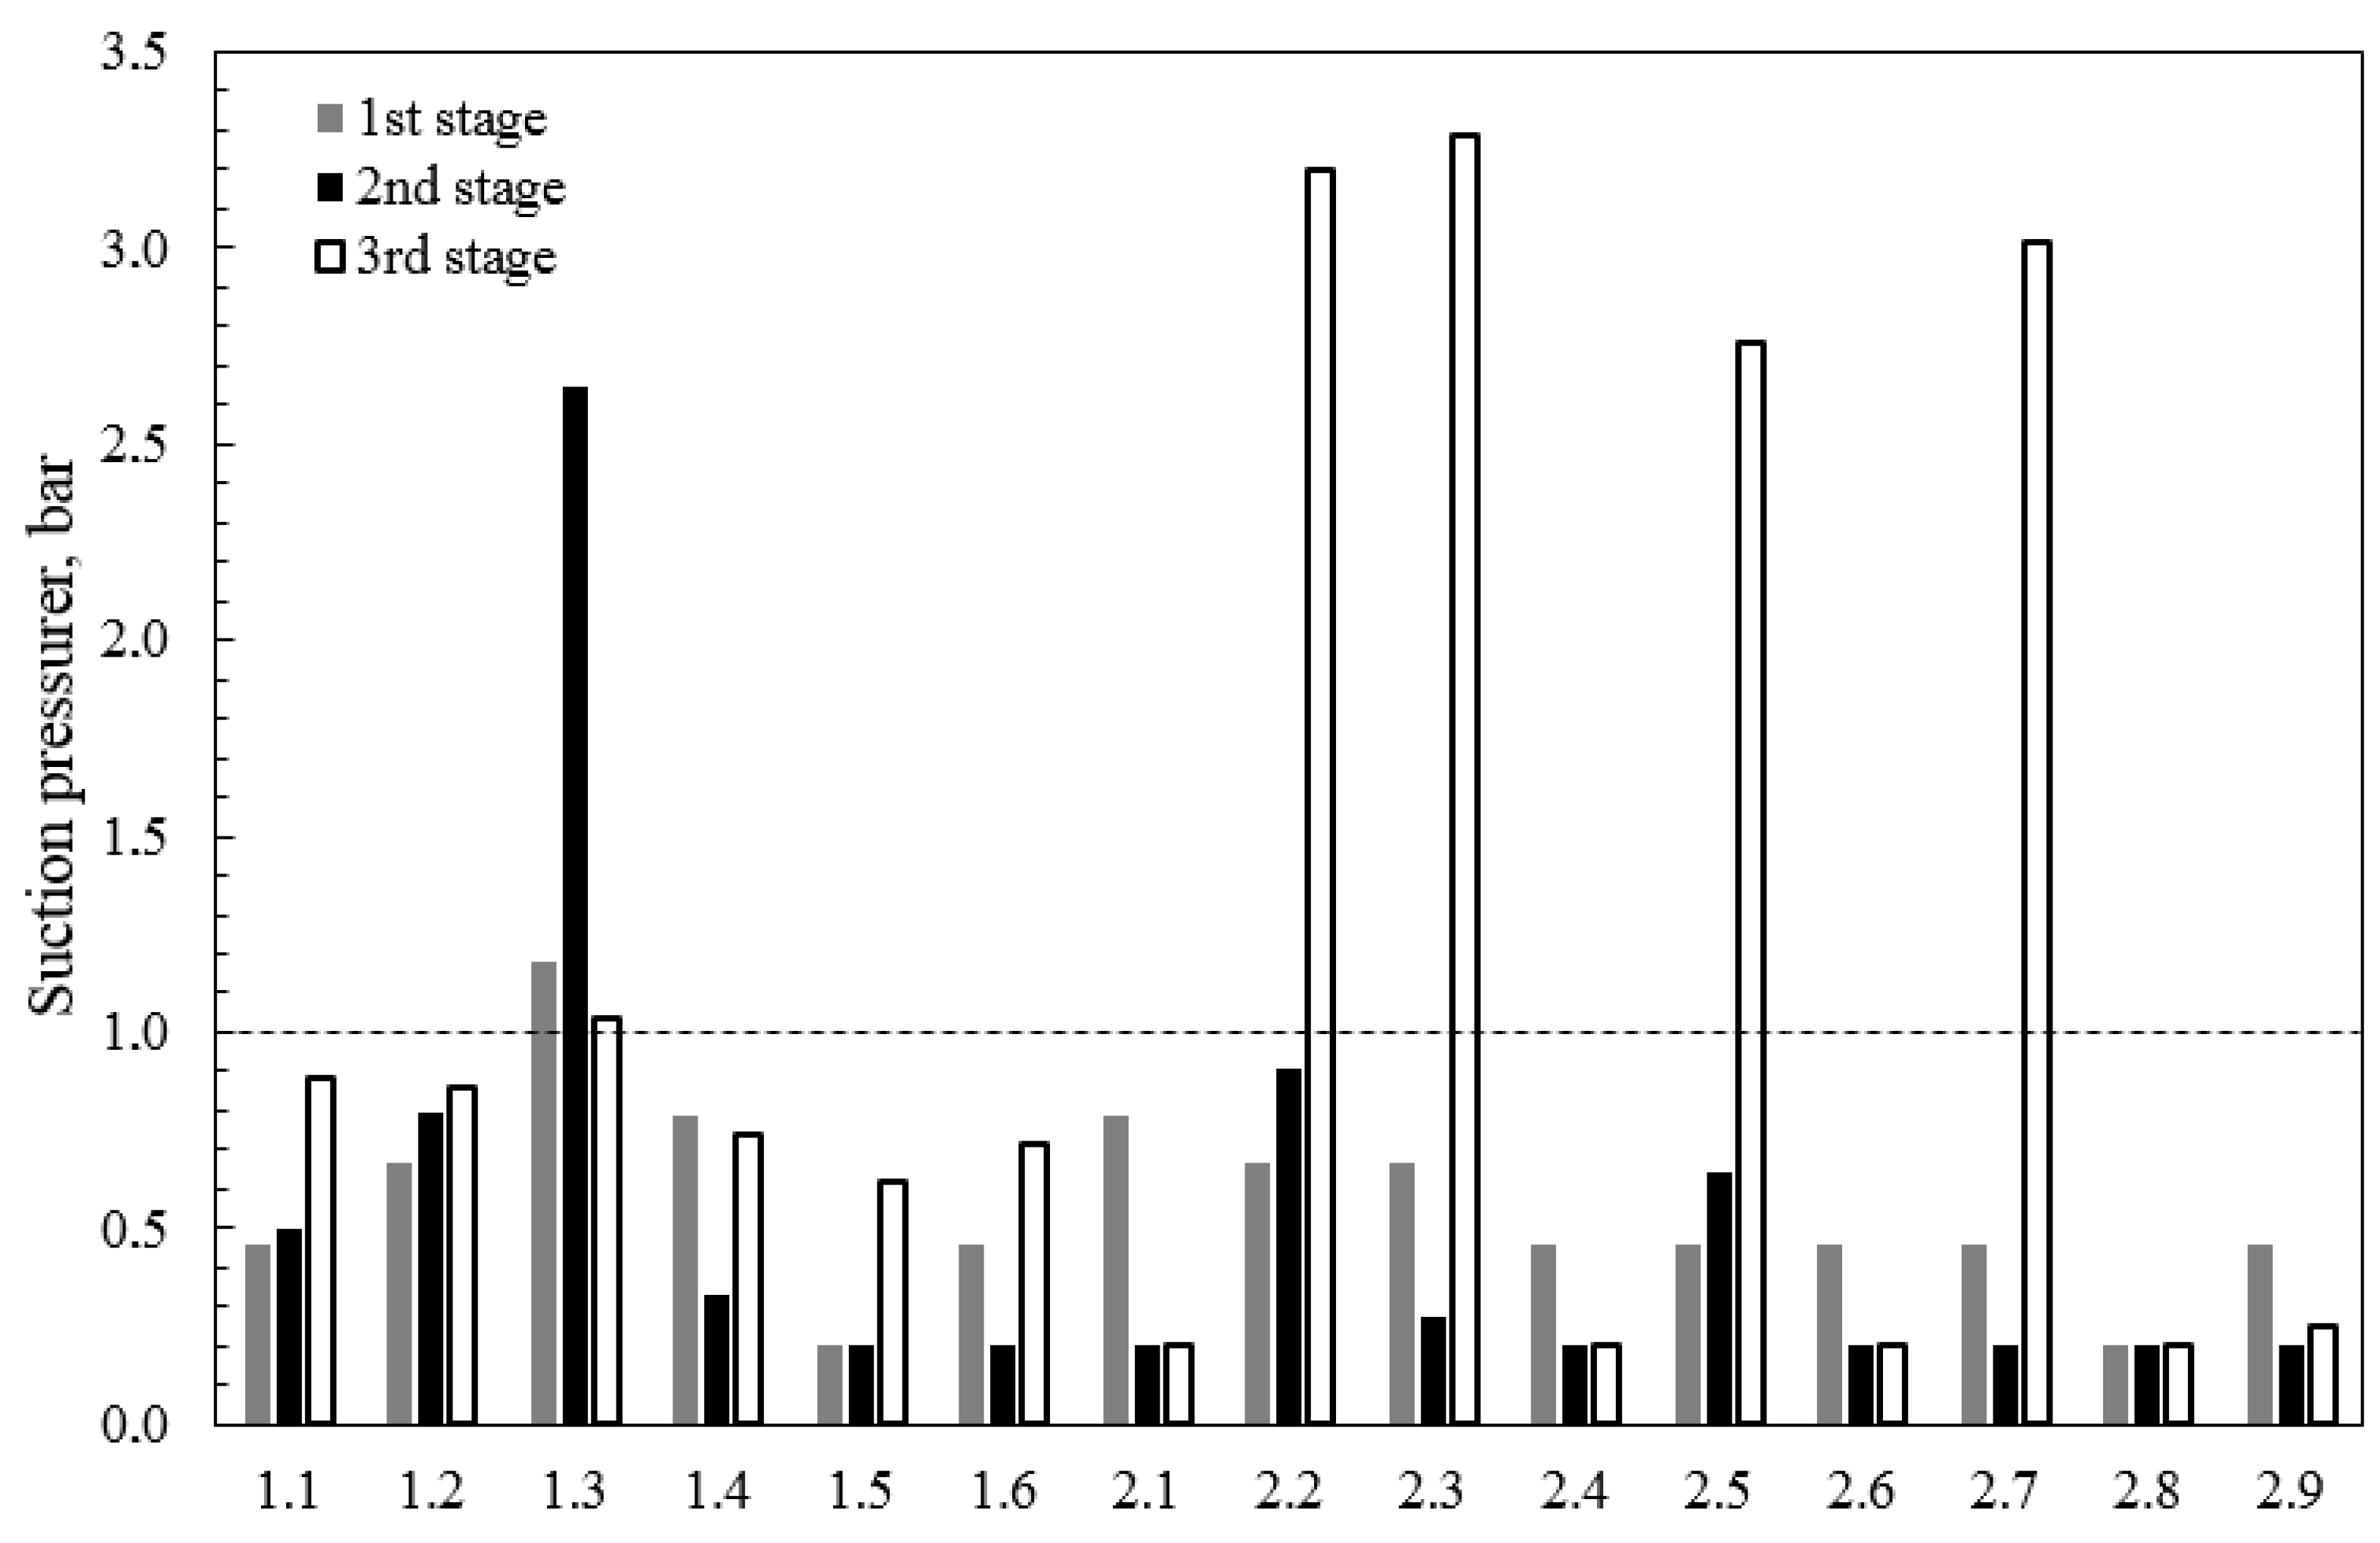
- Minimization of pressure drops. The assumed evaporator and recuperator pressure drops comprise 10% of the gas suction pressure. Therefore, minimizing these losses can increase the gas suction pressure by 20%.
- Increasing number of stages. Ultimately, the number of stages would probably need to increase to four. This significantly increases the complexity of the system and questions the legitimacy of the use of such systems.
4. Conclusions
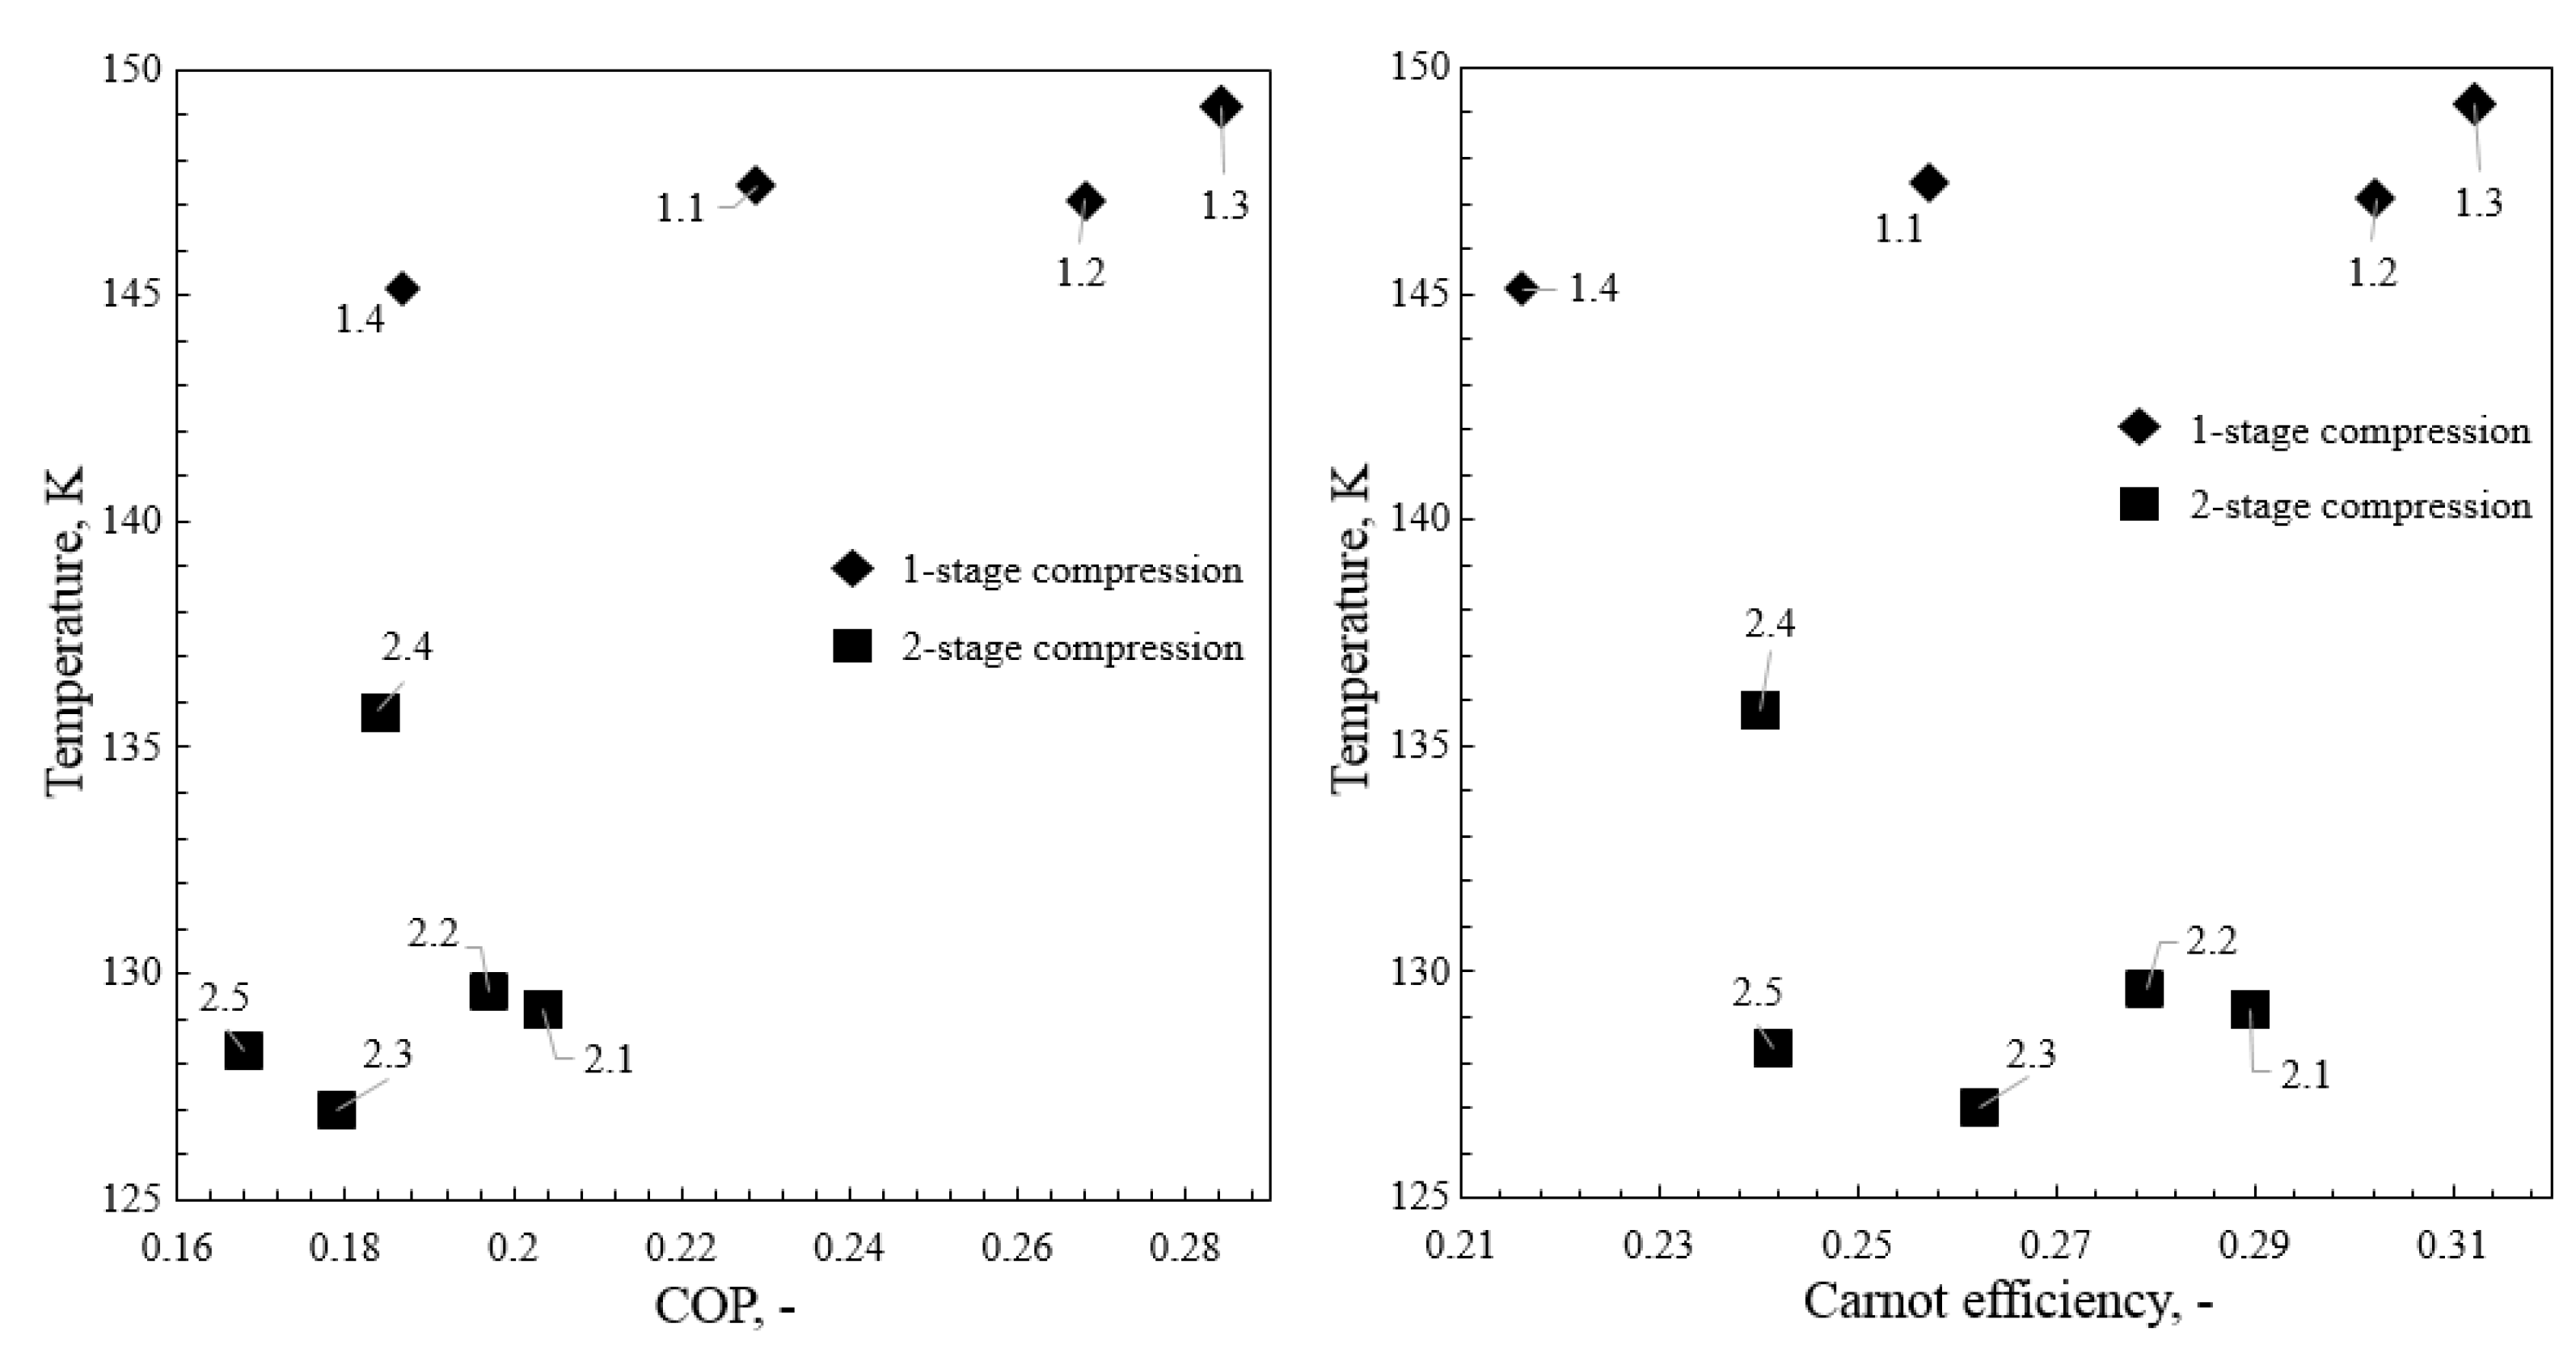
- A three-stage cascaded refrigeration system based on standard mass-produced refrigeration equipment can provide cooling power at a temperature of 130 K with COP greater than 0.17.
- The application of flammable refrigerants substantially improves the performance of the cryorefrigerator. The use of only non-flammable refrigerants is possible, but it puts significant limitations on the cooling power temperature and COP of the system.
- The use of two-stage compression at the second and third stages allows one to improve the performance. Furthermore, due to two-stage compression, it is possible to apply R50 as a third-stage refrigerant which requires the evaporating temperature in the second stage to be as low as 186 K.
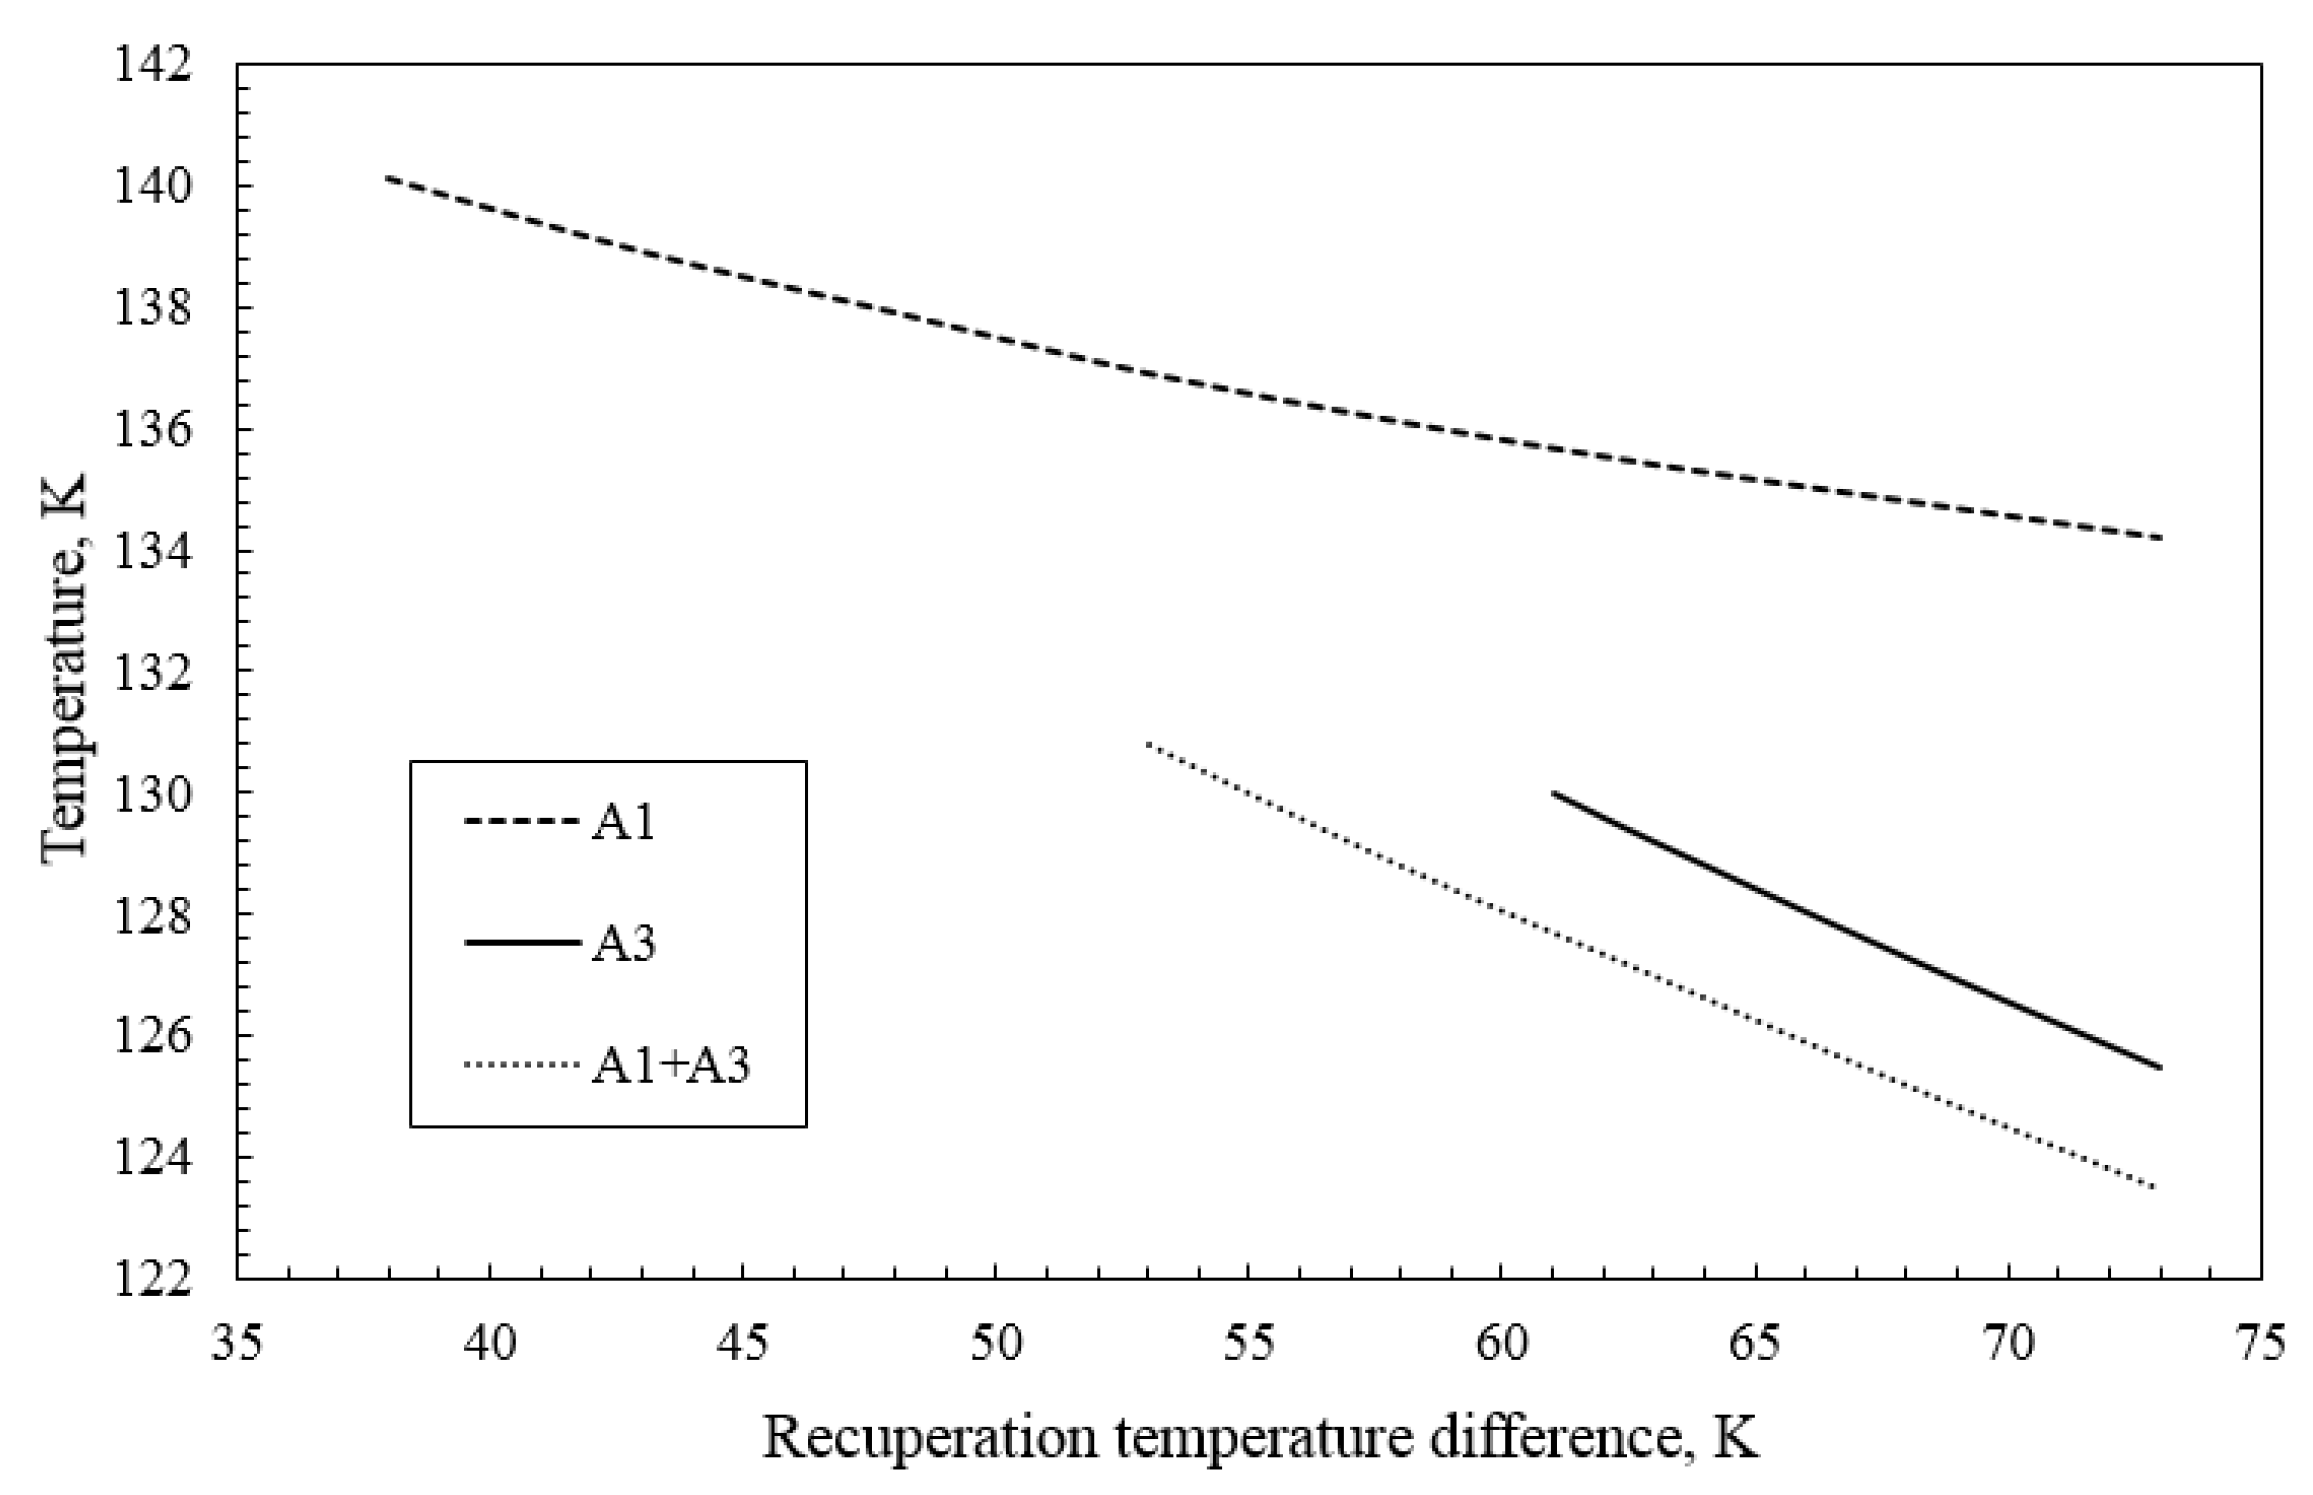
- The recuperation temperature difference is a vital parameter for the feasibility of systems analyzed using flammable refrigerants. It allows one to meet the strict requirements of refrigeration compressors.
- To reach a cooling power temperature of 130 to 150 K, the three-stage cascaded refrigerator usually operates with lower gas suction pressures than atmospheric. The requirement of operation at suction pressures of at least 1 bar will significantly reduce the feasibility and performance of the analyzed systems.
Author Contributions
Funding
Institutional Review Board Statement
Informed Consent Statement
Data Availability Statement
Conflicts of Interest
Abbreviations
| Symbol | Description | Unit |
| Latin | ||
| Power | W | |
| Q | Quality | - |
| p | Pressure | bar |
| s | Specific entropy | J kg K |
| T | Temperature | K |
| Greek | ||
| Heat of evaporation | kJ kg | |
| Pressure drop | bar | |
| Temperature difference | K | |
| Efficiency | - | |
| Abbreviations | ||
| COND | Condenser | |
| COP | Coefficient of Performance | |
| EVAP | Evaporator | |
| GAS COOL | Gas Cooler | |
| GWP | Global Warming Potential | |
| LNG | Liquified Natural Gas | |
| NG | Natural Gas | |
| ODP | Ozone depletion Potential | |
| REC | Recuperation | |
| Subscripts | ||
| 0 | refers to cooling power | |
| Carnot | refers to Carnot cycle | |
| comp | compressor | |
| cond | condenser | |
| cr | critical point | |
| ev | evaporator | |
| e-c | evaporator-condenser | |
| gascool | gas cooler | |
| HP | high pressure | |
| LP | low pressure | |
| M | refers to heat sink | |
| rec | recuperation | |
| s | isentropic | |
| TP | triple point | |
| sat | saturated |
References
- Rogala, Z.; Brenk, A.; Malecha, Z. Theoretical and Numerical Analysis of Freezing Risk during LNG Evaporation Process. Energies 2019, 12, 1426. [Google Scholar] [CrossRef]
- Barclay, M.; Gangaware, D.F.; Dalton, K.; Skrzypkowski, M. Thermodynamic Cycle Selection for Distributed Natural Gas Liquefaction. Aip Conf. Proc. 2016, 75, 710. [Google Scholar]
- Pauli, G. Refrigeration Loops in LNG Applications: Dynamic Simulation and Optimization Study. Ph.D. Thesis, Università di Pisa, Pisa, Italy, 2018. [Google Scholar]
- Kamalinejad, M.; Amidpour, M.; Naeynian, S.M.M. Thermodynamic design of a cascade refrigeration system of liquefied natural gas by appling mixed integer non-linear programming. Chin. J. Chem. Eng. 2015, 23, 998–1008. [Google Scholar] [CrossRef]
- Kamalinejad, M.; Amidpour, M.; Naenian, M.M. Optimal Synthesis of Cascade Refrigeration in Liquefied Natural Gas Cycles by Pinch-Exergy. J. Oil Gas Petrochem. Technol. 2013, 1, 29–44. [Google Scholar]
- Trigilio, A.; Bouza, A.; Scipio, S.D. Modelling and Simulation of Natural Gas Liquefaction Process. J. Nat. Gas Sci. Eng. 2016, 28, 672–690. Available online: https://www.intechopen.com/chapters/35292 (accessed on 13 June 2022).
- Ghorbani, B.; Hamedi, M.H.; Amidpour, M. Cascade refrigeration systems in integrated cryogenic natural gas process ( natural gas liquids ( NGL ), liquefied natural gas ( LNG ) and nitrogen rejection unit ( NRU )). Energy 2016, 115, 88–106. [Google Scholar] [CrossRef]
- Shariq, M.; Karimi, I.A.; Wood, D.A. Retrospective and future perspective of natural gas liquefaction and optimization technologies contributing to ef fi cient LNG supply: A review. J. Nat. Gas Sci. Eng. 2017, 45, 165–188. [Google Scholar]
- Lin, W.; Xiong, X.; Gu, A. Optimization and thermodynamic analysis of a cascade PLNG (pressurized liquefied natural gas) process with CO2 cryogenic removal. Energy 2018, 161, 870–877. [Google Scholar] [CrossRef]
- Kochunni, S.K.; Chowdhury, K. Comparison between reverse Brayton and Kapitza based LNG boil-off gas reliquefaction system using exergy analysis Comparison between reverse Brayton and Kapitza based LNG boil-off gas reliquefaction system using exergy analysis. In Proceedings of the IOP Conference Series: Materials Science and Engineering, 26th International Cryogenic Engineering Conference & International Cryogenic Materials Conference 2016, New Delhi, India, 7–11 March 2016; IOP Publishing Ltd.: Bristol, UK, 2016. [Google Scholar]
- Johnson, A.N.; Baltrusiatis, J.; William, L.; Johnson, N. Design and Control of a Cryogenic Multi-Stage Compression Refrigeration Process. Chem. Eng. Res. Des. 2017, 121, 360–367. [Google Scholar] [CrossRef]
- Yousef, A.M.; Eldrainy, Y.A.; El-maghlany, W.M.; Attia, A. Biogas upgrading process via low-temperature CO2 liquefaction and separation. J. Nat. Gas Sci. Eng. 2017, 45, 812–824. [Google Scholar] [CrossRef]
- Baranov, A.Y.; Malysheva, T.A. Turbo-refrigerators using for cooling the cryotherapeutic units. Procedia Eng. 2016, 152, 169–172. [Google Scholar] [CrossRef]
- Little, W.A.; Sapozhnikov, I. Low Cost Cryocoolers for Cryoelectronics; Springer: Berlin/Heidelberg, Germany, 1997; pp. 509–513. [Google Scholar]
- Kainin, S.; Ponchunchoovong, S.; Imsilp, U.; Singsee, S. Cryopreservation of Mekong catfish, Pangasius bocourti Sauvage, spermatozoa. Aquac. Res. 2014, 45, 859–867. [Google Scholar] [CrossRef]
- Choi, M.J.; Abduzukhurov, T.; Park, D.H.; Kim, E.J. Effects of Deep Freezing Temperature for Long-term Storage on Quality Characteristics and Freshness of Lamb Meat. Korean J. Food Sci. Anim. Resour. 2018, 38, 959–969. [Google Scholar] [CrossRef]
- Kumar, N.; Biswas, K. Cryomilling: An environment friendly approach of preparation large quantity ultra refined pure aluminium nanoparticles. J. Mater. Res. Technol. 2019, 8, 63–74. [Google Scholar] [CrossRef]
- Hou, Q.; Shi, Z.C.; Fan, R.H.; Ju, L.C. Cryomilling and Characterization of Metal/ceramic Powders. Key Eng. Mater. 2012, 512–515, 127–131. [Google Scholar] [CrossRef]
- Enayati, M.H. Nanocrystallization of Al Powder by Cryomilling Process. KONA Powder Part. J. 2017, 34, 207–212. [Google Scholar] [CrossRef]
- Zhou, F.; Witkin, D.; Nutt, S.R.; Lavernia, E.J. Formation of nanostructure in Al produced by a low-energy ball milling at cryogenic temperature. Mater. Sci. Eng. A 2004, 375–377, 917–921. [Google Scholar] [CrossRef]
- Romero-gomez, J.; Romero-gomez, M.; Ferreiro Garcia, R.; De Miguel Catoira, A. On board LNG reliquefaction technology: A comparative study. Pol. Marit. Res. 2014, 21, 77–88. [Google Scholar] [CrossRef]
- Xiong, L.; Peng, N. Optimization of UA of heat exchangers and BOG compressor exit pressure of LNG boil-off gas reliquefaction system using exergy analysis. In Proceedings of the IOP Conference Series: Materials Science and Engineering, Advances in Cryogenic Engineering: Proceedings of the Cryogenic Engineering Conference (CEC) 2015, Tucson, AZ, USA, 28 June–2 July 2015; IOP Publishing Ltd.: Bristol, UK, 2015. [Google Scholar]
- Sayyaadi, H.; Babaelahi, M. Exergetic Optimization of a Refrigeration Cycle for Re-Liquefaction of LNG Boil-Off Gas. Int. J. Thermodyn. 2010, 13, 127–133. [Google Scholar]
- Quack, H. Theory of cascade refrigeration. Aip Conf. Proc. 2012, 783, 1434. [Google Scholar]
- Kanizawa, F.T.; Ribatski, G. Modeling and analysis of a cascade cryogenic refrigerator. In Proceedings of the 22nd International Congress of Mechanical Engineering, Ribeirão Preto, SP, Brazil, 3–7 November 2013. [Google Scholar]
- Lee, S.; Choi, S.H.; Lee, Y.; Cha, K.; Young-myung, Y. The study on a new liquefaction cycle development for LNG plant. In Proceedings of the International Gas Union Research Conference, Seoul, Korea, 19–21 October 2011. [Google Scholar]
- Dorosz, P.; Chorowski, M.; Piotrowska, A. Performance of the one-stage Joule–Thomson cryocooler fed with a nitrogen–hydrocarbon mixture and built from mass-produced components made for the refrigeration industry. Int. J. Refrig. 2017, 82, 252–261. [Google Scholar] [CrossRef]
- Dorosz, P.; Piotrowska, A.; Pyrka, P.; Bogdan, P. Analysis of the LNG re-condensation system based on Joule-Thomson cooler. In Proceedings of the IOP Conference Series: Materials Science and Engineering, 27th International Cryogenics Engineering Conference and International Cryogenic Materials Conference 2018 (ICEC-ICMC 2018), Oxford, UK, 3–7 September 2018; IOP Publishing Ltd.: Bristol, UK, 2019. [Google Scholar]
- Piotrowska, A.; Chorowski, M.; Dorosz, P. Performance Analysis of Joule-Thomson Cooler Supplied with Gas Mixtures. In Proceedings of the IOP Conference Series: Materials Science and Engineering, 26th International Cryogenic Engineering Conference & International Cryogenic Materials Conference 2016, New Delhi, India, 7–11 March 2016; IOP Publishing Ltd.: Bristol, UK, 2017. [Google Scholar]
- Missimer, D. Refrigerant conversion of Auto-Refrigerating Cascade (ARC) systems. Int. J. Refrig. 1997, 20, 201–207. [Google Scholar] [CrossRef]
- Lee, C.; Yoo, J.; Jin, L.; Cha, J.; Jeong, S. Development of Cascade Non- F lammable Mixed Refrigerant Joule-Thomson Refrigerator for 100 K. In Proceedings of the 19th International Cryocooler Conference (ICC19), San Diego, CA, USA, 20–23 June 2016; pp. 385–394. [Google Scholar]
- Chakravarthy, V.; Wber, J.; Rashad, A.A.; Acharya, A.; Bonaquist, D. Oxygen liquefier using a mixed gas refrigeration cycle. In Proceedings of the ASME International Mechanical Engineering Congress, Washington, DC, USA, 15–21 November 2003. [Google Scholar]
- Lee, H.S.; Oh, S.T.; Yoon, J.I.; Lee, S.G.; Choi, K.H. Analysis of Cryogenic Refrigeration Cycle using Two Stage Intercooler. Defect Diffus. Forum 2010, 297–301, 1146–1151. [Google Scholar] [CrossRef]
- Qyyum, M.A.; Ali, W.; Long, N.V.D.; Khan, M.S.; Lee, M. Energy efficiency enhancement of a single mixed refrigerant LNG process using a novel hydraulic turbine. Energy 2017, 144, 968–976. [Google Scholar] [CrossRef]
- European Union. Regulation (EU) No 517/2014 of the Council on Fluorinated Greenhouse Gases and Repealing Regulation; Technical Report; European Union: Brussels, Belgium, 2014. [Google Scholar]
- Bock Kaltemaschinen. Operating Instructions Semi-Hermetic Motorcompressors. Technical Report 09963. Available online: https://www.gea.com/pl/productgroups/compressors/compressors-for-commercial-refrigeration/semi-hermetic-compressors/index.jsp (accessed on 12 May 2020).
- GEA-Bock. Semi-Hermetic GEA Bock Compressors; Technical Report; GEA-Bock: Frickenhausen, Germany, 2020. [Google Scholar]
- Frascold. Frascold Data Sheets Q4-21.1Y; Technical Report; Frascold: Rescaldina, Italy, 2020. [Google Scholar]
- Frascold. Frascold Data Sheets CXH01-80-298Y; Technical Report; Frascold: Rescaldina, Italy, 2020. [Google Scholar]
- Bitzer. Bitzer Semi-Hermetic Reciprocating Compressors Technical Data 4FES-5Y; Technical Report; Bitzer: Sindelfingen, Germany, 2020. [Google Scholar]
- Hundy, G.F.; Trott, A.R.; Welch, T.C. Refrigeration, Air Conditioning and Heat Pumps, 5th ed.; Butterworth-Heinemann: Oxford, UK, 2016. [Google Scholar]
- Refrigeration Manual Part 4—System Design; Technical Report; Emerson: St. Louis, MI, USA, 1969.
- Lemmon, E.W.; Bell, I.H.; Huber, M.L.; McLinden, M.O. NIST Standard Reference Database 23: Reference Fluid Thermodynamic and Transport Properties-REFPROP; Version 10.0; National Institute of Standards and Technology: Gaithersburg, MD, USA, 2018.
- Bell, I.H.; Wronski, J.; Quoilin, S.; Lemort, V. Pure and Pseudo-pure Fluid Thermophysical Property Evaluation and the Open-Source Thermophysical Property Library CoolProp. Ind. Eng. Chem. Res. 2014, 53, 2498–2508. [Google Scholar] [CrossRef]
- Frascold Semihermetic Compressors. Available online: https://www.frascold.it/en/products/technologies/reciprocating_compressors (accessed on 12 May 2020).
- Dorin Semihermetic Compressors. Available online: https://www.dorin.com/en/catalogo-15/SE/ (accessed on 12 May 2020).
- Wang, H.; Chen, G.; M.Q., G.; Li, X. Performance comparison of single-stage mixed- refrigerant Joule–Thomson cycle and reverse Brayton cycle for cooling 80 to 120 K temperature- distributed heat loads. In Proceedings of the IOP Conference Series: Materials Science and Engineering, Advances in Cryogenic Engineering: Proceedings of the Cryogenic Engineering Conference (CEC) 2017 (Previous Edition: CEC-2015), Madison, WI, USA, 9–13 July 2017; IOP Publishing Ltd.: Bristol, UK, 2017. [Google Scholar] [CrossRef]
- Lee, C.; Jin, L.; Park, C.; Jeong, S. Design of non-flammable mixed refrigerant Joule-Thomson refrigerator for precooling stage of high temperature superconducting power cable Design of non-flammable mixed refrigerant Joule-Thomson refrigerator for precooling stage of high temperature superco. Cryogenics 2017, 81, 14–23. [Google Scholar] [CrossRef]
- Kruthiventi, S.A.I.S.; Govindharasu, N.; Rao, Y.V.H. An identification of best mixture composition for the Joule-Thomson refrigerator operating at 90 K. Int. J. Mech. Prod. Eng. Res. Dev. 2018, 8, 467–476. [Google Scholar]
- Kochenburger, T.M.; Oellrich, L.R. Evaluation of a two-stage mixed refrigerant cascade for HTS cooling below 60 K. Phys. Procedia 2015, 67, 227–232. [Google Scholar] [CrossRef]
- Jensen, J.B.; Skogestad, S. Optimal Operation of a Simple Lng Process. IFAC Proc. Vol. 2006, 39, 241–246. [Google Scholar] [CrossRef]
- Lee, J.; Oh, H.; Jeong, S. Investigation of neon—nitrogen mixed refrigerant Joule—Thomson cryocooler operating below 70 K with precooling at 100 K. Cryogenics 2014, 61, 55–62. [Google Scholar] [CrossRef]
- Chang, H.m. A thermodynamic review of cryogenic refrigeration cycles for liquefaction of natural gas. Cryogenics 2015, 72, 127–147. [Google Scholar] [CrossRef]


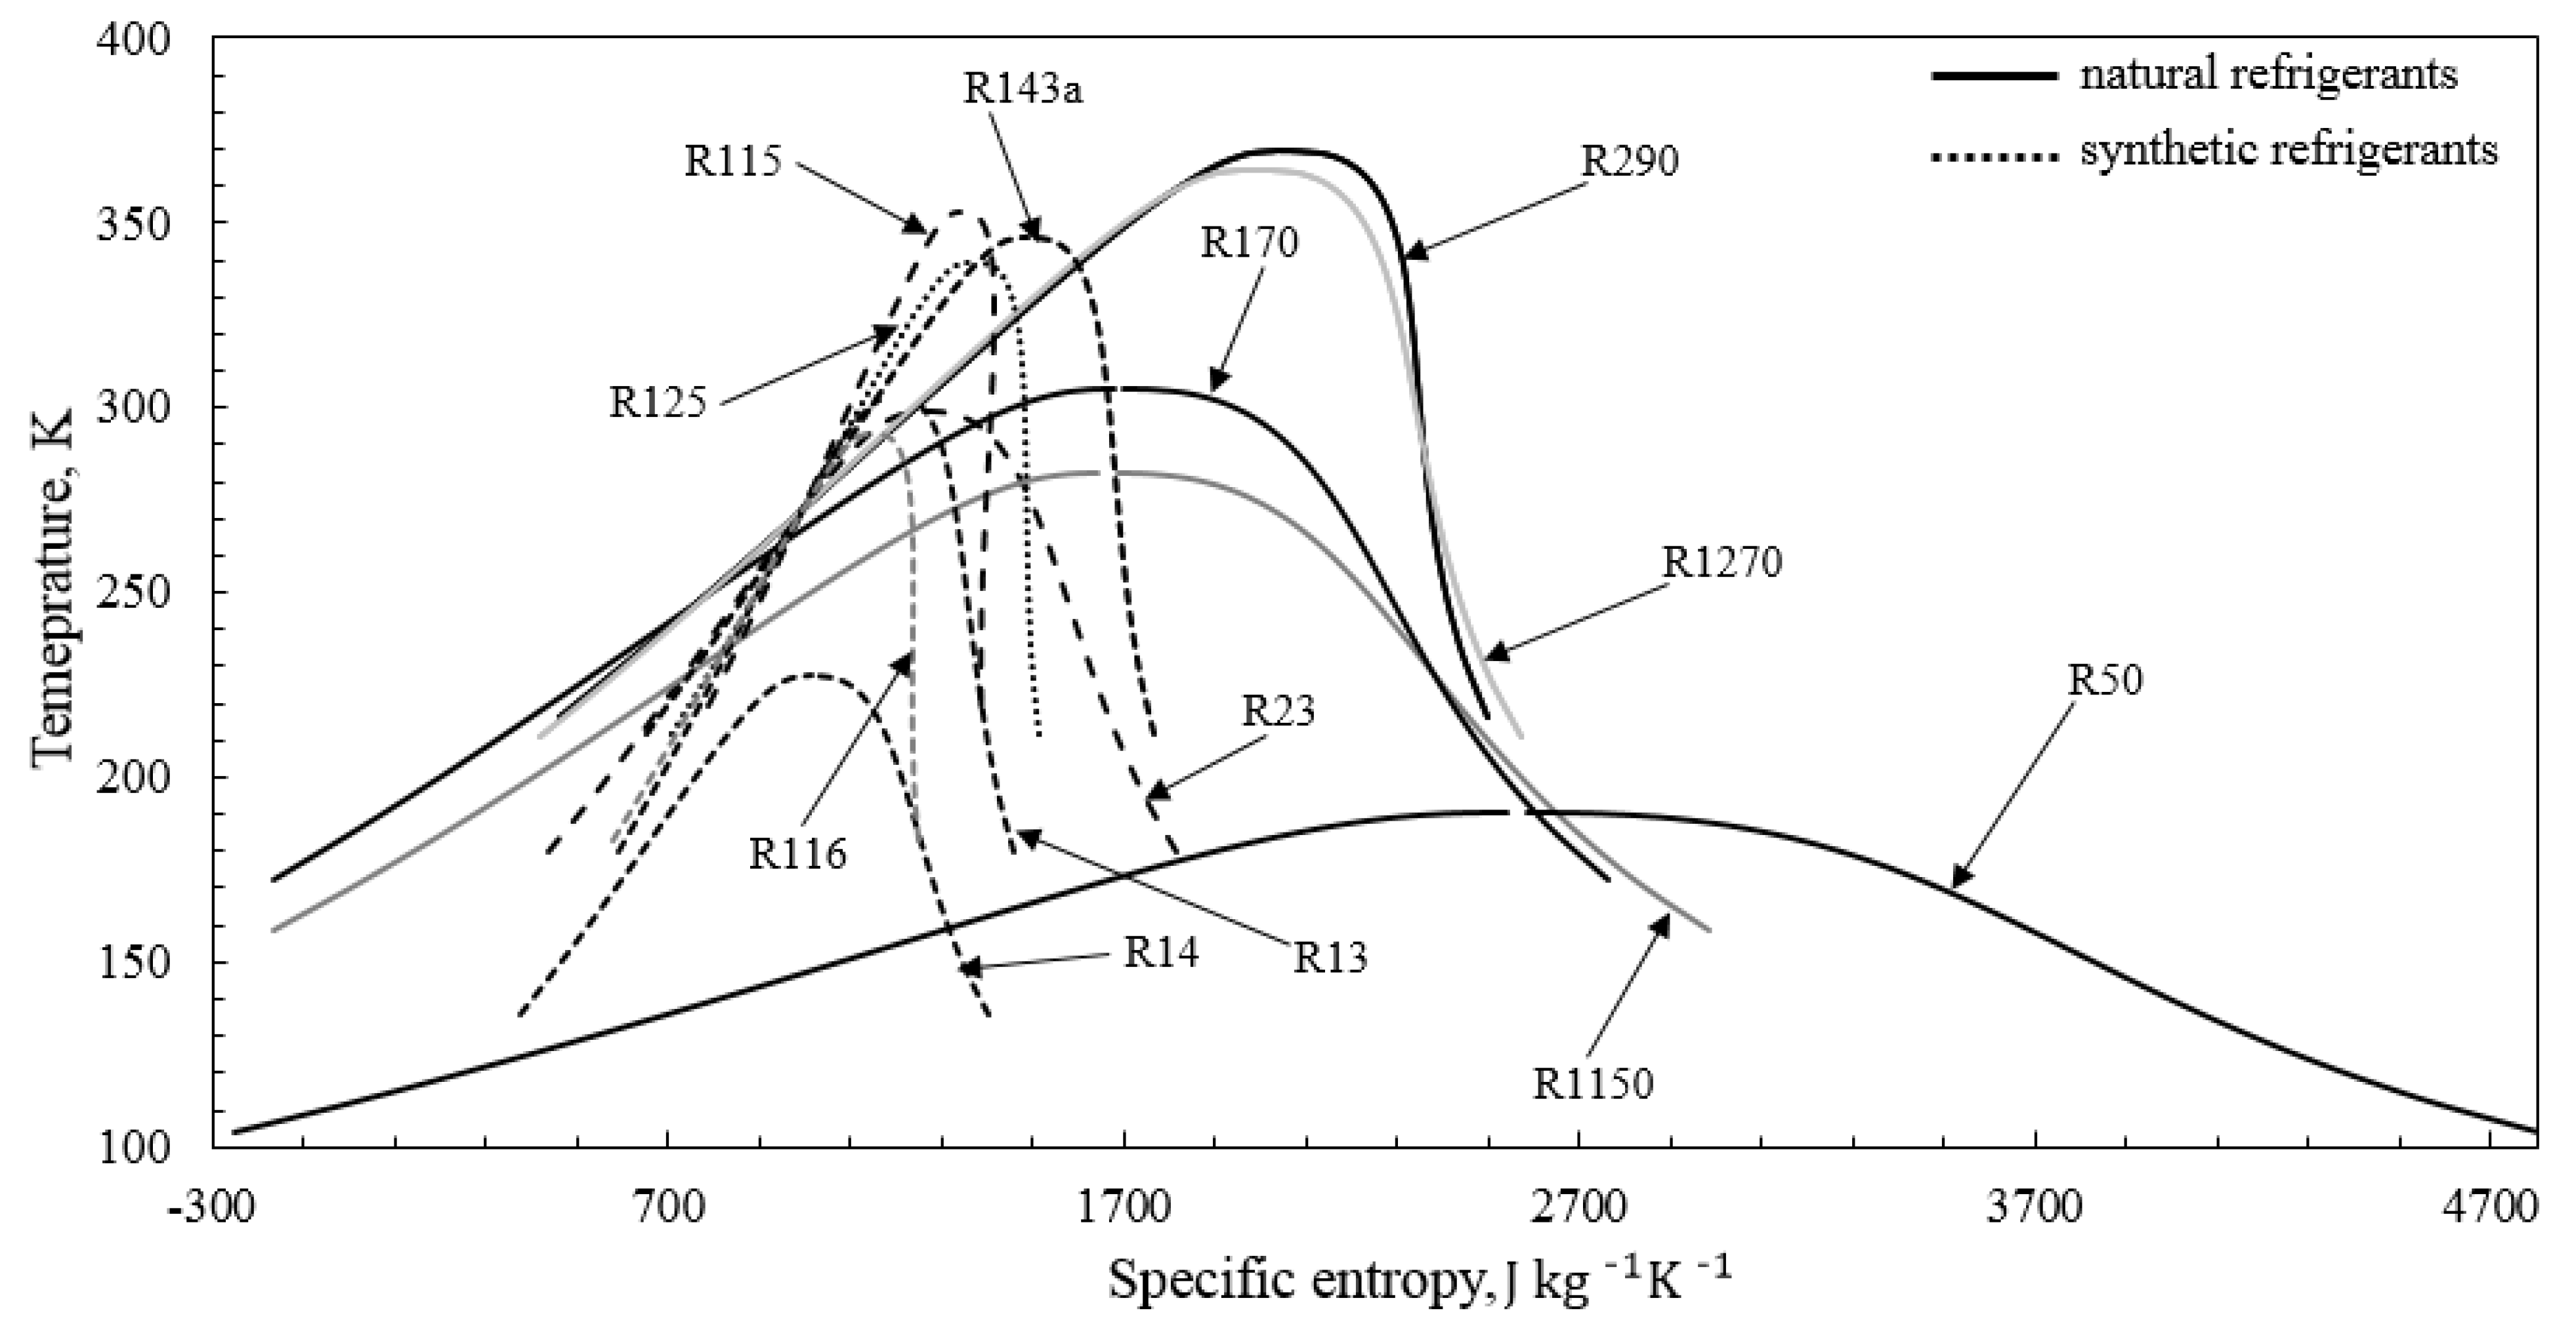
| Fluid | Type | ODP | GWP | FC | (1 bar) | (0.2 bar) | (30 bar) | (1 bar) | |||
|---|---|---|---|---|---|---|---|---|---|---|---|
| - | - | - | - | - | K | K | K | K | bar | kJ kg | K |
| R1270 | HO | 0 | 1.8 | A3 | 225.2 | 195.3 | 341.8 | 364.2 | 45.6 | 439 | 87.953 |
| R290 | HC | 0 | 3.3 | A3 | 230.7 | 199.8 | 350.9 | 369.9 | 42.5 | 426 | 85.525 |
| R125 | HFC | 0 | 3170 | A1 | 224.8 | 196.9 | 330.6 | 339.2 | 36.2 | 164 | 172.52 |
| R116 | PFC | 0 | 12,200 | A1 | 194.8 | 173.6 | 292.4 | 293 | 30.5 | 117 | 173.1 |
| R1150 | HO | 0 | 3.7 | A3 | 169.2 | 146.1 | 260 | 282.4 | 50.4 | 483 | 103.989 |
| R170 | HC | 0 | 5.5 | A3 | 184.3 | 159.1 | 282.9 | 305.3 | 48.7 | 490 | 90.368 |
| R23 | HFC | 0 | 12,400 | A1 | 190.9 | 167.1 | 280.1 | 299.3 | 48.3 | 240 | 118.02 |
| R50 | HC | 0 | 28 | A3 | 111.5 | 95.1 | 177.3 | 190.6 | 46 | 511 | 90.694 |
| R14 | PFC | 0 | 7390 | A1 | 144.9 | 125.5 | 220 | 227.5 | 37.5 | 135 | 120 |
| Name | Symbol | Unit | Value | Reference |
|---|---|---|---|---|
| Heat rejection temperature | K | 313 | - | |
| Compressor isentropic efficiency | % | 70 | [37] | |
| Stage temperature difference | K | 5 | - | |
| Pressure drop in condensers | bar | 0.1 | [3] | |
| Pressure drop in evaporators | bar | 0.1 | [3] | |
| Pressure drop in gas coolers | bar | 0.2 | [3] | |
| Pressure drop in recuperator at high-pressure side | bar | 0.1 | [3] | |
| Pressure drop in recuperator at low-pressure side | bar | 0.1 | [3] |
| Point | T, K | p, bar | h, J kg | s, J kgK | Q, - |
|---|---|---|---|---|---|
| 2.1 | |||||
| 2.2 s | |||||
| 2.2 | |||||
| 2.3 | |||||
| 2.4 s | |||||
| 2.4 | |||||
| 2.5 | |||||
| 2.6 | |||||
| 2.7 | |||||
| 2.8 | |||||
| 2.9 |
| Name | Symbol | Unit | Value | References |
|---|---|---|---|---|
| Recuperation temperature difference | K | up to 73 | [36,38] | |
| Suction pressure | bar | 0.2–19 bar | [41,42] | |
| Discharge pressure | bar | —30 bar | [36,37,38,39,40] |
| 1st Stage | 2nd Stage | 3rd Stage | COP | FC | |||
|---|---|---|---|---|---|---|---|
| 1.1 | R125 | R23 | R14 | 0.229 | 0.257 | 147.4 | A1 |
| 1.2 | R290 | R170 | R14 | 0.268 | 0.302 | 147.1 | A1 + A3 |
| 1.3 | R1270 | R1150 | R14 | 0.284 | 0.312 | 149.2 | A1 + A3 |
| 1.4 | R125 | R116 | R14 | 0.187 | 0.216 | 145.1 | A1 |
| 2.1 | R290 | R1150 | R50 | 0.204 | 0.290 | 129.2 | A3 |
| 2.2 | R290 | R170 | R50 | 0.197 | 0.279 | 129.6 | A3 |
| 2.3 | R125 | R1150 | R50 | 0.179 | 0.262 | 127 | A1 + A3 |
| 2.4 | R125 | R23 | R14 | 0.184 | 0.240 | 135.8 | A1 |
| 2.5 | R125 | R170 | R50 | 0.168 | 0.242 | 128.3 | A1 + A3 |
Publisher’s Note: MDPI stays neutral with regard to jurisdictional claims in published maps and institutional affiliations. |
© 2022 by the authors. Licensee MDPI, Basel, Switzerland. This article is an open access article distributed under the terms and conditions of the Creative Commons Attribution (CC BY) license (https://creativecommons.org/licenses/by/4.0/).
Share and Cite
Rogala, Z.; Kwiatkowski, A. Modeling of a Three-Stage Cascaded Refrigeration System Based on Standard Refrigeration Compressors in Cryogenic Applications above 110 K. Modelling 2022, 3, 255-271. https://doi.org/10.3390/modelling3020017
Rogala Z, Kwiatkowski A. Modeling of a Three-Stage Cascaded Refrigeration System Based on Standard Refrigeration Compressors in Cryogenic Applications above 110 K. Modelling. 2022; 3(2):255-271. https://doi.org/10.3390/modelling3020017
Chicago/Turabian StyleRogala, Zbigniew, and Adrian Kwiatkowski. 2022. "Modeling of a Three-Stage Cascaded Refrigeration System Based on Standard Refrigeration Compressors in Cryogenic Applications above 110 K" Modelling 3, no. 2: 255-271. https://doi.org/10.3390/modelling3020017
APA StyleRogala, Z., & Kwiatkowski, A. (2022). Modeling of a Three-Stage Cascaded Refrigeration System Based on Standard Refrigeration Compressors in Cryogenic Applications above 110 K. Modelling, 3(2), 255-271. https://doi.org/10.3390/modelling3020017