Article

Modeling and Experimental Verification of Plasma Jet Electromagnetic Signals

1
Department of Theoretical and Experimental Electrical Engineering, Brno University of Technology, Technická 12, 616 00 Brno, Czech Republic
2
SIX Research Center, Brno University of Technology, Technická 12, 616 00 Brno, Czech Republic
*
Author to whom correspondence should be addressed.
Modelling 2022, 3(1), 70-91; https://doi.org/10.3390/modelling3010005
Submission received: 14 December 2021 / Revised: 10 January 2022 / Accepted: 20 January 2022 / Published: 27 January 2022

Abstract

:
Herein, we discuss the modeling and verification of RF sensed signals in a simple plasma channel (plasma jet) at the generator frequency of f = 13.56 MHz, assuming plasma discharge at atmospheric pressure. The actual experiment was preceded by a basic numerical analysis and evaluation of several variants of the geometric/numerical model of a simple plasma channel formed in a glass capillary chamber; this step was performed with different electrode configurations. The analyses also included the impact of the location of the sensing element (i.e., the antenna) on the resulting evaluated electromagnetic signal. Furthermore, a numerical model with concentrated parameters facilitated a comparative analysis centered on the impact of plasma concentration and composition in the monitored electromagnetic RF spectrum of the channel. The theoretical outputs were verified via experiments and compared. This methodology finds use in the radio-frequency evaluation of plasma parameters in both simple capillary nozzles and more complex, slit-designed plasma chambers.

1. Introduction

In the last two to three decades, plasma discharges generated at atmospheric pressure have become increasingly more applicable in various industries, mainly because they offer significant advantages against the traditional low-pressure technologies. The benefits include markedly faster and more effective technological procedures, substantially reduced operational and investment costs, and significantly enhanced variability in designing and configuring plasma sources. Such properties and capabilities invite the ever-growing interest of research teams worldwide in the development of atmospheric-pressure plasma sources suitable for both broad use and special applications. To select a plasma source conveniently usable in a concrete case, we need to know exactly the attributes of the plasma produced by that source. Thus, a large number of diagnostic methods are required to define the properties of the plasma from various perspectives [1,2,3,4,5,6,7,8,9,10].
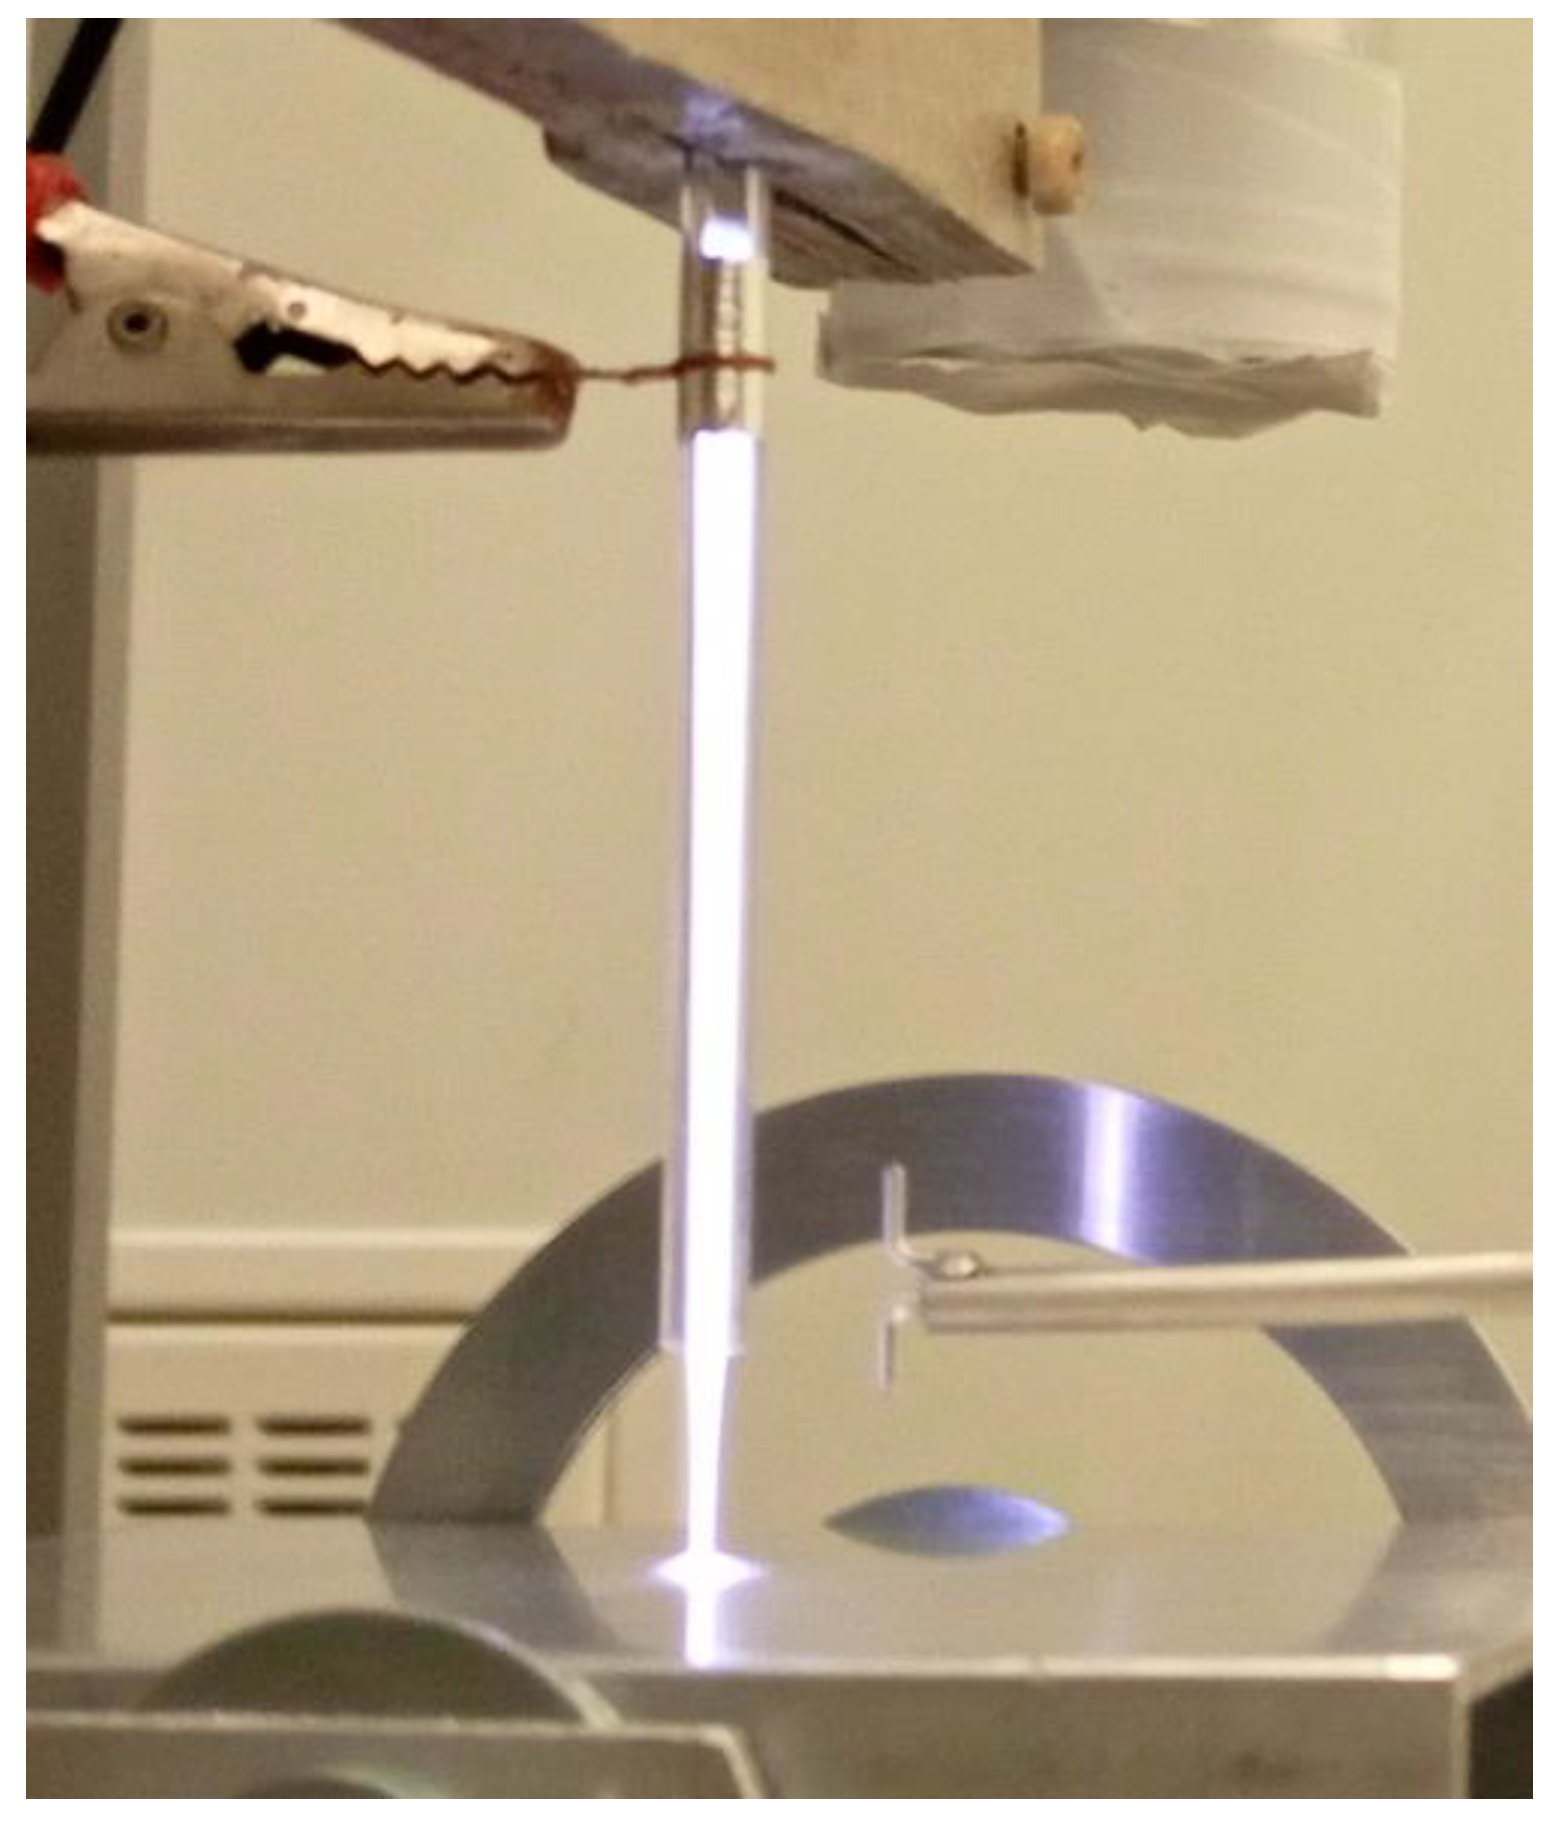
One of the diagnostic approaches is embodied in the analysis of radio frequency (RF) electromagnetic signals, a procedure often utilized in tasks such as the diagnostics of microplasma [5,6,7,8], which generates high-frequency (HF) signals characterized by specific spectra. The actual discharge creates a compound signal [5,6,7,8] capable of being theoretically described and modeled [11,13,14,15,16,17,18,19,20]. To verify the functionality of the method, we employed an atmospheric-pressure plasma source, namely, a plasma pencil (Figure 1) similar to that modeled in report [11]. This pencil consisted of an argon-carrying quartz capillary encircled by a thin electrode ring that was connected to an RF generator (operating at the frequency of 13.56 MHz and output of 50 Ω) over an impedance matching element. The discharge that forms inside the capillary is blown out into an external medium, where, in our configuration, it burns against an oppositely positioned grounded planar electrode. The discharge is of the markedly non-isothermal type, the properties of which are characterized within, for example, articles [19,20,21]. A set of selected plasma parameters that are significant in terms of the electromagnetic field model created and discussed herein is presented in Table 1. The functionality of the proposed methodology and the actual models of the field [22,23,24,25,26,27,28,29,30] was verified by measuring the electromagnetic field irradiated by the plasma jet, with the plasma located close to the jet orifice; the actual measurement was performed using a suitably designed dipole antenna [5,6,7,8] linked to a frequency analyzer.
Before starting the experiment, we carried out a basic numerical analysis of several versions of the geometrical/numerical model of the simple plasma channel that forms in the plasma jet. This task was centered on the equivalent electromagnetic model of the plasma [31]. The high-frequency electromagnetic field [14,18] was analyzed correspondingly to the pre-specified configuration and the material characterization of the modeled problem [21,22,23,24,25,26], assuming the desired excitation frequency. The geometrical arrangement and the analysis are graphically represented in Figure 2.

2. Numerical Model with Distributed Parameters

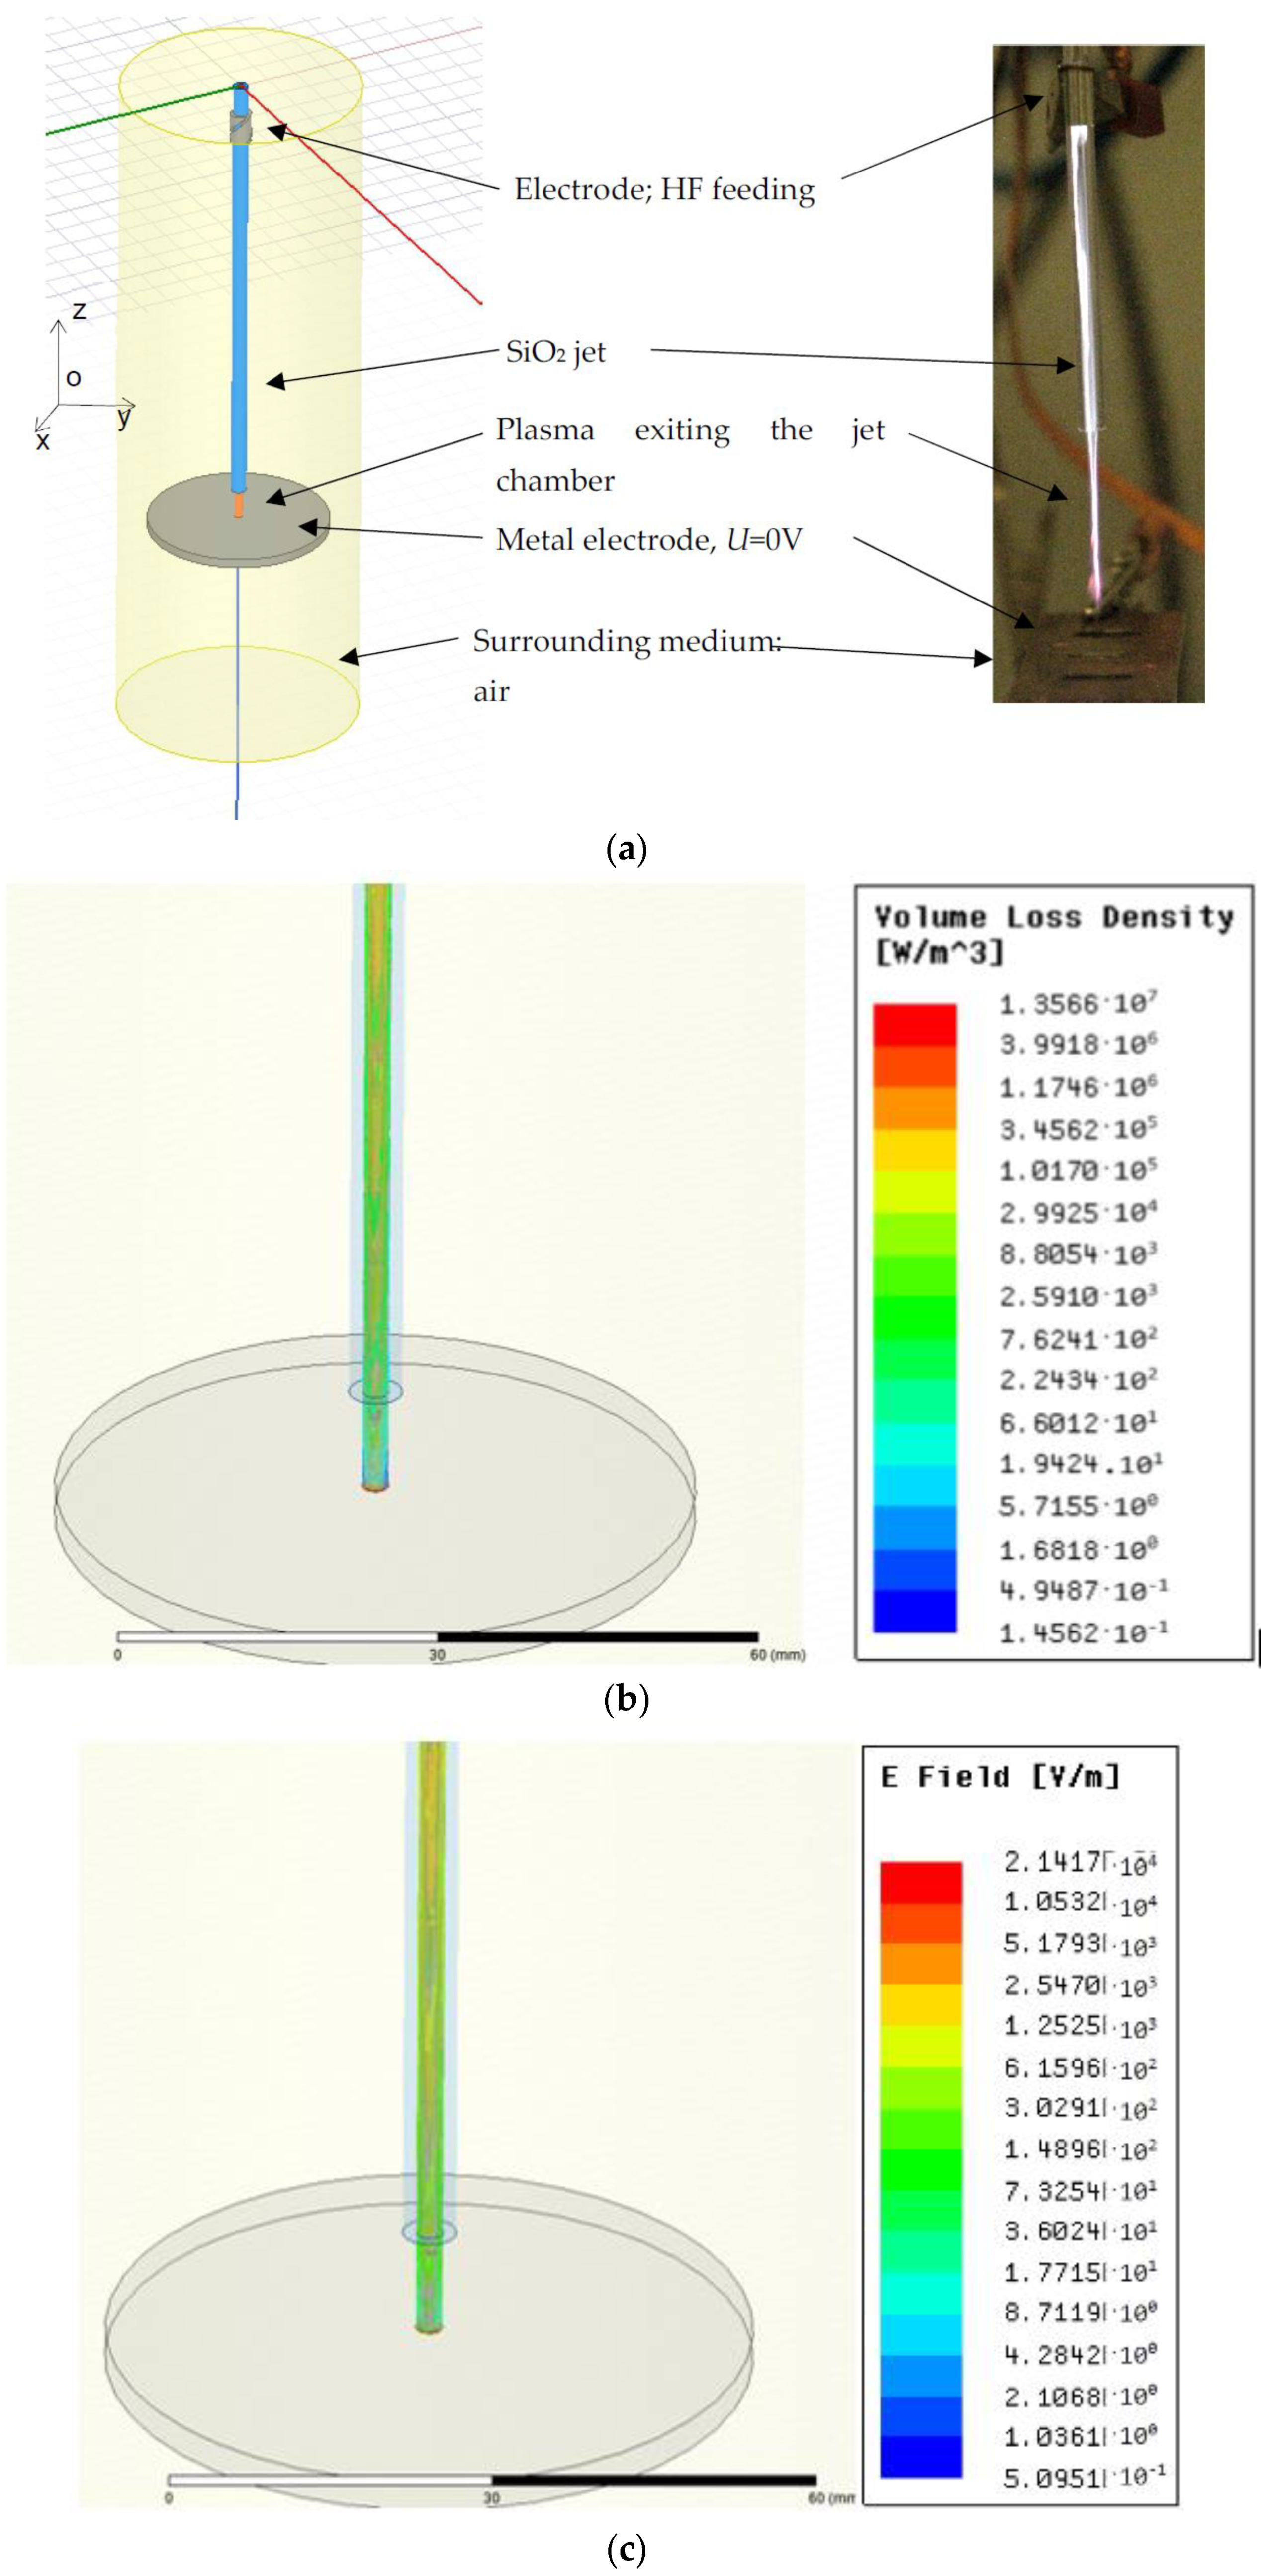
To describe, evaluate, and analyze the conditions outside the plasma channel, we used a wave-theory-based numerical model formulated from the reduced Maxwell equations [12,13,14]. The model was conceived as a fully non-stationary problem defined on the basis of the telegrapher’s equations [32,33]. The results obtained in the analyzed simple model are presented in Figure 2b,c, the monitored quantities being the volume loss Pvol in the area of the channel and the intensity of the electric field E. In the model, the plasma channel was substituted with a “macroscopic” counterpart; the main benefit of this approach rests in capturing the overall interaction of the plasma and the external electromagnetic field. The relevant analysis, evaluation, and interpretation allow us to find the presumed distribution of the electromagnetic field quantities, together with the time course and spectral characteristics of the signal generated by a plasma discharge in the vicinity of the jet chamber.
The monitoring of the signals that are formed (depending on the medium) in the burning of a plasma discharge is performed by various means, including sensors and antennas, as is also the case in observing, for instance, microplasma discharges [5,6,34,35]. The applicable detection and measurement methods [6,34] can be employed in the absolute mode or the differential mode.
When modeling the dynamic or pseudodynamic behavior of a plasma discharge, we can encounter several problems [36,37,38]. The most fundamental of these issues rests in describing the action of electromagnetic forces in areas (“particles”) that are structured and have a specific electric charge with respect to the weight of the object. Multiple situation modeling [34] approaches are available for both simplified, single-purpose descriptions and expanded ones, in which the mutual motion of charged areas is included. In this article, the focus is on evaluating the quantitative critical parameters of the interaction of the EMG field and “plasma material” objects instead of monitoring and evaluating a detailed particle behavior model.
The forces acting on a moving electric charge [34] in an electromagnetic field can be expressed through the formula
f e = ρ ( E + v × B ) ,
where B is the magnetic flux density vector in the space of a moving electrically charged particle with volume density ρ, v denotes the mean velocity of the particle, and E represents the electric intensity vector. Then, the specific force acting on the moving electrically charged particles having charge qe and number Ne, with volume V in the monitored area, is
f e = d ( N e q e ) d V ( E + v × B ) .
The force fe will initiate a change in the charged area, i.e., variation in the particle energy We, thus effecting a change in the particle oscillation frequency ω. This can be written as
Δ ω 0 = ω W e Δ W e ,
where ω0 is the electrically charged particle frequency of oscillation, Δω0 denotes the change in the particle oscillation frequency, and ΔWe denotes the change in the energy of the electrically charged particle. The relationship [34] between an electrically charged particle frequency and the steady-state values of the electromagnetic field can be expressed as
ω 0 | q e ( E + v × B ) | m e x ,
where x is the characteristic mean distance of the oscillation of a particle with electric charge qe, which moves at steady-state velocity v, and me is the mass of an electrically charged particle in the magnetic field with magnetic flux density B. The numerical model is based on the formulation of the Heaviside notation of Maxwell’s equations for the quantities of intensities and inductions of the electromagnetic field; we have
r o t   H = J T ,   r o t   E = B t ,
d i v   B = 0 ,   d i v   D = ρ ,
where H is the magnetic field intensity vector, JT represents the current density vector, and D denotes the electric flux density vector. These formulas hold true if the continuity equation
d i v   J T = ρ t
is respected.
The vector functions are expressed by using the scalar electric potential φe and the vector magnetic potential A; after the Coulomb calibration [12], the relationship between the quantities is expressed via
E = g r a d   φ e   A   t ,
B = rot   A .
The total current density vector with respect to the velocity of the moving electrically charged particles v in the magnetic field is
J T = γ ( E + v × B ) ( ε E ) t + γ q ( m d v d t + l v + k t v d t ) ,
where m is the particle mass given by the formula
m = m 0 ( 1 v 2 c 2 ) ,
where q denotes the electric charge of the moving particle, γ is the conductivity of the medium from the macroscopic perspective, l represents the damping coefficient, and k is the coefficient of stiffness of the ambient environment. The material relationships for the macroscopic part of the model are represented by the expressions
B = μ 0 μ r H ,   D = ε 0 ε r E ,
where the indices of the permeabilities and permittivities r denote the quantity of the relative value, and 0 is the quantity value for vacuum. The relationship between the macroscopic and microscopic descriptions of the plasma model is based on an expression of the force between individual electrically charged particles in an electromagnetic field and the impact on the dynamics of electrically charged particles with respect to the surrounding electromagnetic field. The relevant formula is established by using Equation (10) and as presented below (13):
m d v d t + l v + k t v d t = q   ( E + v × B ) q γ ( ε E ) t .
By applying the Galerkin method to find the functional minimum, and respecting the boundary conditions, the numerical model is obtained as a system of non-linear equations. This system is the solved by means of the standard methods.
As is known from source [36], for example, the relativistic approach to electrodynamics must be re-examined when expressing electrodynamic systems in motion. The problem begins when the vector of the intensities of the electric E and magnetic H fields of the dynamic system is relative. For a quasi-stationary system, the dynamics of the mass model are defined in Equation (13). In order to take into account the relative motion of independent motion systems, it is appropriate to expand the formulas to include an element that respects Faraday’s law of induction; we then have
rot E =   B   t + rot ( v × B ) .
For the magnetic field relationships,
rot H = J + ρ v + D t + rot ( v × D )
holds, where ρ is the volume charge density. The complete Maxwell’s equations are covariant in all systems; it is therefore irrelevant in which system the observer moves. After deriving the four vectors and respecting the Lorentz transformation, the current density is written as
J = ρ s t + j c ρ u t ,
where j represents the imaginary component of the quantity complex form, c is the module of the speed of light in vacuum, and s stands for the position vector of a point. For continuity Equation (7), we have
d i v ( J ) = 0 .
To simplify the procedure, if we assume the movement of one relative system ()’ in the x, y, and z axes of the Cartesian coordinate system, the four-vector of the total current density after applying the Lorentz transformation to (10)–(15) can be written in the form (invariant)
J T = γ N q q ( m d ( v + j c u t ) d t + l ( v + j c u t ) + k t ( v + j c u t ) d t ) ( 1 v 2 c 2 ) 1 2 + j c N q q V ( 1 v 2 c 2 ) 1 2 u t ( ε E ) t ( 1 v 2 c 2 ) 1 2 + γ ( E + ( v + j c u t ) × B ) ( 1 v 2 c 2 ) 1 2 + r o t ( ( v + j c u t ) × D ) ( 1 v 2 c 2 ) 1 2
Based on the model formulated in this manner, it is necessary to investigate the connection between the microscopic and macroscopic interpretations of matter. Such a step will then allow us to express the relationship of the specific electrical conductivity γ to the parameters of the material, or plasma, and we will also be able to evaluate the influence of both the actual distribution of areas with electric charge q and the charge’s concentration on the evaluated quantities of the EMG field.
In terms of microscopic modeling, we introduced in the EMG model of the material properties of plasma a non-linearity of the electrical conductivity γ in the generated plasma channel as a parameter expressing the density of the electric charge q [27]. Similarly to the nanomaterial model in [27], the method to define the specific electrical conductivity parameter can be written for plasma, too. We have
γ = g ( x , y , z , q ) ,
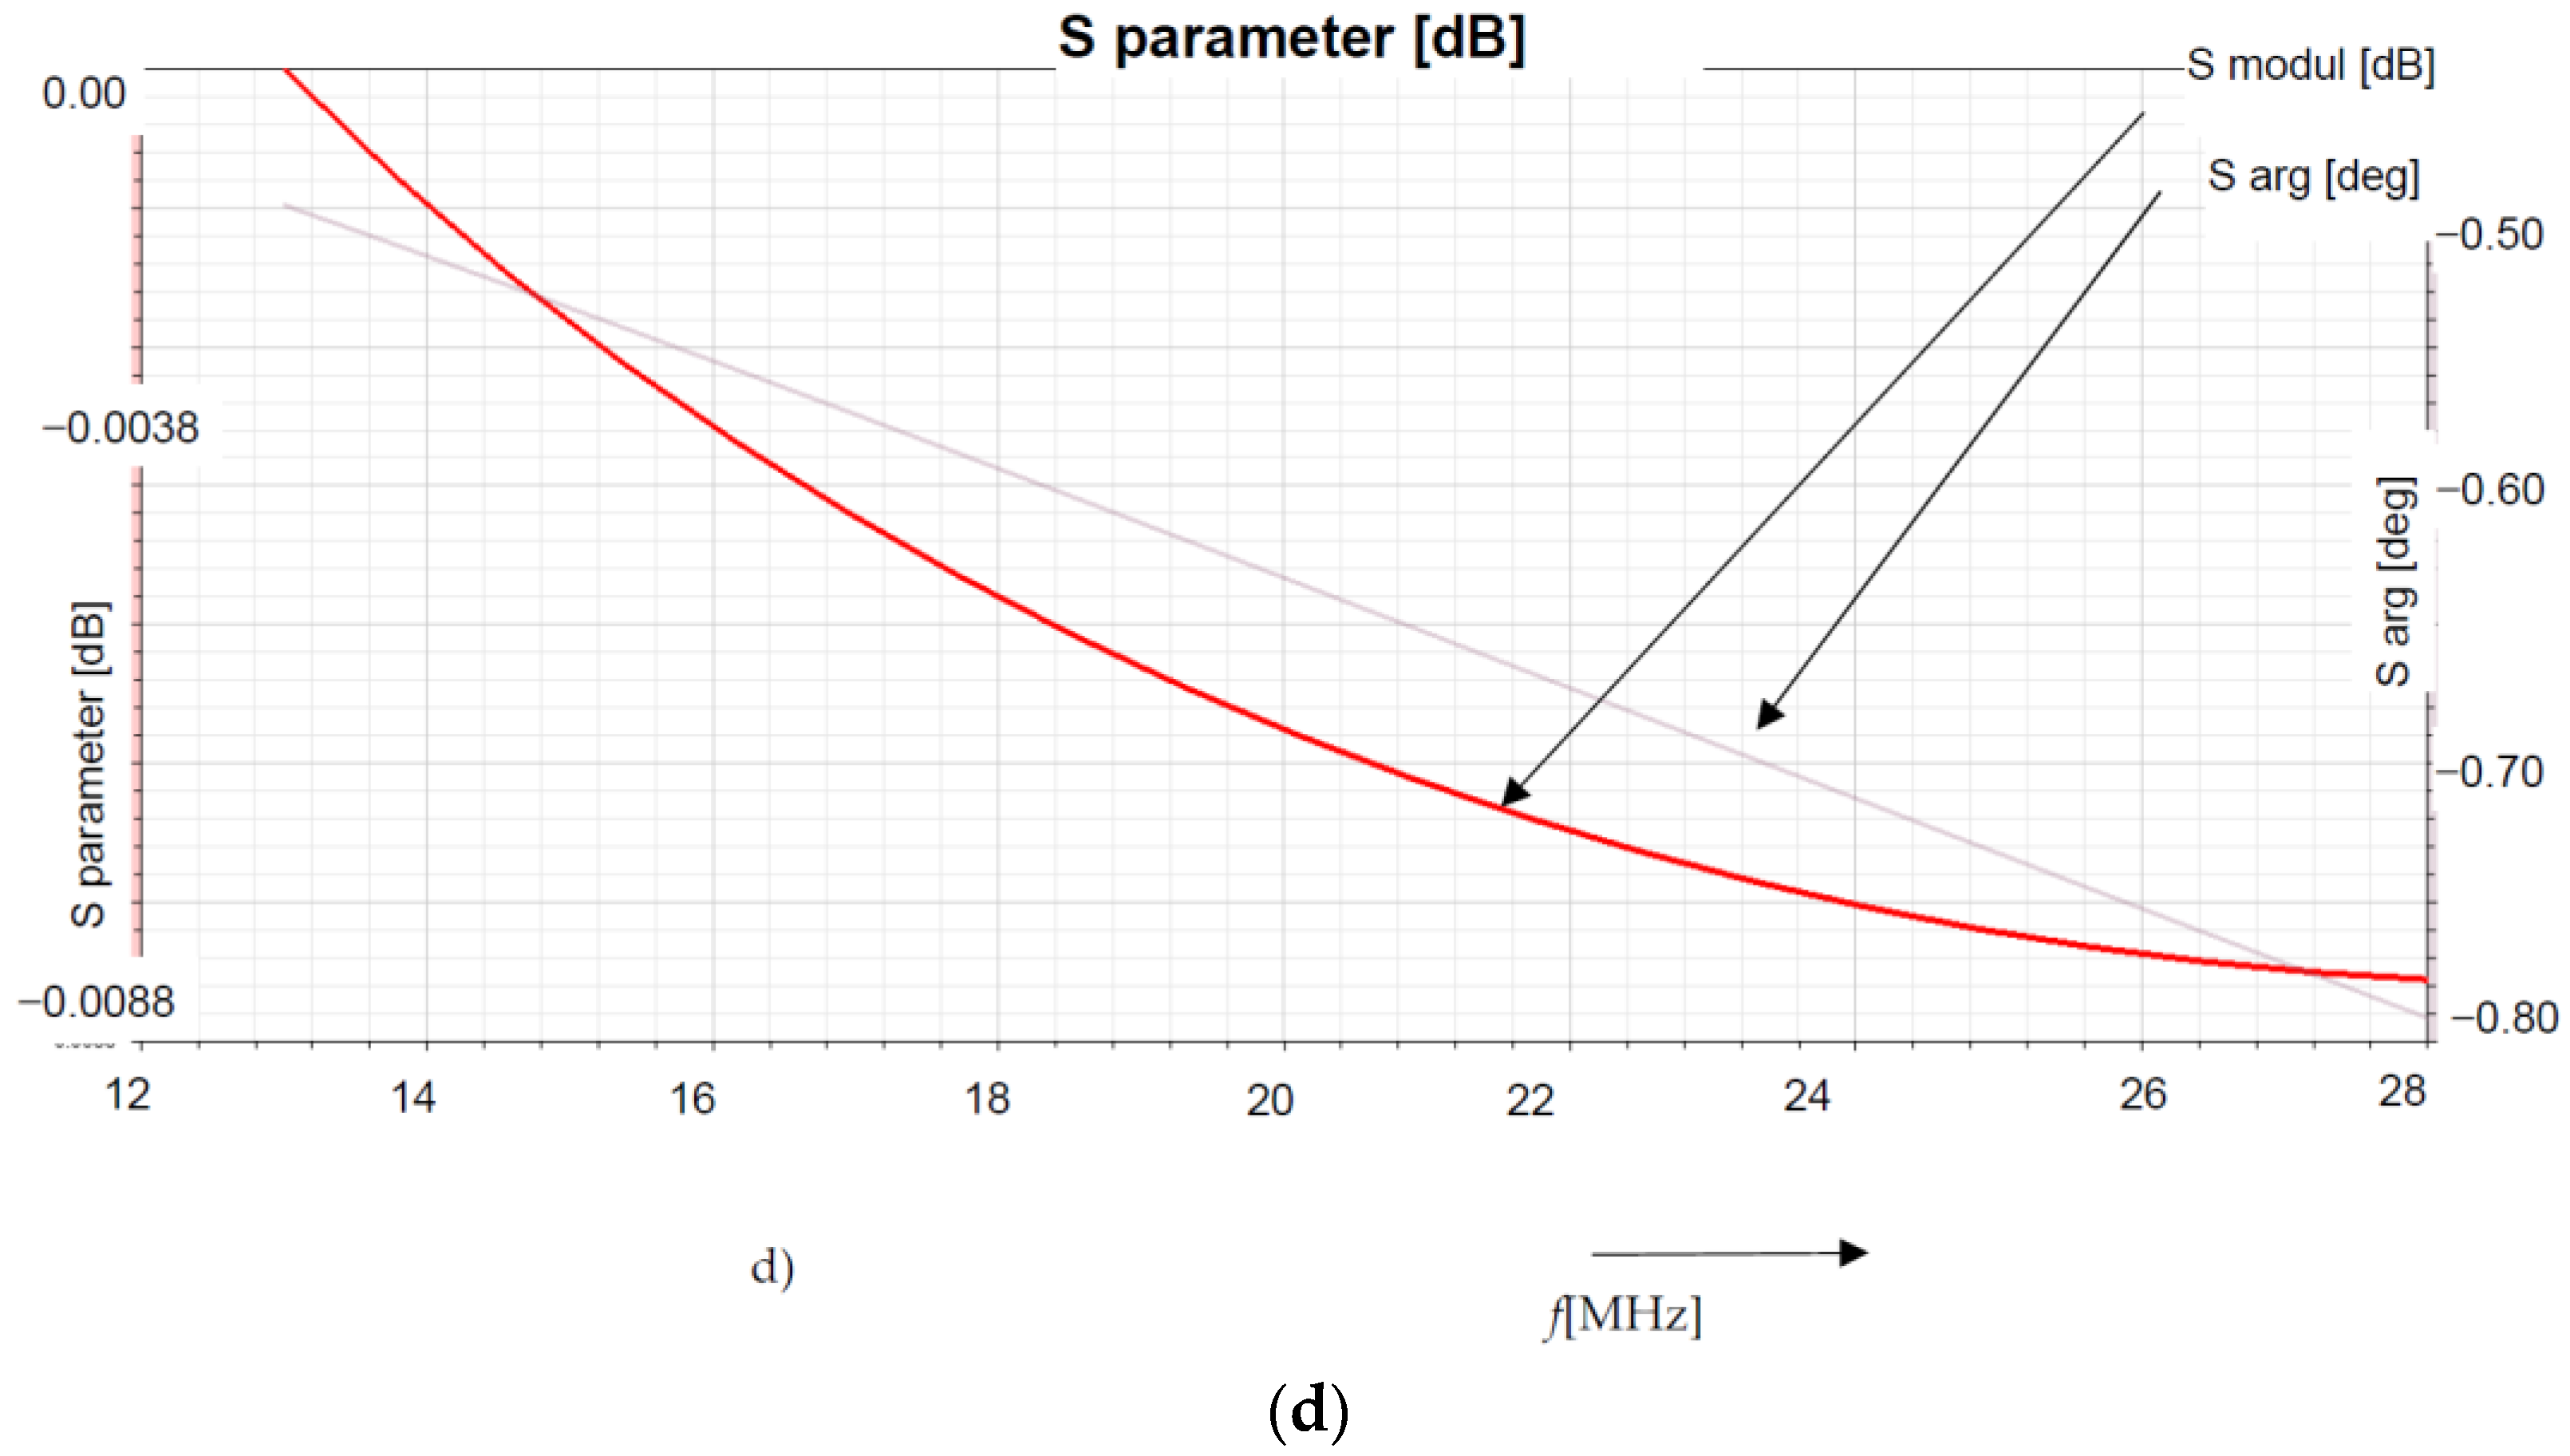
where x, y, z are the spatial coordinates, and q is the electric charge. In the first step, we examined the models to evaluate the S, Z parameters of the frequency analysis, as shown in Figure 2d); subsequently, for an identical geometrical configuration, we executed the same task in similar quantities, including the representation of the parameters z and s [27] and respecting the impact of the temperature of the neutrals, Tn [39,40,41].
We then have
γ = g ( x , y , z , q ) + g ( T n , q ) .
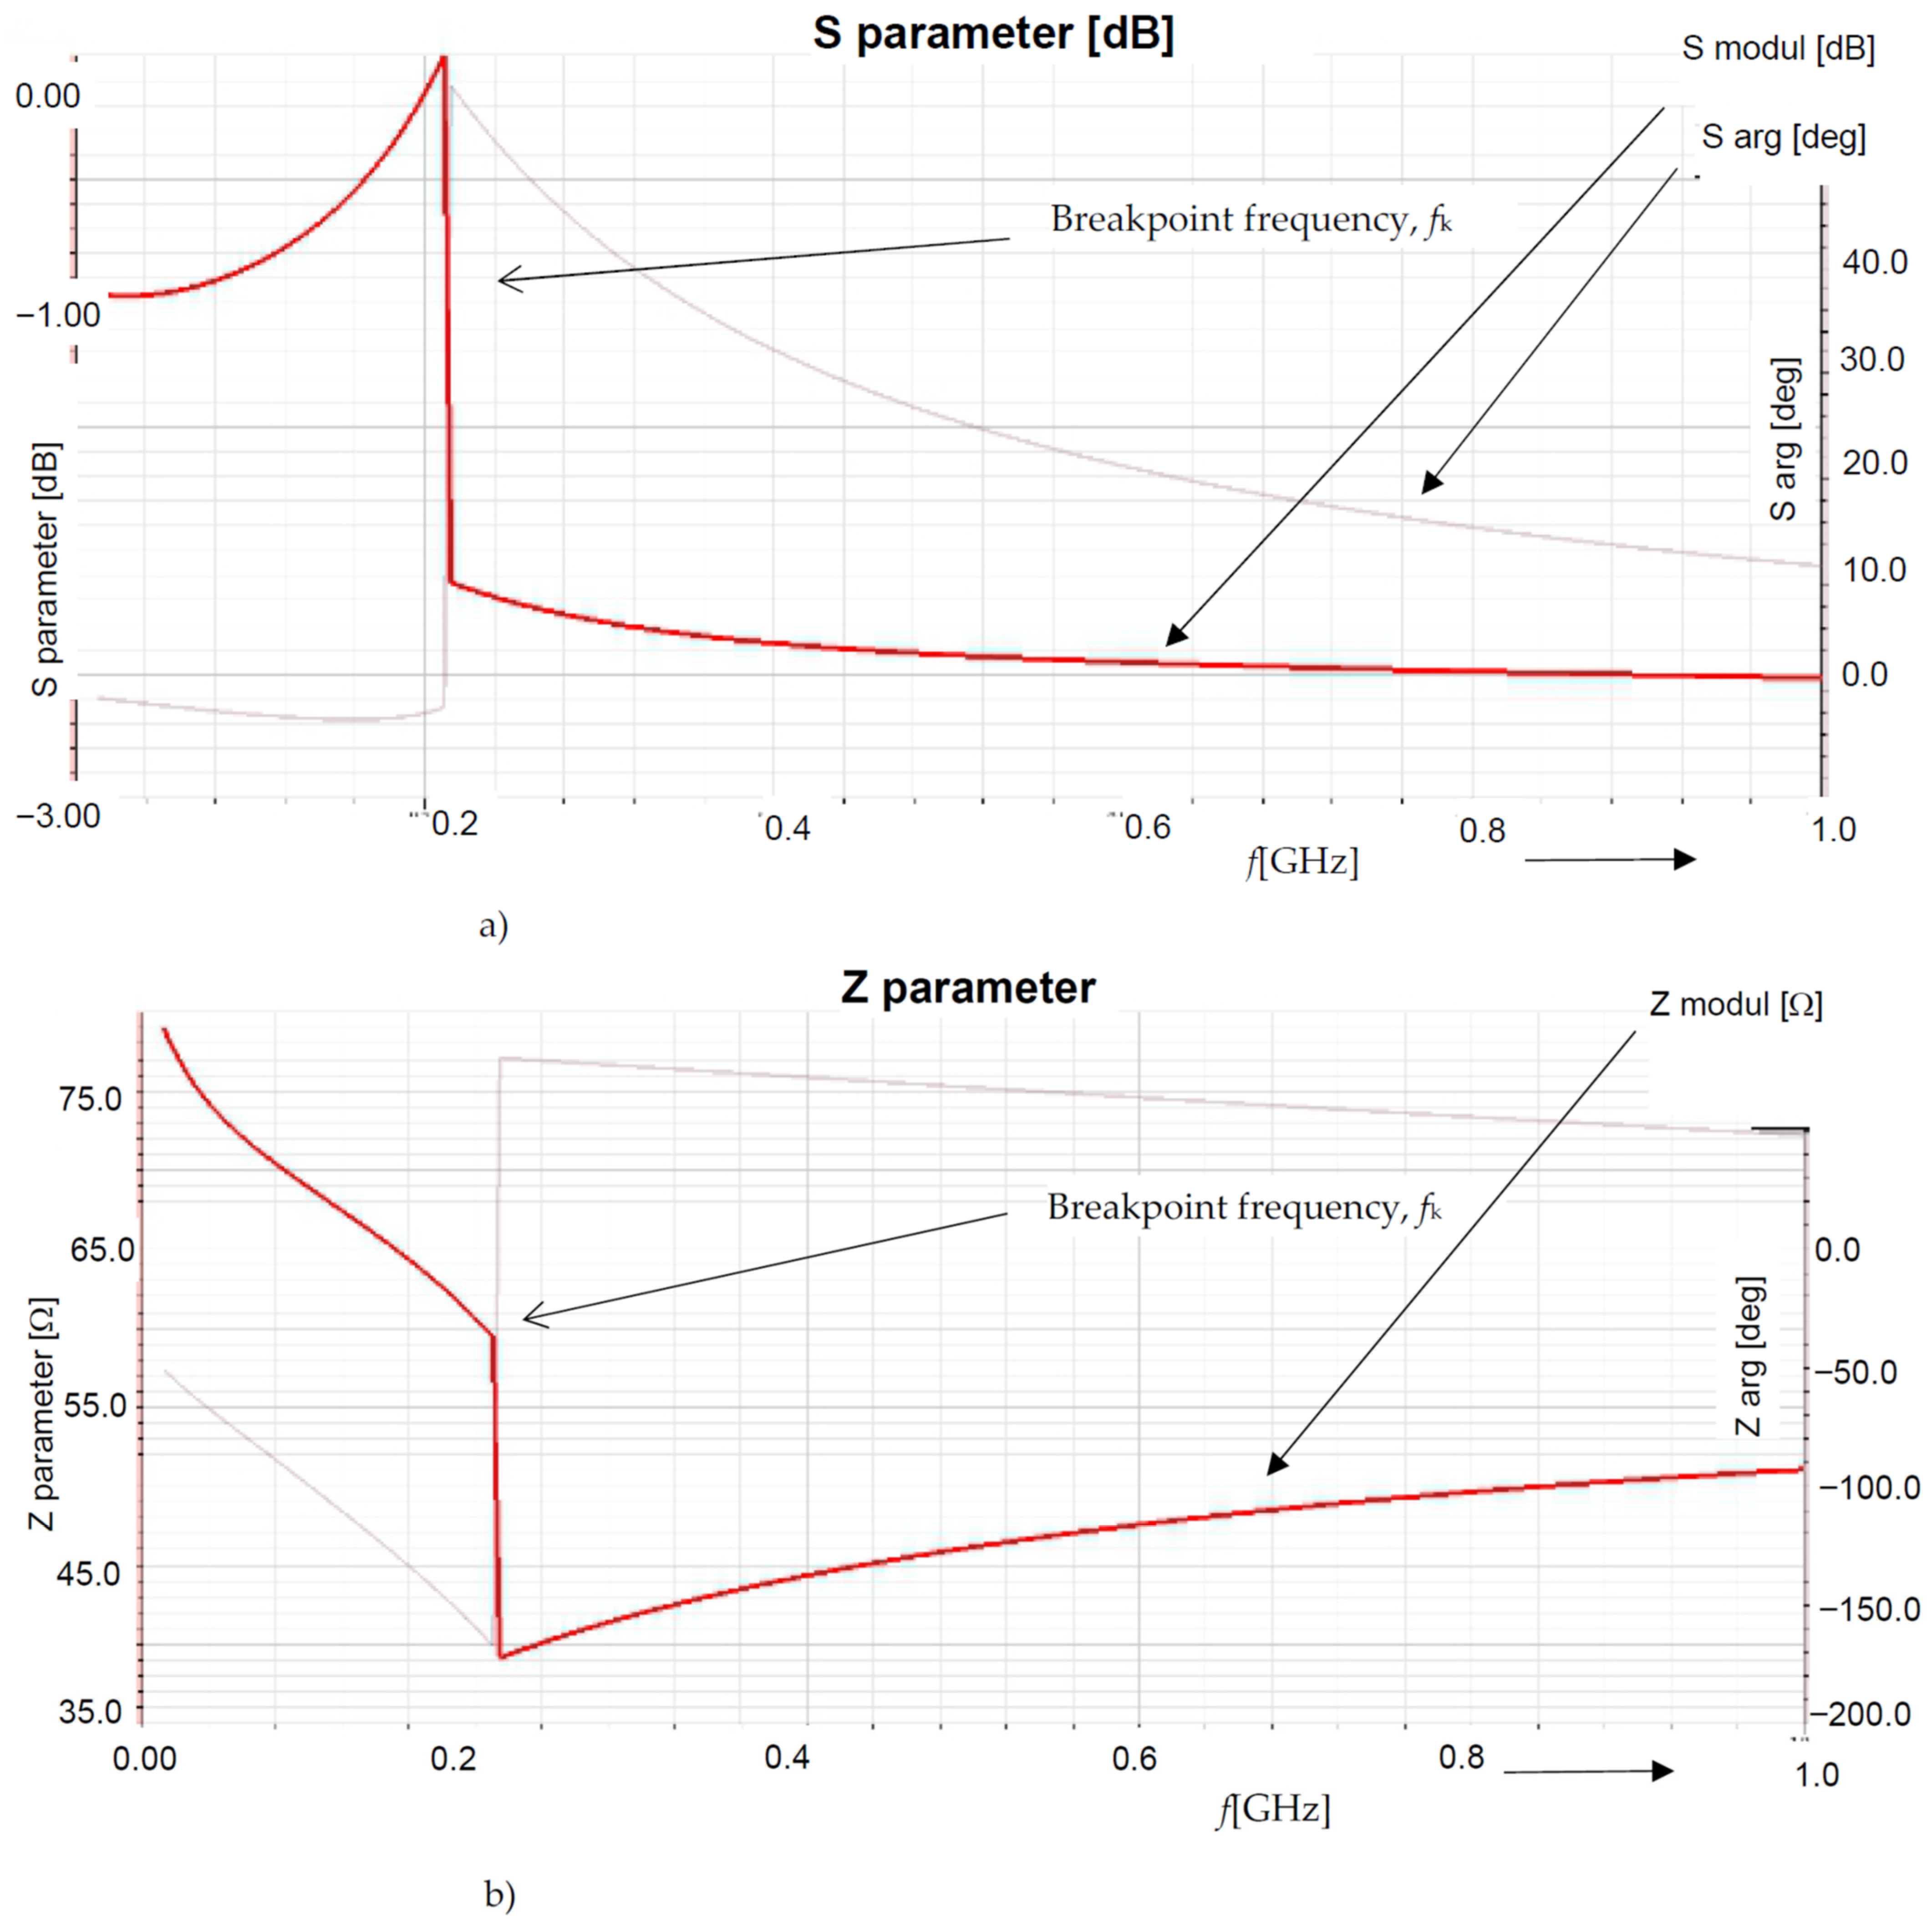
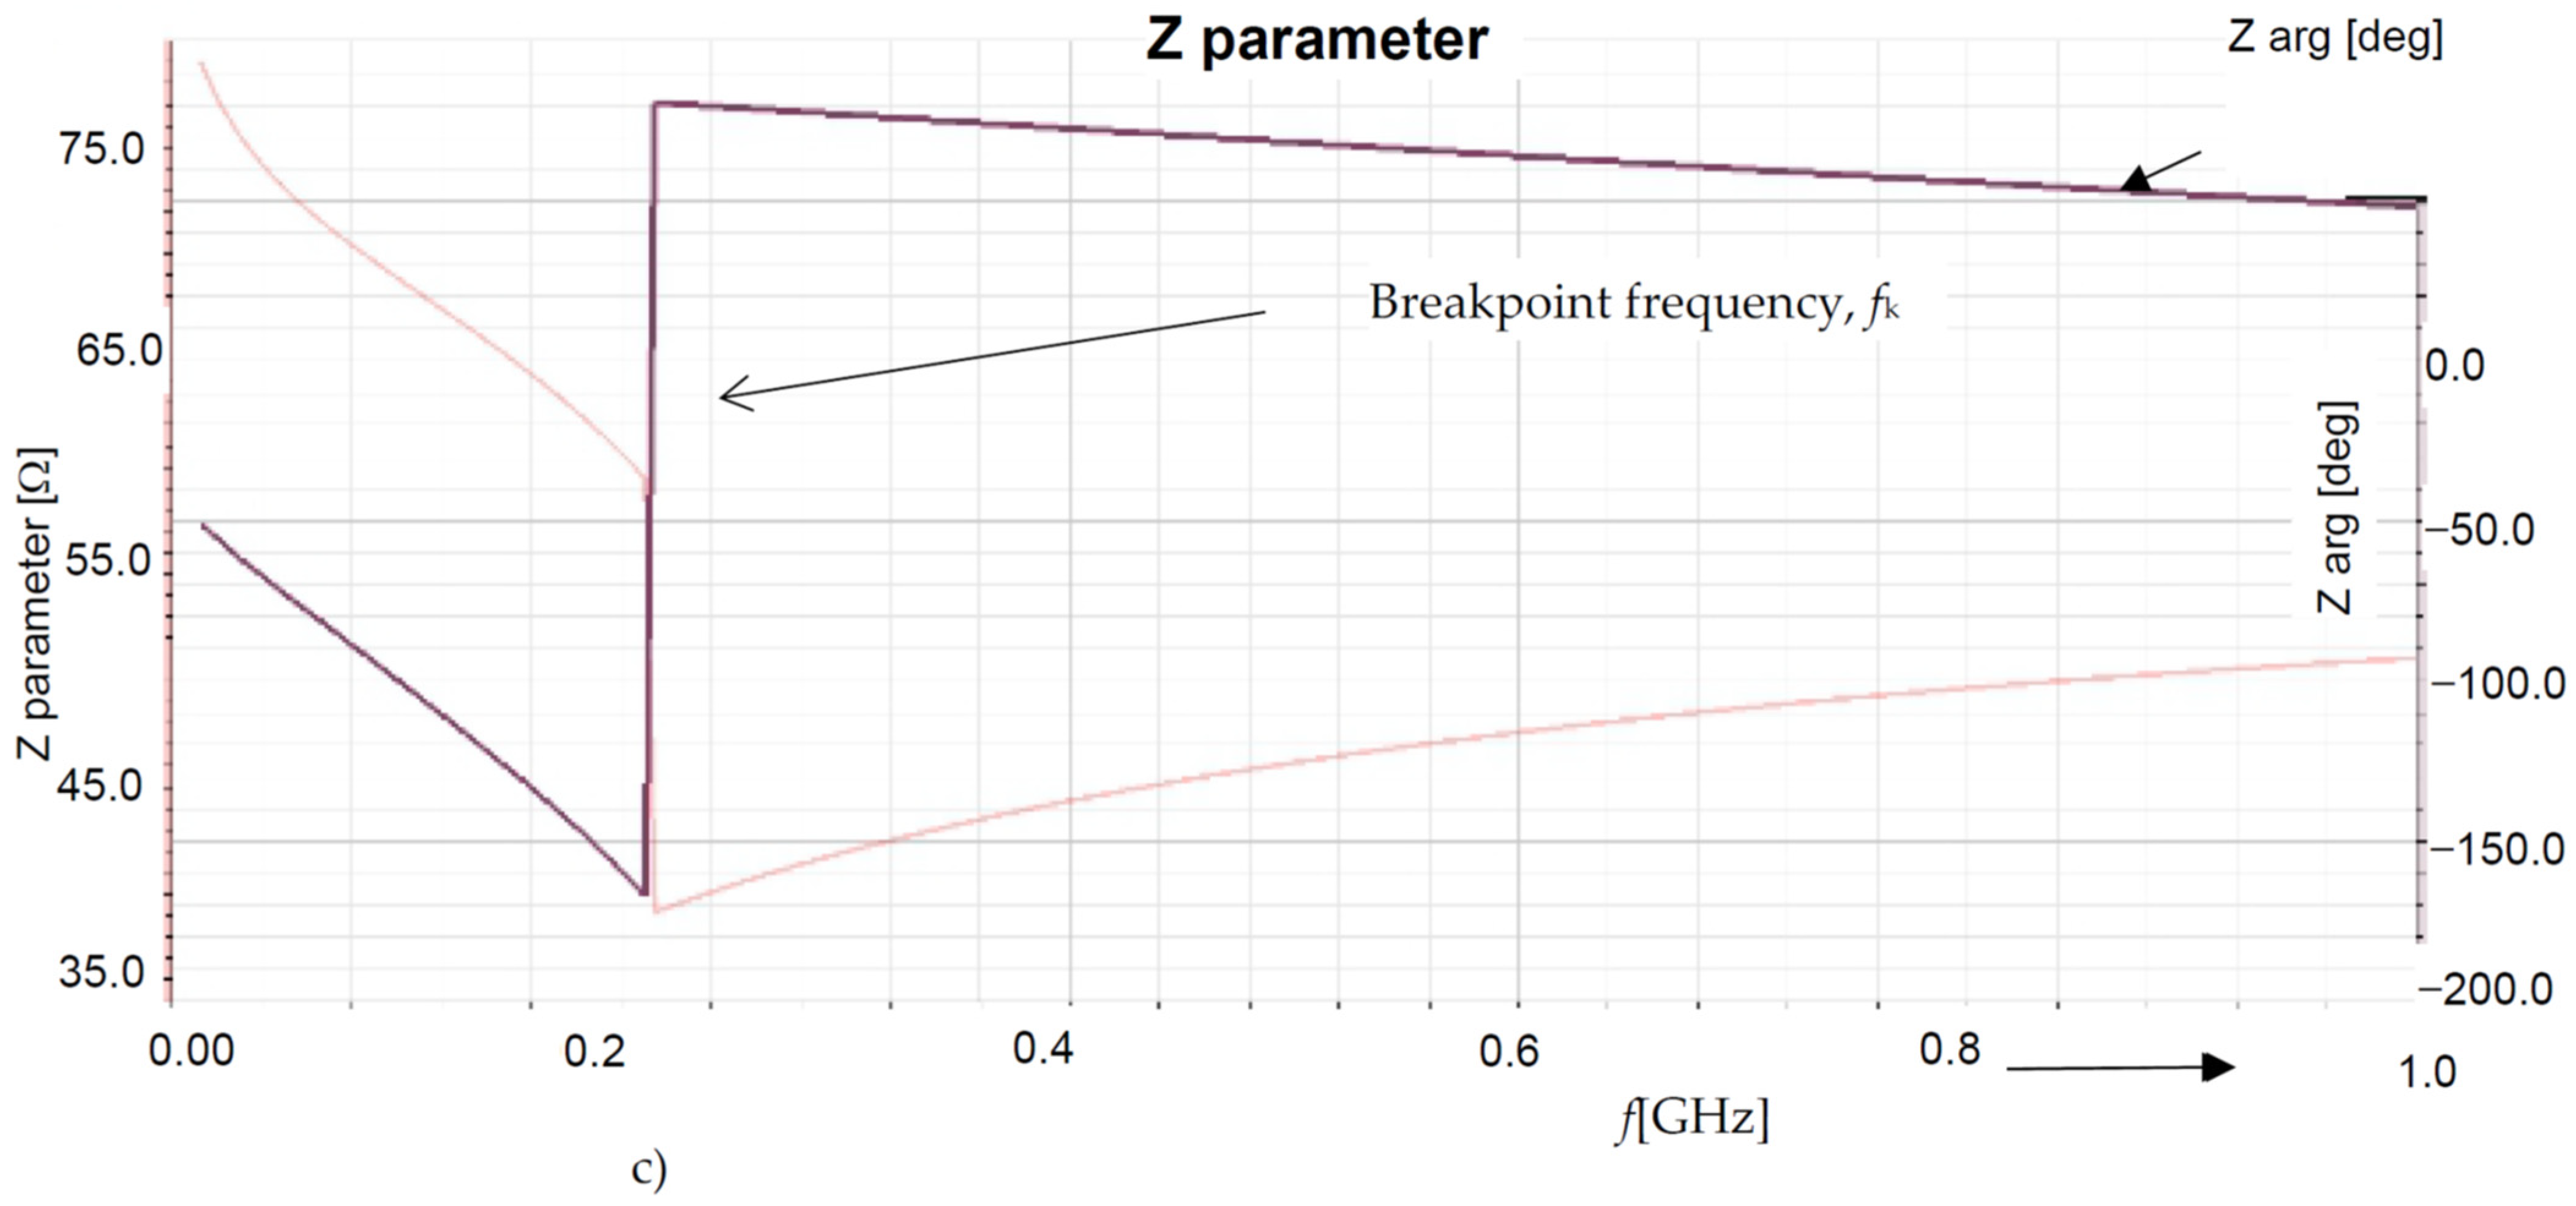
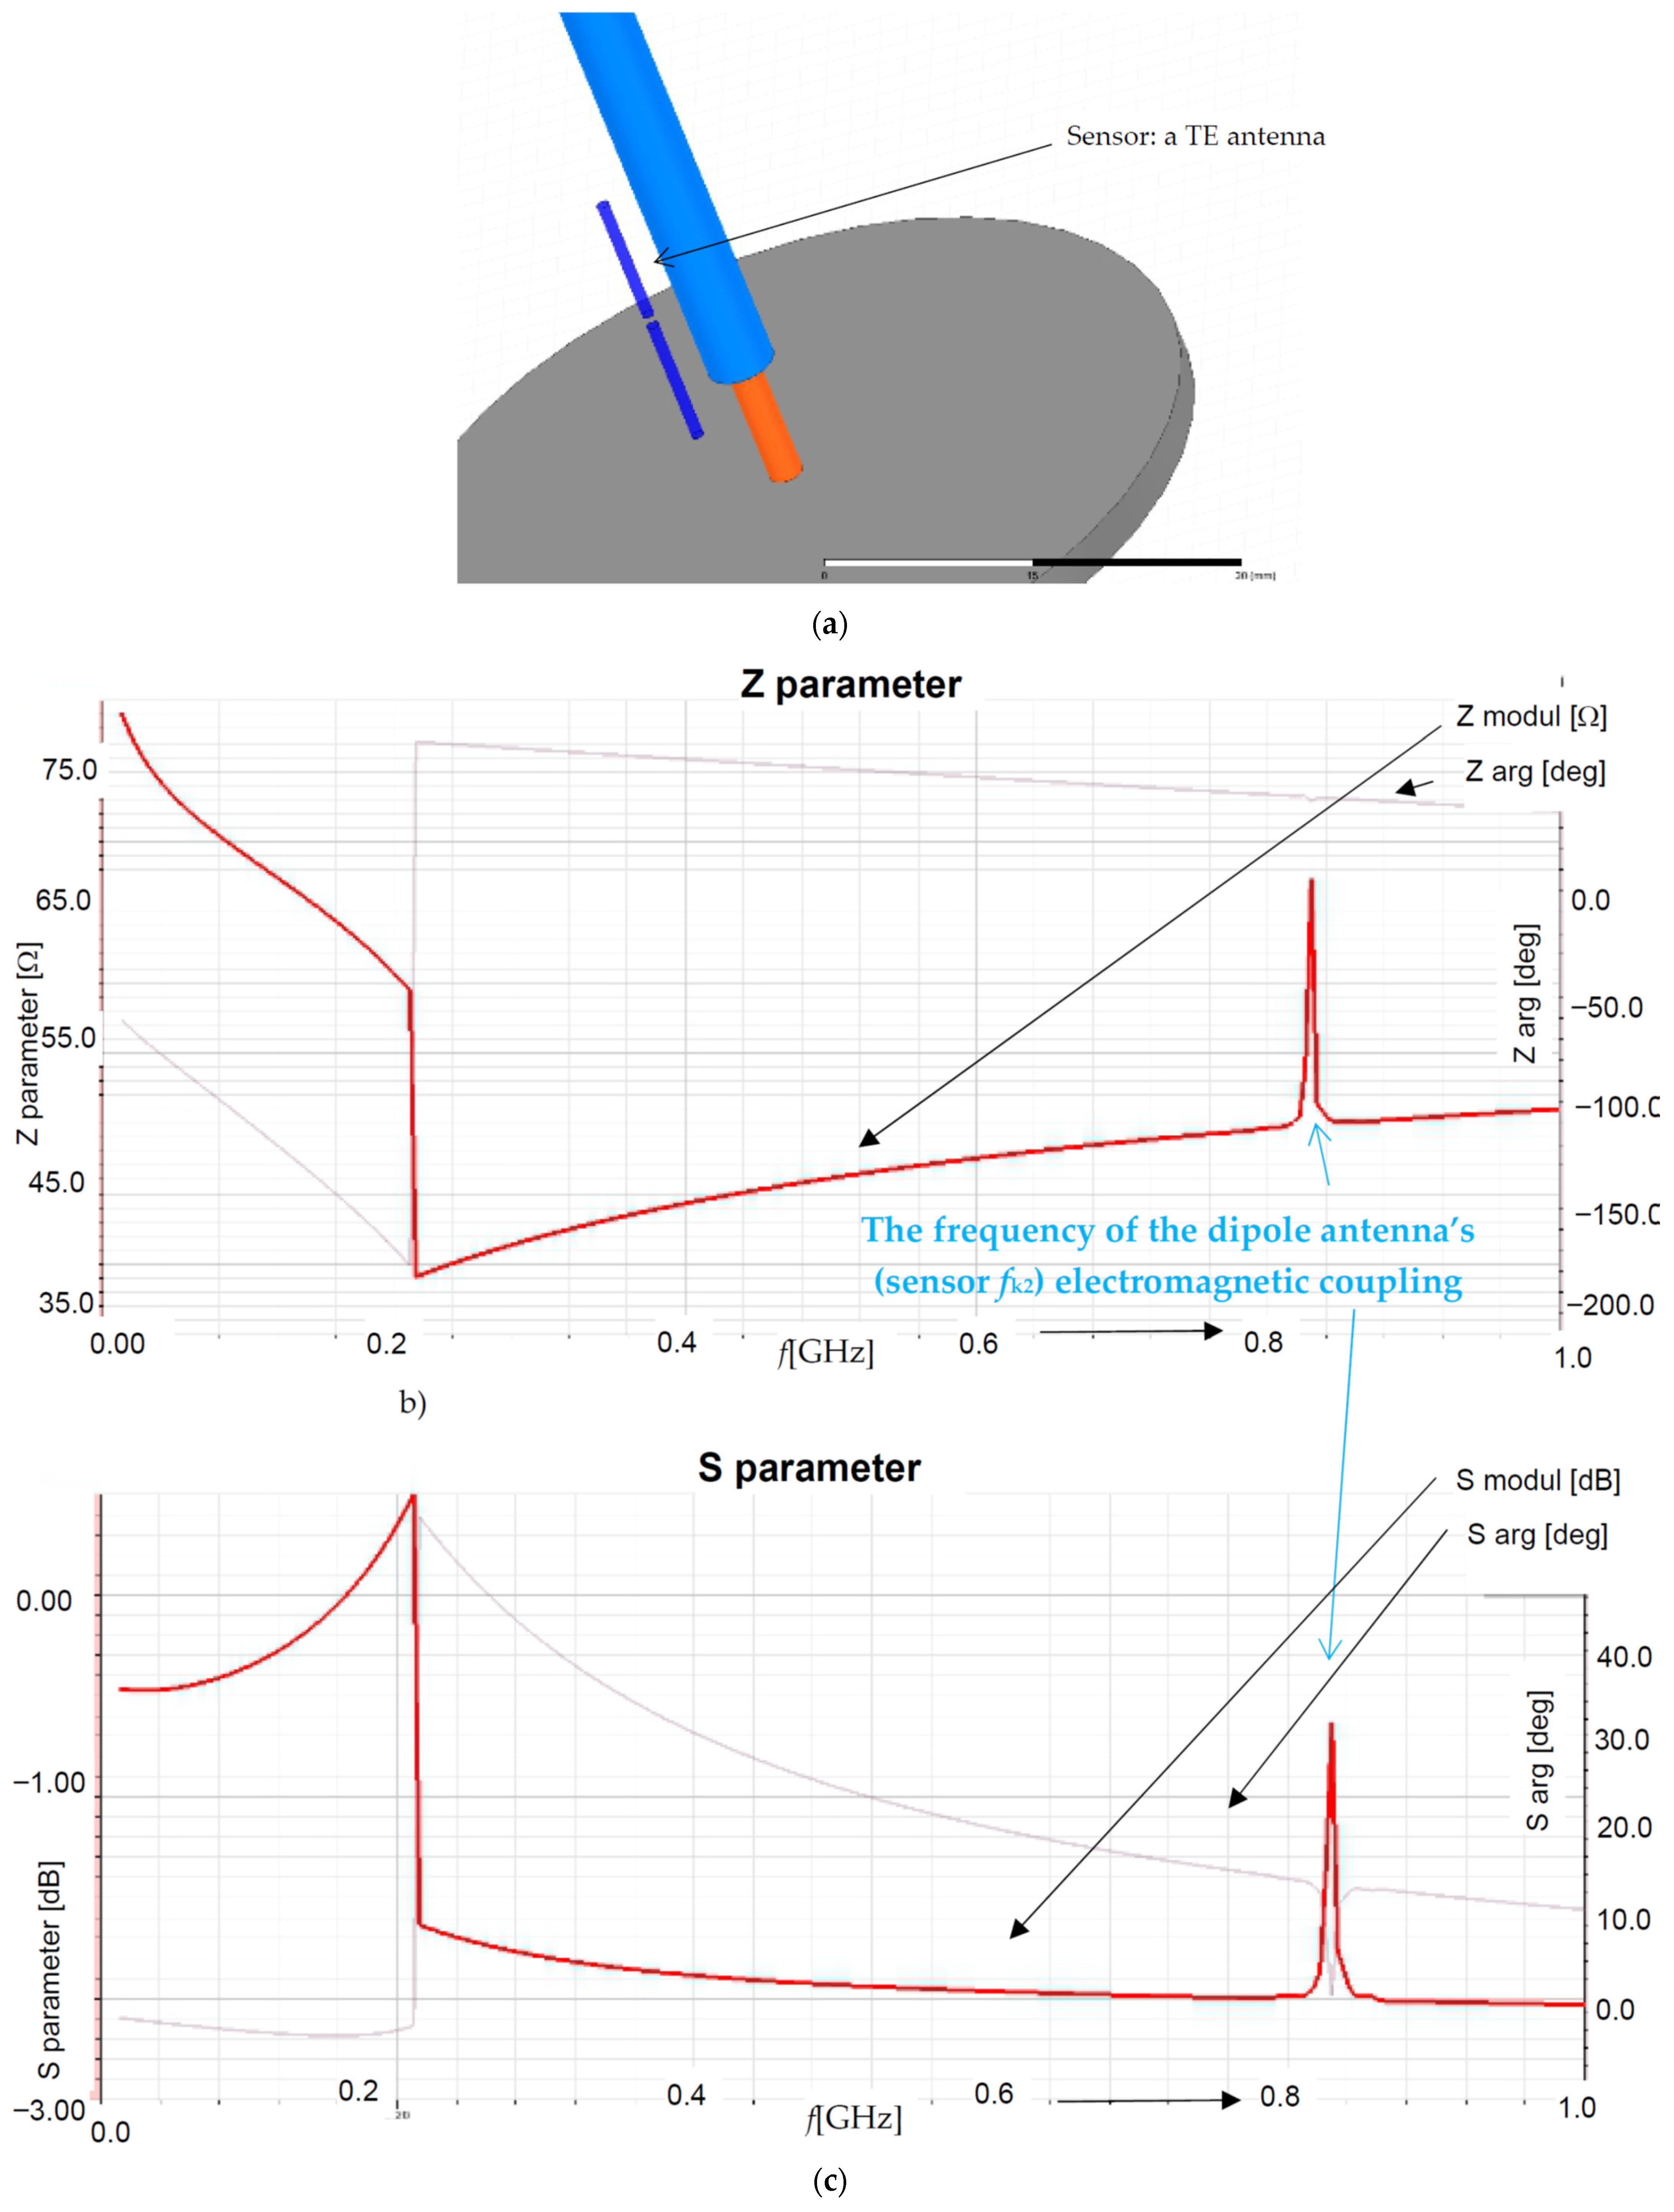
The frequency relationships of the parameters s and z, f = 10 MHz–28 MHz (with a maximum range up to 1 GHz), are evaluated in Figure 3a–c. The monotonous function of specific conductivity from the first approach, presented in Formula (19) and Figure 2d, is shown to have changed into a non-linear and, theoretically, “non-continuous” one at the critical frequency fk during the frequency domain analysis of the parameters s and z, shown in Figure 3a–c. This non-linearity embodies a precondition for the oscillation and dynamic instability of the discharge being modeled, shown in Figure 4. Thus, the experiments can be generally expected to involve a broader spectrum of signals detectable via a convenient RF method [5,6,7,8]. In the experiments and laboratory measurements, the components of the electric field E are sensed with antennas, and the magnetic field is measured—and its intensity H evaluated—by using a Rogowski sensor or a Hall probe. With these facts in mind, we proposed a numerical concept to analyze and evaluate the impact exerted by the sensing element on the superposed electromagnetic field, as shown in Figure 5. The element was proved to have a major influence on the resulting electromagnetic field (Figure 3a–c and Figure 5a–c), the frequency domain of the parameters z and s in particular; moreover, the frequency fk2 was also significantly affected. The basic parameters of the modeled plasma jet were as follows: RF generator output power of Pg = 50 W; argon flow rate of vv = 5 L/min; and distance between the plasma jet orifice and the base of l = 10 mm. The base consisted of a grounded duralumin (Mg–Al alloy) plate 2 mm in thickness; this plate was in contact with the plasma.
Further analyses then focused on the electrical conductivity, respecting the mobility of ions [39,40,41] entering the plasma burning process, to yield the formula
γ = g ( x , y , z , q ) + g ( T n , q ) + g ( T i ,   Ar , q ) + g ( T OH , q ) + g ( T N 2 , q ) + g ( T e , q ) ,
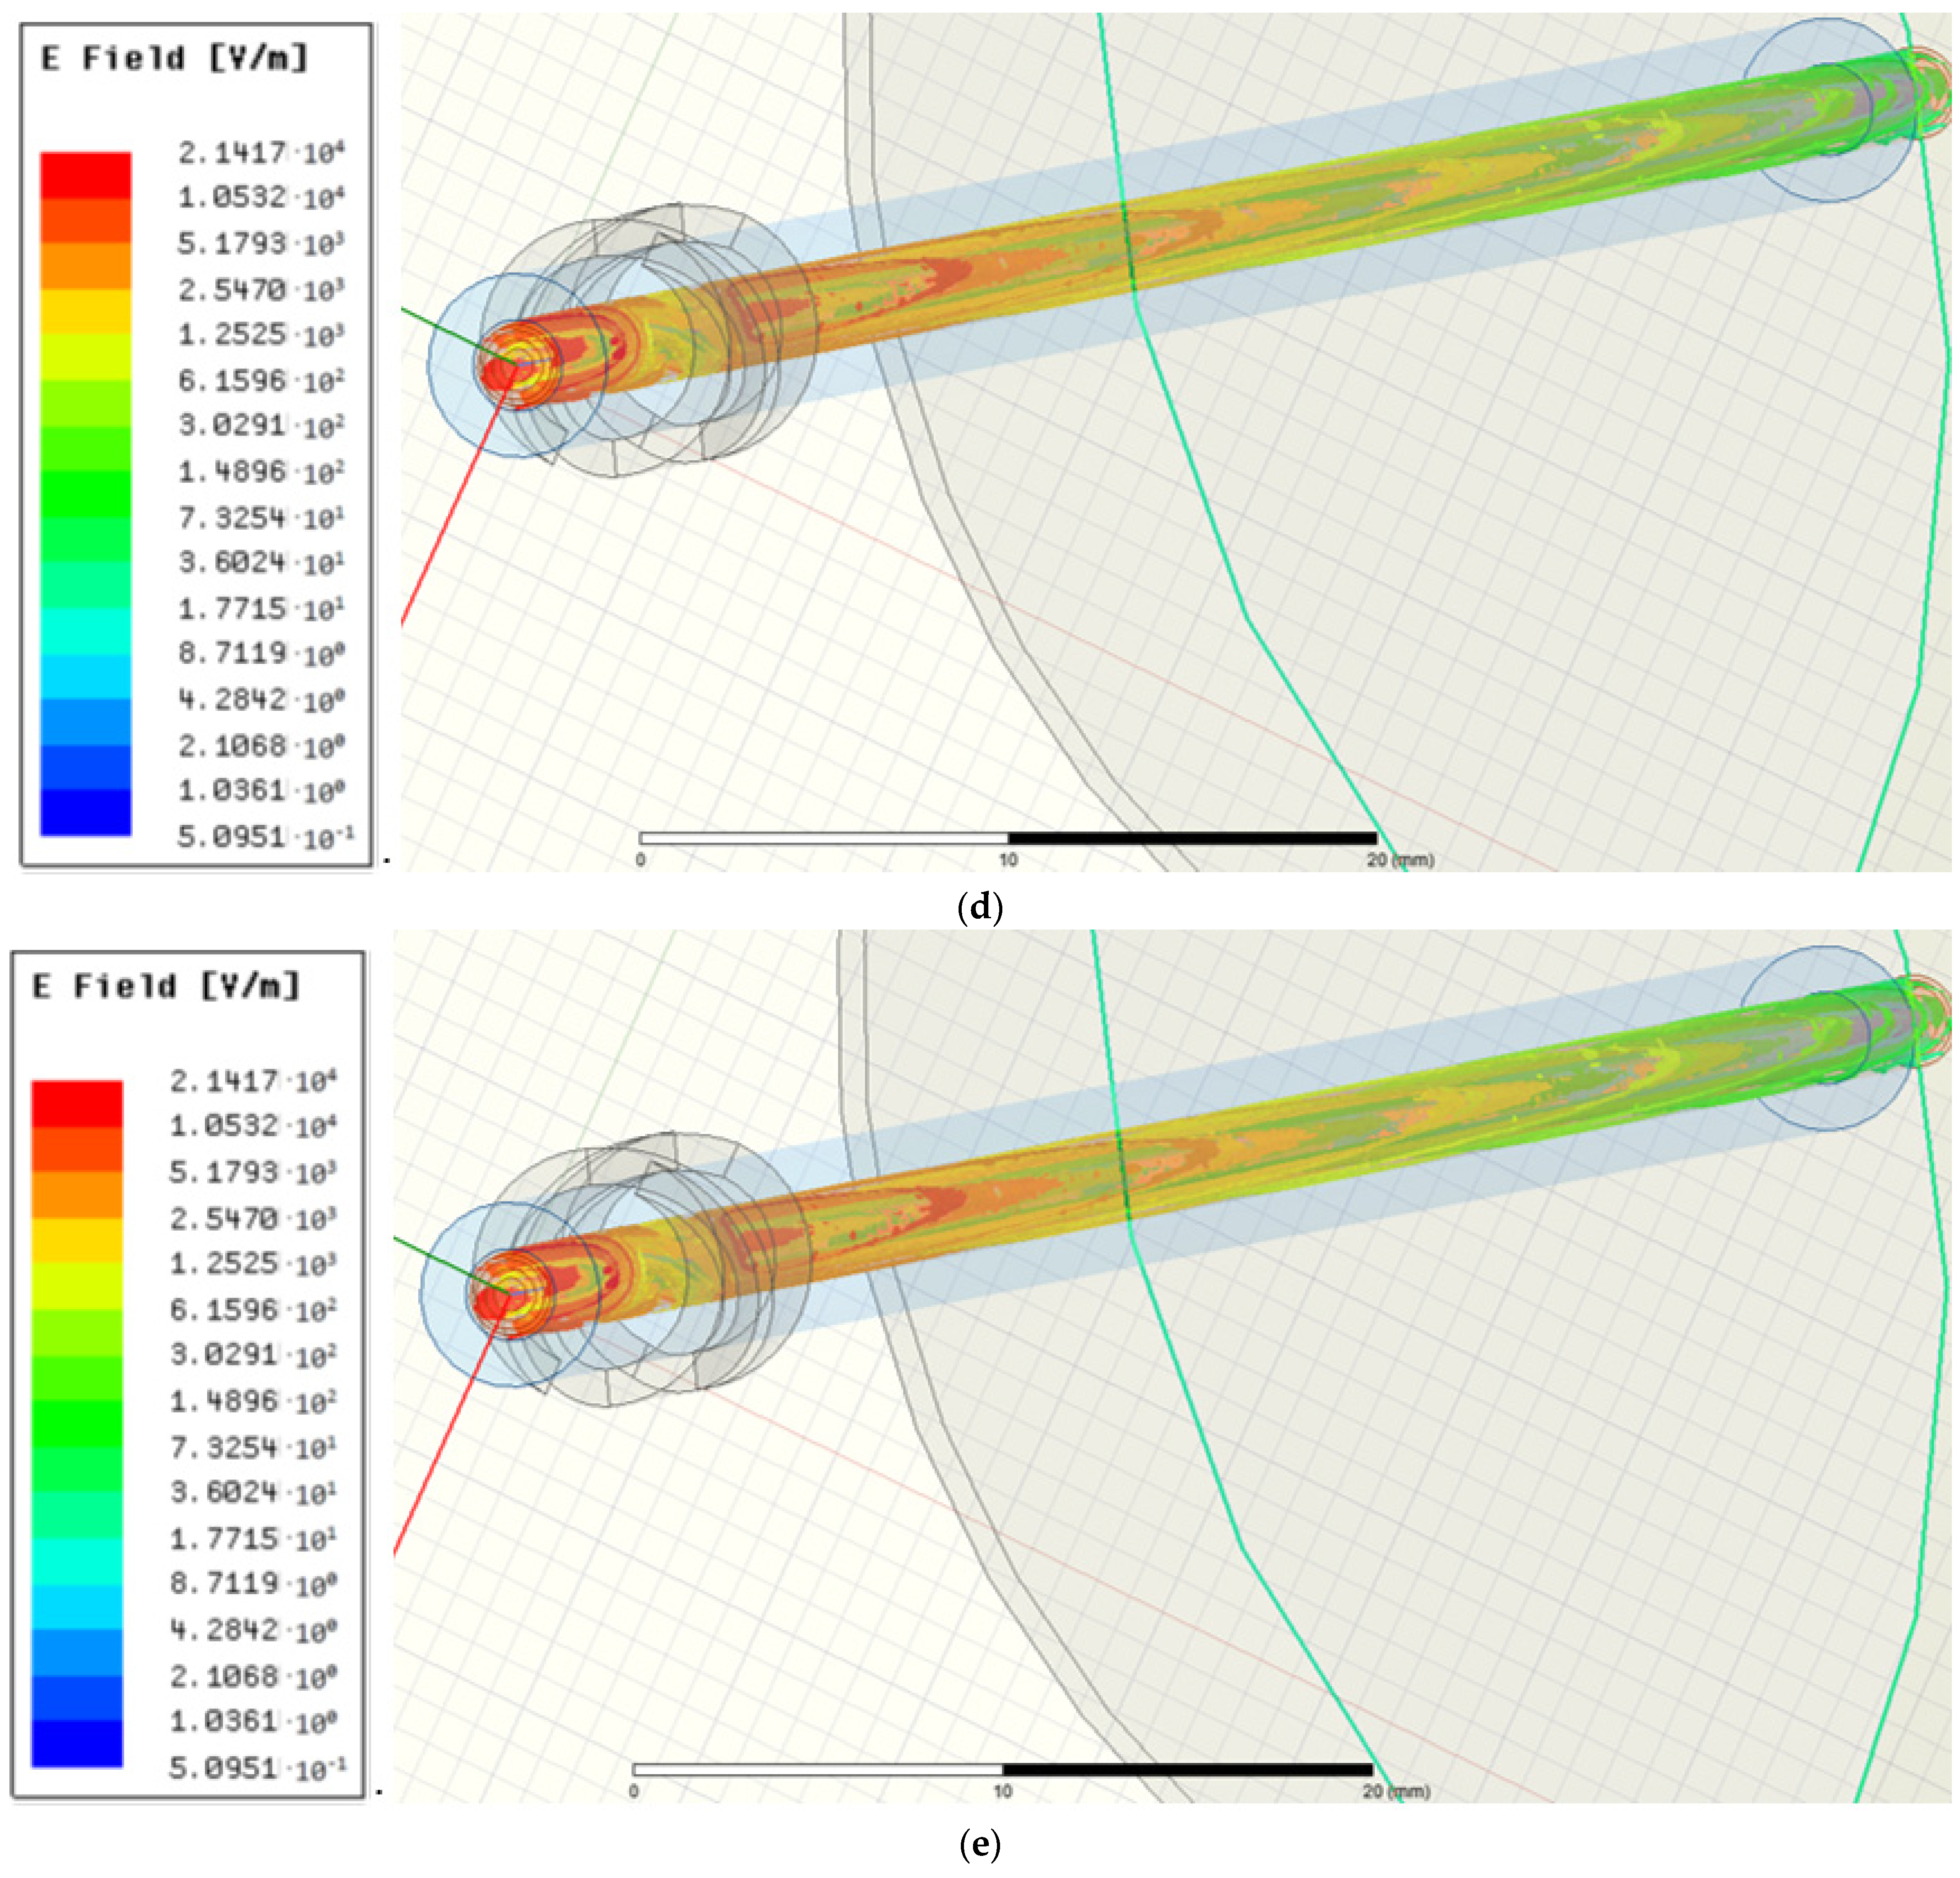
where Tn is the temperature of the neutrals, Ti,Ar denotes the temperatures of the ions and the argon, TOH represents the temperature of the rotating OH molecule, TN2…q expresses the temperature of the N2 and other molecules, and Te denotes the temperature of the electrons. These properties, which characterize the dependence of the electrical conductivity (formulated as in (20), (21)) on the “plasma temperature” parameters, have been employed by various authors, including those of [39,40,41]. The specific conductivity parameter γ (21) as a non-linear function defines the relationship between the above-discussed plasma parameters, where the transport properties of the environment are accepted [41]. The properties comprise, for example, the plasma diffusion coefficients; these then depend on the effective precipitation frequency as related to the plasma state, thermodynamic plasma parameters, and mobility/velocity of electrons and their distribution in the plasma channel [40] according to factors including, but not limited to, the temperature and also the position and mobility of the electric charge carriers. Such items were discussed in more detail within the referenced article [39]. The plasma channel properties set out in (19)–(21) were respected in the ANSYS-HFSS system using the embedded parametric material of specific electrical conductivity (HFSS module—material), which is a standard tool of the FEM ANSYS HFSS system [14]. The results of the model analyses with pre-specified boundary and initial conditions are presented in Figure 2, Figure 3, Figure 4 and Figure 5.

3. Numerical Model with Concentrated Parameters

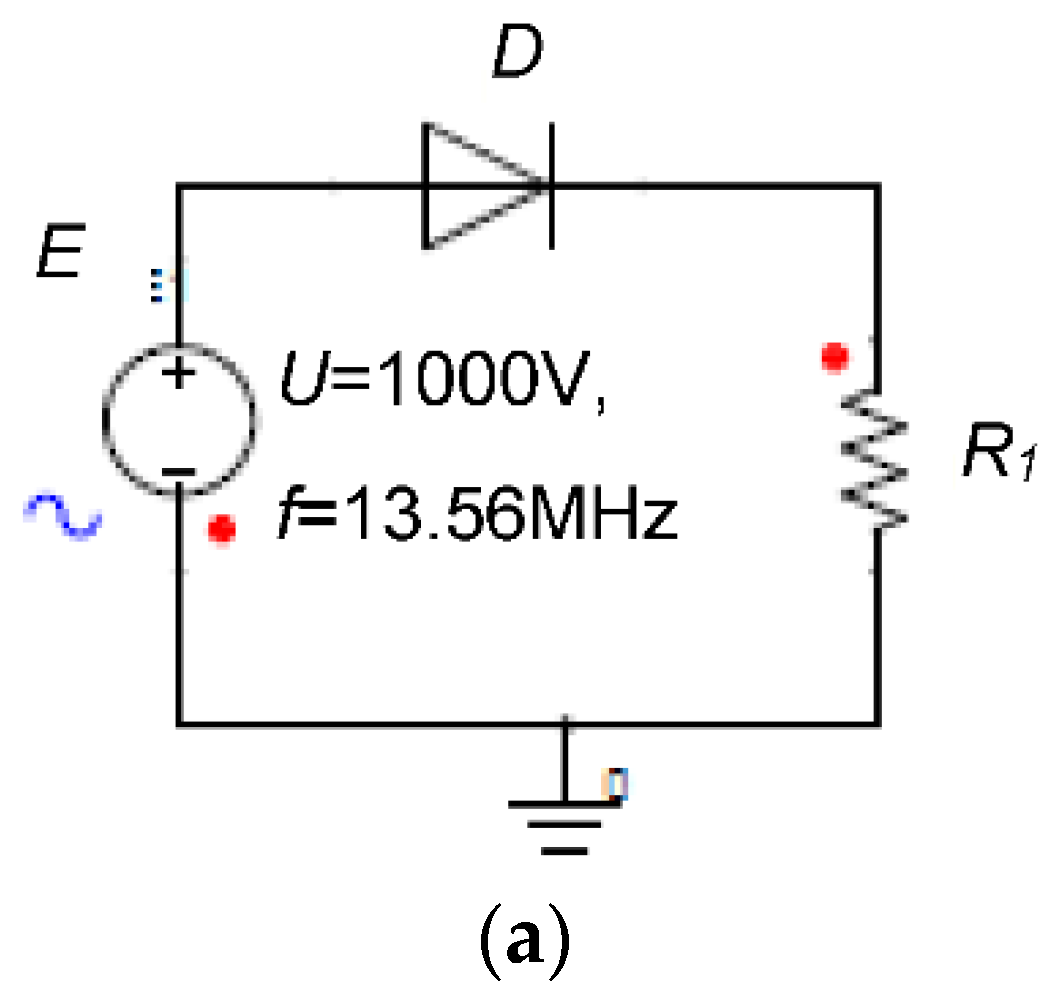
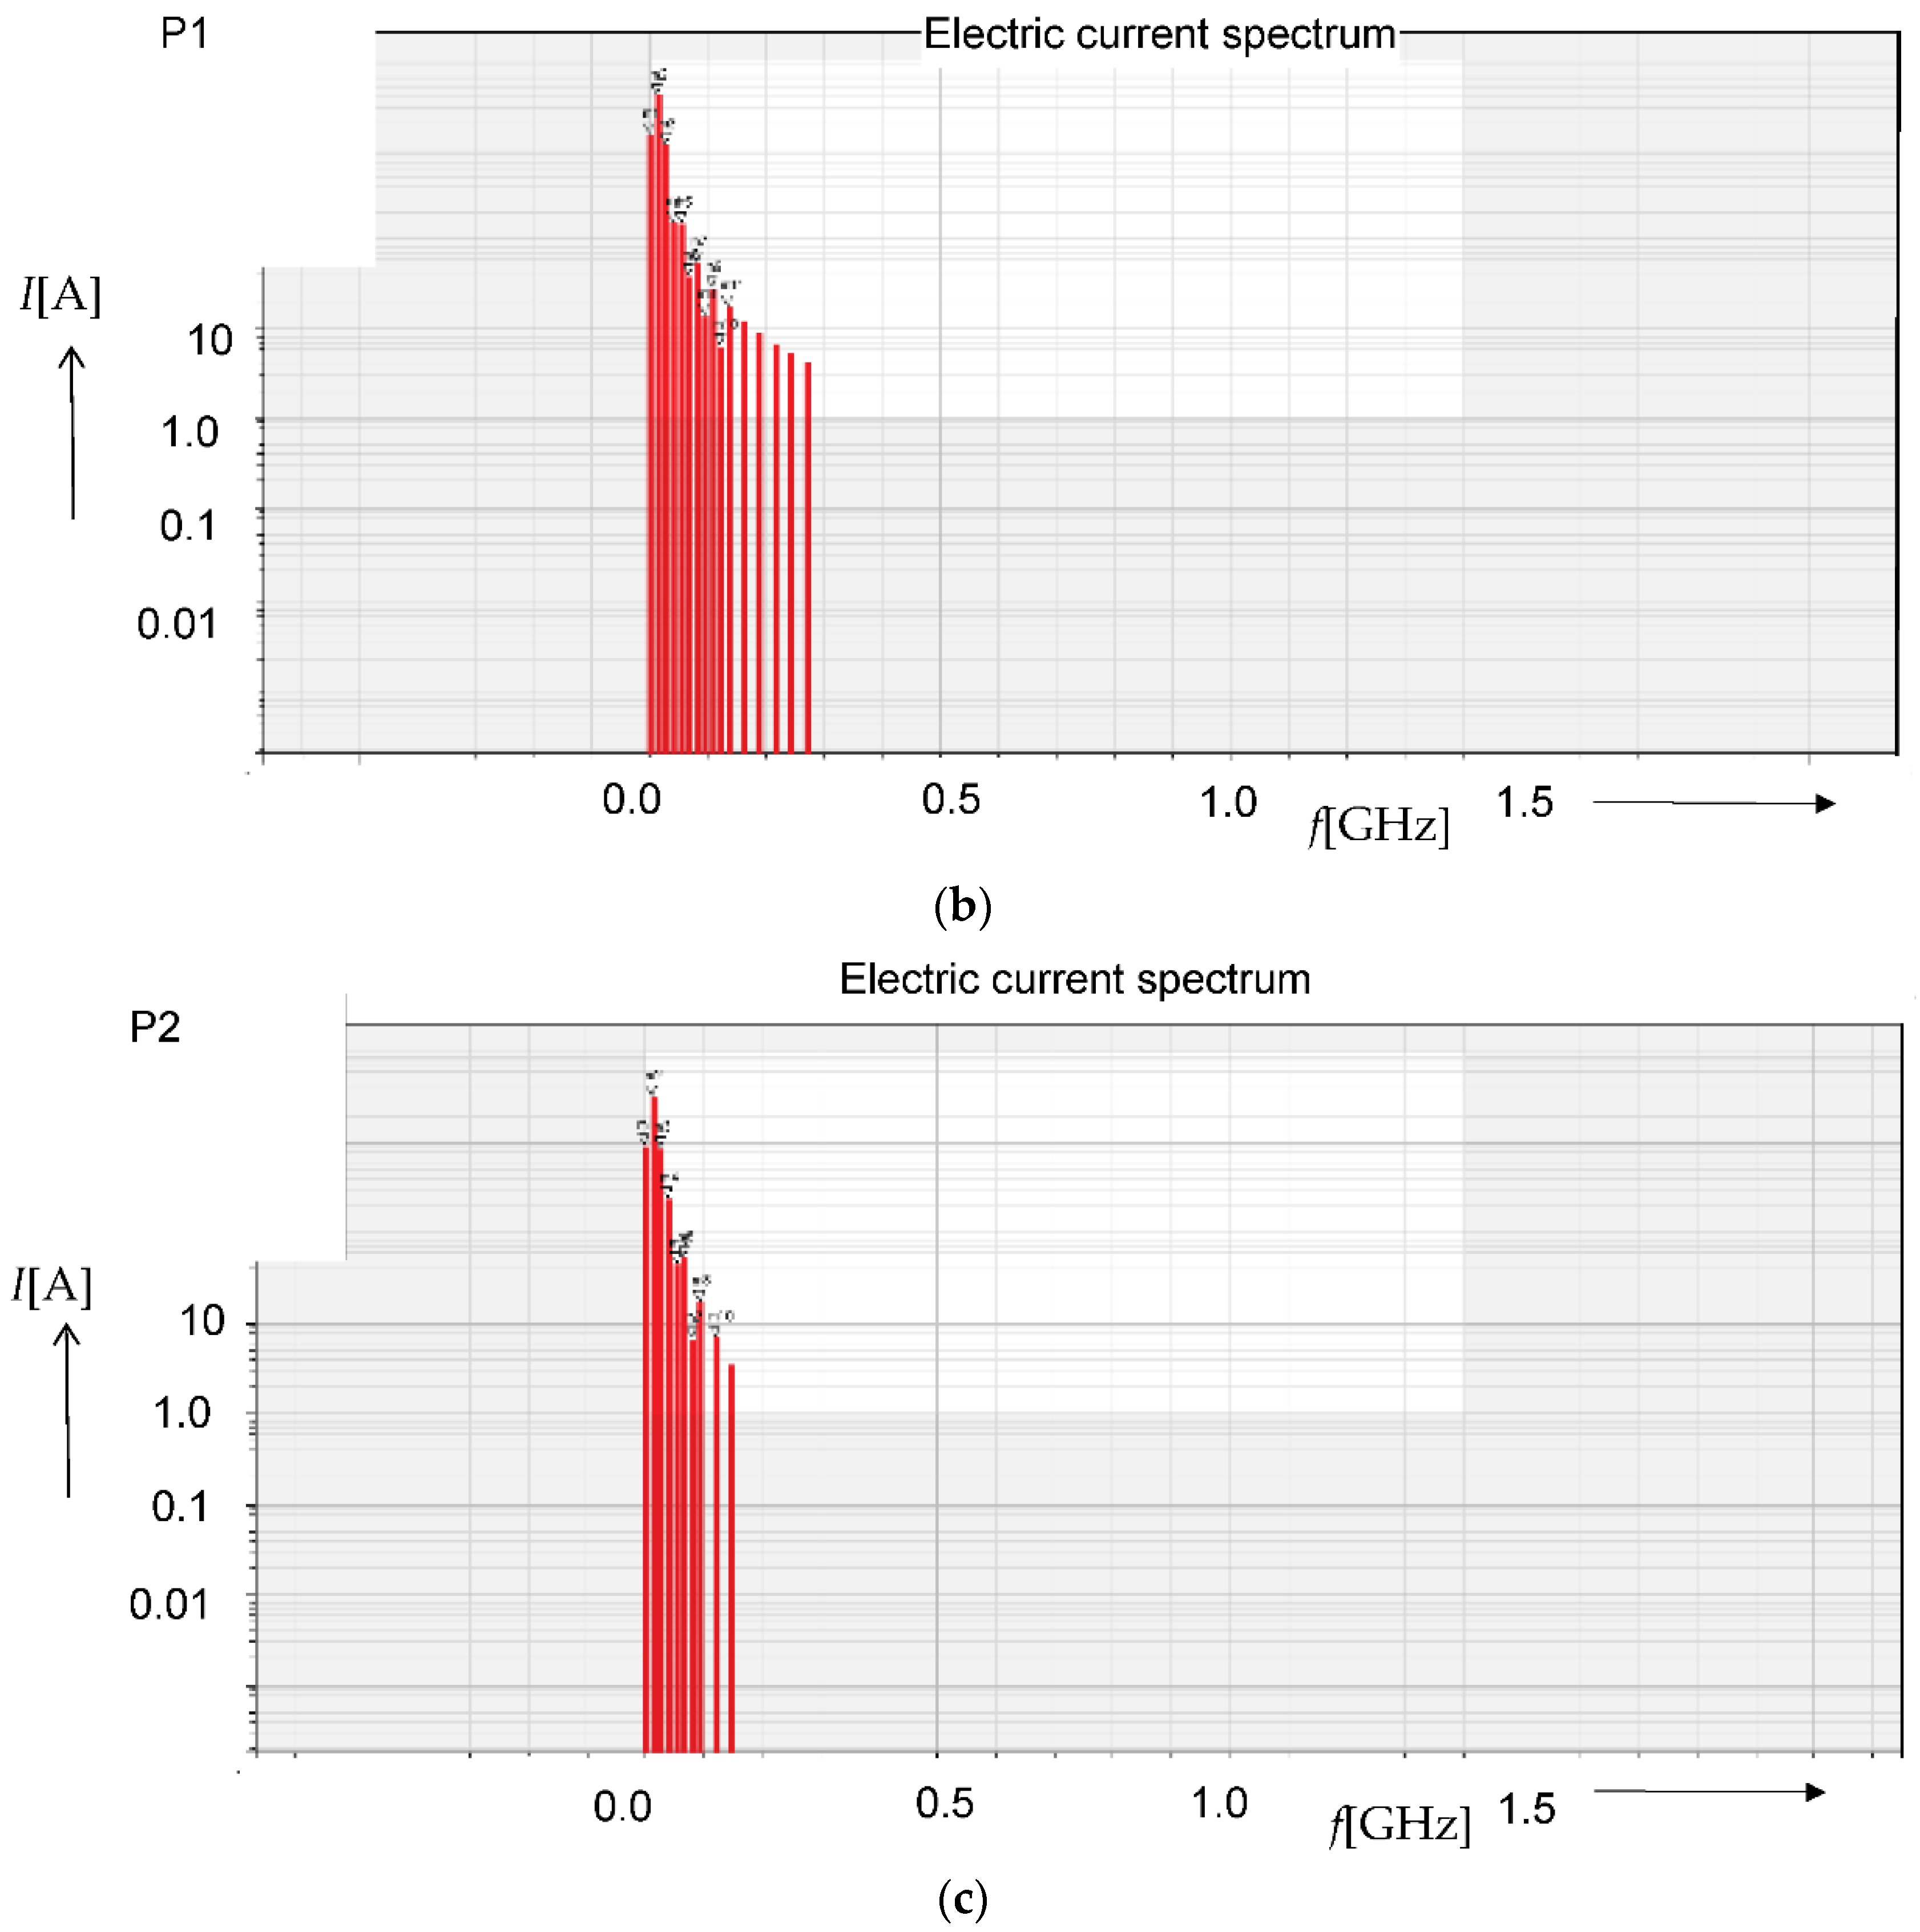
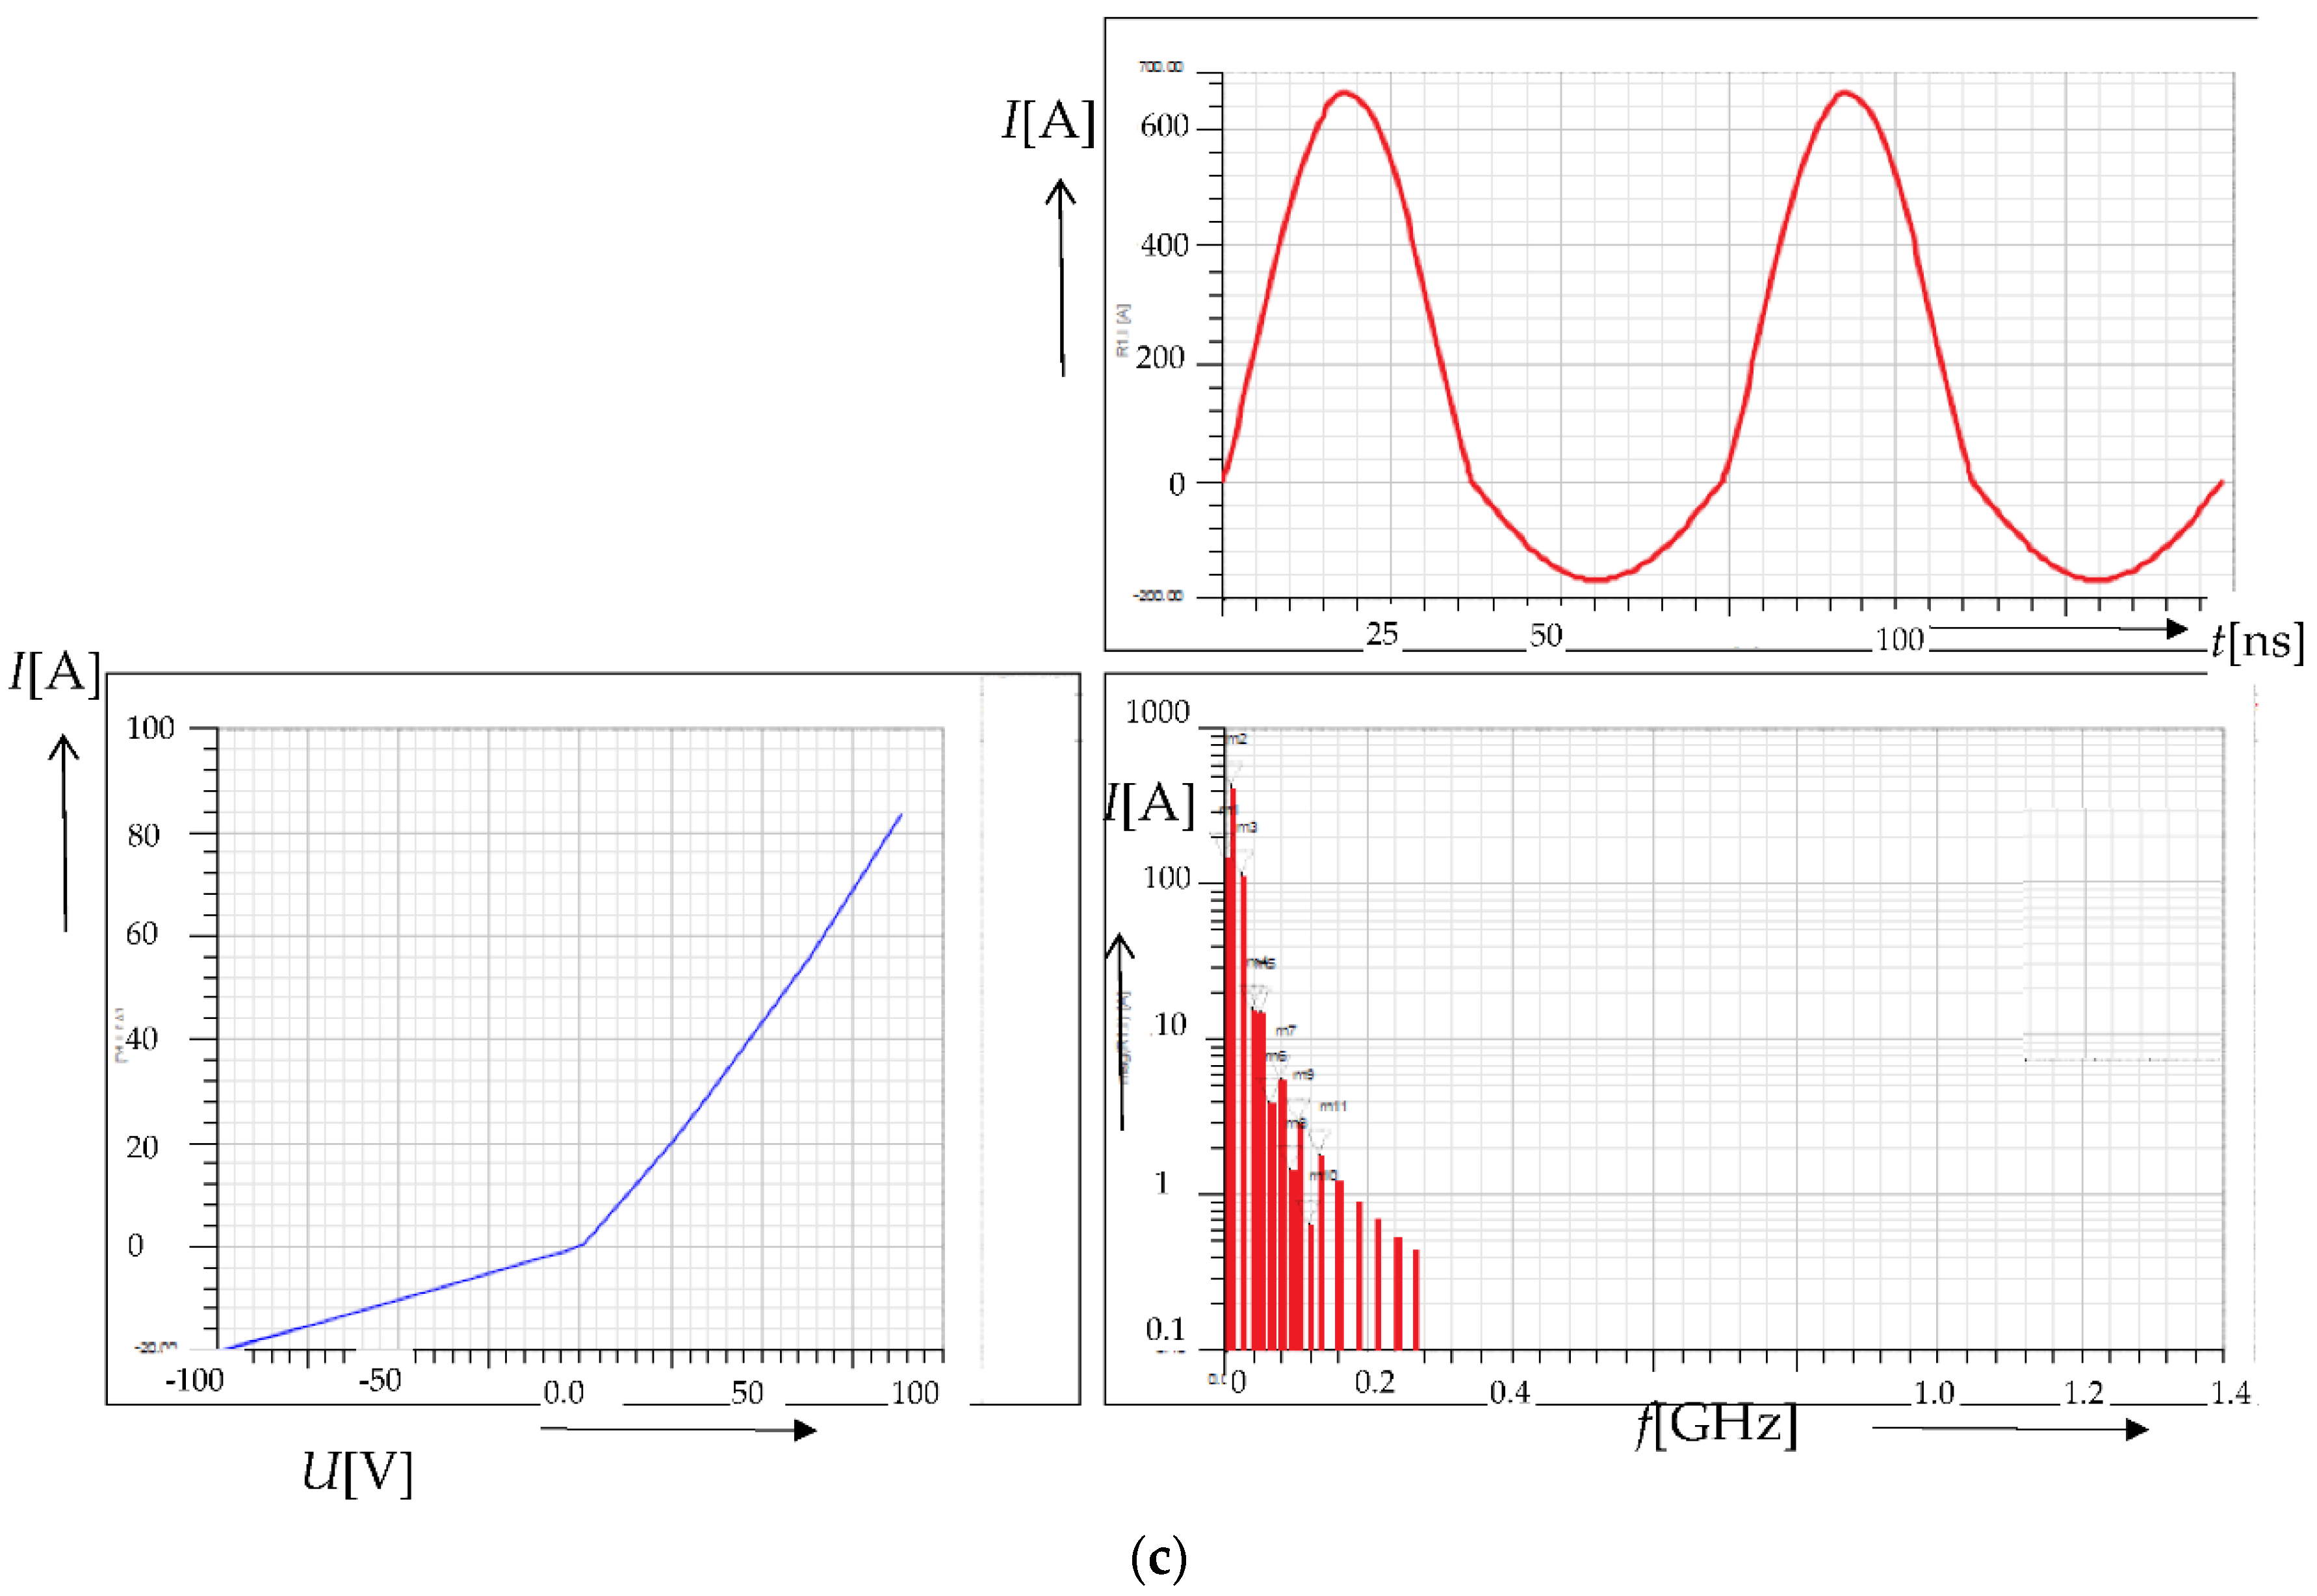
The numerical model to express the relationship between the obtained frequency spectrum of the signals in the burning of plasma inside the jet chamber channel (Figure 5c and Figure 8a) and the properties of the plasma was designed with concentrated parameters [12,14], shown in Figure 6a. This model was, at the same time, conceived to explain the spectral changes accompanying the parametric variation of the plasma, and its correctness was proved through experimental verification. By extension, modifications of the instantaneous values of the electrical voltage u(t) and current i(t) of the plasma channel allow us to acquire the frequency spectra and V–A characteristics (Figure 6b). During the experiment, with the plasma channel burning, it is possible to determine and record the volt–ampere characteristics, as shown in Figure 7a.
The basic experiments involving the numerical model (ANSYS-Circuit [14]) with concentrated parameters facilitate the parameterization of a change in the charge carrier concentration density with respect to the reference state in the plasma, and they are also instrumental in capturing the impact of variations in the density concentration and the mobility of the positive and negative charges, i.e., the electrons and ions, in the plasma. By comparing the instantaneous values of the patterns of the voltage u(t) on the electrodes of the plasma chamber and the electric current i(t) on the one hand and the spectra of the electric current on the other, the modeled values can be parametrically correlated with those obtained through the experiment, and the results of the analyses correspond to each other.
The initial design of the ANSYS-Circuit-based model [14] with the reference parameters of the plasma is visualized in Figure 6. The relevant quantities, processes, and values are defined as follows: voltage on the electrode, ue = Uemp f(t) [V]; electric current through the electrode, ie = Iemp f(t) [A]; gas flow rate, Ar vv = 5 l/min; limit decrease of voltage in the selected configuration on the plasma channel, Ut = 200 V; voltage characterizing a changed mobility of the positive and negative carriers of the electric charge, Uf = 0 V; resistivity of the channel in the negative carriers, Rch− = 1 Ω; resistivity of the channel in the positive carriers, Rch+ = 10 Ω; mean resistivity of the channel, R1 = 1Ω; maximum potential decrease value in the channel, Uemp = 1500 V; excitation source frequency, f = 13.56 MHz; and actual preset amplitude, Ug = 1000 V, Iemp = 1500 A. The parameters of the equivalent plasma model with concentrated parameters were determined on the basis of previous research [13], experiments, and measurements [19,28,29,30,35]. The values of the current Iemp, voltage Ug, and resistance R1 were merely measured and then evaluated on the experimental plasma channel from Figure 2a. To simplify and improve the evaluation in the numerical model, the currents, voltages, and resistances were modified to the above values.
Changes in the mobility or concentration of the positive and negative charges in the plasma (as expressed through Equation (21)) inside the jet chamber, namely, changes that are in contrast with the reference state in Figure 6a, require an evaluation of the frequency spectrum of the relevant non-linear circuit component (Figure 6a,b). The variation of the parameters corresponding to the physical model of the plasma (Figure 6c) expresses a change in the behavior of the instantaneous values of the voltage u(t) and current i(t) at the orifice of the plasma chamber, following the relevant V–A characteristics and frequency spectrum (Figure 6c). Diverse modes of changes in the parameters of the plasma model, together with variations in the detectable behavior of the above-presented quantities, are visualized in Figure 7a–c. The alterations were achieved via modifying the parameters of the model with concentrated parameters, namely, E-D-R1 and others (Figure 6a).

4. Comparing the Model and the Experiment

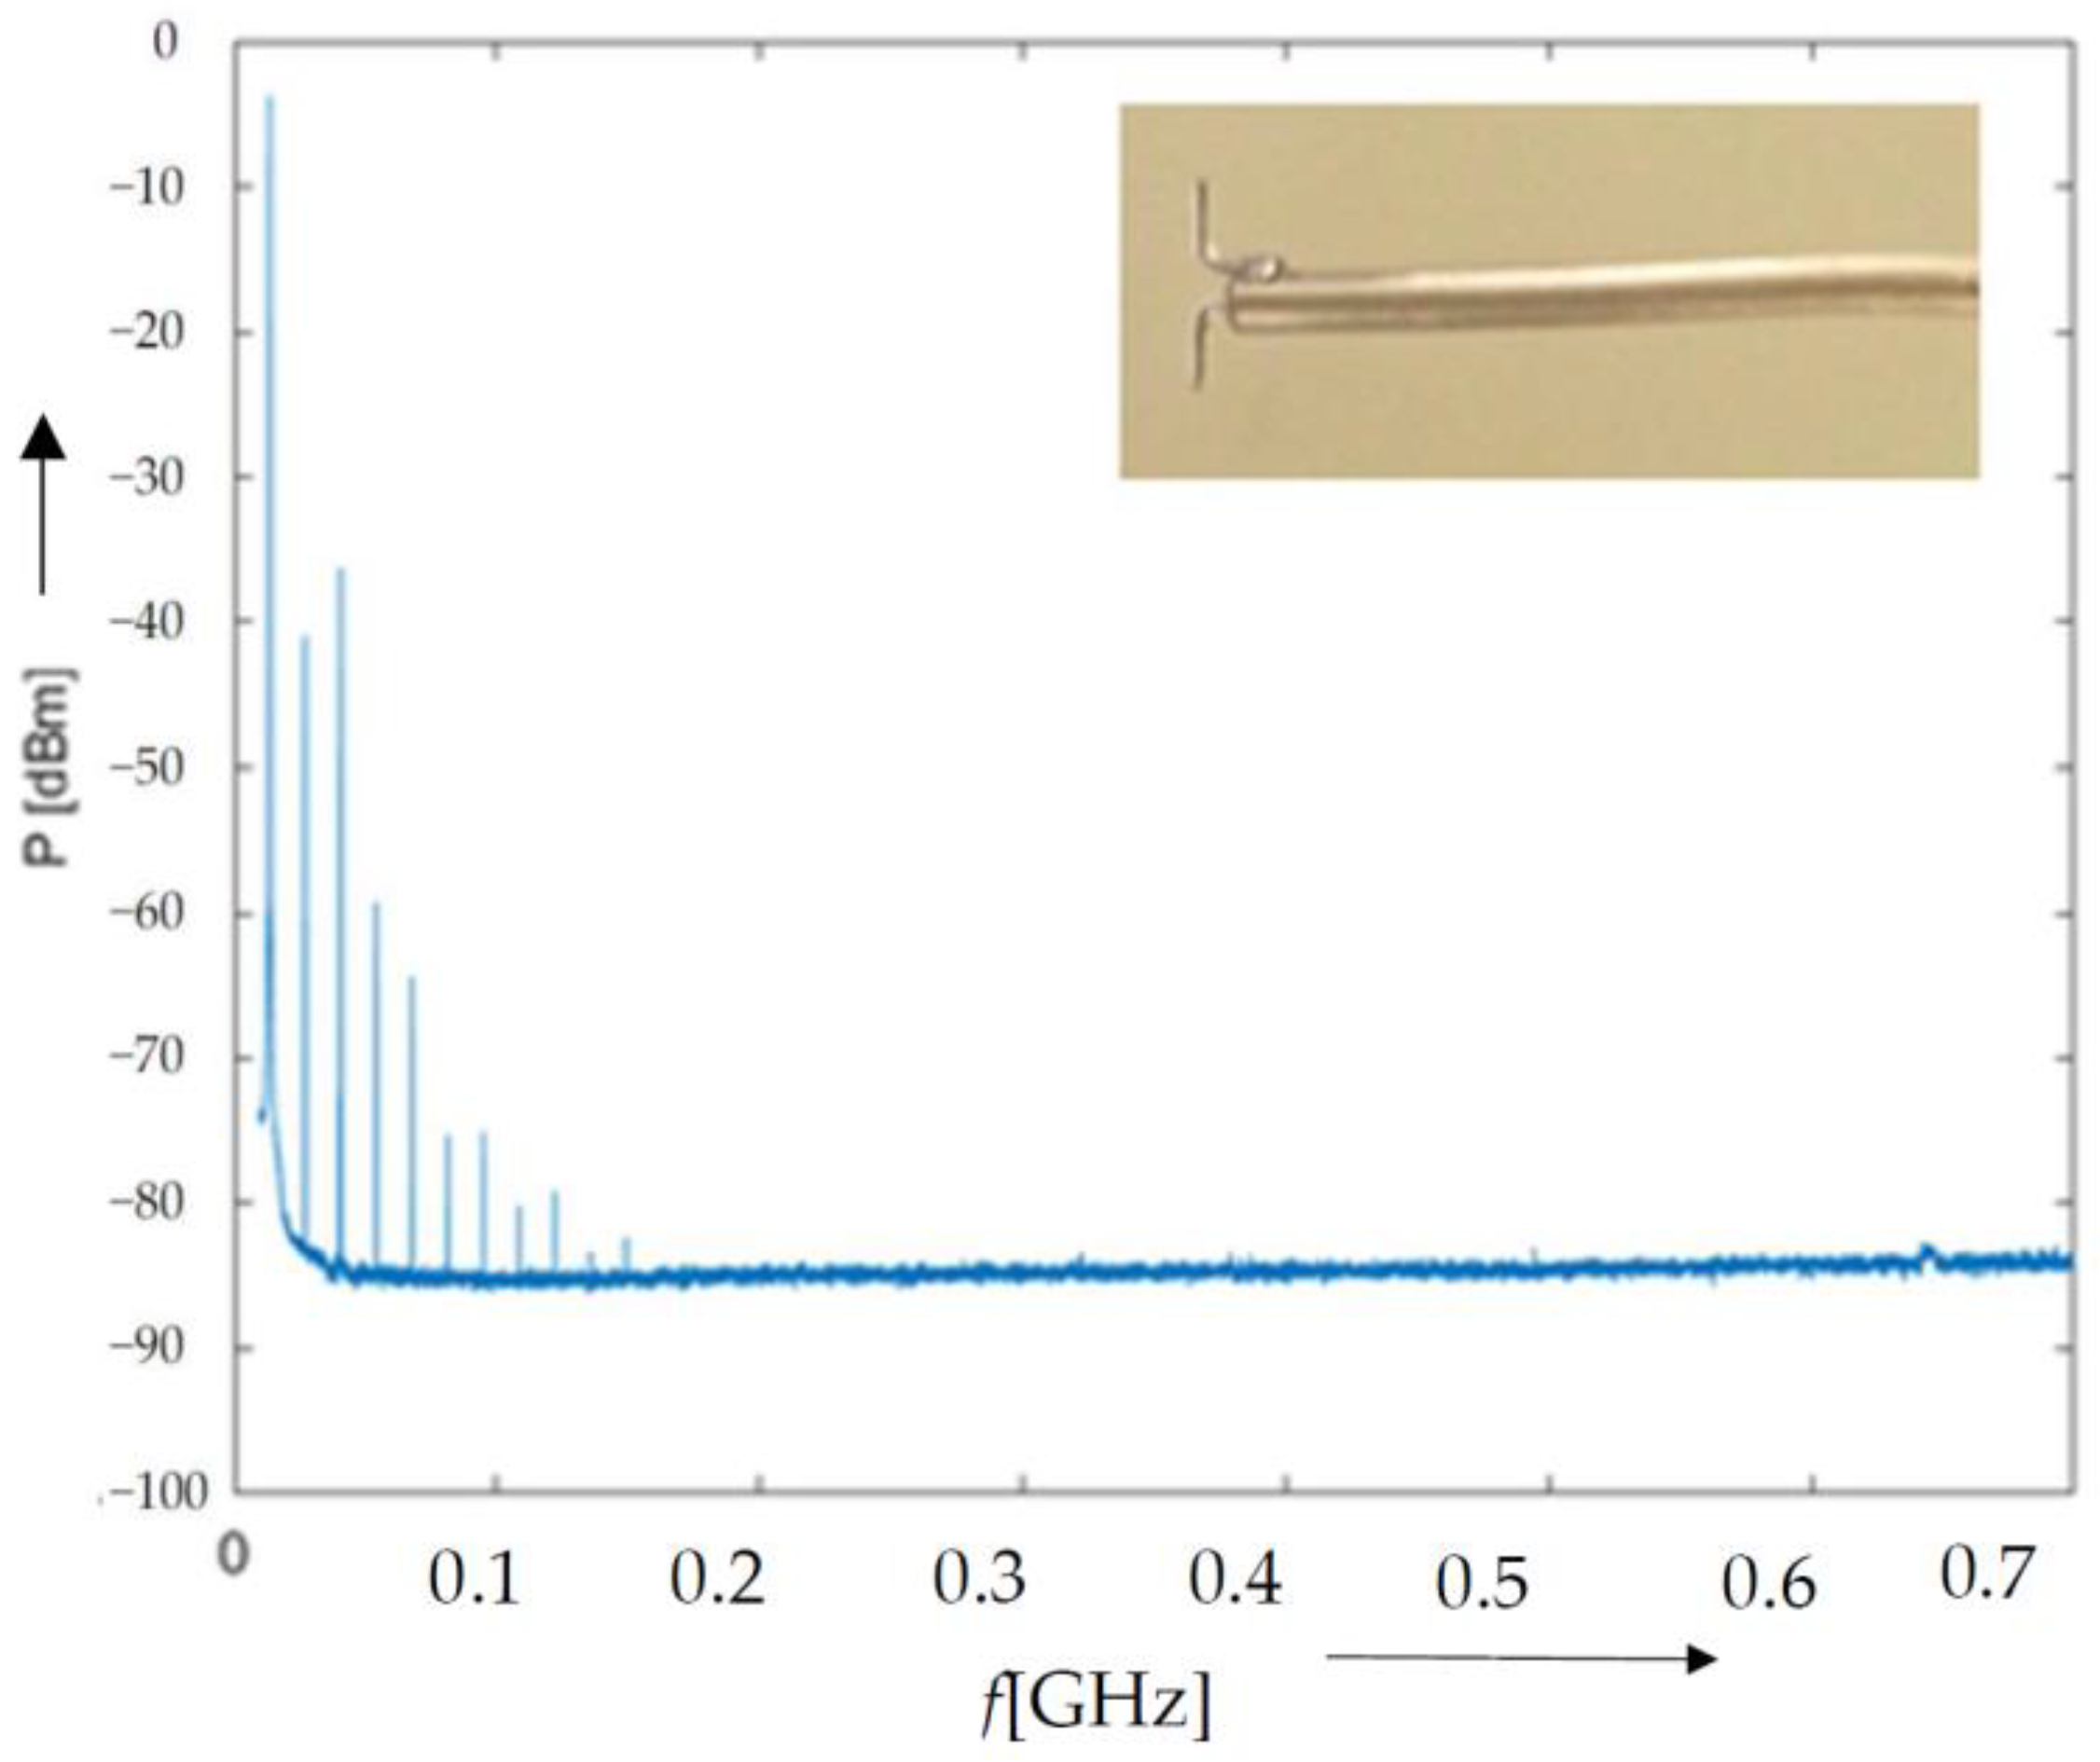
The designed concentrated parameter numerical model to evaluate the frequency spectrum in Figure 6 and Figure 7 was, together with changes in its characteristics, compared with the results of experiments, as shown in Figure 8, Figure 9 and Figure 10. These exploited a 10 mm long dipole antenna at a distance of 10 mm from the plasma. The relevant configurations and structures of the measuring procedures and tools are indicated in Figure 1 and Figure 8a,b. The antenna was connected to a ZVL-6 Rohde & Schwarz frequency analyzer operating at 9 kHz–6 GHz. The measurement and recording were carried out within the frequency range of f = 10–700 MHz, assuming the following plasma jet parameters: RF generator power of Pg = 50 W; argon flow rate of vv = 5 l/min (vv = 3 L/min); and distance between the plasma jet orifice and the base of l = 10 mm. The base was a grounded duralumin (Mg–Al alloy) plate 2 mm in thickness; this plate was in contact with the plasma.
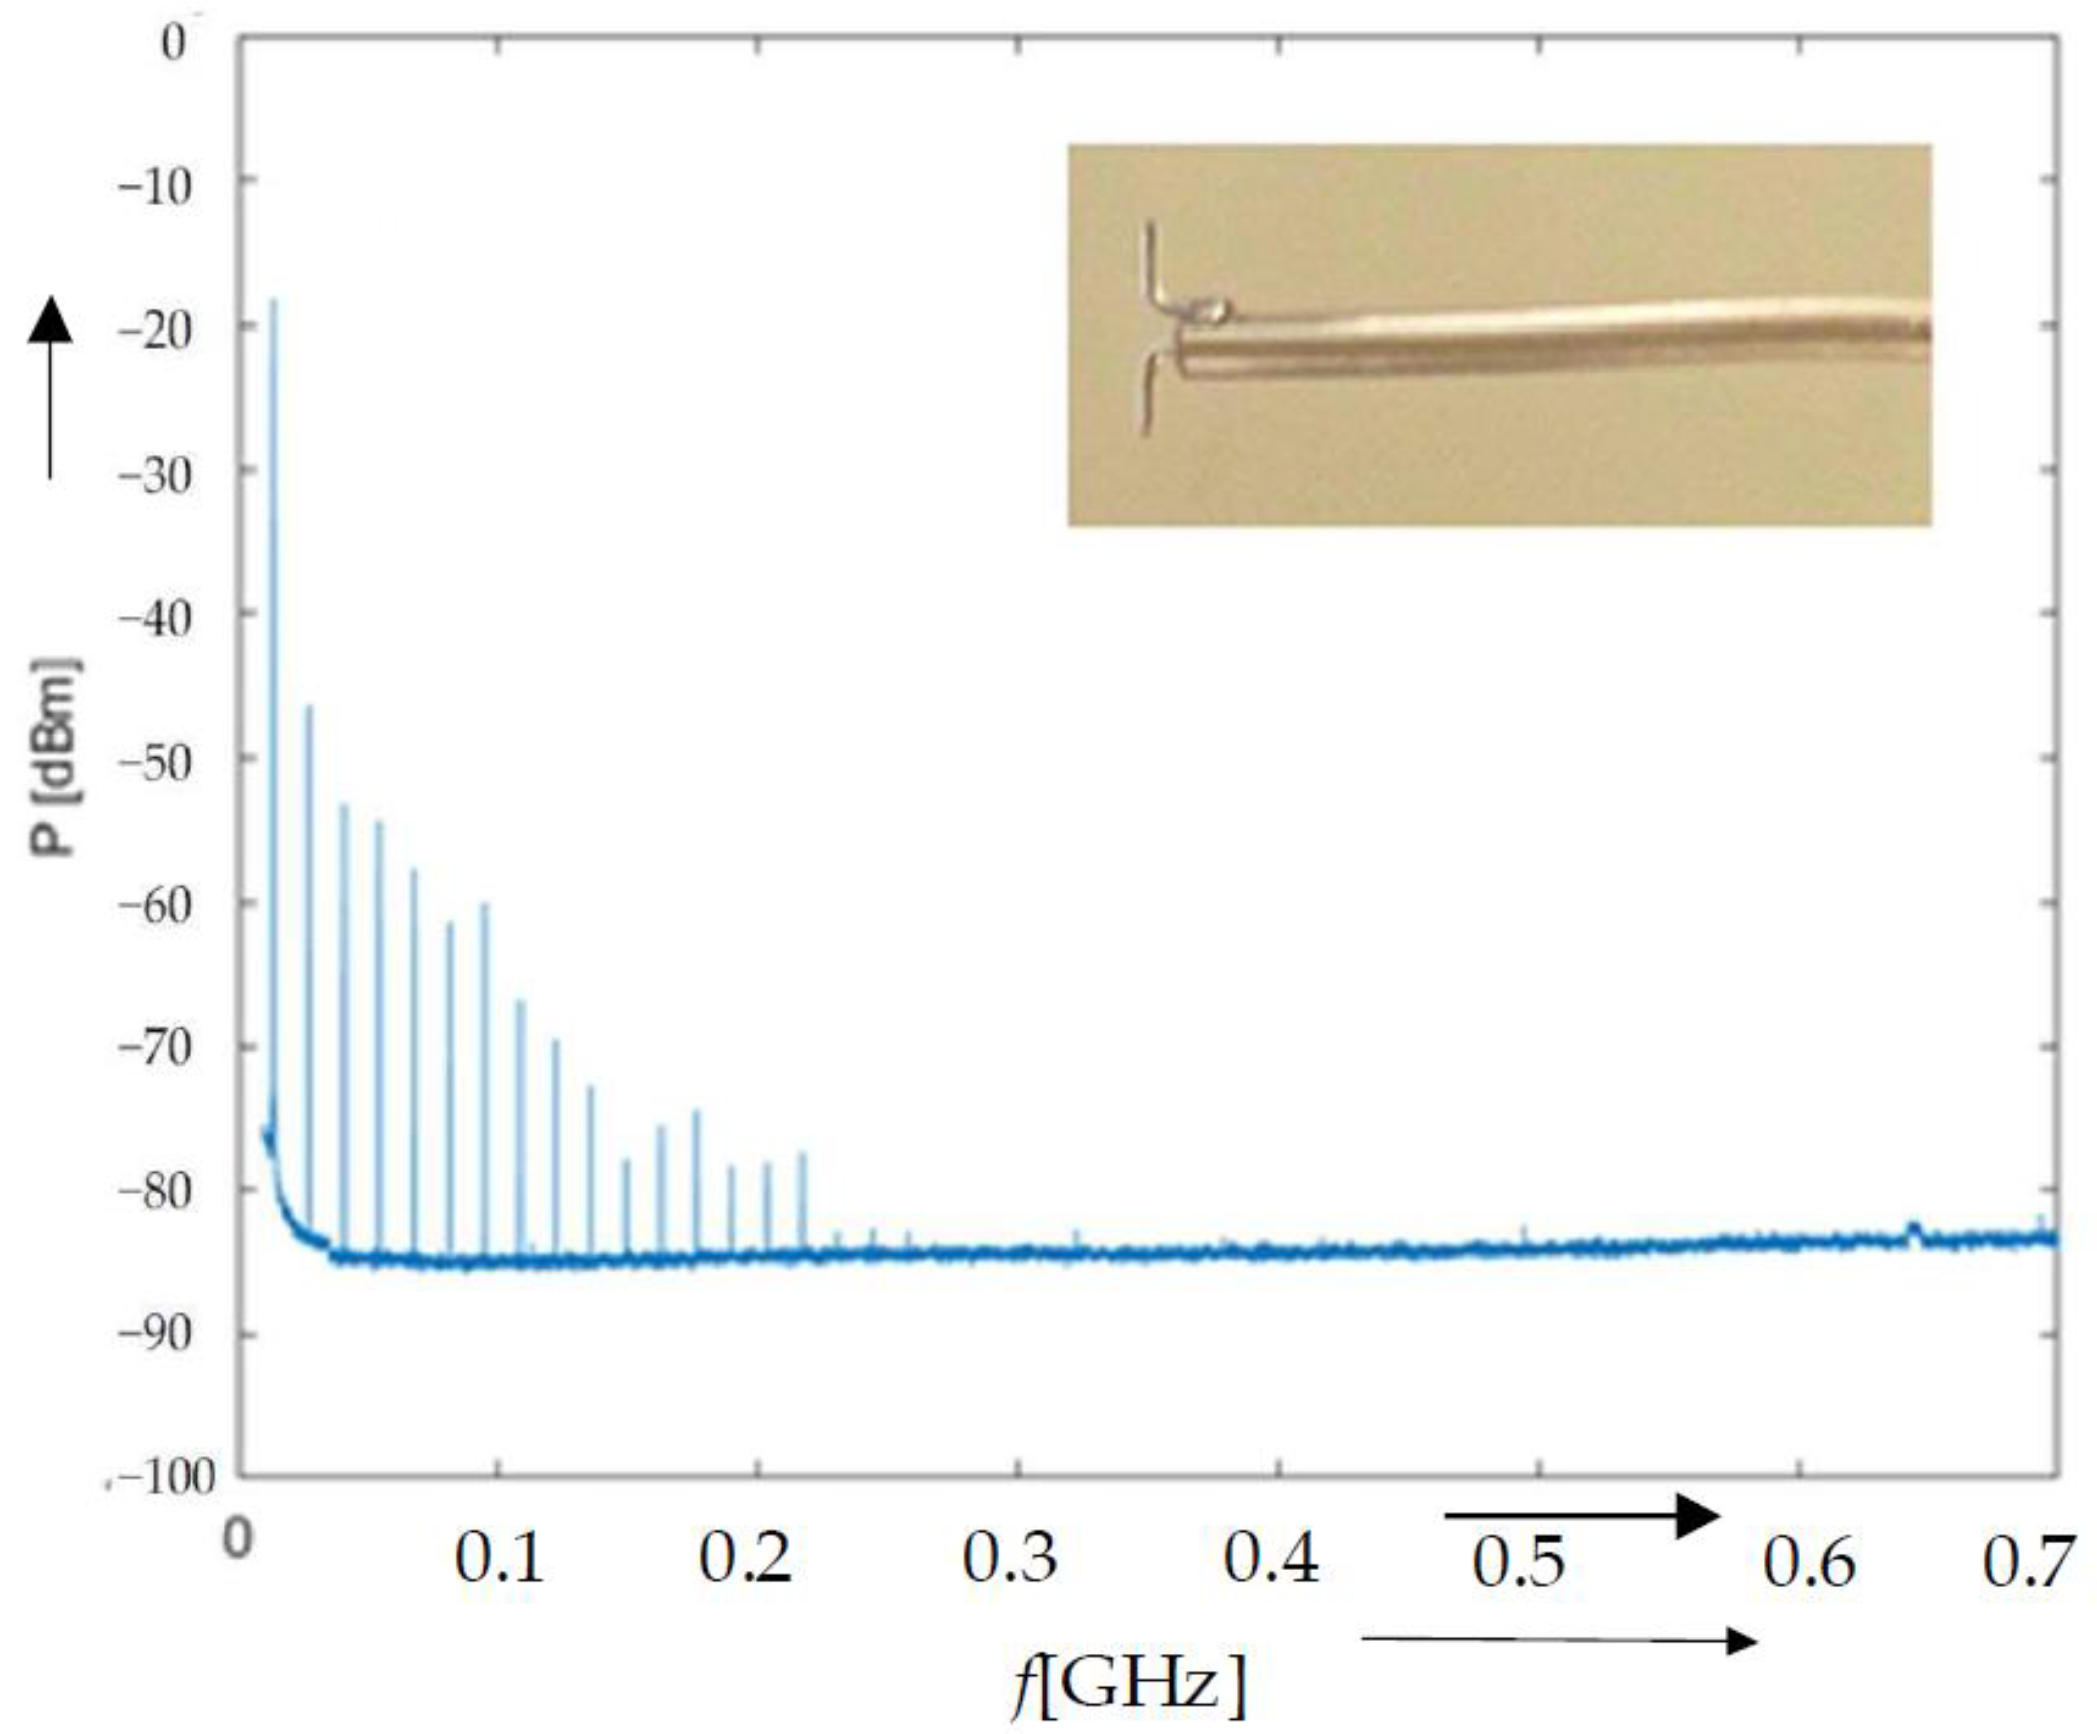
The parametric analysis, with the model (described in Equations (1)–(13)) respecting the above Formula (21), enabled us to explain the rules characterizing the distribution and behavior of the spectrum of the RF signals (Figure 6, Figure 7 and Figure 8), the discrete frequencies of the spectrum and their amplitudes, and the attenuation of the amplitudes in relation to the frequency. In terms of the experiments, the anticipated frequencies (see the spectra in Figure 6) corresponded to the parametric changes in the model with concentrated parameters‚ as shown in Figure 6 and Figure 7. The experiments were carried out at CEITEC laboratories, Brno University of Technology; the evaluated electromagnetic spectrum is presented in Figure 9 and Figure 10.
The numerical models with concentrated and distributed parameters reflected the observations and spectra made or obtained in the course of the comparative, ANSYS-Circuit-based experiments (Figure 6 and Figure 7). The models outlined both without the effect of the relative motion of plasma particles (1–18) and involving the plasma properties (19–21) were structured by using the FEM system ANSYS-HFSS [14]; the relevant analysis, comprising the interpretation of the monitored quantities, is presented in Figure 2, Figure 3, Figure 4 and Figure 5. The reduced data of the model with concentrated parameters (Figure 7) and the experiments are given in Table 2.
The complete relativistic model (1–18), including the properties of plasma (21), will be evaluated at the follow-up stage of this research according to [39,4041]. After the measurements and comparisons, we plan to embed a more detailed relativistic model in the analysis because the previous experiments [34] revealed the diverse impacts affecting the model (14–18).

5. Conclusions

Based on long-term experience with the numerical modeling, measurement, and metrology of microplasma, we designed a numerical model of a simple plasma jet, analyzed the related electromagnetic field, evaluated the associated effects and distributions of the electromagnetic field and the spectrum of the detected signal, and set up an experiment to measure the anticipated spectrum. The models were based on a simple description of the plasma, exploiting the macroscopic approach, and respected the composition of the channel, the configuration of the environment, and the initial and boundary conditions. We also included the impact of the non-linear aspects in the description of the plasma, respecting the influence of the temperature of the neutrals and involving diverse other parameters of the structure of the material upon which the plasma impinges.
The models and their analyses provided the theoretical foundations for the research, allowing us to shape the methodology and methods for the RF-based plasma measurement and to formulate the anticipated parameters and effects. The most advantageous working procedure was identified in monitoring the plasma discharge by means of an RF antenna and evaluating the spectral distribution of the obtained electromagnetic field. The changes in the spectrum corresponded to the parametric variations in the numerical models (to compare these, see Figure 7a,c, Figure 9 and Figure 10, for example).
Importantly, the resulting superposed electromagnetic field was markedly influenced by the sensor located in the near field of the source of the signal generated by the plasma from the jet. Thus, the actual presence of the sensor may significantly affect the measured data if the measurement is performed in the vicinity of the resonance frequency fk2 of the antenna. For this reason, it appears to be convenient to use complementary methods that sense the transversal magnetic component of the electromagnetic wave.
The proposed methodology of facilitation using numerical models (concentrated/distributed parameters) is unique in terms of plasma quality evaluation and has allowed us, based on the methods applied to date, to clarify the properties that have been revealed experimentally and are explainable by the model (properties of the sensed signal spectrum).

Author Contributions

P.F. and R.P. contributed to the theoretical part, numerical modeling, and design of the experiments, and they also co-wrote the paper; Z.S., M.K. and P.D. conceived and designed the experiments that allowed partial verification of the effects; and J.Z. with R.K. modified the manuscript graphically and participated in evaluating the experiments. All authors have read and agreed to the published version of the manuscript.

Funding

This research was funded by a grant from the Czech Science Foundation (GA-20-14105S).

Institutional Review Board Statement

Not applicable.

Informed Consent Statement

Not applicable.

Data Availability Statement

Not applicable.

Acknowledgments

The research was funded and supported within a grant from the Czech Science Foundation (GA-20-14105S). For the actual analyses and experiments, the infrastructure of the SIX Center was used.

Conflicts of Interest

The authors declare no conflict of interest. The funding organizations had no role in the concept of the study; in the collection, analyses, or interpretation of the data; in the writing of the manuscript; or in the decision to publish the results.

References

  1. Ishikawa, K. Plasma diagnostics. In Cold Plasma in Food and Agriculture: Fundamentals and Applications; Academic Press: Cambridge, MA, USA, 2016; pp. 117–141. [Google Scholar] [CrossRef]
  2. Liao, L.; He, J. Discussion on laser-induced plasma diagnostics under condition of optically thick. Optik 2016, 127, 4878–4880. [Google Scholar] [CrossRef]
  3. Donne, A.J.H. Introduction to plasma diagnostics. Fusion Technol. 1994, 25 Pt 2, 291–296. [Google Scholar]
  4. Brown, N.P.; Steinberg, A.M.; Deibel, J.A.; Walker, M.L.R. Assessment of the capability of terahertz time-domain spectroscopy as a plasma diagnostic. In Proceedings of the AIAA Propulsion and Energy 2020 Forum, Virtual Event, 24–26 August 2020; pp. 1–20. [Google Scholar] [CrossRef]
  5. Fiala, P.; Drexler, P.; Nespor, D.; Szabo, Z.; Mikulka, J.; Polivka, J. The evaluation of noise spectroscopy tests. Entropy 2016, 18, 443. [Google Scholar] [CrossRef] [Green Version]
  6. Fiala, P.; Jirku, T.; Drexler, P.; Dohnal, P. Detection of partial discharge inside of HV transformer, modeling, sensors and measurement. In Proceedings of the PIERS 2010 Cambridge—Progress in Electromagnetics Research Symposium, Cambridge, MA, USA, 5–8 July 2010; pp. 1013–1016. [Google Scholar]
  7. Myška, R.; Drexler, P. Simulation and verification of methods for partial discharge source localization. In Proceedings of the Progress in Electromagnetics Research Symposium, Kuala Lumpur, Malaysia, 27–30 March 2012; pp. 704–708. [Google Scholar]
  8. Drexler, P.; Fiala, P. Methods for high-power em pulse measurement. IEEE Sens. J. 2007, 7, 1006–1011. [Google Scholar] [CrossRef]
  9. Guo, Y.; Guan, Y.; Xiang, Y. Diagnostic value of high-frequency color doppler in plasma cell mastitis. J. Dalian Med. Univ. 2014, 36, 556–558. [Google Scholar] [CrossRef]
  10. Liu, Y.; Morita, S.; Huang, X.; Oishi, T.; Goto, M.; Zhang, H. Component investigation of ionization stages on tungsten unresolved transition array spectra for plasma diagnostics based on space-resolved extreme-ultra violet spectroscopy in large helical device. J. Appl. Phys. 2017, 122, 233301. [Google Scholar] [CrossRef]
  11. Norberg, S.A.; Johnsen, E.; Kushner, M.J. Helium atmospheric pressure plasma jets touching dielectric and metal surfaces. J. Appl. Phys. 2015, 118, 013301. [Google Scholar] [CrossRef]
  12. Stratton, J.A. Electromagnetic Theory; Wiley: New York, NY, USA, 1941; pp. 1–640. [Google Scholar]
  13. Kikuchi, H. Electrohydrodynamics in Dusty and Dirty Plasmas, Gravito-Electrodynamics and EHD; Kluwer: Boston, MA, USA, 2001; pp. 1–207. [Google Scholar]
  14. ANSYS. Ansys Multiphysics Manuals; ANSYS: Canonsburg, PA, USA, 2020; Available online: https://www.ansys.com/ (accessed on 19 January 2022).
  15. Weisstein, E.W. Galerkin Method; MathWorld. 2015. Available online: https://mathworld.wolfram.com/GalerkinMethod.html (accessed on 19 January 2022).
  16. Bartusek, K.; Drexler, P.; Fiala, P.; Kadlec, R.; Kubasek, R. Magnetoinductive Lens for Experimental Mid-field MR Tomograph. In Proceedings of the Piers 2010 Cambridge Progress in Electromagnetics Research Symposium, Cambridge, MA, USA, 5–8 July 2010; Volume 1–2, pp. 1047–1050. [Google Scholar]
  17. Zhang, D.; Ranjan, B.; Tanaka, T.; Sugioka, K. Multiscale hierarchical micro/nanostructures created by femtosecond laser ablation in liquids for polarization-dependent broadband antireflection. Nanomaterials 2020, 10, 1573. [Google Scholar] [CrossRef]
  18. Haňka, L. Teorie Elektromagnetického Pole; paperback SNTL: Praha, Czech Republic, 1971. [Google Scholar]
  19. Madrova, T. Supravodivost ve Čtvrtém Skupenství (Superconductivity in the Fourth State). Master’s Thesis, Brno Univerzity of Technology, Brno, Czech Republic, 2020; pp. 1–88. [Google Scholar]
  20. Kousal, J.; Pokorná, J.; Brablec, A.; Slavíček, P.; Klíma, M.; Janča, J. Electron concetration in atmospheric non-isotermal plasma jet. Czechoslov. J. Phys. 2002, 52, 571–575. [Google Scholar]
  21. Drexler, P.; Fiala, P.; Klima, M.; Gescheidtova, E.; Zajickova, L. A plasma chamber: Electromagnetic modeling and experiments. In Proceedings of the Progress in Electromagnetics Research Symposium, Rome, Italy, 17–20 June 2019; pp. 2570–2573. [Google Scholar] [CrossRef]
  22. Fiala, P.; Bartusek, K.; Steinbauer, M. A novel hypothesis for quantum physics, model with telegraphs equation. In Proceedings of the Progress in Electromagnetics Research Symposium, Hangzhou, China, 24–28 March 2008; Volume 2, pp. 1189–1192. [Google Scholar]
  23. Drexler, P.; Fiala, P. Utilization of faraday mirror in fiber optic current sensors. Radioengineering 2008, 17, 2.101–2.107. [Google Scholar]
  24. Fiala, P.; Drexler, P.; Nespor, D. Principal tests and verification of a resonance-based solar harvester utilizing micro/nano technology. Microsyst. Technol. 2014, 20, 845–860. [Google Scholar] [CrossRef]
  25. Urban, R.; Drexler, P.; Fiala, P.; NeŠpor, D. Numerical model of a large periodic structure. In Proceedings of the Progress in Electromagnetics Research Symposium, Guangzhou, China, 25–28 August 2014; pp. 2350–2354. [Google Scholar]
  26. Bartusek, K.; Kubasek, R.; Fiala, P. Determination of pre-emphasis constants for eddy current reduction. Meas. Sci. Technol. 2010, 21, 105601. [Google Scholar] [CrossRef]
  27. Steinbauer, M.; Pernica, R.; Zukal, J.; Kadlec, R.; Bachorec, T.; Fiala, P. Modeling electromagnetic nanostructures and experimenting with nanoelectric elements to form periodic structures. Inform. Autom. Pomiary W Gospod. I Ochr. Środowiska 2020, 10, 4–14. [Google Scholar] [CrossRef]
  28. Klíma, M.; Slavíček, P.; Šíra, M.; Čižmár, T.; Vaněk, P. HF plasma pencil and DC diaphragm discharge in liquids—diagnostics and application. Czechoslov. J. Phys. 2006, 56, B1051–B1056. [Google Scholar] [CrossRef]
  29. Slavíček, P.; Brablec, A.; Kapička, V.; Klíma, M.; Šíra, M. Longitudinal emission diagnostics of plasma channel in rf barrier torch discharge. Acta Phys. Slovaca 2005, 55, 573–576. [Google Scholar]
  30. Fiala, P.; Machac, J.; Polivka, J. Microwave noise field behaves like white light. Prog. Electromagn. Res. 2011, 111, 311–330. [Google Scholar]
  31. Fiala, P.; Szabó, Z.; Friedl, M. EMHD models respecting relativistic processes of trivial geometries. In Proceedings of the Progress in Electromagnetics Research Symposium, Marrakesh, Morocco, 20–23 March 2011; pp. 95–98. [Google Scholar]
  32. Steinbauer, M.; Fiala, P.; Szabo, Z.; Bartusek, K. Experiments with accuracy of the air ion field measurement. Adv. Electr. Electron. Eng. 2008, 8, 276–279. [Google Scholar]
  33. Drexler, P.; Čáp, M.; Fiala, P.; Steinbauer, M.; Kadlec, R.; Kaška, M.; Kočiš, L. A sensor system for detecting and localizing partial discharges in power transformers with improved immunity to interferences. Sensors 2019, 19, 923. [Google Scholar] [CrossRef] [Green Version]
  34. Fiala, P. Pulse-powered virtual cathode oscillator. IEEE Trans. Dielectr. Electr. Insul. 2011, 18, 1046–1053. [Google Scholar] [CrossRef]
  35. Fiala, P.; Sadek, V.; Kriz, T. Numerical modeling of electromagnetic field a tornado. In Proceedings of the Progress in Electromagnetics Research Symposium, Hangzhou, China, 24–28 March 2008; Volume 2, pp. 1180–1184. [Google Scholar]
  36. Moisan, M.; Pelltier, J. Microwave Excited Plasmas; Elsevier: Amsterdam, The Netherlands, 1992; ISBN 0-444-88815-2. [Google Scholar]
  37. AlShunaifi, I.A.; Elaissi, S.; Ghiloufi, I.; Alterary, S.S.; Alharbi, A.A. Modelling of a Non-Transferred Plasma Torch Used for Nano-Silica Powders Production. Appl. Sci. 2021, 11, 9842. [Google Scholar] [CrossRef]
  38. Vinoth Kumar, S.H.B.; Ibaceta-Jaña, J.; Maticuic, N.; Kowiorski, K.; Zelt, M.; Gernert, U.; Lipińska, L.; Szyszka, B.; Schlatmann, R.; Hartmann, U.; et al. Applicability of Atmospheric Pressure Plasma Jet (APPJ) Discharge for the Reduction in Graphene Oxide Films and Synthesis of Carbon Nanomaterials. C 2021, 7, 71. [Google Scholar] [CrossRef]
  39. Demetriades, S.T.; Argyropoulos, G.S. Ohm’s law in multicomponent nonisothermal plasmas with temperature and pressure gradients. Phys. Fluids 1966, 9, 2136–2149. [Google Scholar] [CrossRef]
  40. Taccogna, F.; Dilecce, G. Non-equilibrium in low-temperature plasmas. Eur. Phys. J. D 2016, 70, 251. [Google Scholar] [CrossRef]
  41. Kodanova, S.K.; Issanova, M.K.; Amirov, S.M.; Ramazanov, T.S.; Tikhonov, A.; Moldabekov, Z.A. Relaxation of non-isothermal hot dense plasma parameters. Matter Radiat. Extrem. 2018, 3, 40–49. [Google Scholar] [CrossRef] [Green Version]
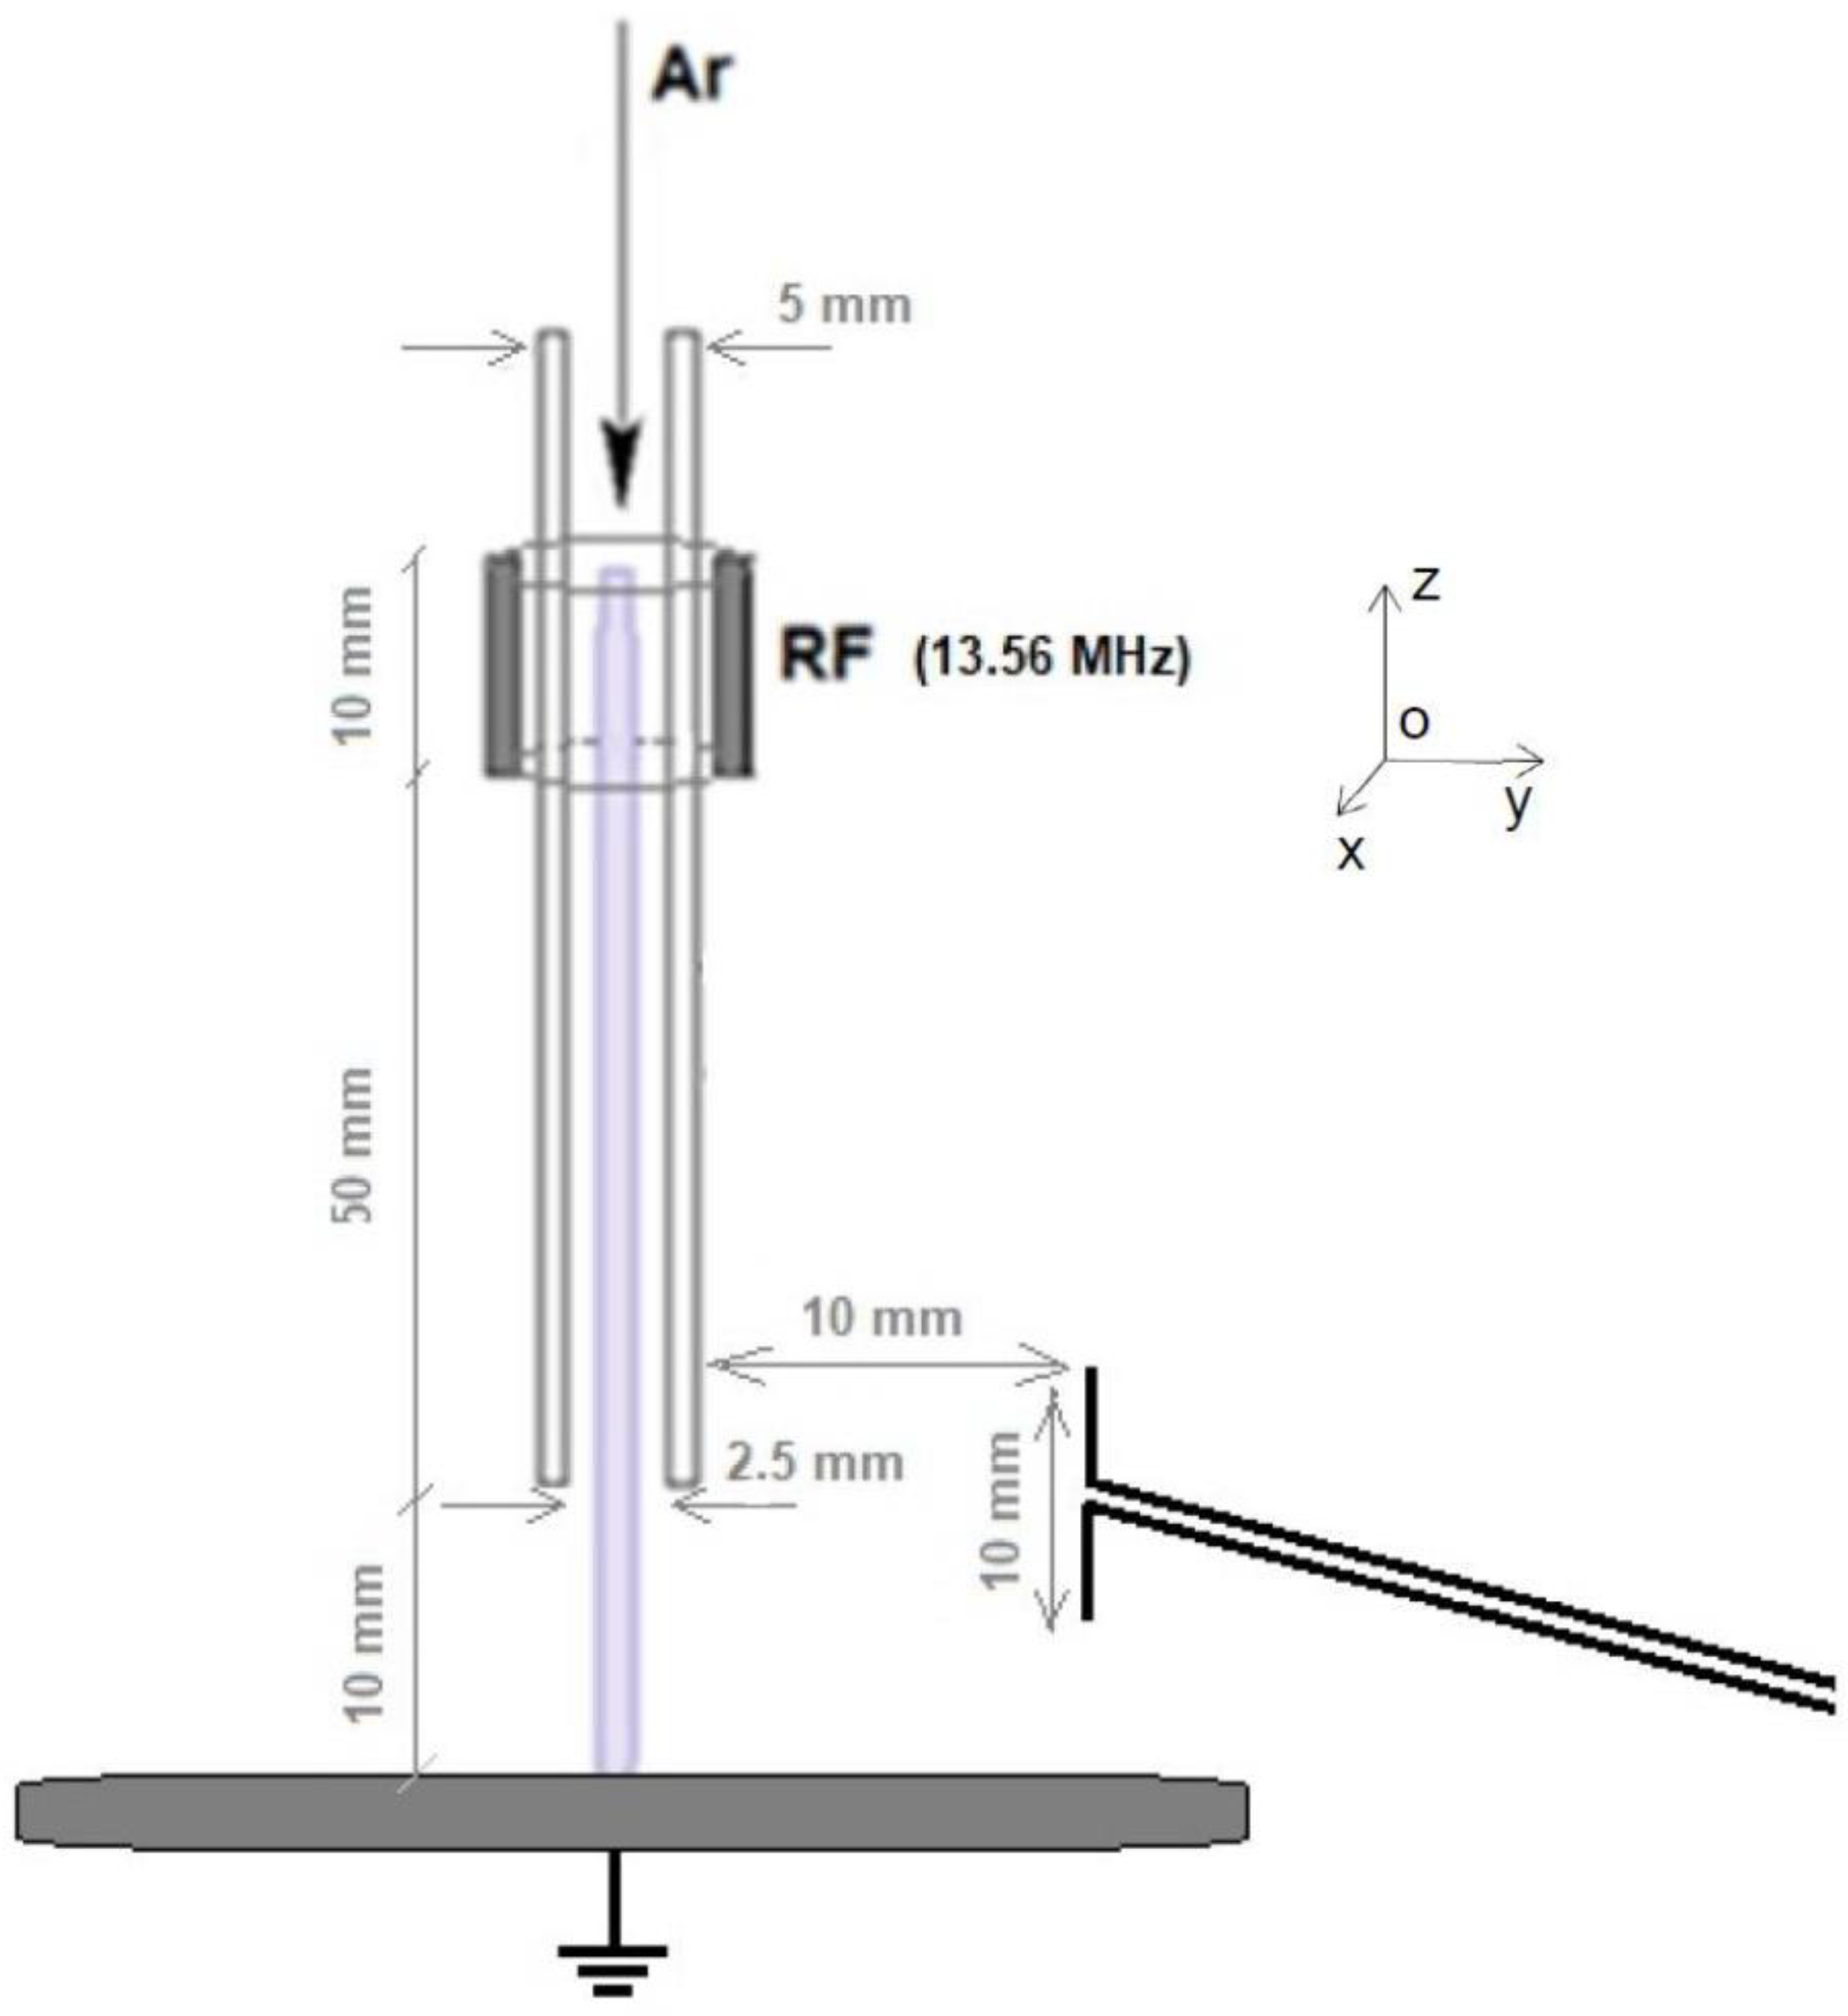
Figure 1. The plasma jet and the measurement of the electromagnetic field with a dipole antenna.
Modelling 03 00005 g001
Figure 2. The geometrical arrangement of the plasma channel, single-turn electrode, external medium, and bottom metal plate: (a) the geometrical model; (b) the distribution of the volume loss density Pvol [Wm−3], f = 13.56 MHz; (c) the distribution of the intensity of the electric field E [Vm−1], f = 13.56 MHz; (d) parameter s11mod, f = 10 MHz–28 MHz.
Modelling 03 00005 g002aModelling 03 00005 g002b
Figure 3. Analyzing and evaluating the geometrical arrangement of the plasma channel, single-turn electrode, external medium, and bottom metal plate: (a) parameter s11mod, f = 10 MHz–1 GHz; (b) parameter z11mod, f = 10 MHz–1 GHz; (c) parameter z11arg, f = 10 MHz–1 GHz.
Modelling 03 00005 g003aModelling 03 00005 g003b
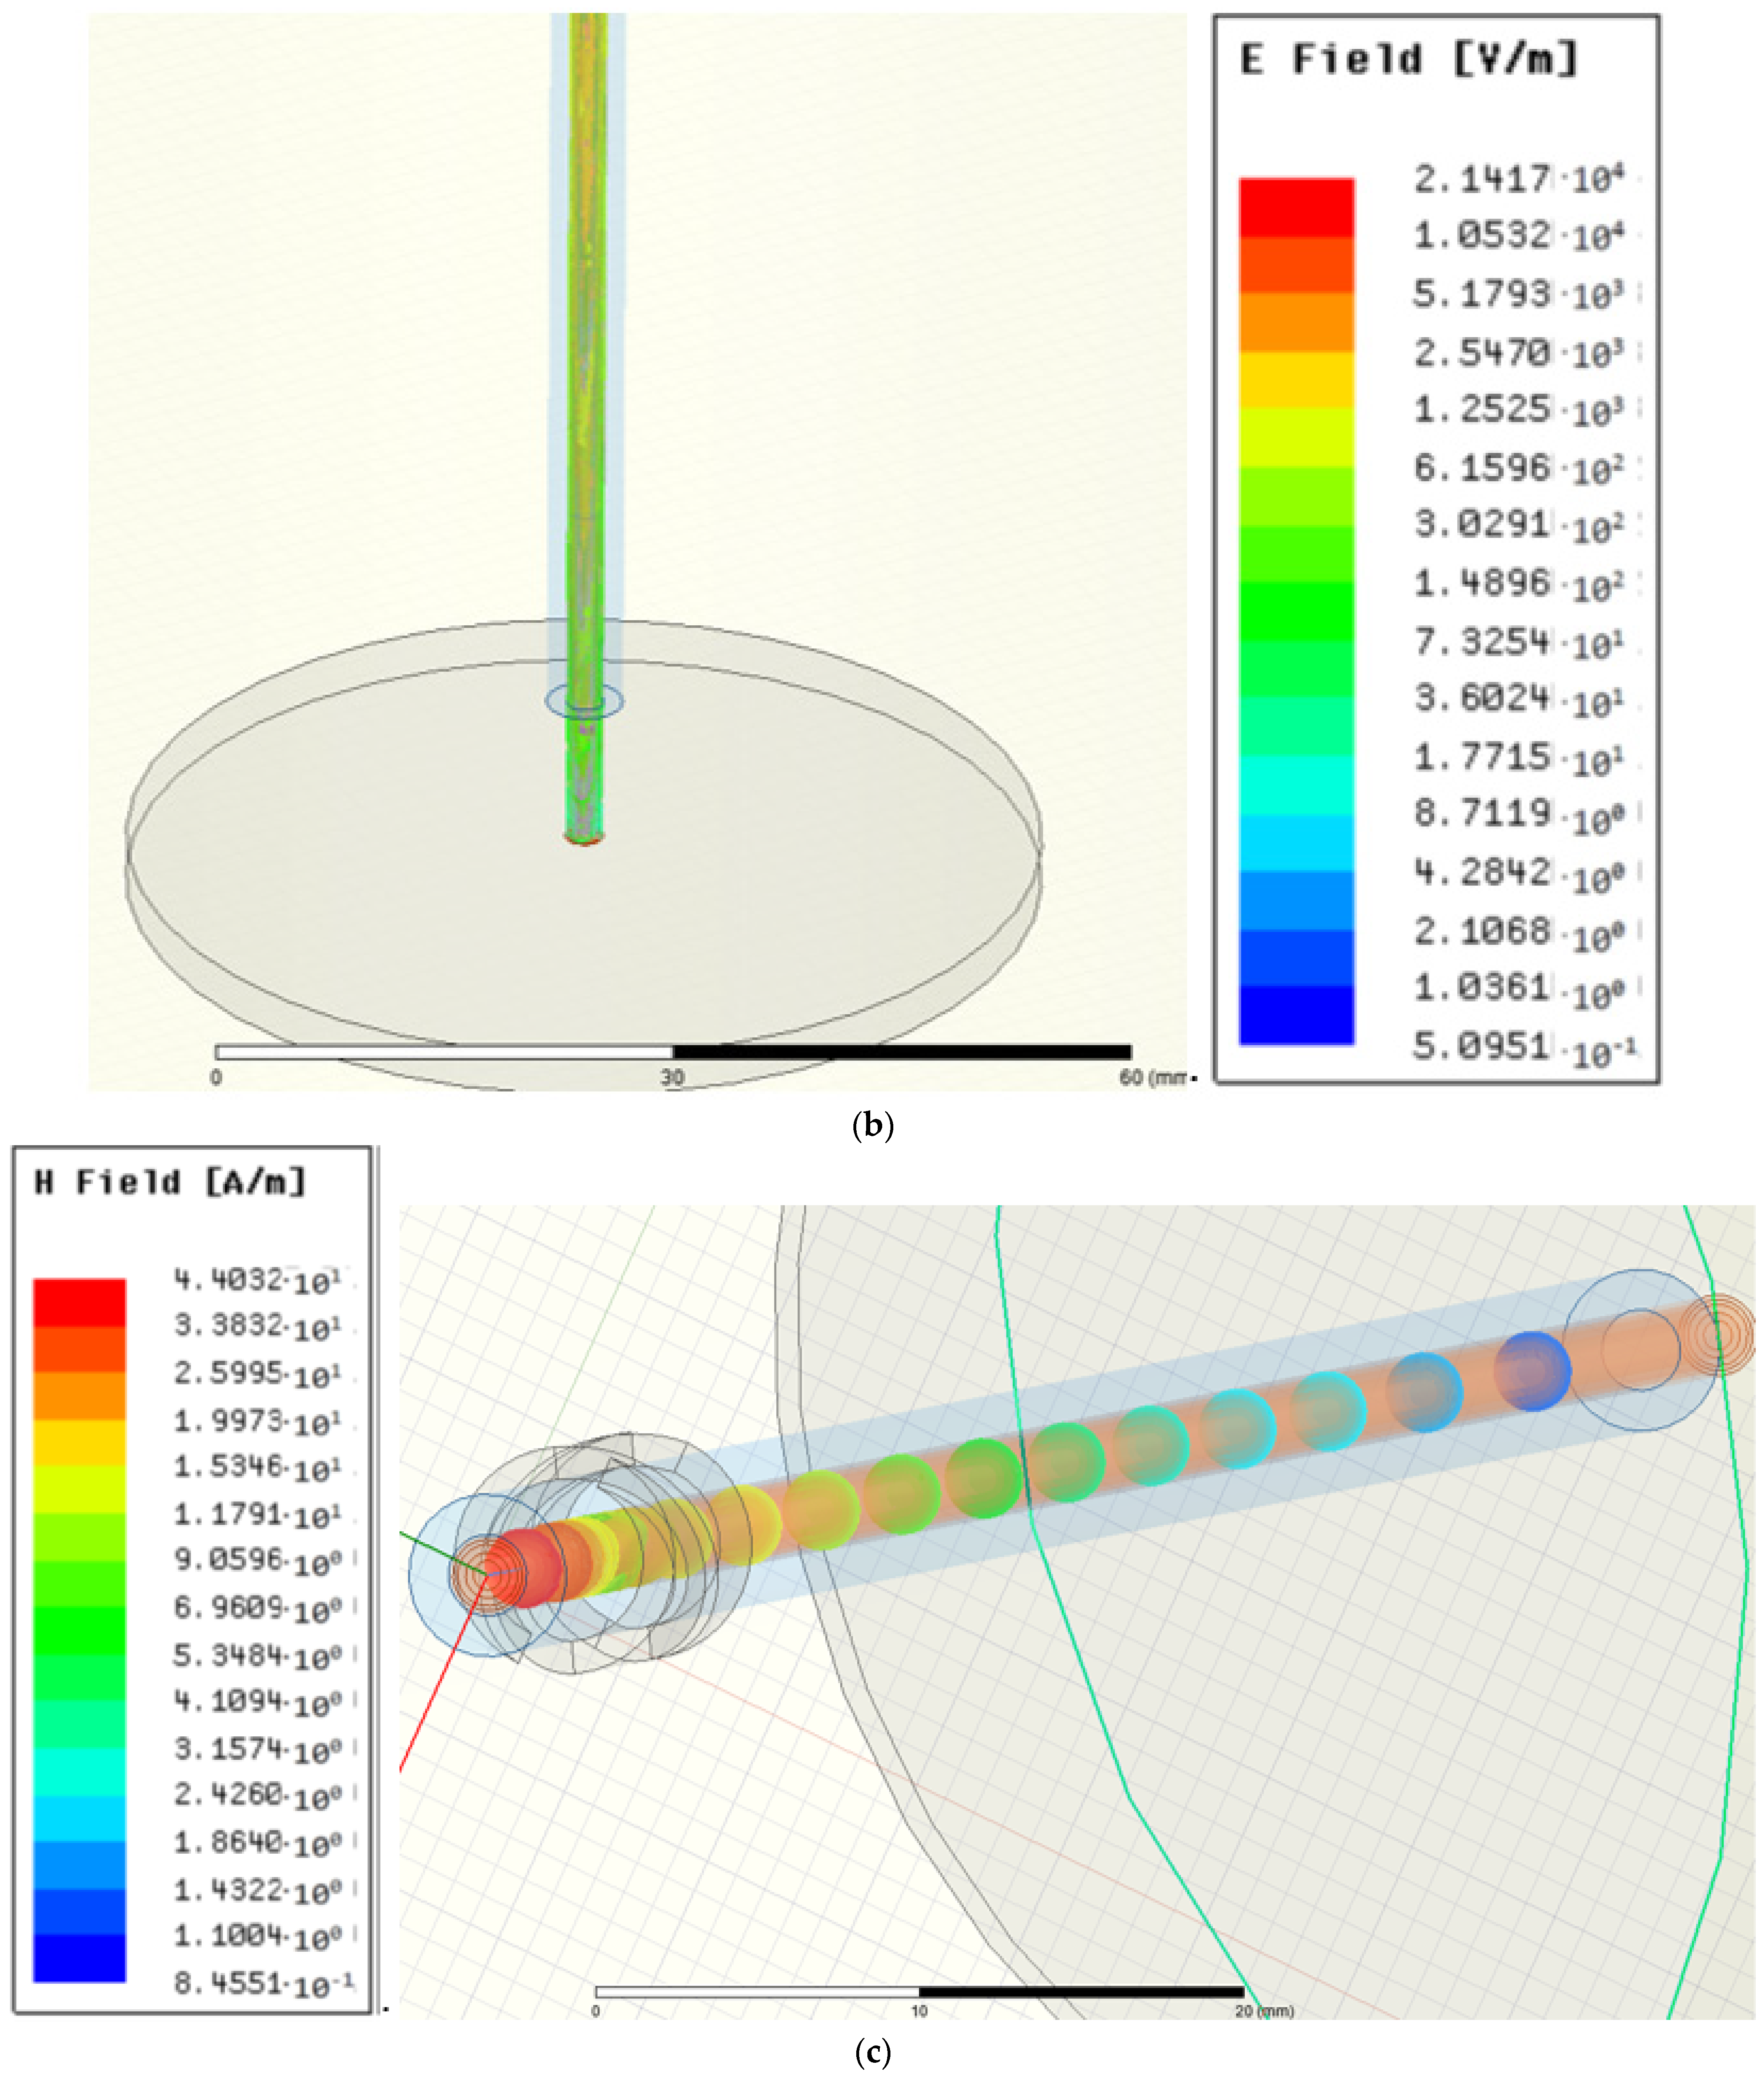
Figure 4. Analyzing and evaluating the geometrical arrangement of the plasma channel, single-turn electrode, external medium, and bottom metal plate: (a) the distribution of the volume loss density Pvol [Wm−3], f = 13.56 MHz, at the orifice; (b) the distribution of the intensity of the electric field E [Vm−1], f = 13.56 MHz, at the orifice; (c) the overall distribution of the intensity of the magnetic field H [Am−1], f = 13.56 MHz; (d) the overall distribution of the volume loss density Pvol [Wm−3], f = 13.56 MHz; (e) the overall distribution of the intensity of the electric field E [Vm−1], f = 13.56 MHz.
Modelling 03 00005 g004aModelling 03 00005 g004bModelling 03 00005 g004c
Figure 5. Analyzing and evaluating the geometrical arrangement of the plasma channel, single-turn electrode, external medium, bottom metal plate, and antenna: (a) the geometrical model with the sensing antenna TE; (b) parameter z11mod, f = 10 MHz–1 GHz; (c) parameter z11arg, f = 10 MHz–1 GHz.
Modelling 03 00005 g005
Figure 6. Analyzing and evaluating the geometrical arrangement of the plasma channel and the single-turn electrode: Configuration of the external environment, including the non-linearities of the plasma channel according to formula (21), VA-characteristic, time domain signal, and frequency domain signal, fmax = 1.4 GHz: (a) A description of the model via concentrated parameters, respecting the above non-linear Formula (21); (b) The analyzed spectrum of the behavior of the instantaneous value of the current i(t), relating to functional parameters P1 such as Ut = 200 V, Uf = 0 V, Rch− = 1 Ω, Rch+ = 5 Ω, R1 = 1 Ω, Uemp = 1500 V, f = 13.56 MHz, Ug = 1000 V, Iemp = 1500 A. These parameters correspond to a higher concentration of the discharge carriers with respect to the reference setting of the model (Figure 5); (c) The analyzed spectrum of the behavior of the instantaneous value of the current i(t), relating to functional parameters P2 such as Ut = 200 V, Uf = 0 V, Rch− = 1 Ω, Rch+ = 10 Ω, R1 = 2 Ω, Uemp = 1500 V, f = 13.56 MHz, Ug = 1000 V, Iemp = 1500 A. These parameters correspond to a lower concentration of the discharge carriers with respect to the reference setting of the model.
Modelling 03 00005 g006aModelling 03 00005 g006b
Figure 7. Analyzing and evaluating the geometrical arrangement of the plasma channel and the single-turn electrode: Configuration of the external environment, including the non-linearities of the plasma channel according to Formula (21), VA-characteristic, time domain signal, and frequency domain signal, fmax = 1.4 GHz: (a) The analyzed spectrum of the behavior of the instantaneous value of the current i(t), relating to functional parameters such as Ut = 0.8 V, Uf = 0.0 * 35 V, Rch− = 3 Ω, Rch+ = 5 Ω, R1 = 3 Ω, Uemp = 700 V, f = 13.56 MHz, Ug = 300 V, Iemp = 700 A. These parameters correspond to a more intensive recombination of the charge carriers with respect to the reference setting of the model; (b) The analyzed spectrum of the behavior of the instantaneous value of the current i(t), relating to functional parameters such as Ut = 0.8 V, Uf = 0.0 * 35 V, Rch− = 3 Ω, Rch+ = 5 Ω, R1 = 1 Ω, Uemp = 700 V, f = 13.56 MHz, Ug = 500 V, Iemp = 700 A. These parameters correspond to a lower concentration of electrons and a common recombination of the charges with respect to the reference setting of the model; (c) The analyzed spectrum of the behavior of the instantaneous value of the current i(t), relating to functional parameters such as Ut = 0.8 V, Uf = 0.0 * 35 V, Rch− = 1 Ω, Rch+ = 5 Ω, R1 = 1 Ω, Uemp = 700 V, f = 13.56 MHz, Ug = 600 V, Iemp = 700 A, as a model exhibiting a higher concentration of the carriers of the negative charge with respect to the reference state (fmax = 1.4 GHz).
Modelling 03 00005 g007aModelling 03 00005 g007b
Figure 8. A typical configuration of the dipole antenna to detect the plasma discharge signal: measuring the electromagnetic field irradiated by the plasma.
Modelling 03 00005 g008
Figure 9. The measured frequency spectrum of the electromagnetic field irradiated by the plasma. The parameters and conditions included Pout = 50 W, fg = 13.56 MHz, argon flow rate of vv = 3 L/min, contact between the plasma and the duralumin basis, jet orifice at the height of l = 10 mm, and frequency spectrum sensing accumulation of 50× (fmax = 0.7 GHz).
Modelling 03 00005 g009
Figure 10. The measured frequency spectrum of the electromagnetic field irradiated by the plasma. The parameters and conditions included Pout = 50 W, fg = 13.56 MHz, argon flow rate of vv = 5 L/min, contact between the plasma and the duralumin basis, jet orifice at the height of l = 10 mm, and frequency spectrum sensing accumulation of 50× (fmax = 0.7 GHz).
Modelling 03 00005 g010
Table 1. The characteristics of the plasma jet discharge as related to the full range of applicable operating conditions: an overview [19,20,21] (the temperatures T of the selected plasma components are determined through the optical emission spectra, and the density of the electrons Ne is established from the spectral profile of the line Hβ).
Plasma PencilTrotOH [K]TvibN2 [K]TexcAr [K]Ne [cm−3]
Values350–16001500–60004500–80001013–1015
Table 2. The graphically displayed results of the numerical models (A—Figure 7a, B—Figure 7b, C—Figure 7c) and the experimental antenna measurements (D—Figure 9, E—Figure 10).
I [A]P [dBm]
f [MHz]ABCDE
13.56362.7321.0401.7−18.1−4.1
27.1268.186.8113.2−46.1−42.4
40.6823.7223.715.4−54.2−36.2
54.241.0554.9914.86−56.6−59.0
67.85.295.293.81−58.1−64.1
81.360.8510.6615.42−61.8−75.0
94.921.881.881.39−60.1−73.9
108.480.6080.0 *2.83−67.2−81.0
122.040.7020.7100.64−70.3−78.6
135.60.3820.0 *1.76−72.5−82.8
149.160.0 *0.0 *0.0 *−77.9−81.5
162.70.0 *0.3801.30−74.80.0 *
176.280.0 *0.0 *0.0 *−73.50.0 *
189.840.0 *0.0 *0.910−78.60.0 *
203.40.0 *0.0 *0.0 *−76.70.0 *
216.960.0 *0.0 *0.610−74.90.0 *
230.520.0 *0.0 *0.0 *−85.10.0 *
244.080.0 *0.0 *0.520−83.90.0 *
257.640.0 *0.0 *0.0 *−85.00.0 *
271.20.0 *0.0 *0.4300.0 *0.0 *
284.760.0 *0.0 *0.0 *0.0 *0.0 *
298.320.0 *0.0 *0.0 *0.0 *0.0 *
* Below the resolution of the method used.
Publisher’s Note: MDPI stays neutral with regard to jurisdictional claims in published maps and institutional affiliations.