Abstract
Background: Left ventricular myocardial work (MW) derived from non-invasive pressure–strain loops has emerged as a load-adjusted index of contractile performance. Its value for risk stratification in advanced heart failure (HF) remains uncertain. Methods: We retrospectively studied 151 consecutive patients with advanced HF undergoing comprehensive evaluation at our tertiary centre between January 2016 and December 2022. MW parameters—left ventricular global work index (LVGWI), global constructive work (LVGCW), global wasted work (LVGWW) and global work efficiency (LVGWE)—were derived from speckle-tracking echocardiography integrated with brachial blood pressure. Cardiopulmonary exercise testing (CPET), right heart catheterisation (RHC) and biochemical markers were obtained. Patients were stratified according to an LVGWI threshold of 600 mmHg%, identified by receiver operating characteristic (ROC) analysis for predicting the combined end point of cardiovascular mortality or HF hospitalisation. Correlations between MW and traditional indices were assessed, and event-free survival was analysed by Kaplan–Meier curves. Results: LVGWI correlated modestly with pVO2 (r = 0.35, p = 0.01) and left ventricular ejection fraction (r = 0.42, p < 0.001) and inversely with NT-proBNP (r = −0.30, p = 0.03). LVGWI displayed the largest area under the curve (AUC 0.76 [95% confidence interval 0.65–0.85]) for predicting the combined end point compared with pVO2 (AUC 0.73) and LVEF (AUC 0.67). Dichotomisation by LVGWI ≤ 600 mmHg% identified a high-risk group (Group A) with worse NYHA class, lower systolic blood pressure and reduced exercise capacity. After a median follow-up of 24 months, Group A exhibited significantly lower event-free survival (log-rank p = 0.02). Multivariable analysis was not performed owing to the limited sample size; therefore, findings should be interpreted with caution. Conclusions: In patients with advanced HF, left ventricular myocardial work, particularly LVGWI, provides incremental prognostic information beyond conventional markers. An LVGWI cut-off of 600 mmHg% derived from ROC analysis identified patients at increased risk of cardiovascular events and may inform timely referral for mechanical circulatory support or transplantation. Larger prospective studies are warranted to confirm these observations and to establish standardised thresholds across vendors.
1. Introduction
Advanced heart failure (HF) represents the end stage of the HF spectrum and is characterised by persistent symptoms, recurrent hospitalisations and poor quality of life despite optimal medical therapy [1,2]. Accurate assessment of ventricular function is fundamental for risk stratification and timely referral for left ventricular assist device (LVAD) implantation or heart transplantation [1]. Conventional metrics such as left ventricular ejection fraction (LVEF) and peak oxygen uptake (pVO2) are widely used but are load dependent and may not fully capture myocardial performance in the setting of altered loading conditions [3].
Myocardial work (MW) is a novel echocardiographic index derived from non-invasive left ventricular pressure–strain loops [3,4]. By integrating brachial cuff pressure, myocardial strain and valve timing, MW quantifies constructive and wasted work throughout the cardiac cycle and provides a load-adjusted assessment of contractility [3,4]. The left ventricular global work index (LVGWI) reflects total work, global constructive work (LVGCW) measures energy contributing to ejection, global wasted work (LVGWW) reflects energy wasted during lengthening in systole or shortening in isovolumic relaxation and global work efficiency (LVGWE) expresses the ratio of constructive to total work [3,4]. Although MW has shown prognostic value in coronary artery disease and dilated cardiomyopathy, its role in advanced HF remains insufficiently explored.
We therefore aimed (I) to evaluate the correlations between MW indices and established measures of cardiac function, exercise capacity and haemodynamic parameters; (II) to determine the prognostic performance of MW indices for predicting cardiovascular death and HF hospitalisation; and (III) to identify an optimal LVGWI threshold for risk stratification in patients with advanced HF.
2. Materials and Methods
2.1. Study Design and Population
This retrospective observational study enrolled 80 consecutive adults with advanced HF referred to the Advanced Heart Failure Unit of Azienda Ospedaliera Universitaria Senese (Siena, Italy) between January 2016 and December 2022. Advanced HF was defined according to International Society for Heart and Lung Transplantation criteria as severe symptoms, frequent hospitalisations or the need for inotropic or mechanical support despite guideline-directed medical therapy. We excluded patients with significant valvular stenosis, hypertrophic cardiomyopathy, congenital heart disease, inadequate echocardiographic images or missing MW data. Given the retrospective design, the requirement for ethical committee approval and informed consent was waived.
2.2. Data Collection
In this single centre observational and retrospective study, clinical, demographic and laboratory data were collected from Siena Heart Center electronic records. All echocardiographic examinations were performed by experienced operators who used a GE Vivid E80/E95 (GE Medical Systems, Northen Ireland) equipped with an adult 1.5–4.3 MHz phased-array transducer, and with a continuously displayed ECG, according to the American Society of Echocardiography/European Association of Cardiovascular Imaging recommendations [5,6]. Conventional echocardiographic measurements were made complying with the European and American Guidelines [6]. For STE analysis, the left ventricular (LV) endocardial border was identified from the apical views (four chambers, two chambers and apical long axis) which had to be clearly visualized throughout the cardiac cycle. Image analysis was retrospectively performed offline using EchoPAC software v204 (GE Medical, Milwaukee, WI, USA). LV and left atrial deformation parameters were made according to conventional guidelines [7,8,9]. Brachial artery cuff pressure was measured 15 min after the echocardiographic examination.
RHCs were performed by experienced operators using a pulmonary artery catheter inserted via the internal jugular vein, zeroed to atmospheric pressure, and referenced at the mid-thoracic level. Cardiac output (CO) was evaluated by the thermodilution method according to current guidelines, using cold water injections for three measurements with a variability <10% [10,11,12,13], and calculated as the mean of the three measurements. All pressures were recorded as the average of eight time-pressure integral derivations during several respiratory cycles [10,11,12,13].
For the CPET, individuals were carefully instructed to undergo a symptom-limited test, having to achieve maximum effort after they were made familiar with the 10-point Borg fatigue scale. Standard 12-lead ECG was recorded at rest and was continuously monitored during the test. Blood pressure was measured using a manual sphygmomanometer every 2 min. All patients were limited by fatigue. The CPET data were obtained on a cycle ergometer (Quark CPET, CosMed USA Inc., Concord, CA, USA) equipped with OMNIA software (CosMed USA Inc., Concord, CA, USA). A gas and volume calibration were performed according to the manufacturer’s instructions during an upright incremental bicycle exercise on a cycle ergometer (Lode, Groningen, The Netherlands) using respiratory gas analysis (Med Graphics Ultima O2, MGC Diagnostics Corporation, Saint Paul, MN, USA). Patients were connected to the metabolic cart using a disposable mouthpiece and with the nares occluded. The exercise test (ramp protocol) included a 1 min pre-exercise resting period while sitting upright on the bike and 2 min unloaded warm-up cycling which was useful to allow adaptation to the mask and to avoid any psychological hyperventilation, with the aim of reaching a starting RER of 0.70–0.85. The warm-up phase was followed by an incremental exercise cycling period whose workload increase was chosen according to the patients’ clinical status (5–15 W per minute), aiming to complete the CPET within 8–12 min, as recommended [14,15]. To ensure that peak oxygen uptake (pVO2) was achieved, at least two of the following criteria had to be met: (1) maximal heart rate (HR) of 90% of the age-predicted HR; (2) RER ≥ 1.10; and (3) a pedal rate note maintained at least at 60 rpm at each level of exercise.
Minute ventilation (VE), VO2, carbon dioxide production (VCO2) values and all other variables were acquired through a turbine transducer system (with breath-by-breath mode) and were averaged every 10–15 s. pVO2 was taken as the average reading among the highest values of oxygen consumption measured in the last 30 s of the peak exercise and was expressed as pVO2 indexed for body weight (mL/kg/min) and as a percentage of predicted pVO2 (%VO2). The predicted VO2 values were calculated using Hansen-Wasserman equations (corrected for age, sex, weight and height) [16]. The first anaerobic threshold (AT1) was determined according to three validated methods to determine AT1 from incremental exercise test data: (1) modified V-slope method; (2) ventilatory equivalent method (VE/VO2 method); and (3) end-tidal O2 pressure method (PetO2). The VE versus W relationship was also considered [16,17]. VE/VCO2 slope was obtained through an automatic analysis performed by the software, using acquired values of VO2 and VCO2 and excluding initial sampling from both pre-exercise hyperventilation phases and recovery phases.
Elastances and ventricular-arterial coupling (VAC) values were obtained using patients’ blood pressure measured brachial artery cuff, LV ejection fraction with modified biplane Simpsons method. Stroke volume, pre-ejection time and total ejection time were obtained via pulse wave-Doppler in the LV outflow tract. The app iElastance (version 4.0.4, Pietro Bertini, 2023, Apple store) was used to calculate the values [18].
Patients were classified into two groups according to LVGWI. The threshold of 600 mmHg% was chosen a priori on the basis of receiver operating characteristic (ROC) curve analysis in our cohort, corresponding to the maximum Youden index for predicting five-year cardiovascular death or HF-related hospitalisation. Although prior studies have proposed different thresholds [3], our ROC-derived cut-off offered the best balance between sensitivity and specificity in this specific population. Group A comprised patients with LVGWI ≤ 600 mmHg%, and Group B comprised those with LVGWI > 600 mmHg%.
The primary combined endpoint was cardiovascular death or unplanned hospitalisation for worsening HF during follow-up. Deaths occurring outside hospital were verified through regional registries and family reports; however, we acknowledge that misclassification between cardiovascular and non-cardiovascular causes cannot be excluded. All patients were followed through outpatient visits and telephone interviews every six months.
Figure 1 represents the flow chart of the study.
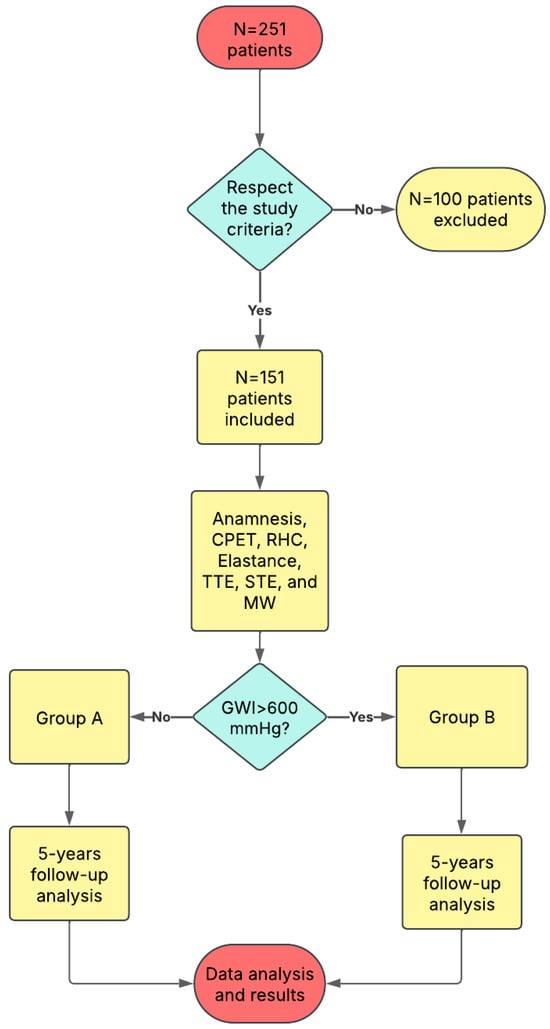
Figure 1.
The study flow-chart. GWI: Global Work Index.
2.3. Statistical Analysis
Continuous variables are presented as mean ± standard deviation (SD) or median with interquartile range (IQR), as appropriate. Categorical variables are expressed as frequencies and percentages. Comparisons between groups were performed using the Student t test or Mann-Whitney U test for continuous variables and the chi-square or Fisher exact test for categorical variables. Correlations between MW parameters and other variables were assessed using Pearson or Spearman correlation coefficients according to data distribution. The prognostic performance of MW indices, pVO2 and LVEF for the combined endpoint was assessed by ROC curve analysis; areas under the curve (AUCs) are reported with 95% confidence intervals (CI). Kaplan–Meier curves with log-rank tests compared event-free survival between groups. Owing to the relatively small number of events, multivariable modelling (e.g., Cox regression) was not performed to avoid overfitting. A two-sided p value < 0.05 was considered statistically significant. Statistical analyses were performed using Jamoi (The Jamovi project, version 2.6.44).
3. Results
3.1. Baseline Characteristics
A total of 251 patients were recruited in this study, and from them only 151 fulfilled the inclusion criteria. The median age was 55 years (IQR 48–60), 44 were female, and 63 had ischaemic cardiomyopathy. The mean LVEF was 25 ± 7%, the mean LV end-diastolic volume was 180 ± 60 mL and mean systolic/diastolic blood pressures were 102 ± 15 and 64 ± 10 mmHg, respectively. The median pVO2 was 14 mL·kg−1·min−1 (IQR 11–18) and the median NT-proBNP concentration was 1500 pg/mL (IQR 600–4000). LVGWI ranged from 200 to 1200 mmHg% (mean 610 ± 250). Group A (LVGWI ≤ 600 mmHg%, n = 89) and Group B (>600 mmHg%, n = 62) differed significantly in haemodynamic and functional parameters: Group A had lower systolic blood pressure (95 ± 13 vs. 108 ± 15 mmHg; p < 0.01), higher NYHA class (83% vs. 55% in class III–IV; p = 0.02), lower pVO2 (12 ± 3 vs. 16 ± 4 mL·kg−1·min−1; p < 0.001) and higher NT-proBNP levels (median 2300 vs. 900 pg/mL; p = 0.04). Medical therapy, including beta-blockers, angiotensin-receptor blockers/neprilysin inhibitors and mineralocorticoid antagonists, did not differ significantly between groups. Table 1 describes in detail the populations anamnesis and parameters.

Table 1.
Patients’ characteristics.
3.2. Correlation Analysis
Table 2 summarises the correlations between MW indices and selected variables. LVGWI correlated moderately with LVEF (R = 0.42, p < 0.001), pVO2 (R = 0.35, p = 0.01) and systolic blood pressure (R = 0.46, p < 0.001) and showed a negative correlation with NT-proBNP (R = −0.30, p = 0.03). LVGCW exhibited similar patterns but with slightly lower correlation coefficients. LVGWE demonstrated weak correlations with pVO2 (R = 0.28, p = 0.04) and LVEF (R = 0.25, p = 0.05). LVGWW had a negative correlation with pVO2 (R = −0.31, p = 0.02). Correlations with invasively measured pulmonary artery pressures and cardiac output were generally weak. Although several correlations achieved statistical significance.
Table 2.
Myocardial Work parameters correlations.
3.3. Prognostic Performance and Outcomes
During a median follow-up of 24 months (IQR 18–30), 20 patients (25%) reached the combined endpoint (eight cardiovascular deaths and twelve HF hospitalisations). The area under the ROC curve for LVGWI to predict the combined endpoint was 0.76 (95% CI 0.65–0.85), with an optimal cut-off at 600 mmHg% (sensitivity 78%, specificity 69%). LVGCW yielded an AUC of 0.72 (95% CI 0.61–0.82), and LVGWE and LVGWW showed lower predictive power (AUC 0.68 and 0.65, respectively). pVO2 and LVEF had AUCs of 0.73 (95% CI 0.62–0.83) and 0.67 (95% CI 0.55–0.77), respectively. Formal statistical comparison between AUCs using the DeLong test was not feasible due to the exploratory nature of the study. Kaplan–Meier analysis revealed that Group A (LVGWI ≤ 600 mmHg%) had significantly lower event-free survival compared with Group B (log-rank p = 0.02, Figure 2). At three years, cumulative event-free survival was 55% in Group A versus 80% in Group B. Moreover, LVGWI proved the strongest predictor of 5-years CV mortality (AUC = 0.852) (Figure 3), CV hospitalization (AUC = 0.955) (Figure 4), all-cause mortality (AUC = 0.852), and all-cause hospitalization (AUC = 0.949) compared to other the other echocardiographic, CPET’s, and RHC’s parameters.
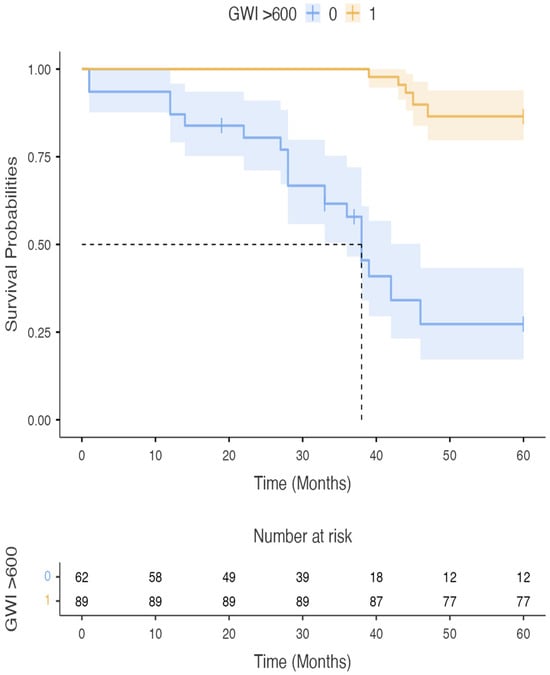
Figure 2.
Survival in group A (blue) and group B (yellow) patients. GWI: Global Work Index.
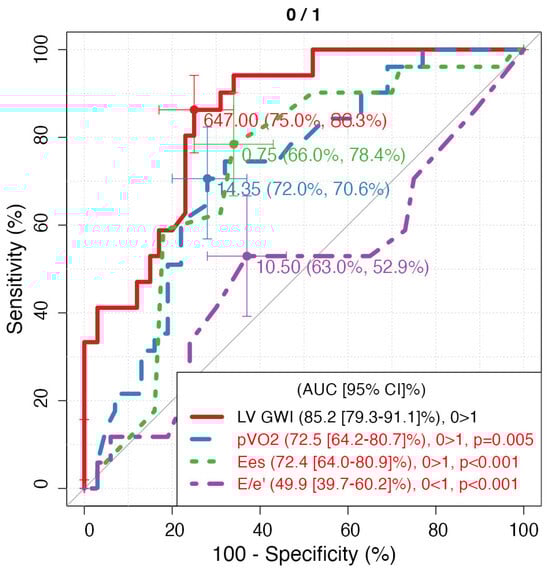
Figure 3.
ROC curves of 5-year CV mortality regarding parameters with the highest AUC for each technique. LV GWI: Left Ventricle Global Work Index; pVO2: peak of oxygen consumption expressed as mL/kg/min; Ees: end-systolic elastance.
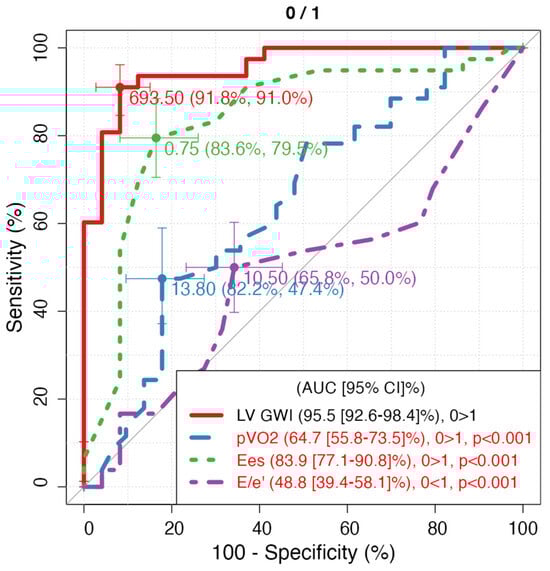
Figure 4.
ROC curves of 5-year CV hospitalization regarding parameters with the highest AUC for each technique. LV GWI: Left Ventricle Global Work Index; pVO2: peak of oxygen consumption expressed as mL/kg/min; Ees: end-systolic elastance.
In univariate Cox regression, LVGWI (hazard ratio [HR] per 50 mmHg% increase = 0.86, 95% CI 0.78–0.94; p = 0.003), pVO2 (HR per 1 mL·kg−1·min−1 = 0.90, 95% CI 0.82–0.98; p = 0.01) and NYHA class (HR per class = 1.7, 95% CI 1.2–2.5; p = 0.01) were predictors of the combined endpoint; other variables were not significant. Because of the limited number of events, multivariable analysis including these variables was not performed.
4. Discussion
This study demonstrates that left ventricular myocardial work indices provide clinically relevant information in patients with advanced HF. First, LVGWI correlated moderately with established measures of contractile function and functional capacity, such as LVEF and pVO2, indicating that MW captures aspects of global systolic performance. However, the observed correlation coefficients were modest, suggesting that MW reflects additional physiological dimensions beyond conventional parameters. Second, LVGWI displayed superior discriminatory ability for cardiovascular death or HF hospitalisation compared with LVEF and similar performance to pVO2. The ROC-derived threshold of 600 mmHg% identified a subgroup of patients with markedly worse haemodynamic profiles, exercise intolerance and increased risk of adverse outcomes, supporting its potential use for risk stratification.
Our findings align with previous studies reporting prognostic value of MW in advanced HF and dilated cardiomyopathy. Hedwig et al. observed that global work indices predicted mortality, LVAD implantation or transplantation with AUCs around 0.80 and suggested an optimal LVGWI cut-off of 455 mmHg% [19]. Differences in cut-off values may reflect population heterogeneity, different vendor algorithms or calibration of the pressure–strain loop. In our cohort, 600 mmHg% provided the best sensitivity–specificity balance, underscoring the need to validate thresholds across settings. We selected LVGWI for stratification because it integrates constructive and wasted work and, in our data, exhibited the highest AUC among MW indices.
An intriguing observation was that Group A, characterized by lower LVGWI and worse prognosis, contained a higher proportion of non-ischaemic patients. Although non-ischaemic cardiomyopathies often exhibit diffuse fibrosis and theoretically retain potential for recovery [20,21], advanced fibrotic remodelling or infiltrative processes might lead to disproportionate mechanical dysfunction despite relatively preserved perfusion. Genetic factors or inflammatory cardiomyopathies may also contribute. These hypotheses warrant further investigation in larger cohorts.
The dependency of MW on blood pressure merits consideration. Systolic blood pressure was lower in Group A and correlated positively with LVGWI. Low blood pressure may both contribute to and result from impaired contractility, reduced cardiac output and neurohormonal activation in advanced HF [22,23,24]. Although blood pressure partly determines MW, the latter remained predictive of outcomes after accounting for blood pressure in univariate analyses, suggesting incremental value. Indeed, MW integrates strain and time intervals, providing a load-adjusted measure that may be more robust than LVEF alone in the setting of fluctuating haemodynamics [3,4].
Our study has limitations. The retrospective design introduces potential selection bias and confounding. Cause-of-death attribution relied on available documentation and may be imprecise; therefore we emphasised cardiovascular mortality but also considered all-cause events. The sample size was modest, and the number of events limited multivariable analyses; thus, our findings are exploratory and hypothesis-generating. Myocardial work assessment was performed using a single vendor’s software, and thresholds may not apply to other platforms. Cardiac magnetic resonance with late gadolinium enhancement was not systematically performed, precluding a correlation between MW and fibrosis. Finally, missing data were handled by complete-case analysis, which may introduce bias.
Despite these limitations, our study suggests that LV myocardial work, particularly LVGWI, could complement established indices for evaluating patients with advanced HF. Prospective multicentre studies with larger samples are required to validate these findings, explore interactions with invasive haemodynamics and fibrosis, and determine how MW-guided risk stratification might influence clinical decision-making.
5. Conclusions
Left ventricular myocardial work represents an emerging, load-adjusted marker of ventricular performance that correlates with yet provides additional information beyond conventional measures of systolic function and exercise capacity. In this retrospective cohort of patients with advanced HF, an ROC-derived LVGWI threshold of 600 mmHg% identified individuals at high risk of cardiovascular death or HF hospitalisation. Incorporation of MW assessment into routine echocardiography may aid clinicians in identifying candidates for advanced therapies such as LVAD implantation or heart transplantation. Further prospective research is necessary to standardise measurement techniques, validate cut-off values across vendors and elucidate the impact of MW-guided management on clinical outcomes.
Author Contributions
L.M., A.P., and M.Y.H. wrote the article; M.C., M.M., S.V., H.S.A., and G.E.M. revised it critically. All authors have read and agreed to the published version of the manuscript.
Funding
This research received no external funding.
Institutional Review Board Statement
The study was conducted in accordance with the Declaration of Helsinki. Ethical review and approval were waived for this study due to the retrospective conduction of the study (Decree of the Ministry of Health, 19 February 2022 (Available online: https://www.gazzettaufficiale.it/eli/id/2022/02/19/22A01189/sg, accessed on 6 July 2025).
Informed Consent Statement
There was not a specific informed consent required for the study due to the retrospective conduction of the study (Decree of the Ministry of Health, 1 March 2022 (Available online: https://www.gazzettaufficiale.it/eli/id/2022/02/19/22A01189/sg, accessed on 6 July 2025).
Data Availability Statement
The data presented in this study are available on request from the corresponding author.
Conflicts of Interest
The authors declare no conflicts of interest.
References
- McDonagh, T.A.; Metra, M.; Adamo, M.; Gardner, R.S.; Baumbach, A.; Böhm, M.; Burri, H.; Butler, J.; Čelutkienė, J.; Chioncel, O.; et al. 2021 ESC Guidelines for the diagnosis and treatment of acute and chronic heart failure. Eur. Heart J. 2021, 42, 3599–3726, Erratum in Eur. Heart J. 2021, 42, 4901. [Google Scholar] [CrossRef] [PubMed]
- Truby, L.K.; Rogers, J.G. Advanced Heart Failure: Epidemiology, Diagnosis, and Therapeutic Approaches. JACC Heart Fail. 2020, 8, 523–536. [Google Scholar] [CrossRef] [PubMed]
- Ilardi, F.; D’Andrea, A.; D’Ascenzi, F.; Bandera, F.; Benfari, G.; Esposito, R.; Malagoli, A.; Mandoli, G.E.; Santoro, C.; Russo, V.; et al. Myocardial Work by Echocardiography: Principles and Applications in Clinical Practice. J. Clin. Med. 2021, 10, 4521. [Google Scholar] [CrossRef] [PubMed] [PubMed Central]
- Pellikka, P.A. Myocardial Work as a Metric of Cardiac Performance. J. Am. Soc. Echocardiogr. 2023, 36, 1019–1020. [Google Scholar] [CrossRef] [PubMed]
- Lang, R.M.; Badano, L.P.; Mor-Avi, V.; Afilalo, J.; Armstrong, A.; Ernande, L.; Flachskampf, F.A.; Foster, E.; Goldstein, S.A.; Kuznetsova, T.; et al. Recommendations for cardiac chamber quantification by echocardiography in adults: An update from the American Society of Echocardiography and the European Association of Cardiovascular Imaging. Eur. Heart J. Cardiovasc. Imaging 2015, 16, 233–270, Erratum in Eur. Heart J. Cardiovasc. Imaging 2016, 17, 969. [Google Scholar] [CrossRef] [PubMed]
- Mitchell, C.; Rahko, P.S.; Blauwet, L.A.; Canaday, B.; Finstuen, J.A.; Foster, M.C.; Horton, K.; Ogunyankin, K.O.; Palma, R.A.; Velazquez, E.J. Guidelines for Performing a Comprehensive Transthoracic Echocardiographic Examination in Adults: Recommendations from the American Society of Echocardiography. J. Am. Soc. Echocardiogr. 2019, 32, 1–64. [Google Scholar] [CrossRef] [PubMed]
- Mondillo, S.; Galderisi, M.; Mele, D.; Cameli, M.; Lomoriello, V.S.; Zacà, V.; Ballo, P.; D’Andrea, A.; Muraru, D.; Losi, M.; et al. Speckle-tracking echocardiography: A new technique for assessing myocardial function. J. Ultrasound Med. 2011, 30, 71–83. [Google Scholar] [CrossRef] [PubMed]
- Pathan, F.; D’Elia, N.; Nolan, M.T.; Marwick, T.H.; Negishi, K. Normal Ranges of Left Atrial Strain by Speckle-Tracking Echocardiography: A Systematic Review and Meta-Analysis. J. Am. Soc. Echocardiogr. 2017, 30, 59–70.e8. [Google Scholar] [CrossRef] [PubMed]
- Badano, L.P.; Kolias, T.J.; Muraru, D.; Abraham, T.P.; Aurigemma, G.; Edvardsen, T.; D’Hooge, J.; Donal, E.; Fraser, A.G.; Marwick, T.; et al. Standardization of left atrial, right ventricular, and right atrial deformation imaging using two-dimensional speckle tracking echocardiography: A consensus document of the EACVI/ASE/Industry Task Force to standardize deformation imaging. Eur. Heart J. Cardiovasc. Imaging 2018, 19, 591–600, Erratum in Eur. Heart J. Cardiovasc. Imaging 2018, 19, 830–833. [Google Scholar] [CrossRef] [PubMed]
- American Thoracic Society; American College of Chest Physicians. ATS/ACCP Statement on cardiopulmonary exercise testing. Am. J. Respir. Crit. Care Med. 2003, 167, 211–277, Erratum in Am. J. Respir. Crit. Care Med. 2003, 1451–1452. [Google Scholar] [CrossRef] [PubMed]
- Fletcher, G.F.; Ades, P.A.; Kligfield, P.; Arena, R.; Balady, G.J.; Bittner, V.A.; Coke, L.A.; Fleg, J.L.; Forman, D.E.; Gerber, T.C.; et al. Exercise standards for testing and training: A scientific statement from the American Heart Association. Circulation 2013, 128, 873–934. [Google Scholar] [CrossRef] [PubMed]
- Glaab, T.; Taube, C. Practical guide to cardiopulmonary exercise testing in adults. Respir. Res. 2022, 23, 9. [Google Scholar] [CrossRef] [PubMed] [PubMed Central]
- Galiè, N.; Humbert, M.; Vachiery, J.L.; Gibbs, S.; Lang, I.; Torbicki, A.; Simonneau, G.; Peacock, A.; Vonk Noordegraaf, A.; Beghetti, M.; et al. 2015 ESC/ERS Guidelines for the diagnosis and treatment of pulmonary hypertension: The Joint Task Force for the Diagnosis and Treatment of Pulmonary Hypertension of the European Society of Cardiology (ESC) and the European Respiratory Society (ERS): Endorsed by: Association for European Paediatric and Congenital Cardiology (AEPC), International Society for Heart and Lung Transplantation (ISHLT). Eur. Heart J. 2016, 37, 67–119. [Google Scholar] [CrossRef] [PubMed]
- Kovacs, G.; Avian, A.; Pienn, M.; Naeije, R.; Olschewski, H. Reading pulmonary vascular pressure tracings. How to handle the problems of zero leveling and respiratory swings. Am. J. Respir. Crit. Care Med. 2014, 190, 252–257. [Google Scholar] [CrossRef] [PubMed]
- Corrà, U.; Piepoli, M.F.; Adamopoulos, S.; Agostoni, P.; Coats, A.J.; Conraads, V.; Lambrinou, E.; Pieske, B.; Piotrowicz, E.; Schmid, J.P.; et al. Cardiopulmonary exercise testing in systolic heart failure in 2014: The evolving prognostic role: A position paper from the committee on exercise physiology and training of the heart failure association of the ESC. Eur. J. Heart Fail. 2014, 16, 929–941. [Google Scholar] [CrossRef] [PubMed]
- Arena, R.; Myers, J.; Abella, J.; Pinkstaff, S.; Brubaker, P.; Moore, B.; Kitzman, D.; Peberdy, M.A.; Bensimhon, D.; Chase, P.; et al. Determining the preferred percent-predicted equation for peak oxygen consumption in patients with heart failure. Circ. Heart Fail. 2009, 2, 113–120. [Google Scholar] [CrossRef] [PubMed] [PubMed Central]
- Binder, R.K.; Wonisch, M.; Corra, U.; Cohen-Solal, A.; Vanhees, L.; Saner, H.; Schmid, J.P. Methodological approach to the first and second lactate threshold in incremental cardiopulmonary exercise testing. Eur. J. Cardiovasc. Prev. Rehabil. 2008, 15, 726–734. [Google Scholar] [CrossRef] [PubMed]
- Gamarra, A.; Díez-Villanueva, P.; Salamanca, J.; Aguilar, R.; Mahía, P.; Alfonso, F. Development and Clinical Application of Left Ventricular-Arterial Coupling Non-Invasive Assessment Methods. J. Cardiovasc. Dev. Dis. 2024, 11, 141. [Google Scholar] [CrossRef] [PubMed] [PubMed Central]
- Hedwig, F.; Nemchyna, O.; Stein, J.; Knosalla, C.; Merke, N.; Knebel, F.; Hagendorff, A.; Schoenrath, F.; Falk, V.; Knierim, J. Myocardial Work Assessment for the Prediction of Prognosis in Advanced Heart Failure. Front. Cardiovasc. Med. 2021, 8, 691611. [Google Scholar] [CrossRef] [PubMed] [PubMed Central]
- Kadish, A.H.; Rubenstein, J.C. Connecting the dots: The relevance of scar in nonischemic cardiomyopathy. J. Am. Coll. Cardiol. 2009, 53, 1146–1147. [Google Scholar] [CrossRef] [PubMed] [PubMed Central]
- Klem, I.; Klein, M.; Khan, M.; Yang, E.Y.; Nabi, F.; Ivanov, A.; Bhatti, L.; Hayes, B.; Graviss, E.A.; Nguyen, D.T.; et al. Relationship of LVEF and Myocardial Scar to Long-Term Mortality Risk and Mode of Death in Patients with Nonischemic Cardiomyopathy. Circulation 2021, 143, 1343–1358. [Google Scholar] [CrossRef] [PubMed]
- Floras, J.S.; Ponikowski, P. The sympathetic/parasympathetic imbalance in heart failure with reduced ejection fraction. Eur. Heart J. 2015, 36, 1974–1982b. [Google Scholar] [CrossRef] [PubMed] [PubMed Central]
- Paleczny, B.; Olesińska-Mader, M.; Siennicka, A.; Niewiński, P.; Nowak, K.; Buldańczyk, A.; Jankowska, E.A.; Banasiak, W.; von Haehling, S.; Ponikowska, B.; et al. Assessment of baroreflex sensitivity has no prognostic value in contemporary, optimally managed patients with mild-to-moderate heart failure with reduced ejection fraction: A retrospective analysis of 5-year survival. Eur. J. Heart Fail. 2019, 21, 50–58. [Google Scholar] [CrossRef] [PubMed]
- La Rovere, M.T.; Pinna, G.D.; Maestri, R.; Robbi, E.; Caporotondi, A.; Guazzotti, G.; Sleight, P.; Febo, O. Prognostic implications of baroreflex sensitivity in heart failure patients in the beta-blocking era. J. Am. Coll. Cardiol. 2009, 53, 193–199. [Google Scholar] [CrossRef] [PubMed]
Disclaimer/Publisher’s Note: The statements, opinions and data contained in all publications are solely those of the individual author(s) and contributor(s) and not of MDPI and/or the editor(s). MDPI and/or the editor(s) disclaim responsibility for any injury to people or property resulting from any ideas, methods, instructions or products referred to in the content. |
© 2025 by the authors. Licensee MDPI, Basel, Switzerland. This article is an open access article distributed under the terms and conditions of the Creative Commons Attribution (CC BY) license (https://creativecommons.org/licenses/by/4.0/).