Abstract
Background/objectives: Acute coronary syndrome (ACS) is a major global health issue primarily caused by the rupture or erosion of vulnerable coronary plaques. Non-invasive identification of these plaques through coronary computed tomography angiography (CCTA) can be improved with radiomics, which extracts and analyses quantitative features from medical images. This systematic review aims to comprehensively evaluate the literature surrounding the role of radiomics in assessing coronary plaques via CCTA. Methods: A systematic search of Medline, EMBASE, and Web of Science was conducted up to July 2024. Nine studies met the inclusion criteria, and their methodological quality was assessed using the radiomic quality score (RQS) and the QUADAS-2 tool. Results: All studies that evaluated radiomic models for plaque vulnerability reported area under the curve (AUC) values exceeding 0.7, indicating at least modest diagnostic performance. In the four studies that made direct comparisons, radiomic models consistently outperformed conventional CCTA markers. However, RQS scores ranged from 2.7% to 41.7%, reflecting variability in study quality and underscoring the need for more robust validation. Conclusions: Radiomics has the potential to enhance CCTA-based identification of vulnerable coronary plaques, offering a promising non-invasive approach to predicting major adverse cardiovascular events. However, the current body of research is limited by the lack of external validation, reliance on small, single-centre retrospective studies, and methodological inconsistencies, which impact the generalisability and reproducibility of findings. Future research should prioritise prospective, multi-centre studies with standardised protocols and rigorous validation frameworks to effectively incorporate radiomics into clinical practice.
1. Introduction
Acute coronary syndrome (ACS), a leading cause of global morbidity and mortality, is primarily caused by rupture or erosion of vulnerable coronary artery plaques [1]. These plaques, typically large, lipid-rich atheromas with a fibrous cap, are crucial to identify for preventing ACS. Invasive imaging methods like intravascular ultrasound (IVUS) and optical coherence tomography (OCT) have pinpointed vulnerable plaque features, such as thin fibrous caps, lipid-rich necrotic cores, and microcalcifications, validated against histological standards. However, these methods are both invasive and costly [2,3,4].
Coronary computed tomography angiography (CCTA), a non-invasive imaging modality, is commonly used to diagnose coronary artery disease (CAD) and assess plaque morphology. Along with invasive imaging techniques, CCTA has identified numerous vulnerable plaque characteristics that are associated with major adverse cardiovascular events (MACE), including quantitative parameters such as low attenuation, spotty calcification, and positive remodelling and the napkin-ring sign (NRS)—a central low-attenuation area surrounded by a higher-attenuation rim [5]. However, these conventional CCTA parameters are qualitative in nature, leading to concerns of intra-observer variability and may fail to fully capture plaque complexity, heterogeneity, and latent morphological features of vulnerable plaques.
Radiomics encompasses the high-throughput extraction and analysis of a multitude of quantitative features from medical images and offers a promising approach to enhancing plaque assessment [6]. This technique enables an automated and comprehensive evaluation of plaque characteristics, potentially offering a quantitative and reproducible approach to assessing plaque vulnerability. While radiomics has demonstrated significant potential in oncology [7], its application in the field of cardiology and the assessment of coronary plaques is still emerging. Some studies suggest that CCTA-based radiomics can correlate with invasive and histologic standards of vulnerable plaques as well as identifying qualitative markers such as the NRS and may be able to predict future MACEs [4,8,9,10,11,12,13,14,15]. Given the non-invasive and widely accessible nature of CCTA, integrating radiomics to accurately and consistently identify vulnerable plaques and predict future MACEs could provide significant benefits for patients with coronary artery disease (CAD). The aim of our systematic review is to comprehensively assess the existing literature regarding the current role of radiomics in the assessment of coronary plaques on CCTA.
2. Materials and Methods
2.1. Study Design and Reporting Guidelines
This study is a systematic review of randomised and non-randomised trials and follows the Preferred Reporting Items for Systematic Reviews and Meta-Analyses (PRISMA) reporting guidelines [16].
2.2. Search Strategy
In July 2023, we conducted searches across several databases as part of the systematic review, including Medline, EMBASE, and Web of Science. A comprehensive outline of the systematic search process, including the detailed search terms, is provided in Supplementary Material S1. The final search date was 1 July 2024. Additionally, we explored the grey literature to identify other relevant publications.
2.3. Inclusion/Exclusion Criteria
Inclusion criteria:
- Studies investigating the use of radiomics in CCTA to identify vulnerable coronary artery plaques (plaques high risk of ACS)
- Patients aged 18 years old and above
- Prospective or retrospective studies
Exclusion criteria:
- Studies not including CCTA analysis (CAC or non-contrast CT, etc.)
- Studies not investigating plaque vulnerability or solely investigating plaque progression
- Ex-vivo studies
- Case series/reports
- Consensus statements
- Conference abstracts
2.4. Study Selection, Data Extraction, and Critical Appraisal
A database was compiled using the reference management software EndNote X9™. Two researchers (HCT and CM) independently reviewed the search results. Initially, duplicates were removed. The remaining study titles were screened for potential relevance. The abstracts of studies considered potentially relevant were then reviewed for eligibility based on the predefined inclusion and exclusion criteria. Studies that did not meet the criteria were categorised in the database according to the reason for exclusion. Full texts of the eligible abstracts were further evaluated using the same criteria. Discrepancies in judgement about the potential inclusion of an article were resolved via an open discussion between the authors and an independent third reviewer (RM).
To facilitate efficient data extraction and storage, the Cochrane Collaboration’s screening and data extraction tool, Covidence, was employed [17]. Data were collected independently by two reviewers (HCT and CM) using the following categories: study details, study design, population, intervention, comparison groups, and outcomes.
A critical appraisal of the methodological quality and risk of bias of the included studies was conducted independently by two reviewers (HCT and CM). The quality assessment was performed according to the Quality Assessment of Diagnostic Accuracy Studies 2 (QUADAS-2) and Radiomics Quality Score (RQS) [18,19].
2.5. Systematic Review Registration
Our systematic review was registered on PROSPERO in August 2024 (ID: CRD42024572070).
3. Results
3.1. Search Results
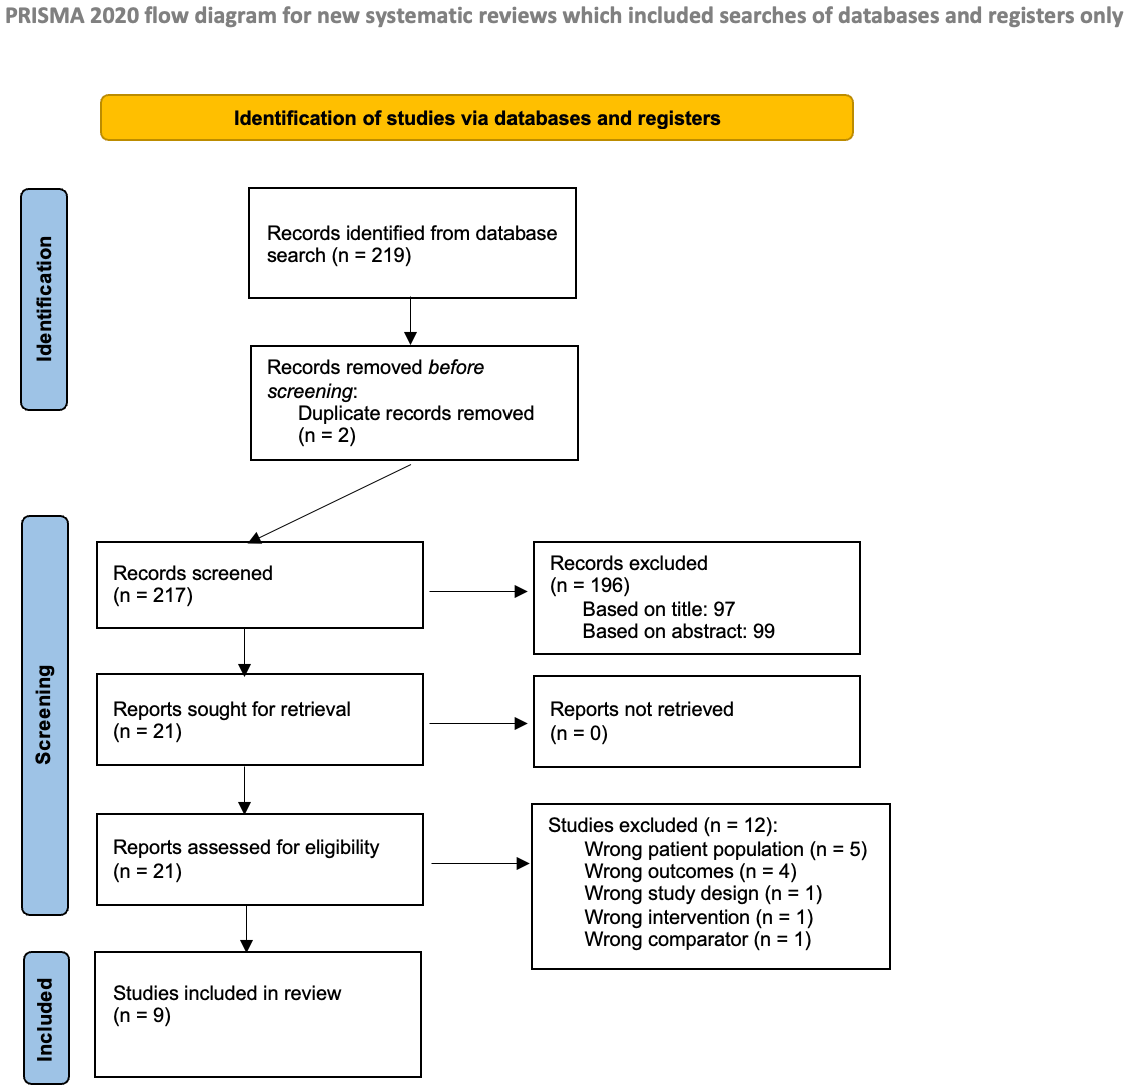
The literature search, as previously described, resulted in 219 studies (see Figure 1). After removing 2 duplicates, 217 studies remained for screening. An initial screening led to the review of 99 abstracts to determine eligibility. From these, 21 studies were selected for full-text review. Ultimately, 9 studies met the inclusion criteria and were included in the analysis [4,8,9,10,11,12,13,14,15].
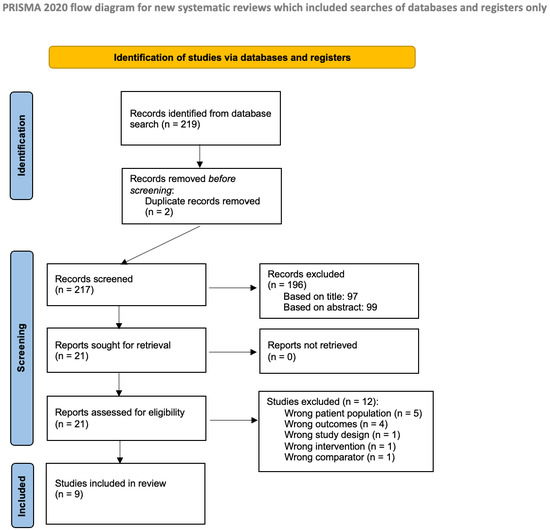
Figure 1.
Prisma flow diagram.
3.2. Methodological Characteristics and Quality of Studies
Among the included studies, eight were retrospective, while one (Lin et al. [4]) was prospective. Additionally, Chen et al. [10] incorporated a prospective analysis to validate their radiomic signature. Table 1 provides a summary of the methodological characteristics of the included studies. The quality of the data and the risk of bias were assessed using the radiomic quality score (RQS) and QUADAS-2 tools. A detailed explanation of the tools and a breakdown of the results can be found in the Supplementary Material (S2/S3). The RQS values varied significantly among the included studies, from 2.7% to 41.7%. The QUADAS-2 results revealed that the included studies exhibited a risk of bias and raised some concerns regarding their applicability.

Table 1.
Methodological characteristics of the included studies.
3.3. Acquisition Parameters
Coronary CT angiography (CCTA) was the imaging modality of choice for image acquisition and feature extraction across the included studies. The complete scanning parameters are detailed in Table 2 and were consistent across the studies, though these specifics were omitted in the methods of two studies [9,11].
Table 2.
Scanning parameters.
3.4. Development of Signatures
Exact feature extraction methods varied across studies; however, a relatively similar pathway was followed across the board. Regions of interest (ROI) were segmented semi-automatically using dedicated software assisted by experienced radiologists in all but one study, which utilised manual segmentation only [12]. Radiomic features were then extracted from these segments using radiomic software packages, which varied among the included studies. The features extracted were largely grouped into three categories: first-order or intensity features, shape features, and texture features. The process of segmentation and feature processing is detailed in Table 3.
Table 3.
Segmentation, feature processing, and software.
3.5. Signature Performance
The performance of radiomic models in identifying vulnerable coronary artery plaques varied across studies, as did the results of radiomic feature assessments. Seven of the included studies developed radiomic models for assessing vulnerable plaques [4,10,11,12,13,14,15], while two studies focused solely on radiomic feature assessment [8,9]. All studies that tested a radiomic model for plaque vulnerability reported at least modest diagnostic performance (AUC > 0.7). In the four studies [4,10,12,14] that compared radiomic models to conventional CCTA markers of vulnerability, the radiomic models outperformed the traditional markers. Table 4 details the performance of each model in predicting primary outcomes as well as the results of radiomic feature assessments. Chen et al. [10] were the only study to also include a prospective analysis to assess the prognostic value of their radiomic model. They found that a high radiomic signature was independently linked to MACE during a median follow-up of 3 years (hazard ratio: 2.01, p = 0.005).
Table 4.
Feature Assessment, Signature Performance, and Baseline Characteristics.
4. Discussion
Our review highlights the current state of the literature on the development and performance of radiomic models for assessing vulnerable coronary artery plaques. The optimal signatures developed within the included studies predicted their primary outcome with at least modest accuracy (AUC range 0.72–1) and consistently outperformed conventional CT markers of plaque vulnerability in the four studies [4,10,12,14] where this comparison was made. Additionally, all the studies demonstrated that radiomic analysis significantly enhances the information that can be extracted from CCTA. This highlights the potential of incorporating radiomics into conventional CT coronary angiography, offering a non-invasive and widely accessible imaging technique capable of providing a quantitative and reproducible assessment of plaque vulnerability. By extracting detailed imaging features, this approach can offer valuable insights into plaque morphology, potentially enhancing the prediction and prevention of MACE, as demonstrated in the prospective trial by Chen et al. [10].
The RQS was employed to assess the methodological quality of the radiomics-based investigations used in these studies, to identify high-quality results as well as issues limiting their value and applicability. The RQS scores ranged widely from 2.7% (1/36) to 44.4% (16/36), with a mean value of 8.77 (24.4%) (Supplementary Material S1), which aligns closely with the findings of a systematic review by Lee et al., where the quality of radiomic research in cardiac CT was reported to have a similar value of RQS (9.9, 27.4%) [20]. This similarity suggests that these methodological issues are prevalent across the field. Many studies scored poorly due to a lack of multivariable analysis, retrospective design, and particularly, the absence of multi-centre validation, which limits the generalisability of the findings. Prospective validation, preferably conducted in a multi-centre setting, is essential for the future clinical application of radiomics, as it addresses variability and confirms the model’s predictive accuracy in real-world clinical practice [21]. Additionally, the QUADAS-2 score raised concerns about potential bias in patient selection and the applicability of the index test. Future studies should apply rigorous methodological standards and adopt more comprehensive risk-of-bias assessments to minimise bias and ensure the reliability of their results.
Our review is limited by the relatively small number of studies and their modest sample sizes, a challenge that is unavoidable given the emerging nature of this field. The heterogeneity in radiomic workflows, study methodologies, and primary outcomes prevented us from conducting a meta-analysis of the included studies. To provide a comprehensive overview of the current research landscape, we included all studies that met the inclusion criteria, irrespective of their quality. This approach allows us to highlight the strengths and weaknesses of existing research and to offer recommendations for future studies.
The primary limitations identified within the reviewed studies include the small sample sizes, single-centre designs, and retrospective methodologies, which contribute to potential overfitting and selection bias and limit the generalisability of the findings. To address the issue of small sample sizes, the researchers employed stratified cross-validation with numerous repeats to generate reliable estimates of diagnostic performance. While this approach is widely recognised as a method for assessing the generalisability of diagnostic accuracy in real-world scenarios, it cannot fully replace the external validation of results in significantly larger and independent cohorts [22]. The generalisability of these results is also influenced by differences in CT scanners from various vendors, as well as inconsistencies in image acquisition, feature extraction, and data analysis techniques. Multiple studies have shown that CT scanner variability, reconstruction settings, and segmentation methods can significantly affect radiomic signatures, underscoring the need for standardised protocols and ensuring a robust framework for radiomic analysis that can facilitate cross-study comparisons [23,24]. For instance, Chen et al. [10] showed that only half of the 1691 initially extracted radiomics features exhibited strong interobserver agreement after intraclass correlation coefficient analysis. To address these challenges, the European Society of Radiology (ESR) has introduced the European Imaging Biomarkers Alliance (EIBALL) with the goal of improving the standardisation and accuracy of quantitative imaging parameters, thereby ensuring consistent and reproducible results across different centres and imaging platforms.
Another limitation among the included studies was the inconsistent criteria used to define a vulnerable coronary artery plaque. The definitions varied across studies, with some relying on qualitative CCTA markers of vulnerability like the NRS, while others used optical coherence tomography (OCT), intravascular ultrasound (IVUS) markers, histological characteristics, or plaques associated with acute myocardial infarction (AMI). Although these markers are linked to plaque vulnerability and the risk of MACE, the variability in primary outcomes diminishes the overall generalisability of the findings, particularly when qualitative markers with intra-observer variability are employed [25,26].
The included studies highlighted several other challenges that limit the integration of CCTA radiomics into routine clinical practice. These include technical complexity, the absence of user-friendly automated software, and the labour-intensive nature of the current semi-automated segmentation process, which also carries the risk of inter-observer variability. Unlike oncological radiomics, where segmentation along tumour borders is straightforward, cardiovascular radiomics faces difficulties in accurately segmenting small, geometrically complex regions of cardiac plaque [27]. All studies noted the significant workload associated with coronary plaque radiomic analysis, which currently hinders its practical use. The eventual aim is to develop fully automated, user-friendly, artificial intelligence (AI)-based radiomic plaque analysis, which can be embedded into routine CCTA reporting software, providing real-time evidence regarding the vulnerability of coronary plaques and the risk of future AMI. Advances in imaging technologies, such as photon-counting detector CT, may facilitate automated segmentation by improving signal-to-noise ratio and spatial resolution, reducing the workload and variability associated with manual processes [28].
In recent years, CCTA has been widely used due to its non-invasive nature, cost-effectiveness, and accessibility, coupled with its excellent negative predictive value for ruling out obstructive coronary artery disease [29]. The primary disadvantage of CCTA is exposure to ionising radiation. To address this concern, innovative non-invasive diagnostic modalities, such as the modified Haller index (MHI), have been introduced to reduce the number of unnecessary procedures performed in patients with a low probability of CAD [30]. Integrating radiomics with CCTA does, however, hold significant promise for enhancing current imaging workstations, enabling the rapid and accurate identification of vulnerable plaques without the need for invasive angiography, and helping to predict and prevent major adverse cardiovascular events (MACE). Additionally, radiomic analysis of coronary plaques may offer insights into the underlying biology of these vulnerable, and monitoring the evolution of these radiomic features over time could help evaluate the effectiveness of therapies targeting coronary artery plaques.
To effectively translate radiomics into the field of cardiac imaging, we must first address the challenges of variability in feature extraction and the lack of reproducibility, which are significant barriers to the success of future radiomic-based research. Additionally, large-scale, prospective, multi-centre studies with diverse patient populations, standardised protocols, and robust external validation frameworks are essential to improving the generalisability of prediction models. Such advancements require collaboration among academic institutions. The Oxford Risk Factors and Non-Invasive Imaging (ORFAN) study currently underway in the UK is one example of a trial working toward these goals.
5. Conclusions
Our review highlights the growing potential of radiomic models in assessing vulnerable coronary artery plaques, demonstrating that these models can predict plaque vulnerability with moderate to high accuracy and surpass conventional CT markers. Radiomic analysis offers a promising non-invasive approach for detailed plaque evaluation and MACE prediction. However, the current literature is limited by a lack of external validation, small single-centre retrospective studies, and inconsistent methodologies that lead to variations in feature extraction, ultimately affecting the generalisability and reproducibility of the findings. Addressing these issues will require large-scale, multi-centre studies with standardised protocols and robust validation frameworks to successfully integrate this technology into clinical practice.
Supplementary Materials
The following supporting information can be downloaded at: https://www.mdpi.com/article/10.3390/hearts5040045/s1, S1: Systematic search terms; S2: Radiomics quality score (RQS); S3: QUADAS-2 score.
Author Contributions
Conceptualisation and methodology: C.P.M., H.C.T. and R.M. Formal analysis, investigation, data curation, and writing—original draft preparation: C.P.M., N.J.O. and A.P.K. Writing—review and editing: R.M. and C.P.M. Supervision: R.M. All authors have read and agreed to the published version of the manuscript.
Funding
This research received no external funding.
Data Availability Statement
No new data were created or analysed in this study.
Conflicts of Interest
The authors declare no conflicts of interest.
References
- van Veelen, A.; van der Sangen, N.M.; Henriques, J.P.; Claessen, B.E. Identification and treatment of the vulnerable coronary plaque. Rev. Cardiovasc. Med. 2022, 23, 39. [Google Scholar] [CrossRef] [PubMed]
- Koskinas, K.C.; Ughi, G.J.; Windecker, S.; Tearney, G.J.; Raber, L. Intracoronary imaging of coronary atherosclerosis: Validation for diagnosis, prognosis and treatment. Eur. Heart J. 2016, 37, 524–535. [Google Scholar] [CrossRef] [PubMed]
- Calvert, P.A.; Obaid, D.R.; O’Sullivan, M.; Shapiro, L.M.; McNab, D.; Densem, C.G.; Schofield, P.M.; Braganza, D.; Clarke, S.C.; Ray, K.K.; et al. Association between IVUS findings and adverse outcomes in patients with coronary artery disease: The VIVA (VH-IVUS in Vulnerable Atherosclerosis) Study. JACC Cardiovasc. Imaging 2011, 4, 894–901. [Google Scholar] [CrossRef]
- Lin, A.; Kolossváry, M.; Cadet, S.; McElhinney, P.; Goeller, M.; Han, D.; Yuvaraj, J.; Nerlekar, N.; Slomka, P.J.; Marwan, M.; et al. Radiomics-Based Precision Phenotyping Identifies Unstable Coronary Plaques from Computed Tomography Angiography. Cardiovasc. Imaging 2022, 15, 859–871. [Google Scholar] [CrossRef]
- Maurovich-Horvat, P.; Ferencik, M.; Voros, S.; Merkely, B.; Hoffmann, U. Comprehensive plaque assessment by coronary CT angiography. Nat. Rev. Cardiol. 2014, 11, 390–402. [Google Scholar] [CrossRef]
- Aerts, H.J.W.L. The potential of radiomic-based phenotyping in precision medicine: A review. JAMA Oncol. 2016, 2, 1636–1642. [Google Scholar] [CrossRef]
- Liu, Z.; Wang, S.; Dong, D.; Wei, J.; Fang, C.; Zhou, X.; Sun, K.; Li, L.; Li, B.; Wang, M.; et al. The Applications of Radiomics in Precision Diagnosis and Treatment of Oncology: Opportunities and Challenges. Theranostics 2019, 9, 1303–1322. [Google Scholar] [CrossRef]
- Kolossváry, M.; Karády, J.; Szilveszter, B.; Kitslaar, P.; Hoffmann, U.; Merkely, B.; Maurovich-Horvat, P. Radiomic Features Are Superior to Conventional Quantitative Computed Tomographic Metrics to Identify Coronary Plaques with Napkin-Ring Sign. Circ. Cardiovasc. Imaging 2017, 10, e006843. [Google Scholar] [CrossRef]
- Kolossváry, M.; Park, J.; Bang, J.-I.; Zhang, J.; Lee, J.M.; Paeng, J.C.; Merkely, B.; Narula, J.; Kubo, T.; Akasaka, T.; et al. Identification of invasive and radionuclide imaging markers of coronary plaque vulnerability using radiomic analysis of coronary computed tomography angiography. Eur. Heart J. Cardiovasc. Imaging 2019, 20, 1250–1258. [Google Scholar] [CrossRef]
- Chen, Q.; Pan, T.; Wang, Y.N.; Schoepf, U.J.; Bidwell, S.L.; Qiao, H.; Feng, Y.; Xu, C.; Xu, H.; Xie, G.; et al. A Coronary CT Angiography Radiomics Model to Identify Vulnerable Plaque and Predict Cardiovascular Events. Radiology 2023, 307, e221693. [Google Scholar] [CrossRef]
- Zheng, Y.-L.; Cai, P.-Y.; Li, J.; Huang, D.-H.; Wang, W.-D.; Li, M.-M.; Du, J.-R.; Wang, Y.-G.; Cai, Y.-L.; Zhang, R.-C.; et al. A novel radiomics-based technique for identifying vulnerable coronary plaques: A follow-up study. Coron. Artery Dis. 2024, 20. [Google Scholar] [CrossRef] [PubMed]
- Li, X.-N.; Yin, W.-H.; Sun, Y.; Kang, H.; Luo, J.; Chen, K.; Hou, Z.-H.; Gao, Y.; Ren, X.-S.; Yu, Y.-T.; et al. Identification of pathology-confirmed vulnerable atherosclerotic lesions by coronary computed tomography angiography using radiomics analysis. Eur. Radiol. 2022, 32, 4003–4013. [Google Scholar] [CrossRef] [PubMed]
- Yunus, M.M.; Yusof, A.K.M.; Ab Rahman, M.Z.; Koh, X.J.; Sabarudin, A.; Nohuddin, P.N.E.; Ng, K.H.; Kechik, M.M.A.; Karim, M.K.A. Automated Classification of Atherosclerotic Radiomics Features in Coronary Computed Tomography Angiography (CCTA). Diagnostics 2022, 12, 1660. [Google Scholar] [CrossRef]
- Chen, Q.; Pan, T.; Yin, X.; Xu, H.; Gao, X.; Tao, X.; Zhou, L.; Xie, G.; Kong, X.; Huang, X.; et al. CT texture analysis of vulnerable plaques on optical coherence tomography. Eur. J. Radiol. 2021, 136, 109551. [Google Scholar] [CrossRef]
- Kim, J.N.; Gomez-Perez, L.; Zimin, V.N.; Makhlouf, M.H.E.; Al-Kindi, S.; Wilson, D.L.; Lee, J. Pericoronary Adipose Tissue Radiomics from Coronary Computed Tomography Angiography Identifies Vulnerable Plaques. Bioengineering 2023, 10, 360. [Google Scholar] [CrossRef]
- Liberati, A.; Altman, D.G.; Tetzlaff, J.; Mulrow, C.; Gøtzsche, P.C.; Ioannidis, J.P.; Clarke, M.; Devereaux, P.J.; Kleijnen, J.; Moher, D. The PRISMA statement for reporting systematic reviews and meta-analyses of studies that evaluate health care interventions: Explanation and elaboration. Ann. Intern. Med. 2009, 151, W65–W94. [Google Scholar] [CrossRef]
- Covidence Systematic Review Software; Veritas Health Innovation: Melbourne, Australia, 2023.
- Lambin, P.; Leijenaar, R.T.H.; Deist, T.M.; Peerlings, J.; de Jong, E.E.C.; van Timmeren, J.; Sanduleanu, S.; Larue, R.T.H.M.; Even, A.J.G.; Jochems, A.; et al. Radiomics: The bridge between medical imaging and personalized medicine. Nat. Rev. Clin. Oncol. 2017, 14, 749–762. [Google Scholar] [CrossRef]
- Whiting, P.F.; Rutjes, A.W.S.; Westwood, M.E.; Mallett, S.; Deeks, J.J.; Reitsma, J.B.; Leeflang, M.M.G.; Sterne, J.A.C.; Bossuy, P.M.M. QUADAS-2: A revised tool for the quality assessment of diagnostic ac- curacy studies. Ann. Intern. Med. 2011, 155, 529–536. [Google Scholar] [CrossRef]
- Lee, S.; Han, K.; Suh, Y.J. Quality assessment of radiomics research in cardiac CT: A systematic review. Eur. Radiol. 2022, 32, 3458–3468. [Google Scholar] [CrossRef]
- Ibrahim, A.; Primakov, S.; Beuque, M.; Woodruff, H.; Halilaj, I.; Wu, G.; Refaee, T.; Granzier, R.; Widaatalla, Y.; Hustinx, R.; et al. Radiomics for precision medicine: Current challenges, future prospects, and the proposal of a new framework. Methods 2021, 188, 20–29. [Google Scholar] [CrossRef]
- Leiner, T. Detecting coronary plaque vulnerability using computed tomography radiomics: The one stop shop for plaque vulnerability? Eur. Heart J. Cardiovasc. Imaging 2019, 20, 1248–1249. [Google Scholar] [CrossRef] [PubMed]
- Hu, P.; Wang, J.; Zhong, H.; Zhou, Z.; Shen, L.; Hu, W.; Zhang, Z. Reproducibility with repeat CT in radiomics study for rectal cancer. Oncotarget 2016, 7, 71440–71446. [Google Scholar] [CrossRef] [PubMed]
- Shiri, I.; Rahmim, A.; Ghaffarian, P.; Geramifar, P.; Abdollahi, H.; Bitarafan-Rajabi, A. The impact of image reconstruction settings on 18F-FDG PET radiomic features: Multi-scanner phantom and patient studies. Eur. Radiol. 2017, 27, 4498–4509. [Google Scholar] [CrossRef] [PubMed]
- Prati, F.; Romagnoli, E.; Gatto, L.; La Manna, A.; Burzotta, F.; Ozaki, Y.; Marco, V.; Boi, A.; Fineschi, M.; Fabbiocchi, F.; et al. Relationship between coronary plaque morphology of the left anterior descending artery and 12 months clinical outcome: The CLIMA study. Eur. Heart J. 2020, 41, 383–391. [Google Scholar] [CrossRef]
- Erlinge, D.; Maehara, A.; Ben-Yehuda, O.; Bøtker, H.E.; Maeng, M.; Kjøller-Hansen, L.; Engstrøm, T.; Matsumura, M.; Crowley, A.; Dressler, O.; et al. Identification of vulnerable plaques and patients by intracoronary near-infrared spectroscopy and ultrasound (PROSPECT II): A prospective natural history study. Lancet 2021, 397, 985–995. [Google Scholar] [CrossRef]
- Shang, J.; Guo, Y.; Ma, Y.; Hou, Y. Cardiac computed tomography radiomics: A narrative review of current status and future directions. Quant. Imaging Med. Surg. 2022, 12, 3436–3453. [Google Scholar] [CrossRef]
- Willemink, M.J.; Persson, M.; Pourmorteza, A.; Pelc, N.J.; Fleischmann, D. Photon-counting CT: Technical Principles and Clinical Prospects. Radiology 2018, 289, 293–312. [Google Scholar] [CrossRef]
- Yang, L.; Zhou, T.; Zhang, R.; Xu, L.; Peng, Z.; Ding, J.; Wang, S.; Li, M.; Sun, G. Meta-analysis: Diagnostic accuracy of coronary CT angiography with prospective ECG gating based on step-and-shoot, Flash and volume modes for detection of coronary artery disease. Eur. Radiol. 2014, 24, 2345–2352. [Google Scholar] [CrossRef]
- Sonaglioni, A.; Rigamonti, E.; Nicolosi, G.L.; Lombardo, M. Appropriate use criteria implementation with modified Haller index for predicting stress echocardiographic results and outcome in a population of patients with suspected coronary artery disease. Int. J. Cardiovasc. Imaging 2021, 37, 2917–2930. [Google Scholar] [CrossRef]
Disclaimer/Publisher’s Note: The statements, opinions and data contained in all publications are solely those of the individual author(s) and contributor(s) and not of MDPI and/or the editor(s). MDPI and/or the editor(s) disclaim responsibility for any injury to people or property resulting from any ideas, methods, instructions or products referred to in the content. |
© 2024 by the authors. Licensee MDPI, Basel, Switzerland. This article is an open access article distributed under the terms and conditions of the Creative Commons Attribution (CC BY) license (https://creativecommons.org/licenses/by/4.0/).