1. Introduction
Electrocardiographic Imaging (ECGI) is a noninvasive imaging modality for studying cardiac electrophysiology [
1]. ECGI noninvasively reconstructs epicardial potentials, which can be used to map epicardial activation and repolarization sequences and generate maps of electrophysiological scar substrate. Electrical information is valuable for understanding cardiac arrhythmias. However, cardiac structure and mechanics play an important role in many forms of heart disease. ECGI offers additional utility when paired with complementary imaging techniques. For example, we combined ECGI with late gadolinium enhancement MRI to correlate electrophysiological substrate with anatomical scars in arrhythmogenic right ventricular cardiomyopathy (ARVC) patients [
2]. More recently, we combined ECGI with tagged MRI to study the electromechanics of the normal human heart in situ [
3]. In the present manuscript, we describe our efforts to expand on this work by combining ECGI with speckle tracking echocardiography (STE) to study the electromechanics of heart failure (HF) and cardiac resynchronization therapy (CRT). In the present study, STE replaced the previously utilized MRI for the following reasons.
STE is an imaging technique which tracks the characteristic speckled patterns in echocardiographic images and computes deformation of the patterns to determine regional strain values [
4,
5]. STE offers several advantages over tagged MRI for studying electromechanics in the CRT patient population. First, many CRT devices are incompatible with MRI, which means that MRI cannot be used to evaluate strain in these patients post-implantation. Tagged MRI also requires a lengthy scan with many long breath holds, which may be too difficult for many HF patients. STE, in contrast, can be obtained from echocardiographic data, which are routinely collected from this patient population. Finally, STE also offers much higher framerates than tagged MRI, which can improve the temporal resolution for identifying features of strain curves.
HF is a progressive disease with high prevalence and high mortality that is a major contributor to healthcare costs [
6]. HF is associated with adverse remodeling of the ventricular myocardium that includes chamber dilatation, slow conduction of electrical activation, decreased myocyte contraction amplitudes, altered intracellular Ca
2+ handling, and prolonged action potential durations [
7,
8,
9,
10,
11,
12]. Approximately 30% of HF patients have dyssynchronous ventricular contraction, apparent by prolonged QRS duration on the ECG. Prolonged QRS duration and left ventricular ejection fraction (LVEF) are inversely correlated, and HF patients with QRS prolongation have higher all-cause mortality and may have higher incidence of sudden death than those with narrow QRS complexes [
13]. CRT improves the synchrony of ventricular contraction by pacing both ventricles. Clinical trials found that CRT improves quality of life, reduces HF-related hospitalizations, prolongs patient survival, and may reduce the risk of sudden cardiac death [
14,
15,
16,
17]. CRT also corrects some of the pathological abnormalities in HF, a process known as reverse remodeling. Animal studies found that CRT restored cellular action potential duration (APD) and Ca
2+ transients to normal levels [
18,
19]. Despite the widely reported benefits of CRT, the rate of patients who do not respond to the therapy has been remarkably stable at around 30% [
20].
The QRS duration (an electrical index of ventricular dyssynchrony) is the most important clinical indication for CRT patient selection. A longer QRS duration, reflecting greater ventricular dyssynchrony, is generally a predictor of greater response to CRT. While various mechanical dyssynchrony assessments of dyssynchrony, such as STE, have been evaluated for their utility in CRT patient selection, they have generally failed to improve the rate of nonresponders. The EchoCRT trial, which evaluated CRT in patients with mechanical dyssynchrony and a narrow QRS complex, was stopped for futility with the conclusion that CRT was possibly detrimental in that patient cohort [
21,
22].
The disappointing performance of mechanical dyssynchrony indices in patient selection is an indication of gaps in our understanding of the electromechanics of HF and CRT. A better understanding of the physiology underlying response and non-response to CRT may advance future attempts to improve the therapy. The present study combines STE with ECGI to study the electromechanics of CRT in HF patients in situ. We imaged HF patients undergoing CRT (HF-CRT) longitudinally to determine baseline dyssynchrony prior to CRT, acute resynchronization at onset of CRT, and reverse remodeling after 6 months of CRT pacing. Previously published ECGI and STE data from a group of 20 healthy adults [
3] served as control data for comparison.
2. Methods
2.1. Patient Cohort
We enrolled a representative group of 30 HF-CRT patients at Washington University in St. Louis—63% were male with a mean age 64.1 years, and 37% were female with a mean age 62.9 years. Any HF patients undergoing new CRT device implantation were eligible for inclusion in the study. Patient demographics, HF etiologies, and baseline EF and QRS durations are provided in
Table 1. The study was approved by the Human Research Protection Office at Washington University in St. Louis (IRB ID: 201111090). All participants provided written informed consent.
2.2. Electrocardiographic Imaging (ECGI)
The ECGI method was described previously [
1]. A schematic of the procedure is presented in
Figure 1. Briefly, 256 uniformly distributed ECGs were simultaneously recorded from the torso using a portable recording system (ActiveTwo, BioSemi; the Netherlands). Patient-specific heart-torso geometries were obtained using a thoracic CT scan gated at 70% of the R-R interval while wearing the recording electrodes. The ECG recordings were combined with the heart-torso geometries to reconstruct unipolar epicardial electrograms noninvasively, using previously described methods [
1]. Typically, 1000 electrograms were computed over the entire ventricular epicardium. Electrograms over the valve plane were excluded from further analysis.
2.3. Echocardiography
Echocardiography was performed using a commercially available ultrasound imaging system (Vivid 7, GE Healthcare, Milwaukee, WI, USA). Longitudinal strain was assessed in standard 4-chamber, 3-chamber (apical long axis), and 2-chamber apical views. Images were obtained using the maximum framerate that allowed for viewing the entire left ventricle (LV) chamber, with a typical frame rate of 70 frames per second. Strain curves in each apical view were computed using vendor speckle tracking software (EchoPAC, GE Healthcare, Milwaukee, WI, USA). To minimize the effect of noise on the timing of the strain curves, 3 beats were processed for each view and averaged. LV volumes and ejection fractions (also averaged over 3 beats) were determined using Simpson’s biplane method. In cases where the 2-chamber view could not be obtained (n = 5), the 4-chamber volume parameters were used. We defined response as a decrease in LV end systolic volume (LVESV) ≥ 15% and/or an increase in ejection fraction (EF) ≥ 5% after 6 months of CRT. Responders and nonresponders were classified based on these echocardiographic criteria.
2.4. Longitudinal CRT Studies
The first ECGI and STE images were obtained after device implantation but prior to the onset of CRT pacing. This allowed us to determine the location of the pacing leads from the CT scan and image the patients prior to any CRT-induced reverse-remodeling. Patients were imaged in their native (un-paced) rhythm and at the onset of CRT pacing. Imaging was repeated in both paced and un-paced rhythms after 3 and 6 months of CRT pacing. To avoid the radiation exposure of additional CT scans during follow-up visits, the ECGI electrodes were placed in the same locations as the initial visit using images from the initial scan to guide electrode placement.
2.5. Analysis
2.5.1. Segmentation
Analysis of each imaging modality was performed blinded to the results of the other modalities. The LV was segmented using a modified version of the American Heart Association 17-Segment Model (
Figure 2). The standard apical segments were replaced with anterolateral, inferolateral, anteroseptal, and inferoseptal apical segments. For the ECGI analysis, the lateral right ventricle (RV) was segmented using the same convention as the lateral LV. Electrogram parameters for each region were computed using the mean value from all electrograms within the region.
2.5.2. Electrogram Analysis
Activation times were computed from epicardial electrograms as the time of steepest negative time-derivative of voltage (−dV/dt
max). Recovery times were computed as the steepest positive time-derivative during the T wave (dV/dt
max) [
23,
24]. Activation-recovery intervals (ARIs, a surrogate for local APD) were computed as the difference between recovery time and activation time. Activation and recovery maps were edited based on overall sequence and neighboring electrograms. Electrogram fractionation was quantified using the number of downward deflections between the QRS onset and T wave onset. Electrograms with more than 2 deflections were considered “fractionated” (see online supplement of [
3] for additional details). ARIs and fractionation were compared across visits in native rhythm to avoid the impact of altered activation sequence on the indices. Parameters were computed at pacing sites by averaging values of the 10 electrograms closest to the pacing lead locations. The term “activation” refers to electrical excitation throughout the text.
2.5.3. Dyssynchrony Indices
We quantified electrical dyssynchrony from the 12-lead ECG using the QRS duration, computed as the latest QRS end in any lead minus the earliest QRS onset in any lead. We note that this definition differs from measurements that report the QRS duration as the maximum duration in any single lead. The total ventricular activation time was defined as the latest ECGI-determined activation time minus the earliest. We evaluated electrical dyssynchrony in ECGI using two previously reported indices. The LV activation delay was defined as the mean activation time in mid and basal lateral LV segments minus the mean activation time in mid and basal lateral RV segments [
25]. LV activation dispersion was computed as the standard deviation of activation times within the LV [
26].
We evaluated mechanical dyssynchrony using analogous indices applied to echocardiographic strain data. The mechanical delay was defined as the mean time of peak strain in mid and basal lateral LV segments minus the mean time of peak strain in mid and basal septal segments. Mechanical dispersion was defined as the standard deviation of contraction times within the LV.
2.5.4. Electromechanical Delay (EMD)
ECGI and echocardiographic parameters were aligned temporally using the body surface ECG from corresponding lead locations. Maxima or minima from the QRS voltage or voltage derivatives were used to align the ECG traces. The electromechanical delay (EMD) was defined as the time of peak strain within an LV segment minus the mean electrical activation time within the segment. Because ECGI does not image the septum, the EMD was not computed for septal segments.
2.5.5. Statistical Analysis
Comparisons between controls and the HF-CRT population were performed using Wilcoxon rank-sum tests. ECGI and STE data are presented for a representative control in
Figure 3. Changes due to acute and chronic CRT pacing were assessed using Wilcoxon signed-rank tests. Correlations between parameters and volumetric reverse remodeling were performed using Spearman correlation coefficients.
3. Results
3.1. Electrical Activation
The native (un-paced) pre-CRT epicardial activation sequence in HF-CRT patients was prolonged compared to controls (
Table A1,
Appendix A) and was acutely altered by the onset of CRT pacing (
Table A2,
Appendix A). The most common pattern of native epicardial activation in HF patients was normal RV activation with varying degrees of delay in the lateral LV.
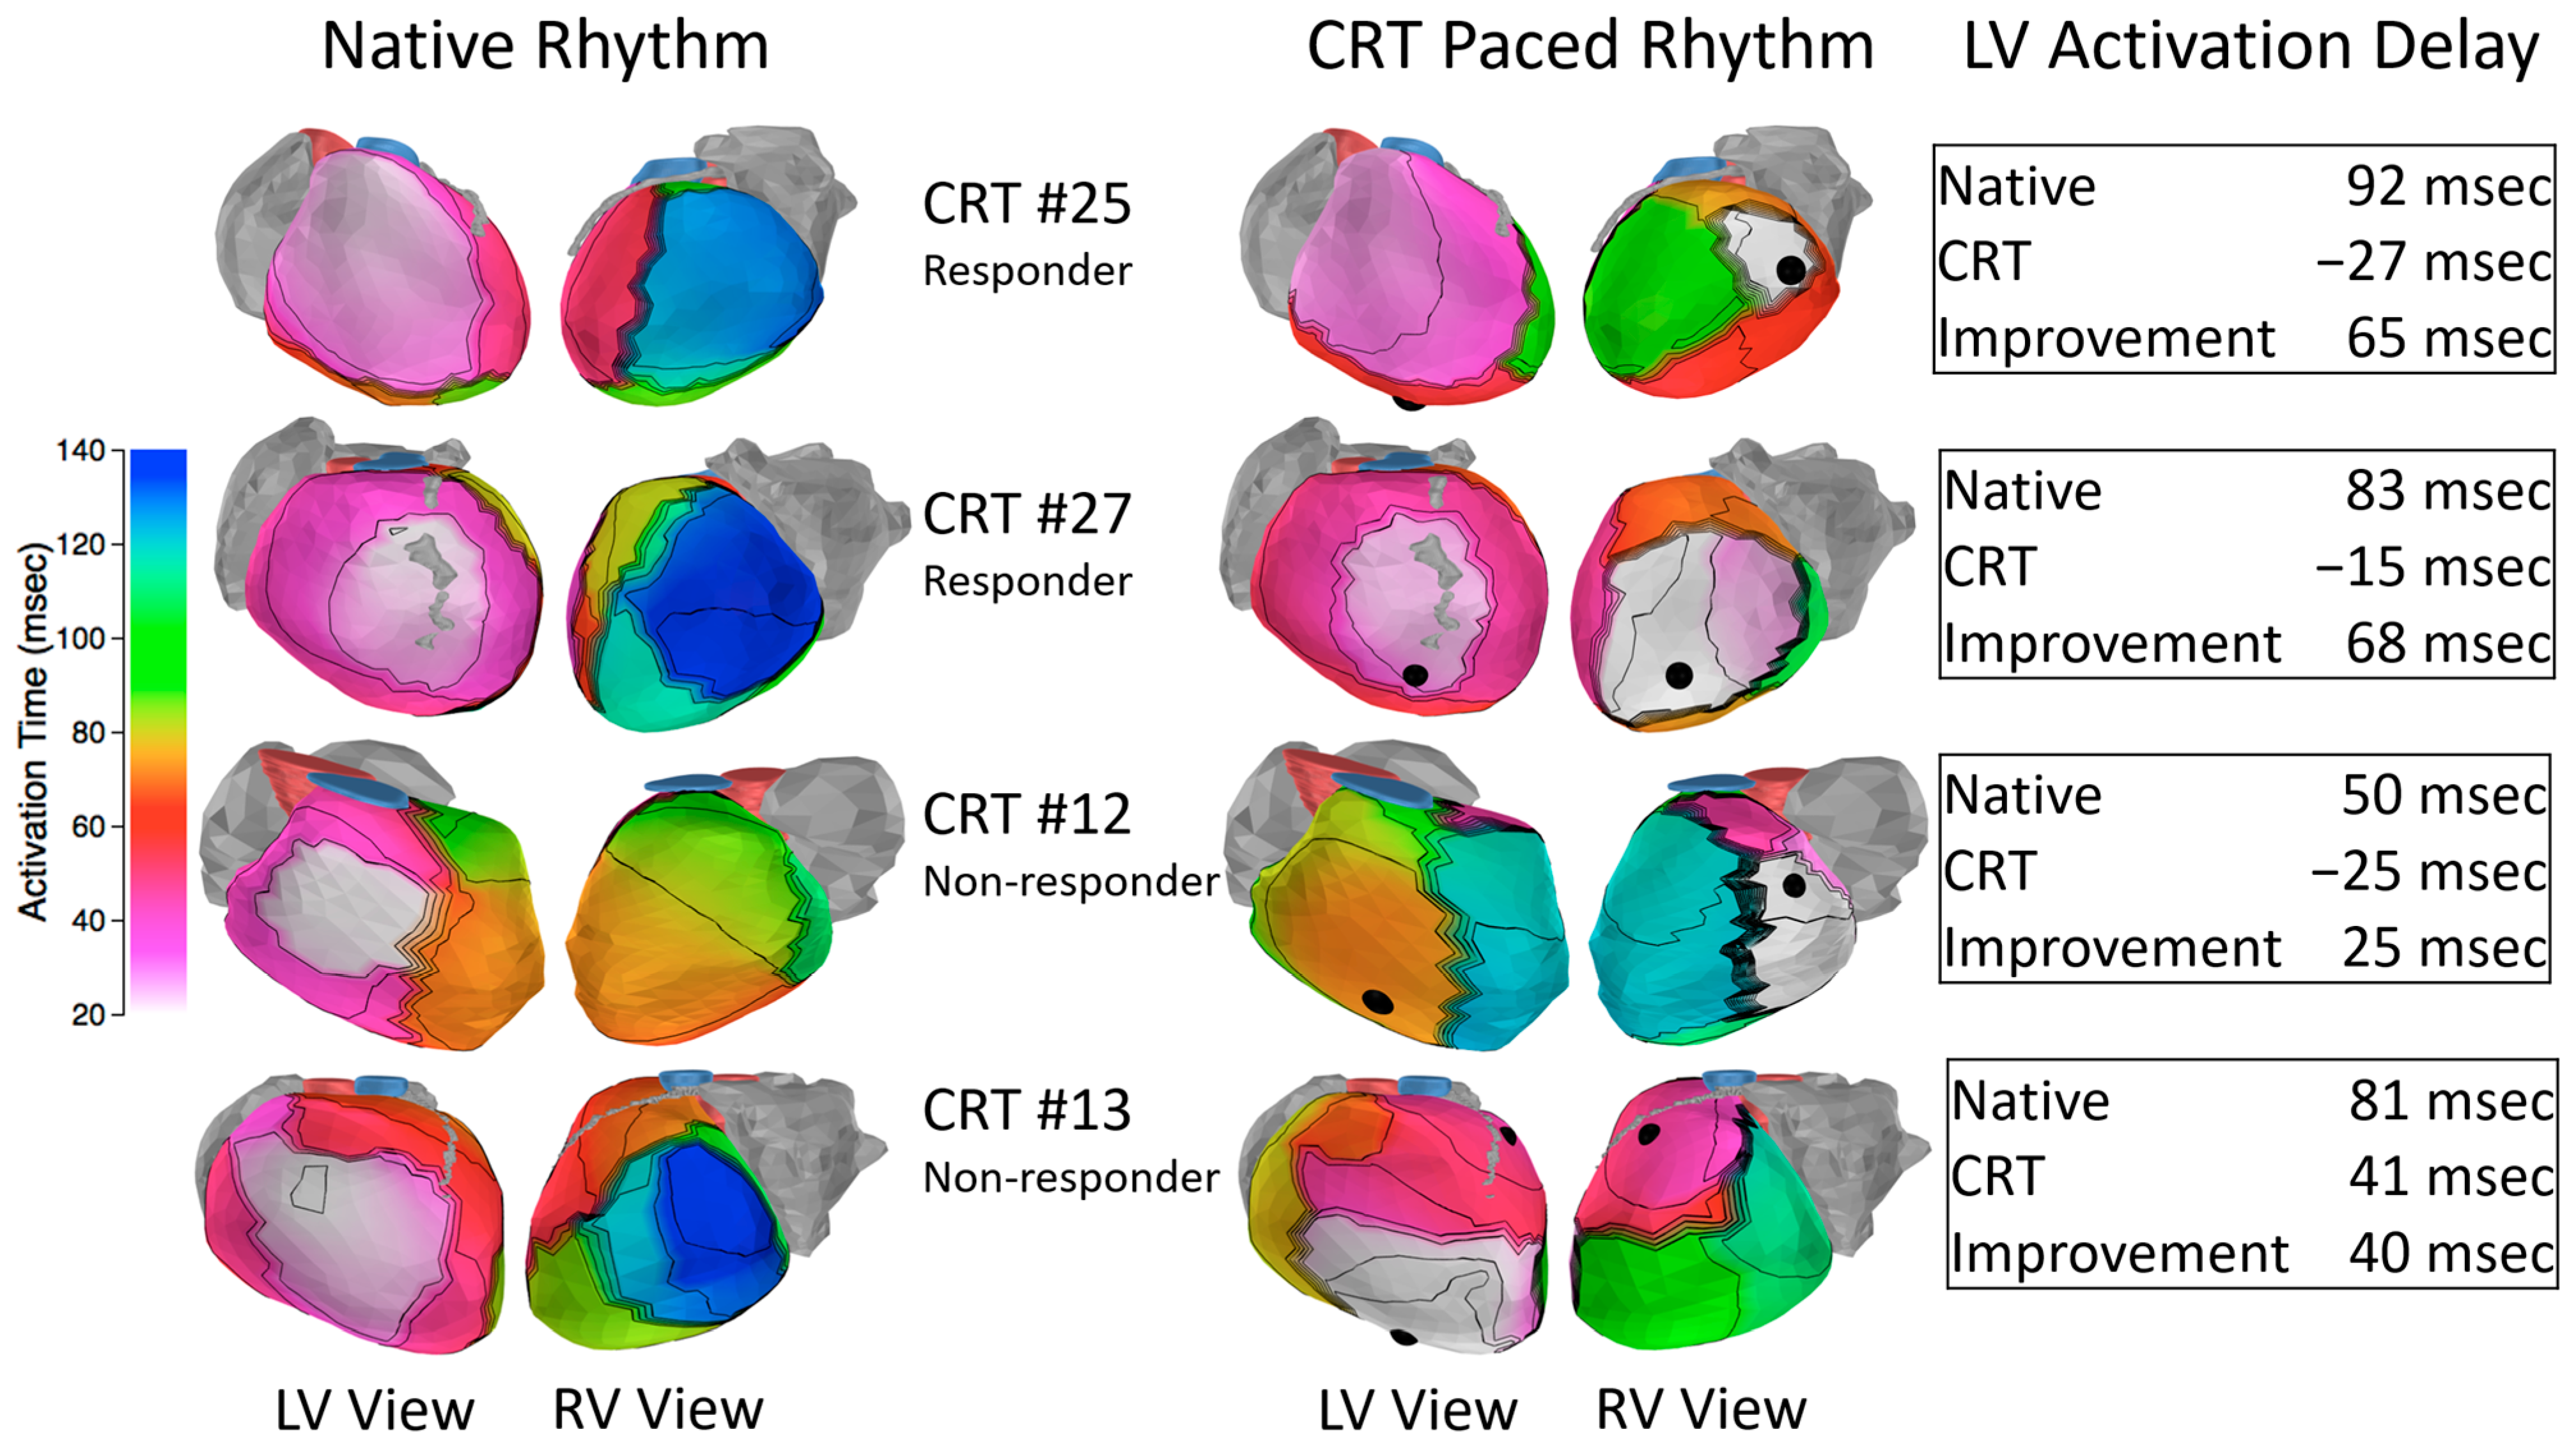
Figure 4 presents representative responders and nonresponders. RV activation patterns were generally consistent with control patients, with RV epicardial breakthrough and a radial activation spread from the breakthrough site to the rest of the RV. LV activation patterns were consistent with prior studies [
25,
26,
27] and generally featured a “U-shaped” left bundle branch block activation pattern with a line of conduction block located between the epicardial aspect of the septum and the LV lateral wall. The best predictors of acute resynchronization efficacy were the baseline level of LV delay (long delay was predictive of effective resynchronization) and the location of the LV lead. The responders (patients 25 and 27) had high baseline electrical dyssynchrony with LV leads located in the region of late activation. The acute onset of CRT pacing resulted in significant improvement in the LV electrical delay parameter. In contrast, the first nonresponder (patient 12) had less baseline dyssynchrony and the onset of pacing resulted in less improvement in synchrony compared to the responders. The second nonresponder (patient 13) had high baseline dyssynchrony. However, the anterior location of the pacing lead reduced the effectiveness of resynchronizing the ventricles.
3.2. Contraction
Contraction in HF-CRT patients was dyssynchronous and impaired. HF-CRT patients had higher pre-systolic stretch and lower peak contraction amplitudes than controls (median −8.78% in HF-CRT vs. −20.65% in controls,
p < 0.001,
Table A1).
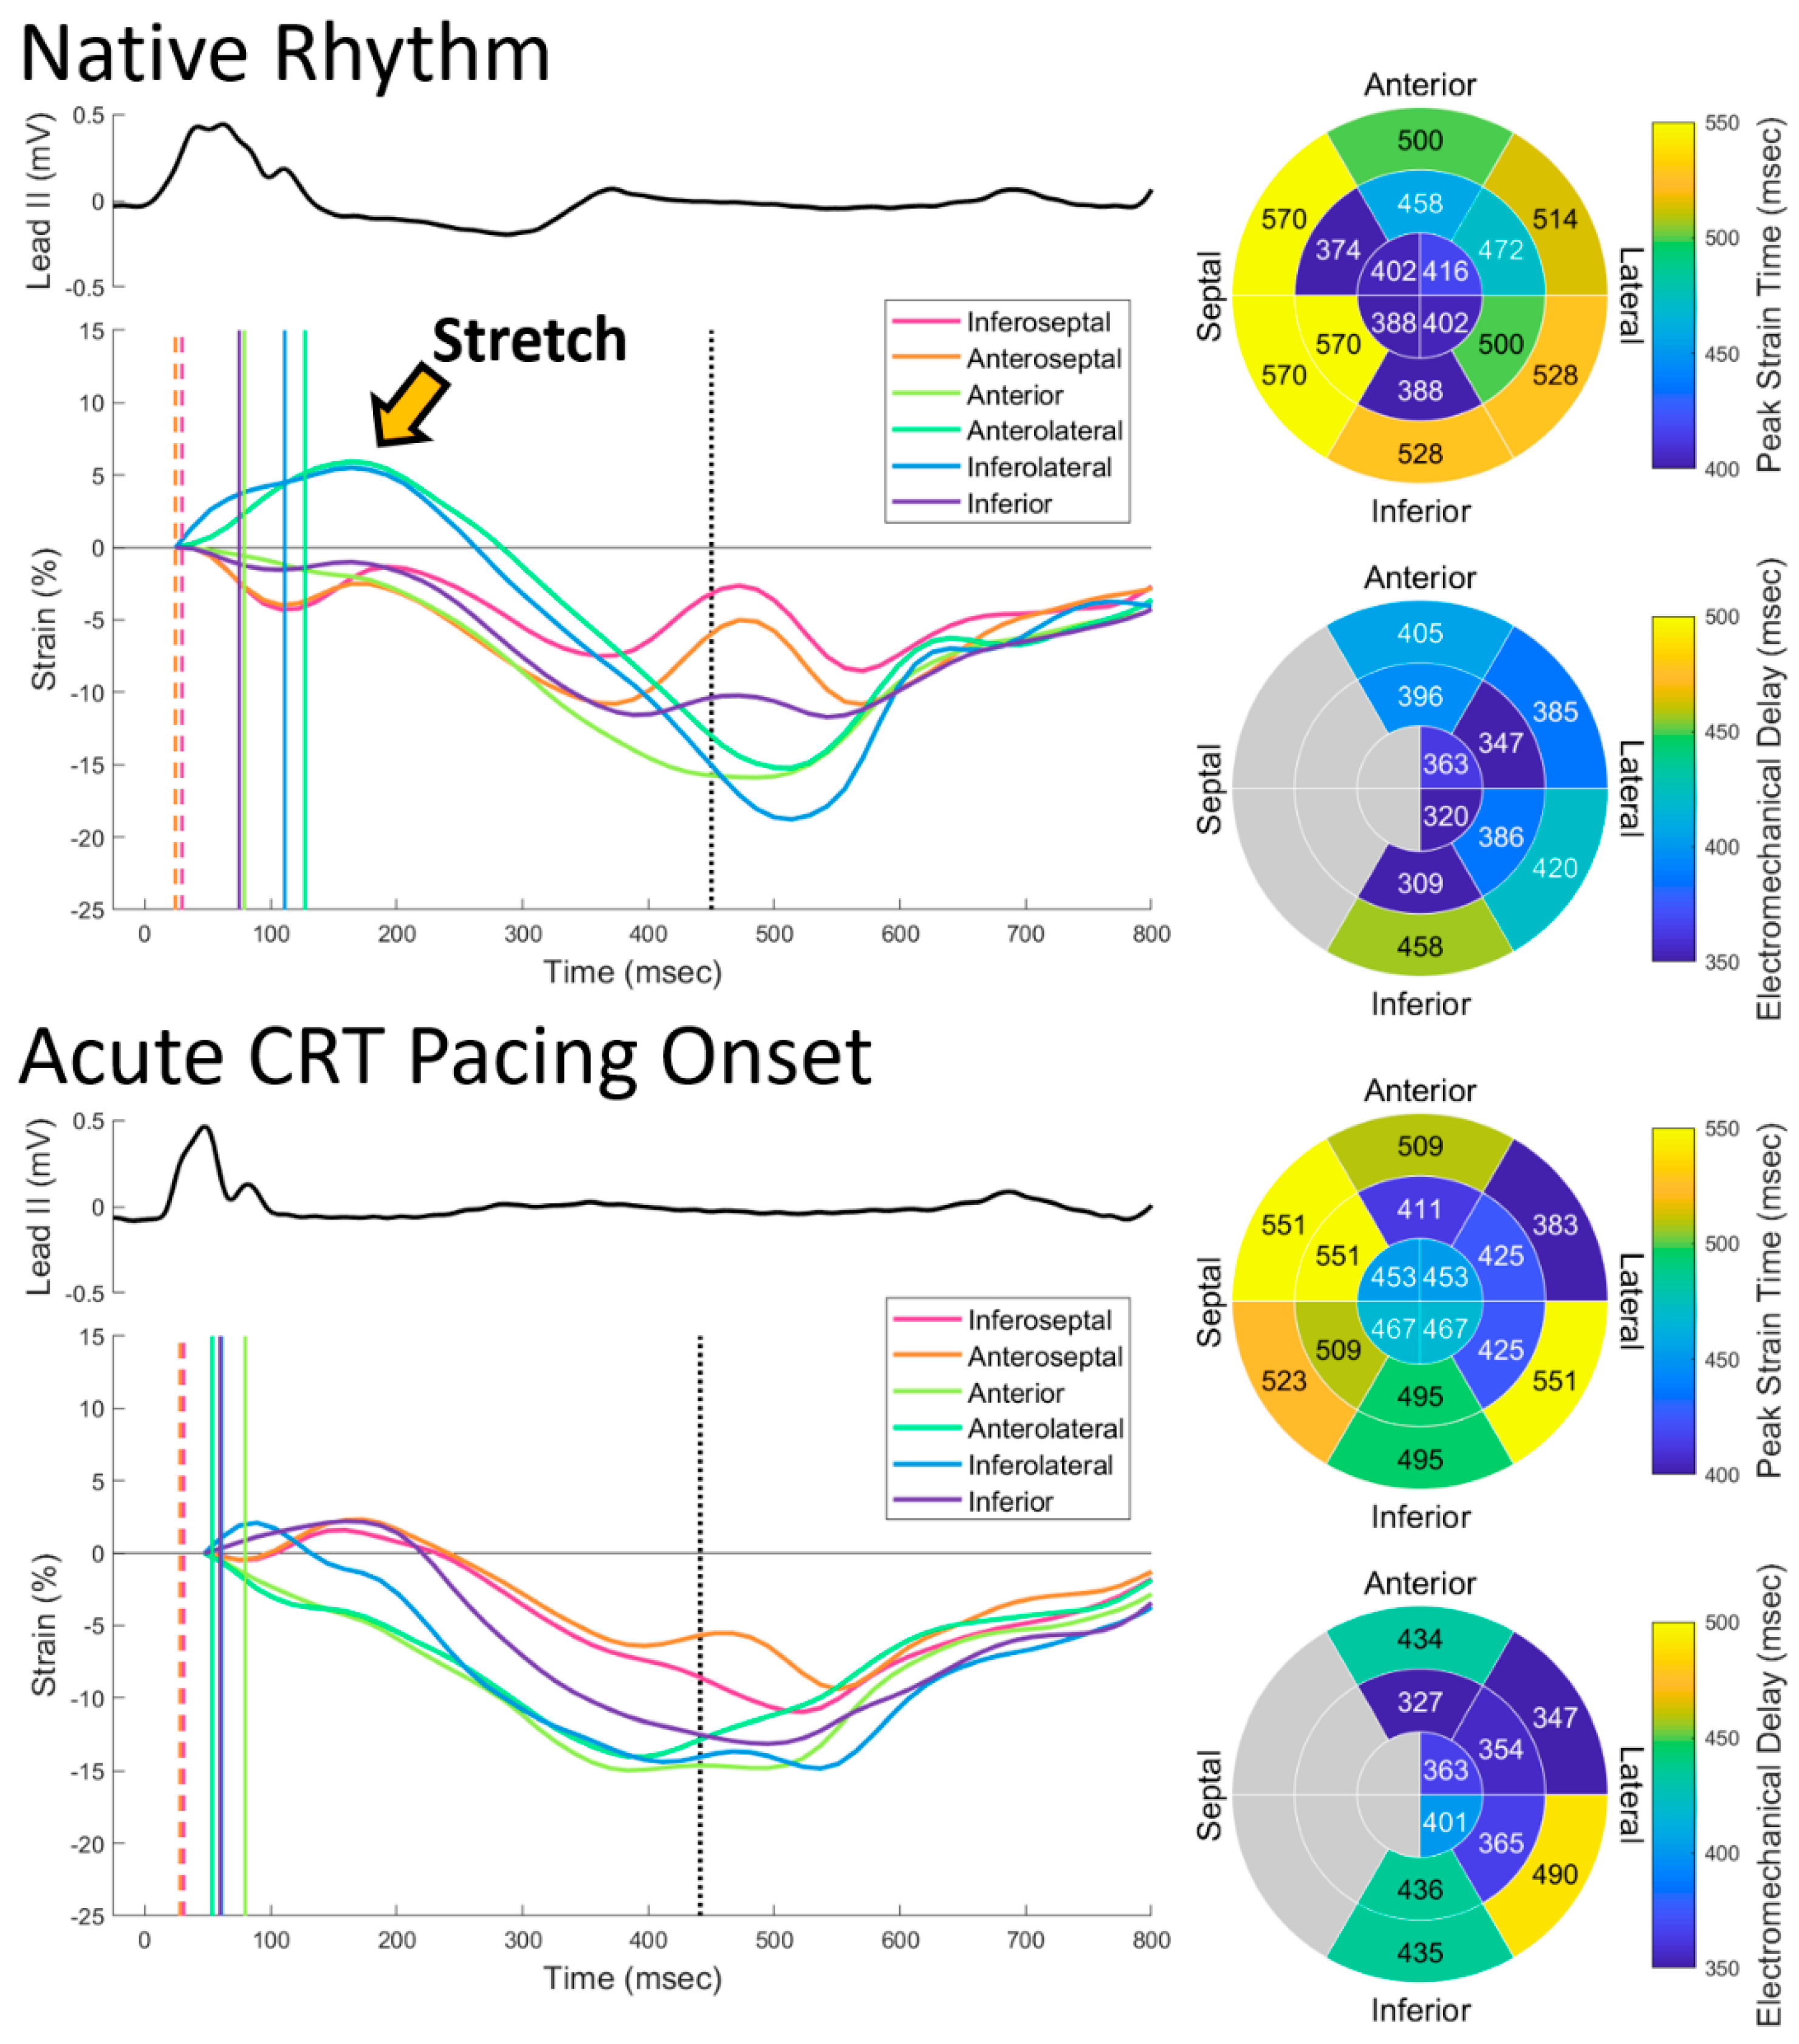
Figure 5 (top) illustrates the native rhythm contraction sequence for a HF-CRT patient. Electrical activation of the lateral LV is delayed relative to the other segments (vertical lines). The lateral LV was stretched (early positive deflection) by the septal wall contraction prior to its own contraction and the lateral wall segments reached peak contraction after aortic valve closure (vertical dotted line). While the overall pattern of delayed LV contraction is apparent from the strain curves, it is difficult to extract markers of contraction timing from the plots because of the influence of opposing contraction and low amplitudes in some regions. In this patient, several of the septal wall segments reached peak strain after the lateral wall, despite the apparent overall pattern of delayed LV contraction. The mean electromechanical delays observed in HF patients closely matched control values. However, the dispersion of EMDs within the LV was larger (median 57 msec in HF-CRT vs. 25 msec in controls,
p < 0.001,
Table A1,
Appendix A).
The onset of CRT pacing improved the overall appearance of synchrony in the STE strain curves (
Figure 5, bottom). The improved mechanical synchrony was reflected in a decrease in the mechanical delay parameter (median 91 msec in native rhythm vs. −15 msec with CRT pacing,
p < 0.001). However, the other mechanical dyssynchrony indices were not significantly changed (
Table A2,
Appendix A). The onset of CRT pacing reduced pre-systolic stretch of the lateral wall but mean peak strain values were unchanged (
Table A2,
Appendix A). EMD values within anatomical segments were altered by the onset of CRT pacing, indicating that the EMD is not an activation-sequence-independent property of the underlying tissue (
Figure 5). There were no statistically significant changes in the mean EMD or the EMD dispersion caused by CRT pacing (
Table A2).
3.3. Volumetric Reverse Remodeling (CRT Response)
Of the 30 HF-CRT patients, 22 patients completed the study and could be classified as responders (patients who had a decrease in LV end systolic volume (LVESV) ≥ 15% and/or an increase in ejection fraction (EF) ≥ 5% after 6 months of CRT) or nonresponders after 6 months of CRT. Out of these, seven (32%) were nonresponders, consistent with the rate of nonresponders observed in most CRT studies. We used Spearman’s rank correlation coefficient to correlate baseline (prior to CRT) native rhythm electrical and mechanical parameters with change in LVESV (
Table A3,
Appendix A). In general, we found that electrical dyssynchrony parameters were more predictive of beneficial reverse remodeling than mechanical dyssynchrony and function parameters. Each ECGI index of electrical dyssynchrony (total activation time, LV electrical delay, and LV electrical dispersion) correlated with LVESV remodeling more strongly than body-surface QRS duration and all of the mechanical indices. The most predictive parameter was the LV electrical delay (Rho = −0.722,
p < 0.001). In addition to baseline parameters, we correlated acute improvements in synchrony parameters at the onset of CRT pacing with change in LVESV (
Table A4,
Appendix A). In this evaluation, acute improvements to the LV activation delay and mechanical dispersion had the highest correlations with LVESV remodeling (Rho = 0.679 and Rho = 0.671, respectively). These correlations were both lower than the correlation between baseline LV delay and LVESV reverse remodeling.
While baseline dyssynchrony and LV lead placement were major factors in resynchronization, the presence of scars played a role in the efficacy of CRT pacing in several patients. Electrograms from scar regions are characteristically low-amplitude and fractionated. We identified the electrophysiological substrate of scars by computing the number of steep downward deflections in low voltage electrograms. HF-CRT patients had a higher percentage of fractionated electrograms than controls (median 1.77% in HF-CRT vs. 0.38% in controls,
p = 0.001,
Table A1,
Appendix A). There were five patients with very high levels of fractionation (6 standard deviations above the control mean)—three were nonischemic, one was ischemic, and one had mild non-obstructive coronary artery disease. Patients 8 and 30 (
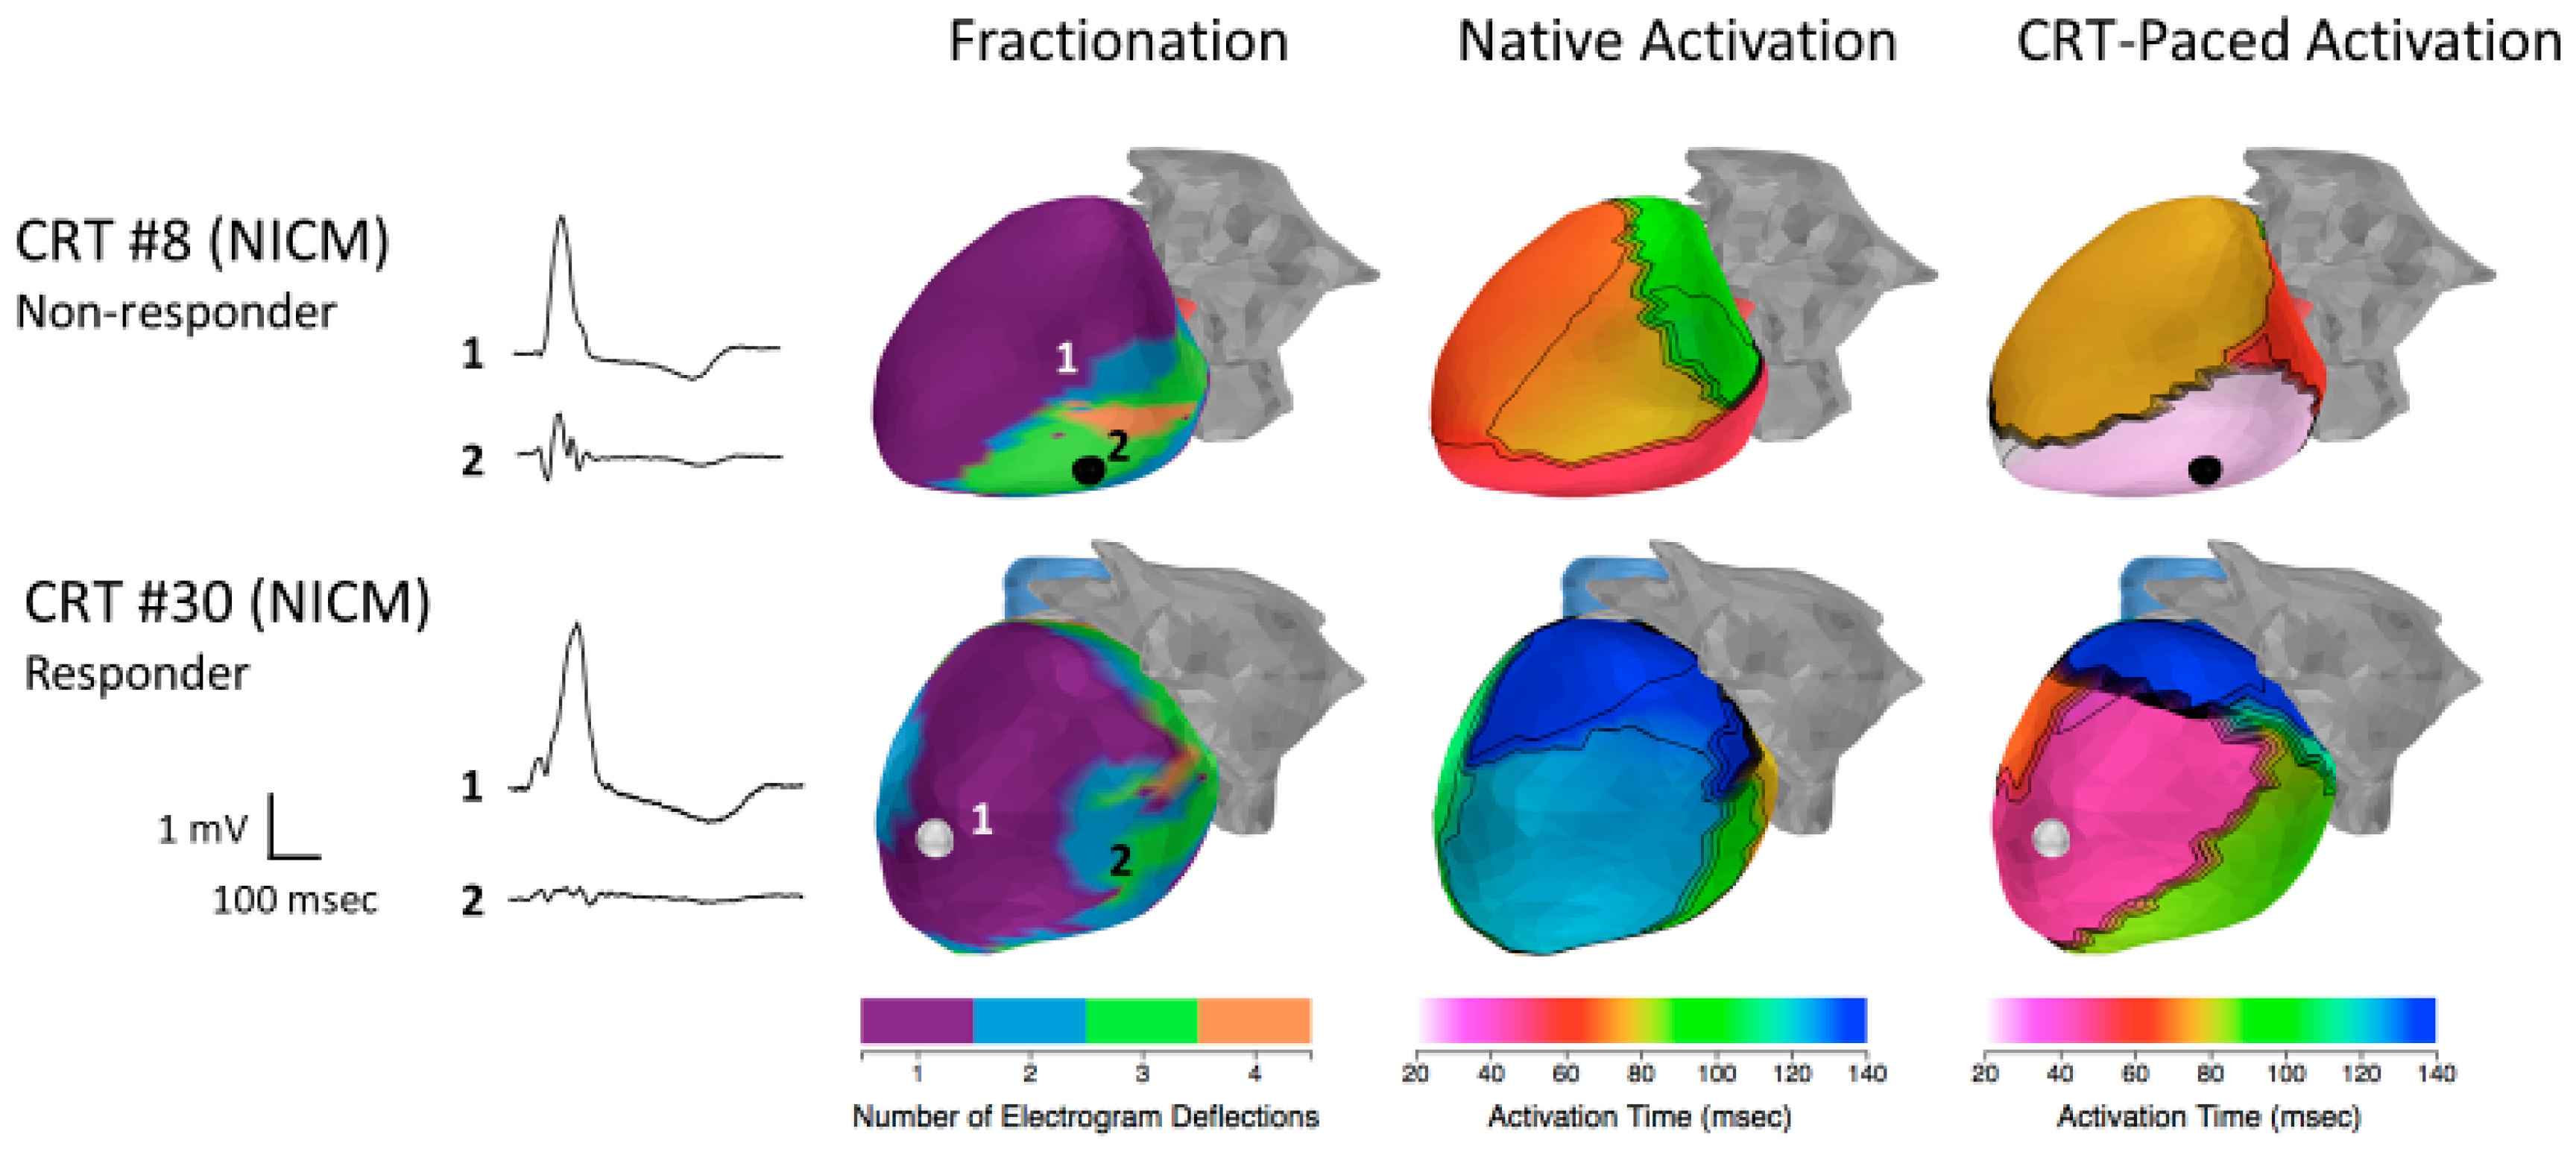
Figure 6, top and bottom rows, respectively) demonstrate the importance of lead placement in relation to the scar. Patient 8 has an LV lead located in an inferolateral scar region, which delayed activation of the anterior LV. As a result, the resynchronization was less effective, and the patient was a nonresponder. Patient 30 had a scar region in the basal lateral LV, but the patient’s LV lead was placed in the center of a region of healthy myocardium. This patient’s electrical synchrony improved substantially, and the patient was a responder.
3.4. Electromechanical Remodeling
To assess changes in electrical and mechanical properties induced by chronic CRT pacing, we compared electrical and mechanical parameters in native rhythm prior to onset of CRT to native rhythm after 6 months of CRT. We found no significant changes in electrical or mechanical synchrony parameters when comparing native rhythm before and after chronic CRT pacing, indicating that the underlying level of dyssynchrony remains unchanged (
Table A5,
Appendix A). We also did not observe statistically significant changes in mean EMD or the dispersion of the EMD (
Table A5,
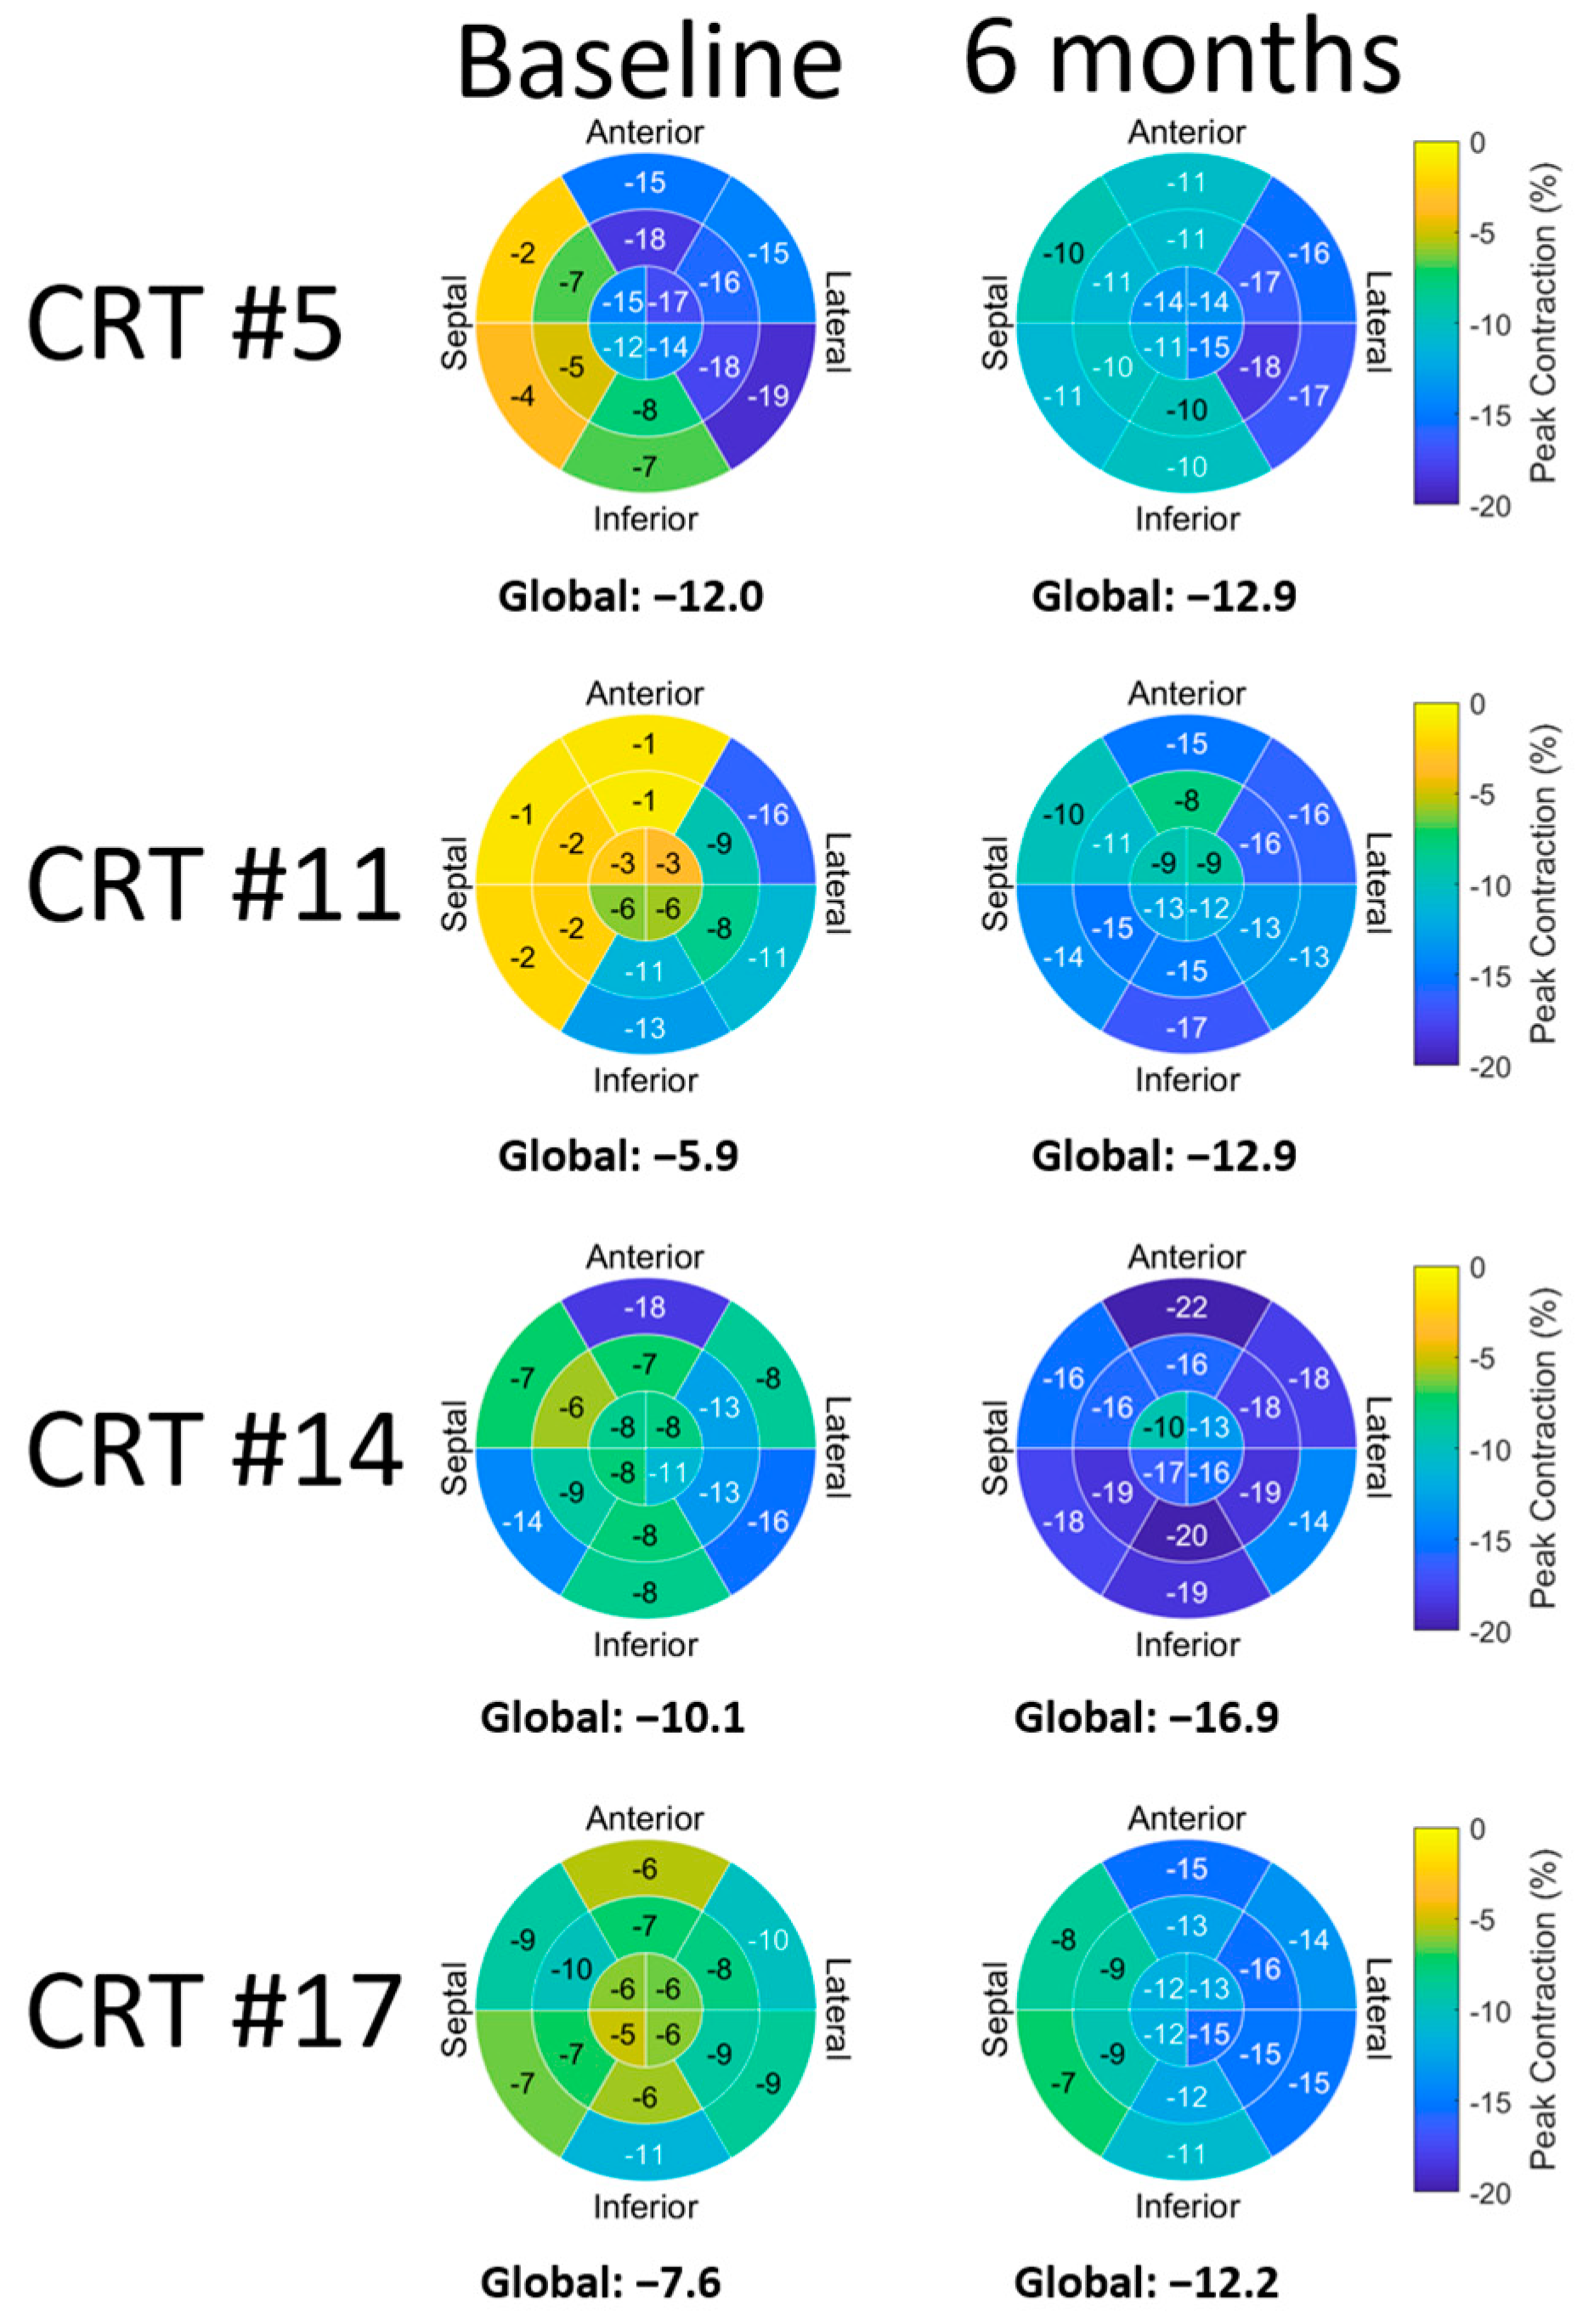
Appendix A). While patients’ native (un-paced) dyssynchrony indices and EMDs were largely unchanged after 6 months of CRT pacing, we did observe a persistent improvement in native rhythm contraction magnitudes after 6 months of CRT (baseline median: −8.55%, remodeled median: −10.14%,
p = 0.008) and sustained EF improvement (baseline median: 24%, remodeled median: 27%,
p < 0.001).
Figure 7 demonstrates the improved contraction in four HF-CRT patients.
Prior to the onset of CRT, HF patients’ mean epicardial ARIs were prolonged by about 45 msec compared to controls (
Table A1,
Appendix A). After 6 months of CRT, mean epicardial ARIs were largely unchanged (
Table A5,
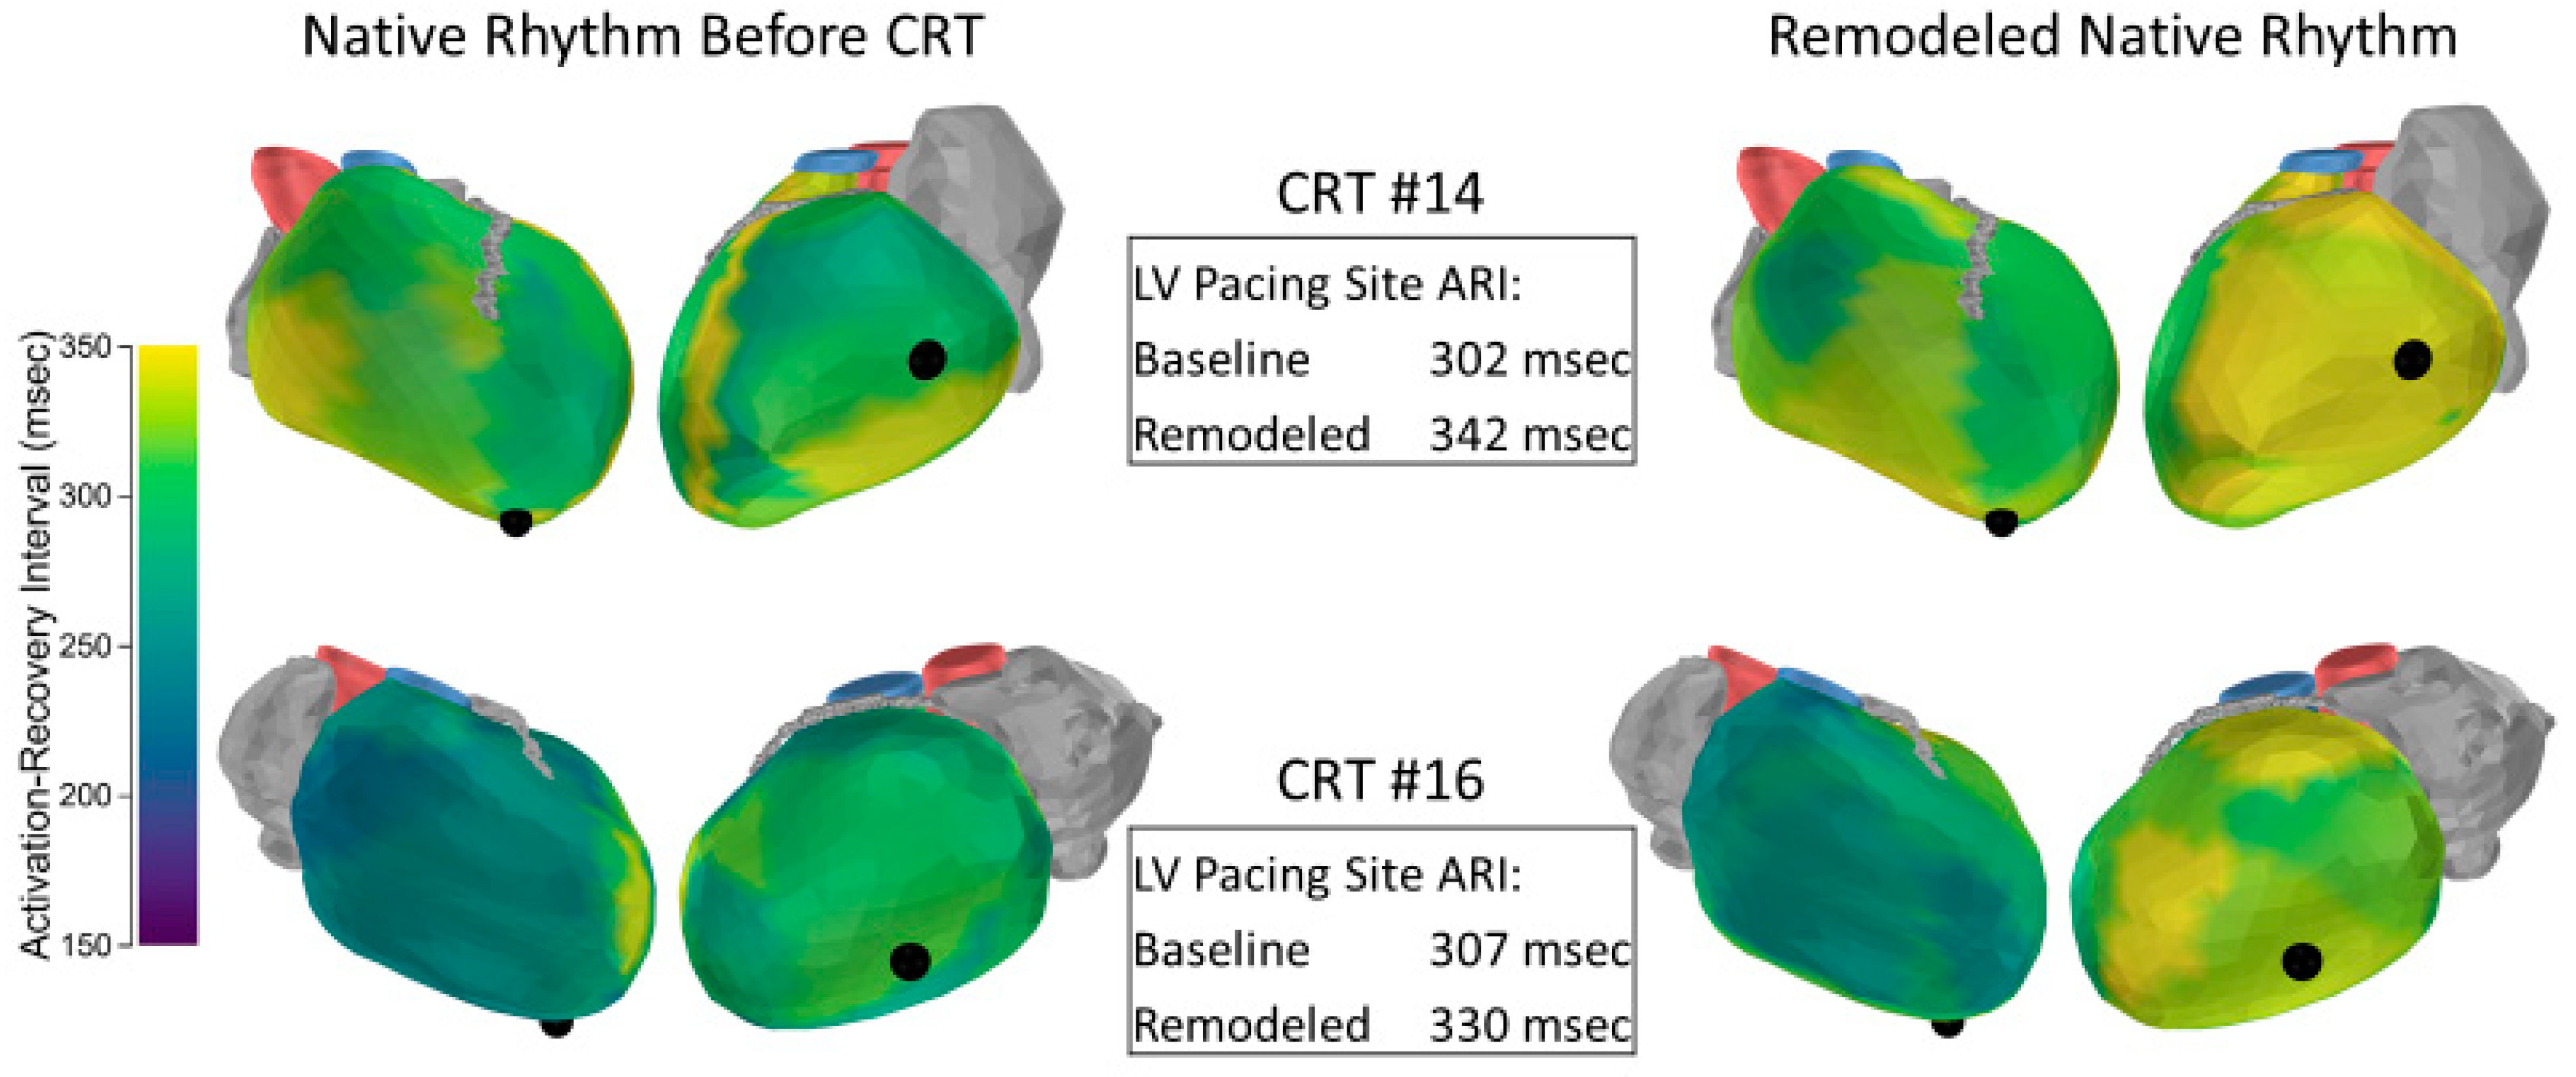
Appendix A). However, native rhythm ARIs near the LV pacing site were prolonged by a median value of 23 msec (
p = 0.002).
Figure 8 presents baseline and remodeled ARI maps for two patients.
We correlated the changes in contraction and ARI prolongation at the LV pacing site with the change in LVESV. The change in contraction was correlated with LVESV change, but the LV ARI change was not (
Table A6,
Appendix A).
4. Discussion
This study combined ECGI and STE for the first time and applied this imaging longitudinally to a group of 30 HF-CRT patients to study the electromechanics of HF, the physiological effects of CRT-induced reverse remodeling, and the utility of ECGI and STE for predicting response to CRT. Using this combination of imaging modalities, we defined and measured the EMD, a novel measurement of excitation-contraction coupling. We found that HF-CRT patients had increased EMD dispersion compared to controls, but the EMD dispersion was not acutely corrected by the onset of pacing and did not significantly change after 6 months of CRT.
Because ECGI and STE are safe, noninvasive imaging techniques, we were able to image patients longitudinally. After 6 months of CRT, we found that patients’ underlying dyssynchrony was unchanged, but increases in peak strain magnitudes revealed improved contraction. Additionally, the panoramic imaging of ECGI revealed prolonged repolarization at the LV pacing lead site. Because we performed echocardiographic evaluations at baseline and after 6 months of CRT, we were able to correlate LVESV reduction (volumetric reverse remodeling) with changes in electromechanical parameters. We found that increased strain magnitudes correlated with LVESV reduction, but the repolarization changes did not, suggesting that the repolarization changes are an effect of the LV epicardial pacing, rather than the reverse remodeling.
In our prospective evaluation of ECGI, STE, and conventional ECG dyssynchrony indices, we found that the ECGI LV activation delay parameter (the difference in mean RV and LV activation time) was the best predictor of response to CRT. Because we imaged patients at baseline and at the acute onset of CRT pacing, we were also able to correlate acute changes in dyssynchrony parameters with reverse remodeling. We found the strongest correlation between LV activation delay and LVESV reduction, and we hypothesize that this parameter could be used to optimize CRT device settings for maximal benefit to patients.
4.1. Reverse Remodeling
CRT is associated with a beneficial reverse-remodeling process which includes a reversal of LV chamber dilation. The volumetric reverse remodeling we observed in this study was consistent with previously reported studies. Notably, 32% of the patients in the present study were echocardiographic nonresponders to CRT, consistent with the nonresponder rate around 30% that is commonly reported [
20].
We found that patients’ levels of electrical and mechanical dyssynchrony after 6 months of CRT were largely unchanged in their native (un-paced) rhythms. Despite the persisting dyssynchrony, we observed increased contraction (strain) magnitudes and a small but statistically significant improvement in EF. The increase in contraction magnitudes that we observed could be an effect of the volumetric reverse remodeling. In simplified models, ventricular wall stress is proportional to chamber diameter as governed by the Law of Laplace [
28]. Volumetric reverse remodeling can therefore decrease wall stress, which decreases the force the contractions are acting against. This may contribute to increased strain amplitudes. The correlation between LVESV decrease and contraction amplitude supports this as a possible mechanism, though it is possible that contractile improvements at the cellular level also contribute.
Multiple animal studies demonstrated ARI shortening as a result of CRT-induced reverse remodeling [
18,
19,
29]. In our study, we found not only that mean ARIs do not decrease, but that ARIs near the LV pacing lead increased by a median value of 23 msec. This ARI prolongation was not correlated with LVESV remodeling, suggesting that this change is not driven by the reverse remodeling process, but rather is caused by the pacing pre-excitation. Prior ECGI studies showed that pre-excitation due to RV pacing and Wolff–Parkinson–White syndrome were both associated with prolonged ARI in the region of pre-excitation [
30,
31]. In the present study, we observed ARI prolongation at the LV pacing site, but not the RV pacing site. It is noteworthy that CRT devices are often programmed so that the RV is activated by the intrinsic conduction system (illustrated in
Figure 4—note the unchanged RV activation pattern in patients 25 and 27). This may cause less pre-excitation at the RV lead location compared to the LV lead and consequently a minimal effect on ARI near the RV lead. The finding of ARI prolongation in the region of the LV pacing lead is consistent with a body-surface study of repolarization heterogeneity in HF-CRT patients. The population of that study showed increased repolarization heterogeneity following CRT implantation which declined following the acute resynchronization phase [
32]. This raises the possibility that the ARI prolongation we observed near the LV lead could have decreased as CRT continued. The discrepancy between these human study results and animal data, which showed shortening of ARI prolongation after CRT [
18,
19,
29], could be due to the species differences or the nature of the heart failure model, which was induced by RV tachypacing in the animal studies.
4.2. Response to CRT
Overall, this study found that electrical indices were more strongly correlated with LVESV reverse remodeling than STE indices. Despite promising initial evaluations, the multicenter PROSPECT trial found that no echocardiographic measures of dyssynchrony improved patient selection for CRT [
21]. The EchoCRT trial, which evaluated CRT in patients with mechanical dyssynchrony and a narrow QRS complex, was stopped for futility with the conclusion that CRT was possibly detrimental in that patient cohort [
22]. The activation sequence dependence of the EMD parameter that we observe is an indicator that the timing of peak strains within anatomical segments does not simply reflect the local contraction. Instead, the EMD is influenced by the entire contraction sequence including opposing wall contractions. This interaction likely decreases the effectiveness of STE indices of dyssynchrony for predicting CRT response. As expected, the baseline QRS duration was correlated with LVESV reverse remodeling. Both of the previously reported ECGI indices of dyssynchrony (the LV activation delay and the LV activation dispersion) were more strongly correlated with LVESV reverse remodeling than the QRS duration. Of all the dyssynchrony indices evaluated, the LV electrical activation delay was the best index for identifying potential responders to CRT.
The initial evaluations of ECGI in HF-CRT patients were retrospective studies of ischemic and nonischemic patients [
25,
26]. In the present study, we validate the results of those studies with prospective data. Our data are also consistent with another prospective ECGI study of HF-CRT patients that found the LV delay (referred to in that study as ventricular electrical uncoupling) was superior to QRS duration at identifying responders [
33]. That study utilized a clinical composite endpoint (freedom from death, freedom from hospitalization, and NYHA functional class improvement after 6 months of CRT). By utilizing echocardiographic criteria for defining response in the present study, we were able to demonstrate that ECGI is predictive of CRT-induced reverse remodeling. In this study, we found that baseline (prior to CRT) electrical dyssynchrony was more predictive of improvement in LVESV remodeling than the improvement of synchrony at pacing onset. It would be valuable to explore whether using ECGI interactively to optimize lead placement and pacing timing could offer patients additional benefits.
An evaluation of ECGI in patients with pediatric congenital heart disease found that placing the LV lead in the site of latest activation resulted in favorable outcomes [
34]. This study demonstrated the importance of the lead location in relation to electrophysiological scar. Prior studies using other imaging modalities demonstrated the importance of scar and its location relative to pacing leads for predicting CRT response [
35]. An advantage of using ECGI for scar mapping is that regions of delayed activation, scar regions, and the baseline level of electrical dyssynchrony could all be imaged with a single modality.
4.3. Study Limitations
Because ECGI does not image the septum, electrical and electromechanical parameters for the septum could not be evaluated. While this study explored the relationship between acute change in ECGI-derived synchrony and reverse remodeling, there was no attempt to optimize CRT device settings using ECGI parameters. Future work could evaluate the impact of utilizing ECGI parameters to optimize device settings to maximize patient benefits. Clinical outcomes in HF-CRT patients are also impacted by medications [
36] and comorbidities such as diabetes [
37,
38,
39]. Future work should be sufficiently powered to account for these variables.
5. Conclusions
ECGI combined with STE is an effective tool for studying cardiac electromechanics. The delay between electrical activation and peak strain is abnormal in HF. CRT does not correct the EMD, but strain magnitudes improve as part of the reverse remodeling process. The LV activation delay measured by ECGI is an effective index for predicting response to CRT, and could have utility for patient selection or device optimization. CRT was less effective when the LV lead was located in a region of electrophysiological scar based on ECGI criteria. This suggests that ECGI could be used to guide LV lead placements. Because ECGI was not used to guide lead placement in the present study, this approach requires additional prospective validation.
Author Contributions
Conceptualization, C.M.A. and Y.R.; methodology, C.M.A., G.K.S., and Y.R.; software, C.M.A.; validation, C.M.A., G.K.S., and Y.R.; formal analysis, C.M.A.; investigation, C.M.A.; resources, G.K.S. and Y.R.; data curation, C.M.A.; writing—original draft preparation, C.M.A. and Y.R.; writing—review and editing, C.M.A. and Y.R.; visualization, C.M.A.; supervision, G.K.S. and Y.R.; project administration, C.M.A., G.K.S., and Y.R.; funding acquisition, Y.R. All authors have read and agreed to the published version of the manuscript.
Funding
This study was supported by NIH—National Heart, Lung and Blood Institute grants R01-HL-033343 and R01-HL-049054 (to YR) and by Washington University Institute of Clinical and Translational Sciences grant UL1-TR000448 from the National Center for Advancing Translational Sciences of the NIH. Dr. Rudy is the Fred Saigh Distinguished Professor at Washington University.
Institutional Review Board Statement
The study was conducted according to the guidelines of the Declaration of Helsinki and approved by Human Research Protection Office at Washington University in St. Louis.
Informed Consent Statement
Informed consent was obtained from all subjects involved in the study.
Data Availability Statement
The data presented in this study are available on request from the corresponding author. The data are not publicly available due to Protected Health Information (PHI) in the data.
Conflicts of Interest
Y.R. receives royalties from CardioInsight Technologies (CIT). CIT does not support any research conducted in Dr. Rudy’s laboratory. The remaining authors have nothing to disclose.
Appendix A
Table A1.
Control and HF-CRT baseline electrical and mechanical parameter comparison. All parameters were measured in native rhythm prior to CRT pacing. Groups were compared using Wilcoxon rank-sum tests. IQR: interquartile range; EM: electromechanical.
Table A1.
Control and HF-CRT baseline electrical and mechanical parameter comparison. All parameters were measured in native rhythm prior to CRT pacing. Groups were compared using Wilcoxon rank-sum tests. IQR: interquartile range; EM: electromechanical.
| | Parameter | Control Median | Control IQR | Heart Failure Median | Heart Failure IQR | p |
|---|
| ECG | QRS duration (msec) | 87 | 16 | 154 | 31 | p < 0.001 |
| Volume | Ejection fraction (%) | 57 | 3 | 24 | 4 | p < 0.001 |
| End systolic volume (mL) | 46 | 20 | 122 | 56 | p < 0.001 |
| End diastolic volume (mL) | 111 | 36 | 160 | 72 | 0.002 |
| Stroke volume (mL) | 63 | 18 | 39 | 19 | p < 0.001 |
| ECGI | Total activation time (msec) | 42 | 12 | 123 | 33 | p < 0.001 |
| LV activation delay (msec) | 14 | 7 | 81 | 48 | p < 0.001 |
| LV activation dispersion (msec) | 9 | 3 | 24 | 9 | p < 0.001 |
| Mean epicardial ARI (msec) | 238 | 32 | 284 | 26 | p < 0.001 |
| Mean LV ARI (msec) | 240 | 23 | 292 | 25 | p < 0.001 |
| Mean RV ARI (msec) | 240 | 50 | 281 | 31 | p < 0.001 |
| Percentage of fractionated electrograms (%) | 0.38 | 1.03 | 1.77 | 2.11 | 0.001 |
| Fractionated deflections per electrogram | 0.0038 | 0.0103 | 0.0179 | 0.0254 | p < 0.001 |
| Strain | Total strain time (msec) | 98 | 42 | 196 | 67 | p < 0.001 |
| Mechanical delay (msec) | 12 | 53 | 91 | 112 | p < 0.001 |
| Mechanical dispersion (msec) | 28 | 10 | 70 | 19 | p < 0.001 |
| Mean peak strain time (msec) | 427 | 40 | 432 | 82 | 0.532 |
| Mean peak contraction (%) | −20.64 | 2.82 | −8.78 | 2.42 | p < 0.001 |
| Max pre-systolic stretch (%) | 2.57 | 1.86 | 4.38 | 3.48 | 0.003 |
| EM Delay | Mean electromechanical delay (msec) | 375 | 40 | 373 | 50 | 0.940 |
| Electromechanical delay dispersion (msec) | 25 | 15 | 57 | 19 | p < 0.001 |
Table A2.
The effect of acute CRT pacing onset on electrical and mechanical parameters in heart failure patients. Changes were evaluated using Wilcoxon signed-rank tests. IQR: interquartile range; EM: electromechanical.
Table A2.
The effect of acute CRT pacing onset on electrical and mechanical parameters in heart failure patients. Changes were evaluated using Wilcoxon signed-rank tests. IQR: interquartile range; EM: electromechanical.
| | Parameter | Native Median | Paced Median | Paired Delta Median | Paired Delta IQR | p |
|---|
| ECG | QRS duration (msec) | 154 | 128 | −37 | 31 | p < 0.001 |
| Volume | Ejection fraction (%) | 24 | 27 | 3 | 4 | p < 0.001 |
| End systolic volume (mL) | 122 | 114 | 1 | 20 | 0.914 |
| End diastolic volume (mL) | 160 | 168 | 5 | 29 | 0.094 |
| Stroke volume (mL) | 39 | 43 | 7 | 9 | p < 0.001 |
| ECGI | Total activation time (msec) | 123 | 104 | −19 | 29 | 0.004 |
| LV activation delay (msec) | 81 | 10 | −62 | 53 | p < 0.001 |
| LV activation dispersion (msec) | 24 | 29 | 11 | 2 | 0.057 |
| Strain | Total strain time (msec) | 196 | 182 | −14 | 75 | 0.223 |
| Mechanical delay (msec) | 91 | −15 | −96 | 91 | p < 0.001 |
| Mechanical dispersion (msec) | 70 | 63 | −9 | 40 | 0.046 |
| Mean peak contraction (%) | −8.78 | −8.78 | 0.22 | 1.97 | 0.549 |
| Max pre-systolic stretch (%) | 4.38 | 3.6 | −1.23 | 2.19 | 0.009 |
| EM Delay | Mean electromechanical delay (msec) | 373 | 391 | 10 | 50 | 0.097 |
| Electromechanical delay dispersion (msec) | 57 | 61 | 8 | 33 | 0.039 |
Table A3.
Correlations between the change in left ventricular end-systolic volume (LVESV) after 6 months of CRT pacing and baseline electrical and mechanical parameters in heart failure patients. All parameters were measured in native rhythm. Correlations were determined using Spearman’s Rho tests.
Table A3.
Correlations between the change in left ventricular end-systolic volume (LVESV) after 6 months of CRT pacing and baseline electrical and mechanical parameters in heart failure patients. All parameters were measured in native rhythm. Correlations were determined using Spearman’s Rho tests.
| | Parameter | Spearman’s Rho | p |
|---|
| ECG | QRS duration (msec) | −0.486 | 0.023 |
| ECGI | Total activation time (msec) | −0.583 | 0.005 |
| LV activation delay (msec) | −0.722 | p < 0.001 |
| LV activation dispersion (msec) | −0.588 | 0.005 |
| Mean epicardial ARI (msec) | −0.110 | 0.625 |
| Mean LV ARI (msec) | 0.168 | 0.454 |
| Mean RV ARI (msec) | −0.373 | 0.088 |
| Fractionated deflections per electrogram | 0.241 | 0.280 |
| Fractionated deflections per electrogram at LV pacing site | 0.387 | 0.075 |
| Strain | Total peak strain time (msec) | −0.425 | 0.101 |
| Mechanical delay (msec) | 0.132 | 0.639 |
| Mechanical dispersion (msec) | −0.585 | 0.019 |
| Mean peak contraction (%) | 0.009 | 0.978 |
| Mean pre-systolic stretch (%) | −0.324 | 0.221 |
| Electromechanical Delay | Mean electromechanical delay (msec) | −0.225 | 0.419 |
| Electromechanical delay dispersion (msec) | −0.204 | 0.466 |
Table A4.
Correlations between the change in left ventricular end-systolic volume (LVESV) after 6 months of cardiac resynchronization therapy (CRT) pacing and the change in dyssynchrony parameters due to the acute onset of CRT pacing. Correlations were determined using Spearman’s Rho tests.
Table A4.
Correlations between the change in left ventricular end-systolic volume (LVESV) after 6 months of cardiac resynchronization therapy (CRT) pacing and the change in dyssynchrony parameters due to the acute onset of CRT pacing. Correlations were determined using Spearman’s Rho tests.
| | Parameter | Spearman’s Rho | p |
|---|
| ECG | QRS duration (msec) | 0.505 | 0.017 |
| Volume | Ejection fraction (%) | 0.025 | 0.934 |
| ECGI | Total activation time (msec) | 0.407 | 0.061 |
| LV activation delay absolute value (msec) | 0.679 | p < 0.001 |
| LV activation dispersion (msec) | 0.545 | 0.010 |
| Strain | Total peak strain time (msec) | 0.583 | 0.023 |
| Mechanical delay absolute value (msec) | 0.013 | 0.965 |
| Mechanical dispersion (msec) | 0.671 | 0.008 |
Table A5.
The effects of 6 months of cardiac resynchronization therapy pacing on heart failure patients’ electrical and mechanical parameters. All parameters at each visit were computed from native rhythm beats. Changes were evaluated using Wilcoxon signed-rank tests.
Table A5.
The effects of 6 months of cardiac resynchronization therapy pacing on heart failure patients’ electrical and mechanical parameters. All parameters at each visit were computed from native rhythm beats. Changes were evaluated using Wilcoxon signed-rank tests.
| | Parameter | Baseline Median | 6 Months Median | Paired Delta Median | Delta IQR | p |
|---|
| ECG | QRS duration (msec) | 154 | 157 | 5 | 11 | 0.164 |
| Volume | Ejection fraction (%) | 24 | 27 | 6 | 7 | p < 0.001 |
| End systolic volume (mL) | 125 | 121 | −22 | 47 | 0.046 |
| End diastolic volume (mL) | 167 | 171 | −11 | 49 | 0.306 |
| Stroke volume (mL) | 40 | 48 | 8 | 19 | 0.005 |
| ECGI | Total activation time (msec) | 123 | 115 | −4 | 14 | 0.178 |
| LV activation delay (msec) | 82 | 81 | 2 | 20 | 0.858 |
| LV activation dispersion (msec) | 24 | 25 | 1 | 4 | 0.211 |
| Mean epicardial ARI (msec) | 282 | 288 | 6 | 28 | 0.408 |
| Mean LV ARI (msec) | 288 | 293 | 6 | 26 | 0.211 |
| Mean RV ARI (msec) | 280 | 283 | 4 | 28 | 0.833 |
| LV pacing site ARI (msec) | 280 | 306 | 23 | 36 | 0.002 |
| RV pacing site ARI (msec) | 293 | 297 | 3 | 30 | 0.291 |
| Percentage of fractionated electrograms (%) | 1.54 | 1.85 | 0.56 | 2.16 | 0.511 |
| Fractionated deflections per electrogram | 0.0171 | 0.0235 | 0.0046 | 0.0492 | 0.565 |
| Strain | Total peak strain time (msec) | 196 | 210 | 14 | 77 | 0.891 |
| Mechanical delay (msec) | 88 | 81 | −6 | 65 | 1.000 |
| Mechanical dispersion (msec) | 70 | 66 | 0 | 26 | 0.228 |
| Mean peak contraction (%) | −8.55 | −10.14 | −1.31 | 2.93 | 0.008 |
| Mean pre-systolic stretch (%) | 4.59 | 3.48 | −1.13 | 4.22 | 0.438 |
| EM Delay | Mean electromechanical delay (msec) | 367 | 381 | 14 | 45 | 0.169 |
| Electromechanical delay dispersion (msec) | 57 | 50 | −7 | 20 | 0.135 |
Table A6.
Correlation between the change in left ventricular end-systolic volume after 6 months of cardiac resynchronization therapy (CRT) pacing and the changes in ARI and contraction remodeling. Correlations were determined using Spearman’s Rho tests.
Table A6.
Correlation between the change in left ventricular end-systolic volume after 6 months of cardiac resynchronization therapy (CRT) pacing and the changes in ARI and contraction remodeling. Correlations were determined using Spearman’s Rho tests.
| Parameter | Spearman’s Rho | p |
|---|
| LV pacing site ARI (msec) | −0.206 | 0.356 |
| Mean peak contraction (%) | 0.618 | 0.013 |
References
- Ramanathan, C.; Ghanem, R.N.; Jia, P.; Ryu, K.; Rudy, Y. Noninvasive electrocardiographic imaging for cardiac electrophysiology and arrhythmia. Nat. Med. 2004, 10, 422–428. [Google Scholar] [CrossRef]
- Andrews, C.M.; Srinivasan, N.T.; Rosmini, S.; Bulluck, H.; Orini, M.; Jenkins, S.; Pantazis, A.; McKenna, W.J.; Moon, J.C.; Lambiase, P.D.; et al. Electrical and Structural Substrate of Arrhythmogenic Right Ventricular Cardiomyopathy Determined Using Noninvasive Electrocardiographic Imaging and Late Gadolinium Magnetic Resonance Imaging. Circ. Arrhythmia Electrophysiol. 2017, 10. [Google Scholar] [CrossRef] [PubMed]
- Andrews, C.; Cupps, B.P.; Pasque, M.K.; Rudy, Y. Electromechanics of the Normal Human Heart In Situ. Circ. Arrhythmia Electrophysiol. 2019, 12. [Google Scholar] [CrossRef]
- Blessberger, H.; Binder, T. Non-invasive imaging: Two dimensional speckle tracking echocardiography: Basic principles. Heart 2010, 96, 716–722. [Google Scholar] [CrossRef] [PubMed]
- Collier, P.; Phelan, D.; Klein, A. A Test in Context: Myocardial Strain Measured by Speckle-Tracking Echocardiography. J. Am. Coll. Cardiol. 2017, 69, 1043–1056. [Google Scholar] [CrossRef] [PubMed]
- Benjamin, E.J.; Virani, S.S.; Callaway, C.W.; Chamberlain, A.M.; Chang, A.R.; Cheng, S.; Chiuve, S.E.; Cushman, M.; Delling, F.N.; Deo, R.; et al. Heart Disease and Stroke Statistics—2018 Update: A Report From the American Heart Association. Circulation 2018, 137. [Google Scholar] [CrossRef]
- Davies, C.; Davia, K.; Bennett, J.; Pepper, J.; Poole-Wilson, P.; Harding, S. Reduced contraction and altered frequency response of isolated ventricular myocytes from patients with heart failure. Circulation 1995, 92, 2540–2549. [Google Scholar] [CrossRef]
- Tomaselli, G.F.; Zipes, D.P. What Causes Sudden Death in Heart Failure? Circ. Res. 2004, 95, 754–763. [Google Scholar] [CrossRef] [Green Version]
- Nattel, S.; Maguy, A.; Le Bouter, S.; Yeh, Y.-H. Arrhythmogenic Ion-Channel Remodeling in the Heart: Heart Failure, Myocardial Infarction, and Atrial Fibrillation. Physiol. Rev. 2007, 87, 425–456. [Google Scholar] [CrossRef]
- Eapen, Z.; Rogers, J.G. Strategies to attenuate pathological remodeling in heart failure. Curr. Opin. Cardiol. 2009, 24, 223–229. [Google Scholar] [CrossRef]
- Kirk, J.A.; Kass, D.A. Cellular and Molecular Aspects of Dyssynchrony and Resynchronization. Card. Electrophysiol. Clin. 2015, 7, 585–597. [Google Scholar] [CrossRef] [Green Version]
- Gambardella, J.; Trimarco, B.; Iaccarino, G. New Insights in Cardiac Calcium Handling and Excitation-Contraction Coupling. Adv. Exp. Med. Biol. 2018, 1067, 373–385. [Google Scholar] [CrossRef] [Green Version]
- Kashani, A.; Barold, S.S. Significance of QRS Complex Duration in Patients With Heart Failure. J. Am. Coll. Cardiol. 2005, 46, 2183–2192. [Google Scholar] [CrossRef] [Green Version]
- Abraham, W.T.; Fisher, W.G.; Smith, A.L.; Delurgio, D.B.; Leon, A.R.; Loh, E.; Kocovic, D.Z.; Packer, M.; Clavell, A.L.; Hayes, D.L.; et al. Cardiac Resynchronization in Chronic Heart Failure. N. Engl. J. Med. 2002, 346, 1845–1853. [Google Scholar] [CrossRef] [PubMed] [Green Version]
- Cleland, J.G.; Daubert, J.-C.; Erdmann, E.; Freemantle, N.; Gras, D.; Kappenberger, L.; Tavazzi, L.; on behalf of The CARE-HF Study Investigators. Longer-term effects of cardiac resynchronization therapy on mortality in heart failure [the CArdiac REsynchronization-Heart Failure (CARE-HF) trial extension phase]. Eur. Heart J. 2006, 27, 1928–1932. [Google Scholar] [CrossRef] [PubMed] [Green Version]
- Cleland, J.G.; Daubert, J.-C.; Erdmann, E.; Freemantle, N.; Gras, D.; Kappenberger, L.; Tavazzi, L. The effect of cardiac resynchronization on morbidity and mortality in heart failure. N. Engl. J. Med. 2005, 352, 1539–1549. [Google Scholar] [CrossRef] [PubMed] [Green Version]
- Bristow, M.R.; Saxon, L.A.; Boehmer, J.; Krueger, S.; Kass, D.A.; De Marco, T.; Carson, P.; Dicarlo, L.; DeMets, D.; White, B.G.; et al. Cardiac-resynchronization therapy with or without an implantable defibrillator in advanced chronic heart failure. N. Engl. J. Med. 2004, 350, 2140–2150. [Google Scholar] [CrossRef] [PubMed]
- Nishijima, Y.; Sridhar, A.; Viatchenko-Karpinski, S.; Shaw, C.; Bonagura, J.D.; Abraham, W.T.; Joshi, M.S.; Bauer, J.A.; Hamlin, R.L.; Györke, S.; et al. Chronic cardiac resynchronization therapy and reverse ventricular remodeling in a model of nonischemic cardiomyopathy. Life Sci. 2007, 81, 1152–1159. [Google Scholar] [CrossRef] [Green Version]
- Aiba, T.; Hesketh, G.G.; Barth, A.S.; Liu, T.; Daya, S.; Chakir, K.; Dimaano, V.L.; Abraham, T.P.; O’Rourke, B.; Akar, F.G.; et al. Electrophysiological Consequences of Dyssynchronous Heart Failure and Its Restoration by Resynchronization Therapy. Circulation 2009, 119, 1220–1230. [Google Scholar] [CrossRef] [Green Version]
- Daubert, C.; Behar, N.; Martins, R.P.; Mabo, P.; Leclercq, C. Avoiding non-responders to cardiac resynchronization therapy: A practical guide. Eur. Heart J. 2016, ehw270. [Google Scholar] [CrossRef]
- Chung, E.S.; Leon, A.R.; Tavazzi, L.; Sun, J.-P.; Nihoyannopoulos, P.; Merlino, J.; Abraham, W.T.; Ghio, S.; Leclercq, C.; Bax, J.J.; et al. Results of the Predictors of Response to CRT (PROSPECT) Trial. Circulation 2008, 117, 2608–2616. [Google Scholar] [CrossRef] [Green Version]
- Beshai, J.F.; Grimm, R.A.; Nagueh, S.F.; Baker, J.H.; Beau, S.L.; Greenberg, S.M.; Pires, L.A.; Tchou, P.J. Cardiac-Resynchronization Therapy in Heart Failure with Narrow QRS Complexes. N. Engl. J. Med. 2007, 357, 2461–2471. [Google Scholar] [CrossRef]
- Coronel, R.; De Bakker, J.M.T.; Wilms-Schopman, F.J.G.; Opthof, T.; Linnenbank, A.C.; Belterman, C.N.; Janse, M.J. Monophasic action potentials and activation recovery intervals as measures of ventricular action potential duration: Experimental evidence to resolve some controversies. Heart Rhythm 2006, 3, 1043–1050. [Google Scholar] [CrossRef]
- Orini, M.; Srinivasan, N.; Graham, A.J.; Taggart, P.; Lambiase, P.D. Further Evidence on How to Measure Local Repolarization Time Using Intracardiac Unipolar Electrograms in the Intact Human Heart. Circ. Arrhythmia Electrophysiol. 2019, 12, e007733. [Google Scholar] [CrossRef] [PubMed]
- Jia, P.; Ramanathan, C.; Ghanem, R.N.; Ryu, K.; Varma, N.; Rudy, Y. Electrocardiographic imaging of cardiac resynchronization therapy in heart failure: Observation of variable electrophysiologic responses. Heart Rhythm 2006, 3, 296–310. [Google Scholar] [CrossRef] [PubMed] [Green Version]
- Ghosh, S.; Silva, J.N.A.; Canham, R.M.; Bowman, T.M.; Zhang, J.; Rhee, E.K.; Woodard, P.K.; Rudy, Y. Electrophysiological substrate and intraventricular LV dyssynchrony in non-ischemic heart failure patients undergoing cardiac resynchronization therapy. Heart Rhythm 2011, 8, 699. [Google Scholar] [CrossRef] [PubMed] [Green Version]
- Auricchio, A.; Fantoni, C.; Regoli, F.; Carbucicchio, C.; Goette, A.; Geller, C.; Kloss, M.; Klein, H. Characterization of left ventricular activation in patients with heart failure and left bundle-branch block. Circulation 2004, 109, 1133–1139. [Google Scholar] [CrossRef] [Green Version]
- Zhong, L.; Ghista, D.N.; Tan, R.S. Left ventricular wall stress compendium. Comput. Methods Biomech. Biomed. Eng. 2012, 15, 1015–1041. [Google Scholar] [CrossRef] [PubMed]
- Aiba, T.; Tomaselli, G. Electrical remodeling in dyssynchrony and resynchronization. J. Cardiovasc. Transl. Res. 2012, 5, 170–179. [Google Scholar] [CrossRef]
- Ghosh, S.; Rhee, E.K.; Avari, J.N.; Woodard, P.K.; Rudy, Y. Cardiac Memory in Patients With Wolff-Parkinson-White Syndrome: Noninvasive Imaging of Activation and Repolarization Before and After Catheter Ablation. Circulation 2008, 118, 907–915. [Google Scholar] [CrossRef] [Green Version]
- Marrus, S.B.; Andrews, C.M.; Cooper, D.H.; Faddis, M.N.; Rudy, Y. Repolarization Changes Underlying Long-Term Cardiac Memory Due to Right Ventricular Pacing: Noninvasive Mapping With Electrocardiographic Imaging. Circ. Arrhythmia Electrophysiol. 2012, 5, 773–781. [Google Scholar] [CrossRef] [Green Version]
- Cvijić, M.; Antolič, B.; Klemen, L.; Zupan, I. Repolarization heterogeneity in patients with cardiac resynchronization therapy and its relation to ventricular tachyarrhythmias. Heart Rhythm 2018, 15, 1784–1790. [Google Scholar] [CrossRef]
- Ploux, S.; Lumens, J.; Whinnett, Z.; Montaudon, M.; Strom, M.; Ramanathan, C.; Derval, N.; Zemmoura, A.; Denis, A.; De Guillebon, M. Noninvasive electrocardiographic mapping to improve patient selection for cardiac resynchronization therapy: Beyond QRS duration and left bundle-branch block morphology. J. Am. Coll. Cardiol. 2013, 61, 2435–2443. [Google Scholar] [CrossRef] [Green Version]
- Silva, J.N.; Ghosh, S.; Bowman, T.M.; Rhee, E.K.; Woodard, P.K.; Rudy, Y. Cardiac resynchronization therapy in pediatric congenital heart disease: Insights from noninvasive electrocardiographic imaging. Heart Rhythm 2009, 6, 1178–1185. [Google Scholar] [CrossRef] [Green Version]
- Adelstein, E.C.; Saba, S. Scar burden by myocardial perfusion imaging predicts echocardiographic response to cardiac resynchronization therapy in ischemic cardiomyopathy. Am. Heart J. 2007, 153, 105–112. [Google Scholar] [CrossRef]
- Hasin, T.; Davarashvili, I.; Michowitz, Y.; Farkash, R.; Presman, H.; Glikson, M.; Rav-Acha, M. Association of Guideline-Based Medical Therapy with Malignant Arrhythmias and Mortality among Heart Failure Patients Implanted with Cardioverter Defibrillator (ICD) or Cardiac Resynchronization-Defibrillator Device (CRTD). J. Clin. Med. 2021, 10, 1753. [Google Scholar] [CrossRef] [PubMed]
- Kahr, P.C.; Trenson, S.; Schindler, M.; Kuster, J.; Kaufmann, P.; Tonko, J.; Hofer, D.; Inderbitzin, D.T.; Breitenstein, A.; Saguner, A.M.; et al. Differential effect of cardiac resynchronization therapy in patients with diabetes mellitus: A long-term retrospective cohort study. ESC Heart Fail. 2020, 7, 2773–2783. [Google Scholar] [CrossRef]
- Kaya, E.; Senges, J.; Hochadel, M.; Eckardt, L.; Andresen, D.; Ince, H.; Spitzer, S.G.; Kleemann, T.; Maier, S.S.K.; Jung, W.; et al. Impact of diabetes on clinical outcome of patients with heart failure undergoing ICD and CRT procedures: Results from the German Device Registry. ESC Heart Fail. 2020, 7, 984–995. [Google Scholar] [CrossRef] [Green Version]
- Sardu, C.; Marfella, R.; Santulli, G. Impact of diabetes mellitus on the clinical response to cardiac resynchronization therapy in elderly people. J. Cardiovasc. Transl. Res. 2014, 7, 362–368. [Google Scholar] [CrossRef] [Green Version]
Figure 1.
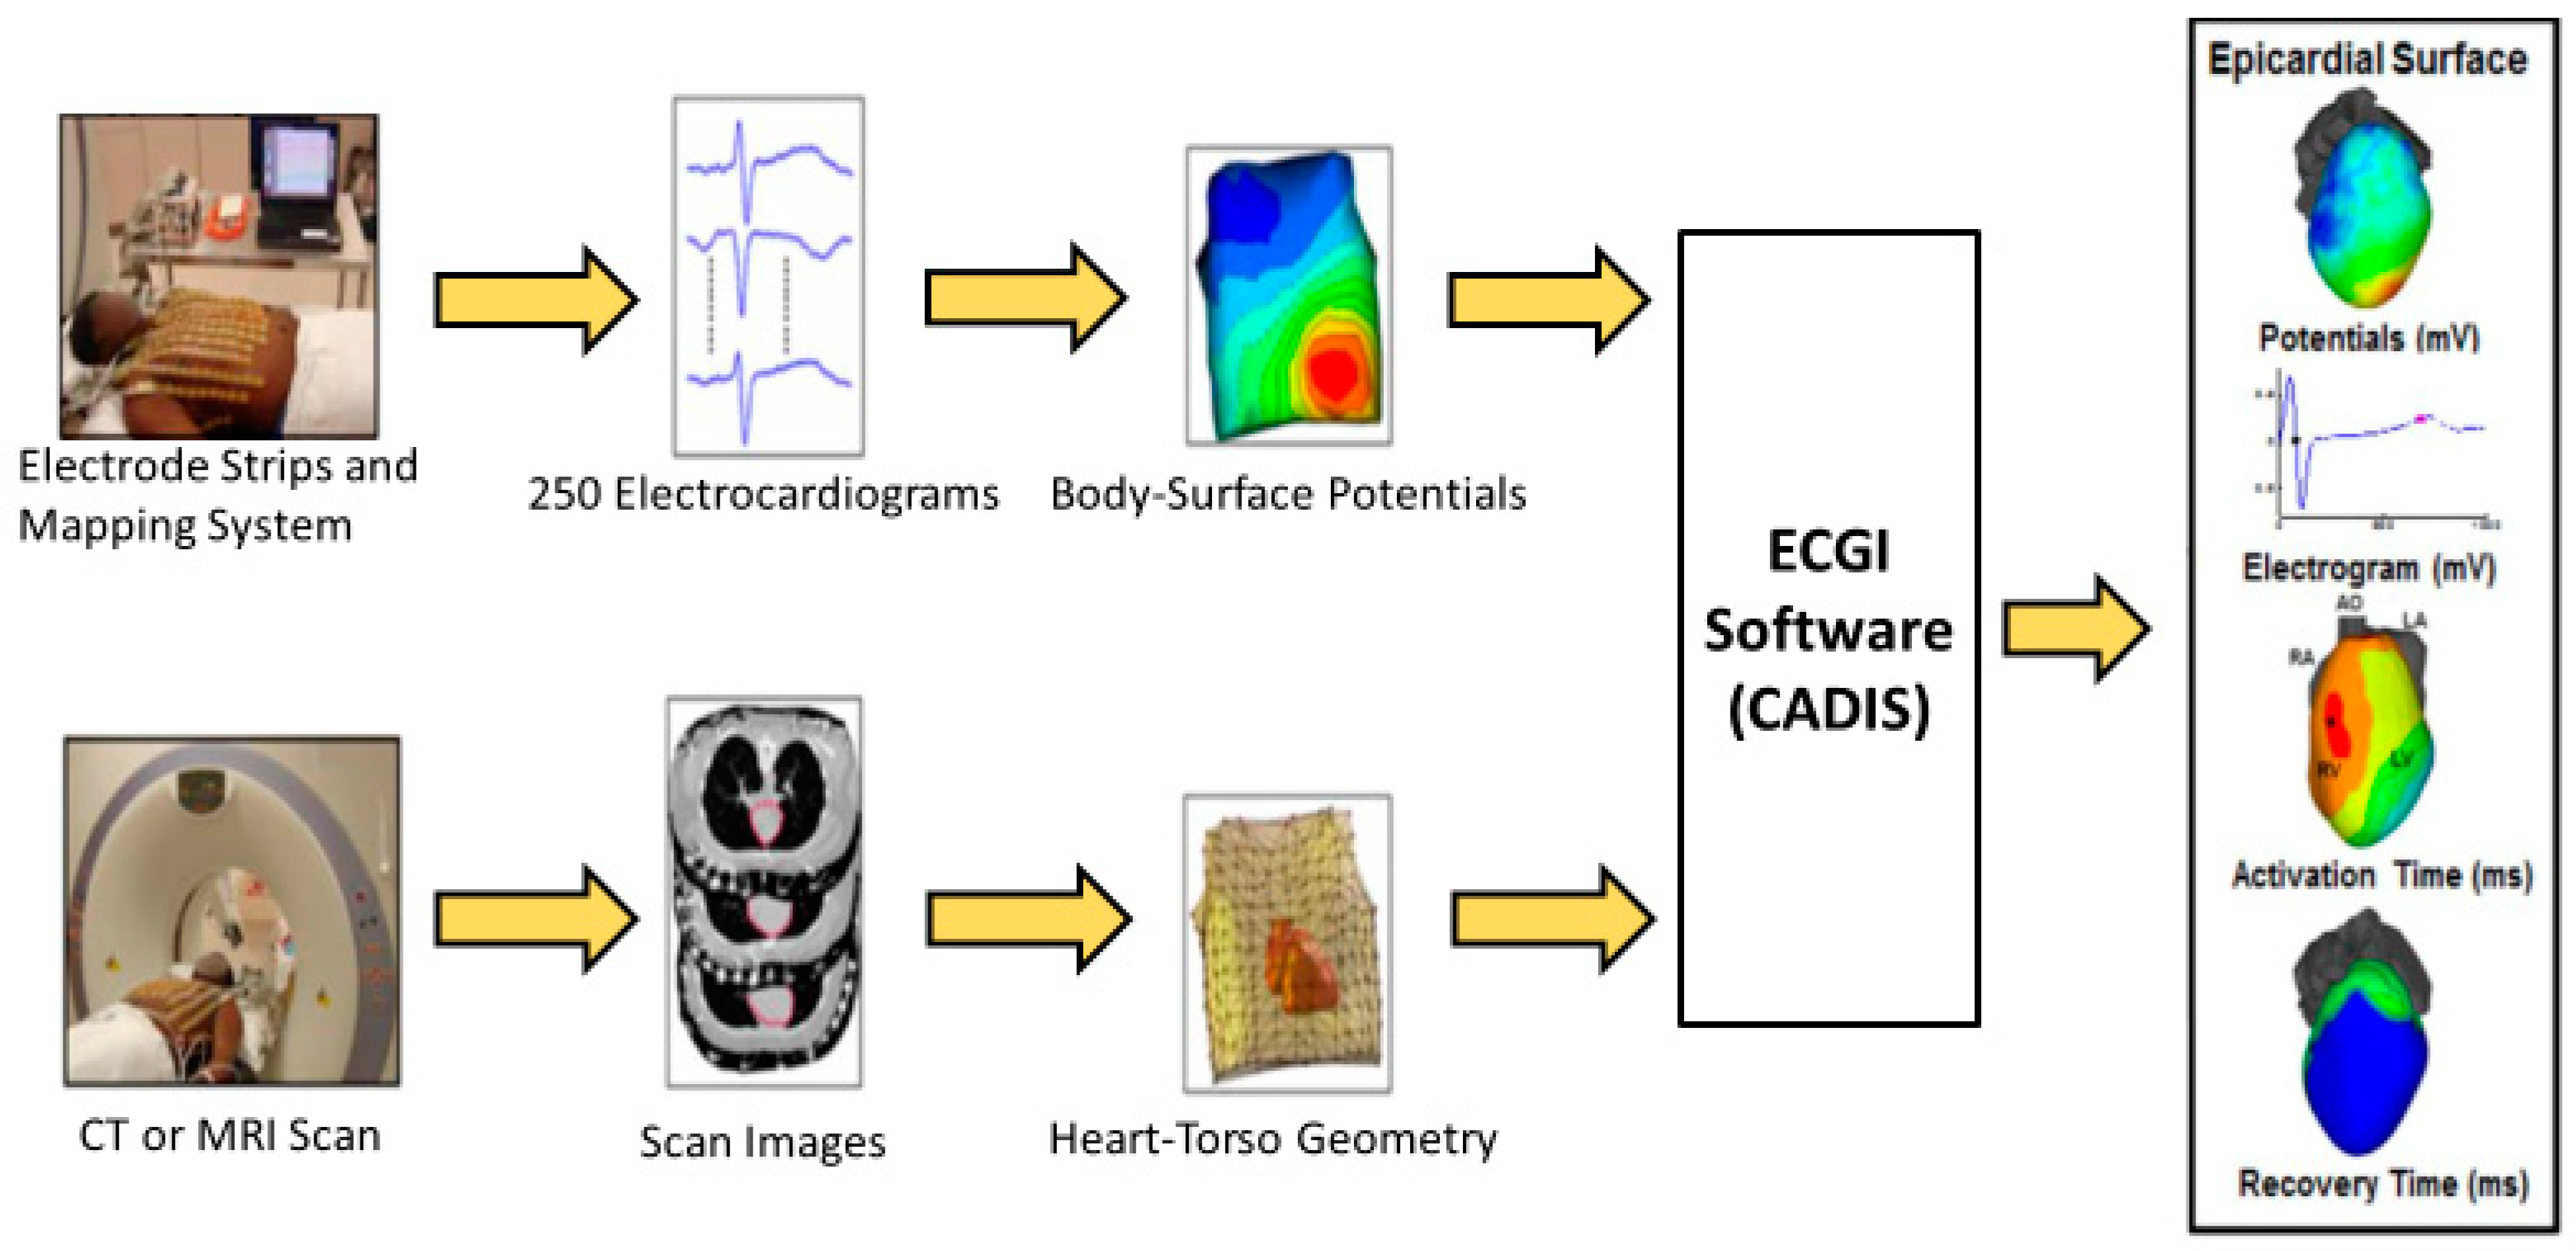
Schematic of the ECGI procedure. Body-surface potentials are recorded from the torso surface using a portable recording system (top). The heart-torso geometry is obtained using a computed tomography (CT) or magnetic resonance imaging (MRI) scan (bottom). The heart-torso geometry and torso potentials are combined and the inverse problem is solved to reconstruct unipolar epicardial electrograms. Electrograms are processed to determine local electrical parameters of interest (right frame).
Figure 1.
Schematic of the ECGI procedure. Body-surface potentials are recorded from the torso surface using a portable recording system (top). The heart-torso geometry is obtained using a computed tomography (CT) or magnetic resonance imaging (MRI) scan (bottom). The heart-torso geometry and torso potentials are combined and the inverse problem is solved to reconstruct unipolar epicardial electrograms. Electrograms are processed to determine local electrical parameters of interest (right frame).
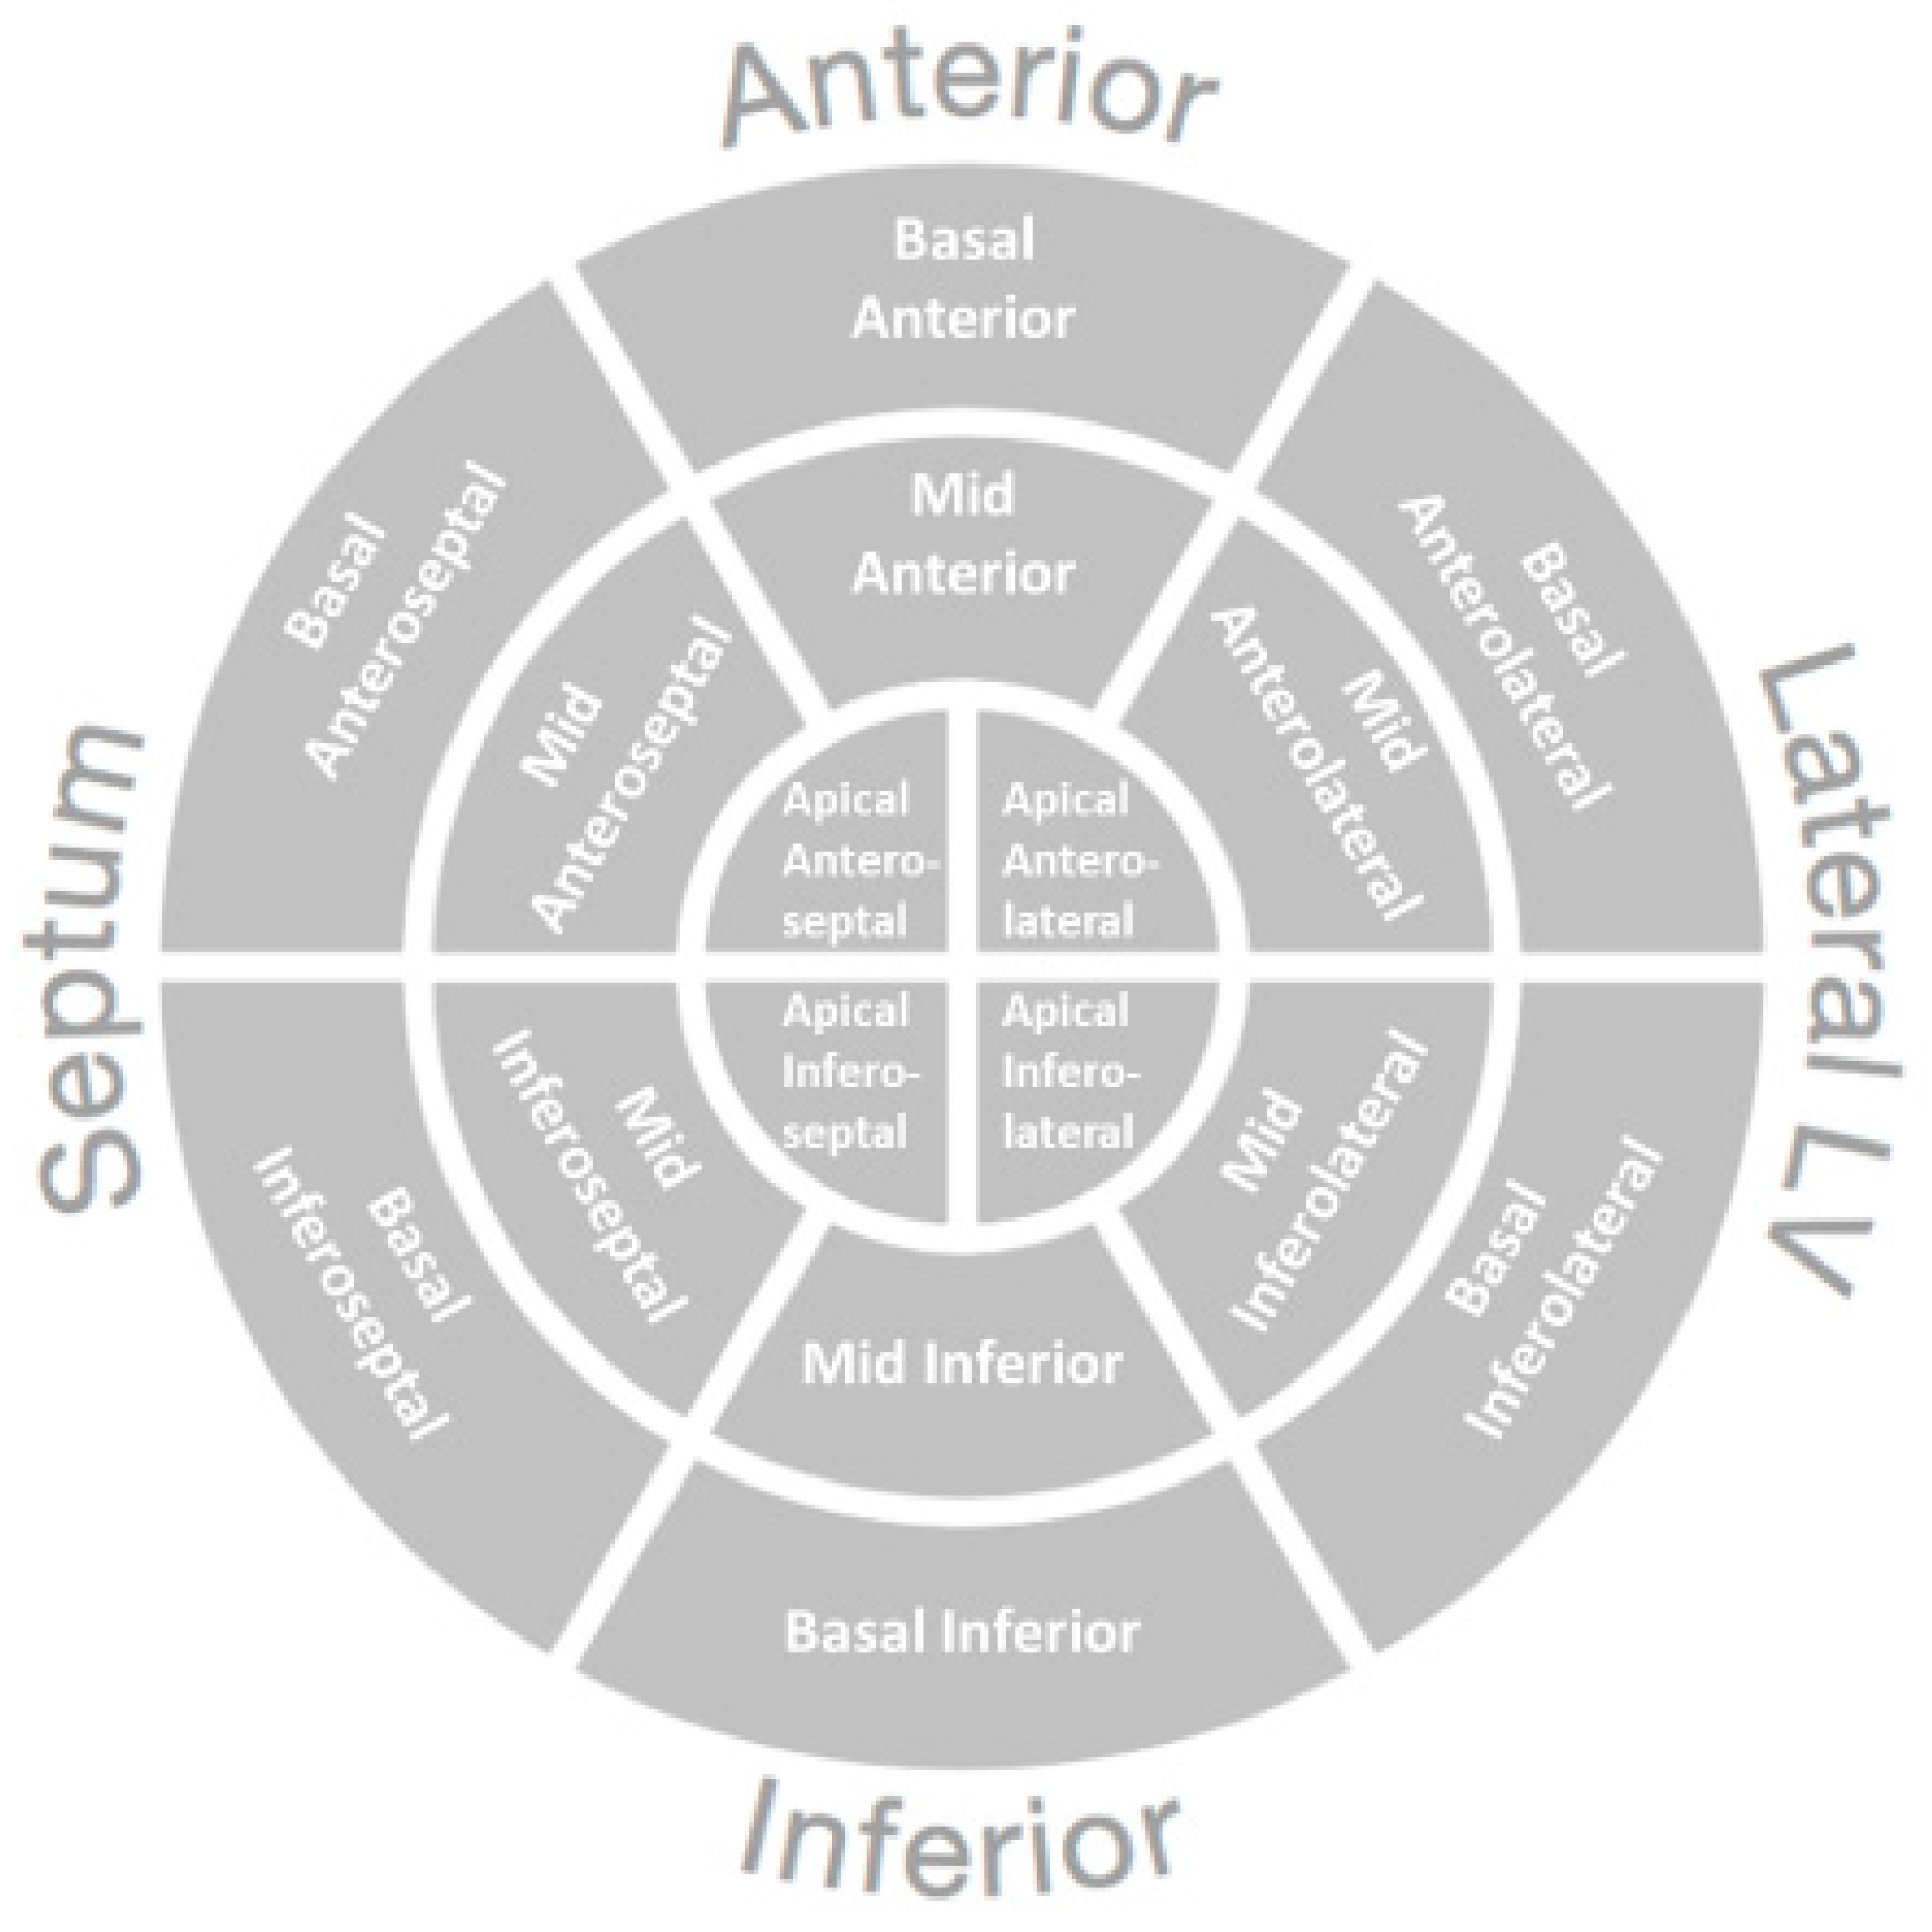
Figure 2.
The LV was segmented using a modified version of the American Heart Association 17-Segment Model. Apical segments were modified from the standard model because ECGI images the epicardium which does not include any septal segments. The apical LV segments from the ECGI maps were divided into Apical Anterolateral and Apical Inferolateral segments.
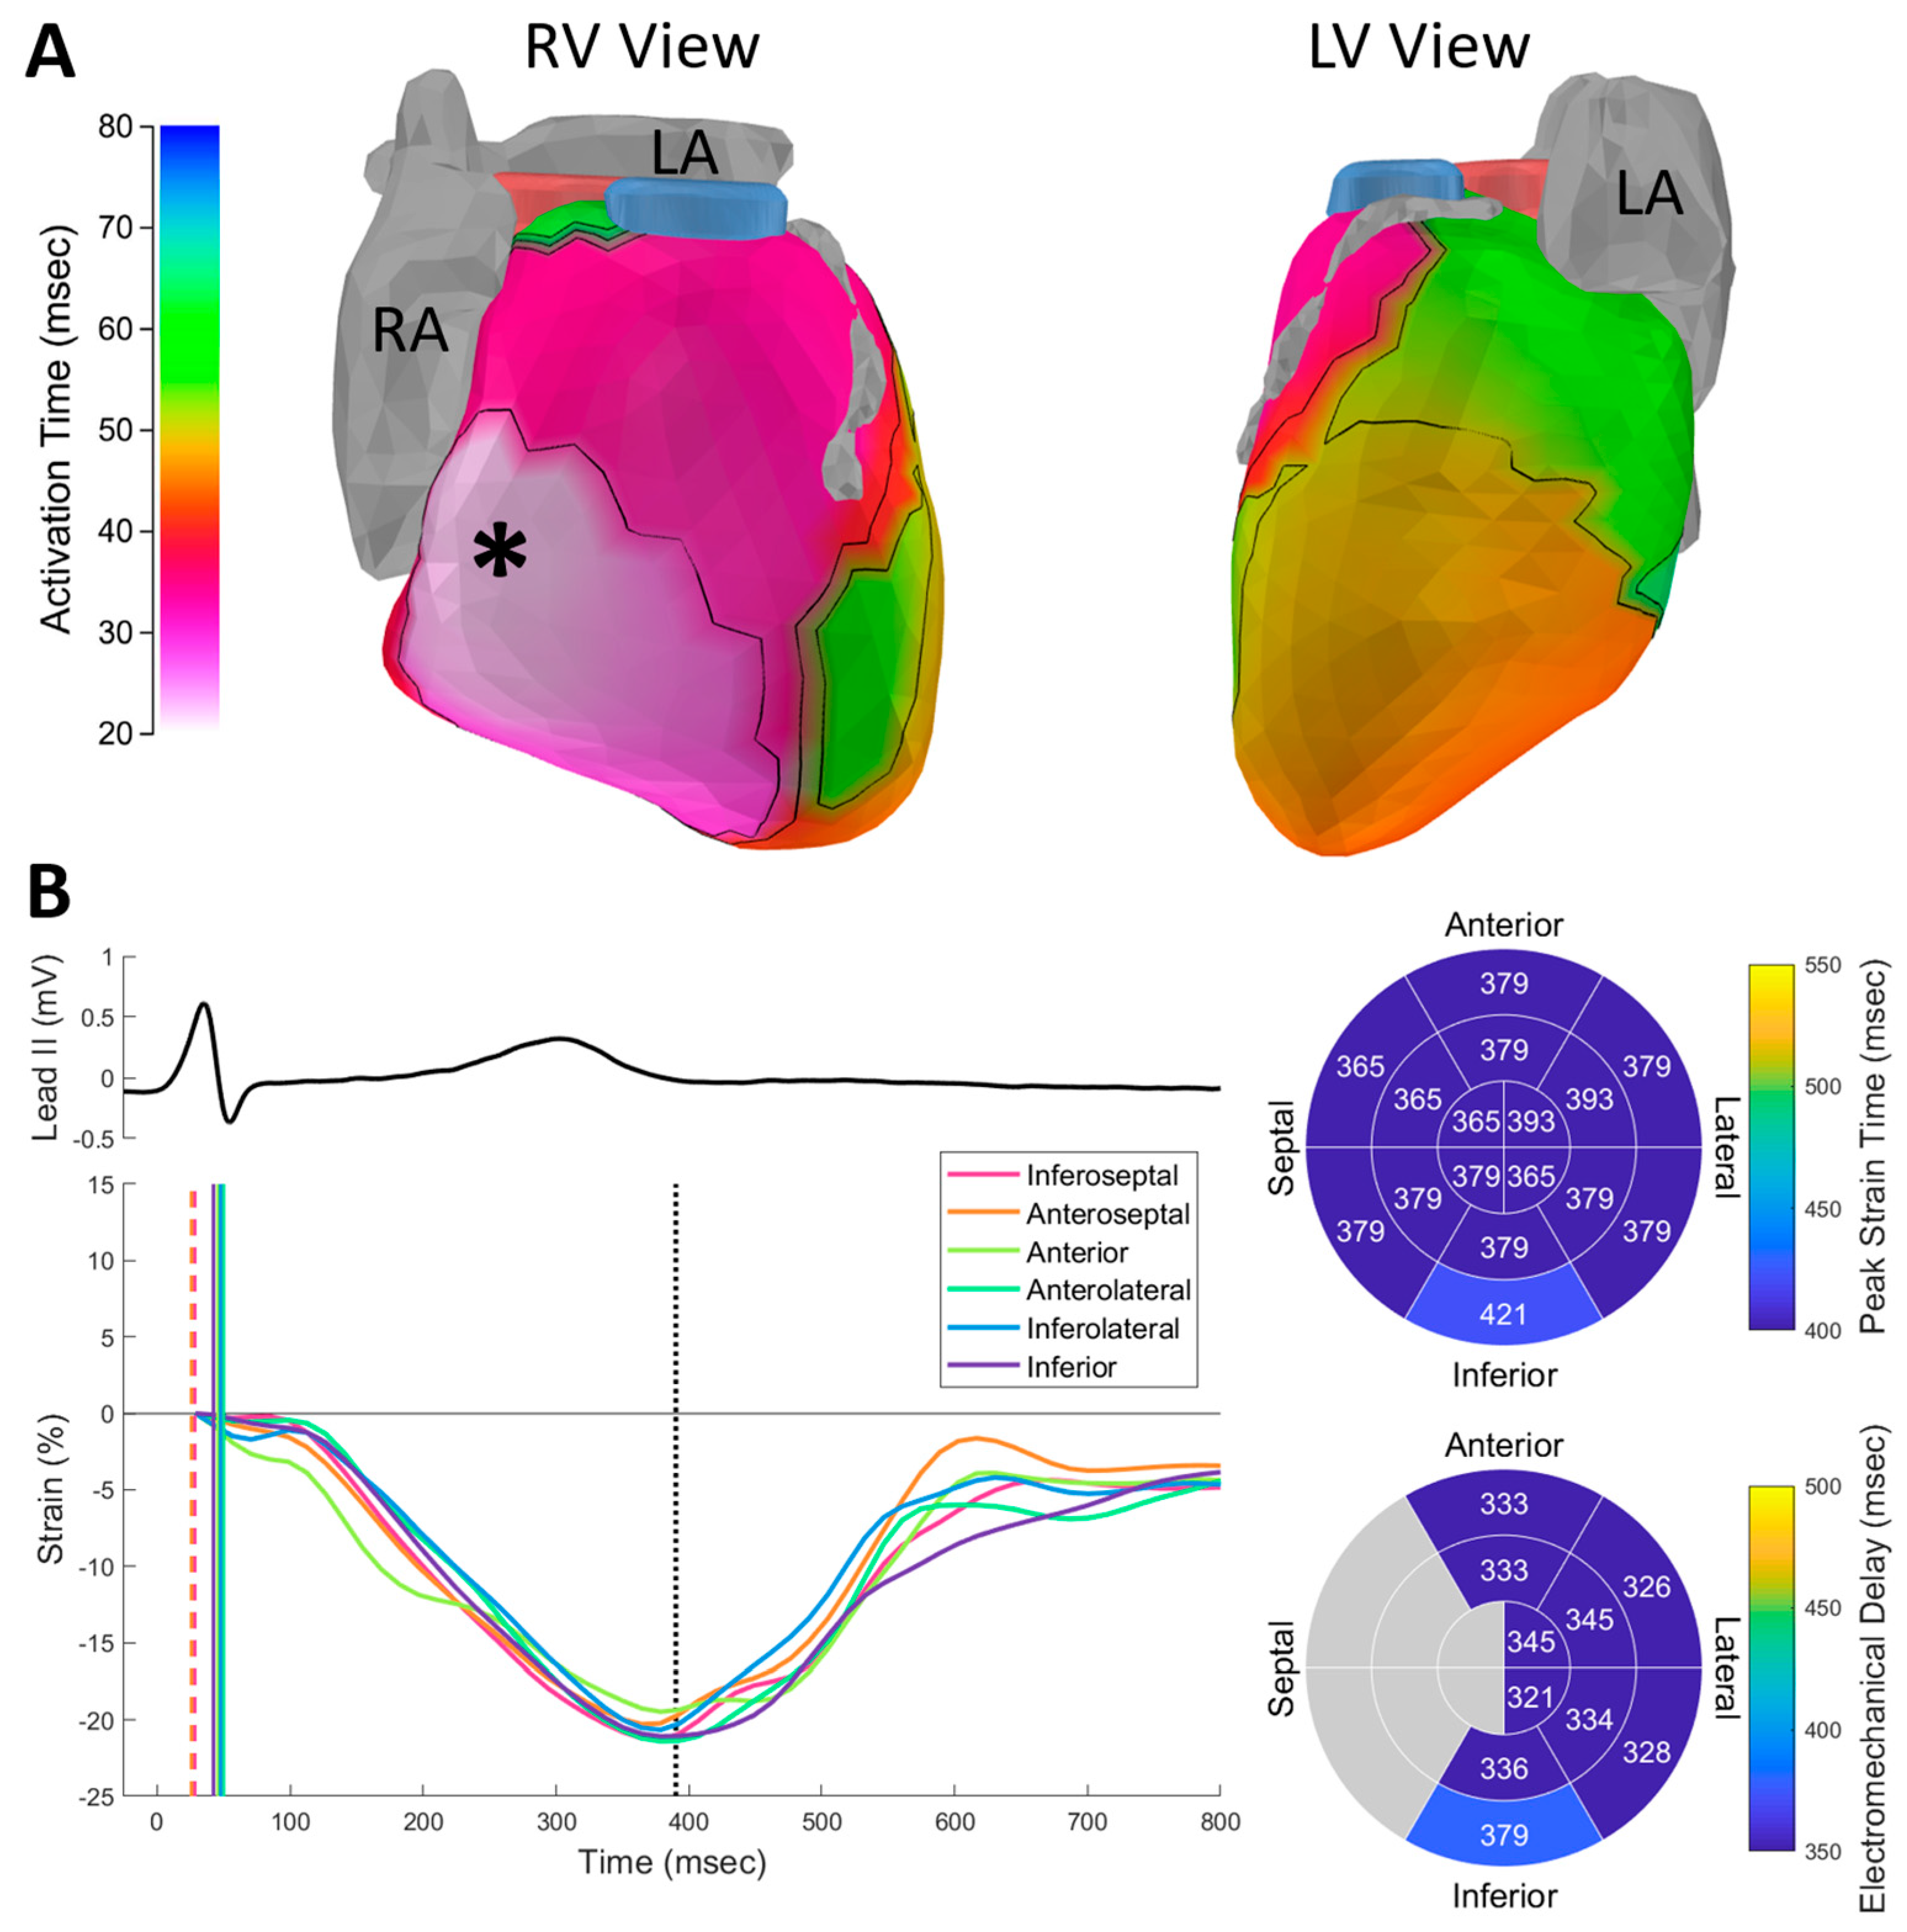
Figure 3.
Healthy adult activation and contraction. (A) Activation isochrones. Atria and left anterior descending coronary artery are shown in gray. Right ventricular outflow tract is shown in blue. Left ventricular outflow tract is shown in pink. Asterisk indicates epicardial breakthrough site. (B) Speckle tracking echocardiography (STE) strain curves plotted below the ECG. Electrical activation times are indicated in the plot with vertical lines (dashed lines indicate right ventricular activation as an approximation of septal activation time). Dotted line indicates aortic valve closure. The timing of peak strain within anatomical segments (top bullseye plot) was homogeneous within the LV. Regional electromechanical delay (EMD) values (bottom bullseye plot) were computed by subtracting the electrical activation time from the time of peak strain within regions. EMD values were not computed for septal regions (shown in gray) because ECGI does not image the septum. RV: right ventricle; LV: left ventricle; RA: right atrium; LA: left atrium.
![Hearts 02 00027 g003]()
Figure 4.
Activation isochrone maps in HF-CRT patients in native rhythm prior to CRT pacing (left) and at pacing onset (right). Pacing lead locations are indicated with black spheres. CRT pacing decreases LV activation delay absolute value (“Improvement”). Echocardiographic responders (top 2 rows) generally had high levels of dyssynchrony at baseline which was substantially improved by CRT pacing. Nonresponders often had less baseline dyssynchrony (row 3) or ineffective lead placement (row 4). RV: right ventricle; LV: left ventricle.
Figure 5.
Native rhythm strains in HF-CRT patients (top) were dyssynchronous and lower in amplitude than controls. Lateral regions often stretched prior to contraction (arrow) and reached peak strain after aortic valve closure (dotted line). Many regions reached peak strain later than controls (top bullseye). The mean EMD in HF patients was the same as in controls, but values within the LV showed greater dispersion (bottom bullseye). The acute onset of CRT (bottom) decreased pre-systolic lateral wall stretch. Peak strain timing values did not capture synchrony improvements effectively. Regional EMDs were different for each activation sequence (native rhythm vs. CRT pacing), indicating that EMD is not a purely intrinsic property.
Figure 6.
Left ventricular views of electrogram fractionation maps (first column), native rhythm activation (middle column), and CRT-paced activation (right column). Representative fractionated and un-fractionated electrograms are provided to the left of the maps. Numbers indicate electrogram locations. Pacing electrodes are indicated with black or white spheres. Pacing within regions of fractionation was less effective at activating nearby regions outside the scar (top row). Patients with large regions of fractionation could still be resynchronized effectively when paced outside of the fractionated region (bottom row). NICM: Nonischemic cardiomyopathy.
Figure 7.
Peak contraction magnitudes improved during the course of CRT. Values at each visit were determined from un-paced native rhythm beats, indicating persistent improvements in contraction as a result of chronic CRT pacing. Global longitudinal strain values (in percent) are indicated below each bullseye plot.
Figure 8.
Native rhythm epicardial activation-recovery interval (ARI) maps in heart failure (left) and after 6 months of CRT pacing (right). After 6 months of CRT pacing, ARI values were prolonged at and around the location of the left ventricle (LV) pacing lead.
Figure 8.
Native rhythm epicardial activation-recovery interval (ARI) maps in heart failure (left) and after 6 months of CRT pacing (right). After 6 months of CRT pacing, ARI values were prolonged at and around the location of the left ventricle (LV) pacing lead.
Table 1.
Study population baseline ejection fraction (EF), QRS duration (QRSd), heart failure etiology, and demographics. Baseline EF and QRSd values were measured during the study, prior to the onset of CRT pacing. ICM: Ischemic Cardiomyopathy. NICM: Nonischemic cardiomyopathy.
Table 1.
Study population baseline ejection fraction (EF), QRS duration (QRSd), heart failure etiology, and demographics. Baseline EF and QRSd values were measured during the study, prior to the onset of CRT pacing. ICM: Ischemic Cardiomyopathy. NICM: Nonischemic cardiomyopathy.
| ID | EF (%) | QRSd (msec) | Etiology | Age | Sex | Race | Ethnicity |
|---|
| EM1 | 27 | 154 | NICM | 53.0 | F | Caucasian | Not Hispanic |
| EM2 | 25 | 167 | NICM | 64.0 | F | Caucasian | Not Hispanic |
| EM3 | 23 | 180 | NICM | 71.9 | M | Caucasian | Not Hispanic |
| EM4 | - | 123 | NICM | 63.3 | M | Caucasian | Not Hispanic |
| EM5 | 29 | 199 | NICM | 54.4 | M | Caucasian | Not Hispanic |
| EM6 | 27 | 169 | NICM | 73.0 | F | Caucasian | Not Hispanic |
| EM7 | 20 | 154 | ICM | 66.3 | M | Caucasian | Not Hispanic |
| EM8 | 25 | 108 | NICM | 59.8 | M | Caucasian | Not Hispanic |
| EM9 | 25 | 173 | NICM | 69.5 | F | Caucasian | Not Hispanic |
| EM10 | 24 | 149 | ICM | 62.4 | M | Caucasian | Not Hispanic |
| EM11 | 24 | 186 | NICM | 69.3 | F | Caucasian | Not Hispanic |
| EM12 | 30 | 136 | ICM | 67.5 | M | Caucasian | Not Hispanic |
| EM13 | 21 | 156 | ICM | 60.1 | M | African American | Not Hispanic |
| EM14 | 29 | 184 | NICM | 54.5 | F | Caucasian | Not Hispanic |
| EM15 | 20 | 162 | ICM | 77.6 | M | Caucasian | Not Hispanic |
| EM16 | 23 | 134 | NICM | 64.0 | F | Caucasian | Not Hispanic |
| EM17 | 24 | 200 | NICM | 52.5 | M | Caucasian | Not Hispanic |
| EM18 | 24 | 184 | ICM | 78.7 | F | Caucasian | Not Hispanic |
| EM19 | 24 | 204 | NICM * | 74.7 | F | Caucasian | Not Hispanic |
| EM20 | 26 | 154 | NICM | 34.7 | M | Caucasian | Not Hispanic |
| EM21 | 21 | 153 | ICM | 77.5 | M | Caucasian | Not Hispanic |
| EM22 | 20 | 147 | ICM | 81.1 | M | Caucasian | Not Hispanic |
| EM23 | 22 | 154 | ICM | 55.3 | M | Caucasian | Not Hispanic |
| EM24 | 17 | 149 | NICM | 74.1 | M | Caucasian | Not Hispanic |
| EM25 | 31 | 145 | NICM | 51.3 | F | Caucasian | Not Hispanic |
| EM26 | 24 | 149 | ICM | 72.4 | M | Caucasian | Not Hispanic |
| EM27 | 17 | 143 | NICM | 40.5 | F | African American | Not Hispanic |
| EM28 | 23 | 142 | NICM | 62.4 | M | Caucasian | Not Hispanic |
| EM29 | 25 | 162 | NICM | 61.4 | M | African American | Not Hispanic |
| EM30 | 17 | 178 | NICM | 64.1 | M | African American | Not Hispanic |
| Publisher’s Note: MDPI stays neutral with regard to jurisdictional claims in published maps and institutional affiliations. |
© 2021 by the authors. Licensee MDPI, Basel, Switzerland. This article is an open access article distributed under the terms and conditions of the Creative Commons Attribution (CC BY) license (https://creativecommons.org/licenses/by/4.0/).


