Abstract
Rechargeable sodium-ion batteries (SIBs) have attracted considerable attention owing to the natural abundance and accessibility of sodium. Maricite NaMnPO4, a phosphate-based cathode material with high theoretical capacity, suffers from blocked sodium-ion diffusion channels. In this study, atomistic simulations using pair potentials and density functional theory (DFT) are employed to investigate intrinsic defect mechanisms, sodium-ion migration pathways, and the role of dopant incorporation at Na, Mn, and P sites in generating Na vacancies and interstitials. Among the intrinsic defects, the Na–Mn anti-site cluster emerges as the most favorable, exhibiting a very low formation energy of 0.12 eV, while the Na Frenkel pair (1.93 eV) is the next most stable defect, indicating that sodium diffusion is primarily facilitated by vacancy formation. Nevertheless, sodium-ion mobility in NaMnPO4 remains limited, as reflected by the relatively high migration activation energy of 1.28 eV. Among the isovalent substitutions, K is predicted to be the most favorable dopant at the Na site, whereas Ca and Cu are the most favorable at the Mn site. Thallium is identified as a promising dopant at the Mn site for generating Na vacancies that facilitate Na-ion migration, while Ge substitution at the P site is predicted to enhance the sodium content in the material.
1. Introduction
The global energy transition hinges on two fronts: replacing fossil fuel-based electricity with renewable generation and converting ground transportation from internal combustion engines (ICEs) to electric vehicles (EVs). The intermittency of renewable sources demands efficient, durable, and sustainable energy storage, yet existing technologies remain insufficient.
Lithium-ion batteries (LIBs) have enabled high energy density, rechargeable systems, with lithiated transition metal oxide cathodes (e.g., LiCoO2 and LiFePO4) serving as the principal lithium source [1,2,3,4,5,6,7]. The limited and uneven global distribution of lithium necessitates the development of alternative chemistries for next-generation, high-capacity energy storage devices, particularly for hybrid electric vehicles.
Owing to its natural abundance, sodium has attracted increasing attention, and rechargeable SIBs are emerging as promising candidates for large-scale energy storage [8,9,10,11,12,13,14,15]. Among the many factors influencing SIB performance, the design of high–energy-density, low-cost cathode materials is paramount. Promising cathode materials for SIBs include olivine NaMPO4 (M = Fe, Mn, Co, Ni) [16,17,18], NASICON (Na super ionic conductor) Na3V2(PO4)3 [19,20,21], Na2MSiO4 (M = Fe, Mn and Co) [22,23,24] and layered NaxMO2 (M = Fe, Mn, Co, Ni) [25,26,27,28]. The NASICON family, with its three-dimensional framework and wide interstitial channels, has been extensively investigated for sodium-ion battery cathodes [29,30,31,32].
Interest in olivine NaMPO4 is largely motivated by the commercial success of LiFePO4 in lithium-ion batteries. NaMnPO4 crystallizes in two polymorphic forms: maricite NaMnPO4 [33] and olivine NaMnPO4 [34]. The key structural difference lies in cation site occupancy: in the maricite phase, Na+ ions occupy 4c Wyckoff sites and transition metals occupy 4a sites, whereas in the olivine phase this arrangement is reversed [33,35]. Electrochemically, the maricite form is largely inactive, while the olivine form is active but thermodynamically unstable and challenging to synthesize directly. The maricite structure, by contrast, is more stable but exhibits the inverted cation distribution relative to olivine [36]. Experimental studies on NaMnPO4 synthesis have been reported. Early work by Koleva et al. [37] demonstrated the preparation of defect-free olivine and maricite-NaMnPO4, while Venkatachalam et al. [38] improved the electrochemical performance of NaMnPO4 via a polyol synthesis route, achieving a discharge capacity of 102.67 mAhg−1. Despite these advances, significant scope remains for enhancing the electrochemical properties of NaMnPO4-based materials. The robust crystal framework affords excellent thermal stability and strong resistance to structural degradation during cycling. Furthermore, Mn is favored as a transition metal in polyanion frameworks due to its environmental benignity, and the theoretical capacity and voltage of NaMnPO4 make it a promising candidate for high energy density applications [33,35].
While extensive computational research has been carried out on olivine-NaMnPO4, relatively few studies have addressed maricite NaMnPO4. In a previous DFT simulation study [36], the electrochemical, electronic, and diffusion properties of maricite NaMnPO4 cathodes for Na-ion batteries, as well as the effects of lattice strain on these properties, have been investigated. However, the influence of intrinsic defects on electrochemical behavior and possible doping strategies has not been explored so far. This work explores maricite NaMnPO4 as a promising cathode material for sodium-ion batteries, with particular emphasis on its defect chemistry. Strategies to enhance electronic conductivity and ion diffusion, including elemental doping and composite formation, will be explored, as has been previously demonstrated in Li- and post-Li-ion battery materials [39,40,41,42,43,44,45,46,47,48]. By addressing these challenges, the study aims to contribute to the development of more efficient and sustainable sodium-ion batteries.
2. Computational Methods
In this study, classical simulations were carried out using the General Utility Lattice Program (GULP) [49] to evaluate the intrinsic defect processes and Na+ ion migration. The total lattice energy was calculated by considering both long-range Coulombic interactions and short-range forces, including Pauli repulsion and van der Waals attraction. Short-range ionic interactions were modelled using Buckingham potentials (see Table 1) [50,51,52,53]. Structural optimization was carried out using the BFGS (Broyden-Fletcher-Goldfarb-Shanno) algorithm [54] to relax the NaMnPO4 crystal structure to its lowest energy configuration. For modelling point defects and ion migration, the Mott-Littleton [55] method was applied. The migration of Na+ ions was simulated by defining two adjacent Na vacancy sites as the starting and final points of the ionic path, with seven interstitial sites forming the migration path computed, using the midpoint between two neighboring Na vacancy sites as a reference to reduce systematic errors. Finally, the activation energy for Na+ ion migration was determined by calculating the energy difference between the highest local energy at the saddle point and the lowest energy required for Na vacancy formation, providing insights into the energy barrier for the migration process.

Table 1.
Buckingham potential parameters [50,51,52,53] used in the classical simulations of two-body problems [Φij (rij) = Aij exp (−rij/ρij) − Cij/rij6], where A, ρ, and C are parameters that were selected carefully to reproduce the experimental data. The values of Y and K represent the shell charges and spring constants, respectively.
Density functional theory (DFT) calculations were performed using the Vienna Ab initio Simulation Package (VASP) [56]. The exchange–correlation functional was treated within the generalized gradient approximation (GGA), parameterized by Perdew, Burke, and Ernzerhof (PBE) [57]. A plane-wave basis set with a cutoff energy of 600 eV and standard projector augmented-wave (PAW) potentials [58], as implemented in VASP, was employed. Defect configurations were modeled using a 2 × 1 × 2 supercell consisting of 112 atoms (Na: 16, Mn: 16, P: 16, and O: 64). A 4 × 4 × 4 Monkhorst–Pack k-point mesh was used in all calculations [59]. Structural optimizations of the doped systems were carried out using the conjugate gradient algorithm [60], with atomic forces evaluated via the Hellmann–Feynman theorem, including Pulay corrections. All optimized structures converged to atomic forces below 0.001 eV/Å. To further examine the electronic effects of doping, Bader charge analysis was conducted to evaluate the charge distribution on the dopant atoms [61]. Density of states (DOS) plots were generated using the Xmgrace plotting tool. To obtain the accurate electronic structure, we employed an orbital-dependent Coulomb potential (Hubbard U) together with the exchange parameter J for Mn. The localized 3d states of Mn were treated using U = 5.00 eV and J = 0.00 eV, in accordance with values reported in previous DFT simulations [62]. The results of DFT + U calculations are highly dependent on the choice of the Hubbard U and Hund’s J parameters, as these values significantly affect key material properties such as band gaps, magnetic moments, and structural features. Experimental observations are often used to calibrate and validate these parameters by comparing calculated properties (e.g., photoemission spectra or magnetic anisotropy) with experimental measurements. The optimal selection of U and J also depends on computational factors such as the basis set and exchange–correlation functional, and different physical properties may require distinct parameter values for best agreement with experiment. In the present work, DFT simulations based on the GGA-PBE approximation employed a U value of 5.0 eV, which has been optimized for the Mn-3d states [62].
3. Results
3.1. Crystal Structure of NaMnPO4
Maricite NaMnPO4 crystallizes in an orthorhombic structure with space group Pmnb. The crystal structure is illustrated in Figure 1. Its lattice parameters (a = 6.892 Å, b = 9.079 Å, c = 5.108 Å, α = β = γ = 90°) were reported by Subhendhu Jana et al. [35] through Rietveld refinement of powder X-ray diffraction data. The unit cell contains 28 atoms in total (Na: 4, Mn: 4, P: 4 and O: 16), corresponding to four formula units (Z = 4) of NaMnPO4. The atomic arrangement includes Na and P atoms occupying 4c sites, Mn atoms positioned at the 4a inversion centers, and oxygen atoms distributed over 4c and 8d Wyckoff positions. In this structure, Mn, Na, and P atoms are coordinated by six, eight, and four oxygen atoms, respectively. Each MnO6 octahedron is linked to six PO43− tetrahedra through shared vertices, while no connectivity occurs between adjacent PO43− tetrahedra within the maricite framework (see Figure 1a). To assess the validity of the interatomic potentials and pseudopotentials used in this study, the bulk maricite NaMnPO4 structure was optimized under constant-pressure conditions.
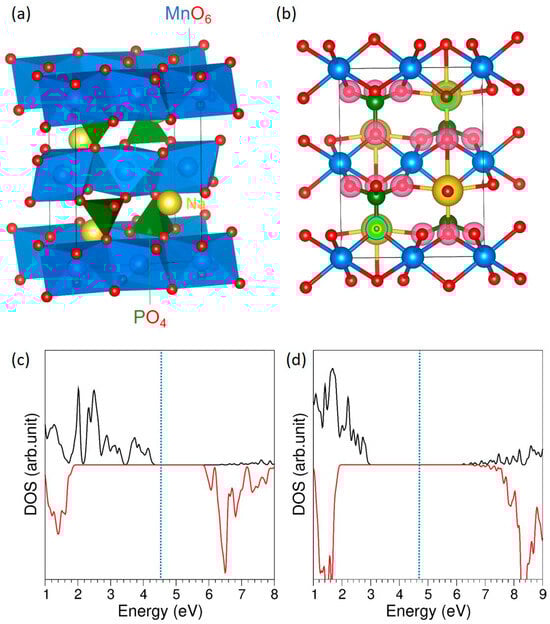
Figure 1.
(a) Crystal structure of NaMnPO4, (b) charge density plot highlighting electron accumulation on oxygen atoms, and total DOS calculated using (c) GGA and (d) GGA + U approaches. The vertical blue dotted line indicates the Fermi energy level.
The optimised lattice parameters of bulk maricite NaMnPO4 obtained from both classical and DFT calculations are summarized in Table 2, together with the corresponding experimental values. The deviations between calculated and experimental parameters were found to be less than 2.5% in all cases, indicating good agreement. Specifically, the b, and c lattice constants showed minor variations, with the maximum error of 1.28% observed in the b parameter for the DFT calculation. The unit cell volume was slightly overestimated in both approaches, with errors of 2.38% and 2.27% for classical and DFT calculations, respectively. Overall, the close correspondence with experimental data confirms the accuracy and reliability of the chosen interatomic potentials and pseudopotentials for defect modelling in maricite NaMnPO4.
Table 2.
Calculated and experimental lattice parameters of NaMnPO4.
Figure 1b presents the charge density distribution, where strong electron accumulation is observed around the oxygen atoms, confirming their highly electronegative character and indicating predominantly ionic bonding between Na–O and P–O, with some degree of covalent interaction in Mn–O bonds. This is further supported by the Bader charge analysis, which reveals effective charges of +1.00 on Na, +1.62 on Mn, +5.00 on P, and 1.90 on O, consistent with the expected oxidation states and confirming the strong charge localization on oxygen. The incorporation of the Hubbard U parameter significantly altered the electronic structure by widening the band gap from 1.40 eV to 3.20 eV (see Figure 1c,d). This increase arises from the enhanced localization of the Mn 3d states, which reduces their hybridisation with the surrounding orbitals and effectively pushes the conduction and valence band edges further apart. Such behavior is consistent with previous DFT + U studies [36], highlighting the critical role of on-site Coulomb interactions in accurately describing the electronic properties of Mn-containing systems. Its magnetic character is evidenced by the asymmetry of the DOS plot with respect to the x-axis, as also reported in earlier work [36].
3.2. Intrinsic Defect Properties
Intrinsic defects play a crucial role in governing ion transport within materials. In this section, we focus on point defects, namely vacancies, interstitials, and anti-site defects. These individual defects were systematically combined to evaluate the formation energies of Frenkel, Schottky, and anti-site defect mechanisms. In the case of anti-site defects, the energy was calculated by exchanging cations, where Na occupies a Mn site and Mn occupies a Na site. To describe these intrinsic defect processes, Kröger–Vink notation [63] was employed, and the corresponding reaction equations were derived to represent the various defect mechanisms in this material.
Table 3 presents the calculated defect formation energies for NaMnPO4. Anti-site defects exhibit particularly low formation energies. The isolated Na–Mn anti-site defect requires only 0.53 eV per defect (Equation (9)), while the clustered configuration is even more favorable at 0.12 eV per defect (Equation (10)). This suggests that Na–Mn site exchanges are the most thermodynamically favorable defect processes in NaMnPO4. They may play a dominant role in both defect chemistry and ion migration. The binding energy for forming a Na–Mn anti-site defect cluster from isolated defects is −0.41 eV, determined from the difference between 0.12 eV and 0.53 eV. The formation of anti-site defects is influenced by several factors, including the synthesis method, processing temperature, cooling rate, and chemical environment, all of which can significantly affect cation ordering and defect concentrations in the material. In olivine-NaMnPO4, hydrothermal samples with higher concentrations of anti-site defects tend to produce more impurity phases under identical thermal treatments [64]. Precursor-based methods have been developed for the low-temperature synthesis of two structural modifications of NaMnPO4. These approaches enable the formation of defect-free NaMnPO4 in the 200–400 °C range. Importantly, both olivine- and maricite-type NaMnPO4 show no signs of anti-site mixing or Na/Mn deficiencies [37]. Although the Na Frenkel defect (1.93 eV/defect, Equation (1)) is the second most favorable defect type, its formation energy is significantly higher than that reported for other phosphate materials, such as Na3V2(PO4)3 (0.46 eV) [65] and NaZr2(PO4)3 (0.70 eV) [66]. This emphasizes the comparatively sluggish nature of Na-ion diffusion in NaMnPO4. In comparison, the Mn Frenkel (2.97 eV/defect, Equation (2)) and O Frenkel (4.07 eV/defect, Equation (4)) are less favorable, while the P Frenkel (15.98 eV/defect, Equation (3)) is highly endothermic and therefore unlikely under normal conditions. For Schottky-type defects, the Na2O Schottky defect (2.65 eV/defect, Equation (6)) is the most energetically favorable, suggesting possible Na2O loss at elevated temperatures, whereas the complete Schottky defect (4.85 eV/defect, Equation (5)) and the P2O5 Schottky defect (7.48 eV/defect, Equation (8)) are less favorable.
Table 3.
Defect formation energies calculated for different reaction processes.
We have performed additional defect calculations. To minimise charge–charge interactions between adjacent cells, both point defects were introduced within the same supercell. The comparison between classical and DFT simulations shows a consistent trend in defect formation energies. For Na–Frenkel defects, the values are 1.93 eV (classical) and 2.12 eV (DFT), while Mn–Frenkel defects yield 2.97 eV and 3.08 eV, respectively. O–Frenkel defects are slightly higher, with 4.07 eV from classical and 4.82 eV from DFT. In the case of anti-site defects, Na–Mn isolated defects show low energies of 0.53 eV (classical) and 0.74 eV (DFT), which further decrease for the clustered configuration to 0.12 eV and 0.26 eV. The highest energies are observed for P–Frenkel defects, with 15.98 eV (classical) and 16.52 eV (DFT). Overall, the close correspondence between classical and DFT values validates the reliability of the classical approach for modeling defect energetics.
3.3. Na-Ion Diffusion
Determining the activation energy of ion migration pathways is crucial for understanding ionic conduction mechanisms. While experimental determination of ion migration pathways is challenging, computational approaches provide a reliable means to predict both the pathways and their corresponding activation energies. Using atomistic simulation techniques, two promising Na-ion migration hops were identified, labelled A and B (see Figure 2a), with Na–Na separations of 4.68 Å and 4.46 Å, respectively. Activation energies of hops A and B were calculated to be 1.28 eV (see Figure 2b) and 2.63 eV (see Figure 2c) respectively. The connection of hops A gives rise to a long-range zig-zag migration pathway in the ab plane with an activation energy of 1.28 eV. This value is considerably higher than those reported for other Na-based cathode materials with phosphate units, such as Na3V2(PO4)3 (0.70 eV), NaZr2(PO4)3 (0.26 eV), olivine-NaFePO4 (0.29 eV), and NaFeP2O7 (0.43 eV) [64,65,66,67]. A previous DFT study reported that maricite-NaMnPO4 exhibits the lowest activation energy of 1.21 eV, which is consistent with the value obtained in this work [36]. In contrast, Na+ ions in olivine-NaMnPO4 migrate more rapidly, with a much lower activation energy of 0.32 eV [36]. In the second hop B, Na+ migration occurs with a high activation energy of 2.63 eV. Since both hops are associated with large energy barriers, enhancing Na-ion transport will require strategies such as elemental doping [66], particle size reduction [68,69], carbon coating [70], and composite design [71,72,73] to enable practical applications.
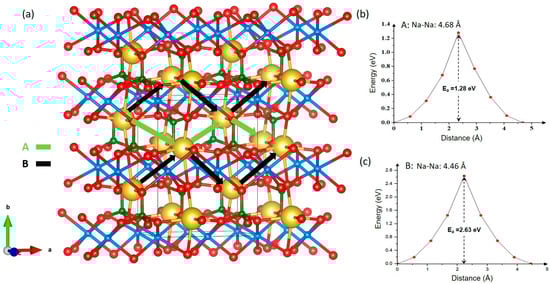
Figure 2.
(a) Na-ion migration hopping and activation energies of (b) hop A and (c) hop B.
3.4. Solution of Dopants
The introduction of dopants or impurities can strongly influence the properties of materials, including conductivity, optical response, and structural stability. In this study, DFT simulations were employed to calculate dopant solution energies, considering charge-compensation mechanisms such as interstitials, vacancies, and lattice energies. A range of potential dopants (both isovalent and aliovalent) was investigated to identify promising candidates for future experimental validation. Isovalent dopants, which possess the same valence state as the host cation (e.g., monovalent substitution at the Na site or divalent substitution at the Mn site), do not require charge compensation since charge neutrality is preserved. In contrast, aliovalent dopants have different valence states compared to the host ions, and their incorporation can introduce additional charge carriers or modify the conductivity of materials. For instance, tetravalent substitution at the P site necessitates charge compensation via the formation of Na interstitials.
3.4.1. Monovalent Dopants
Monovalent dopants (M = Li, K, and Rb) were first considered for substitution at the Na site. The solution energies were calculated (Table 4) using the corresponding reaction equation, expressed in Kröger–Vink notation.
Table 4.
M-O bond distances, Bader charges on the dopants, magnetic moments, and changes in the volume of the monovalent doped configurations.
Figure 3 summarizes the effect of monovalent substitution at the Na site. In Figure 3a, the solution energies of Li, K, and Rb are plotted against their ionic radii, revealing a clear minimum for K. This lowest solution energy indicates that K incorporates most readily into the lattice, whereas Li (undersized) and Rb (oversized) exhibit higher energies, consistent with size mismatch and the associated elastic/structural penalty. While our default dopant reservoirs are the corresponding oxides (Li2O, K2O, Rb2O), realistic conditions are captured by enforcing host-stability inequalities and considering competing dopant-bearing phases (e.g., alkali phosphates/halides/peroxides) and Na-rich/Na-poor limits; these choices may shift absolute values but do not alter the qualitative conclusion that K incorporates most readily. Figure 3b shows the charge density plot for the K-doped system, where the redistribution of electronic density around the dopant and neighboring atoms is clearly visible. Figure 3c shows the total DOS, confirming that K-doping does not introduce states at the Fermi level and preserves the insulating nature of the host material. Figure 3d illustrates the atomic DOS of K, where the p-states of K are localized deep in the valence region, far from the Fermi level, further confirming its limited electronic activity.
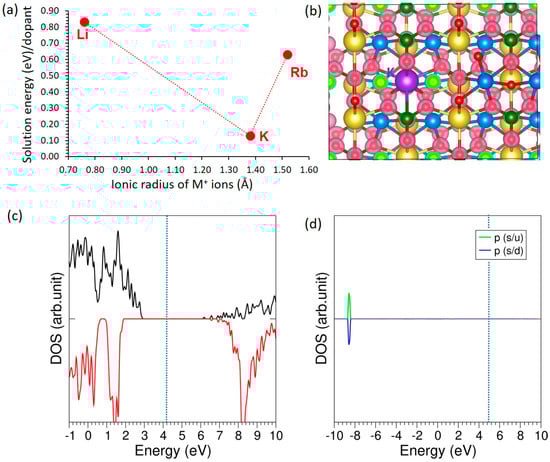
Figure 3.
(a) Solution energies of monovalent dopants, (b) charge density plot of K-doped NaMnPO4 (c) total DOS plot, and (d) atomic DOS plot of K.
The introduction of alkali-metal dopants leads to distinct structural and electronic modifications depending on the ionic radius of the substituent. Li, with the smallest ionic radius (0.76 Å), forms the shortest M–O bond length of 2.29 Å and carries a Bader charge of +1.00 |e|, while maintaining a magnetic moment of 5.00 µB (see Table 4). This substitution results in a slight lattice contraction, as reflected by a negative volume change (ΔV/V = −0.26%). In contrast, the larger dopants K (1.38 Å) and Rb (1.52 Å) exhibit elongated M–O bond distances of 2.77 Å and 2.81 Å, respectively, and slightly reduced Bader charges of +0.82 |e|. However, their magnetic moments remain unchanged at 5.00 µB. The incorporation of these larger cations induces a lattice expansion, with ΔV/V values of +0.79% and +1.27% for K and Rb, respectively.
3.4.2. Divalent Dopants
We categorize the divalent dopants into two groups: alkali earth elements (Mg, Ca, Sr, and Ba) and transition metals (Fe, Co, Ni, Cu, and Zn), since they exhibit distinct behaviors. Figure 4 shows the results of alkali earth dopant substitution at the Mn site in NaMnPO4. The following equation describes the doping process.
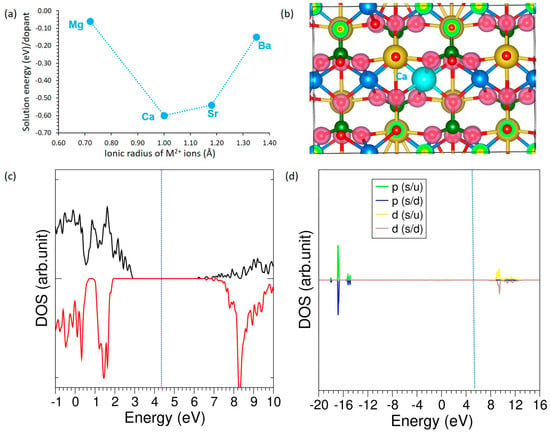
Figure 4.
(a) Solution energies of alkali earth dopants, (b) charge density plot associated with the Ca doping (c) total DOS plot of Ca-NaMnPO4, and (d) atomic DOS plot of Ca.
Figure 4a shows the solution energies of Mg, Ca, Sr, and Ba as a function of their ionic radii. Among these, Ca exhibits the lowest solution energy, suggesting the most favorable incorporation, while Mg and Ba appear less stable. Importantly, all four dopants have exothermic solution energies, indicating that they are thermodynamically favorable for incorporation into the host lattice under equilibrium conditions, at least in the dilute limit. Figure 4b presents the charge density distribution for the Ca-doped structure, which reveals localized electron accumulation around oxygen atoms and confirms the strong ionic interaction between Ca and its neighboring oxygen atoms. The DOS analysis (Figure 4c) shows that Ca-doping does not introduce states at the Fermi level, thereby preserving the insulating character of the host material. Furthermore, the atomic DOS of Ca (Figure 4d) demonstrates that its orbitals lie far from the Fermi level, indicating minimal direct contribution to the electronic states near the band edges.
For alkaline earth doping, clear trends emerge with increasing ionic radius. Mg (0.72 Å) forms the shortest M–O bond (2.17 Å) and shows the highest Bader charge transfer (+2.00 |e|), leading to a slight lattice contraction (ΔV/V = −0.43%) (see Table 5). In contrast, Ca, Sr, and Ba exhibit progressively longer M–O bond lengths (2.33–2.59 Å) and reduced charge transfer (~+1.6 |e|), resulting in lattice expansion that scales with size, from +0.77% for Ca to +2.36% for Ba. All alkaline earth-doped systems maintain a magnetic moment of 4.69 µB. These observations suggest that smaller dopants strengthen M–O interactions and contract the lattice, while larger cations induce expansion with weaker charge localization.
Table 5.
M-O bond distances, Bader charges on the dopants, magnetic moments, and changes in the volume of the alkali earth doped configurations.
Although metastable mixed-metal olivine phases Na[Mn1−XMX]PO4 (M = Fe, Ca, Mg; 0 ≤ x ≤ 0.5) have been accessed at low temperature via a topotactic solid-state route, analogous substitution in maricite-NaMnPO4 has not been explored [74]. Future experimental studies can verify the feasibility and limits of Fe-, Ca-, and Mg-incorporation into the maricite framework by preparing doped compositions under comparable topotactic conditions and establishing phase purity, dopant uptake, site occupancy, and oxidation states using synchrotron/neutron diffraction, as well as X-ray absorption spectroscopy.
The incorporation of transition-metal dopants (Fe, Co, Ni, Cu, and Zn) at the Mn site in NaMnPO4 was examined by plotting their solution energies against ionic radii. Among these, Cu emerges as the most favorable substitution, with a negative solution energy, while Fe, Co, Ni, and Zn exhibit higher positive values, indicating less stable incorporation (Figure 5a). The charge density distribution of the Cu-doped system (Figure 5b) shows pronounced charge localization around oxygen atoms, consistent with the ionic nature of Cu–O bonding. Density of states analysis (Figure 5c) confirms that Cu-doping preserves the insulating character of the host lattice, as no states are introduced at the Fermi level. The atomic DOS of Cu (Figure 5d) reveals that Cu 3d orbitals dominate near the valence band edge, providing states close to the Fermi level that may influence the electronic structure and enhance local conductivity.
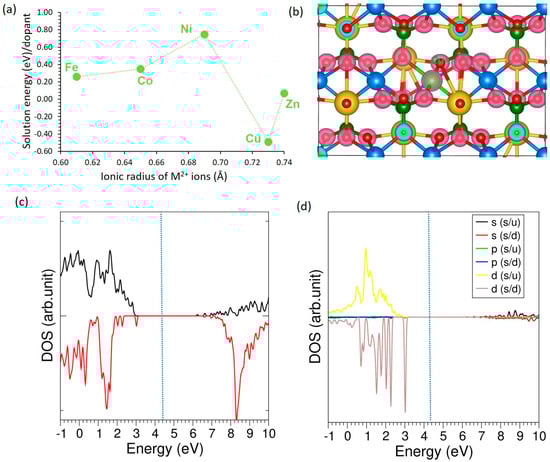
Figure 5.
(a) Solution energies of transition metal dopants, (b) charge density plot associated with the Cu-doping (c) total DOS plot of Cu-doped NaMnPO4 and (d) atomic DOS plot of Cu.
Transition metal dopants display distinct structural and electronic features compared to alkali and alkaline earth substitutions. In general, their smaller ionic radii (0.61–0.74 Å) yield shorter M–O bond lengths (2.05–2.21 Å) than those observed for larger alkali or alkaline earth cations. Among them, Ni (0.69 Å) forms the shortest bond (2.05 Å), consistent with stronger hybridization with oxygen, while Zn (0.74 Å) produces the longest bond (2.21 Å). The Bader charge transfer varies significantly across the series, from +0.98 |e| in Cu to +1.52 |e| in Fe, reflecting differences in d-electron configurations and bonding characteristics (see Table 6). All transition metal dopants reduce the magnetic moment slightly compared to the undoped system, with values ranging from 4.63 µB (Cu) to 4.94 µB (Fe), indicating partial quenching of magnetization due to d-state participation. Unlike alkali and alkaline earth elements, transition metal substitution consistently leads to lattice contraction, with ΔV/V values between −0.18% and −0.38%, highlighting the stronger electronic interactions between the transition metal d-orbitals and the oxygen sublattice.
Table 6.
M-O bond distances, Bader charges on the dopants, magnetic moments, and changes in the volume of the transition metal-doped NaMnPO4.
3.4.3. Trivalent Dopants
The doping of trivalent dopants (M = B, Al, Ga, In, and Tl) on the Mn site can promote Na vacancies for enhancing vacancy-mediated Na-ion migration according to the following equation.
Figure 6 highlights a strong size–solubility correlation for trivalent dopants in NaMnPO4. The solution energy decreases monotonically with the ionic radius of M3+ (B ≫ Al > Ga > In > Tl) (see Figure 6a), indicating that lattice strain and coordination mismatch dominate the thermodynamics—very small, hard cations such as B3+/Al3+ are disfavored, whereas larger ions (In3+, Tl3+) are comparatively compatible with the Mn site. The solution energies are prohibitively high for B3+ (>9.00 eV) and Al3+ (>4.50 eV), clearly indicating that these dopants are highly unlikely to be incorporated into the lattice under typical synthesis conditions. The charge-density isosurface for Tl (see Figure 6b) shows modest, fairly isotropic Tl–O bonding, consistent with Tl acting mainly as a structural/size-matched substituent while the host bears charge compensation. Although the electronic-structure results (Figure 6c) largely preserve a wide band gap with the Fermi level positioned inside it, a small number of mid-gap states are observed. The Tl-projected DOS (Figure 6d) indicates that these states predominantly originate from Tl-s orbitals, with negligible weight near the Fermi energy, confirming that Tl contributes minimally to the electronic states at the Fermi level. Together, these results suggest the highest trivalent solubility for Tl (and likely In), limited solubility for Ga, and essentially none for Al/B; compensation is expected via Mn2+→Mn3+ redox and/or Na vacancies rather than free carriers.
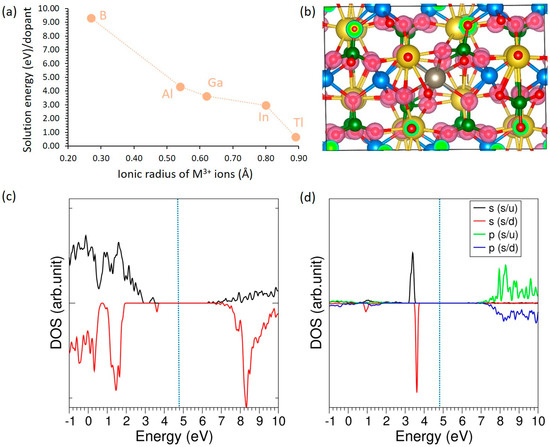
Figure 6.
(a) Solution energies of trivalent dopants, (b) charge density plot associated with the Tl-doping (c) total DOS plot of Tl-doped NaMnPO4 and (d) atomic DOS plot of Tl.
The local structure and charge analysis in Table 7 mirror the thermodynamics of Figure 6. The average M–O distance increases with the dopant ionic radius (Al 1.95 Å < Ga 2.21 Å < In 2.36 Å < Tl 2.64 Å), and the cell responds accordingly: Al causes a slight contraction (ΔV/V ≈ −0.29%), whereas Ga, In, and Tl expand the lattice (+0.99 to +2.84%). B is anomalous—its very small radius (0.27 Å) paired with an unusually long M–O (2.39 Å) indicates severe mismatch and local distortion, consistent with its very unfavorable solution energy. Bader charges track ionicity: Al and In are ~+3, Ga is slightly reduced (+2.66), while Tl (+0.92) and B (+0.60) transfer far less charge, implying much more covalent, weakly ionic bonding to O and a largely structural (rather than electronic) role for Tl. Across all cases the Mn moments remain ~4.63 μB, indicating the Mn sublattice retains high-spin Mn2+ character; thus, charge compensation in these dilute models is unlikely to proceed via substantial Mn2+→Mn3+ oxidation and is more consistent with compensating Na defects and/or ligand charge redistribution. Overall, larger, softer cations (In, Tl) are most easily accommodated structurally, whereas small hard cations (B, Al) impose strain and are disfavored.
Table 7.
M-O bond distances, Bader charges on the dopants, magnetic moments, and changes in the volume of the trivalent-doped NaMnPO4.
3.4.4. Tetravalent Dopants
The doping of tetravalent dopants (M = Si, Ge, Ti, Sn, Zr and Pb) on the P site can generate Na interstitials for enhancing the capacity of NaMnPO4. The following equation describes this process.
The impact of tetravalent dopants substituting at the P site in NaMnPO4 was investigated to assess their stability and electronic effects. As shown in Figure 7a, solution energies plotted against ionic radius reveal that Si and Ge have the lowest values (~3.7–3.8 eV), appearing relatively more favorable than Ti, Sn, Zr, and Pb. Nevertheless, even these “most favorable” dopants (Si4+ and Ge4+) still exhibit prohibitively high positive solution energies, indicating poor solubility and making their incorporation into the lattice under typical synthesis conditions highly unlikely. The charge density distribution for the Ge-doped system (Figure 7b) shows strong electron localization around oxygen atoms, consistent with ionic Ge–O interactions. The total DOS (Figure 7c) further confirms that Ge-doping preserves the insulating nature of the host lattice, with no states introduced at the Fermi level. The atomic DOS of Ge (Figure 7d) indicates that Ge orbitals lie deep in the valence region and slightly near the conduction band edge, suggesting only a minimal contribution to electronic states near the Fermi level.
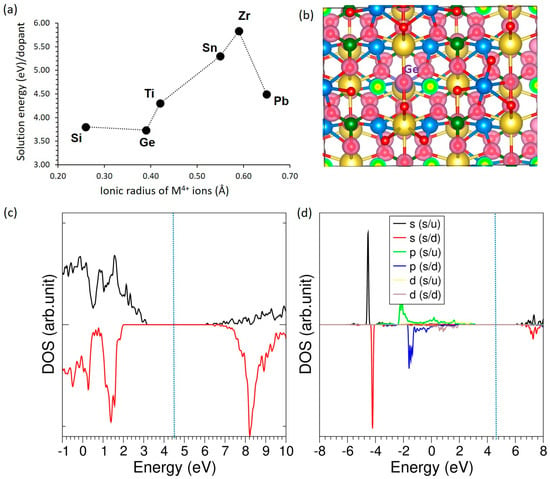
Figure 7.
(a) Solution energies of tetravalent dopants, (b) charge density plot of Ge-doped structure (c) total DOS plot of Ge-doped NaMnPO4, and (d) atomic DOS plot of Ge.
Under Na-interstitial compensation for M4+→P5+ substitution, Table 8 shows a clear size–structure–bonding trend that supports the mechanism. As ionic radius increases from Si to Pb, the M–O distance lengthens (1.65→2.22 Å) and the unit cell expands (ΔV/V from −0.38% to +1.86%). Si and Ge are essentially +4 (more ionic), Sn and Zr are slightly lower (+3.82, +3.08), and Ti and especially Pb are more covalent (+2.52, +2.42), consistent with longer M–O and softer bonding. The magnetic moment remains ~4.94 μB across the series, indicating that Mn stays high-spin Mn2+ and that charge neutrality is furnished by Na interstitial rather than Mn oxidation or electronic carriers. Practically, larger M4+ (Sn, Zr, Pb) are structurally accommodated but introduce greater lattice expansion (likely perturbing Na-ion pathways), whereas smaller M4+ (Si, Ge) maintain tighter frameworks with minimal electronic impact.
Table 8.
M-O bond distances, Bader charges on the dopants, magnetic moments, and changes in the volume of the tetravalent-doped NaMnPO4.
4. Conclusions
Atomistic simulations were carried out to investigate point defects (vacancies, interstitials, Frenkel, Schottky, and anti-site defects), Na-ion migration pathways, and the solution of dopants in maricite NaMnPO4. Among the intrinsic defects, the Na–Mn anti-site was identified as the most favorable process, indicating that a small fraction of Na and Mn ions readily exchange positions. The Na Frenkel defect was the second most favorable, suggesting that Na vacancies likely facilitate Na diffusion in this material. Sodium-ion migration is sluggish, with a calculated activation energy of 1.28 eV. For isovalent substitution, K is predicted to be most favorable at the Na site, and Ca/Cu at the Mn site. Thallium at the Mn site is expected to generate Na vacancies that enhance Na-ion migration, whereas Ge substitution at the P site is predicted to raise the sodium content
Author Contributions
Conceptualization, G.M.P.D.G. and N.K.; validation, G.M.P.D.G., P.A. and P.I.; formal analysis, G.M.P.D.G.; investigation, G.M.P.D.G. and N.K.; resources, P.I.; data curation, P.I.; writing—original draft preparation, G.M.P.D.G.; writing—review and editing, N.K.; supervision, P.A.; project administration, P.A. All authors have read and agreed to the published version of the manuscript.
Funding
This research received no external funding.
Institutional Review Board Statement
Not applicable.
Informed Consent Statement
Not applicable.
Data Availability Statement
The original data presented in this study are included in the article; further inquiries can be made to the corresponding author.
Acknowledgments
We acknowledge HPC services at Imperial College London for providing computational services. ChatGPT (GPT-5) was used to polish the English.
Conflicts of Interest
The authors declare no conflicts of interest.
References
- Hasan, M.M.; Haque, R.; Jahirul, M.I.; Rasul, M.G.; Fattah, I.M.R.; Hassan, N.M.S.; Mofijur, M. Advancing energy storage: The future trajectory of lithium-ion battery technologies. J. Energy Storage 2025, 120, 116511. [Google Scholar] [CrossRef]
- Wang, Y.; Yu, T.; Chen, J.; Gao, B.; Yu, M.; Zhu, J. Advances in safety of lithium-ion batteries for energy storage: Hazard characteristics and active suppression techniques. Energy Rev. 2025, 4, 100117. [Google Scholar] [CrossRef]
- Njema, G.G.; Ouma, R.B.O.; Kibet, J.K. A Review on the Recent Advances in Battery Development and Energy Storage Technologies. J. Renew. Energy 2024, 2024, 2329261. [Google Scholar] [CrossRef]
- Mizushima, K.; Jones, P.C.; Wiseman, P.J.; Goodenough, J.B. LixCoO2 (0 < x < −1): A new cathode material for batteries of high energy density. Mater. Res. Bull. 1980, 15, 783–789. [Google Scholar]
- Zhao, T.; Mahandra, H.; Marthi, R.; Ji, X.; Zhao, W.; Chae, S.; Traversy, M.; Li, W.; Yu, F.; Li, L.; et al. An overview on the life cycle of lithium iron phosphate: Synthesis, modification, application, and recycling. Chem. Eng. J. 2024, 485, 149923. [Google Scholar] [CrossRef]
- Guo, Y.; Zhang, Q.; Wei, J.; Hu, Y.; Liu, X.; Huang, S.; Pang, C. Advances and industrialization of LiFePO4 cathodes in electric vehicles: Challenges, innovations, and future directions. J. Mater. Chem. A 2025, 13, 17271–17283. [Google Scholar] [CrossRef]
- Konar, R.; Maiti, S.; Shpigel, N.; Aurbach, D. Reviewing failure mechanisms and modification strategies in stabilizing high-voltage LiCoO2 cathodes beyond 4.55 V. Energy Storage Mater. 2023, 63, 103001. [Google Scholar] [CrossRef]
- Dou, Y.; Zhao, L.; Liu, Y.; Zhang, Z.; Zhang, Y.; Li, R.; Liu, X.; Zhou, Y.; Wang, J.; Wang, J. High-abundance and low-cost anodes for sodium-ion batteries. Carbon Neutralization 2024, 3, 954–995. [Google Scholar] [CrossRef]
- Phogat, P.; Dey, S.; Wan, M. Comprehensive review of Sodium-Ion Batteries: Principles, Materials, Performance, Challenges, and future Perspectives. Mater. Sci. Eng. B 2025, 312, 117870. [Google Scholar] [CrossRef]
- Hwang, J.-Y.; Myung, S.-T.; Sun, Y.-K. Sodium-ion batteries: Present and future. Chem. Soc. Rev. 2017, 46, 3529–3614. [Google Scholar] [CrossRef]
- Wu, Y.; Shuang, W.; Wang, Y.; Chen, F.; Tang, S.; Wu, X.-L.; Bai, Z.; Yang, L.; Zhang, J. Recent Progress in Sodium-Ion Batteries: Advanced Materials, Reaction Mechanisms and Energy Applications. Electrochem. Energy Rev. 2024, 7, 17. [Google Scholar] [CrossRef]
- Bača, P.; Libich, J.; Gazdošová, S.; Polkorab, J. Sodium-Ion Batteries: Applications and Properties. Batteries 2025, 11, 61. [Google Scholar] [CrossRef]
- Yabuuchi, N.; Kubota, K.; Dahbi, M.; Komaba, S. Research Development on Sodium-Ion Batteries. Chem. Rev. 2014, 114, 11636–11682. [Google Scholar] [CrossRef]
- Yadav, P.; Shelke, V.; Patrike, A.; Shelke, M. Sodium-based batteries: Development, commercialization journey and new emerging chemistries. Oxf. Open Mater. Sci. 2023, 3, itac019. [Google Scholar] [CrossRef]
- Balaouras, V.; Kelaidis, N.; Daskalopulu, A.; Kuganathan, N.; Chroneos, A. Ionic diffusion in post-lithium batteries. J. Solid State Electrochem. 2025, 29, 3553–3565. [Google Scholar] [CrossRef]
- Zhu, L.; Li, L.; Wen, J.; Zeng, Y.-R. Structural stability and ionic transport property of NaMPO4 (M = V, Cr, Mn, Fe, Co, Ni) as cathode material for Na-ion batteries. J. Power Sources 2019, 438, 227016. [Google Scholar] [CrossRef]
- Liao, H.; Zhang, Z.; Zheng, Y.; Gao, Y. NaFePO4 for sodium-ion batteries: Mechanism, synthesis and optimization strategies toward commercialization. Energy Storage Mater. 2024, 65, 103157. [Google Scholar] [CrossRef]
- Pan, M.-Y.; Lu, S.-T.; Zhang, M.-Y.; Li, C.; Zou, G.-D.; Cao, K.-Z.; Fan, Y. Synthesis of olivine NaMnPO4 single crystals and electrochemical performance as anode material for Li-ion batteries. J. Solid State Chem. 2023, 321, 123929. [Google Scholar] [CrossRef]
- Akçay, T.; Häringer, M.; Pfeifer, K.; Anhalt, J.; Binder, J.R.; Dsoke, S.; Kramer, D.; Mönig, R. Na3V2(PO4)3—A Highly Promising Anode and Cathode Material for Sodium-Ion Batteries. ACS Appl. Energy Mater. 2021, 4, 12688–12695. [Google Scholar] [CrossRef]
- Zhang, X.; Rui, X.; Chen, D.; Tan, H.; Yang, D.; Huang, S.; Yu, Y. Na3V2(PO4)3: An advanced cathode for sodium-ion batteries. Nanoscale 2019, 11, 2556–2576. [Google Scholar] [CrossRef]
- Banerjee, S.; Choudhary, R.B.; Ansari, S. Na3V2(PO4)3 derived cathode materials for sodium-ion batteries (SIBs): A review. Future Batter. 2024, 4, 100010. [Google Scholar] [CrossRef]
- Li, S.; Guo, J.; Ye, Z.; Zhao, X.; Wu, S.; Mi, J.-X.; Wang, C.-Z.; Gong, Z.; McDonald, M.J.; Zhu, Z.; et al. Zero-Strain Na2FeSiO4 as Novel Cathode Material for Sodium-Ion Batteries. ACS Appl. Mater. Interfaces 2016, 8, 17233–17238. [Google Scholar] [CrossRef] [PubMed]
- Law, M.; Ramar, V.; Balaya, P. Na2MnSiO4 as an attractive high capacity cathode material for sodium-ion battery. J. Power Sources 2017, 359, 277–284. [Google Scholar] [CrossRef]
- Treacher, J.C.; Wood, S.M.; Islam, M.S.; Kendrick, E. Na2CoSiO4 as a cathode material for sodium-ion batteries: Structure, electrochemistry and diffusion pathways. Phys. Chem. Chem. Phys. 2016, 18, 32744–32752. [Google Scholar] [CrossRef]
- Blesa, M.C.; Moran, E.; León, C.; Santamaria, J.; Tornero, J.D.; Menéndez, N. α-NaFeO2: Ionic conductivity and sodium extraction. Solid State Ion. 1999, 126, 81–87. [Google Scholar] [CrossRef]
- Satrughna, J.A.K.; Kanwade, A.R.; Rajore, S.M.; Tiwari, M.K.; Ito, Y.; Ogura, A.; Lee, H.; Ohshita, Y.; Shirage, P.M. Sol-gel-based synthesis of high-capacity-NaCoO2 cathode for advanced sodium-ion batteries. Electrochim. Acta 2024, 507, 145201. [Google Scholar] [CrossRef]
- Wadhwa, P.; Cappellini, G.; Teles, L.K.; Filippetti, A. Fundamentals of NaMnO2, the cathode material for Na-ion rechargeable batteries. J. Mater. Chem. C 2025, 13, 12483–12493. [Google Scholar] [CrossRef]
- An, S.; Karger, L.; Dreyer, S.L.; Hu, Y.; Barbosa, E.; Zhang, R.; Lin, J.; Fichtner, M.; Kondrakov, A.; Janek, J.; et al. Improving cycling performance of the NaNiO2 cathode in sodium-ion batteries by titanium substitution. Mater. Futures 2024, 3, 035103. [Google Scholar] [CrossRef]
- Thirupathi, R.; Kumari, V.; Chakrabarty, S.; Omar, S. Recent progress and prospects of NASICON framework electrodes for Na-ion batteries. Prog. Mater. Sci. 2023, 137, 101128. [Google Scholar] [CrossRef]
- Wang, J.; He, T.; Yang, X.; Cai, Z.; Wang, Y.; Lacivita, V.; Kim, H.; Ouyang, B.; Ceder, G. Design principles for NASICON super-ionic conductors. Nat. Commun. 2023, 14, 5210. [Google Scholar] [CrossRef]
- Song, W.; Ji, X.; Wu, Z.; Zhu, Y.; Yang, Y.; Chen, J.; Jing, M.; Li, F.; Banks, C.E. First exploration of Na-ion migration pathways in the NASICON structure Na3V2(PO4)3. J. Mater. Chem. A 2014, 2, 5358–5362. [Google Scholar] [CrossRef]
- Xiao, J.; Zhang, B.; Liu, J.; He, X.; Xiao, Z.; Qin, H.; Liu, T.; Amine, K.; Ou, X. NaSICON-type materials for lithium-ion battery applications: Progress and challenges. Nano Energy 2024, 127, 109730. [Google Scholar] [CrossRef]
- Mohsin, I.U.; Schneider, L.; Yu, Z.; Cai, W.; Ziebert, C. Enabling the Electrochemical Performance of Maricite-NaMnPO4 and Maricite-NaFePO4 Cathode Materials in Sodium-Ion Batteries. Int. J. Electrochem. 2023, 2023, 6054452. [Google Scholar] [CrossRef]
- Xiao, H.; Fang, H. Rapid synthesis of olivine NaMnPO4. Chem. Lett. 2024, 53, upae125. [Google Scholar] [CrossRef]
- Jana, S.; Lingannan, G.; Ishtiyak, M.; Panigrahi, G.; Sonachalam, A.; Prakash, J. Syntheses, crystal structures, optical, Raman spectroscopy, and magnetic properties of two polymorphs of NaMnPO4. Mater. Res. Bull. 2020, 126, 110835. [Google Scholar] [CrossRef]
- Zhu, L.; Xie, J.-Y.; Zhou, G.-M.; Zhang, D.-A.; Du, A. First principles investigation of voltage, structure, ionic and electronic conduction of olivine and maricite NaMnPO4. Solid State Ion. 2023, 398, 116274. [Google Scholar] [CrossRef]
- Koleva, V.; Boyadzhieva, T.; Zhecheva, E.; Nihtianova, D.; Simova, S.; Tyuliev, G.; Stoyanova, R. Precursor-based methods for low-temperature synthesis of defectless NaMnPO4 with an olivine- and maricite-type structure. CrystEngComm 2013, 15, 9080–9089. [Google Scholar] [CrossRef]
- Priyanka, V.; Savithiri, G.; Subadevi, R.; Sivakumar, M. An emerging electrochemically active maricite NaMnPO4 as cathode material at elevated temperature for sodium-ion batteries. Appl. Nanosci. 2020, 10, 3945–3951. [Google Scholar] [CrossRef]
- Kuganathan, N.; Srikaran, R.; Fossati, P.C.M.; Chroneos, A. Theoretical Modeling of Defects, Dopants, and Diffusion in the Mineral Ilmenite. Minerals 2019, 9, 610. [Google Scholar] [CrossRef]
- Kuganathan, N. DFT Modelling of Li6SiO4Cl2 Electrolyte Material for Li-Ion Batteries. Batteries 2022, 8, 137. [Google Scholar] [CrossRef]
- Kuganathan, N.; Baiutti, F.; Morata, A.; Tarancon, A.; Chroneos, A. Interstitial lithium doping in SrTiO3. AIP Adv. 2021, 11, 075029. [Google Scholar] [CrossRef]
- Suthaharan, S.; Iyngaran, P.; Kuganathan, N.; Chroneos, A. Defects, diffusion and dopants in the ceramic mineral “Lime-Feldspar”. J. Asian Ceram. Soc. 2021, 9, 570–577. [Google Scholar] [CrossRef]
- Dutra, A.C.C.; Goldmann, B.A.; Islam, M.S.; Dawson, J.A. Understanding solid-state battery electrolytes using atomistic modelling and machine learning. Nat. Rev. Mater. 2025, 10, 566–583. [Google Scholar] [CrossRef]
- Poletayev, A.D.; Dawson, J.A.; Islam, M.S.; Lindenberg, A.M. Defect-driven anomalous transport in fast-ion conducting solid electrolytes. Nat. Mater. 2022, 21, 1066–1073. [Google Scholar] [CrossRef]
- Wood, S.M.; Eames, C.; Kendrick, E.; Islam, M.S. Sodium Ion Diffusion and Voltage Trends in Phosphates Na4M3(PO4)2P2O7 (M = Fe, Mn, Co, Ni) for Possible High-Rate Cathodes. J. Phys. Chem. C 2015, 119, 15935–15941. [Google Scholar] [CrossRef]
- Clark, J.M.; Barpanda, P.; Yamada, A.; Islam, M.S. Sodium-ion battery cathodes Na2FeP2O7 and Na2MnP2O7: Diffusion behaviour for high rate performance. J. Mater. Chem. A 2014, 2, 11807–11812. [Google Scholar] [CrossRef]
- Whiteside, A.; Fisher, C.A.J.; Parker, S.C.; Saiful Islam, M. Particle shapes and surface structures of olivine NaFePO4 in comparison to LiFePO4. Phys. Chem. Chem. Phys. 2014, 16, 21788–21794. [Google Scholar] [CrossRef]
- Tripathi, R.; Wood, S.M.; Islam, M.S.; Nazar, L.F. Na-ion mobility in layered Na2FePO4F and olivine Na[Fe,Mn]PO4. Energy Environ. Sci. 2013, 6, 2257–2264. [Google Scholar] [CrossRef]
- Gale, J.D. GULP: A computer program for the symmetry-adapted simulation of solids. J. Chem. Soc. Faraday Trans. 1997, 93, 629–637. [Google Scholar] [CrossRef]
- Binks, D.J.; Grimes, R.W. Incorporation of Monovalent Ions in ZnO and Their Influence on Varistor Degradation. J. Am. Ceram. Soc. 1993, 76, 2370–2372. [Google Scholar] [CrossRef]
- Kuganathan, N.; Chroneos, A. Defects, Dopants and Sodium Mobility in Na2MnSiO4. Sci. Rep. 2018, 8, 14669. [Google Scholar] [CrossRef]
- Gale, J.D.; Henson, N.J. Derivation of interatomic potentials for microporous aluminophosphates from the structure and properties of berlinite. J. Chem. Soc. Faraday Trans. 1994, 90, 3175–3179. [Google Scholar] [CrossRef]
- Lewis, D.W.; Catlow, C.R.A.; Sankar, G.; Carr, S.W. Structure of Iron-Substituted ZSM-5. J. Phys. Chem. 1995, 99, 2377–2383. [Google Scholar] [CrossRef]
- Gale, J.D.; Rohl, A.L. The General Utility Lattice Program (GULP). Mol. Simul. 2003, 29, 291–341. [Google Scholar] [CrossRef]
- Mott, N.F.; Littleton, M.J. Conduction in polar crystals. I. Electrolytic conduction in solid salts. Trans. Faraday Soc. 1938, 34, 485–499. [Google Scholar] [CrossRef]
- Kresse, G.; Joubert, D. From ultrasoft pseudopotentials to the projector augmented-wave method. Phys. Rev. B 1999, 59, 1758–1775. [Google Scholar] [CrossRef]
- Perdew, J.P.; Burke, K.; Ernzerhof, M. Generalized Gradient Approximation Made Simple. Phys. Rev. Lett. 1996, 77, 3865–3868. [Google Scholar] [CrossRef]
- Blöchl, P.E. Projector augmented-wave method. Phys. Rev. B 1994, 50, 17953–17979. [Google Scholar] [CrossRef] [PubMed]
- Monkhorst, H.J.; Pack, J.D. Special points for Brillouin-zone integrations. Phys. Rev. B 1976, 13, 5188–5192. [Google Scholar] [CrossRef]
- Press, W.H.; Teukolsky, S.A.; Vetterling, W.T.; Flannery, B.P. Numerical Recipes in C, 2nd ed.; The art of scientific computing; Cambridge University Press: Cambridge, UK, 1992. [Google Scholar]
- Bader, R.F.W. The zero-flux surface and the topological and quantum definitions of an atom in a molecule. Theor. Chem. Acc. 2001, 105, 276–283. [Google Scholar] [CrossRef]
- Dima, R.S.; Maleka, P.M.; Maluta, E.N.; Maphanga, R.R. First principles study on sodium de-intercalation from NaMnPO4. Mater. Today Proc. 2022, 62, S7–S11. [Google Scholar] [CrossRef]
- Kröger, F.A.; Vink, H.J. Relations between the Concentrations of Imperfections in Crystalline Solids. In Solid State Physics; Seitz, F., Turnbull, D., Eds.; Academic Press: Cambridge, MA, USA, 1956; Volume 3, pp. 307–435. [Google Scholar]
- Ong, S.P.; Chevrier, V.L.; Hautier, G.; Jain, A.; Moore, C.; Kim, S.; Ma, X.; Ceder, G. Voltage, stability and diffusion barrier differences between sodium-ion and lithium-ion intercalation materials. Energy Environ. Sci. 2011, 4, 3680–3688. [Google Scholar] [CrossRef]
- Seshan, V.; Iyngaran, P.; Abiman, P.; Kuganathan, N. Atomic-Scale Study of NASICON Type Electrode Material: Defects, Dopants and Sodium-Ion Migration in Na3V2(PO4)3. Physchem 2025, 5, 1. [Google Scholar] [CrossRef]
- Kuganathan, N.; Chroneos, A. Defects, diffusion, dopants and encapsulation of Na in NaZr2(PO4)3. Materialia 2021, 16, 101039. [Google Scholar] [CrossRef]
- El Kacemi, Z.; Mansouri, Z.; Benyoussef, A.; El Kenz, A.; Balli, M.; Mounkachi, O. First principle calculations on pristine and Mn-doped iron fluorophosphates as sodium-ion battery cathode materials. Comput. Mater. Sci. 2022, 206, 111292. [Google Scholar] [CrossRef]
- Xiao, H.; Fang, H. On the thermal stability of olivine NaMnPO4. Dalton Trans. 2025, 54, 9049–9056. [Google Scholar] [CrossRef]
- Jang, D.; Palanisamy, K.; Yoon, J.; Kim, Y.; Yoon, W.-S. Crystal and local structure studies of LiFe0.48Mn0.48Mg0.04PO4 cathode material for lithium rechargeable batteries. J. Power Sources 2013, 244, 581–585. [Google Scholar] [CrossRef]
- Drezen, T.; Kwon, N.-H.; Bowen, P.; Teerlinck, I.; Isono, M.; Exnar, I. Effect of particle size on LiMnPO4 cathodes. J. Power Sources 2007, 174, 949–953. [Google Scholar] [CrossRef]
- Liu, Y.; Zhang, N.; Wang, F.; Liu, X.; Jiao, L.; Fan, L.-Z. Approaching the Downsizing Limit of Maricite NaFePO4 toward High-Performance Cathode for Sodium-Ion Batteries. Adv. Funct. Mater. 2018, 28, 1801917. [Google Scholar] [CrossRef]
- Hu, W.; Tang, Y.; Zhang, Y.; Yu, L.; Liu, H.; Cao, Y.; Li, B.; Liu, L. Carbon-Coated Maricite NaFePO4 Nanospheres Embedded in Graphene Nanosheets as Cathodes for Sodium-Ion Batteries. ACS Appl. Nano Mater. 2025, 8, 13238–13245. [Google Scholar] [CrossRef]
- Song, A.; Li, Y.; Yuan, D.; Wu, J.; Gu, H.; Zhang, G.; Wu, A.; Xu, J. Recent progress in carbon-based composite materials for advanced sodium ion batteries: From storage mechanism to structural design to applications as flexible electrodes. Green Energy Environ. 2025, 10, 1437–1460. [Google Scholar] [CrossRef]
- Lee, K.T.; Ramesh, T.N.; Nan, F.; Botton, G.; Nazar, L.F. Topochemical Synthesis of Sodium Metal Phosphate Olivines for Sodium-Ion Batteries. Chem. Mater. 2011, 23, 3593–3600. [Google Scholar] [CrossRef]


Disclaimer/Publisher’s Note: The statements, opinions and data contained in all publications are solely those of the individual author(s) and contributor(s) and not of MDPI and/or the editor(s). MDPI and/or the editor(s) disclaim responsibility for any injury to people or property resulting from any ideas, methods, instructions or products referred to in the content. |
© 2025 by the authors. Licensee MDPI, Basel, Switzerland. This article is an open access article distributed under the terms and conditions of the Creative Commons Attribution (CC BY) license (https://creativecommons.org/licenses/by/4.0/).