Article

Chemical Stability of PFSA Membranes in Heavy-Duty Fuel Cells: Fluoride Emission Rate Model

1
Argonne National Laboratory, Lemont, IL 60439, USA
2
Los Alamos National Laboratory, Los Alamos, NM 87545, USA
3
Lawrence Berkeley National Laboratory, Berkeley, CA 94720, USA
*
Author to whom correspondence should be addressed.
Electrochem 2025, 6(3), 25; https://doi.org/10.3390/electrochem6030025
Submission received: 8 May 2025 / Revised: 16 June 2025 / Accepted: 30 June 2025 / Published: 4 July 2025

Abstract

Laboratory data from in-cell tests at and near open circuit potentials (OCV) and ex-situ H2O2 vapor exposure tests are used to develop a fluoride emission rate (FER) model for a state-of-the-art 12-µm thin, low equivalent weight, long-chain perfluorosulfonic acid (PFSA) ionomer membrane that is mechanically reinforced with expanded PTFE and chemically stabilized with 2 mol% cerium as an anti-oxidant. The anode FER at OCV linearly correlates with O2 crossover from the cathode and the high yield of H2O2 at anode potentials, as observed in rotating ring disk electrode (RRDE) studies. The cathode FER may be linked to the energetic formation of reactive hydroxyl radicals (·OH) from the decomposition of H2O2 produced as an intermediate in the two-electron ORR pathway at high cathode potentials. Both anode and cathode FERs are significantly enhanced at low relative humidity and high temperatures. The modeled FER is strongly influenced by the gradients in water activity and cerium concentration that develops in operating fuel cells. Membrane stability maps are constructed to illustrate the relationship between the cell voltage, temperature, and relative humidity for FER thresholds that define H2 crossover failure by chemical degradation over a specified lifetime.

1. Introduction

Low-temperature polymer electrolyte membrane fuel cells (PEMFCs) are being considered for many heavy-duty (HD) transport applications [1,2,3,4,5,6]. Marcinkoski et al. established interim targets for PEMFC systems to compete with the performance, durability, and cost of class-8 diesel trucks: 68% peak efficiency, 25,000-h lifetime, and a cost of 80 USD/kW [7]. Padgett et al. formulated a unified cell-level target for performance and durability in a single metric: 2.5 kW/gPGM Pt group metal (PGM) utilization at 0.7 V, 90 °C, 2.5 atm, and 2/1.5 anode/cathode stoichiometry after a 25,000 h-equivalent accelerated stress test (AST) [8]. Ahluwalia et al. investigated several catalyst systems for oxygen reduction reaction (ORR) and operational strategies to achieve 25,000-h electrode lifetime on a HD truck duty cycle [9,10,11]: load sharing with hybrid batteries, regulating the radiator fan power to preferentially maintain the stack temperature below 65 °C, clipping the maximum cell voltage to 850 mV, overloading the cathode catalyst, limiting the loss of electrochemical surface area (ECSA), and oversizing the active membrane area.
Besides the ORR catalyst, stability of perfluorosulfonic acid (PFSA) membranes in low-temperature PEMFCs is also of concern in heavy-duty applications that have aggressive duty cycles and long service life [12,13,14,15]. Despite recent advances in backbone fluorination, mechanical reinforcement of 8–20 µm thin membranes, and chemical stabilization with anti-oxidants [16,17,18], PFSA membranes remain subject to chemical and mechanical degradation under harsh conditions. Chemical degradation is initiated by the formation of hydrogen peroxide and subsequent radicals that attack the main and side chains of the polymer, leading to fragmentation of the structure [19,20,21,22]. Mechanical degradation occurs due to hygrothermal stresses on a constrained membrane caused by dynamically varying membrane humidification levels during operation over a vehicle duty cycle [23,24]. Synergistic chemical–mechanical degradation significantly shortens the membrane lifetime in vehicular applications with frequent load cycling and start–stop events [25,26,27].
Chemical degradation is stimulated through the combination of metal contaminants, fuel impurities, and radical attacks on the Nafion polymer [28,29]. Specifically, a radical attack occurs through the initial formation of peroxide as a side reaction intermediate in the 2-electron ORR at the fuel cell electrodes [30,31]. Although H2O2 can attack the polymer structure, conversion of H2O2 into highly reactive radical species is generally considered the dominant degradation pathway under typical fuel cell operating conditions. Metal ion contaminants from bipolar plate degradation such as Fe2+ and Fe3+ catalyze the decomposition of H2O2 under acidic conditions into more reactive radical species such as hydroxyl (⋅OH) and hydroperoxyl (⋅OOH) through a Fenton reaction [32,33,34].
F e 2 + + H 2 O 2     F e 3 + + OH + OH
OH +   H 2 O 2     H 2 O + OOH
OH +   H 2     H 2 O + H
F e 3 + +   H 2 O 2     F e 2 + + OOH +   H +
The OH radicals rapidly react with fluoride atoms from the main and side chains of Nafion, breaking C-F and C-S bonds and releasing HF [19,35]. A radical attack primarily occurs through the unzipping of the terminal end groups, side chain degradation, and random scission along the Nafion backbone [34]. Unzipping occurs on the carboxylic end groups to produce CO2 and HF. Subsequent radical attack and hydrolysis result in the regeneration of the carboxylic end group with one carbon removed.
C F 2 - C F 2 m - C F 2 - C F 2 - CF - O - C F 2 - CF C F 3 - O - C F 2 - C F 2 - S O 3 H - C F 2 - COOH + OH     C F 2 - C F 2 m - C F 2 - C F 2 - CF - O - C F 2 - CF C F 3 - O - C F 2 - C F 2 - S O 3 H - C F 2 +   C O 2 + H 2 O
C F 2 - C F 2 m - C F 2 - C F 2 - CF - O - C F 2 - CF C F 3 - O - C F 2 - C F 2 - S O 3 H - C F 2 + OH + H 2 O   C F 2 - C F 2 m - C F 2 - C F 2 - CF - O - C F 2 - CF C F 3 - O - C F 2 - C F 2 - S O 3 H - COOH + 2   HF
On the side chain of Nafion, radical attack can initiate at the C-S bond, generating a CF2 radical group that undergoes radical-driven hydrolysis forming a carboxylic end group and releasing HF.
C F 2 - C F 2 m - C F 2 - C F 2 - CF - O - C F 2 - CF C F 3 - O - C F 2 - C F 2 - S O 3 H - C F 2 - COOH + OH   C F 2 - C F 2 m - C F 2 - C F 2 - CF - O - C F 2 - CF C F 3 - O - C F 2 - C F 2 - C F 2 - COOH + S O 3 + H 2 O
C F 2 - C F 2 m - C F 2 - C F 2 - CF - O - C F 2 - CF C F 3 - O - C F 2 - C F 2 - C F 2 - COOH + OH + H 2 O   C F 2 - C F 2 m - C F 2 - C F 2 - CF - O - C F 2 - CF C F 3 - O - C F 2 - COOH - C F 2 - COOH + 2 HF
Hydrogen radicals can also abstract fluorine from the carbon connected to the side chain, forming a C - O bond that undergoes beta scission by reacting with hydroxyl radicals and separates the side chain from the backbone neighboring carbon. In this process, a radicalized -CF2⋅ is formed in the main chain, which may be oxidized to form -CF2OH or -COOH groups. The production of HF accelerates as the concentration of -COOH end groups regeneratively increases and the main chains become available for unzipping and further degradation [36].
C F 2 - C F 2 m - C F 2 - C F 2 - CF - O - C F 2 - CF C F 3 - O - C F 2 - C F 2 - S O 3 H - C F 2 - COOH + H   C F 2 - C F 2 m - C F 2 - C F 2 - C - O - C F 2 - CF C F 3 - O - C F 2 - C F 2 - S O 3 H - C F 2 - COOH + HF
C F 2 - C F 2 m - C F 2 - C F 2 - C - O - C F 2 - CF C F 3 - O - C F 2 - C F 2 - S O 3 H - C F 2 - COOH + 2 OH   C F 2 - C F 2 m - C F 2 - C F 2 + COO - C F 2 - CF C F 3 - O - C F 2 - C F 2 - S O 3 H - C F 2 - COOH + H 2 O
C F 2 - C F 2 m - C F 2 - C F 2 + OH + H 2 O     C F 2 - C F 2 m - C F 2 - CO O H   + 2 H F
Membrane lifetime can be enhanced by incorporating radical scavengers, such as cerium and manganese ions [37,38,39]. For example, Ce3+ scavenges ·OH to form Ce4+; which is subsequently reduced back to Ce3+ upon reacting with H2O2, mitigating radical formation and attack [38,40,41,42]. This leads to a regenerative sink process in which cerium ions reduce the presence of peroxide and radical species.
C e 3 + + OH +   H +   C e 4 + + H 2 O
C e 4 + +   H 2 O 2     C e 3 + + OOH +   H +
C e 4 + + OOH     C e 3 + + O 2 +   H +
The purpose of this work is to discuss the chemical stability of a mechanically reinforced, chemically stabilized, long-chain PFSA membrane with commercially relevant electrodes and Pt loadings. The scope is limited to low temperature PEMFC systems that operate below 90–95 °C and are equipped with a cathode humidifier to maintain relative humidities above 30% [22,23]. The overall approach is to characterize the chemical stability in terms of fluoride emission rate (FER) at steady-state and to develop a model using experimental data at or near OCV, where it can be measured with high fidelity. The model can then be used to calculate FER in differential cells and map operating conditions to limit fluoride emission rates for postulated failure scenarios.

2. Materials and Methods

2.1. Data Sources

The experimental data supporting the FER model development pertains to a state-of-the-art, thin (12 μm), low equivalent weight (800 EW) PFSA membrane that is mechanically reinforced with an expanded PTFE skeleton layer and chemically stabilized with 9.7 mg/cm2 Ce [43]. It is incorporated into a membrane electrode assembly (MEA) in which the cathode electrode has 30% PtCo/HSC ORR catalyst with 0.1 mg/cm2 Pt and 825 EW ionomer with 0.9 I/C. The anode electrode has 10% Pt/GrV HOR catalyst with 0.025 mg/cm2 Pt and 900 EW ionomer with 0.6 I/C. The data sources are briefly described below.
Cell Tests: A series of 270–300 h tests were conducted on a 44-cm2 single cell hardware to examine the effect of operating conditions on FER measured by ion exchange chromatography of water samples collected over 24-h time intervals. Figure 1a presents the data from one series of tests on the effect of temperature on anode and cathode FERs at 250 kPaabs backpressure and 100% RH. The cell voltage was held at 0.9 V or OCV if it could not be maintained at the set point. No specific cell recovery operation was attempted during the course of the test, and the cell voltage dropped to an OCV of 0.86 V after 265 h at 95 °C but stayed at the set point of 0.9 V at 80 °C. The membrane remained healthy, as evidenced by no obvious change in the measured H2 crossover.
In another series of tests, the cells were subjected to catalyst-specific, membrane-specific, and combined catalyst–membrane H2/air-accelerated stress tests (AST) in a counterflow configuration [45]. The 125-h catalyst AST consisted of 30,000 square wave (SW) potential cycles at 90 °C and 100% RH. Each potential cycle was of 15-s duration with 5 s at 0.675 V lower potential limit (LPL) and 10 s at 0.925 V upper potential limit (UPL). The 500-h membrane AST consisted of 30,000 SW current cycles at 95 °C and 20% RH. Each current cycle was of 60-s duration with 30 s at 0.01 A/cm2 lower current density (LCD) and 30 s at 1.5 A/cm2 upper current density (UCD). The 625-h combined AST consisted of the 125-h catalyst AST as Part I and the 500-h membrane AST as Part II. Post-test transmission electron microscopic (TEM) examination of specimens revealed that the membrane thickness had decreased by 22% at the air inlet, 30% in the middle, and 38% at the air outlet after the combined AST. The membrane remained healthy in the tests, with no significant change In the measured H2 crossover. More complete information on test protocols and data will be published in a separate paper.
OCV Tests: Coms et al. investigated the effect of membrane thickness on chemical degradation in a 38-cm2 active area cell hardware with the catalysts coated on the anode and cathode gas diffusion media [43]. The tests were performed at OCV and 90 °C for 2-mol% Ce loading and three levels of four variables: membrane thickness, RH, cathode pressure, and anode differential pressure. A design-of-experiments approach was used to reduce the number of tests from 34 to 3(4–1). The tests were 270 h long, and the measured FERs are summarized in Figure 1b as steady-state values after exposure for 200 h at different RH. The OCV is not constant during the test and declines at a rate that depends on the operating conditions. For example, it declined rapidly to 0.860 V for an MEA with a 20-µm membrane held at 90% RH, 210 kPa anode, and 150 kPa cathode pressure, and gradually to 0.792 V for an MEA with a 12-µm membrane held at 30% RH, 220 kPa anode, and 200 kPa cathode pressure. The variability in FER for a given RH in Figure 1b is a measure of the combined effect of membrane thickness and gas pressures.
Hydrogen Peroxide Vapor Test: Ex-situ tests were conducted by Kumaraguru [44] and Coms [43] to investigate the chemical stability of membranes exposed to 30-ppm of H2O2 vapor in a N2 carrier stream at 90 °C. A three-step protocol was developed to baseline the membrane degradation rate via unzipping at 91–95% RH in step 1, measure the accelerated degradation rate at 22–23% RH in step 2, and kinetically characterize the damage in the low-RH excursion in step 2 by holding at 91–95% RH in step 3. Each step had a 20-h duration. The tests were performed for three membrane thicknesses (8, 12, 20 µm) and three levels of Ce loading. Figure 1c summarizes the 3-step FER data for the 12-µm membrane with 0, 2, and 8 mol% Ce loading. It indicates that the unmitigated membrane has much higher degradation rates and, as detected by FTIR, also suffers chain scission during low-RH excursion. Even at low 2 mol% loading, cerium is very effective in mitigating chemical degradation and, as confirmed by FTIR, arresting main chain scission.

2.2. Theoretical

Differential Cell Model: A 1-D model was developed to calculate the potential gradients and other variables that affect Ce transport in operating differential cells. Neglecting current transport in the axial direction, the ionic ( E i ) and electric potential ( E e ) distributions in the through-plane (anode to cathode, y) are determined by the following equations:
y σ i E i y = j a j c
y σ e E e y = j a j c
i i = σ i E i y
i e = σ e E e y
i = i i + i e
We use the Butler–Volmer equation for the HOR kinetics and the Tafel equation for the ORR kinetics as follows:
j a = 2 i 0 a S P t a s i n h η a b a
i 0 a = i 0 a r C H 2 C H 2 r γ a e Δ H s a R 1 353 1 T
η a = E e E i + E N a
E N a = R T 2 F l n C H 2 C H 2 r
j c + j x = i 0 c S P t c 1 θ e ω θ R T e η c b c
i 0 c = i 0 c r C O 2 C O 2 r γ c a w β 1 S e Δ H s c R 1 353 1 T
η c = E N c ( E e E i )
E N c = E N 0 + RT 2 F ln C O 2 C O 2 r 0.5 / a w
Water Transport: Assuming a local equilibrium between water uptake in ionomer ( λ m ) and vapor concentration ( ρ v ) in the electrode, the following equations define water concentration ( ρ w ), effective diffusivity ( D w e ), and water transport in the through-plane [46]:
( ε + ε m ) ρ w = ε m M w M m ρ m   λ m + ε ρ v
( ε + ε m ) ρ w D w e = ε m M w M m ρ m   λ m D λ e + ε ρ v D v e
t [ ε + ε m ρ w ] = y [ ε + ε m D w e ρ w y M w β λ i i F ] + S ˙ w
S ˙ w = j c 2 F M w
The water transport equation can be conveniently recast in terms of ρ v as the dependent variable:
( ε + ε m ) ρ v t = y [ ( ε + ε m ) D w e ρ v y M w β λ i i F ] + S ˙ w
ε m = ε m M w M m ρ m ρ s λ m a m
For computational expediency, Lai’s relationship between λ m and water activity ( a m ) is extrapolated beyond the saturation limit ( a m = 1 ) as follows:
λ m =   1 + 0.2352 α m 2 T 303 30 14.22 a m 3 18.92 a m 2 + 13.41 a m ,   a m 1
λ m = a m 1 a m l 1 0.1 λ m l λ s + λ s ,   1 < a m < ( a m l = 3 )
λ m l = 7.633 + 0.1779 T 273 ,   298   K < T < 373   K
Cerium Transport: Ce is mobile and moves rapidly in the through-plane under applied potential. The following conservation equation describes the dynamics of Ce transport between the membrane and the electrodes by electromigration and diffusion:
ϵ m c C e t =   y ( D C e c C e y + u C e c C e V i y )
Following Baker et al., Ce diffusivity ( D C e ) and mobility ( u m ) are correlated with temperature and water uptake [47]:
D C e = ϵ m 1.5 D C e ( λ s , T r ) e H d R 1 T 1 T r λ m λ 0 λ s λ 0 1.75 ,   D C e λ s , T r = 2 × 10 6   c m 2 / s ,   λ 0 = 2.3
u C e = ϵ m 1.5 u C e λ s , T r e H m R 1 T 1 T r λ m λ 0 λ s λ 0 1.4 ,   u C e λ s , T r = 1.5 × 10 2   c m 2 / V . s
Solution Method: The foregoing set of equations governing potential distribution, water transport, cerium transport, and fluoride emission rate for the differential cell models were solved simultaneously using COMSOL Multiphysics (version 6.0) [48]. The computational domain defined as the gas diffusion layers, catalyst layers, and membrane was discretized on a non-uniform rectangular grid providing appropriate spatial variation in through-plane gradients. The simulations were performed using the time-dependent COMSOL solver, with adaptive time stepping to ensure numerical stability. The output data was processed to extract crossover rates, cerium retention, and relative humidity at the anode and cathode interfaces of the membrane. The transient equations are integrated for multiple time steps until convergence, defined as repeat solutions with negligible differences, is obtained.

3. Results

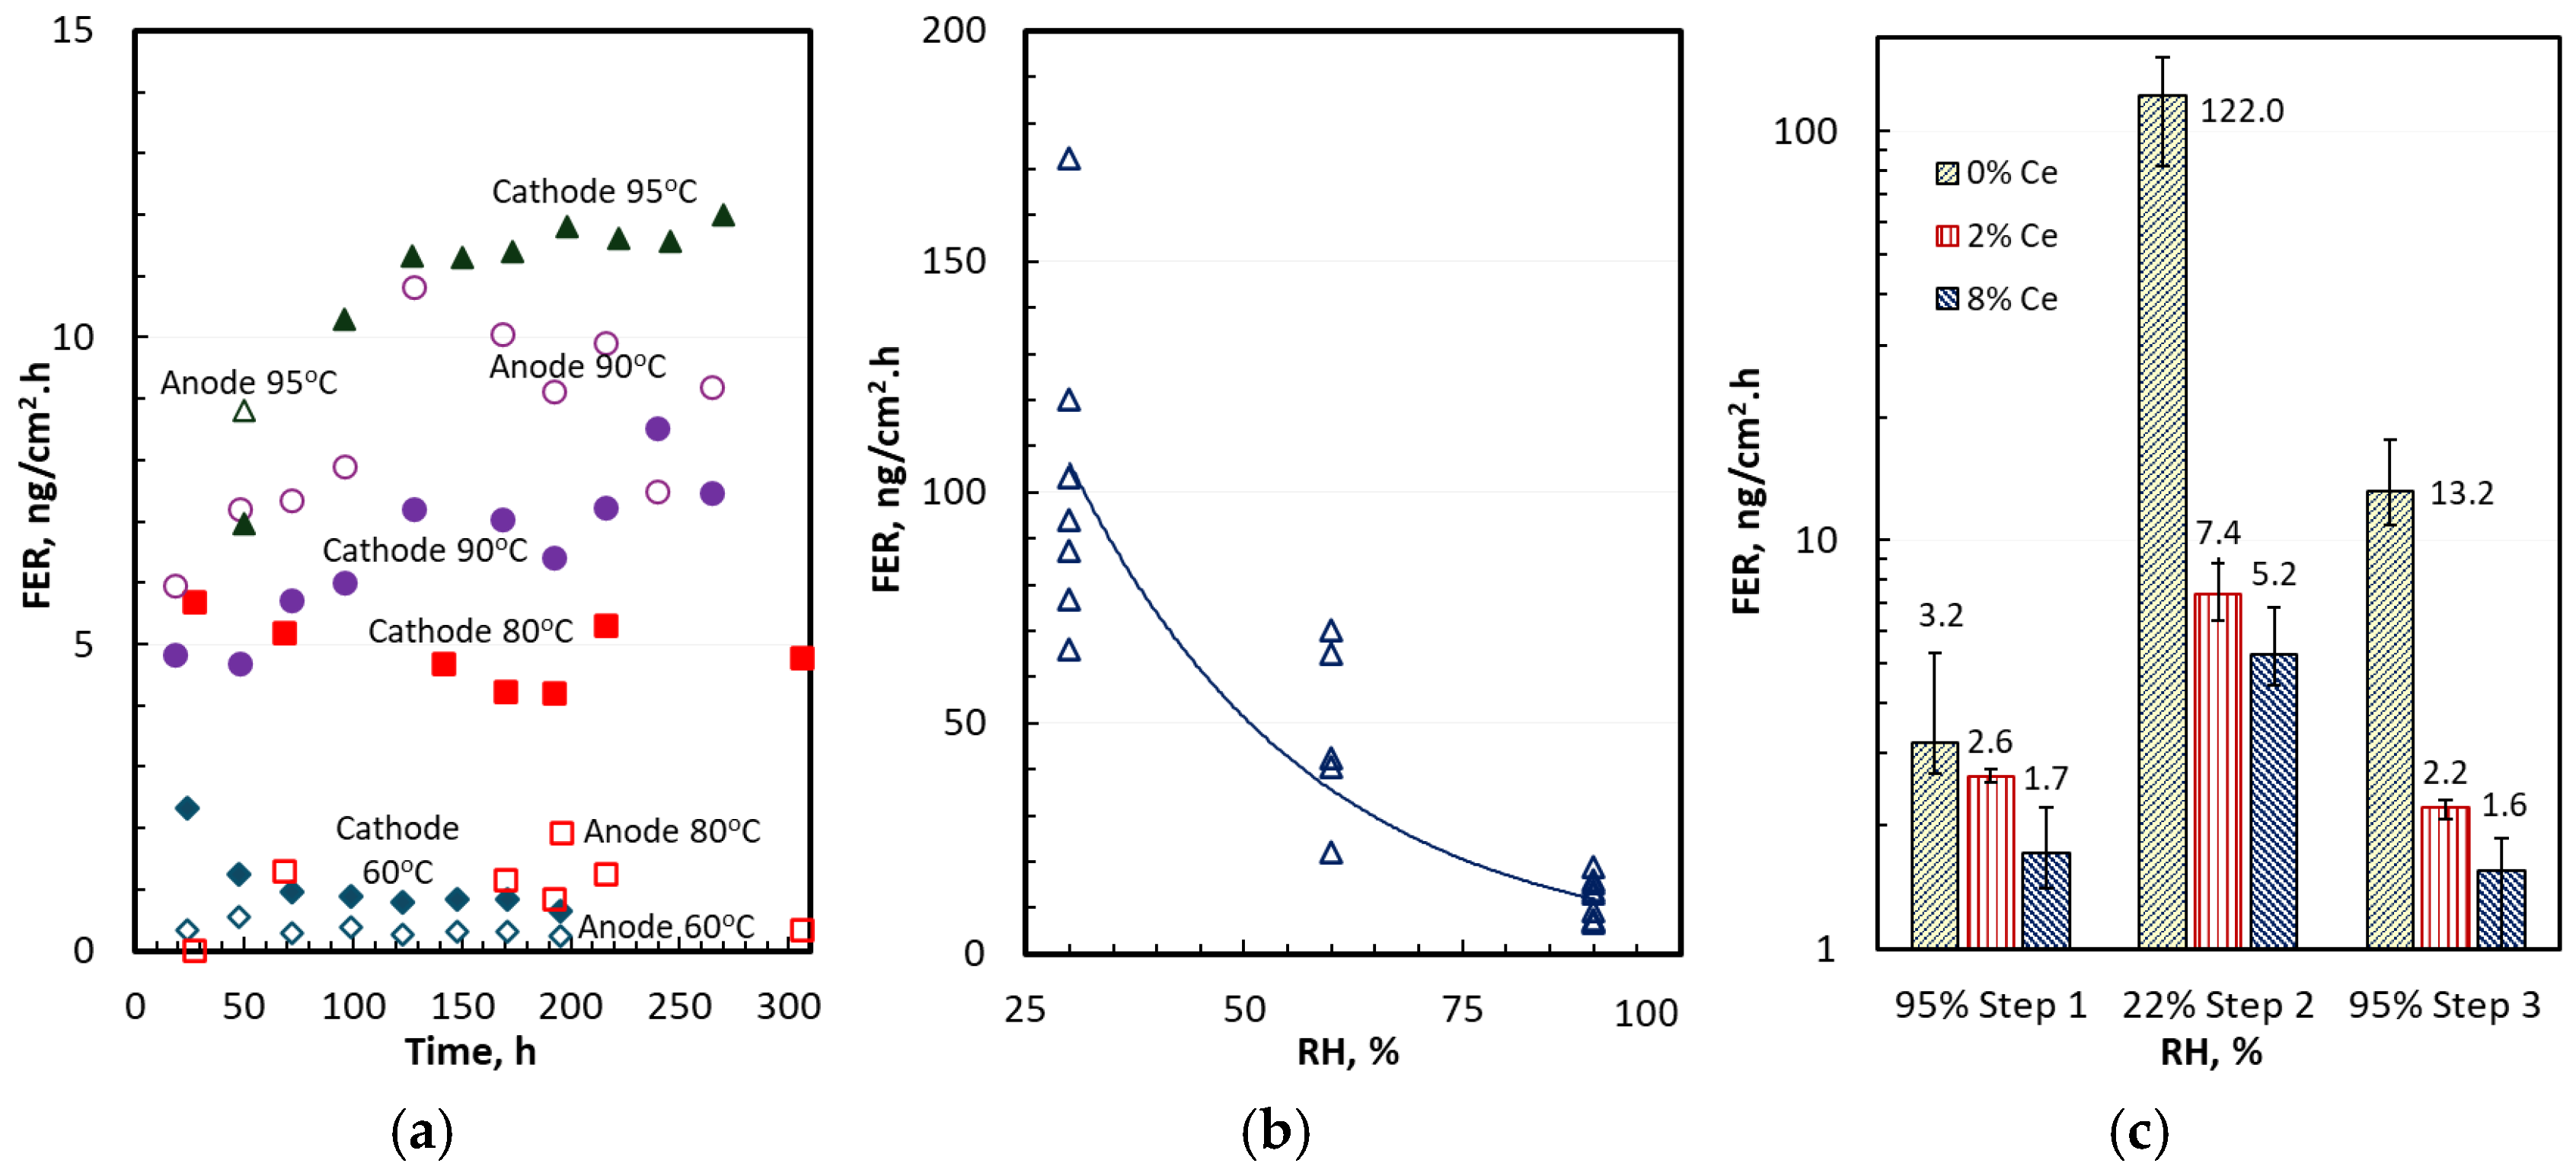
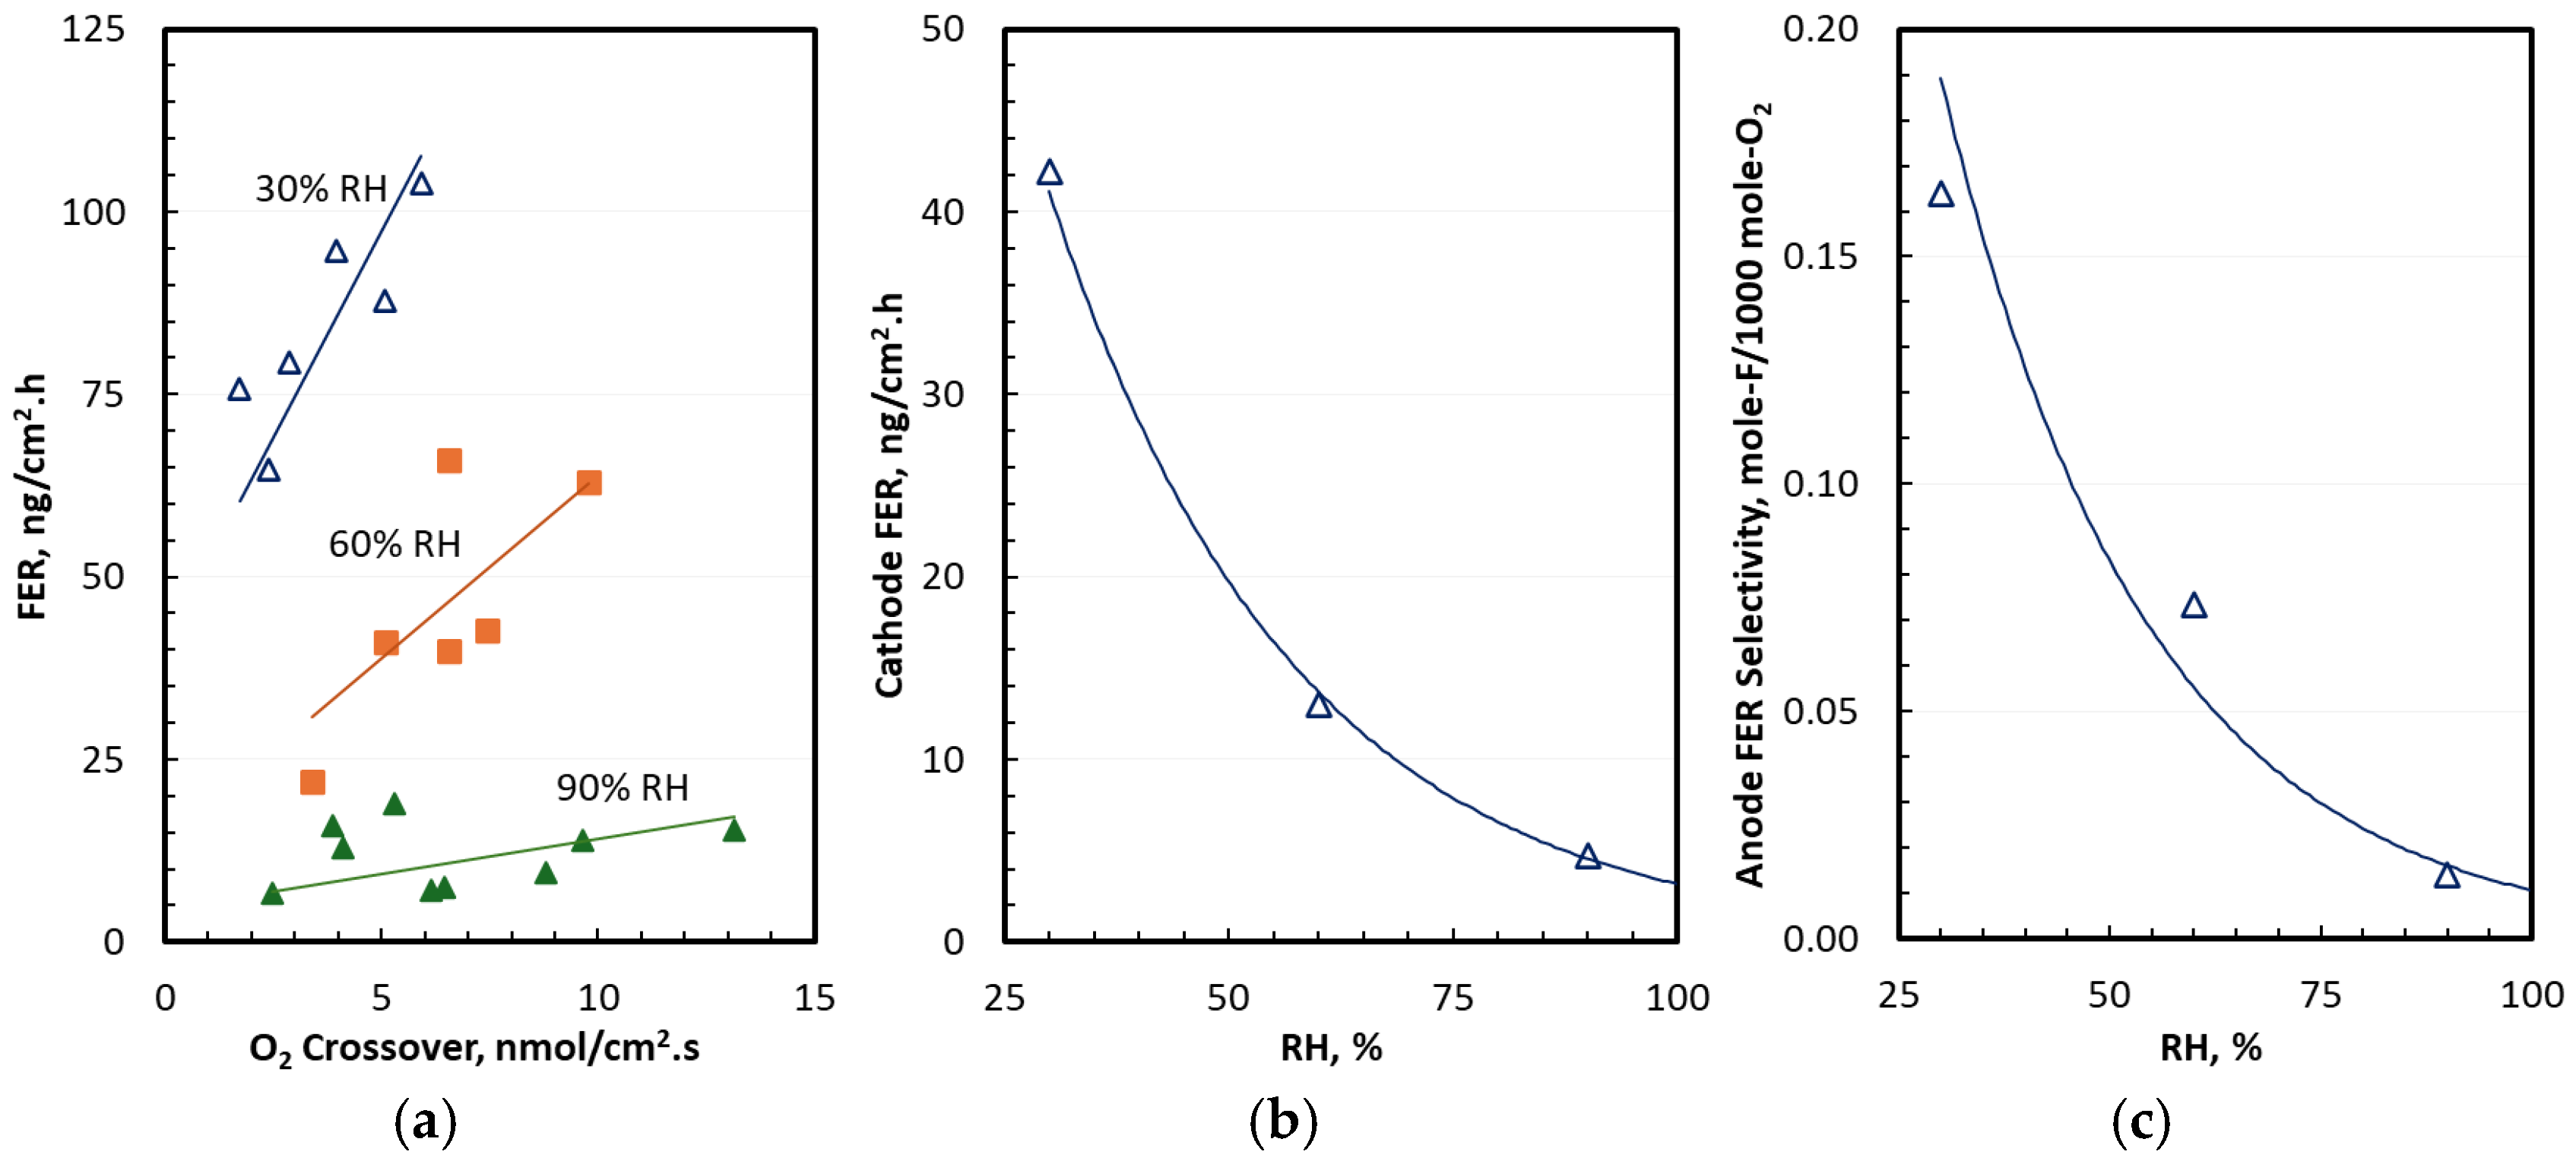
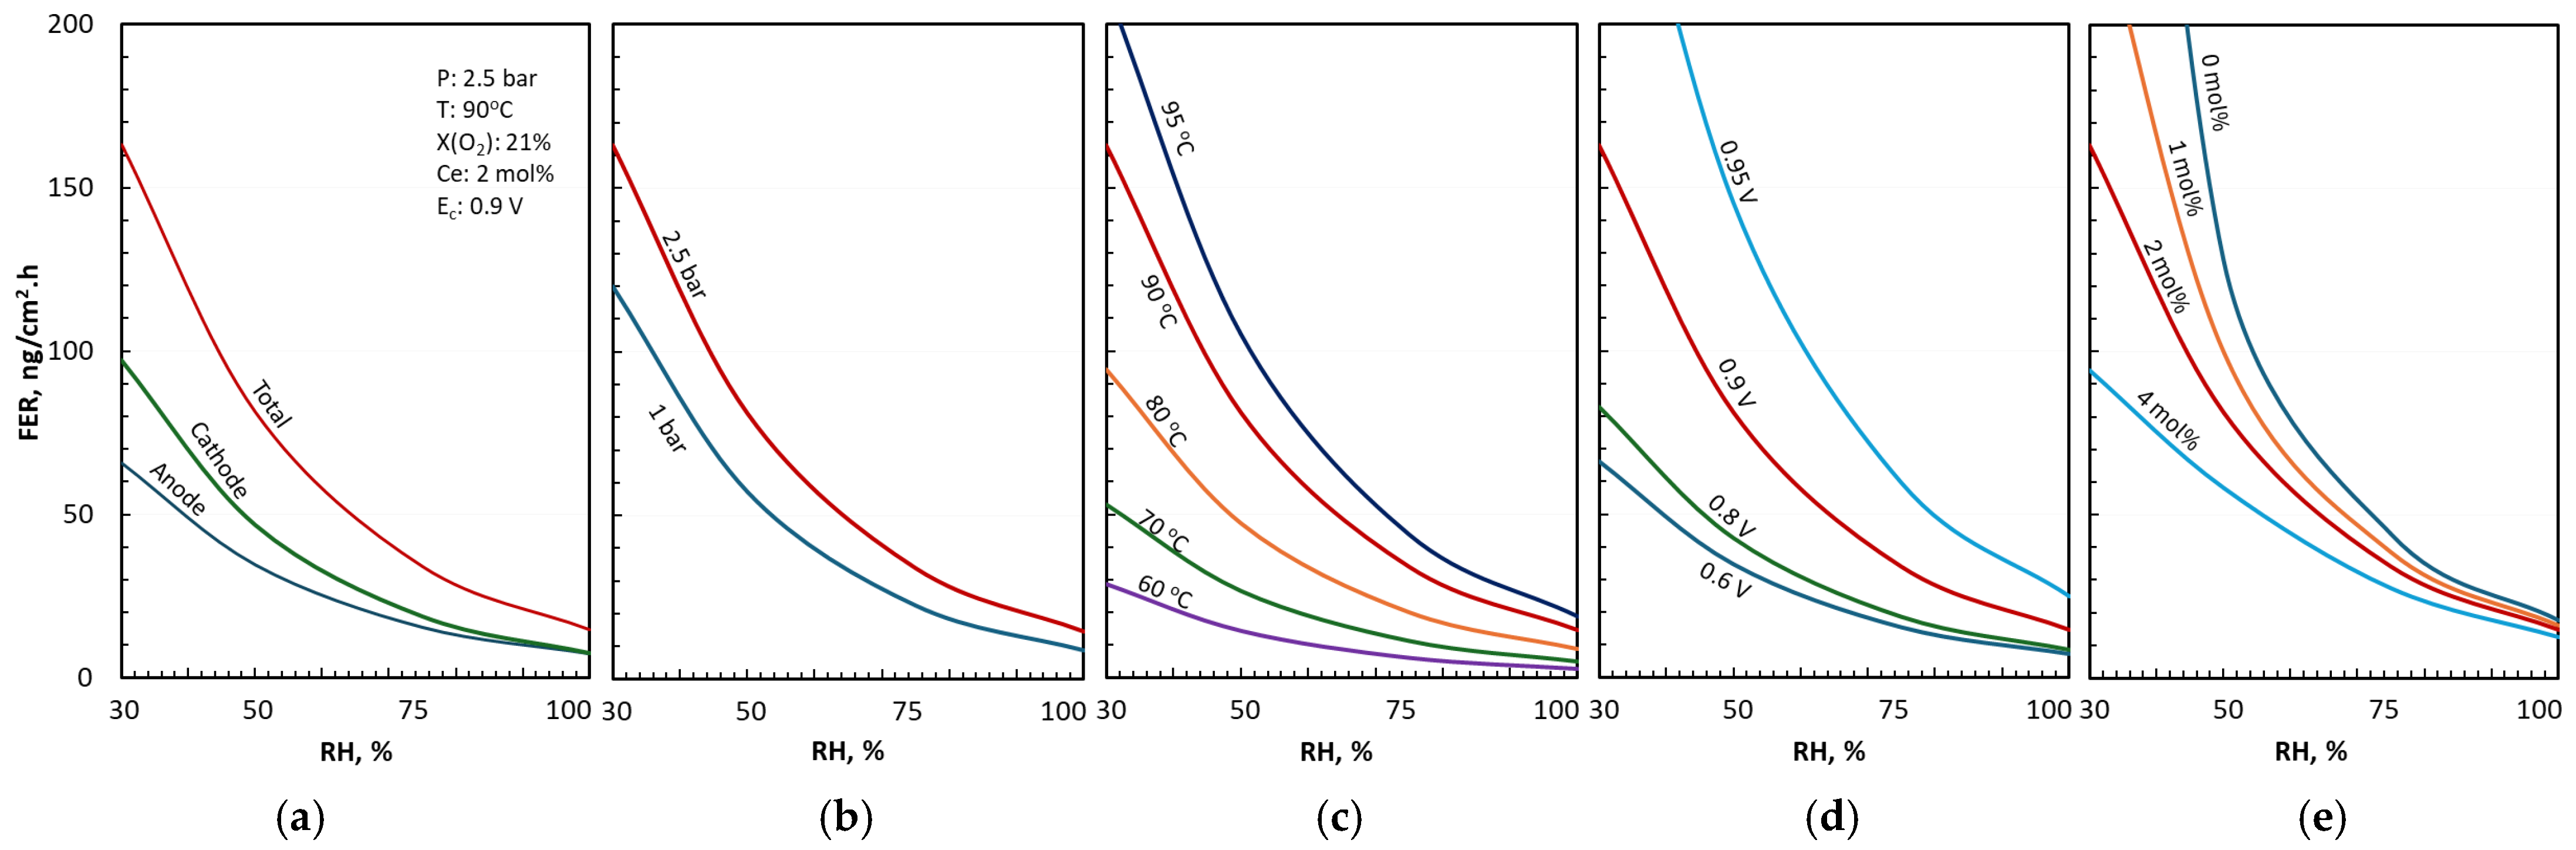
3.1. Anode and Cathode FERs

Coms et al. obtained 27 data points for FERs at OCV for different combinations of membrane thickness (8, 12, and 20 µm thicknesses), relative humidity (30%, 60%, 90%), cathode pressure (150 kPa, 200 kPa, 250 kPa), and differential pressure between anode and cathode (−20 kPa, +20 kPa, +60 kPa) [43]. We digitized the measured total (anode plus cathode) FERs that were reported as discrete data points, plotted in terms of single variables: RH, membrane thickness, cathode pressure, and anode pressure. We were able to pair the digitized data with reasonable certainty and extract the complete information for FERs in terms of all four experimental variables for each data point. Figure 2a presents the digitized FER as a function of the O2 crossover ( N ˙ O 2 ) that is known to depend on T, water uptake, membrane EW, P O 2 , and δ m .
N ˙ O 2 = ψ O 2 P O 2 δ m
Figure 2a includes least-square linear fits of FER ( r ˙ F ) at 30%, 60%, and 90% RH, in which the x-intercept represents the cathode FER ( r ˙ F c ) and the slope is a measure of the anode FER selectivity ( S F ), i.e., moles of fluorine produced per mole of O2 crossover to anode. The choice of intercepts (i.e., r ˙ F c ) was constrained by the measured cathode FERs of 4.6 ng/cm2·h at 90% RH for a 20-µm membrane at 210 kPa anode and 150 kPa cathode pressure, and 44.3 ng/cm2·h at 30% RH for a 12-µm membrane at 220 kPa anode and 200 kPa cathode pressure. Most data points are within 1 standard deviation of 9, 9.8, and 4.8 ng/cm2·h at 30%, 60%, and 90% RH, respectively. The mean errors are 10% for 30% RH, 24% for 60% RH, and 39% for 90% RH.
r ˙ F = r ˙ F c + r ˙ F a
r ˙ F a = N ˙ O 2 S F M F
Figure 2b presents the derived and modeled cathode FER as a function of RH. The derived r ˙ F c is well correlated with an exponential function considering that R2 is 99.91%, the standard deviation is 0.75 ng/cm2·h, and the mean error is 3.9%. We also investigated the possible relationship between cathode FER and H2 crossover from anode ( N ˙ H 2 ) by plotting r ˙ F c   = r ˙ F r ˙ F a against N ˙ H 2 and found no correlation between them.
N ˙ H 2 = ψ H 2 P H 2 δ m
Figure 2c presents the derived anode FER selectivity as a function of RH and shows that S F decreases from 0.19 mol-F/1000 mol-O2 at 30% RH to 0.01 mol-F/1000 mol-O2 at 90% RH. The derived S F is fairly well correlated with an exponential function considering that R2 is 96.52%, the standard deviation is 0.018 mol-F/1000 mol-O2, and the mean error is 20%. H2O2 produced from the parasitic 2-electron ORR of proton–electron couples and crossover O2 is the likely source of anode FER since experiments on rotating ring disk electrodes (RRDE) exhibit a high yield of peroxide at anode potentials [49]. The cathode FER may be linked to the energetic formation of reactive hydroxyl radicals (·OH) from the decomposition of H2O2 produced as an intermediate in the 2-electron ORR pathway at high cathode potentials. Production of radicals is also catalyzed by metal contaminants through the Fenton reaction.
O 2 + 2 H + + 2 e     H 2 O 2
H 2 O 2 + 2 H + + 2 e     2   H 2 O  
H 2 O 2     OH + OH
Figure 3a is a parity plot of modeled and measured FER for the 24 data points that could be digitized and paired with reasonable accuracy. The coefficient of determination (R2) from a statistical analysis is 91.7%, and the standard deviation is 12.3 ng/cm2·h or 23.5%. The mean errors are 11%, 18%, and 37% for 30%, 60%, and 90% RH, respectively.
Figure 3b is a parity plot showing results from a regression analysis for the same 24 data points assuming that r ˙ F is only a function of RH. With this assumption, R2 is smaller: 71.93%; the standard deviation is larger: 22.6 ng/cm2·h or 43.2%; and the mean errors are much larger: 33%, 31%, and 39% for 30%, 60%, and 90% RH, respectively. Coms’ analysis with all 27 data points shows a reported R2 of 82.30% for RH-only and 85.31% for combined RH and ΔP regression [43].

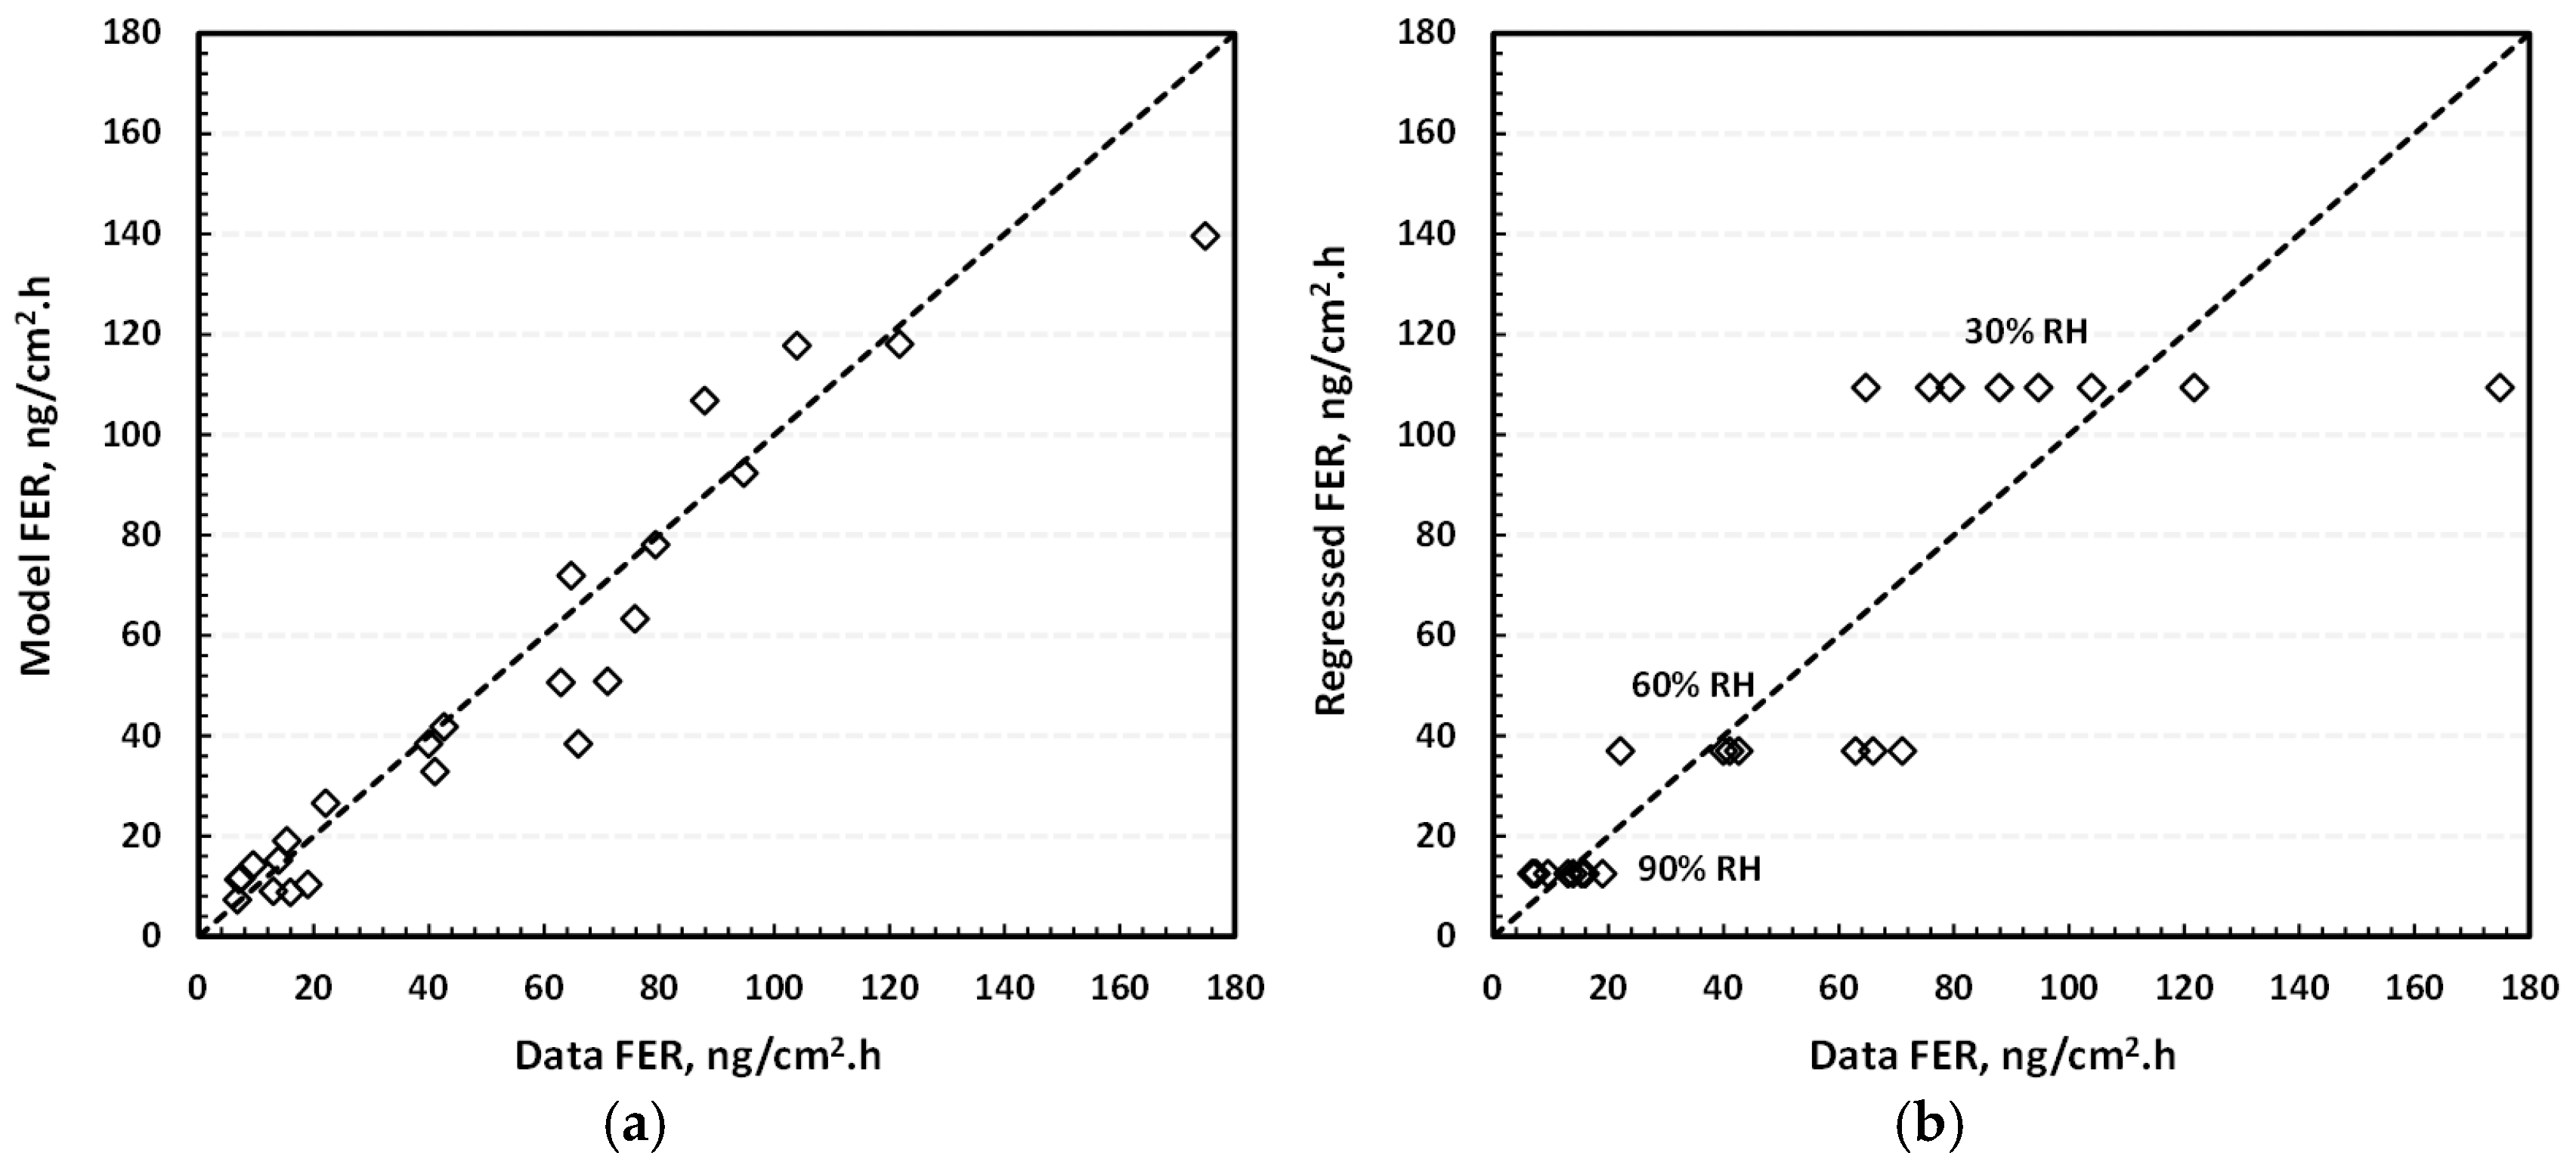
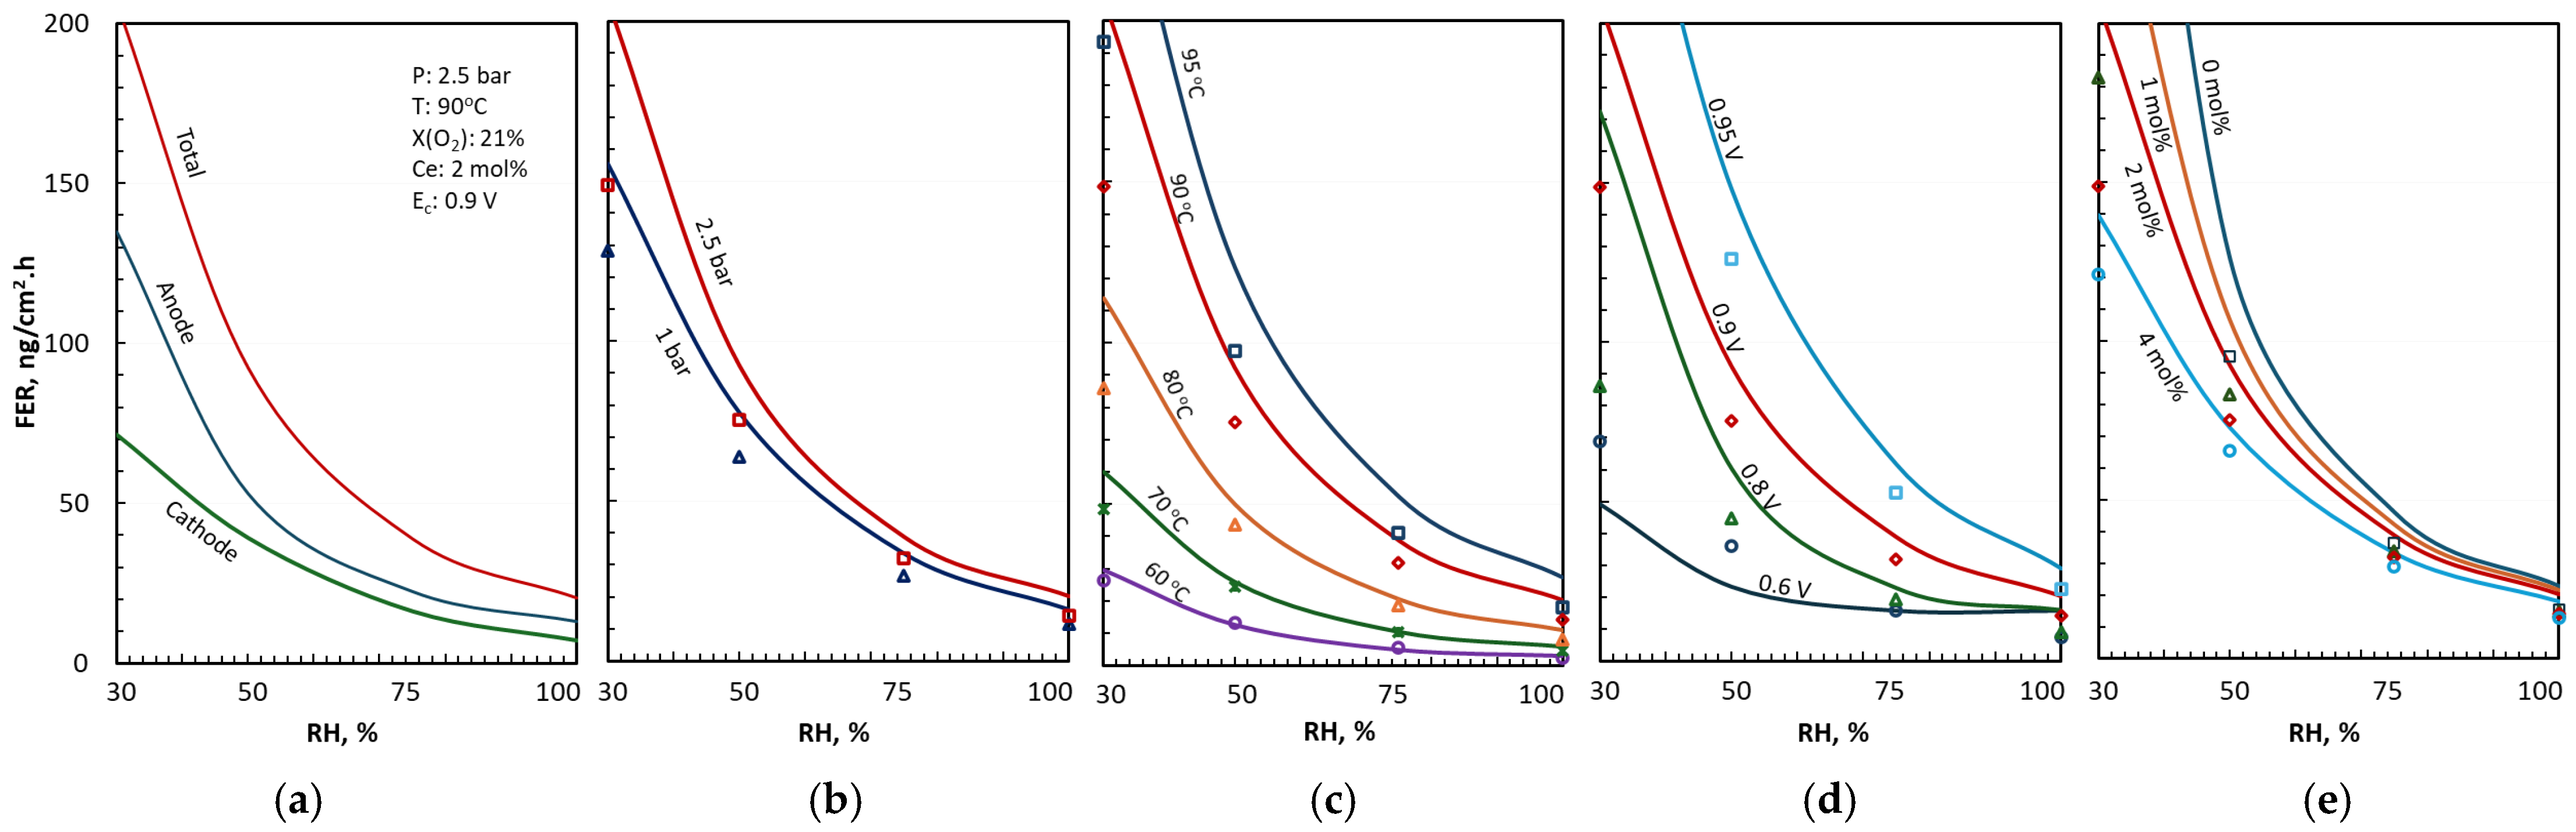
3.2. FER Correlation

We developed separate correlations for anode and cathode FER by combining the data in Figure 1 and Figure 2, and assuming that r ˙ F c is a function of the cathode potential ( E c ), but, because HOR is facile and the anode overpotentials are small, the anode potential generally remains below 10 mV vs. SHE under all conditions, so the potential dependence of r ˙ F a can be neglected.
Both r ˙ F c and r ˙ F a are functions of the water activity in membrane ( a m ), Ce loading ( C C e ), and temperature ( T ). Following Chandesris [21], the equivalent transfer coefficient ( α F ) for the dependence of r ˙ F c on cathode potential is assigned a value of 0.54, which translates into a factor of 5 increase in FER if the cathode potential is raised to 0.95 V from 0.85 V (see Figure 4a).
r ˙ F c = A c ( a m ) χ c ( a m , C C e ) e H c R 1 T r 1 T e α F F R T ( E c E r )
A c a m = A c 0 e β c a m
S F = A a ( a m ) χ a ( a m , C C e ) e H a R 1 T r 1 T
A a a m = A a 0 e β a a m
Figure 4a presents the effect of temperature on the measured anode, cathode, and total FER from which we derive apparent activation energies for temperature dependence at 0.9 V of 99 kJ/mol for r ˙ F a and 71 kJ/mol for r ˙ F c . Table 1 lists the actual values of H c and H a from Equations (33) and (35). It also includes the coefficients, β a and β c , that determine the effect of water activity on r ˙ F c and r ˙ F a as derived from the modeled curves in Figure 2b,c.
The effect of Ce on FER is incorporated by analyzing the peroxide data in Figure 1c, which indicates that Ce3+ mitigates the effect of H2O2 vapor, especially under dry conditions. As suggested by Coms, the hydroxyl radical (∙OH) produced from H2O2 decomposition is responsible for abstracting hydrogen atoms by unzipping PFSA chains and releasing fluoride at a rate that depends on temperature, RH, and anti-oxidant loading in a stabilized membrane [43]. Scission of a polymer chain in an unmitigated membrane can also occur, but it does not directly release fluoride; however, the scission rate can be measured by FTIR. We built an empirical function using data in Figure 1c to capture the effect of Ce loading and RH on relative FER from a 12-µm membrane. The function is valid from 0 to 4 mol% Ce and 30% to 100% RH:
χ c a m , C C e = χ a a m , C C e = χ 0 ( a m ) C C e + C 0 ( a m )
χ 0 ( a m ) = 32.49 a m 5.82
C 0 a m = 16.46 a m 3.68
= l n ( χ 0 ) l n ( 2 + C 0 )
Figure 4c shows that adding a small amount of Ce to an unmitigated membrane can significantly reduce FER under dry conditions, and the benefit is progressively smaller at higher Ce loading and under wet conditions.
A single-variable sensitivity analysis was conducted to illustrate the effect of the operating and design variables on FER correlation. The baseline conditions are 2.5 bar, 90 °C, 21 mol% O2, 0.9 V cathode potential, 2 mol% Ce loading, and other MEA characteristics listed in Table 1. Figure 5a indicates that at 0.9 V cathode potential, the anode and cathode FERs are nearly equal at 100% RH, but the cathode FER is about 50% larger at 30% RH. Raising the operating pressure in Figure 5b increases FER because of the higher oxygen crossover and hence, the anode FER. Figure 5c shows that FER is extremely sensitive to temperature, especially under drier conditions, and increases ten-fold on raising the temperature from 60 °C to 95 °C. Figure 5d points to a similar sensitivity of FER to cathode potentials above 0.8 V; note that the cathode potential only affects r ˙ F c and not r ˙ F a . Figure 5e confirms that Ce3+ is more effective in mitigating FER under dry conditions than under wet conditions. We conclude that FER is extremely sensitive to RH, T, E c , and cerium loading, and prolonged excursions near OCV and high T under dry conditions accelerate chemical degradation of the membrane.

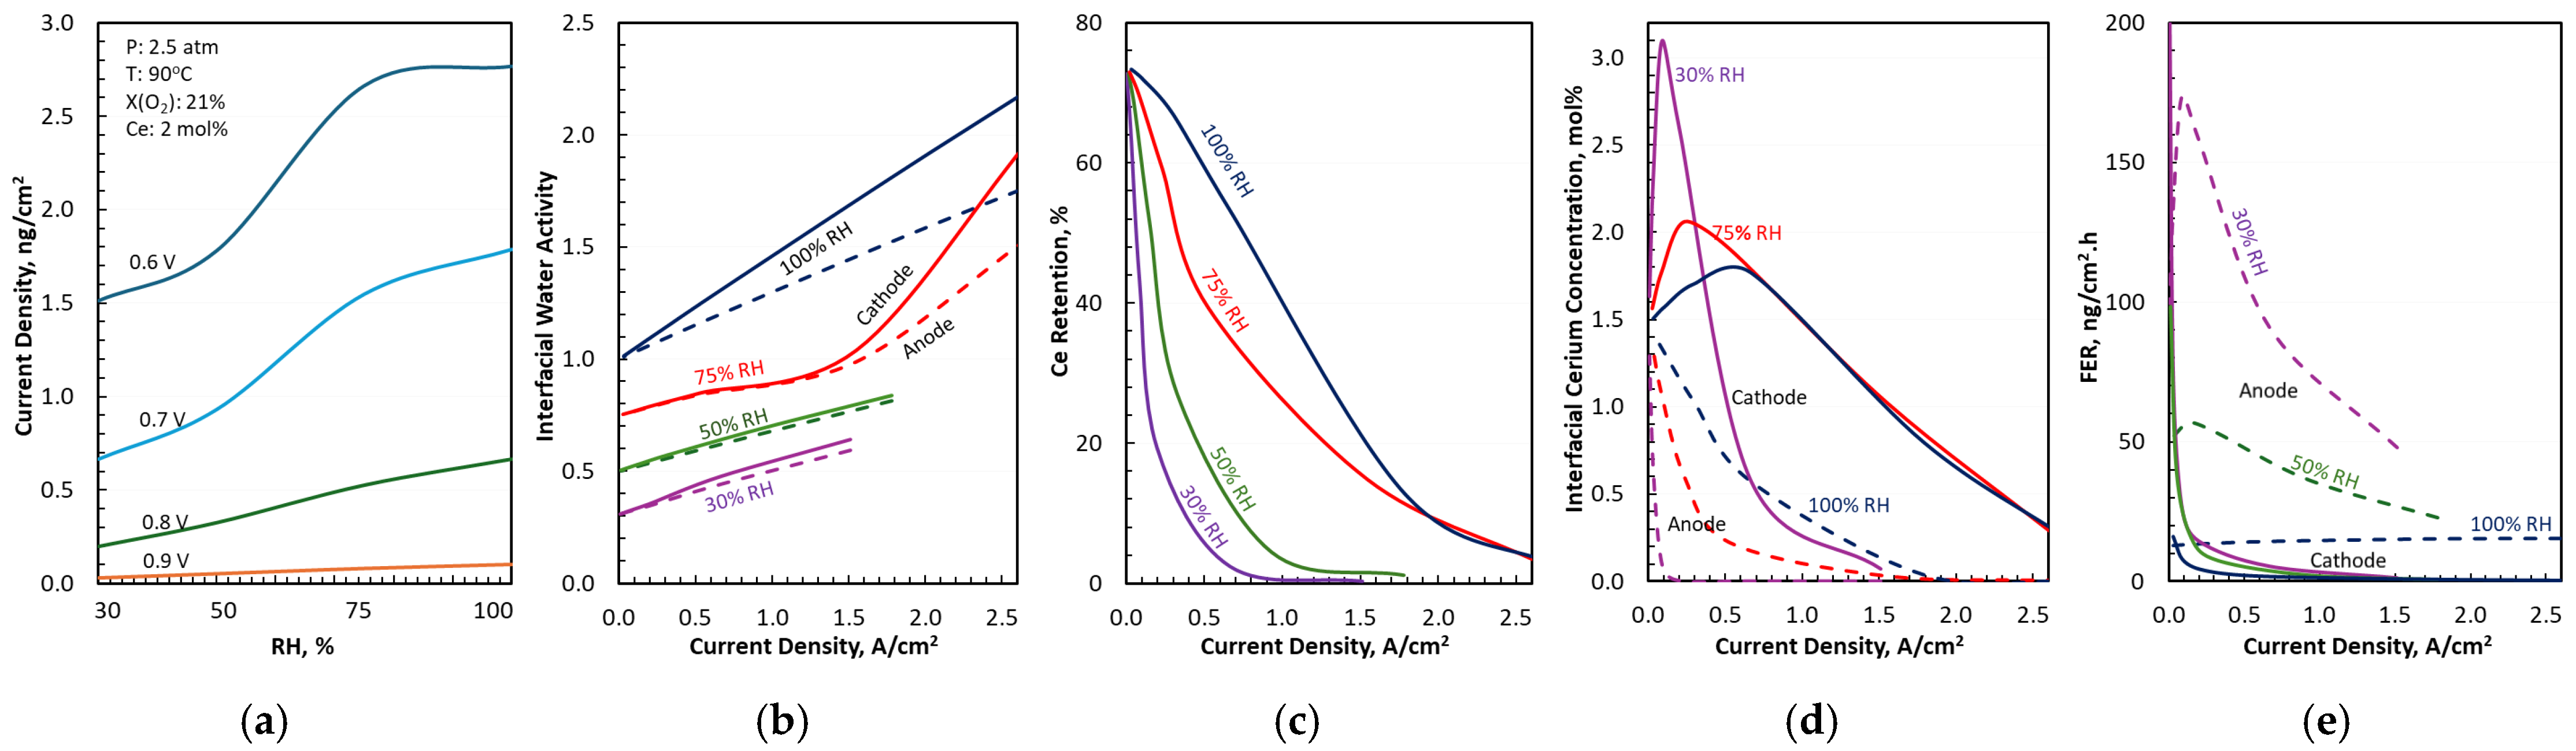
3.3. Water and Cerium Transport in Differential Cells

Gradients in water activity and cerium concentration develop in operating cells that affect FER. We used our models to characterize these gradients under the same baseline conditions as in Figure 5, except that the cell voltage is treated as a variable.
Figure 6a depicts the modeled relationship between the cell voltage and current density as a function of RH in the gas channel. At the lowest cell voltage of interest in this study, 0.6 V, the current density varies between 1.5 A/cm2 at 30% RH and 2.7 A/cm2 at 100% RH. Figure 6b presents the resulting gradients in interfacial activity due to water production in the cathode, electroosmotic drag that transports water from the anode to the cathode, and diffusion in the membrane. The higher the current density, the larger the differential between the activities at cathode and anode interfaces and between the gas channel and the membrane interfaces.
Figure 6c presents the modeled steady-state Ce retention, defined as the fraction of total Ce loading remaining in the membrane under applied potential. At OCV, diffusion redistributes cerium equally between the membrane, anode, and cathode, and limits the retention in the membrane to <72%. As voltage is applied, Ce is also transported by electromigration with flux proportional to the potential gradient ( E i / y ) and, therefore, the current density ( i i / σ i ), and Ce retention is determined by the balance between electromigration and diffusion. The higher the current density, the lower the retention, which drops to <20% at 0.6 V (1.5–2.5 A/cm2). For a given current density, Ce diffusivity decreases faster at lower RH than electromobility, and Ce retention decreases, becoming <5% at 1.5 A/cm2 for RH < 50%.
Figure 6d portrays the dynamics of cerium migration. Under applied potential, Ce depletes in the anode and segregates at the cathode–membrane interface at low current density before accumulating in the cathode at higher current density. Under drier conditions, Ce depletes to a greater extent at the anode interface, and segregates more at low current density and depletes more at high current density at the cathode interface.
Figure 6e presents FER calculated using interfacial water activity and Ce concentration in Figure 5b,d. Only near OCV is FER higher at the cathode than the anode. The cross-over cell voltage at which anode FER exceeds cathode FER depends on the RH in the gas channel: 907 mV at 30% RH and 925 mV at 100% RH. At lower cell voltage (i.e., higher current density), higher water activity at the cathode interface suppresses cathode FER, and Ce depletion at the anode interface accelerates anode FER.

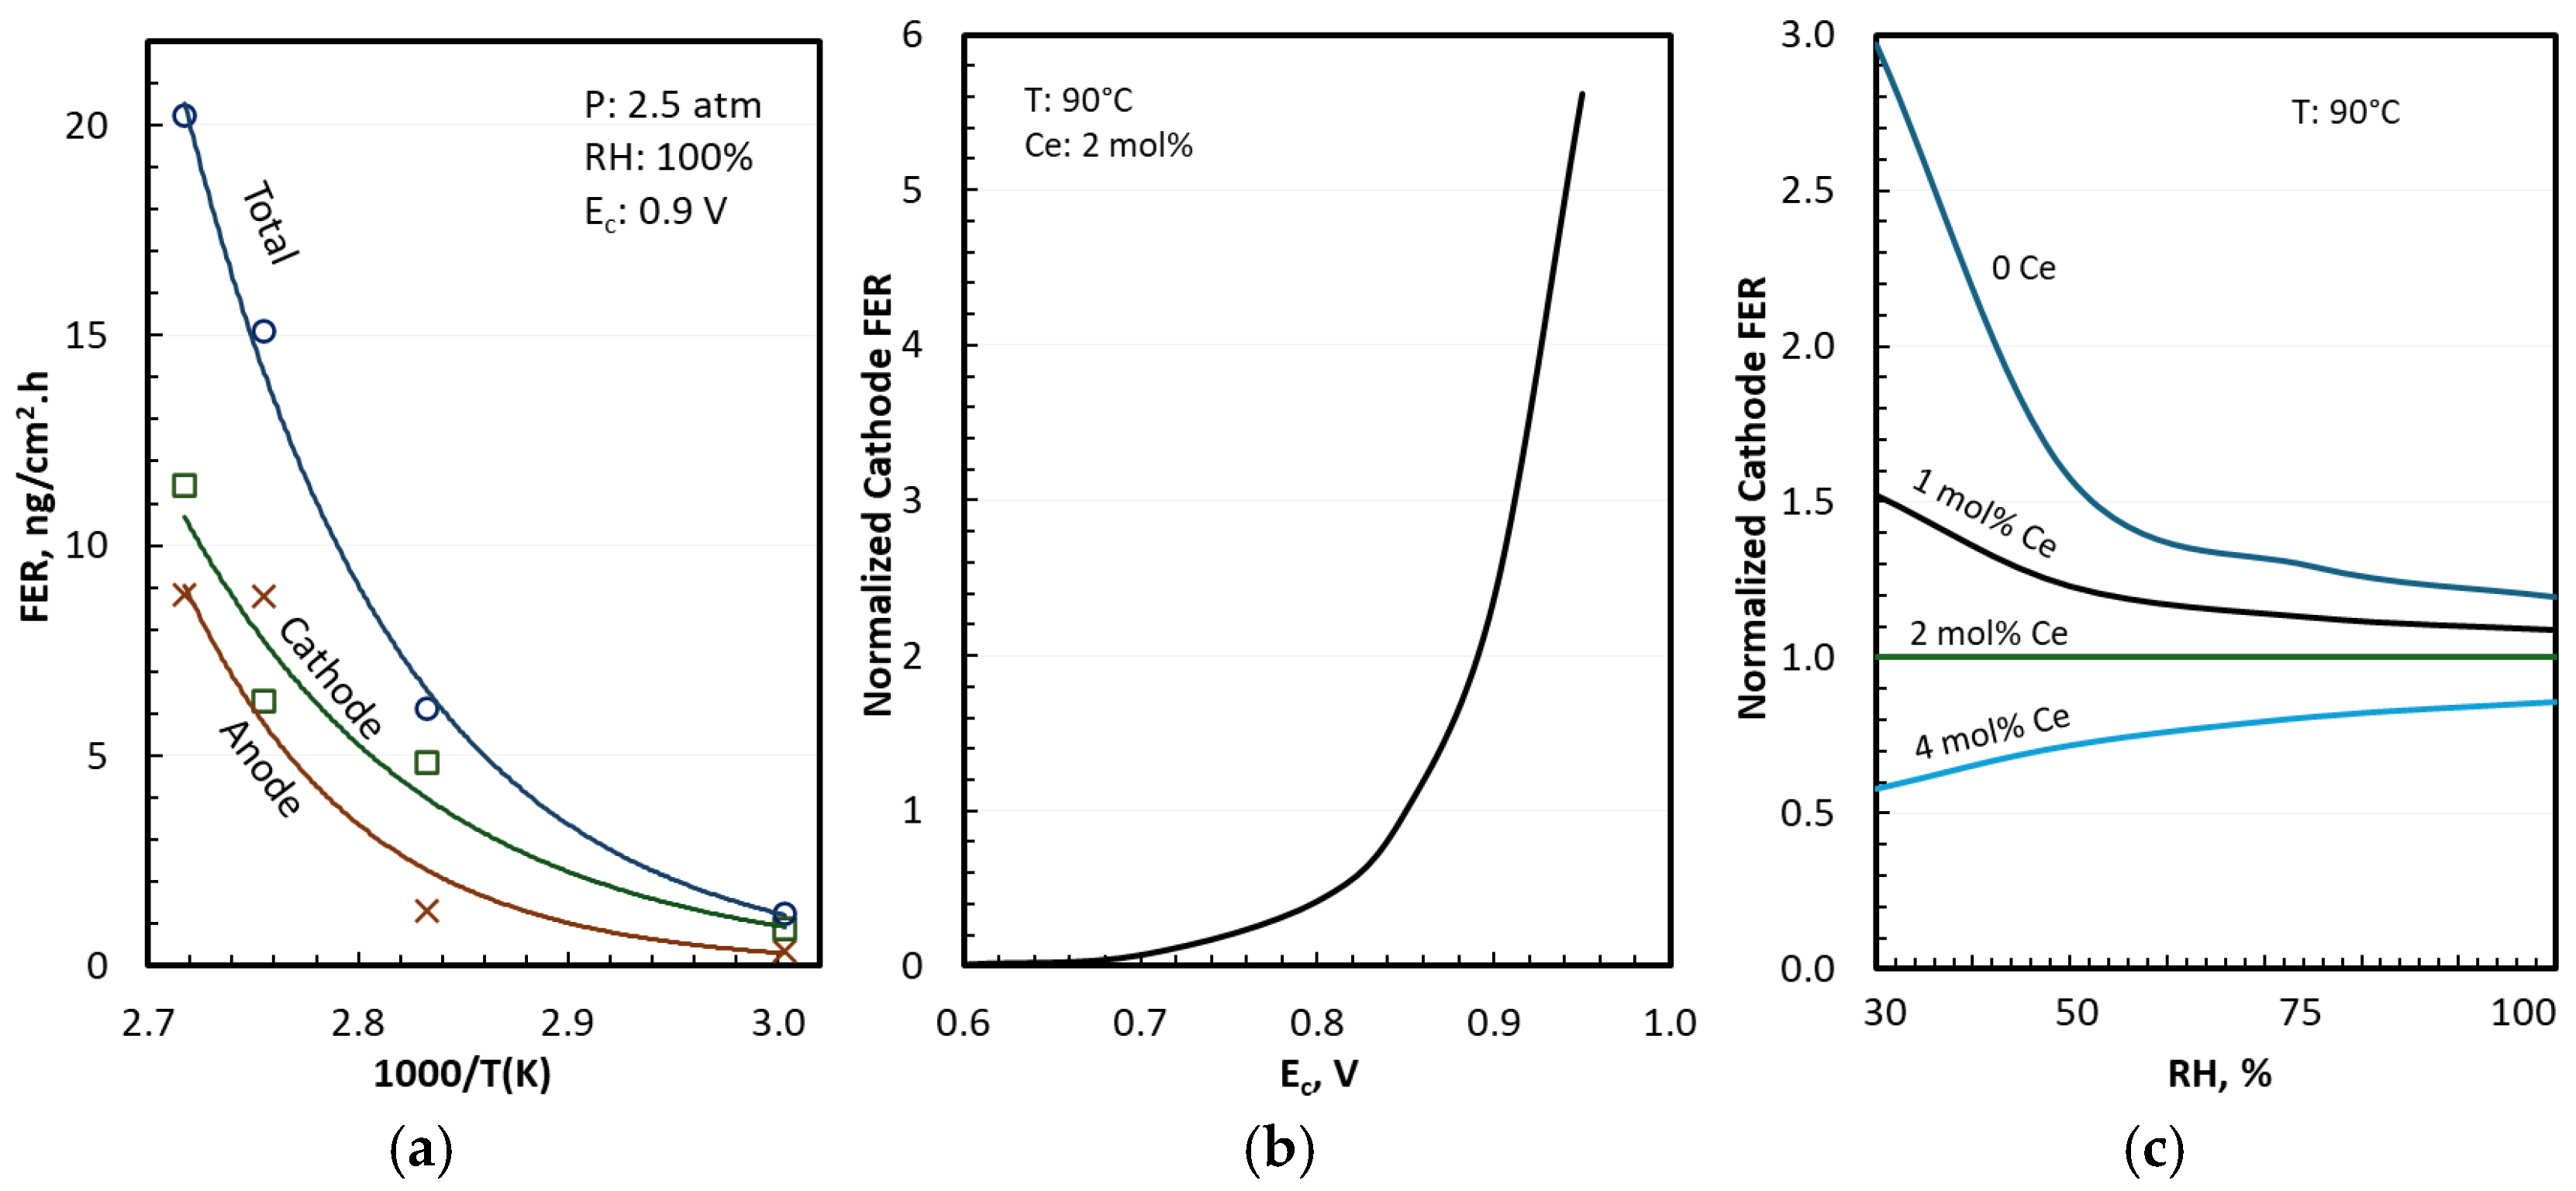
3.4. FER in Differential Cells
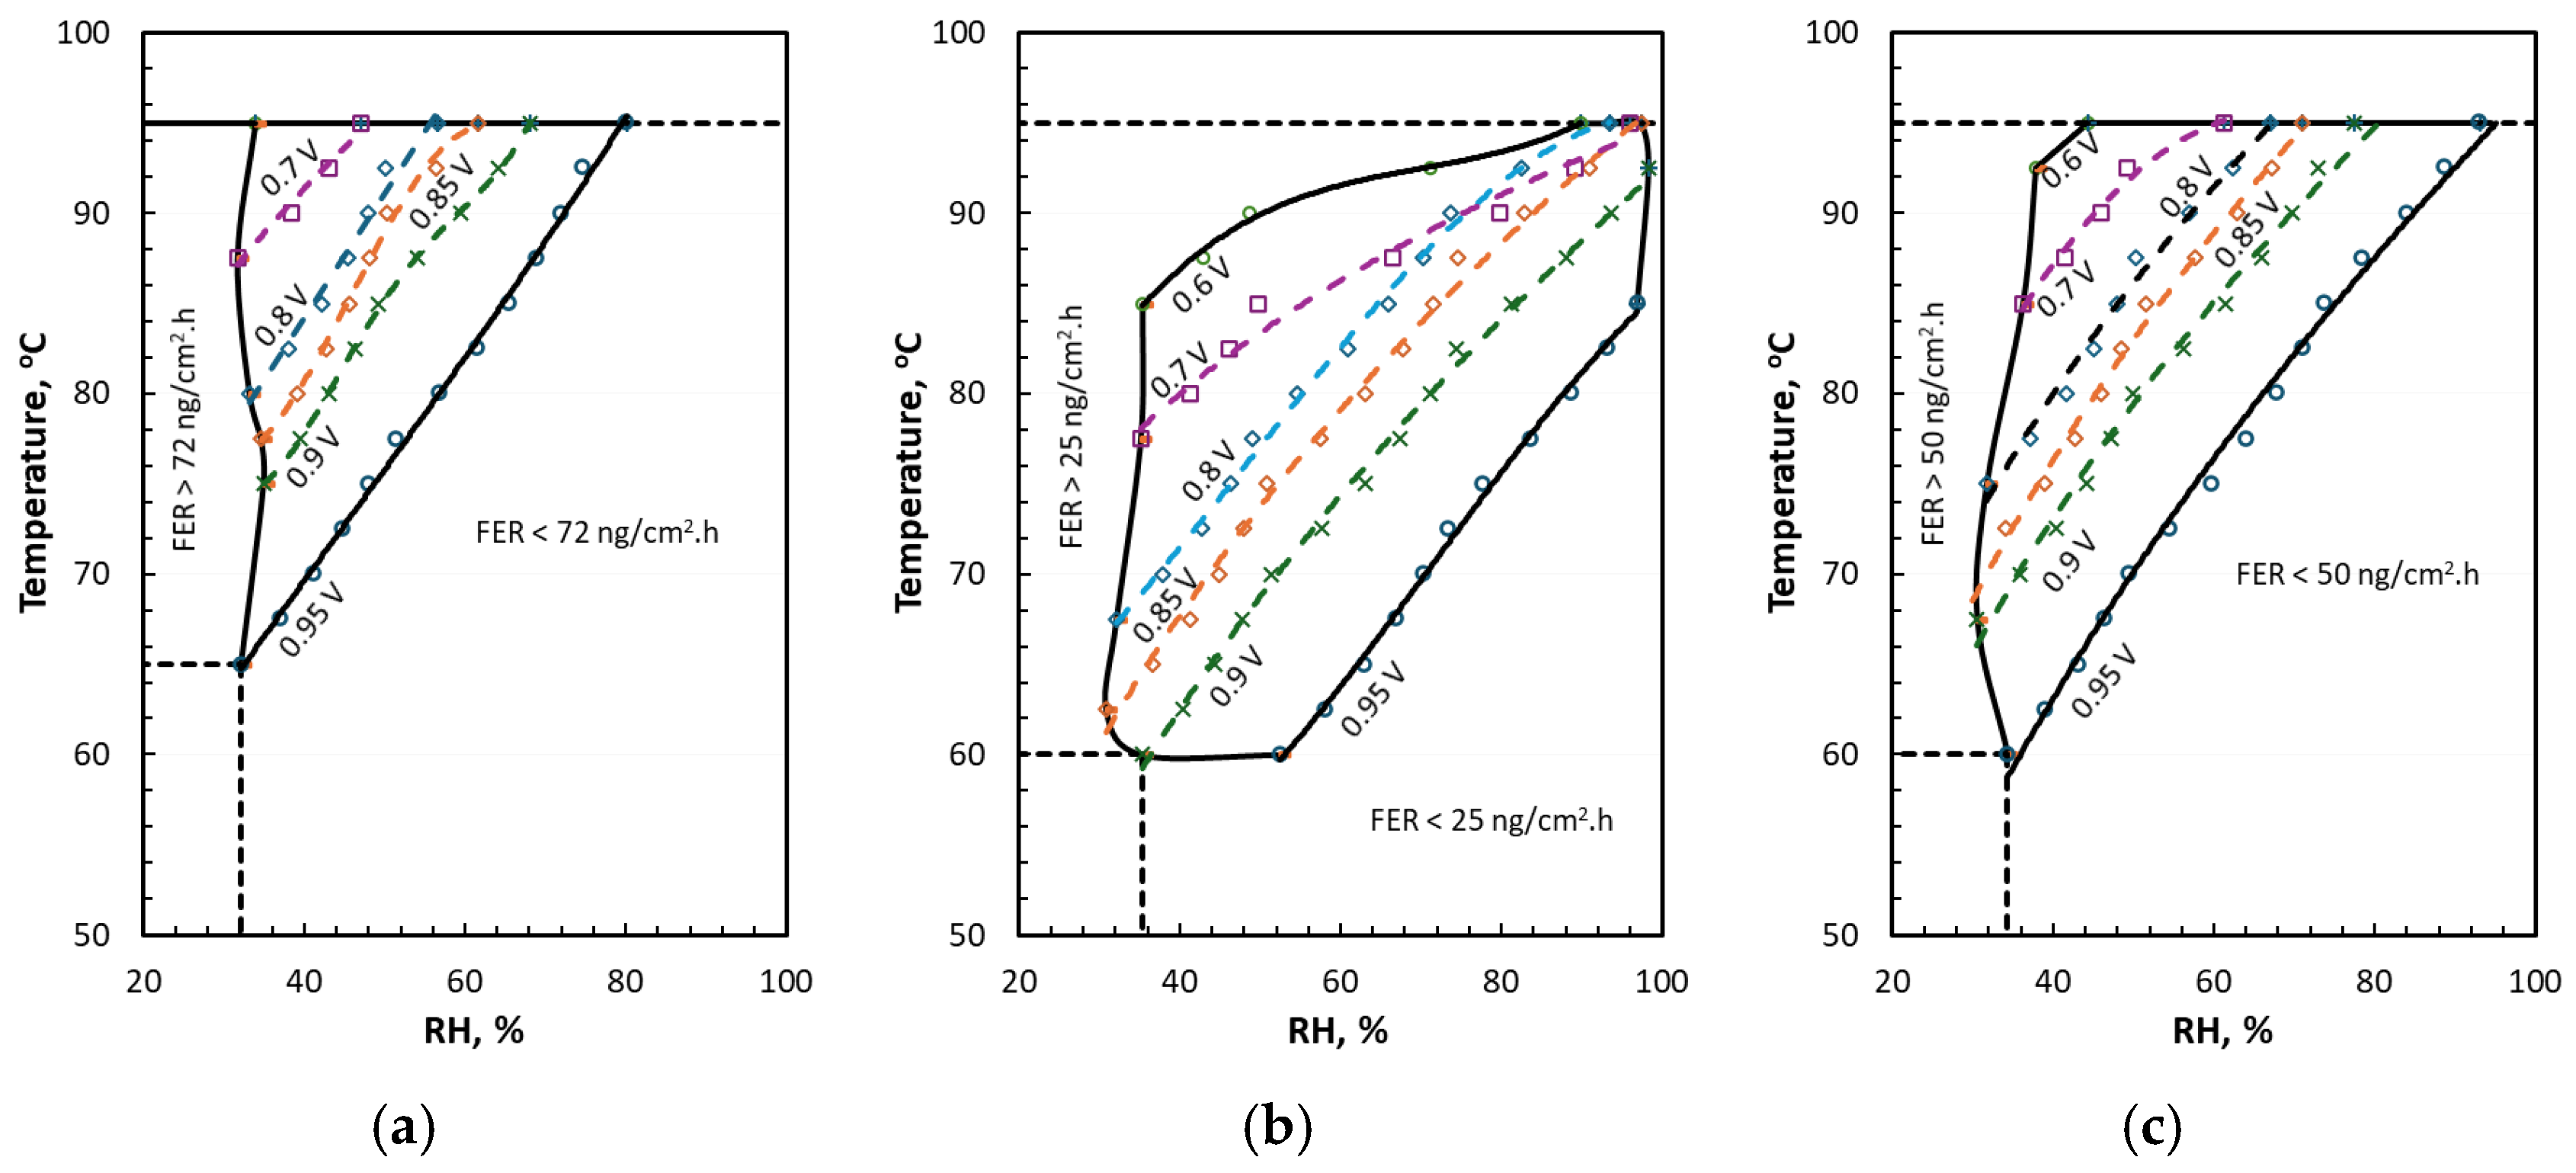
Figure 7 summarizes results from a single-variable sensitivity analysis conducted to quantify the effects of activity and Ce gradients on FER. The solid lines in Figure 7 are FERs with gradients, and the symbols are FERs at the same cathode potentials but without gradients.
Figure 7a indicates that the anode FER is comparable to but higher than the cathode FER at 0.9 V and other baseline conditions listed in the legend. As seen previously in Figure 6e, the difference between anode and cathode FERs grows at lower cell voltages. Cathode FER is higher than the anode FER for cell voltages above a threshold, 925 mV at 2.5 bar and for pressures below 2 bar at 0.9 V.
The main message from the sensitivity analysis Is that the gradients In Ce concentration generally accelerate FER at lower RH (Figure 7b–e), higher pressures (Figure 7b), higher temperatures (Figure 7c), lower cell voltages (Figure 7d), and lower Ce loading in the membrane (Figure 7e). Increased interfacial water activity at higher current density tends to offset or even reverse the effect of Ce segregation, as manifested in lower FER at 0.6 V in Figure 7d.

4. Discussion

For a perspective on results obtained in this study, we calculate average FER for membrane failure by chemical degradation within 25,000 h. The actual membrane lifetime may be further limited by synergistic mechanical stresses and manufacturing defects [51]. We postulate three scenarios and refer to them as theoretical failure limit (TFL), safe limit (SL), and design limit (DL). TFL identifies absolute membrane failure by hole formation and corresponds to 100% cumulative fluoride release (CFR) in 25,000 h. In this limit, the average FER is 72 ng/cm2·h for a 12-µm membrane with 75% fluorine content, as in a (CF2)m polymer chain (excluding the PTFE reinforcement). The average FER in SL is 25 ng/cm2·h corresponding to 33% CFR in 25,000 h and was selected to coincide with the results from TEM analysis of specimens exposed to the combined catalyst–membrane AST. DL is a compromise between TFL and SL, with an average FER of 50 ng/cm2·h corresponding to 70% CFR in 25,000 h. It may be regarded as a 50% probability of H2 crossover failure by chemical degradation of membrane.
Figure 8 presents stability maps for TFL, SL, and DL over a range of 60 to 95 °C temperature, 30 to 100% RH, and 0.6 to 0.95 V cell voltage. Each iso-potential line in Figure 8 represents combinations of RH and temperature at a specified cell voltage for which the FER equals the average that defines the failure limit. All operating points below and to the right of an iso-potential line have an average FER below the failure limit and are deemed safe, i.e., have a membrane lifetime >25,000 h. All operating points above and to the left of an iso-potential line have an average FER exceeding the failure limit and are deemed unsafe, i.e., have a membrane lifetime <25,000 h. As expected, the operating conditions are less restrictive at lower cell voltages. For example, the two DL end points are 60 °C, 34% RH and 95 °C, 90% RH for 0.95 V iso-potential line, and these relax to 85 °C, 34% RH and 95 °C, 60% RH for 0.7 V iso-potential line.

5. Conclusions

The main conclusion of this study is that the chemical stability of PFSA membranes can be characterized by fluoride emission due to attacks by radicals such as OH produced from decomposition of H2O2 that forms on the anode by reaction between H2 and crossover O2 and on the cathode as an intermediate in the 2-electron ORR pathway. Thus, the anode FER depends on N ˙ O 2 and the cathode FER is not related to N ˙ H 2 but depends on the cathode potential. Both anode and cathode FERs are significantly enhanced at low relative humidity and are strongly influenced by the gradients in water activity and cerium concentration that develop in operating fuel cells. The cathode FER exceeds anode FER at potentials near open circuit voltage, and vice versa at lower cell voltages.
The following are some prospective areas of research that may be worthy of future investigations:
(a)
Cerium mobility, water transport, and FER under dynamically varying loads representative of duty cycles for different applications
(b)
Effect of Fe impurities on FER from Ce-doped membranes
(c)
Experimental measurements of anode and cathode FERs in operating cells at 0.6–0.85 V and 60–80 °C
(d)
Relationship between cumulative fluoride emission and membrane failure mode
(e)
Development of accelerated stress tests that can simulate membrane failure in a reasonable time without altering the degradation mechanism
(f)
Synergism between mechanical stresses and chemical degradation
(g)
Enhanced membrane stability by immobilization of cerium
(h)
Ionomer stability and its effect on ORR catalyst activity

Author Contributions

Conceptualization, R.A.; methodology, R.A. and R.M.; software, R.A., L.R.J. and X.W. (Xiaohua Wang); validation, R.A., L.R.J., C.Q. and X.W. (Xiaojing Wang); formal analysis, R.A., L.R.J. and X.W. (Xiaohua Wang); investigation, R.A., L.R.J., X.W. (Xiaohua Wang), C.Q. and X.W. (Xiaojing Wang); resources, R.A.; data curation, R.A., L.R.J. and X.W. (Xiaohua Wang); writing—original draft preparation, R.A. and L.R.J.; writing—review and editing, R.A., L.R.J. and X.W. (Xiaohua Wang); visualization, R.A. and X.W. (Xiaohua Wang); supervision, R.A.; project administration, R.A.; funding acquisition, R.A. All authors have read and agreed to the published version of the manuscript.

Funding

This work was supported by the Hydrogen and Fuel Cell Technologies Office (HFTO), Office of Energy Efficiency and Renewable Energy, U.S. Department of Energy (DOE) through the Million Mile Fuel Cell Truck (M2FCT) consortia, technology managers G. Kleen and D. Papageorgopoulos. Argonne National Laboratory is managed for the U.S. Department of Energy by the University of Chicago Argonne, LLC, also under contract DE-AC-02-06CH11357. The views expressed in the article do not necessarily represent the views of the DOE or the U.S. Government. The U.S. Government retains and the publisher, by accepting the article for publication, acknowledges that the U.S. Government retains a nonexclusive, paid-up, irrevocable, worldwide license to publish or reproduce the published form of this work, or allow others to do so, for U.S. Government purposes.

Institutional Review Board Statement

Not applicable.

Informed Consent Statement

Not applicable.

Data Availability Statement

Our data presented in Figure 1a and Figure 4a will be made available upon request.

Acknowledgments

The authors thank S. Kumaraguru of General Motors for supplying the MEA specimens tested in this study and Tanya Agarwal of Los Alamos National Laboratory, and Ramchandra Gawas and Ali A. Sadhakkathullahil of Lawrence Berkeley National Laboratory for their help with the ion exchange chromatography analysis of water samples.

Conflicts of Interest

The authors declare no conflicts of interest. The funders had no role in the design of the study; in the collection, analyses, or interpretation of data; in the writing of the manuscript; or in the decision to publish the results.

Nomenclature

a activity
D diffusivity
F Faraday constant or fluorine
i current density (A/cm2)
M molecular or equivalent weight
N ˙ crossover flux
r ˙ F fluoride release rate
S F selectivity
T temperature
y through-plane
εvoid volume fraction
ηoverpotential
ω H for θ
σconductivity
j current density (A/cm3)
P pressure
R gas constant
S saturation
S P t specific Pt area ( m P t 2 / m 3 )
u mobility
δthickness
ε m ionomer volume fraction
θoxygen coverage
ρdensity
ψpermeability
ASTAccelerated stress test
CFLCumulative fluoride release
DLDesign limit
EWEquivalent weight
FERFluoride emission rate
FTIRFourier transform infrared spectroscopy
GrVGraphitized Vulcan
HORHydrogen oxidation reaction
I/CIonomer to carbon ratio
MEAMembrane electrode assembly
OCVOpen circuit voltage
ORROxygen reduction reaction
PEMFCPolymer electrolyte membrane fuel cell
PFSAPerfluorosulfonic acid
PTFEPolytetrafluoroethylene (Teflon)
RRDERotating ring disk electrode
RHRelative humidity
SLSafe limit
TFLTheoretical failure limit
Subscripts and Superscripts
a anode
e effective
m ionomer or membrane
r reference
w water
c cathode
i ionic
N Nernst
s kinetic
x crossover

References

  1. Satyapal, S. Hydrogen and Fuel Cells Overview: Opportunities for Ports & Maritime Applications. In Proceedings of the H2@Ports Workshop, San Francisco, CA, USA, 10 September 2019. [Google Scholar]
  2. Ahluwalia, R.K.; Wang, X.; Star, A.G.; Papadias, D.D. Performance and Cost of Fuel Cells for Off-Road Heavy-Duty Vehicles. Int. J. Hydrogen Energy 2022, 47, 10990–11006. [Google Scholar] [CrossRef]
  3. Toyota, Kenworth Prove Fuel Cell Electric Truck Capabilities with Successful Completion of Truck Operations for ZANZEFF Project. Available online: https://pressroom.toyota.com/toyota-kenworth-prove-fuel-cell-electric-truck-capabilities-with-successful-completion-of-truck-operations-for-zanzeff-project/ (accessed on 12 June 2025).
  4. Ahluwalia, R.K.; Wang, X.; Papadias, D.D.; Star, A.G. Performance and Total Cost of Ownership of a Fuel Cell Hybrid Mining Truck. Energies 2023, 16, 286. [Google Scholar] [CrossRef]
  5. Anglo American Unveils a Prototype of the World’s Largest Hydrogen-Powered Mine Haul Truck—A Vital Step towards Reducing Carbon Emissions over Time 2022. Available online: https://www.angloamerican.com/media/press-releases/2022/06-05-2022 (accessed on 12 June 2025).
  6. Ahluwalia, R.K.; Papadias, D.; Peng, J.-K.; Krause, T.; Chan, S.; Devlin, P. Total Cost of Ownership for Line Haul, Yard Switchers and Regional Passenger Locomotives–Preliminary Results. In Proceedings of the H2@Ports Workshop, Lansing, MI, USA, 26–27 March 2019. [Google Scholar]
  7. Marcinkoski, J.; Vijayagopal, R.; Adams, J.; James, B.; Kopasz, J.; Ahluwalia, R.K. Hydrogen Class 8 Long Haul Truck Targets. DOE Advanced Truck Technologies. December 2019. Available online: https://www.hydrogen.energy.gov/pdfs/19006_hydrogen_class8_long_haul_truck_targets.pdf (accessed on 11 June 2025).
  8. Padgett, E.; Kleen, G.; Mukundan, R.; Wang, X.; Ahluwalia, R.; Papageorgopoulos, D. Development of Targets for Heavy Duty Fuel Cell Vehicles with Application-Driven System Modelling. In Proceedings of the ECS/PRIME 2020, Honolulu, HI, USA, 4–9 October 2020. [Google Scholar]
  9. Wang, X.; Hu, L.; Neyerlin, K.C.; Ahluwalia, R. Baselining Activity and Stability of ORR Catalysts and Electrodes for Proton Exchange Membrane Fuel Cells for Class-8 Heavy-Duty Applications. J. Electrochem. Soc. 2023, 170, 024503–024512. [Google Scholar] [CrossRef]
  10. Ahluwalia, R.K.; Wang, X. Performance and Durability of Hybrid Fuel Cell Systems for Class-8 Long Haul Trucks for Heavy-Duty Applications. J. Electrochem. Soc. 2024, 171, 034507–034521. [Google Scholar] [CrossRef]
  11. Ahluwalia, R.K.; Wang, X.; Chen, K.; Wang, X.; Spendelow, J.S. Performance and Durability of Heavy-Duty Fuel Cell Systems with an Advanced Ordered Intermetallic ORR Alloy Catalyst and Novel Support. J. Electrochem. Soc. 2024, 171, 114512–114523. [Google Scholar] [CrossRef]
  12. Babic, U.; Suermann, M.; Büchi, F.N.; Gubler, L.; Schmidt, T.J. Critical Review—Identifying Critical Gaps for Polymer Electrolyte Water Electrolysis Development. J. Electrochem. Soc. 2017, 164, F387. [Google Scholar] [CrossRef]
  13. Gasteiger, H.A.; Mathias, M.F. Fundamental Research and Development Challenges in Polymer Electrolyte Fuel Cell Technology. ECS Proc. Vol. 2005, 2002, 1. [Google Scholar] [CrossRef]
  14. LaConti, A.B.; Hamdan, M.; McDonald, R.C. Mechanisms of Membrane Degradation. In Handbook of Fuel Cells; Wiley: Hoboken, NJ, USA, 2010. [Google Scholar]
  15. Borup, R.; Meyers, J.; Pivovar, B.; Kim, Y.S.; Mukundan, R.; Garland, N.; Myers, D.; Wilson, M.; Garzon, F.; Wood, D.; et al. Scientific Aspects of Polymer Electrolyte Fuel Cell Durability and Degradation. Chem. Rev. 2007, 107, 3904–3951. [Google Scholar] [CrossRef]
  16. Dow Chemical Company. Nafion® Membranes: An Introduction and Overview; Dow Chemical Company: Midland, MI, USA, 1996. [Google Scholar]
  17. Kolde, J.A. Advanced Composite Polymer Electrolyte Fuel Cell Membranes. ECS Proc. Vol. 1995, 23, 193–201. [Google Scholar] [CrossRef]
  18. Penner, R.M.; Martin, C.R. Ion Transporting Composite Membranes: I. Nafion-Impregnated Gore-Tex. J. Electrochem. Soc. 1985, 132, 514–515. [Google Scholar] [CrossRef]
  19. Shah, A.A.; Ralph, T.R.; Walsh, F.C. Modeling and Simulation of the Degradation of Perfluorinated Ion-Exchange Membranes in PEM Fuel Cells. J. Electrochem. Soc. 2009, 156, B465. [Google Scholar] [CrossRef]
  20. Ehlinger, V.M.; Crothers, A.R.; Kusoglu, A.; Weber, A.Z. Modeling Proton-Exchange-Membrane Fuel Cell Performance/Degradation tradeoffs with Chemical Scavengers. J. Phys. Energy 2020, 2, 044006. [Google Scholar] [CrossRef]
  21. Chandesris, M.; Vincent, R.; Guetaz, L.; Roch, J.S.; Thoby, D.; Quinaud, M. Membrane Degradation in PEM Fuel Cells: From Experimental Results to Semi-Empirical Degradation Laws. Int. J. Hydrogen Energy 2017, 42, 8139–8149. [Google Scholar] [CrossRef]
  22. Spears, A.J.; Rockward, T.; Mukundan, R.; Garzon, F. Investigation of Membrane Chemical Degradation as a Function of Catalyst Platinum Loading. J. Electrochem. Soc. 2021, 168, 064503. [Google Scholar] [CrossRef]
  23. Alavijeh, S.A.; Goulet, M.A.; Khorasany, R.M.H.; Ghataurah, J.; Lim, C.; Lauritzen, M.; Kjeang, E.; Wang, G.G.; Rajapakse, R.K.N.D. Decay in Mechanical Properties of Catalyst Coated Membranes Subjected to Combined Chemical and Mechanical Membrane Degradation. Fuel Cells 2015, 15, 204–213. [Google Scholar] [CrossRef]
  24. Khorasany, R.M.H.; Goulet, M.A.; Alavijeh, A.S.; Kjeang, E.; Wang, G.G.; Rajapakse, R.K.N.D. On the Constitutive Relations for Catalyst Coated Membrane Applied to In-Situ Fuel Cell Modeling. J. Power Sources 2014, 252, 138–143. [Google Scholar] [CrossRef]
  25. Venkatesan, S.V.; El Hannach, M.; Holdcroft, S.; Kjeang, E. Probing Nanoscale Membrane Degradation in Fuel Cells through Electron Tomography. J. Memb. Sci. 2017, 539, 138–143. [Google Scholar] [CrossRef]
  26. Venkatesan, S.V.; Lim, C.; Holdcroft, S.; Kjeang, E. Progression in the Morphology of Fuel Cell Membranes upon Conjoint Chemical and Mechanical Degradation. J. Electrochem. Soc. 2016, 163, F637. [Google Scholar] [CrossRef]
  27. Singh, Y.; Orfino, F.P.; Dutta, M.; Kjeang, E. 3D Failure Analysis of Pure Mechanical and Pure Chemical Degradation in Fuel Cell Membranes. J. Electrochem. Soc. 2017, 164, F1331. [Google Scholar] [CrossRef]
  28. Madhav, D.; Wang, J.; Keloth, R.; Mus, J.; Buysschaert, F.; Vandeginste, V. A Review of Proton Exchange Membrane Degradation Pathways, Mechanisms, and Mitigation Strategies in a Fuel Cell. Energies 2024, 17, 998. [Google Scholar] [CrossRef]
  29. Chen, C.; Fuller, T.F. The Effect of Humidity on the Degradation of Nafion® Membrane. Polym. Degrad. Stab. 2009, 94, 1436–1447. [Google Scholar] [CrossRef]
  30. Coms, F.D. The Chemistry of Fuel Cell Membrane Chemical Degradation. ECS Trans. 2008, 16, 235–255. [Google Scholar] [CrossRef]
  31. Healy, J.; Hayden, C.; Xie, T.; Olson, K.; Waldo, R.; Brundage, M.; Gasteiger, H.; Abbott, J. Aspects of the Chemical Degradation of PFSA Ionomers Used in PEM Fuel Cells. Fuel Cells 2005, 5, 302–308. [Google Scholar] [CrossRef]
  32. Rodgers, M.P.; Bonville, L.J.; Kunz, H.R.; Slattery, D.K.; Fenton, J.M. Fuel Cell Perfluorinated Sulfonic Acid Membrane Degradation Correlating Accelerated Stress Testing and Lifetime. Chem. Rev. 2012, 112, 6075–6103. [Google Scholar] [CrossRef] [PubMed]
  33. Chandesris, M.; Médeau, V.; Guillet, N.; Chelghoum, S.; Thoby, D.; Fouda-Onana, F. Membrane Degradation in PEM Water Electrolyzer: Numerical Modeling and Experimental Evidence of the Influence of Temperature and Current Density. Int. J. Hydrogen Energy 2015, 40, 1353–1366. [Google Scholar] [CrossRef]
  34. Xie, T.; Hayden, C.A. A Kinetic Model for the Chemical Degradation of Perfluorinated Sulfonic Acid Ionomers: Weak End Groups versus Side Chain Cleavage. Polymer 2007, 48, 5497–5506. [Google Scholar] [CrossRef]
  35. Frühwirt, P.; Kregar, A.; Törring, J.T.; Katrašnik, T.; Gescheidt, G. Holistic Approach to Chemical Degradation of Nafion Membranes in Fuel Cells: Modelling and Predictions. Phys. Chem. Chem. Phys. 2020, 22, 5647–5666. [Google Scholar] [CrossRef]
  36. Wong, K.H.; Kjeang, E. Macroscopic In-Situ Modeling of Chemical Membrane Degradation in Polymer Electrolyte Fuel Cells. J. Electrochem. Soc. 2014, 161, F823–F832. [Google Scholar] [CrossRef]
  37. Trogadas, P.; Parrondo, J.; Ramani, V. Degradation Mitigation in Polymer Electrolyte Membranes Using Cerium Oxide as a Regenerative Free-Radical Scavenger. Electrochem. Solid-State Lett. 2008, 11, B113. [Google Scholar] [CrossRef]
  38. Pearman, B.P.; Mohajeri, N.; Brooker, R.P.; Rodgers, M.P.; Slattery, D.K.; Hampton, M.D.; Cullen, D.A.; Seal, S. The Degradation Mitigation Effect of Cerium Oxide in Polymer Electrolyte Membranes in Extended Fuel Cell Durability Tests. J. Power Sources 2013, 225, 75–83. [Google Scholar] [CrossRef]
  39. Gubler, L.; Koppenol, W.H. Kinetic Simulation of the Chemical Stabilization Mechanism in Fuel Cell Membranes Using Cerium and Manganese Redox Couples. J. Electrochem. Soc. 2011, 159, B211. [Google Scholar] [CrossRef]
  40. Xiao, S.; Zhang, H.; Bi, C.; Zhang, Y.; Zhang, Y.; Dai, H.; Mai, Z.; Li, X. Degradation Location Study of Proton Exchange Membrane at Open Circuit Operation. J. Power Sources 2010, 195, 5305–5311. [Google Scholar] [CrossRef]
  41. Wang, L.; Advani, S.G.; Prasad, A.K. Self-Hydrating Pt/CeO2-Nafion Composite Membrane for Improved Durability and Performance. ECS Electrochem. Lett. 2014, 3, F30. [Google Scholar] [CrossRef]
  42. Lim, C.; Alavijeh, A.S.; Lauritzen, M.; Kolodziej, J.; Knights, S.; Kjeanga, E. Fuel Cell Durability Enhancement with Cerium Oxide under Combined Chemical and Mechanical Membrane Degradation. ECS Electrochem. Lett. 2015, 4, F29. [Google Scholar] [CrossRef]
  43. Coms, F.D.; McQuarters, A.B.; Marks, A. PFSA Membrane Thickness Impact on Chemical Degradation Rates. J. Electrochem. Soc. 2025, 172, 054501. [Google Scholar] [CrossRef]
  44. Kumaraguru, S. Durable High Power Membrane Electrode Assembly with Low Pt Loading. Energy. Hydrog. Fuel Cells Progr. Annu. Merit Rev. 2018, 1, 1–9. [Google Scholar]
  45. M2FCT, Heavy-Duty Fuel Cell Catalyst AST Protocol. Available online: https://millionmilefuelcelltruck.org/ast-protocols (accessed on 9 April 2025).
  46. Ahluwalia, R.K.; Wang, X. Rapid Self-Start of Polymer Electrolyte Fuel Cell Stacks from Subfreezing Temperatures. J. Power Sources 2006, 162, 502–512. [Google Scholar] [CrossRef]
  47. Baker, A.M.; Babu, S.K.; Mukundan, R.; Advani, S.G.; Prasad, A.K.; Spernjak, D.; Borup, R.L. Cerium Ion Mobility and Diffusivity Rates in Perfluorosulfonic Acid Membranes Measured via Hydrogen Pump Operation. J. Electrochem. Soc. 2017, 164, F1272–F1278. [Google Scholar] [CrossRef]
  48. COMSOL AB. COMSOL Multiphysics 6.0; COMSOL AB: Stockholm, Sweden; Available online: www.comsol.com (accessed on 13 November 2024).
  49. Sethuraman, V.A.; Weidner, J.W.; Haug, A.T.; Motupally, S.; Protsailo, L.V. Hydrogen Peroxide Formation Rates in a PEMFC Anode and Cathode. J. Electrochem. Soc. 2008, 155, B50. [Google Scholar] [CrossRef]
  50. Ahluwalia, R.K.; Wang, X.; Peng, J.-K.; Konduru, V.; Arisetty, S.; Ramaswamy, N.; Kumaraguru, S. Achieving 5000-h and 8000-h Low-PGM Electrode Durability on Automotive Drive Cycles. J. Electrochem. Soc. 2021, 168, 044518. [Google Scholar] [CrossRef]
  51. Kundu, S.; Fowler, M.W.; Simon, L.C.; Grot, S. Morphological Features (Defects) in Fuel Cell Membrane Electrode Assemblies. J. Power Sources 2006, 157, 650–656. [Google Scholar] [CrossRef]
Figure 1. (a) Effect of temperature on FER at 2.5 atm, 100% RH and cell voltage held at 0.9 V or OCV. Open symbols denote anode FER and closed symbols denote cathode FER at 60 °C (teal), 80 °C (red), 90 °C (purple), and 95 °C (green); (b) Effect of RH on FER at OCV and 90 °C. The solid line is a regression of data from Coms et al. [43]; (c) Effect of cerium loading and RH on FER in H2O2 vapor test at 90 °C. Data from Kumaraguru [44] and Coms et al. [43].
Electrochem 06 00025 g001
Figure 2. (a) Relationship between O2 crossover and FER at OCV, 90 °C, and RH of 30% (blue open triangles), 60% (orange closed squares), and 90% (green closed triangles); (b) Derived cathode FER as function of RH at OCV and 90 °C; (c) Anode FER selectivity defined as moles of fluorine produced per mole of O2 crossover to anode at 90 °C.
Electrochem 06 00025 g002
Figure 3. (a) Calibration of FER model against digitized data at OCV, 90 °C, 30–90% RH, and variable anode/cathode pressures and membrane thicknesses, R2 = 91.70%, SD = 23.5%. Symbols denote model FER compared to data in Coms [43]; (b) Calibration of FER correlation developed from regression analysis with RH as a single variable, R2 = 71.93%, SD = 43.2%. R 2 = 1 i = 1 n y i y i ^ 2 / i = 1 n y i y ¯ 2 , S D = i = 1 n y i y ¯ 2 / n .
Electrochem 06 00025 g003
Figure 4. Steps in development of FER correlation: (a) Temperature dependence at 0.9 V, 2.5 atm, and 100% RH leading to an apparent activation energy of 99 kJ/mol for anode FER and 71 kJ/mol for cathode FER; (b) Cathode potential dependence of FER at 90 °C, 2 mol% Ce loading; (c) Cerium loading dependence of FER at different RH.
Electrochem 06 00025 g004
Figure 5. Single-variable sensitivity analysis of FER correlation. The baseline conditions are 2.5 bar, 90 °C, 0.9 V cathode potential, and 2 mol% Ce loading: (a) RH sensitivity; (b) Pressure sensitivity; (c) Temperature sensitivity; (d) Cathode potential sensitivity; (e) Ce loading sensitivity.
Electrochem 06 00025 g005
Figure 6. Water and Ce transport in differential cells. The baseline conditions are 2.5 bar, 90 °C, 21 mol% O2, and 2 mol% Ce loading: (a) Cell polarization curves at different RH; (b) Interfacial water activity (c) Ce retention in membrane; (d) Interfacial Ce concentration; (e) Impact of water activity and Ce concentration gradients on anode and cathode FER.
Electrochem 06 00025 g006
Figure 7. Single-variable sensitivity analysis of FER in differential cells with gradients in water activity and Ce concentration. The baseline conditions are 2.5 bar, 90 °C, 21 mol% O2, and 2 mol% Ce loading: (a) RH sensitivity; (b) Pressure sensitivity; (c) Temperature sensitivity; (d) Cell voltage sensitivity; (e) Ce loading sensitivity.
Electrochem 06 00025 g007
Figure 8. Membrane stability maps for differential cells in terms of cell voltage, temperature, and RH. The iso-potential lines connect the modeled failure limits at different combinations of RH and temperature at 0.6 V (green circles), 0.7 V (purple squares), 0.8 V (teal diamonds), 0.85 V (orange diamonds), 0.9 V (green crosses), and 0.95 V (blue circles). The baseline conditions are 2.5 bar, 12 µm membrane, and 2 mol% Ce loading: (a) Theoretical failure limit defined by 72 ng/cm2·h FER; (b) Safe limit defined by 25 ng/cm2·h FER; (c) Proposed design limit defined by 50 ng/cm2·h FER.
Electrochem 06 00025 g008
Table 1. Model constants and parameters adapted from previous work on a distributed ORR kinetic model applied to differential cells with the same material set and MEA [50]. The model constants for FER have been determined in this study.
Symbol Symbol Symbol
i 0 a r 248 m A / c m P t 2 γ a 1.25 Δ H s a 30.2 kJ/mol
b a 22.6 mV S P t a 5.6 × 10 6   m P t 2 / m 3
i 0 c r 3.1 m A / c m P t 2 γ c 0.65 Δ H s c 28.1 kJ/mol
b c 60.8 mV S P t c 12 × 10 6   m P t 2 / m 3 ω 2.9 kJ/mol
ε0.4 ε m 0.26β0.9
H d 51.6 kJ/mol H m 46.5 kJ/mol
A c 0 123.3 ng/cm2·h β c 3.7 H c 71 kJ/mol
α F 0.54 E r 0.85 V T r 363 K
A a 0 6.5 × 10 4 β a 4.1 H a 78 kJ/mol
Disclaimer/Publisher’s Note: The statements, opinions and data contained in all publications are solely those of the individual author(s) and contributor(s) and not of MDPI and/or the editor(s). MDPI and/or the editor(s) disclaim responsibility for any injury to people or property resulting from any ideas, methods, instructions or products referred to in the content.

