Article

A Novel Label-Free Electrochemical Immunosensor Based on a Self-Assembled Monolayer-Modified Electrode for Polychlorinated Biphenyl (PCB) in Environmental Analysis

Sensing & Separation Group, School of Chemistry and Life Science Interface, Tyndall National Institute, University College Cork, T12 R5CP Cork, Ireland
*
Author to whom correspondence should be addressed.
Electrochem 2022, 3(3), 451-462; https://doi.org/10.3390/electrochem3030031
Submission received: 5 July 2022 / Revised: 18 August 2022 / Accepted: 18 August 2022 / Published: 22 August 2022
(This article belongs to the Collection Feature Papers in Electrochemistry)

Abstract

:
PCBs (polychlorinated biphenyls) are a very large group of organic compounds that have between two and ten chlorine atoms attached to the biphenyl. These compounds have an acute impact as environmental pollutants, causing cancer and other adverse health effects in humans. It is therefore imperative to develop techniques for the cost-effective detection of PCBs at very low concentrations in ecosystems. In this paper, a novel label-free, indirect, competitive electrochemical immunosensor was first developed with a PCB-BSA conjugate. It is shown herein to compete with free PCBs for binding to the anti-PCB polyclonal primary antibody (IgY). Then, we used a secondary antibody to enhance the sensitivity of the sensor for the detection of PCB in a sample. It has been successfully immobilized on an 11-mercaptoundecanoic acid (11-MUA)-modified gold electrode via a carbodiimide-coupling reaction using cross-linking 1-ethyl-3-(3-dimethylaminopropyl) carbodiimide (EDC) and N-hydroxysuccinimide (NHS) on the electrode surface. The immunosensor was investigated by cyclic voltammetry and differential pulse voltammetry in a standard solution of [Fe(CN)6]3−/4−. A linear range of 0.011–220 ng/mL−1 and a limit of detection (LOD) of 0.11 ng/mL−1 for PCBs detection were achieved by the developed immunosensor, showing advantages over conventional assays. The novel label-free electrochemical immunosensor discussed in this paper is a solution for simple, rapid, cost-effective sample screening in a portable, disposable format. The proposed immunosensor has good sensitivity, and it can prove to be an adequate real-time monitoring solution for PCBs in soil samples or other samples.

1. Introduction

Polychlorinated biphenyls (PCBs) are organic compounds containing two to ten chlorine atoms attached to the biphenyl [1,2]. Aroclor 1254 (C12H5Cl5) is a mixture of polychlorinated biphenyls, and is a viscous, light-yellow liquid with a molecular weight of 328, containing 21% C12H6Cl4, 48% C12H5Cl5, 23% C12H4Cl6, and 6% C12H3Cl7, with an average chlorine content of 54% [3]. Owing to its severe harm to the environment, the chemical was banned despite its wide use in industry. Nevertheless, it is still present in electrical power generation, plastic manufacturing, chemical production, printing, and other industries; therefore, PCB contamination is still a global issue. It can be found in air, soil, and aquatic environments, and in human bodies [4,5,6] PCBs disrupt endogenous hormones and immune functions, and can lead to tumor formation [7,8]. It is therefore important and urgent to develop reliable, on-site screening systems that use simple analytical methods with high specificity and sensitivity for PCB detection. These methods can be applied to trace levels of PCBs that pose a major threat to the environment and to public health.
For PCB detection, standard methods such as gas chromatography–mass spectrometry (GC-MS) and high-performance liquid chromatography–mass spectrometry (HPLC-MS) have been commonly used [9,10,11]. Although they are sensitive and accurate, these instrumental analyses have some limitations and are mainly used in laboratory settings. Therefore, immunoassay techniques seem to be a viable solution for portable devices. For example, enzyme-linked immunosorbent assays (ELISA) [12,13,14] have detection limits of less than 1.0 μg/mL with high specificity [15,16]. Traditional ELISA involves many steps and long incubations, which must be reduced in order to enable rapid, on-site detection of PCBs. Therefore, electrochemical methods will replace optical ones because they enable faster response times and miniaturization. Electrochemical biosensors can be labeled or label-free [17]; label-free-based immunoassays have attracted considerable attention recently due to their fast, simple, and low-cost on-site analysis, and the fact that do not require the modification of biological samples [18,19,20,21]. A competitive immunoassay is the common scheme used with label-free immunosensors [3,6,17,22], whereby the formation of antibody–antigen complexes changes the thickness and mass of an electrode surface, which in turn blocks the transfer of electrons to the electrode surface [23,24]. Therefore, the key factor here is the immobilization of the antibody or antigen on the electrode surface with no nonspecific binding [25,26].
In view of the rarity of studies using label-free electrochemical immunosensors for PCB detection [7,8,13,27,28,29,30], in this study, a novel, sensitive, and label-free electrochemical immunosensor was developed based on an indirect competitive assay on modified electrodes for the quantification of total polychlorinated biphenyls (PCBs). Detailed instructions for electrode modification were provided in our previous study [3]. This study applied the Aroclor 1254–bovine serum albumin (BSA) conjugate, which became the solution for the competition assay and enabled our development of the immunosensor modified with 11-mercaptodecylic acid (MUA). PCB-BSA competed with antigens in solution for polyclonal antibodies (anti-PCB), resulting in two types of anti-PCB: one which binds freely to PCB in solution, while the other binds to PCB-BSA. Secondary antibodies were then applied, which in turn competed with these two types of anti-PCB, changing the electrochemical signals and increasing the sensitivity of the immunosensor. Differential pulse voltammetry (DPV) was applied to record the interaction of antibodies with PCB antigens on the modified electrode, using [Fe(CN)6]3−/4− solution as a redox probe. PCBs were therefore competitively bound to this particular antibody, resulting in Aroclor 1254–BSA complex formation, which then dissociated from the electrode, causing significant decreases in DPV. Capture assays were used in optimization, and the analyte concentrations remained constant, allowing the use of direct ELISA. Competitive assays were used in the sensitivity measurements, and the analyte concentration gradually changed, allowing the use of indirect ELISA.
PCBs were determined using the proposed immunosensor in both standard and real samples. The details of the preparation, characterization, and possible application of the immunosensors were investigated as follows. The presented immunosensor’s linear dynamic range and limit of detection were compared with a labeled immunosensor, ELISA, and other previously described immunoassays for PCB detection. We believe that the findings of this study, a label-free detection technique, will have a significant impact on the development of an ultrasensitive platform for detecting and quantifying PCBs in the environment. Figure 1 illustrates the functionalization process of SPGE and the detection process of the PCB contaminant.

2. Materials and Methods

2.1. Chemicals and Materials

Aroclor 1254 PCB was purchased from Cole-Parmer Instrument Company Ltd., Eaton Socon, Saint Neots, UK. Reagents, such as buffers (Tris base: PBS—phosphate-buffered saline, DEA—diethanolamine); solutions (NaHCO3—sodium bicarbonate, NaCl—sodium chloride, KCl—potassium chloride, HCl 37%—hydrochloric acid, NaBH3CN—sodium cyanoborohydride, NH4OH—ammonium hydroxide, NaOH—sodium hydroxide); chemicals (NHS—N-hydroxysuccinimide 98%, EDC—1-ethyl-3-(3-dimethylaminopropyl) carbodiimide, 11-MUA—11-mercaptoundecanoic acid 95%, K4[Fe(CN)6]—potassium ferrocyanide, K3[Fe(CN)6]—potassium ferricyanide, BSA—bovine serum albumin); Tween-20 detergent; acetone; alcohol (1-isopropyl; ethanol); and clean soil, were bought from Sigma (Dublin, Ireland). Other biochemicals, including polyclonal chicken antibody (IgY), specific to PCB; goat anti-chicken IgY (heavy and light chain) unconjugated antibody; and PCB-BSA conjugate (Aroclor 1254), were purchased from GmbH (Heidelberg, Germany). All the reagents were of analytical grade or higher, and all the buffers and solutions were made from water filtered with nanopores (18.2 mΩ-cm).

2.2. Equipment and Instruments

For the optical assays, a microplate reader (EL Read 2000 from biochrom.co, Cambridge, UK) and 96-well ELISA microplates (Greiner bio-one from Frickenhausen, Germany) were used. For electrochemical assays, a Palm Sens potentiostat (Palm Instrument BV Houten, The Netherlands) and disposable electrochemical screen-printed gold electrodes (AuE) with a size L 3.4 × W 1.0 × H 0.05 cm and a diameter of 4 mm (Drop Sens, Asturias, Spain) were used. For incubation and pretreatments, a 37 °C Biometra OV3 Incubator (Gottingen, Germany) and a plasma cleaner (Harrick Plasma Ithaca, Ithaca, NY, USA) were used. Between measurements, nitrogen spray guns were used to dry the SPEs.

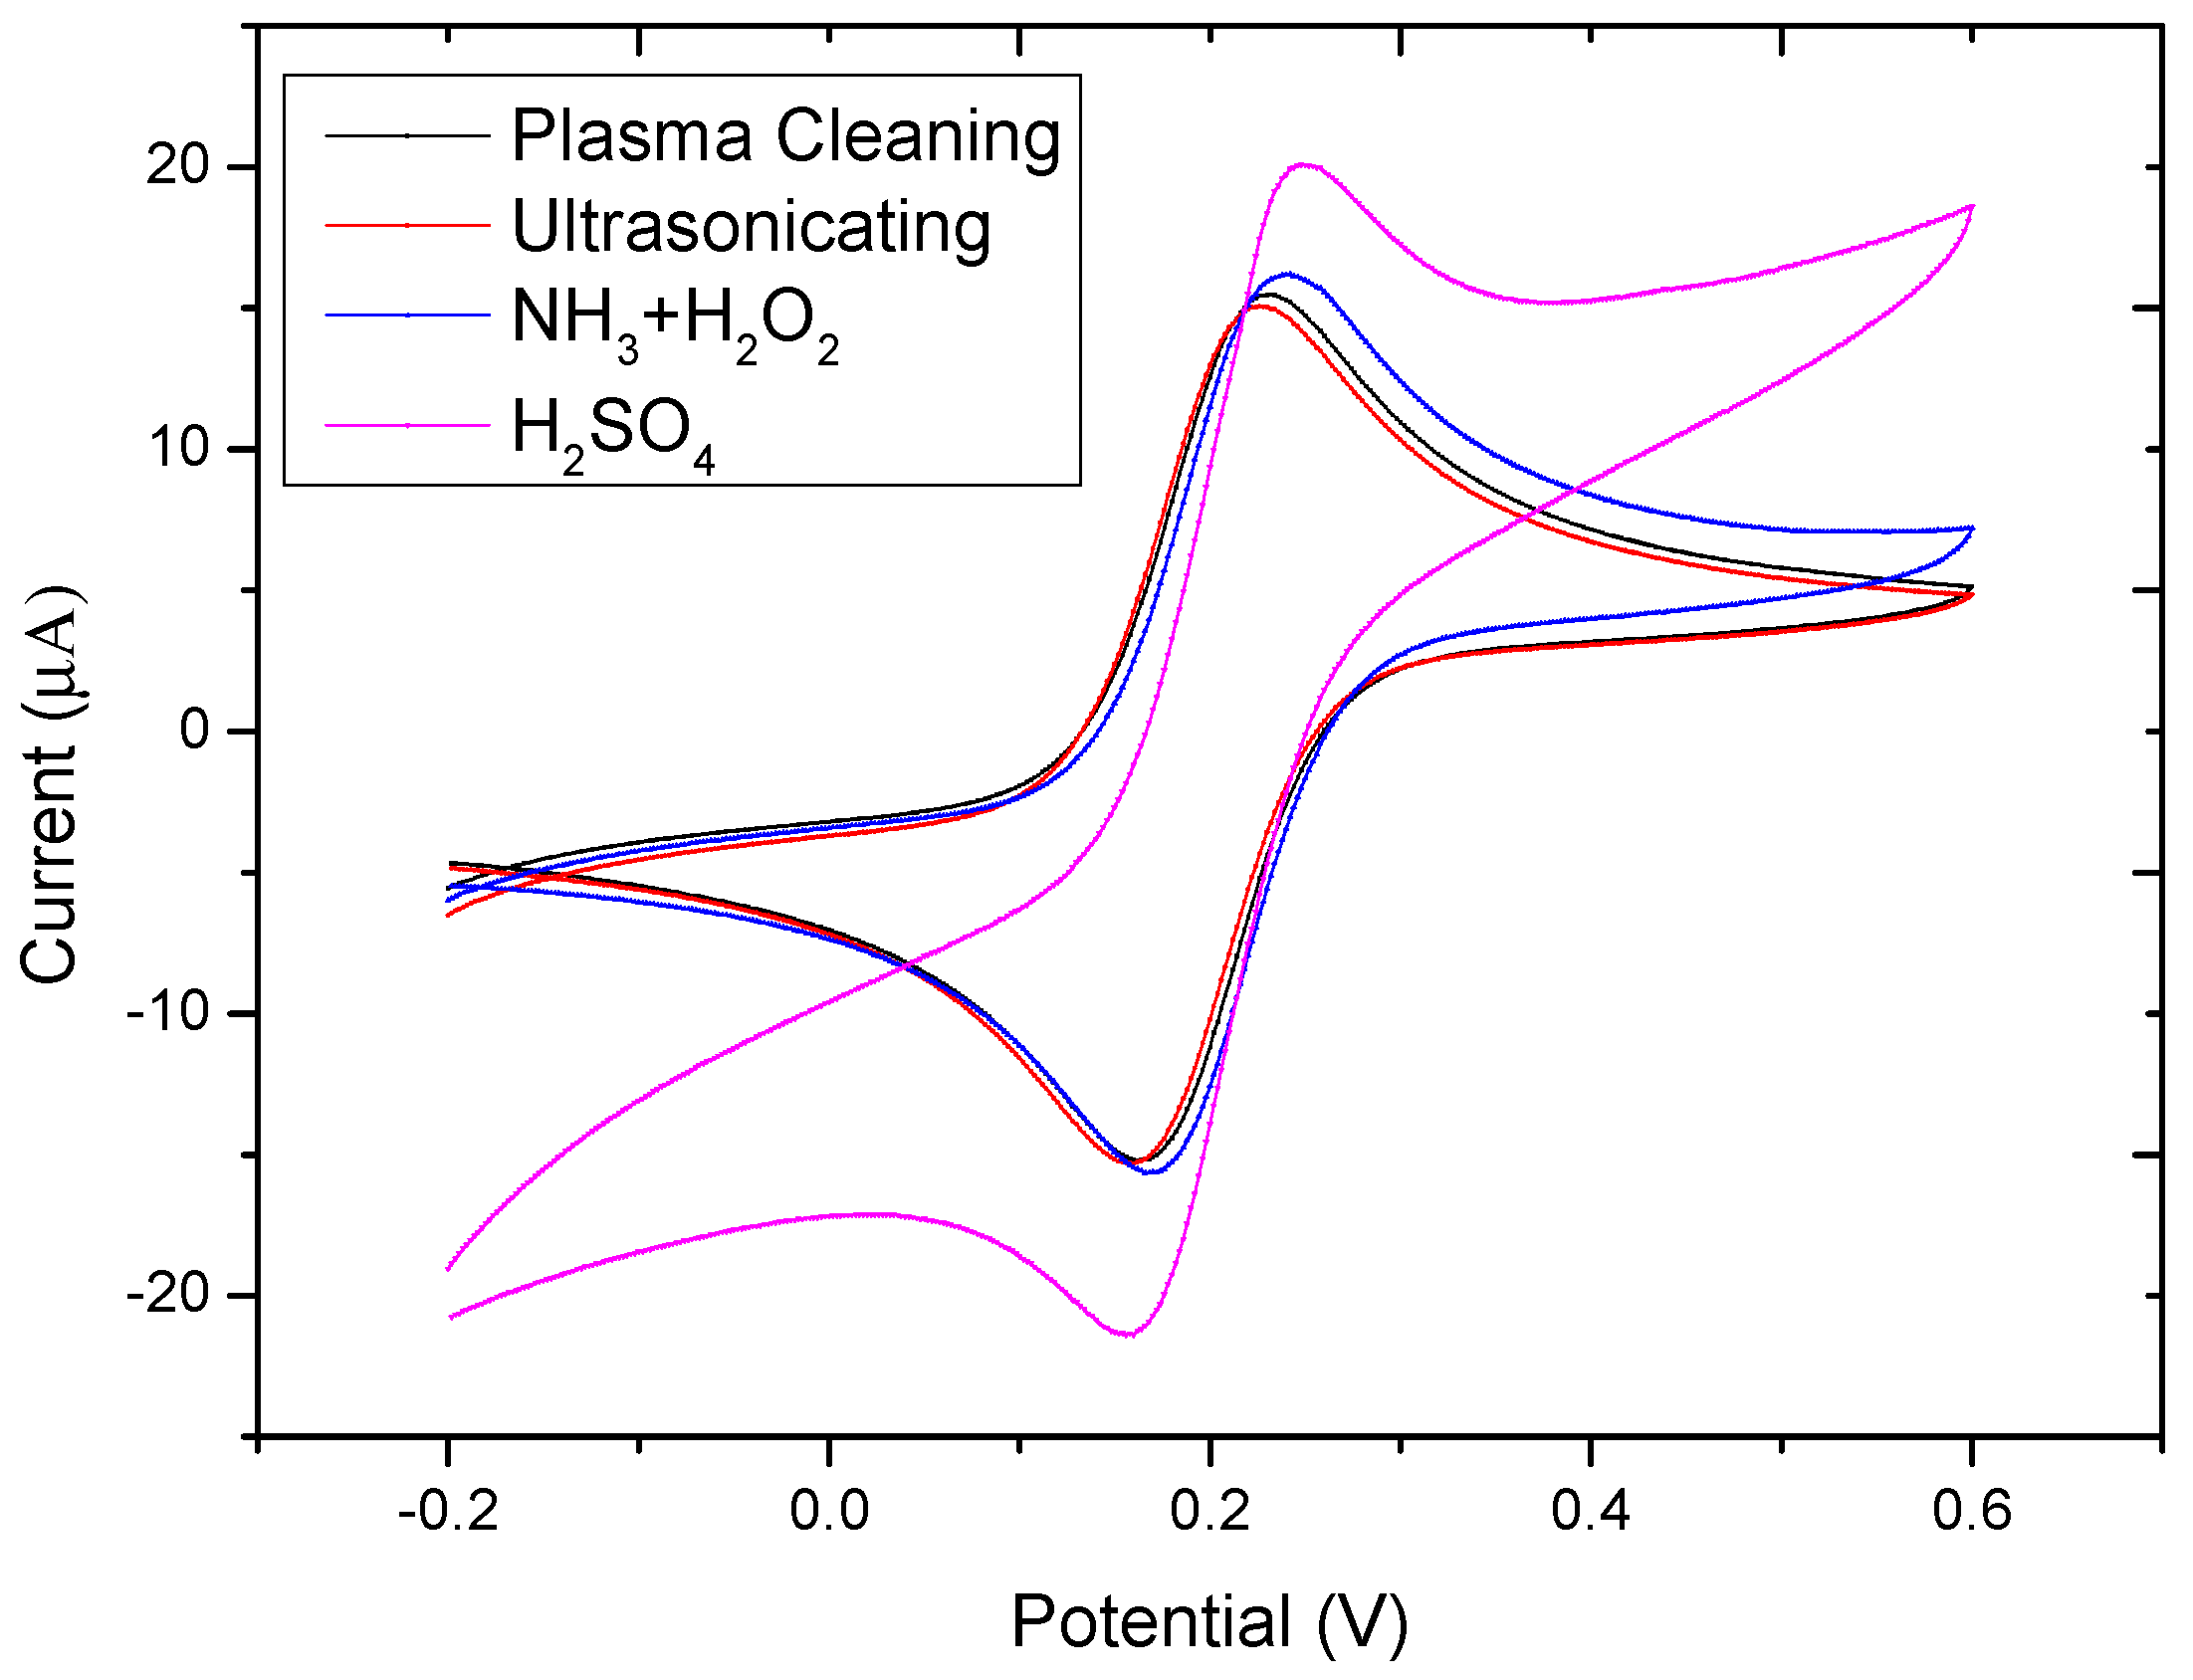
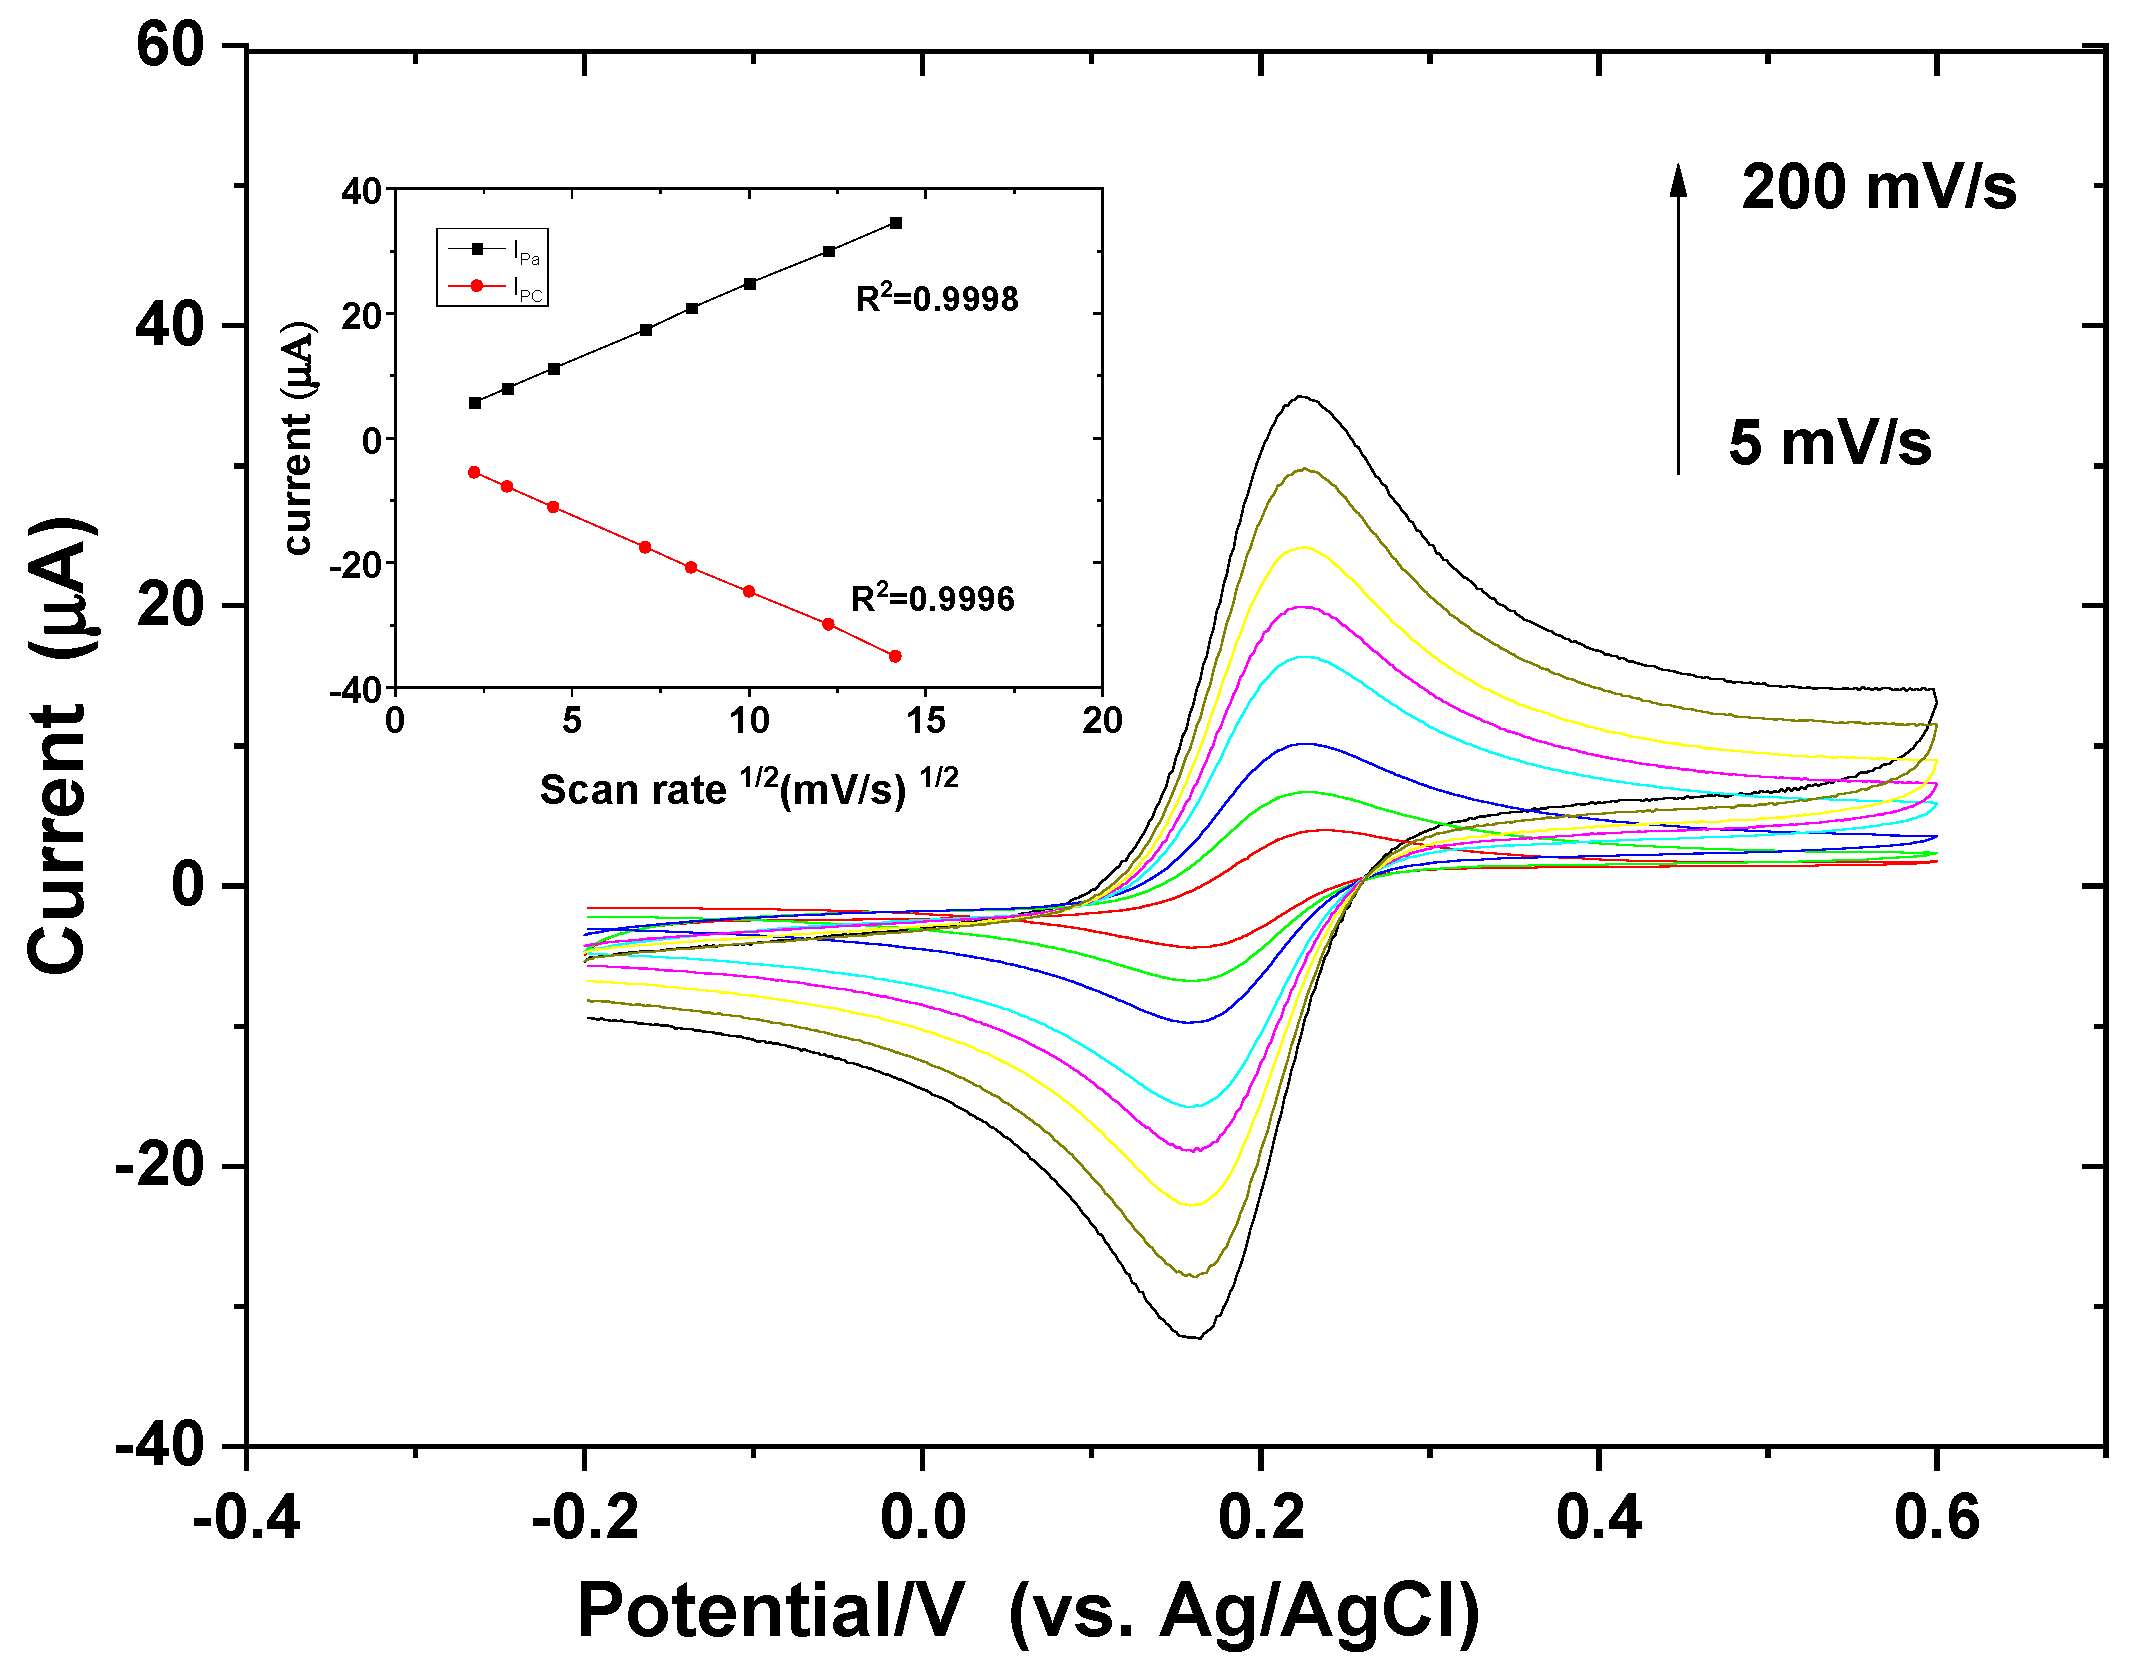
2.3. Cyclic Voltammetry for Pretreatment of Electrodes

For electrochemical measurements, it is necessary to ensure that the electrode surfaces are clean. As a result, the optimization of various SPGE cleaning protocols was carried out. At a scan rate of 50 mV s−1, the chips were cycled in 5 mM [Fe(CN)6]3−/4− in 0.1 M KCl. The potential was chosen between −0.2 and 0.6 versus Ag/AgCl. The following are the different chip-cleaning protocols: (a) SPGE was given a plasma cleaner treatment for 20–30 min; (b) SPGE was ultrasonically cleaned for 5 min in acetone, then for another 5 min in 1-isopropyl alcohol before being rinsed with deionized water for 5 min; (c) on a hot plate, a 1:1:5 mixture of 29% ammonia solution, 30% H2O2, and ultrapure water was heated to 80 °C, and the SPGEs were immersed in the solution for 5 min; (d) the SPGE was cycled from 0 to +1.6 V in 0.5 M for 3 scans in 0.5 M sulfuric acid, H2SO4. The SPGE, on the other hand, was scanned between −0.2 and 0.6 V in 5 mM [Fe(CN)6]3−/4− in 0.1 M KCl to investigate the effect of the scan rate. Different scan rates of 5–200 mV s versus Ag/AgCl were used in the experiments.

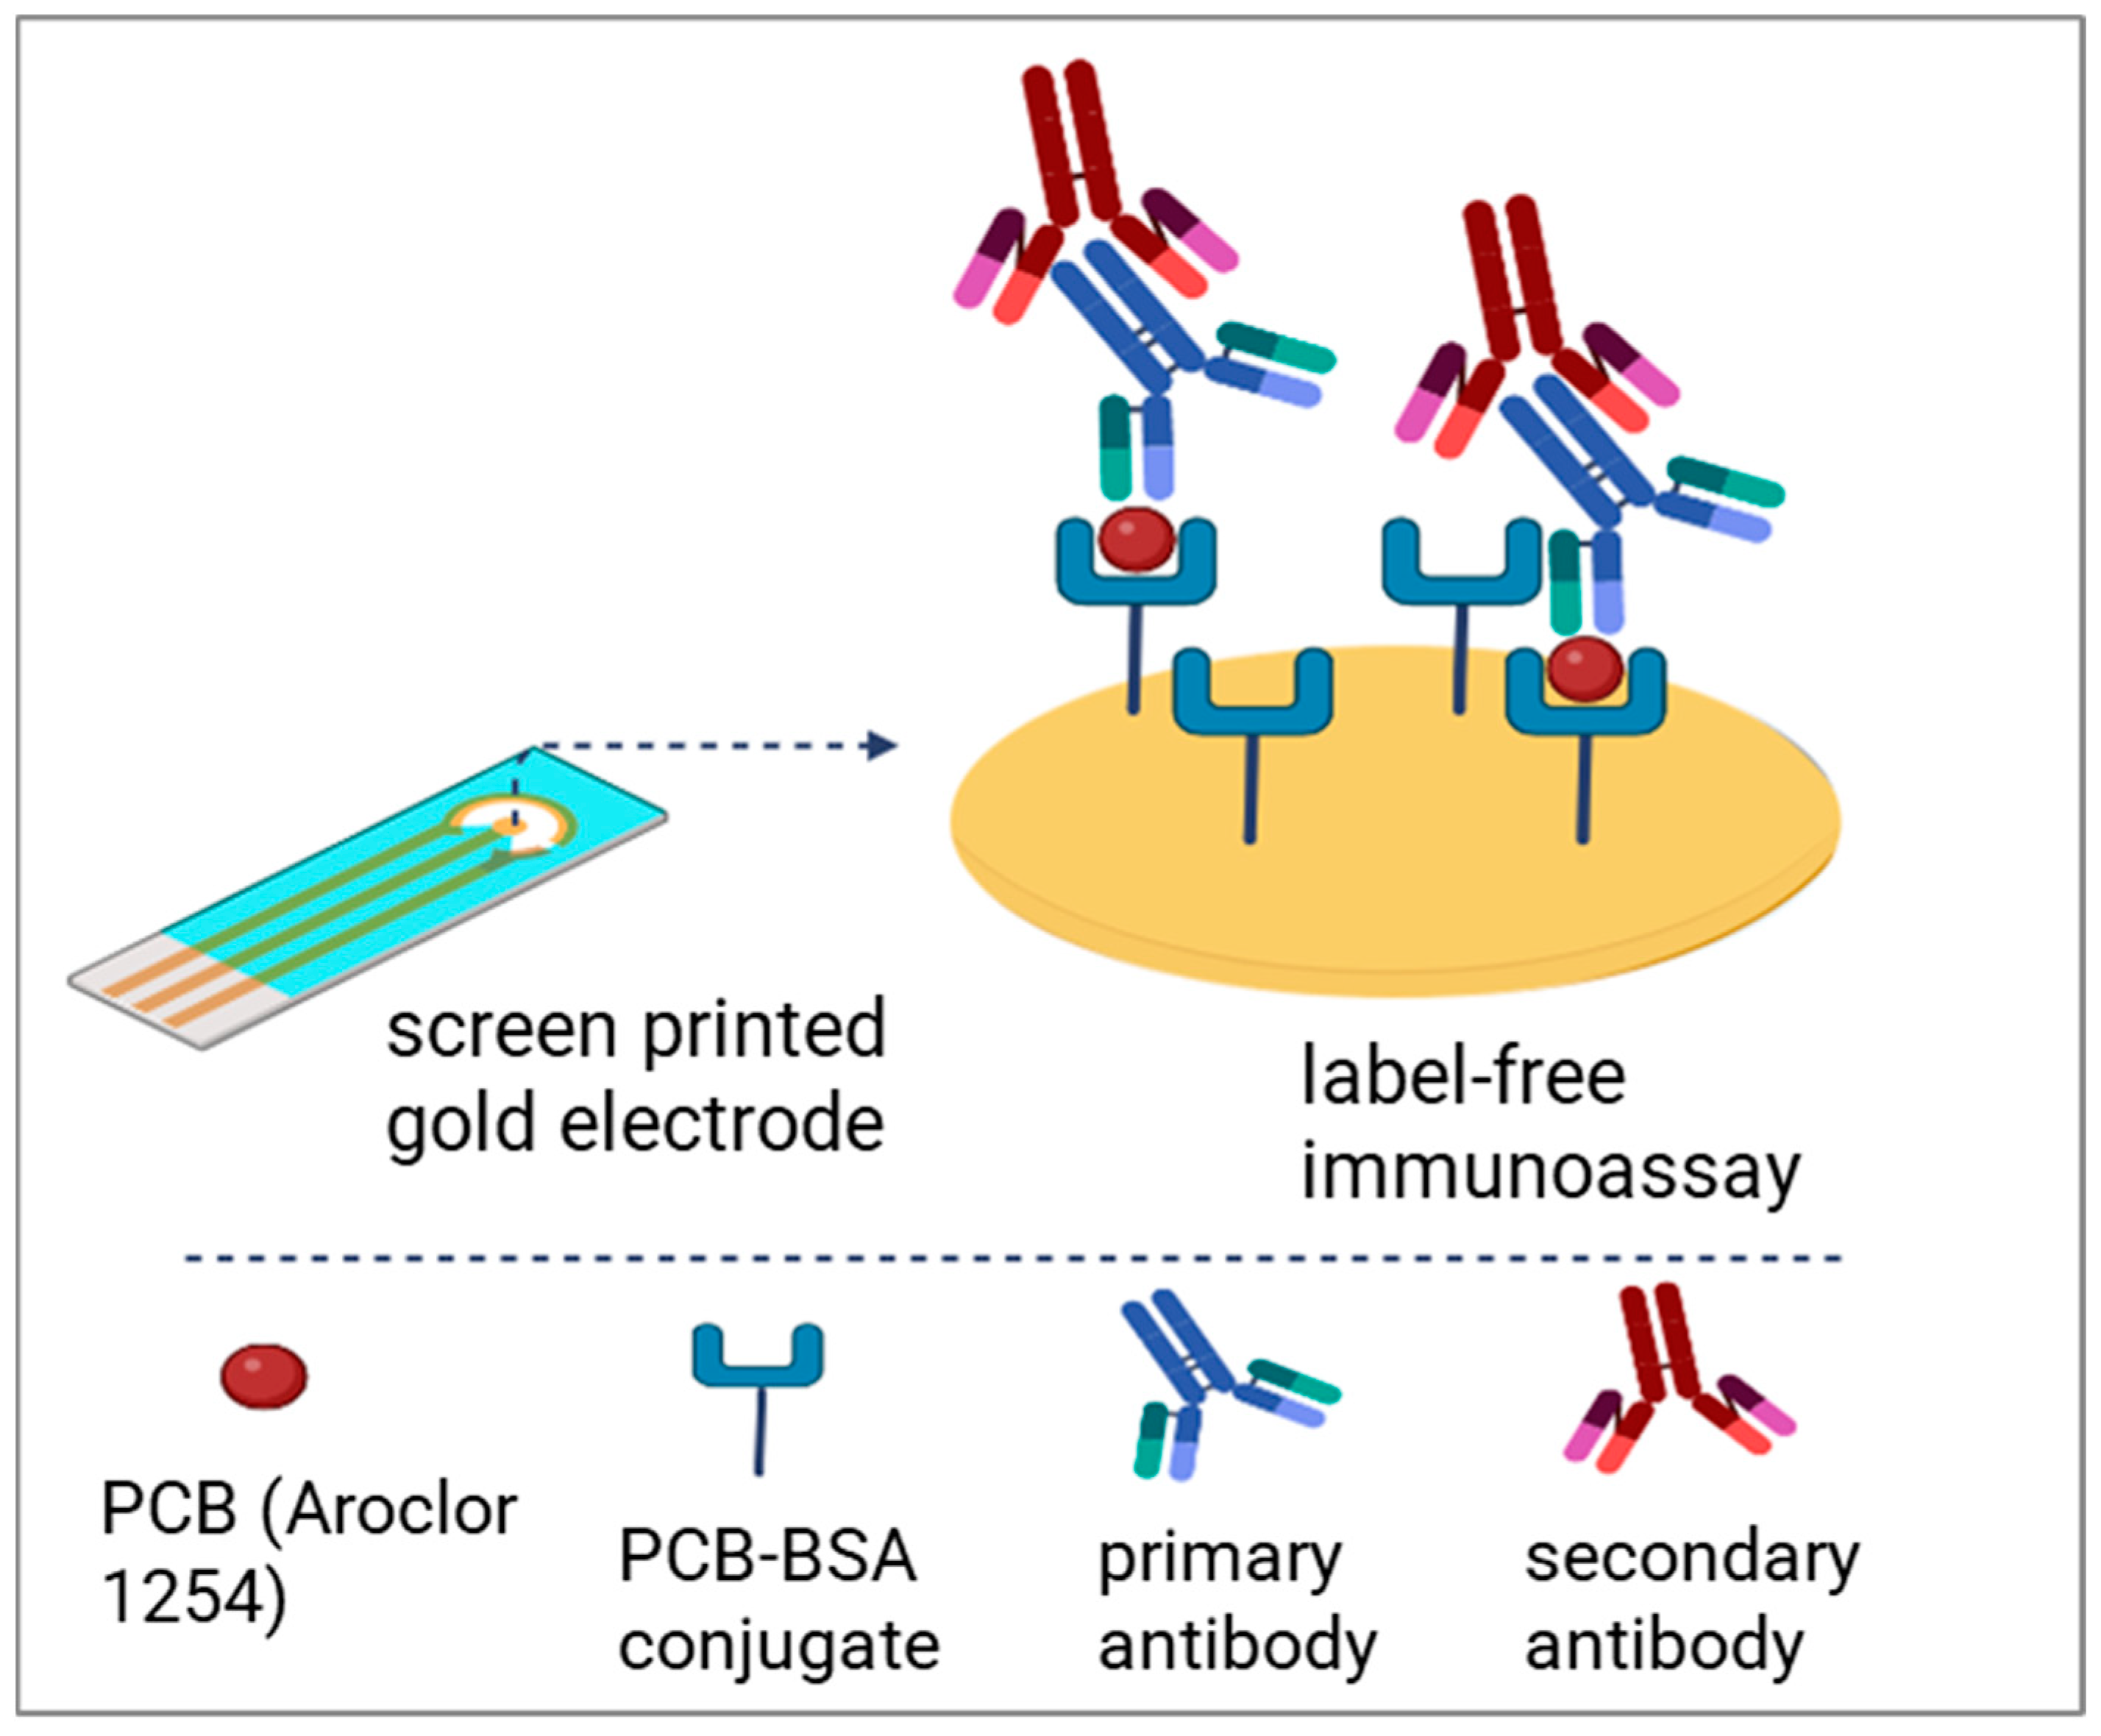
2.4. Modification of SPG Electrodes

Our method for modifying the electrode was discussed in our previous paper [3]. We briefly describe the method here: 5 mM of 11-MUA used as SAM was applied on the gold working electrodes. 11-MUA was diluted in absolute ethanol and bubbled with N2 for the purpose of reducing the oxygen [23,32,33]; then, the electrodes were immersed in this mixture for 20 h at 25 °C. Next, the electrodes were rinsed thoroughly with ethanol and dried with N2. After that, 50 mM EDC and NHS solution was used to immerse electrodes for 1 h, and then the electrodes were rinsed with deionized water and dried again with N2. The electrodes were then exposed to protein as a final step. A measure of 5 µg mL−1 of Aroclor 1254–BSA coating conjugate was immobilized for 1 h at 37 °C.

2.5. Optimization of Label-Free Immunoassay

These different experimental parameters were optimized using an Aroclor 1254 solution at 25 ng mL−1 concentration without a competition test (we used fixed-concentration PCBs at 25 ng mL−1 Aroclor 1254 concentration). Therefore, instead of performing the competitive assay, we applied a capture assay with DPV techniques to optimize several conditions, including the concentrations of BSA–Aroclor 1254, the concentrations of anti-PCB Ab, and the competition time. Under optimized experimental conditions, the label-free immunoassay was performed using an indirect competitive immunoassay scheme using DPV, which was applied in order to find the calibration plot and compare the other methods. The electrode surfaces were incubated at 37 °C for one hour with 15 μL of BSA–Aroclor 1254 coating antigen (5 μg mL−1) (pH 7.4). For washing the electrode surfaces, 0.05 M Tris, pH 7.4 (0.05% Tween 20) was sprayed on them three times, and then the electrodes were blocked for 30 min at 37 °C with 1% BSA–Tris (0.05 M Tris–HCI). To eliminate unbound coating conjugates, the electrode surface was washed three times following the incubation process. Aroclor 1254 PCB, serially diluted with PCB-specific polyclonal chicken antibody (IgY), was mixed and left to incubate for 15 min with 0.246 µg/mL−1 of the polyclonal chicken antibody (IgY). The electrode surface was exposed to 15 μL of each dilution, and binding occurred for 30 min at 37 °C. The SPGE surface was coated with a 1/5000 dilution of unlabeled anti-rabbit IgG antibody and allowed to react for 30 min at 37 °C in order to standardize the assay. A 100 μL-volume wash buffer was used to wash the electrodes before the electrochemical reading. The DPV analysis utilized a voltage range from −0.2 to +0.6 V at a scan rate of 0.05 V s−1 and a response amplitude of 0.05 V. In addition to the step potential, the modulation time and interval time were all fixed during the assay: 0.01 V and 0.1 s, respectively, were used in 0.1 M KCl in 4 mL PBS, containing a 5 mM redox probe [Fe(CN)6]3−/4−.

2.6. Real Sample Analysis

For the real sample analysis, ten grams of soil were placed in a glass flask and spiked with a known amount of Aroclor 1254 before being extracted for recovery studies. A measure of 5 g of the spiked sample was added to 10 mL of methanol. The flask was sealed, shaken frequently for 2 min, and then left at room temperature for 30 min. The sample was centrifuged at 2500 rpm for 10 min [34,35]. After waiting 5 min for the solid particles to settle, the soil was filtered through a 0.45 m nitrocellulose filter. The extract was then evaporated to a volume of 1 mL before processing, as described in Section 2.5.

3. Results and Discussion

3.1. Electrochemical Characterization of the Electrode

Cleaning and substrate preparation are important steps in studying the surface phenomenon, because they can improve the surface state for better electrochemical activity to take place. There are different common pretreatment methods for producing a clean gold surface, and most are performed just before the modification of the surface. Different pretreatment procedures, either individual or combined, are employed. Common pretreatment methods include thermal treatment, mechanical polishing with a slurry of alumina, oxygen plasma cleaning, chemical oxidation with piranha solution or ethanol, and electrochemical polishing using potential cycling [27,36]. In this study, we used four different protocols to clean the electrode, as follows: plasma cleaning, ultrasonicating, NH3 + H2O2, and H2SO4. Electrode cleanliness can be measured by examining the potential difference of the peak-to-peak separation (ΔEp) of anodic and cathodic peaks. According to Fischer et al., a smaller ΔEp indicates a cleaner surface, where any increase in the ΔEp value indicates that some sort of contamination has occurred on the electrode surface [28]. Considering that the theoretical value of ΔEp is 59 mV for the single-electron transfer of [Fe(CN)6]3−/4−, the closest experimental value of ΔEP (58 mV) was achieved when the CV was performed using the plasma-cleaner-treated electrode. Compared with the other cleaning protocols, the plasma cleaning method shows well-defined peaks(see Figure 2). For this reason, we used this method as our cleaning procedure for further electrochemical investigations. The data generated from the curves are summarized in Table 1.
Secondly, the influence of the scan rates was investigated by performing the CVs over the range 5–200 mV/s−1. As shown in Figure 3, a large peak separation was observed when the scan rates were increased. The redox couple used was 5 mM ferricyanide/ferrocyanide in 0.1 MKCL. The peak-to-peak separation achieved for the scan rate of 50 mV/s was 64 mV, which is a better performance compared to those reported by M. Lu with 75 mV [29]. A good linear correlation was obtained between the anodic peak height and the square root of the applied scan rates, as shown in Figure 3. The values of the correlation coefficients (R2) of the anodic peak (0.999) and the cathodic peak (0.998) confirm that the electrochemical system was under the diffusion control process. Table 2 shows the calculated CV data for the oxidation of 5 mM [Fe(CN)6]3−/4− in 1 M kCL with different scan rates. The measurements were performed at room temperature, 25 °C. Table 2 shows that the data of Ipa increased as the scan rate increased. It also shows the ∆Epa for each scan rate within the practical range (70–40 mV). In addition, the theoretical value of 58 mV was recorded twice at that range, at scan rates of 100 and 200 mV/s. Furthermore, it shows all the redox reactions across the different scan rates applied at ≈200 mV.

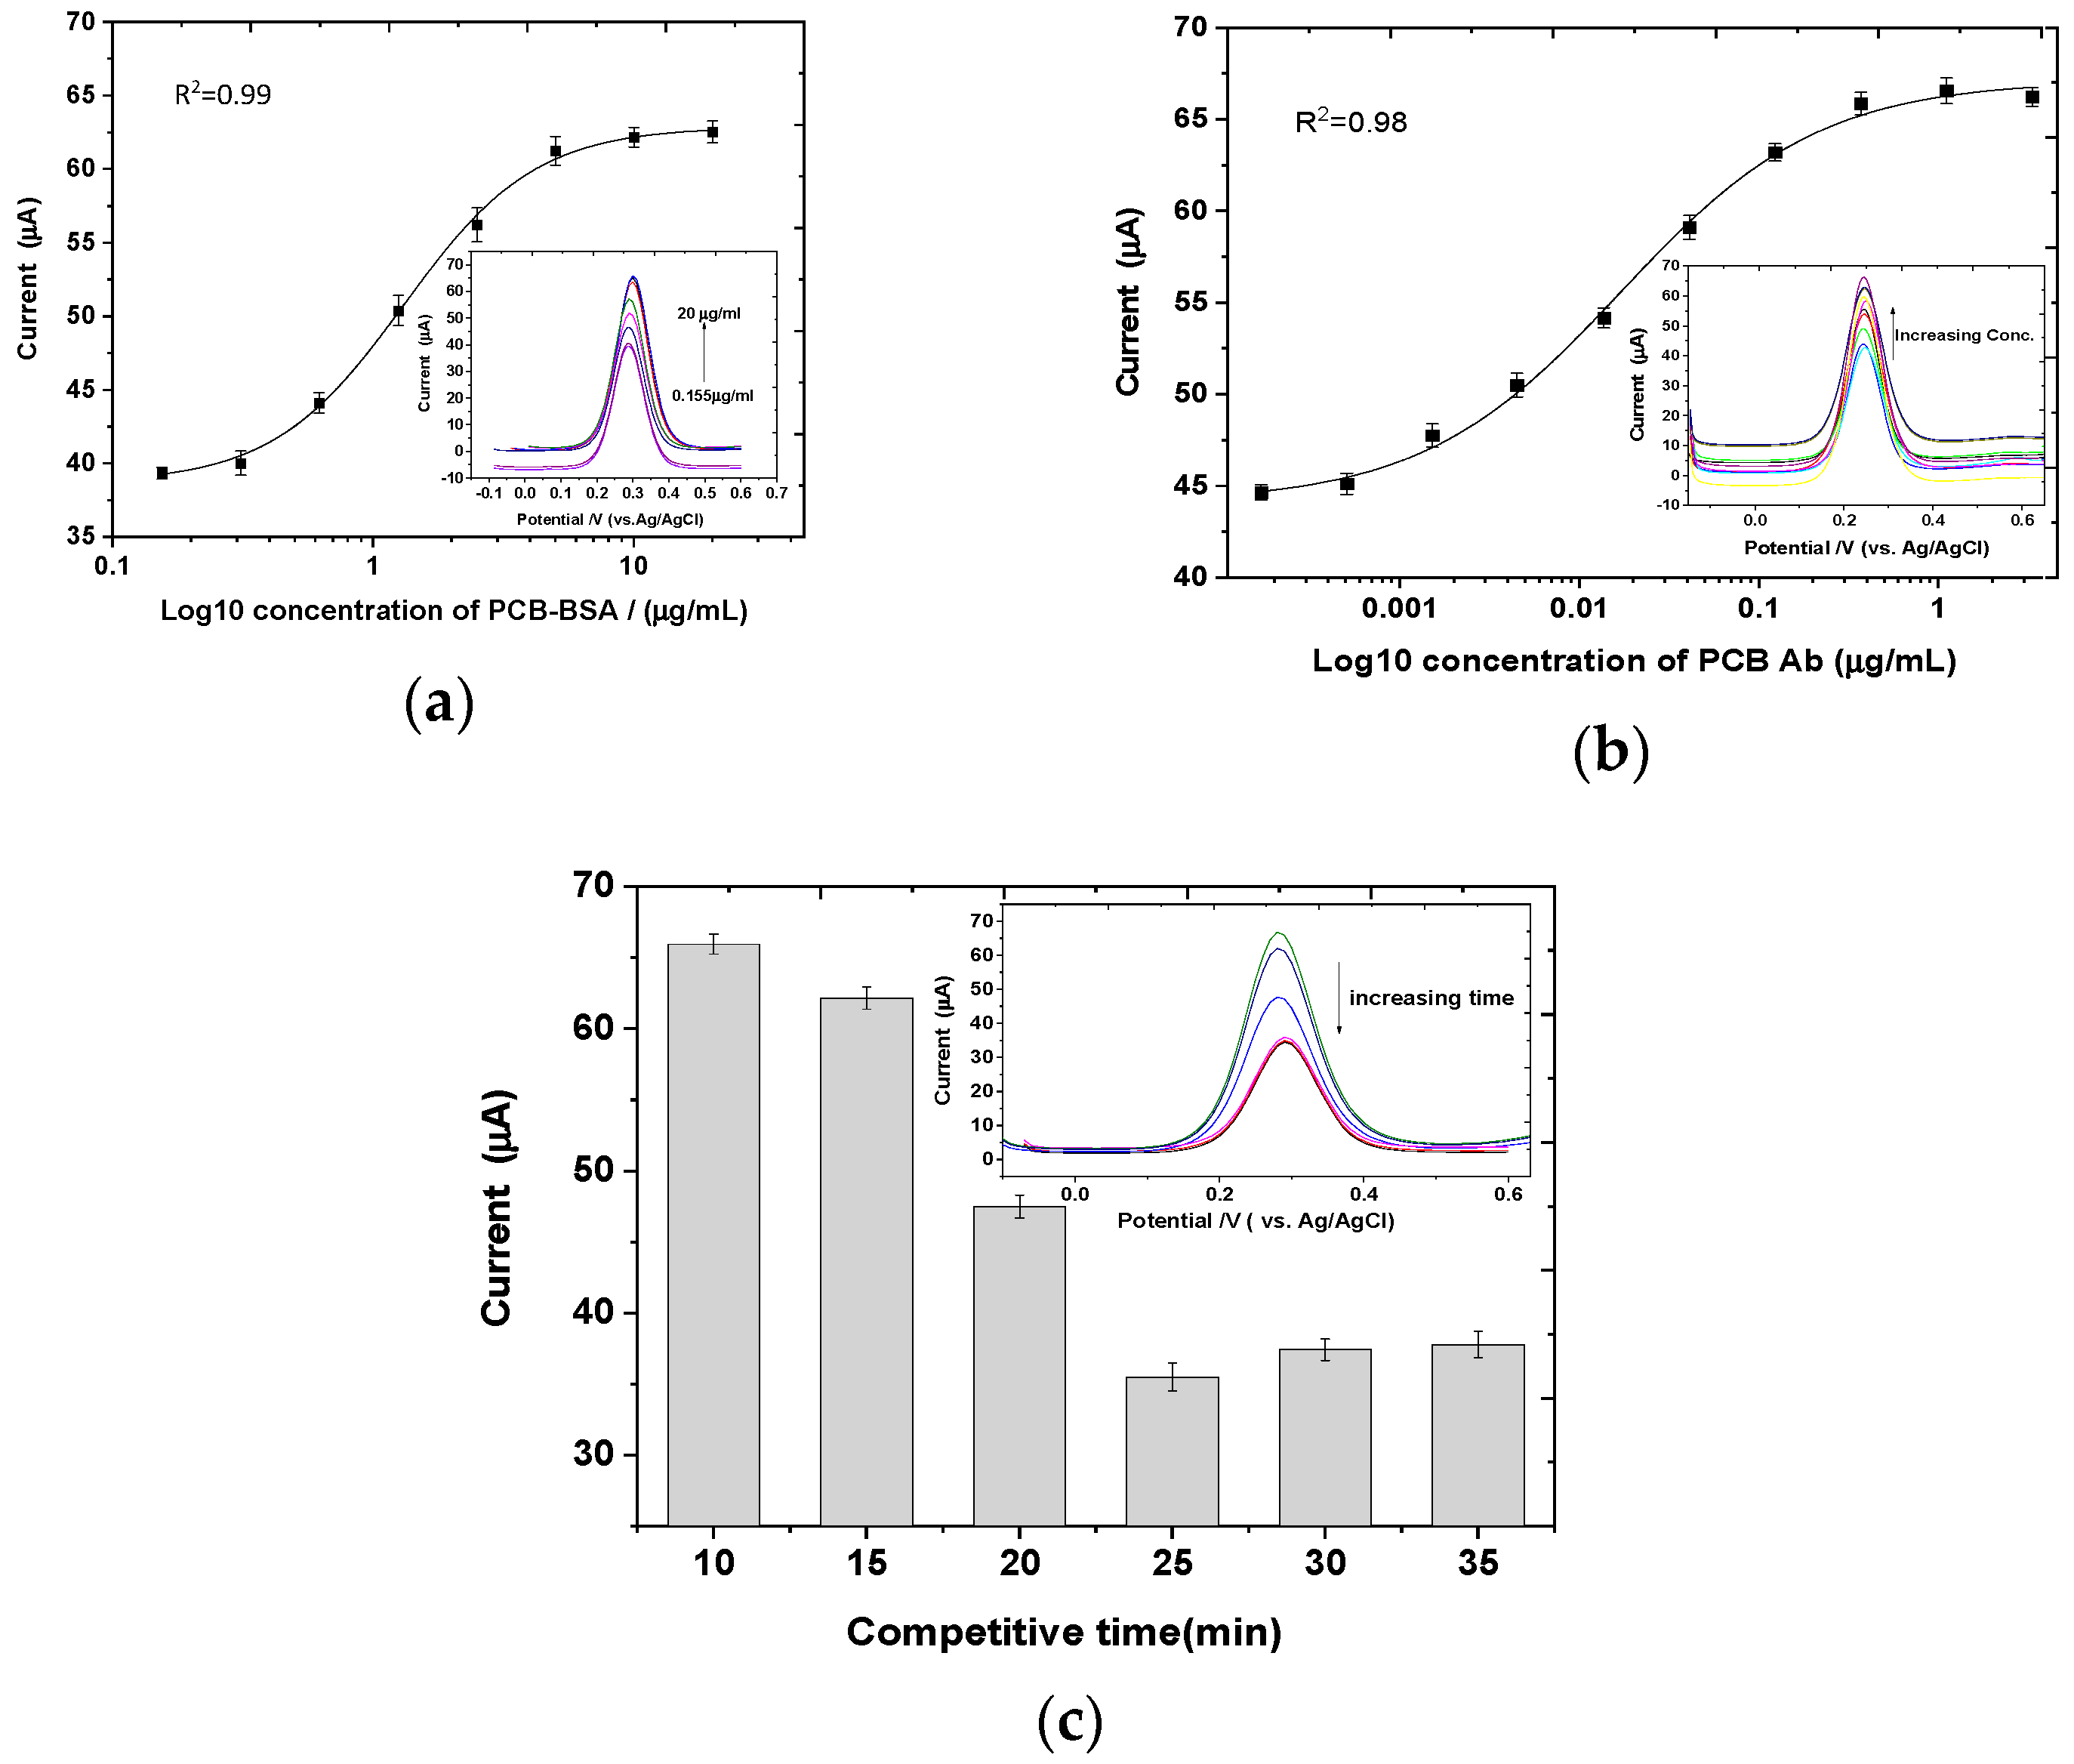
3.2. Optimization of the Assay Conditions

Different concentrations of BSA–Aroclor 1254 conjugate and anti-PCB Ab, and different competition times were selected to test the immunosensor. This test was performed using a capture assay and the concentration of BSA–Aroclor 1254 conjugate varied from 20 to 0.155 μg mL−1 in this study. The BSA–Aroclor 1254 conjugate was immobilized on the sensor surface in three independent experiments. As the concentration of BSA–Aroclor 1254 increased, there was an increase in the peak sensor currents. The concentration of the BSA–Aroclor 1254 conjugate (5–20 μg mL−1) did not affect the DPV current further; therefore, 5 μg mL−1 was chosen as the optimal concentration to use during the experiments, as shown in Figure 4a. Furthermore, 5 μg mL−1 BSA–Aroclor 1254 coating conjugate was immobilized on the electrodes and used to cover the electrodes completely, followed by blocking the chips with 1% BSA in Tris buffer (pH 7.4). The primary PCB antibody was serially diluted in concentrations ranging between 10 μg mL−1 and 0.0005 ng ml−1. As shown in Figure 4b, the optimal concentration of anti-PCB Ab was 0.246 µg/mL−1. The competitive times for PCB–BSA and PCBs standards were also optimized because of the competition with the finite anti-PCBs, which is a factor that affects the DPV response of the biosensor. Figure 4c shows the peak current progressed at a dramatic rate until it reached minimal intensity at 25 min (containing 25 ng mL−1 Aroclor 1254 concentration). Most of the PCB was bound specifically to anti-PCB, as shown in the data from 10 to 35 min. It is therefore optimal to have a 25 min competition time.

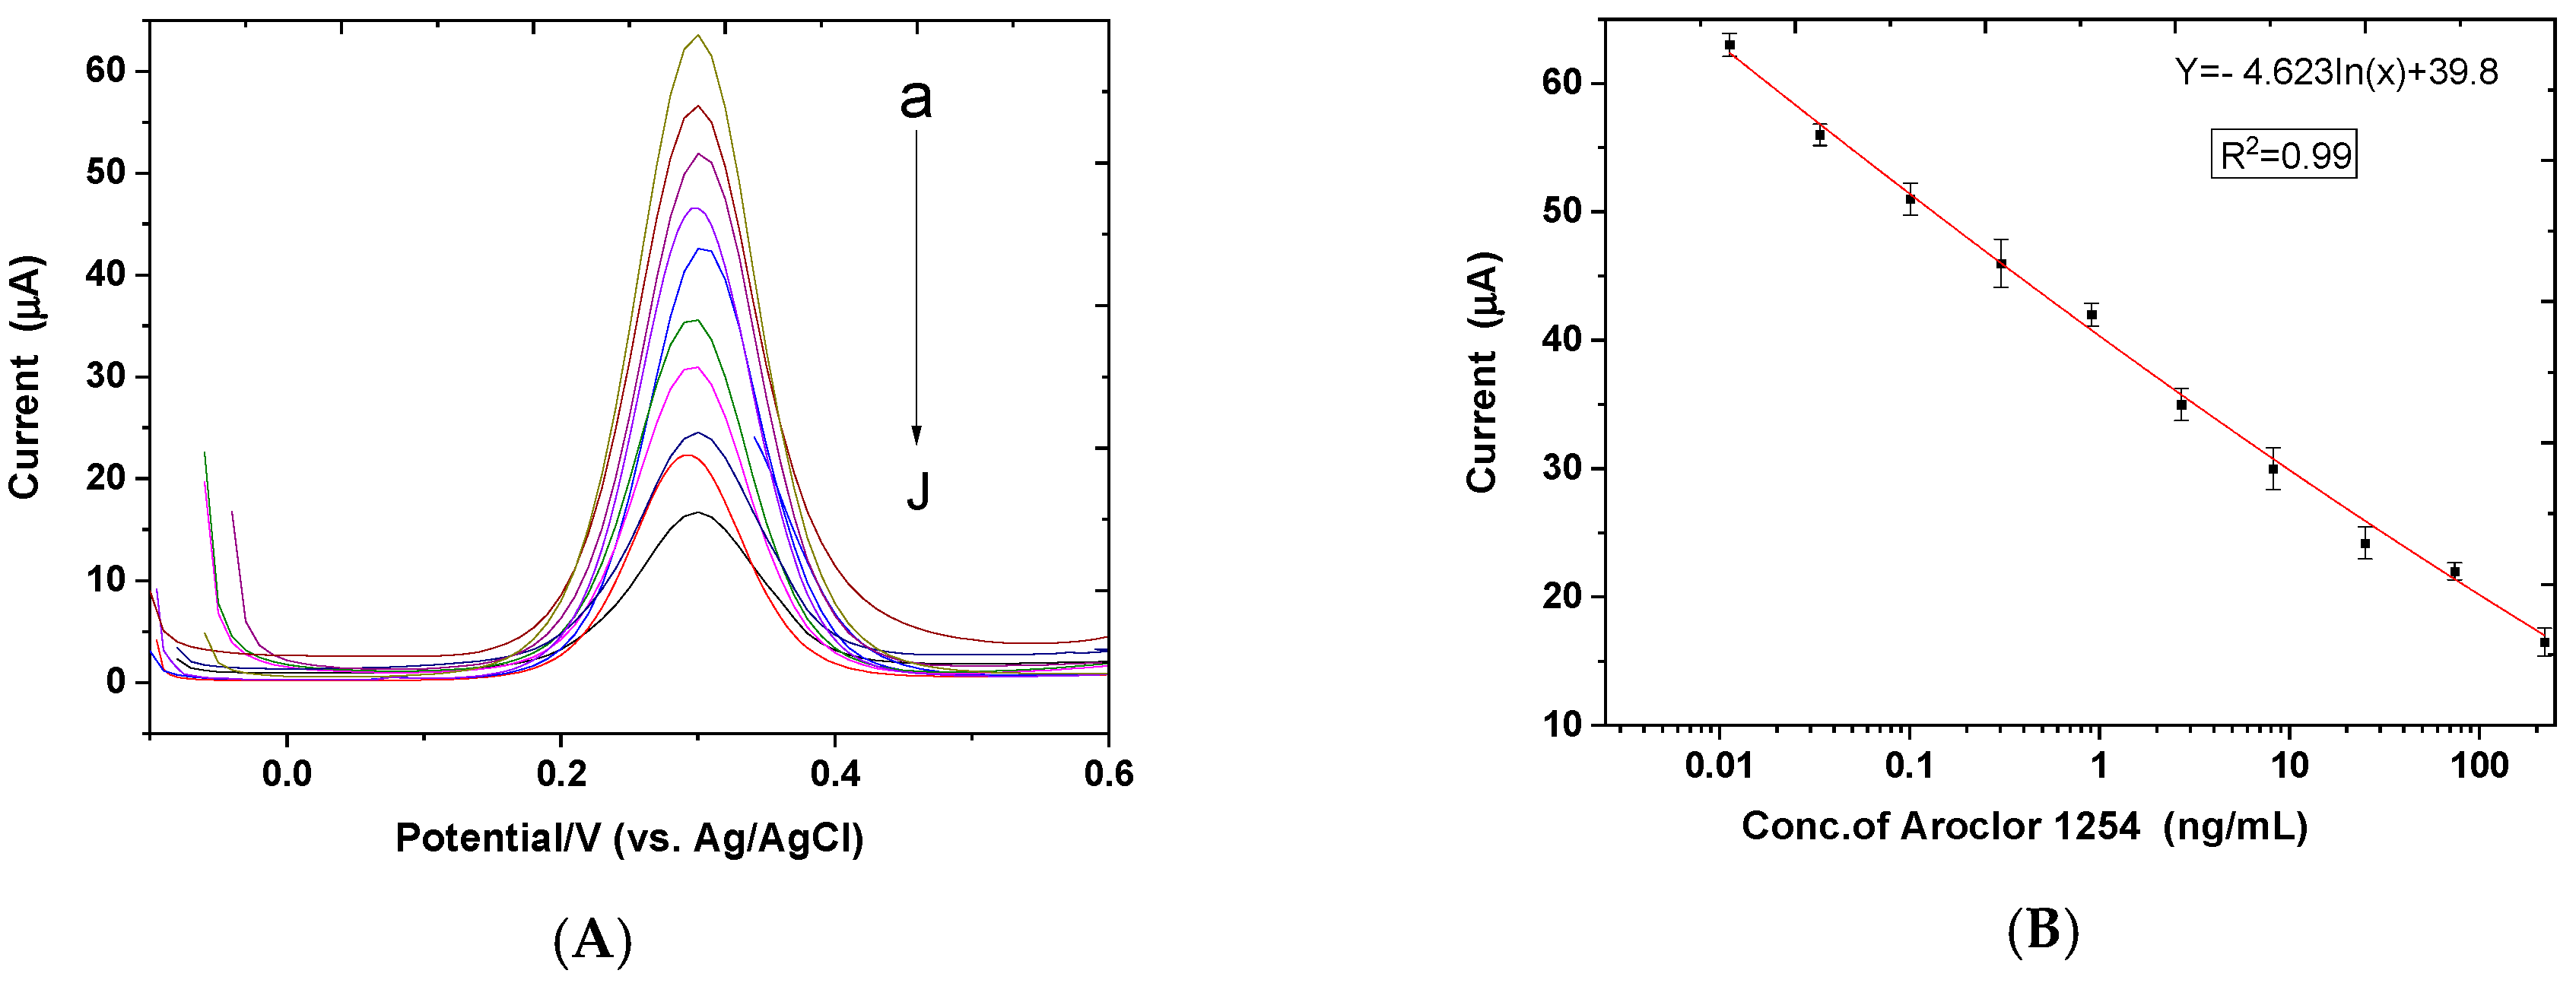
3.3. Sensitivity of the Immunosensor for PCB Aroclor 1254 Determination

Aroclor 1254 was examined under optimized conditions using DPV in PBS (pH 7.4) to assess its effects on analytical capability. The DPV redox peak currents shown in Figure 5 are clearly shown to decrease with increasing concentrations of Aroclor 1254. Results indicate that Aroclor 1254 and PCB-BSA were successfully incorporated. Figure 5B shows the current had a linear relationship with Aroclor-1254 concentration on a semilogarithmic scale. The concentration was between 0.011 and 220 ng mL−1. Additionally, the linear regression equation fit is shown (Y = −4.623In(x) + 39.8) (R2 = 0.99), and the limit of detection was estimated to be 0.11 ng mL−1. This was estimated to be three times that of the SD of the blank sample/slope. Table 3 shows a comparison with other existing PCB detection methods; the immunosensor demonstrated a wider linear dynamic range and an acceptable detection limit with a sensitivity of 4.62 μA ng−1.

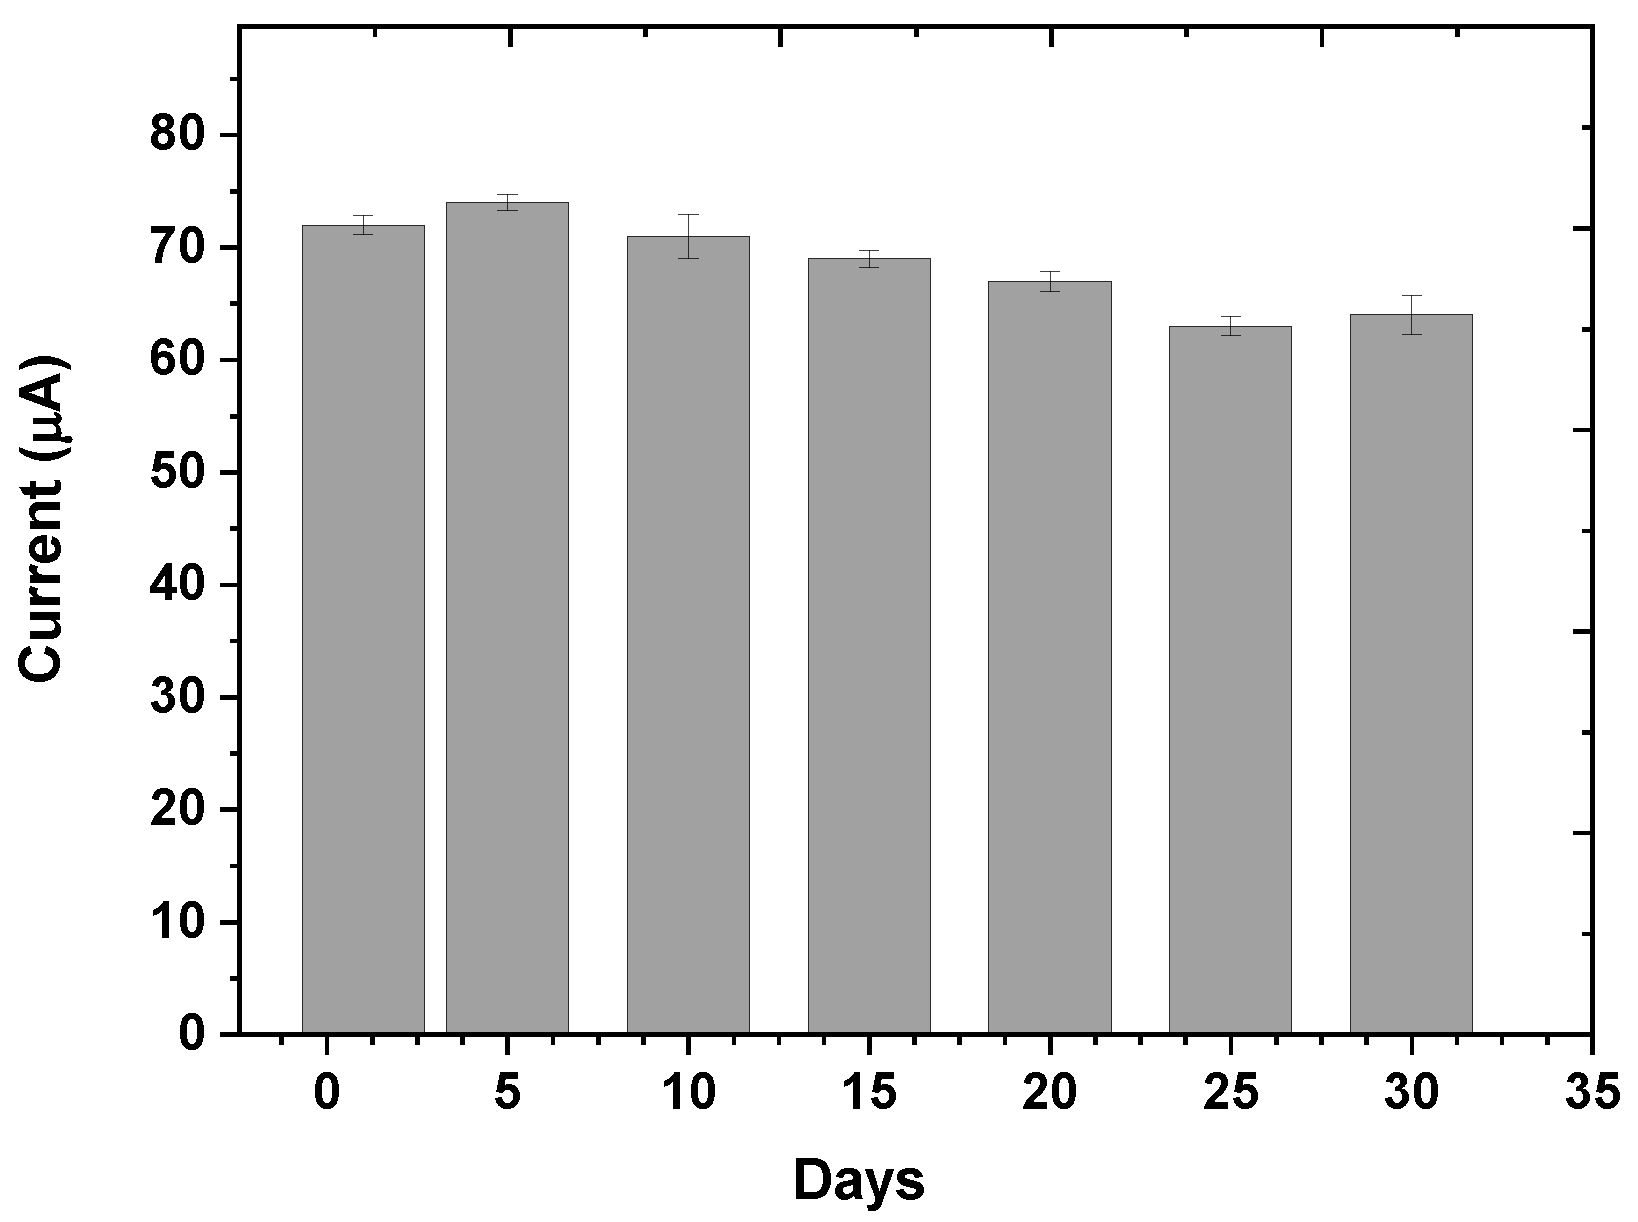
3.4. Reproducibility and Stability of the Designed Immunosensor

Electrochemical immunosensors were tested with PCB concentrations as high as 25 ng mL−1 across seven electrodes to verify the reproducibility. The relative RSD was 2.43%. According to the results, the fabricated immunosensor has high reproducibility and stability, which are important parameters in quantitative detection by immunosensors. In Figure 6, DPV was used for a complete assay every 5 days for a month (n = 3). After storing the immunosensor for 10 days, it maintained 98% of its original response, while maintaining 92% after 20 days. This electrode displayed excellent stability (RSD 5.9%) during a long period after being kept under dry conditions at 4 °C for 30 days. This might be due to the antibody being firmly attached to the gold surface, which is a reason for the good stability.

3.5. Real Sample Analysis

Aroclor 1254, which was added to the soil samples using the standard addition technique, was determined using the developed immunosensor. As shown in Table 4, the developed sensing device showed recovery values in the range 90–96% for a spiked soil sample. All samples were run in triplicate. This indicated highly reliable results, with an RSD value of 2.5% (n = 3). In comparison with the traditional ELISA method, the new immunosensor was effective and reliable in determining Aroclor 1254 prevalence in the soil samples. In this case, the developed electrode met higher performance standards than the standard instrument, so the results we obtained were more appealing. The fundamental analysis also revealed that the developed sensor had other advantages in terms of determining PCBs in soil samples, including high accuracy, high selectivity, and high sensitivity.

4. Conclusions

In this work, a highly sensitive, cost-effective, and label-free electrochemical immunosensor was used for the determination of PCBs (Aroclor 1254). A self-assembled, monolayer-modified electrode was used in an indirectly competitive format and the results were compared with those of other methods. This immunosensor had a linear range of 0.011–220 ng/mL−1 and a limit of detection (LOD) of 0.11 ng/mL−1 under optimum conditions. According to our analyses, the chip demonstrated good performance and stability and could be used to detect PCB compounds using the electrochemical immunosensor. This immunosensor could be incorporated into a portable device to carry out real-time measurements in the field. Moreover, the technique described can be improved using nanoparticles, such as gold nanoparticles (GNPs), to enhance the sensitivity and performance of the individual sensor measurements. This would improve the commercialization of the technique we present here. This would also reduce the steps required for immunoassay testing in the field. Hence, incorporating an organic-pollutant-monitoring platform into portable lab-on-a-chip technology would be a useful way to avoid the costly and inefficient analysis of samples in specialized laboratories.

Author Contributions

Supervision, E.M.; writing—original draft, S.A.; reviewing—original draft, T.B.; Data curation, Investigation, Methodology, I.A.; Investigation and Review and editing. H.A. All authors have read and agreed to the published version of the manuscript.

Funding

The Saudi Ministry of Higher Education and Cultural Bureau, Dublin supported this work.

Institutional Review Board Statement

Not applicable.

Informed Consent Statement

Not applicable.

Data Availability Statement

Data are contained within the article.

Conflicts of Interest

The authors declare that there is no conflict of interest from any parts.

Abbreviations

The following abbreviations were used in this manuscript:
∆Eppeak-to-peak separation
11-MUA11-mercaptoundecanoic acid
Ag/AgClsilver/silver chloride
Augold
BSAbovine serum albumin
CVcyclic voltammetry
EDC1-Ethyl-3-(3-(dimethylamino)-propyl) carbodiimide
ELISAenzyme-linked immunosorbent assay
HPLChigh performance liquid chromatography
K3Fe(CN)6potassium ferricyanide
K4Fe(CN)6potassium ferrocyanide
KCIpotassium chloride
LODlimit of detection
MeOHmethanol
NaClsodium chloride
NaCNBH4sodium cyanoborohydride
NaOHsodium hydroxide
NHSN-hydroxy succinimide
PAbpolyclonal antibodies
PBSphosphate-buffered saline
PCBpolychlorinated biphenyls
Rctcharge transfer resistance
SAMself-assembled monolayer
SPGEscreen-printed gold electrodes
TRIStris(hydroxylmethyl)aminomethane

References

  1. Biziuk, M. Environmental fate and global distribution of polychlorinated biphenyls Related papers Environmental Fate and Global Distribution of Polychlorinated Biphenyls. Artic. Rev. Environ. Contam. Toxicol. 2009, 201, 137–158. [Google Scholar] [CrossRef]
  2. Lauby-Secretan, B.; Loomis, D.; Grosse, Y.; El Ghissassi, F.; Bouvard, V.; Benbrahim-Tallaa, L.; Guha, N.; Baan, R.; Mattock, H.; Straif, K.; et al. Carcinogenicity of polychlorinated biphenyls and polybrominated biphenyls. Lancet Oncol. 2013, 14, 287–288. [Google Scholar] [CrossRef] [Green Version]
  3. Alsefri, S.; Balbaied, T.; Moore, E. Electrochemical Development of an Immunosensor for Detection Polychlorinated biphenyls (PCBs) for Environmental Analysis. Chemosensors 2021, 9, 307. [Google Scholar] [CrossRef]
  4. Han, D.; Currell, M.J. Persistent organic pollutants in China’s surface water systems. Sci. Total Environ. 2017, 580, 602–625. [Google Scholar] [CrossRef]
  5. Fu, J.; Mai, B.; Sheng, G.; Zhang, G.; Wang, X.; Peng, P.; Xiao, X.; Ran, R.; Cheng, F.; Peng, X.; et al. Persistent organic pollutants in environment of the Pearl River Delta, China: An overview. Chemosphere 2003, 52, 1411–1422. [Google Scholar] [CrossRef]
  6. Laschi, S.; Fránek, M.; Mascini, M. Screen-Printed Electrochemical Immunosensors for PCB Detection. Electroanal. Int. J. Devoted Fundam. Pract. Asp. Electroanal. 2000, 12, 1293–1298. [Google Scholar] [CrossRef]
  7. Hong, S.; Kang, T.; Oh, S.; Moon, J.; Choi, I.; Choi, K.; Yi, J. Label-free sensitive optical detection of polychlorinated biphenyl (PCB) in an aqueous solution based on surface plasmon resonance measurements. Sens. Actuators B Chem. 2008, 134, 300–306. [Google Scholar] [CrossRef]
  8. Bender, S.; Sadik, O.A. Direct Electrochemical Immunosensor for Polychlorinated Biphenyls. Environ. Sci. Technol. 1998, 32, 788–797. [Google Scholar] [CrossRef]
  9. Helen, C.; Lemasle, M.; Laplanche, A.; Genin, E. Determination of polychlorodibenzo-p-dioxins and polychlorodibenzofurans by gas chromatography/tandem mass spectrometry and gas chromatography/triple mass spectrometry in a quadrupole ion trap. J. Mass Spectrom. 2001, 36, 546–554. [Google Scholar] [CrossRef]
  10. Ottonello, G.; Ferrari, A.; Magi, E. Determination of polychlorinated biphenyls in fish: Optimisation and validation of a method based on accelerated solvent extraction and gas chromatography–mass spectrometry. Food Chem. 2014, 142, 327–333. [Google Scholar] [CrossRef]
  11. Popp, P.; Keil, P.; Möder, M.; Paschke, A.; Thuss, U. Application of accelerated solvent extraction followed by gas chromatography, high-performance liquid chromatography and gas chromatography–mass spectrometry for the determination of polycyclic aromatic hydrocarbons, chlorinated pesticides and polychlorinated dibenzo-p-dioxins and dibenzofurans in solid wastes. J. Chromatogr. A 1997, 774, 203–211. [Google Scholar] [CrossRef]
  12. Zajicek, J.L.; Tillitt, D.E.; Schwartz, T.R.; Schmitt, C.J.; Harrison, R.O. Comparison of an enzyme-linked immunosorbent assay (ELISA) to gas chromatography (GC)—Measurement of polychlorinated biphenyls (PCBs) in selected US fish extracts. Chemosphere 2000, 40, 539–548. [Google Scholar] [CrossRef] [Green Version]
  13. Lasrado, J.A.; Santerre, C.R.; Zajicek, J.L.; Stahl, J.R.; Tillitt, D.E.; Deardorff, D. Determination of PCBs in Fish Using Enzyme-linked Immunosorbent Assay (ELISA). J. Food Sci. 2003, 68, 133–136. [Google Scholar] [CrossRef]
  14. Fillmann, G.; Galloway, T.S.; Sanger, R.C.; Depledge, M.H.; Readman, J.W. Relative performance of immunochemical (enzyme-linked immunosorbent assay) and gas chromatography–electron-capture detection techniques to quantify polychlorinated biphenyls in mussel tissues. Anal. Chim. Acta 2002, 461, 75–84. [Google Scholar] [CrossRef]
  15. Endo, T.; Okuyama, A.; Matsubara, Y.; Nishi, K.; Kobayashi, M.; Yamamura, S.; Morita, Y.; Takamura, Y.; Mizukami, H.; Tamiya, E. Fluorescence-based assay with enzyme amplification on a micro-flow immunosensor chip for monitoring coplanar polychlorinated biphenyls. Anal. Chim. Acta 2005, 531, 7–13. [Google Scholar] [CrossRef]
  16. Inui, H.; Takeuchi, T.; Uesugi, A.; Doi, F.; Takai, M.; Nishi, K.; Miyake, S.; Ohkawa, H. Enzyme-Linked Immunosorbent Assay with Monoclonal and Single-Chain Variable Fragment Antibodies Selective to Coplanar Polychlorinated Biphenyls. J. Agric. Food Chem. 2012, 60, 1605–1612. [Google Scholar] [CrossRef]
  17. Syahir, A.; Usui, K.; Tomizaki, K.; Kajikawa, K.; Mihara, H. Label and Label-Free Detection Techniques for Protein Microarrays. Microarrays 2015, 4, 228–244. [Google Scholar] [CrossRef] [Green Version]
  18. Wang, S.; Zhao, S.; Wei, X.; Zhang, S.; Liu, J.; Dong, Y.; Florescu, M.; Jaffrezic-Renault, N. An Improved Label-Free Indirect Competitive SPR Immunosensor and Its Comparison with Conventional ELISA for Ractopamine Detection in Swine Urine. Sensors 2017, 17, 604. [Google Scholar] [CrossRef] [Green Version]
  19. Ge, L.; Li, S.P.; Lisak, G. Advanced sensing technologies of phenolic compounds for pharmaceutical and biomedical analysis. J. Pharm. Biomed. Anal. 2020, 179, 112913. [Google Scholar] [CrossRef]
  20. Švorc, Ľ. Determination of Caffeine: A Comprehensive Review on Electrochemical Methods. Int. J. Electrochem. Sci. 2013, 8, 5755–5773. [Google Scholar]
  21. Zheng, X.; Li, H.; Xia, F.; Tian, D.; Hua, X.; Qiao, X.; Zhou, C. An Electrochemical Sensor for Ultrasensitive Determination the Polychlorinated Biphenyls. Electrochim. Acta 2016, 194, 413–421. [Google Scholar] [CrossRef]
  22. Date, Y.; Aota, A.; Sasaki, K.; Namiki, Y.; Matsumoto, N.; Watanabe, Y.; Ohmura, N.; Matsue, T. Label-Free Impedimetric Immunoassay for Trace Levels of Polychlorinated Biphenyls in Insulating Oil. Anal. Chem. 2014, 86, 2989–2996. [Google Scholar] [CrossRef] [PubMed]
  23. Haji-Hashemi, H.; Norouzi, P.; Safarnejad, M.R.; Ganjali, M.R. Label-free electrochemical immunosensor for direct detection of Citrus tristeza virus using modified gold electrode. Sens. Actuators B Chem. 2017, 244, 211–216. [Google Scholar] [CrossRef]
  24. Liu, X.; Duckworth, P.A.; Wong, D.K.Y. Square wave voltammetry versus electrochemical impedance spectroscopy as a rapid detection technique at electrochemical immunosensors. Biosens. Bioelectron. 2010, 25, 1467–1473. [Google Scholar] [CrossRef]
  25. Frederix, F.; Bonroy, K.; Laureyn, W.; Reekmans, G.; Campitelli, A.; Dehaen, W.; Maes, G. Enhanced performance of an affinity biosensor interface based on mixed self-assembled monolayers of thiols on gold. Langmuir 2003, 19, 4351–4357. [Google Scholar] [CrossRef]
  26. Briand, E.; Salmain, M.; Herry, J.M.; Perrot, H.; Compère, C.; Pradier, C.M. Building of an immunosensor: How can the composition and structure of the thiol attachment layer affect the immunosensor efficiency? Biosens. Bioelectron. 2006, 22, 440–448. [Google Scholar] [CrossRef] [Green Version]
  27. Bhattarai, J.K.; Tan, Y.H.; Pandey, B.; Fujikawa, K.; Demchenko, A.V.; Stine, K.J. Electrochemical impedance spectroscopy study of Concanavalin A binding to self-assembled monolayers of mannosides on gold wire electrodes. J. Electroanal. Chem. 2016, 780, 311–320. [Google Scholar] [CrossRef] [Green Version]
  28. Fischer, L.M.; Tenje, M.; Heiskanen, A.R.; Masuda, N.; Castillo, J.; Bentien, A.; Émneus, J.; Jakobsen, M.H.; Boisen, A. Gold cleaning methods for electrochemical detection applications. Microelectron. Eng. 2009, 86, 1282–1285. [Google Scholar] [CrossRef]
  29. Lu, M.; Li, X.; Yu, B.; Li, H. Electrochemical Behavior of Au Colloidal Electrode through Layer-by-Layer Self-Assembly. J. Colloid Interface Sci. 2002, 248, 376–382. [Google Scholar] [CrossRef]
  30. Fan, L.; Wang, G.; Liang, W.; Yan, W.; Guo, Y.; Shuang, S.; Dong, C.; Bi, Y. Label-free and highly selective electrochemical aptasensor for detection of PCBs based on nickel hexacyanoferrate nanoparticles/reduced graphene oxides hybrids. Biosens. Bioelectron. 2019, 145, 111728. [Google Scholar] [CrossRef]
  31. Dutta, G.; Lillehoj, P.B. Wash-free, label-free immunoassay for rapid electrochemical detection of PfHRP2 in whole blood samples. Sci. Rep. 2018, 8, 1–8. [Google Scholar] [CrossRef] [PubMed]
  32. Bakshi, S.; Mehta, S.; Kumeria, T.; Shiddiky, M.J.A.; Popat, A.; Choudhury, S.; Bose, S.; Nayak, R. Rapid fabrication of homogeneously distributed hyper-branched gold nanostructured electrode based electrochemical immunosensor for detection of protein biomarkers. Sens. Actuators B Chem. 2021, 326, 128803. [Google Scholar] [CrossRef]
  33. Xiao, X.; Li, H.; Wang, M.; Zhang, K.; Si, P. Examining the effects of self-assembled monolayers on nanoporous gold based amperometric glucose biosensors. Analyst 2014, 139, 488–494. [Google Scholar] [CrossRef]
  34. Centi, S.; Laschi, S.; Fránek, M.; Mascini, M. A disposable immunomagnetic electrochemical sensor based on functionalised magnetic beads and carbon-based screen-printed electrodes (SPCEs) for the detection of polychlorinated biphenyls (PCBs). Anal. Chim. Acta 2005, 538, 205–212. [Google Scholar] [CrossRef]
  35. Deng, A.; Franek, M.; Kolar, V. Food and Agricultural Immunology Determination of Atrazine in Soil Samples by ELISA Using Polyclonal and Monoclonal Antibodies. Agric. Immunol. 2010, 11, 135–144. [Google Scholar] [CrossRef]
  36. Chen, D.; Li, J. Interfacial design and functionization on metal electrodes through self-assembled monolayers. Surf. Sci. Rep. 2006, 61, 445–463. [Google Scholar] [CrossRef]
  37. Laschi, S.; Mascini, M.; Scortichini, G.; Fra, M.; Nek, Ä.; Mascini, M. Polychlorinated Biphenyls (PCBs) Detection in Food Samples Using an Electrochemical Immunosensor. J. Agric. Food Chem. 2003, 51, 1816–1822. [Google Scholar] [CrossRef]
Figure 1. Functionalization steps of PCB immunoassay on SPGE, reprinted from reference [31], Springer Nature, 2018.
Electrochem 03 00031 g001
Figure 2. Studies on different chip-cleaning procedures. CV was scanned in mM [Fe(CN)6]3−/4− redox coupled with a 50 mV/s scan rate.
Electrochem 03 00031 g002
Figure 3. Influence of the scan rates on the CV signals measured in 5 mM [Fe(CN)6]3/4 in 1 M KCL. The potential applied was from −0.2 to 0.6 V.
Electrochem 03 00031 g003
Figure 4. (a) Optimized concentration of PCB-BSA conjugate using capture assay. Detection was DPV (n = 3). The optimized concentration of the PCB-BSA conjugate was 5 µg/mL. (b) Optimized concentration of PCB using capture assay. Detection was DPV (n = 3). The optimized concentration of PCB was 0.246 µg/mL, which is less than the optical, which was 0.465 µg/mL. (c) Competition time for immunosensor response. Detection was DPV (n = 3).
Electrochem 03 00031 g004
Figure 5. (A) Typical DPV response of the designed immunosensor to Aroclor 1254 concentrations: (a) 0.011, (b) 0.033, (c) 0.101, (d) 0.304, (e) 0.91, (f) 2.7, (g) 8.2, (h) 25, (i) 74, and (j) 220 ng/mL−1. (B) Plot of DPV current with respect to logarithms of different Aroclor 1254 concentrations.
Electrochem 03 00031 g005
Figure 6. The stability of Aroclor 1254 detection by the immunosensor during 30 days.
Electrochem 03 00031 g006
Table 1. The values of peak-to-peak separation using different cleaning protocols.
Cleaning ProtocolsEpa (V)Epc (V)ΔEP (mV) *
Plasma cleaning0.2260.16858
Ultrasonicating0.2260.16066
NH3 + H2O20.2420.17270
H2SO40.2460.16086
* ΔEP = EPa − Epc.
Table 2. Influence of the scan rate on the half-peak potential and the peak current for the oxidation component of the process. The scan rates studied were 5, 10, 20, 50, 70, 100, 150, and 200 mV s−1.
Scan Rate (mV/s)Ipa (µA) cΔEp (mV) bEmid vs. Ag/Ag CL (Mv) a
20034.5958193
15030.0164194
10024.8058193
7020.8362191
5017.3864192
2011.1868192
107.9868194
55.7170198
a Measured from the value ½ (Epc + Epa) versus Ag/AgCl reference electrode; b ∆Ep = (Epc − Epa); c Ep anodic data as a function of scan rate.
Table 3. Performance of diverse electrochemical detection methods.
MethodDetection ModeLinear RangeLODAmplificationReal SampleRef.
DPV-1–1000.22 ng/LNoneWater[30]
EISNoncompetitive0.01–10 μg/L0.001 μg/LNoneOil[22]
DPVCompetitive0.01–50 ppm5.2 ppmAP (ALP)Food[37]
LSVCompetitive0.1–2200.09 ng/mL−1AP (ALP)Water[3]
DPVCompetitive0.011–2200.11 ng/mL−1NoneSoilThis work
Table 4. SPGE electrochemical and ELISA (immunoassay) approaches for the determination of Aroclor 1254 in soil samples (n = 3).
TechniquesSampleAdded (ng/mL−1)Found (ng/mL−1)Recovery %RSD % (n = 3).
ELISASoil8.210.54128.534.4%
ELISASoil2526.41105.643.6%
ElectrochemicalSoil8.27.8996.211.7%
ElectrochemicalSoil2522.74902.5 %
Publisher’s Note: MDPI stays neutral with regard to jurisdictional claims in published maps and institutional affiliations.

