Article

Composite Multi-Parameter Sensor Based on Misaligned Peanut-Shaped Structure for Measuring Strain and Temperature


1
School of Physics and Technology, University of Jinan, Jinan 250022, China
2
Institute of Optoelectronic Technology, Taishan University, Taian 271021, China
*
Authors to whom correspondence should be addressed.
Optics 2026, 7(1), 12; https://doi.org/10.3390/opt7010012
Submission received: 4 December 2025 / Revised: 22 January 2026 / Accepted: 2 February 2026 / Published: 4 February 2026

Abstract

A composite fiber optic sensor based on a misaligned peanut-shaped structure and the single-mode fiber–multimode fiber–single-mode fiber (SMS) structure is proposed for simultaneous strain and temperature measurements. The misaligned peanut-shaped structure is formed by introducing a certain core-offset during fusion splicing. Through a simulation analysis of the sensor, the optical field distribution of the sensor structure under different offset amounts is obtained. The experimental results demonstrate that the sensor achieves a maximum strain sensitivity of −48.21 pm/µε with an offset of 35.61 µm under a strain range of 0–600 µε and a maximum temperature sensitivity of 124.29 pm/°C at a 24.35 µm offset with a temperature range of 35–95 °C. Meanwhile, the sensor with a 35.61 µm offset has two resonance peaks that are selected for simultaneous measurements, with strain sensitivities of −48.21 pm/µε and −47.04 pm/µε and temperature sensitivities of 75.71 pm/°C and 84.29 pm/°C, respectively. Therefore, the simultaneous measurement of the strain and temperature can be achieved through a matrix method, demonstrating that the sensor possesses a dual-parameter sensing capability for the strain and temperature.

1. Introduction

Optical fiber sensors are increasingly applied for the measurement of various physical parameters, including strain [1], curvatures [2], the refractive index [3], and temperature [4], which is owing to their compact size, high sensitivity, rapid response speed, and excellent immunity to electromagnetic interference. In recent years, simultaneous multi-parameter sensing has become a research focus in the field, particularly emphasizing high-precision strain measurement along with stability and reliability under complex environmental conditions. The challenge in practical applications is overcoming temperature and other cross-sensitivity effects on strain measurements and effectively decoupling errors from multi-physical field coupling. To this end, several advanced optical fiber sensors for high-sensitivity strain sensing have been developed, such as fiber Bragg gratings (FBGs) [5], long-period fiber gratings (LPFGs) [6], and photonic crystal fibers (PCFs) [7]. These designs not only provide high strain sensitivity with low crosstalk but also enable the simultaneous monitoring of other parameters, such as the temperature and refractive index. However, complex fabrication processes and high production costs limit their widespread practical application.
In 2012, Di Wu et al. first proposed a method for fabricating peanut-shaped structures and demonstrated a simple, low-cost MZI using only single-mode fibers (SMFs), which consisted of two cascaded peanut-shaped structures [8]. The peanut-shaped structure exhibits advantages of simple fabrication, a compact configuration, low costs, and excellent anti-electromagnetic interference. These intrinsic advantages make it suitable for optical fiber sensing applications and provide a solid foundation for further research. The reported sensor exhibited a temperature sensitivity of 46.8 pm/°C over a sensing length of 22 mm, while its strain sensitivity was only 1.4 pm/µε. With the in-depth development of research, the application of peanut-shaped structures has been extended to diverse physical parameter measurements, covering the refractive index [9], temperature [10], curvature [11], magnetic field intensity [12], liquid level [13], and other fields. In the field of optical fiber strain sensing, several structural designs have been proposed. For example, in 2014, Shuo Yuan et al. designed and fabricated a sensor based on a spherical structure from SMFs, which achieved a temperature sensitivity of 0.1193 nm/°C within a wide temperature range of 25–735 °C, though its strain sensitivity was only −0.0012 nm/με [14]. In 2015, Lingya Lv et al. proposed a sensor that consists of a two-peanut-taper MZI and an in-line embedded FBG [15]. The sensor, with a total length of 35 mm, exhibited strain sensitivities of 1.07 pm/με and 0.891 pm/με for the MZI and FBG, respectively, while their corresponding temperature sensitivities reached 55.35 pm/°C and 10.85 pm/°C. After tapering the central region of the sensor with a fusion splicer, the strain sensitivity of the MZI was enhanced to 1.93 pm/με. In recent years, researchers have further explored more complex structural designs. In 2022, Shiying Xiao et al. designed a triple-peanut-taper MZI sensor, which improved the temperature sensitivity to 78.29 pm/°C, yet its strain sensitivity was −0.639 pm/με [16]. Although peanut-shaped structures have demonstrated considerable potential across multiple sensing domains, their performance in strain measurement requires further enhancement to enable further applications in high-precision scenarios. Therefore, the development of peanut-shaped sensors with high strain sensitivity has become a critical research focus. Under such circumstances, the proposed peanut-shaped structure in this study shows an improved strain sensitivity compared to previously reported designs.
In this work, we introduce an improved peanut-shaped structure by adding a controlled offset during fusion splicing, resulting in an offset peanut-shaped structure. The proposed sensor integrates an SMS structure with an offset peanut-shaped structure. Experimental results demonstrate that the offset significantly enhances the strain sensitivity. Notably, within a certain range, the temperature sensitivity exhibits an increasing trend with larger offset values. Specifically, with a maximum offset of 35.61 µm, the strain sensitivities for two resonance peaks reached −48.21 pm/µε and −47.04 pm/µε, respectively, and the corresponding temperature sensitivities reached 75.71 pm/°C and 84.29 pm/°C within 35–95 °C. Owing to the discriminative responses of the two resonance peaks to the strain and temperature, the simultaneous measurement of these two parameters is realized.

2. Fabrication and Sensing Principle

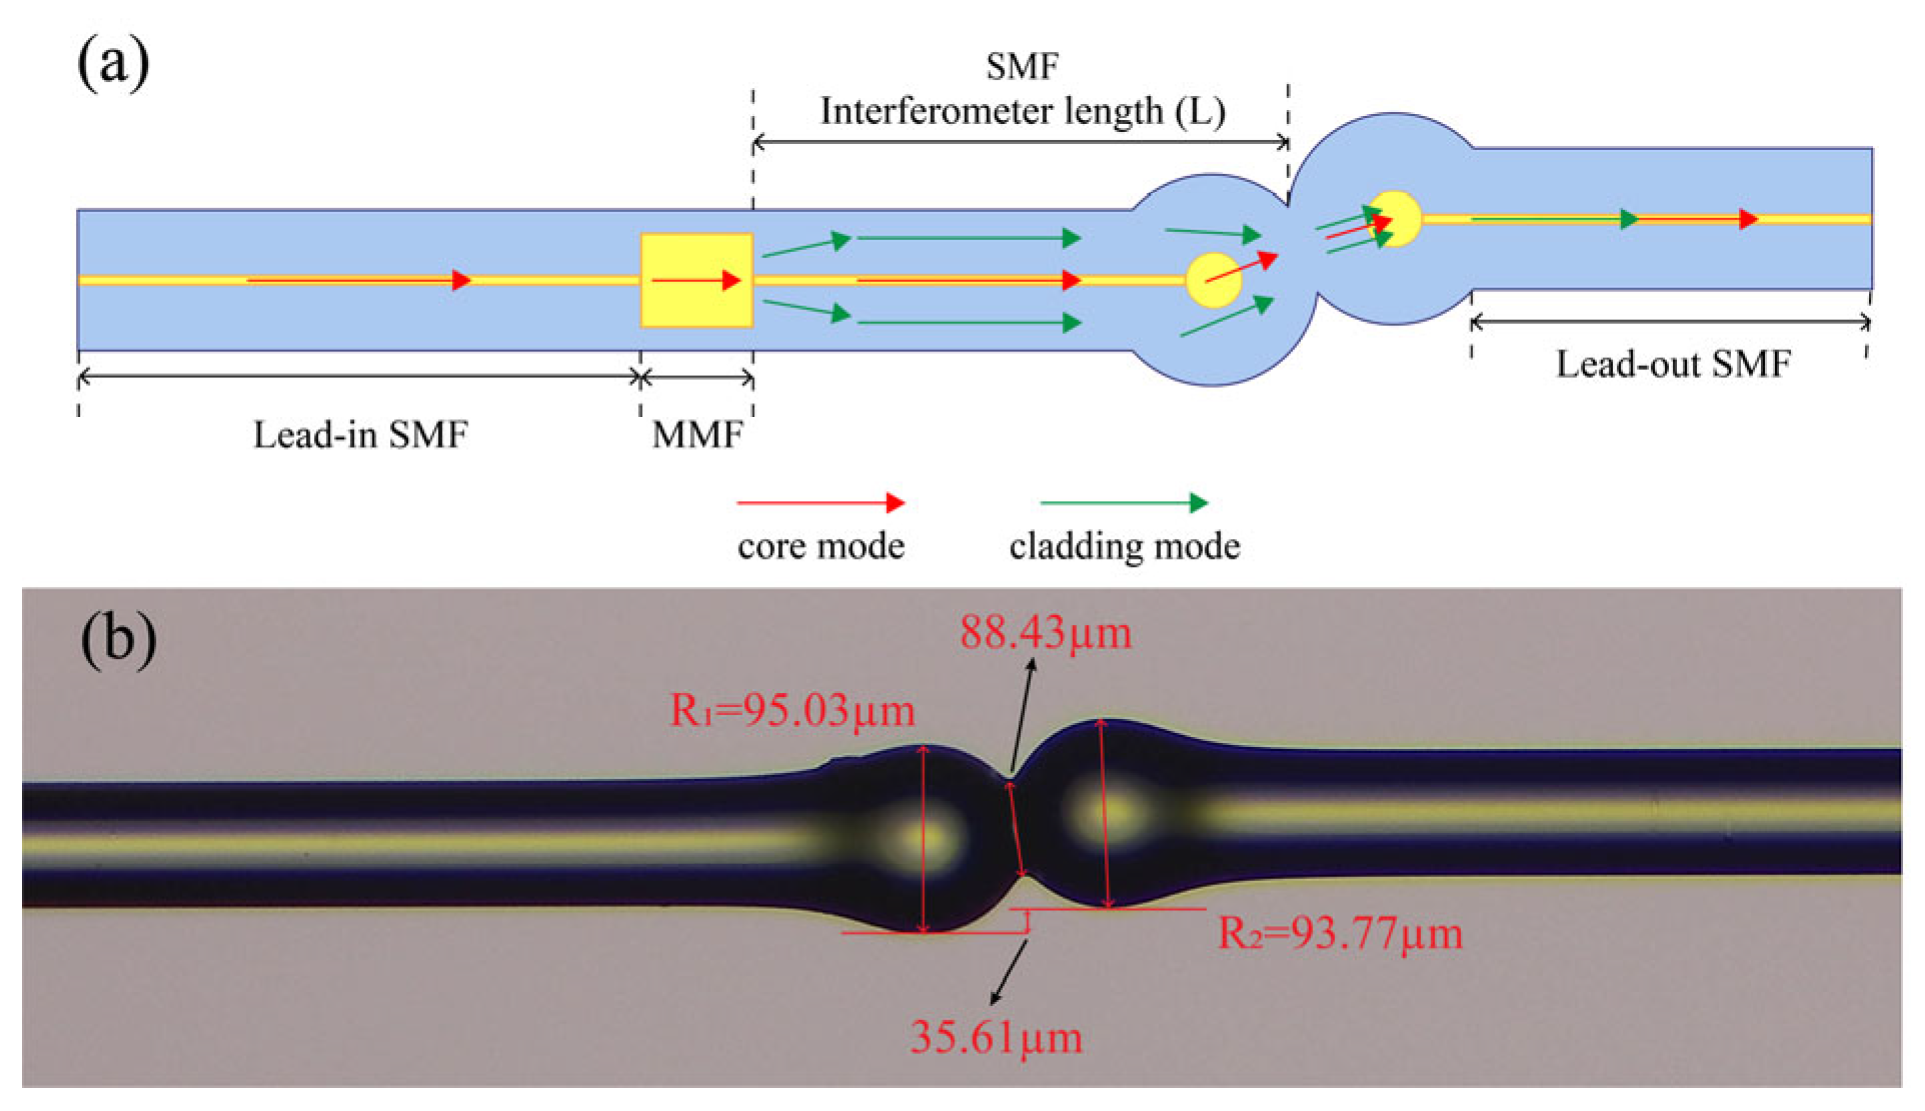
The sensor presented in this work was fabricated using SMFs (YOFC, Wuhan, China, G652 D, 9/125 µm) and MMFs (Fibestar, Beijing, China, IR105/125-AC, 105/125 µm). The schematic of this sensor structure is shown in Figure 1.
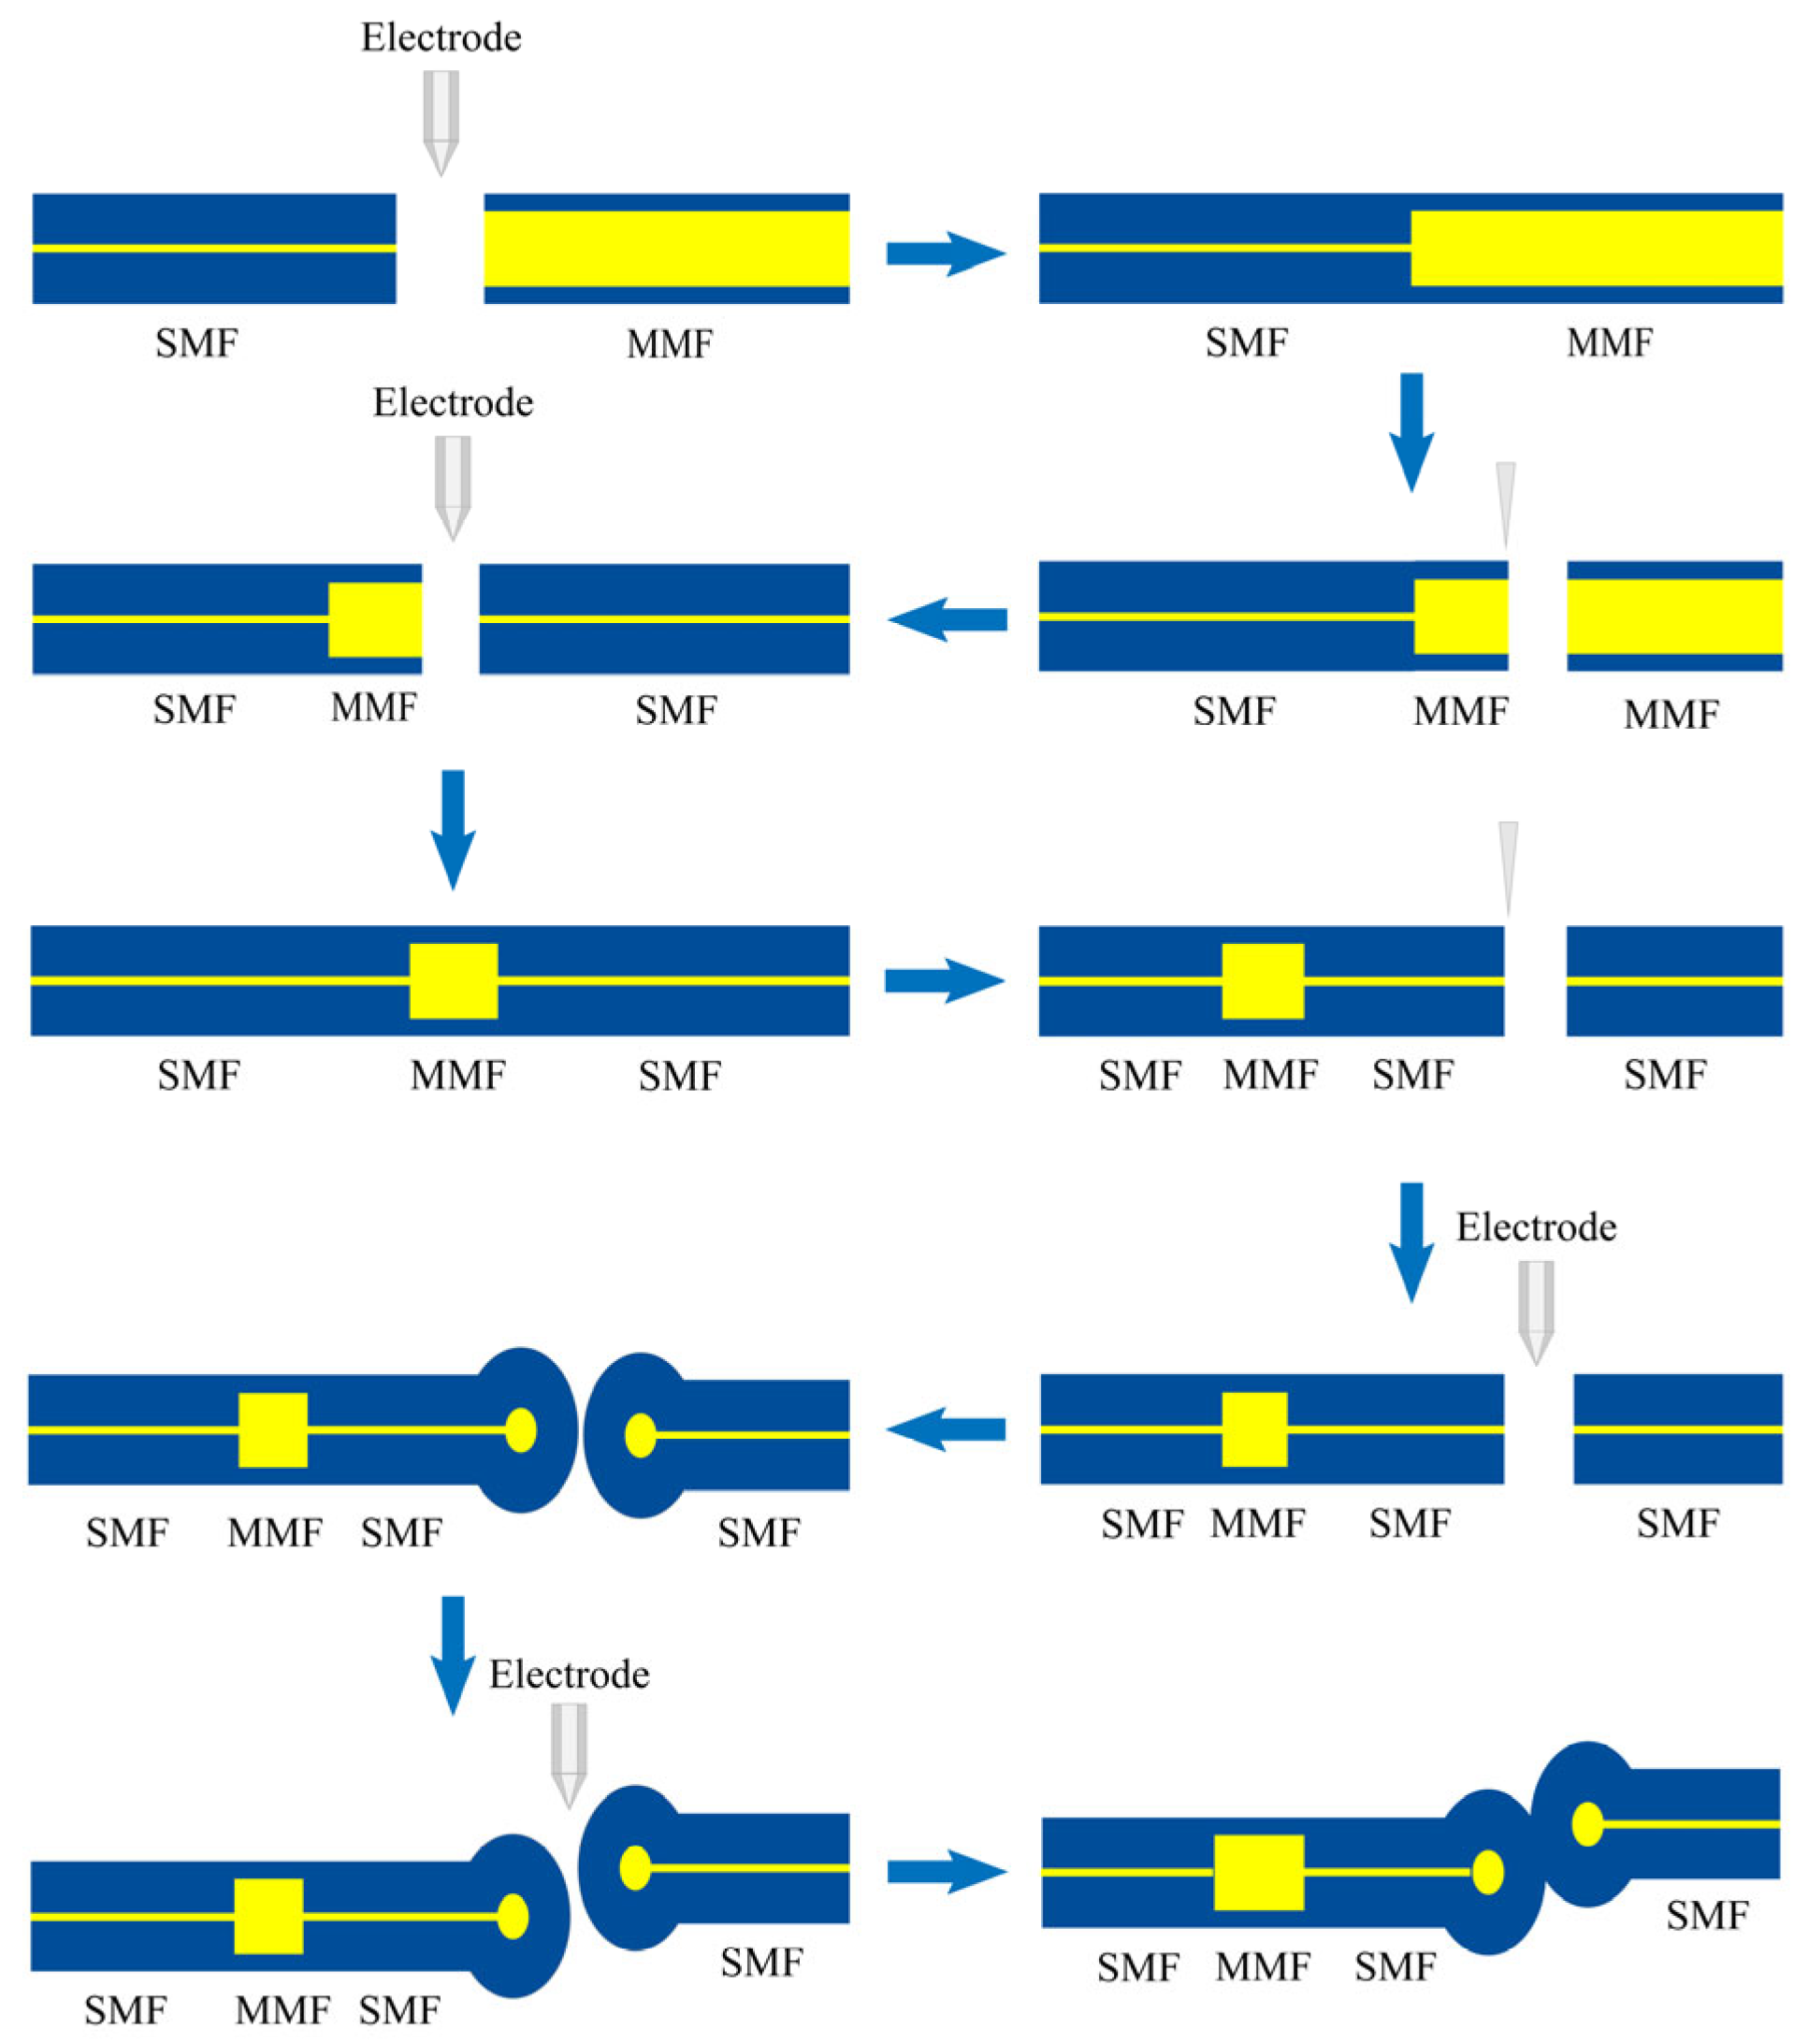
As shown in Figure 2, the sensor was fabricated with an SMS fusion structure and an offset peanut-shaped structure. The procedure is as follows: First, the SMS structure was fabricated with an MMF segment measuring 3 mm, followed by the cleaving of the trailing SMF to a length of 1 cm. Then, another SMF section was stripped of its coating, and the cleaved ends of two SMF segments were fused with a fusion splicer (Fujikura, Tokyo, Japan, FSM-87S) to form two spherical structures. Finally, the positions of the two spherical structures were manually adjusted via the manual mode of the fusion splicer to achieve offset splicing. The fusion splicer parameters for manufacturing this structure are as follows: cleaning voltage—700 mV; cleaning time—1000 ms; prefusion voltage—10 mV; prefusion time—200 ms; fusion voltage—950 mV; fusion time—2000 ms; and fusion overlap—20 µm.
Using this method, four offset peanut-shaped structures were fabricated with offsets of 0 µm, 12.6 µm, 24.35 µm and 35.61 µm, respectively. The interference spectrum is affected by the lengths of the MMF and intermediate SMF in the sensing region, while the MMF length determines the mode coupling coefficient when light is coupled into the intermediate SMF [17]. Consequently, the lengths of the MMF and SMF were selected as 3 mm and 1 cm, respectively, to obtain a compact sensor size, low insertion loss, and a high interference spectrum extinction ratio.
The operational principle of the sensor is depicted in Figure 1a. Owing to the core diameter mismatch between the MMF and the SMF, a portion of the optical power is coupled into the cladding region of the intermediate SMF when light is incident from the MMF to the SMF, which gives rise to the excitation of both the fundamental core mode ( L P 01 ) and higher-order cladding modes ( L P 0 m ,   m 1 ). As these two modes propagate simultaneously in the SMF, a phase difference is generated. When they pass through the offset peanut-shaped structure at the other end, they are coupled together again, forming an MZI.
During optical propagation, the output light intensity of the sensor can be defined as [18]
I = I c o r e + m n I m n + 2 I c o r e I m n cos Δ ϕ
where I core and I mn represent the light intensities of the fiber core and cladding modes in the interferometer, respectively. And the phase difference between them can be expressed as
Δ ϕ = 2 π λ n e f f c o r e - n e f f c l a d , i L = 2 π L λ Δ n e f f
where n e f f c o r e and n e f f c l a d , i represent the effective refractive indexes of the fiber core and the i-order cladding modes, respectively; Δ n e f f represents the effective refractive index difference between the core and cladding modes; L denotes the interference length; and λ is the central wavelength of the light source.
The interference spectrum exhibits a minimum light intensity when the phase is 2 ( m + 1 ) π and a maximum light intensity when the phase is 2 m π , where m is a positive integer. Based on these interference phase conditions, the wavelength of the interference dip can be obtained [13]:
λ m = 2 L 2 m + 1 Δ n e f f ( m = 1 , 2 , 3 )
When the sensing region is subjected to changes in strain or external temperature, alterations occur in Δ n e f f and L, which lead to shifts in the wavelength of the interference dip. The total wavelength shift in the interference dip arising from strain and external temperature variations is given by [19].
Δ λ m = K ε , m · Δ ε + K T , m · Δ T = λ m 1 + L Δ n e f f · Δ n e f f L Δ ε + 1 L · L T + 1 Δ n e f f · Δ n e f f T Δ T
where K ε , m and K T , m denote the strain and temperature sensitivities of the interference dip, respectively; Δ ε and Δ T represent the variations in the strain and external temperature, respectively.
This sensor uses an MMF of 105/125 µm that serves as both a beam splitter and a coupler. Due to its large mode field diameter, the MMF enhances light coupling from the preceding SMS structure into the subsequent offset peanut-shaped structure. The light propagation behavior and intensity distribution of the sensor were numerically simulated using the beam propagation method (BPM) in RSoft 2020 software. In order to systematically study the impact of the offset on the sensor performance, simulations were conducted for peanut-shaped structures with offsets of 0 µm, 24.35 µm and 35.61 µm to analyze their optical field energy distribution. The partial simulation parameters are set as follows: the refractive indices of the core and cladding of the MMF are 1.5 and 1.455, respectively, while those of the SMF are 1.4501 and 1.4449, respectively. The lengths of the lead-in SMF, lead-out SMF, the MMF, and the middle SMF segment are 500 µm, 500 µm, 3000 µm, and 10,000 µm, respectively.
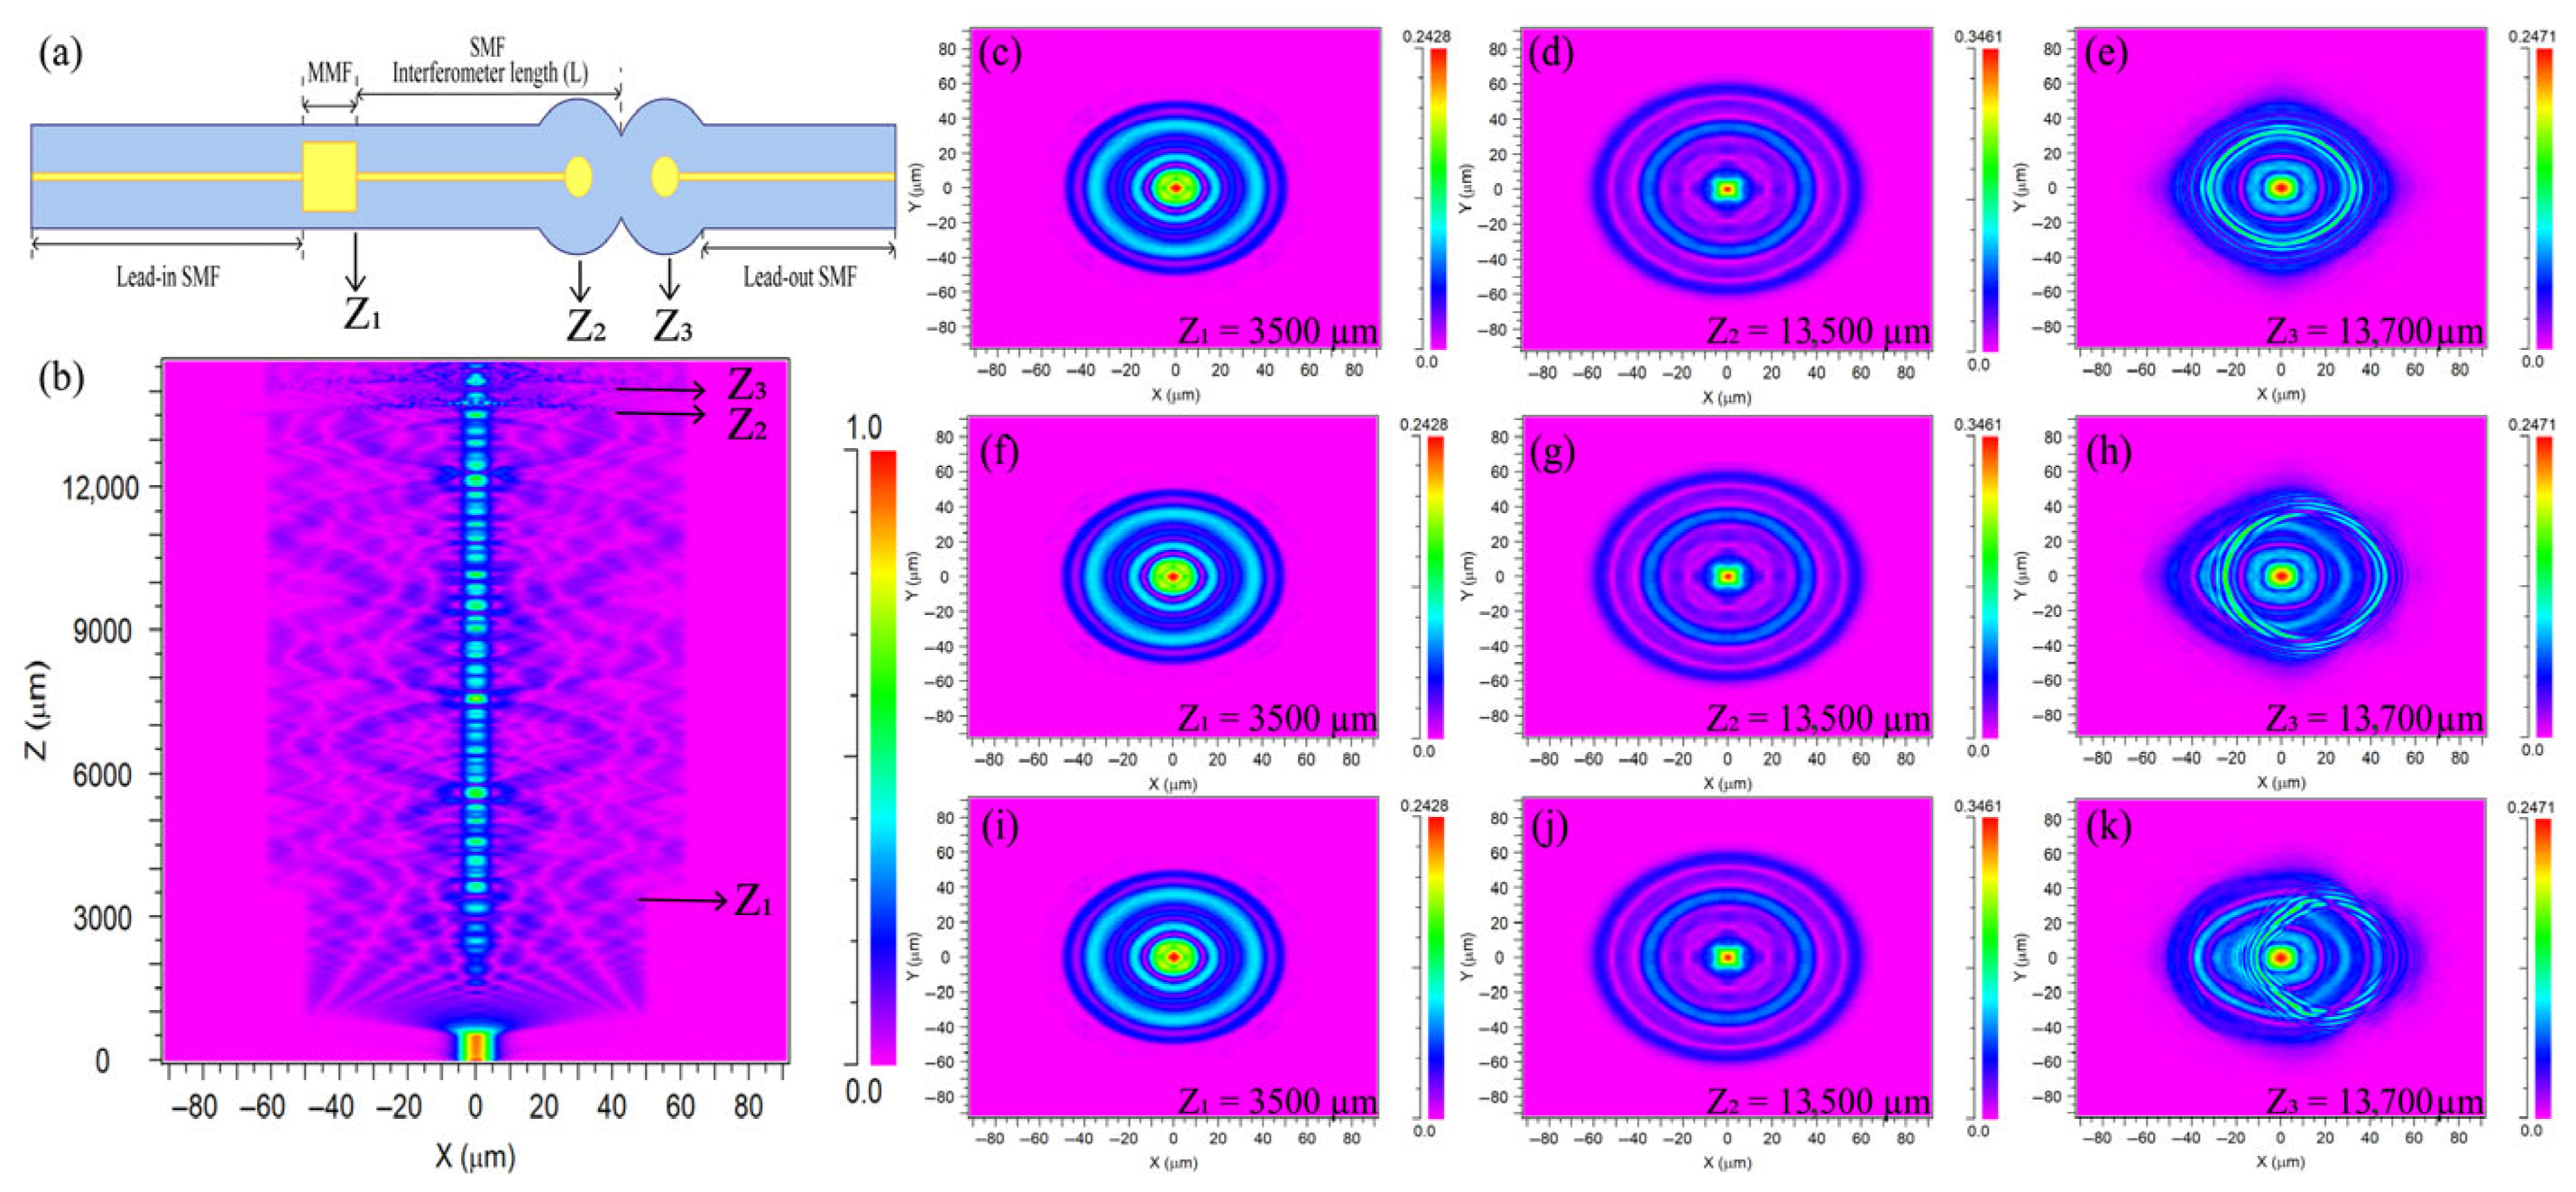
The schematic diagram of the sensor is shown in Figure 3a, and the simulated optical field distribution of the sensor without the core-offset along the Z-direction is presented in Figure 3b, showing the energy exchange process between the core mode and cladding mode. Figure 3c–k display the cross-sectional optical field distributions at specific Z-positions (Z1 = 3500 μm, Z2 = 13,500 μm and Z3 = 13,700 μm) under core-offsets of 0 μm, 24.35 μm, and 35.61 μm, respectively. It can be clearly observed that the characteristic of the optical field energy distribution varies significantly with the change in the core-offset. With no core-offset in Figure 3c–e, the optical field exhibits a symmetrical annular pattern centered on the core, exhibiting a regular morphology and more energy confinement to the core. As the light propagates along the Z-axis from Z1 to Z3, part of the energy gradually leaks into the cladding. By comparing Figure 3c–k, it can be observed that the optical field distributions of the sensors with different offsets are basically identical at positions Z1 and Z2. When the core-offset increases to 24.35 μm in Figure 3h, the central symmetry of the optical field is broken, and the energy leaking into the cladding also shifts to a certain extent in the direction of the core-offset. When the core-offset further increases to 35.61 μm in Figure 3k, the energy leaking into the cladding increases further, and the evanescent field intensity in the cladding region is enhanced accordingly. With the increase in the core-offset, more optical field energy diffuses into the cladding, and the evanescent field intensity is significantly enhanced as a result, which can effectively improve the detection sensitivity of the sensor.

3. Results and Discussion

3.1. Strain Sensing Experiment

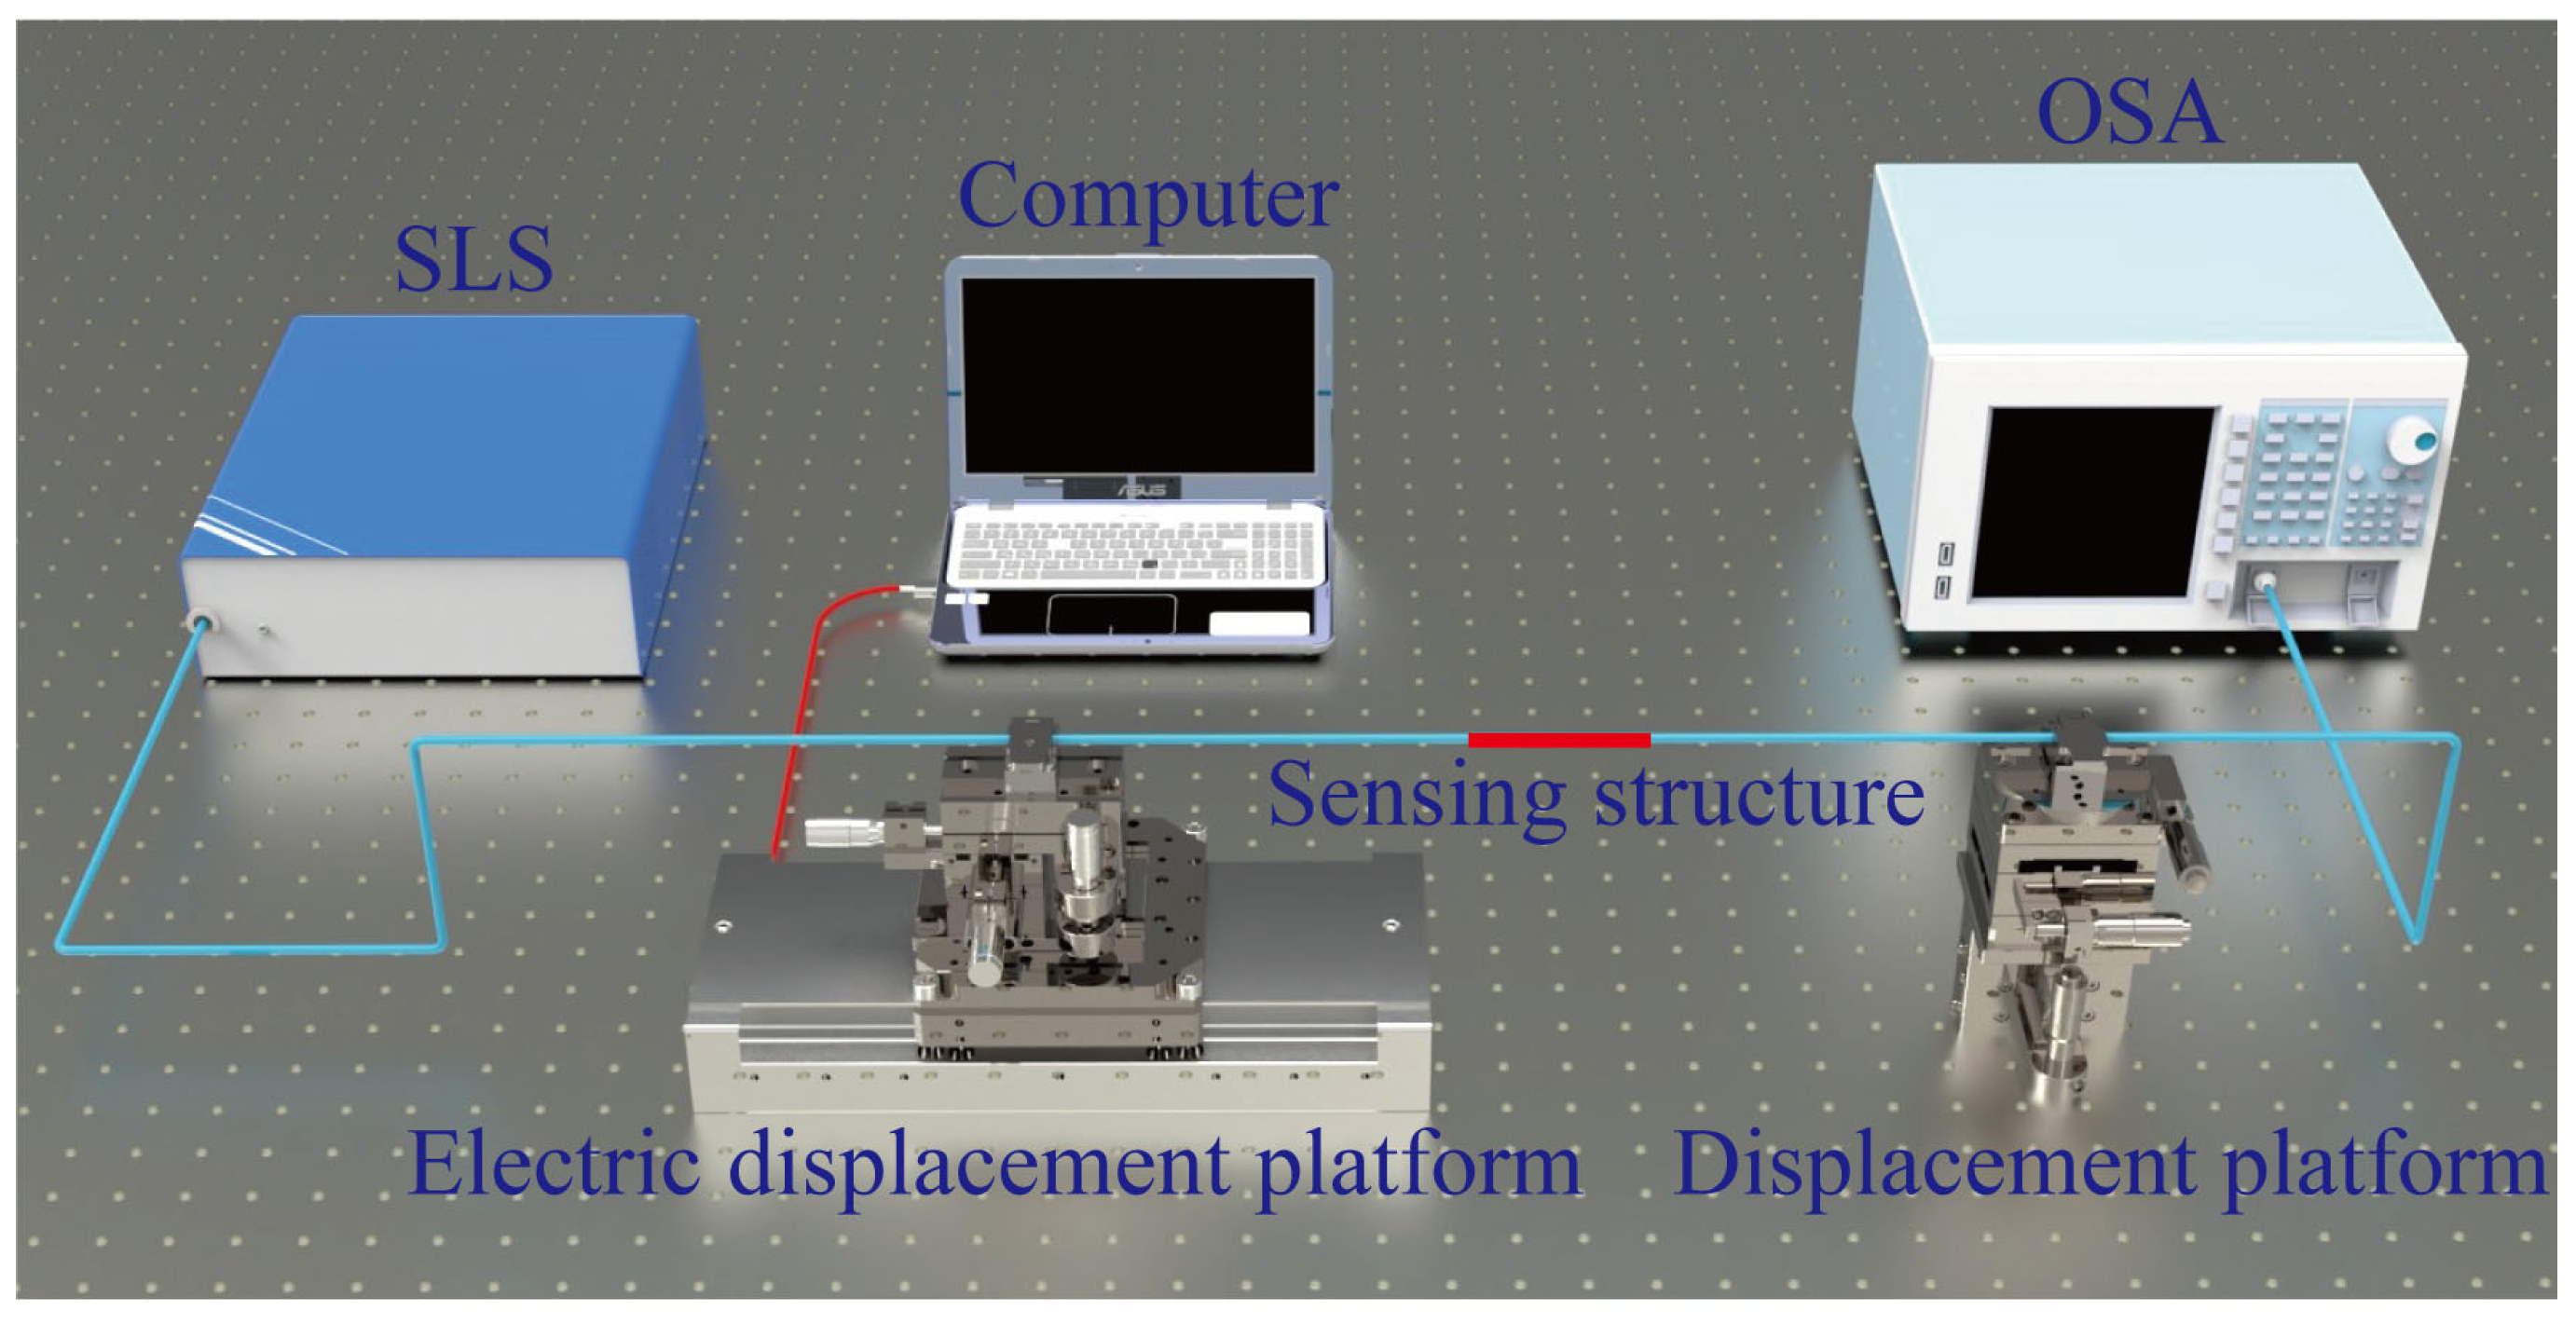
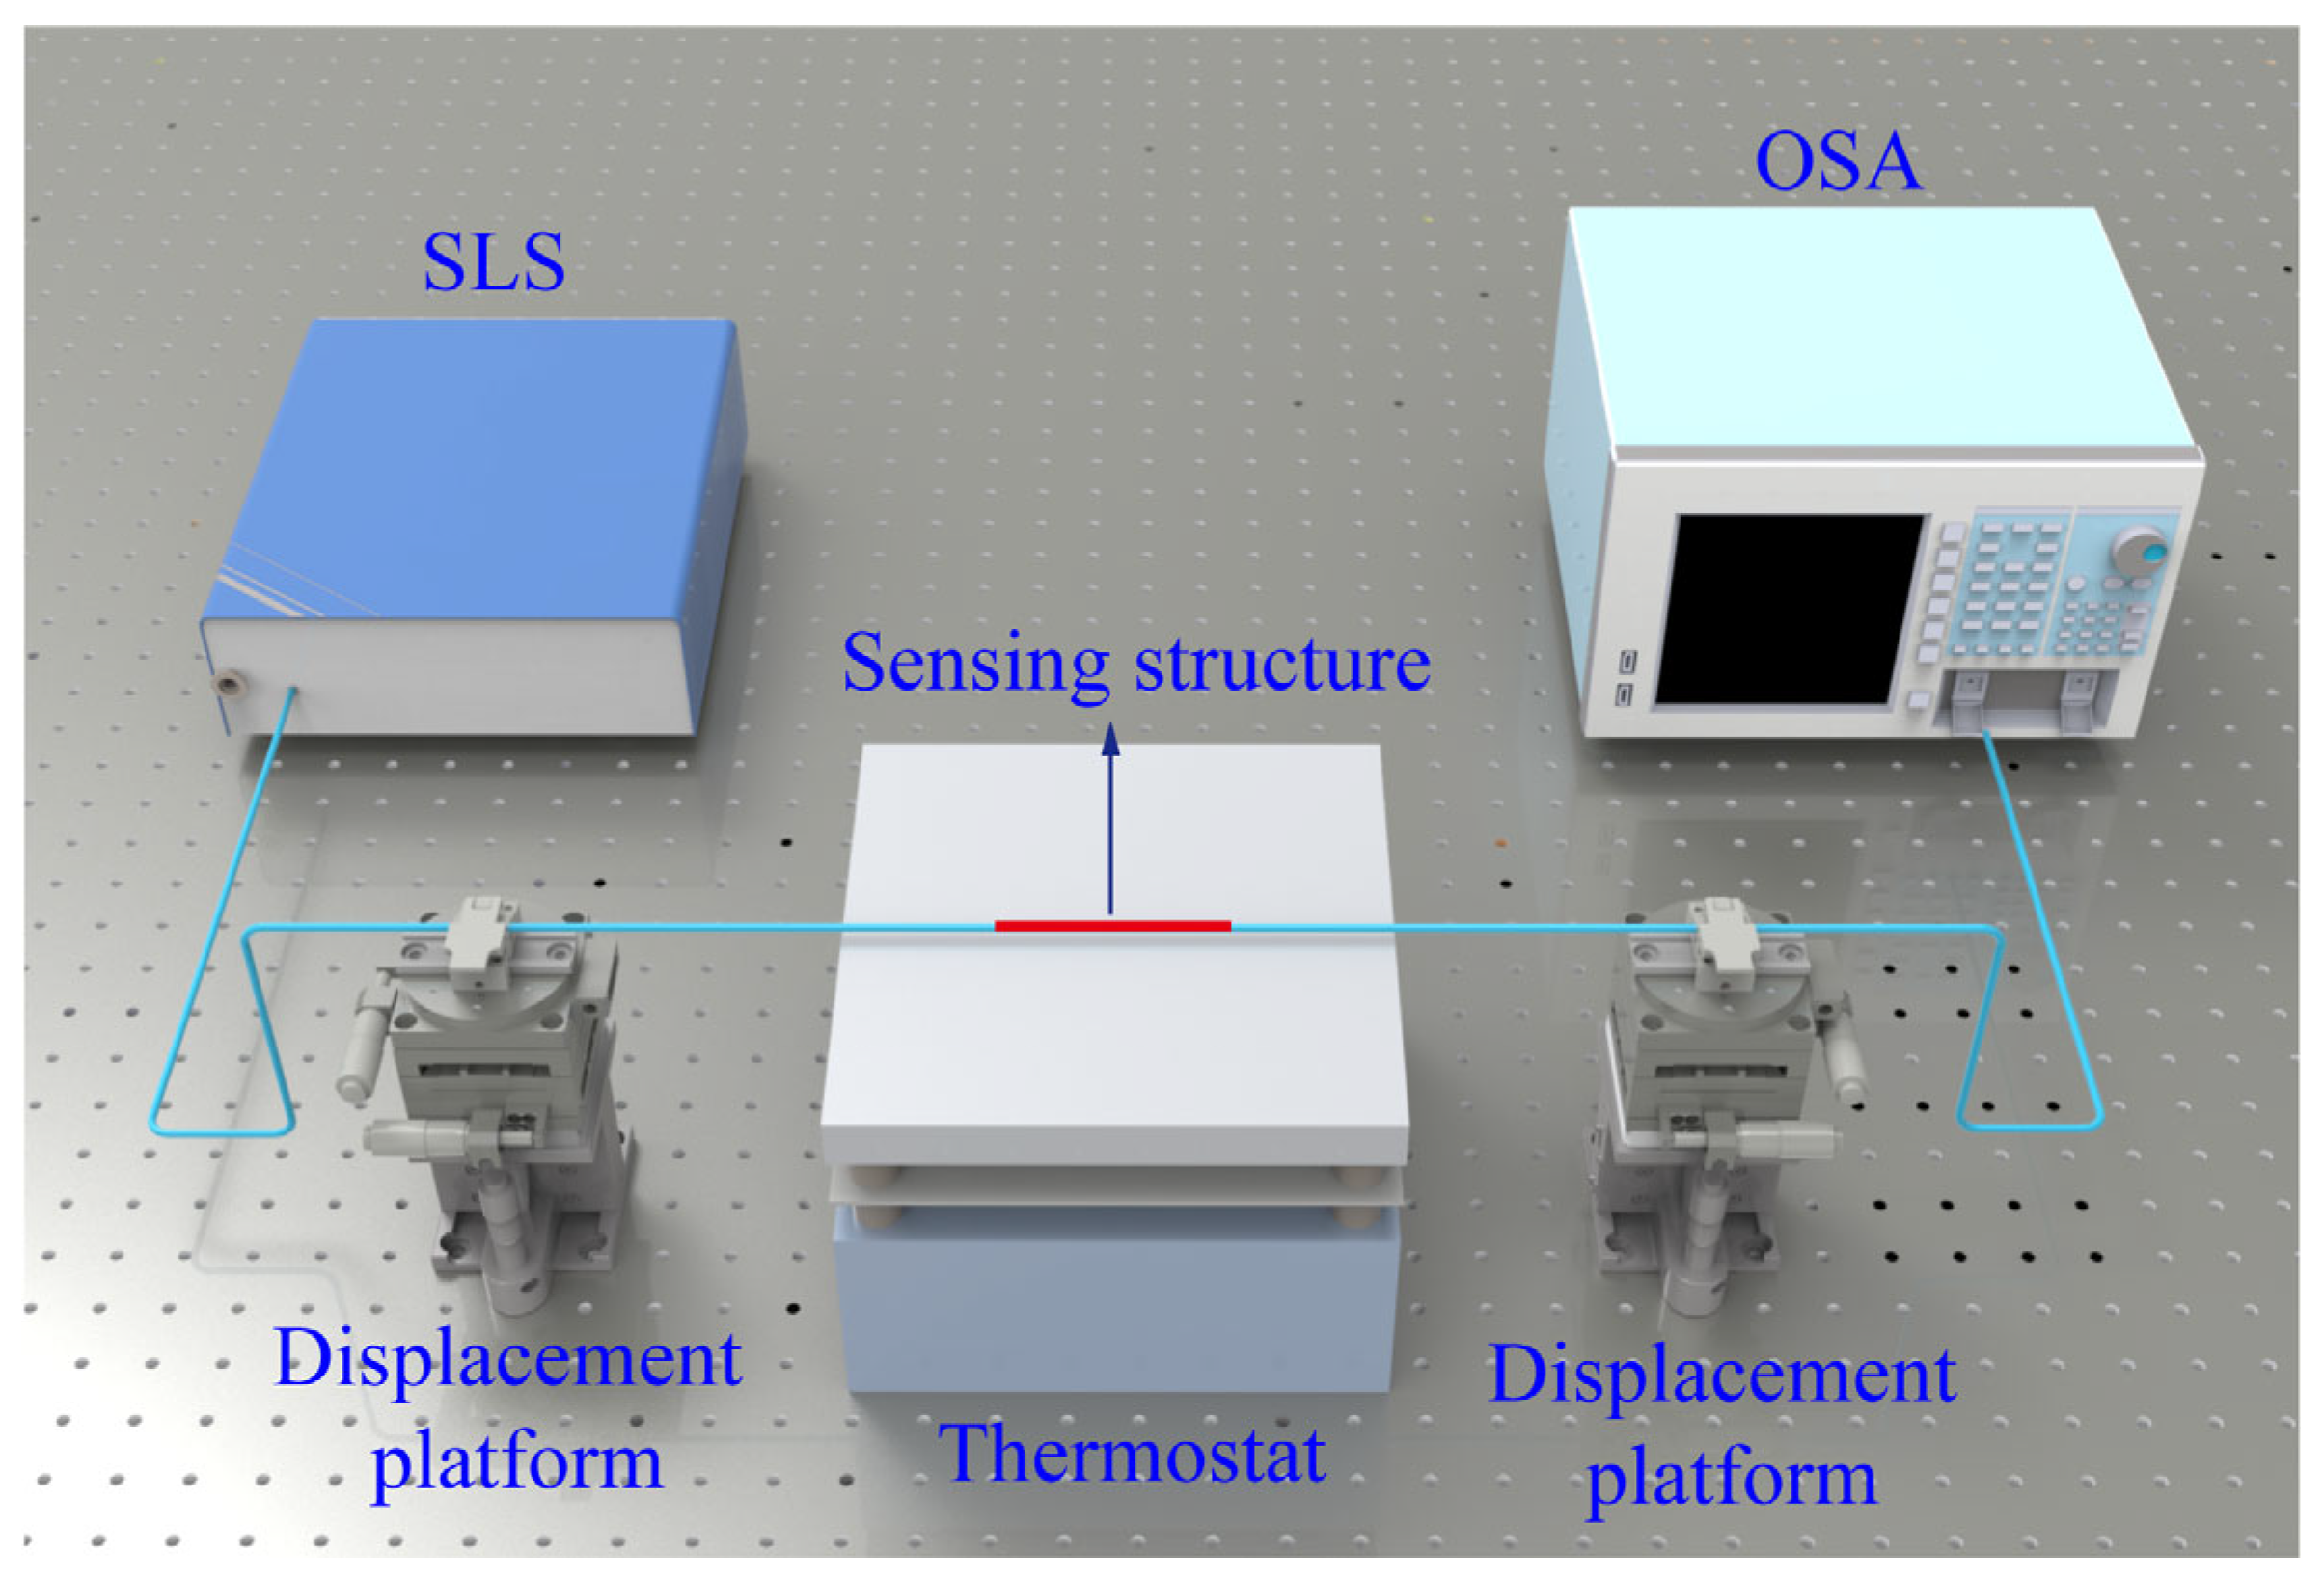
To verify that the offset of peanut-shaped structures can enhance the strain sensitivity of the sensor, experiments were conducted on four sensors with different offset amounts using the device illustrated in Figure 4. The experimental device consisted of the supercontinuum light source (SLS, NKT Photonics, Copenhagen, Denmark, Superk COMPACT, 450–2400 nm), the optical spectrum analyzer (OSA, YOKOGAWA, Tokyo, Japan, AQ6370D, 600–1700 nm), the displacement platform and the electric displacement platform (TOYO, Taiwan, China, ETH14-L0.5-50, resolution 0.2 μm). The environmental temperature was rigorously maintained at 25 °C throughout the experiment. The sensor input and output were connected to the SLS and OSA, respectively. The two ends of the sensing region were fixed on the displacement platform and the electric displacement platform using fiber clamps, with a naturally straight configuration without initial strain. The initial distance between the two displacement platforms was 30 cm. During the experiment, the right displacement platform remained stationary, while the left electric displacement platform was moved outward by 30 µm each time to increase the strain by 100 µε under computer control. The transmission spectra of all four sensors were each recorded separately when a strain of 0–600 µε was applied.
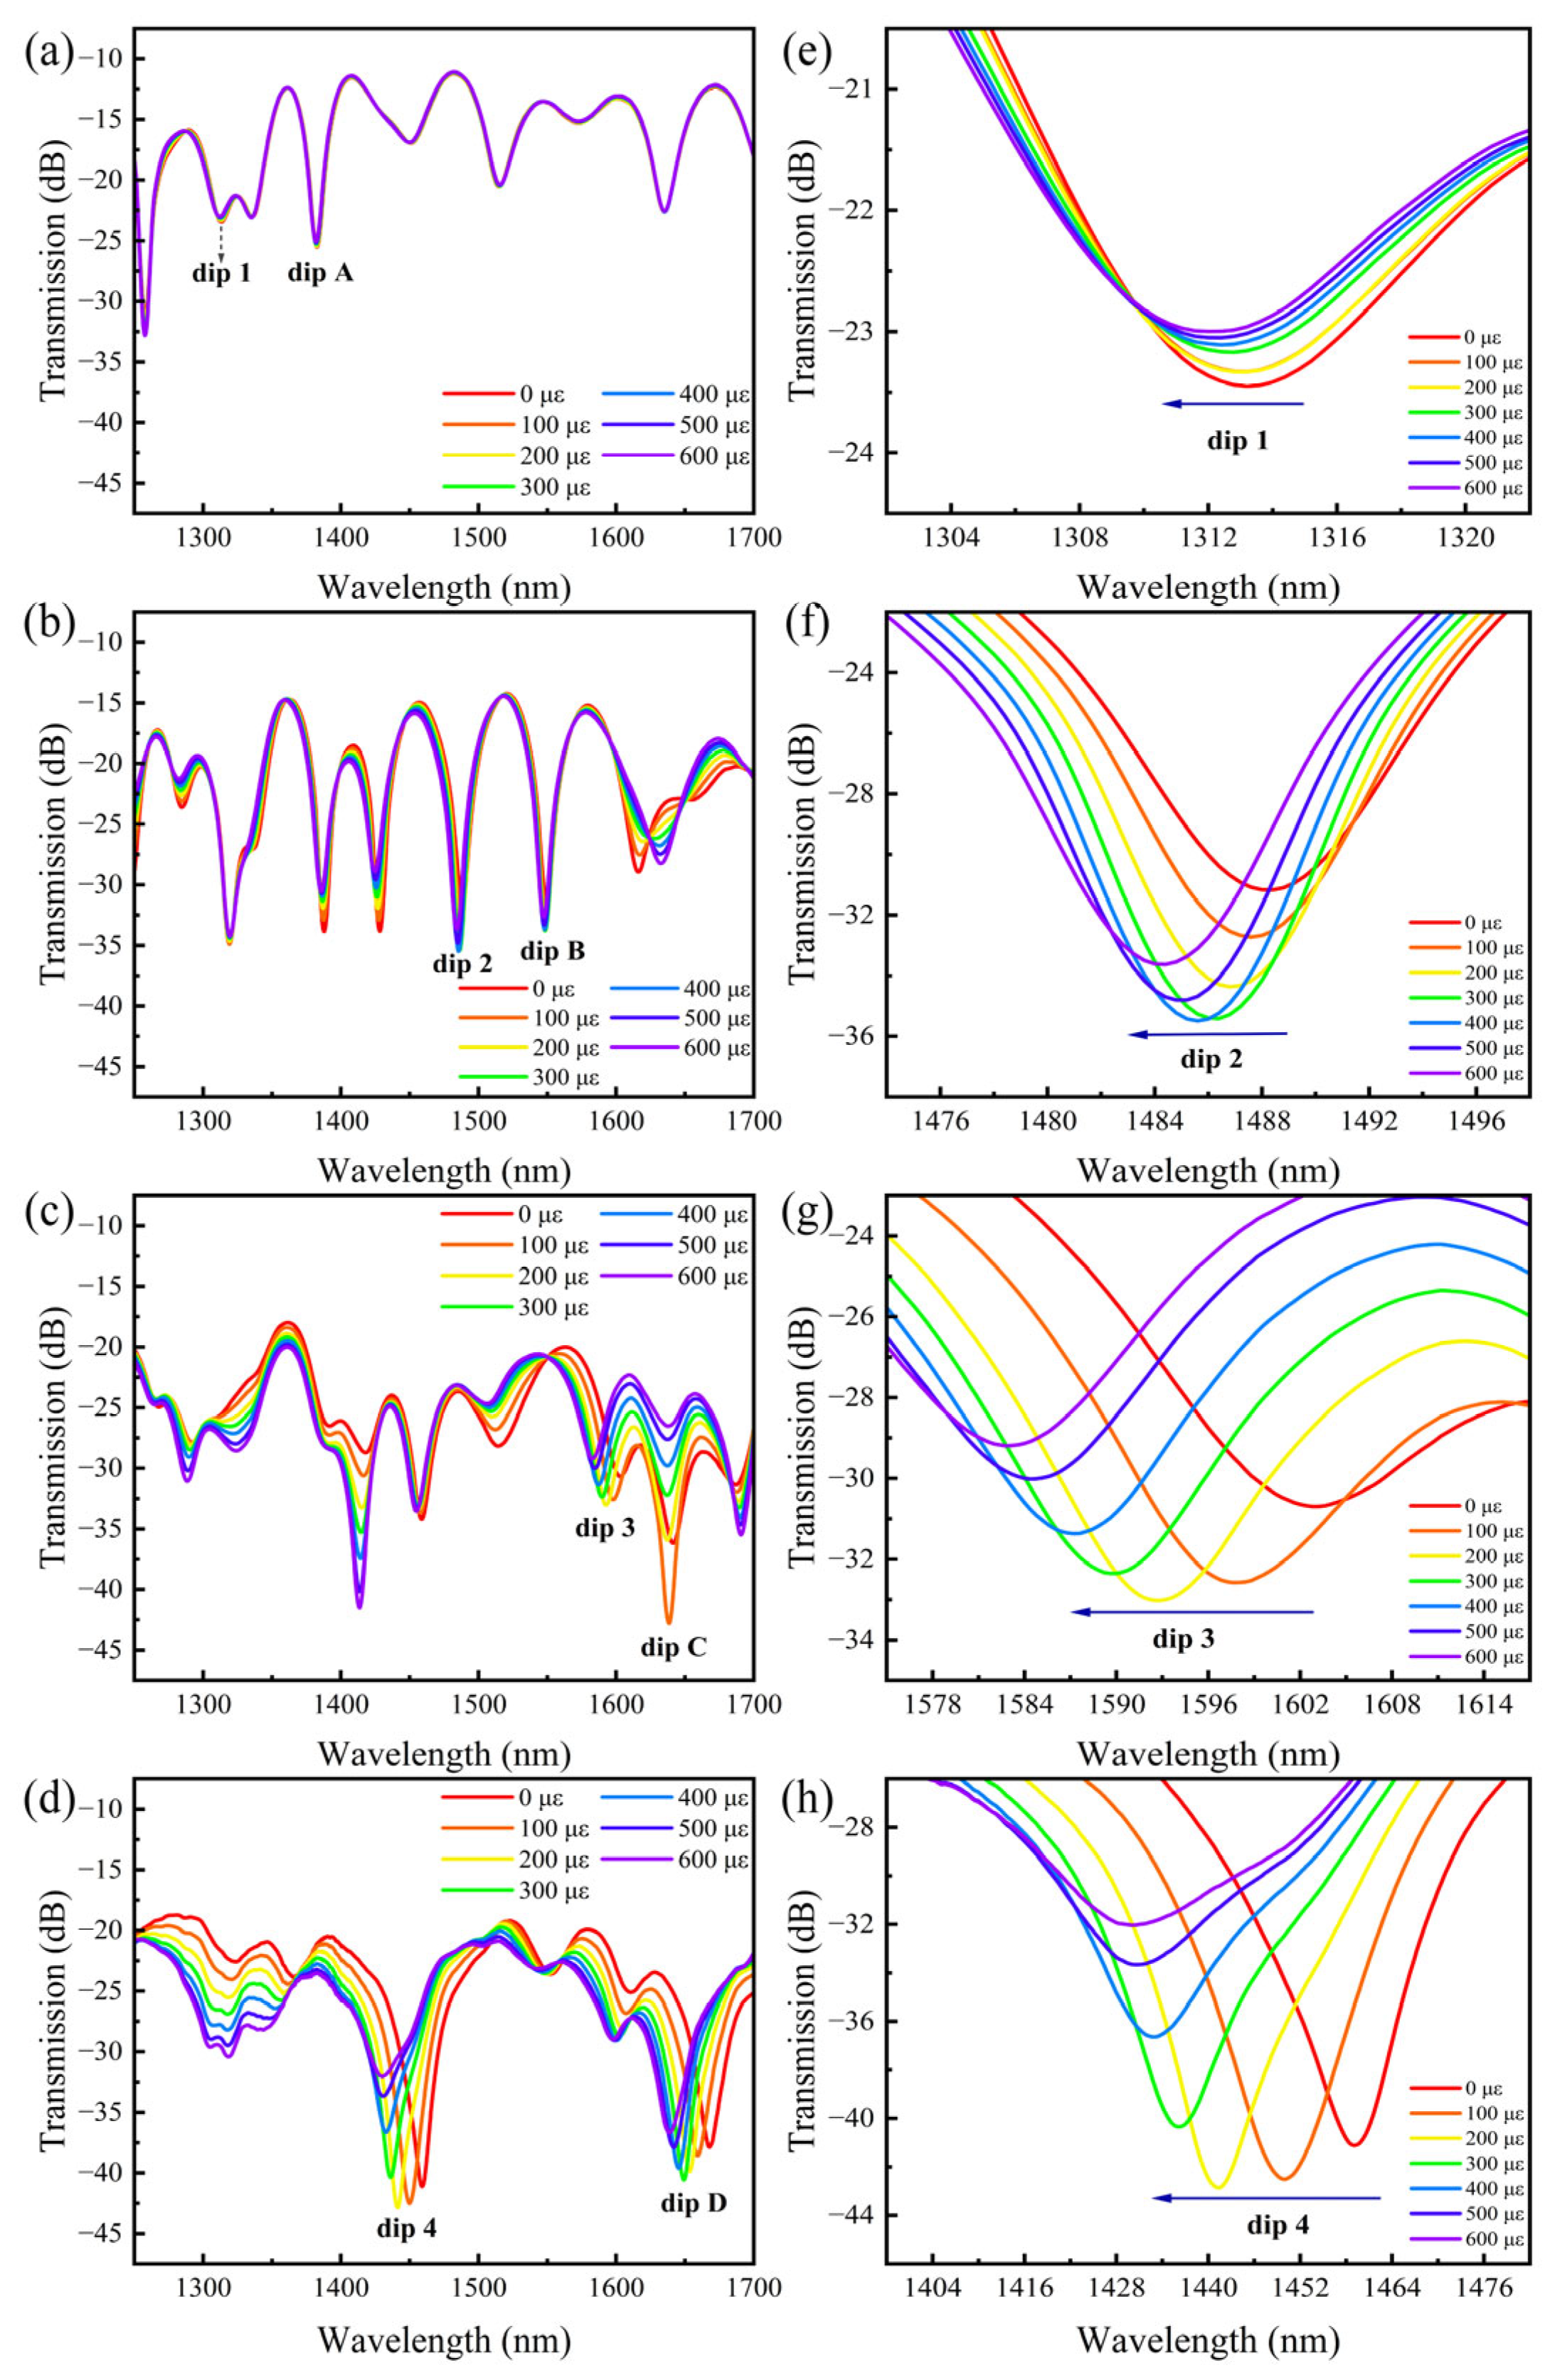
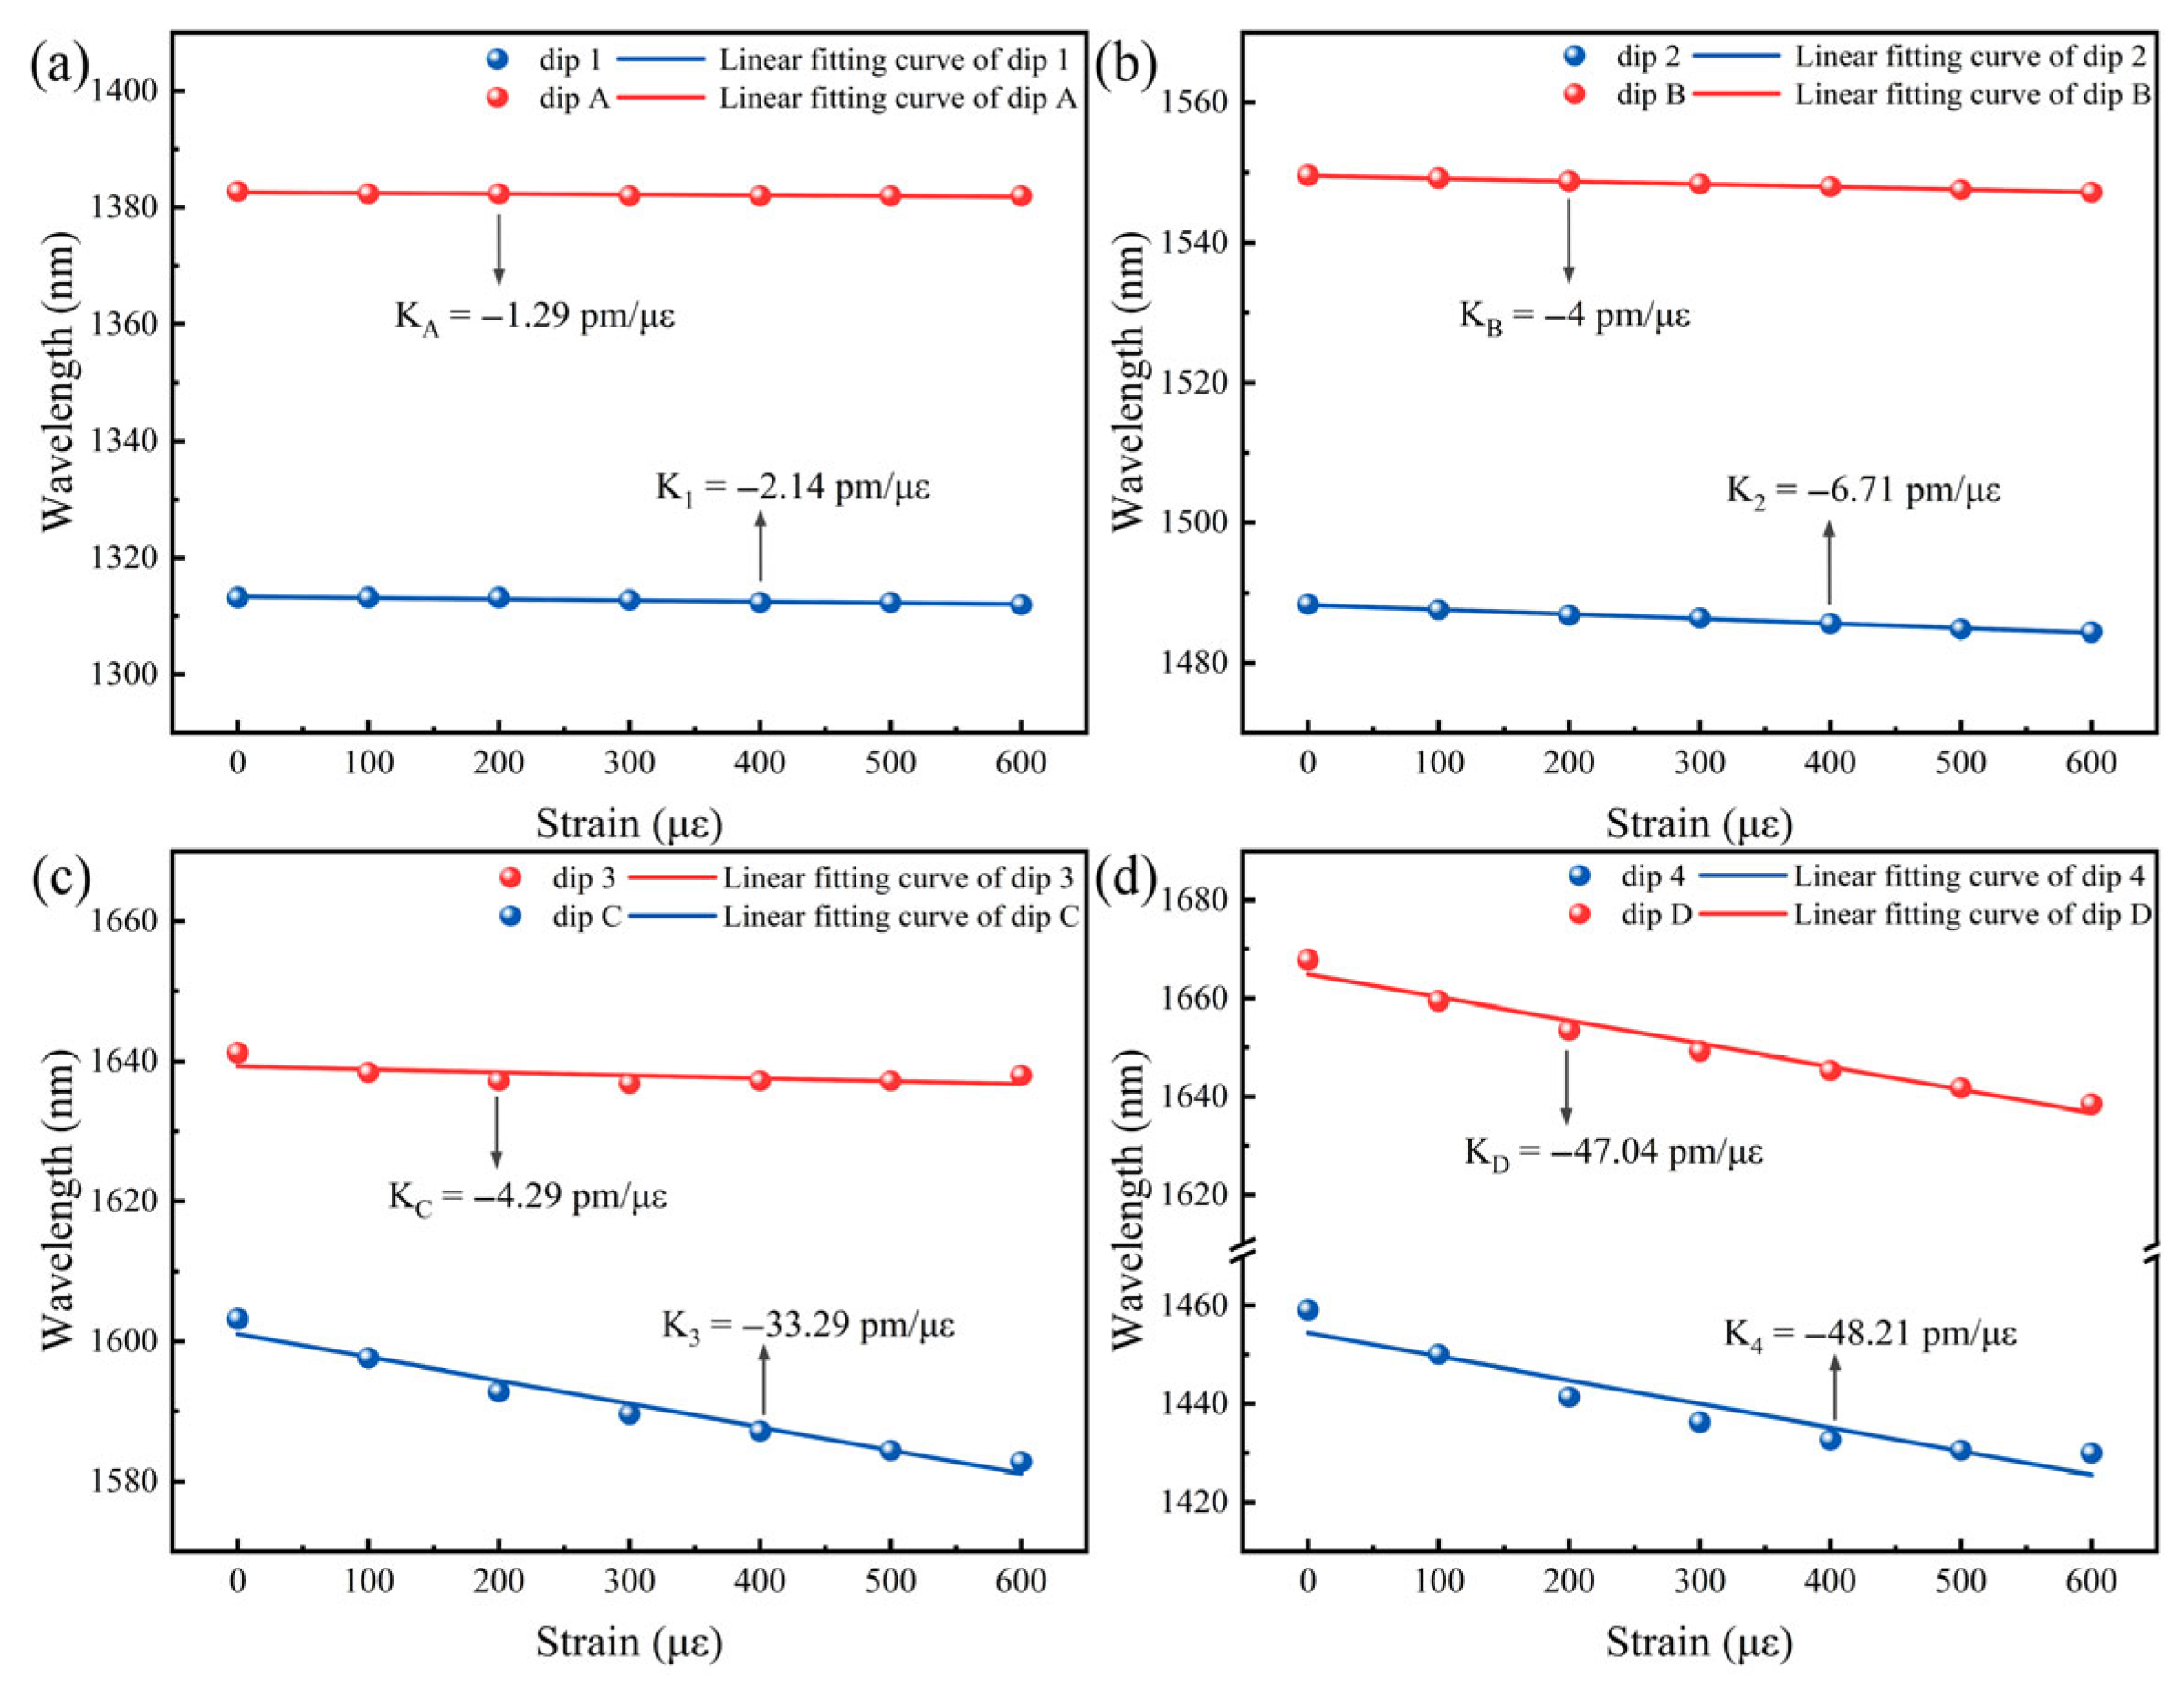
The transmission spectra of four sensors with offset amounts of 0 µm, 12.6 µm, 24.35 µm, and 35.61 µm under different strains are presented in Figure 5, where the interference dips with the highest strain sensitivity for each sensor are designated as dip 1, dip 2, dip 3 and dip 4, respectively. As shown in Figure 5 and Figure 6, the wavelengths of all four interference dips show a clear blue shift with increasing applied strain. Additionally, as the offset amount increases, the blue shift becomes more pronounced, with a concomitant increase in strain sensitivity. The strain sensitivities of dip 1 to dip 4 are −2.14 pm/µε, −6.71 pm/µε, −33.29 pm/µε and −48.21 pm/µε, respectively.
As shown in Figure 6, the interference dips 1 to 4 exhibited the highest strain sensitivity, and another set of interference dips labeled dip A to dip D was also observed. In subsequent temperature experiments, these interference dips (dip A to dip D) were found to have the highest temperature sensitivity. Notably, the two sets of dips show a clear difference in strain sensitivity. The strain sensitivities of dip A to dip D are −1.29 pm/µε, −4 pm/µε, −4.29 pm/µε, and −47.04 pm/µε, respectively, which are significantly lower than those of dip 1 to dip 4 in the corresponding structures.
These results demonstrate that increasing the offset can effectively enhance the strain sensitivity of the sensor. As observed from the simulated optical field distribution in Figure 3, the introduction of the offset excites more higher-order modes, consequently changing the effective refractive index difference between the core and cladding modes. Meanwhile, the asymmetry of the misaligned peanut structure causes it to sustain greater non-axial force under strain, resulting in more pronounced structural deformation compared with the non-misaligned peanut structure, further making the change in the optical path difference more pronounced. Therefore, when axial strain is applied to the sensor, under the synergistic effect of the two aforementioned critical factors, the phase difference between the core and cladding modes will exhibit a more significant change [20,21,22,23]. This significant change in the phase difference results in a more pronounced wavelength shift in the spectrum, thereby enhancing the strain sensitivity.
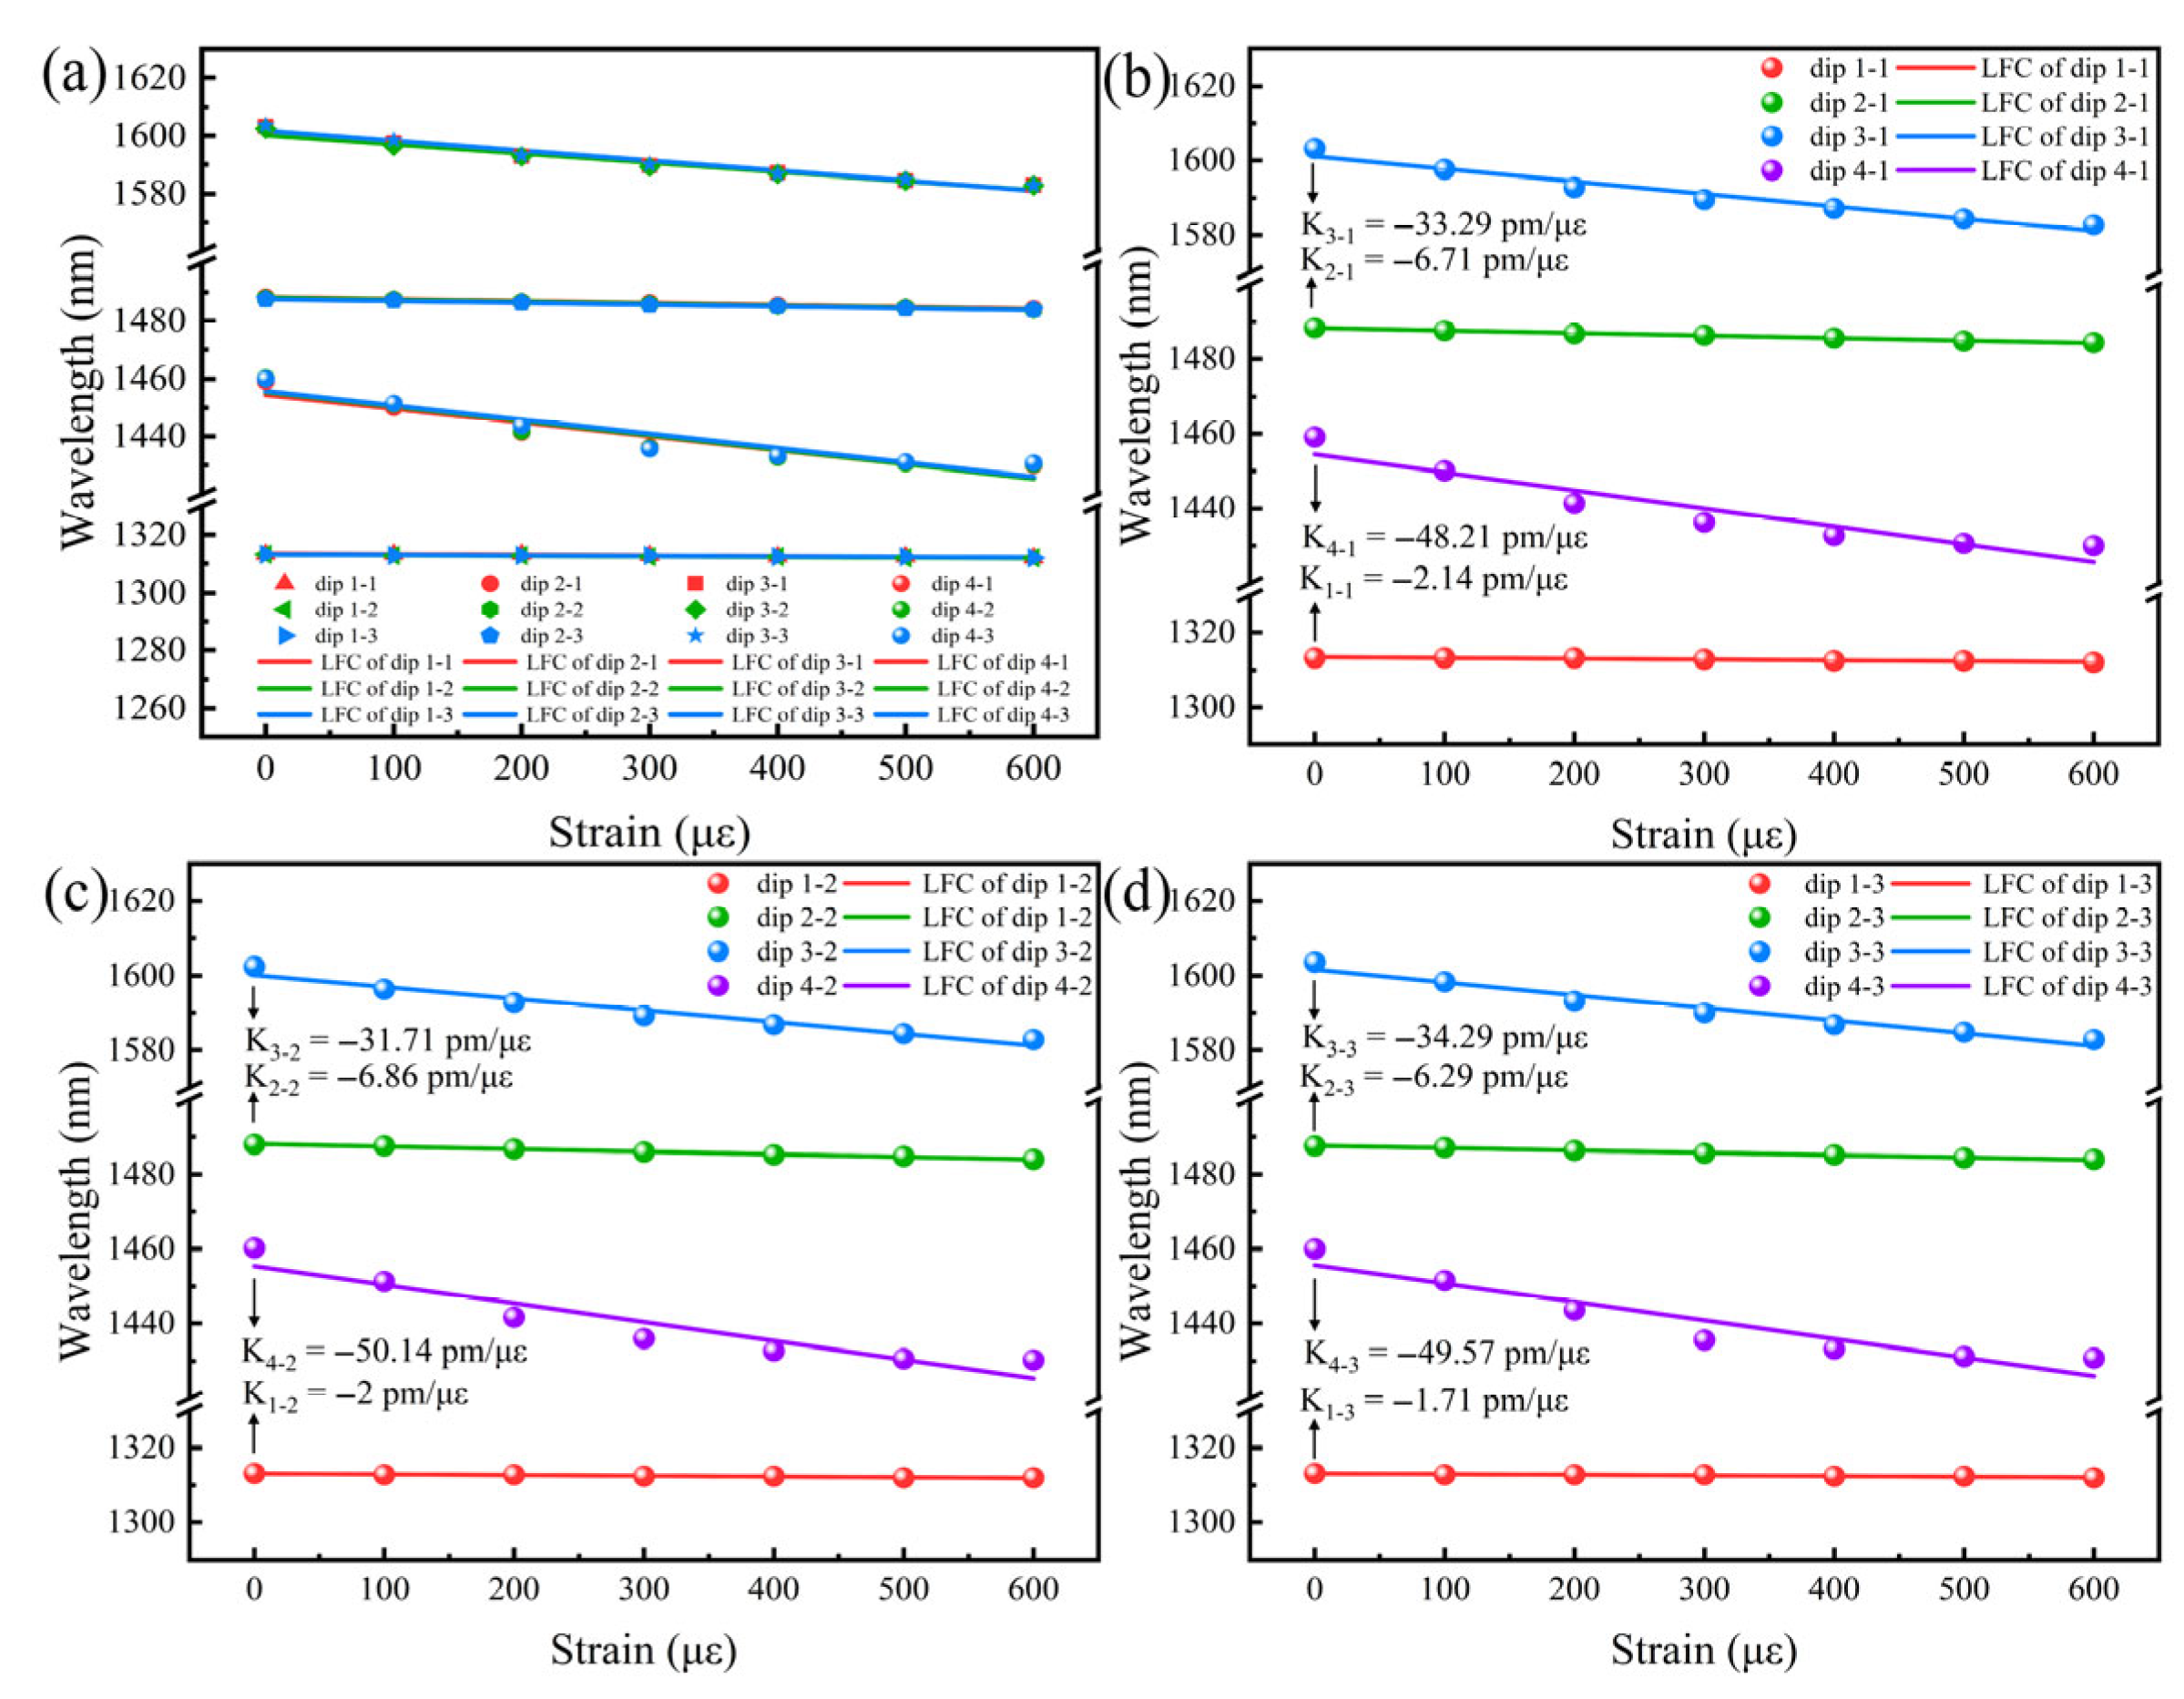
To assess the repeatability of the strain sensing, three repeatability tests were conducted on four sensors prepared by an identical fabrication process. In accordance with the same procedure as described previously, the strain was increased stepwise from 0 µε to 600 µε at intervals of 100 µε. After each adjustment, the corresponding interference spectrum was recorded using an OSA. The linear fitting relationships between the interference dip wavelength and strain for each sensor in the three repeated experiments are shown in Figure 7. In the three repeated experiments of the four sensors (dip 1–dip 4), the variation in strain sensitivity is ±0.43 pm/µε, ±0.57 pm/µε, ±2.49 pm/µε and ±1.87 pm/µε, respectively. The fitting results indicate that the wavelength response to strain exhibits an adequate consistency and stability among the four sensors.

3.2. Temperature Sensing Experiment

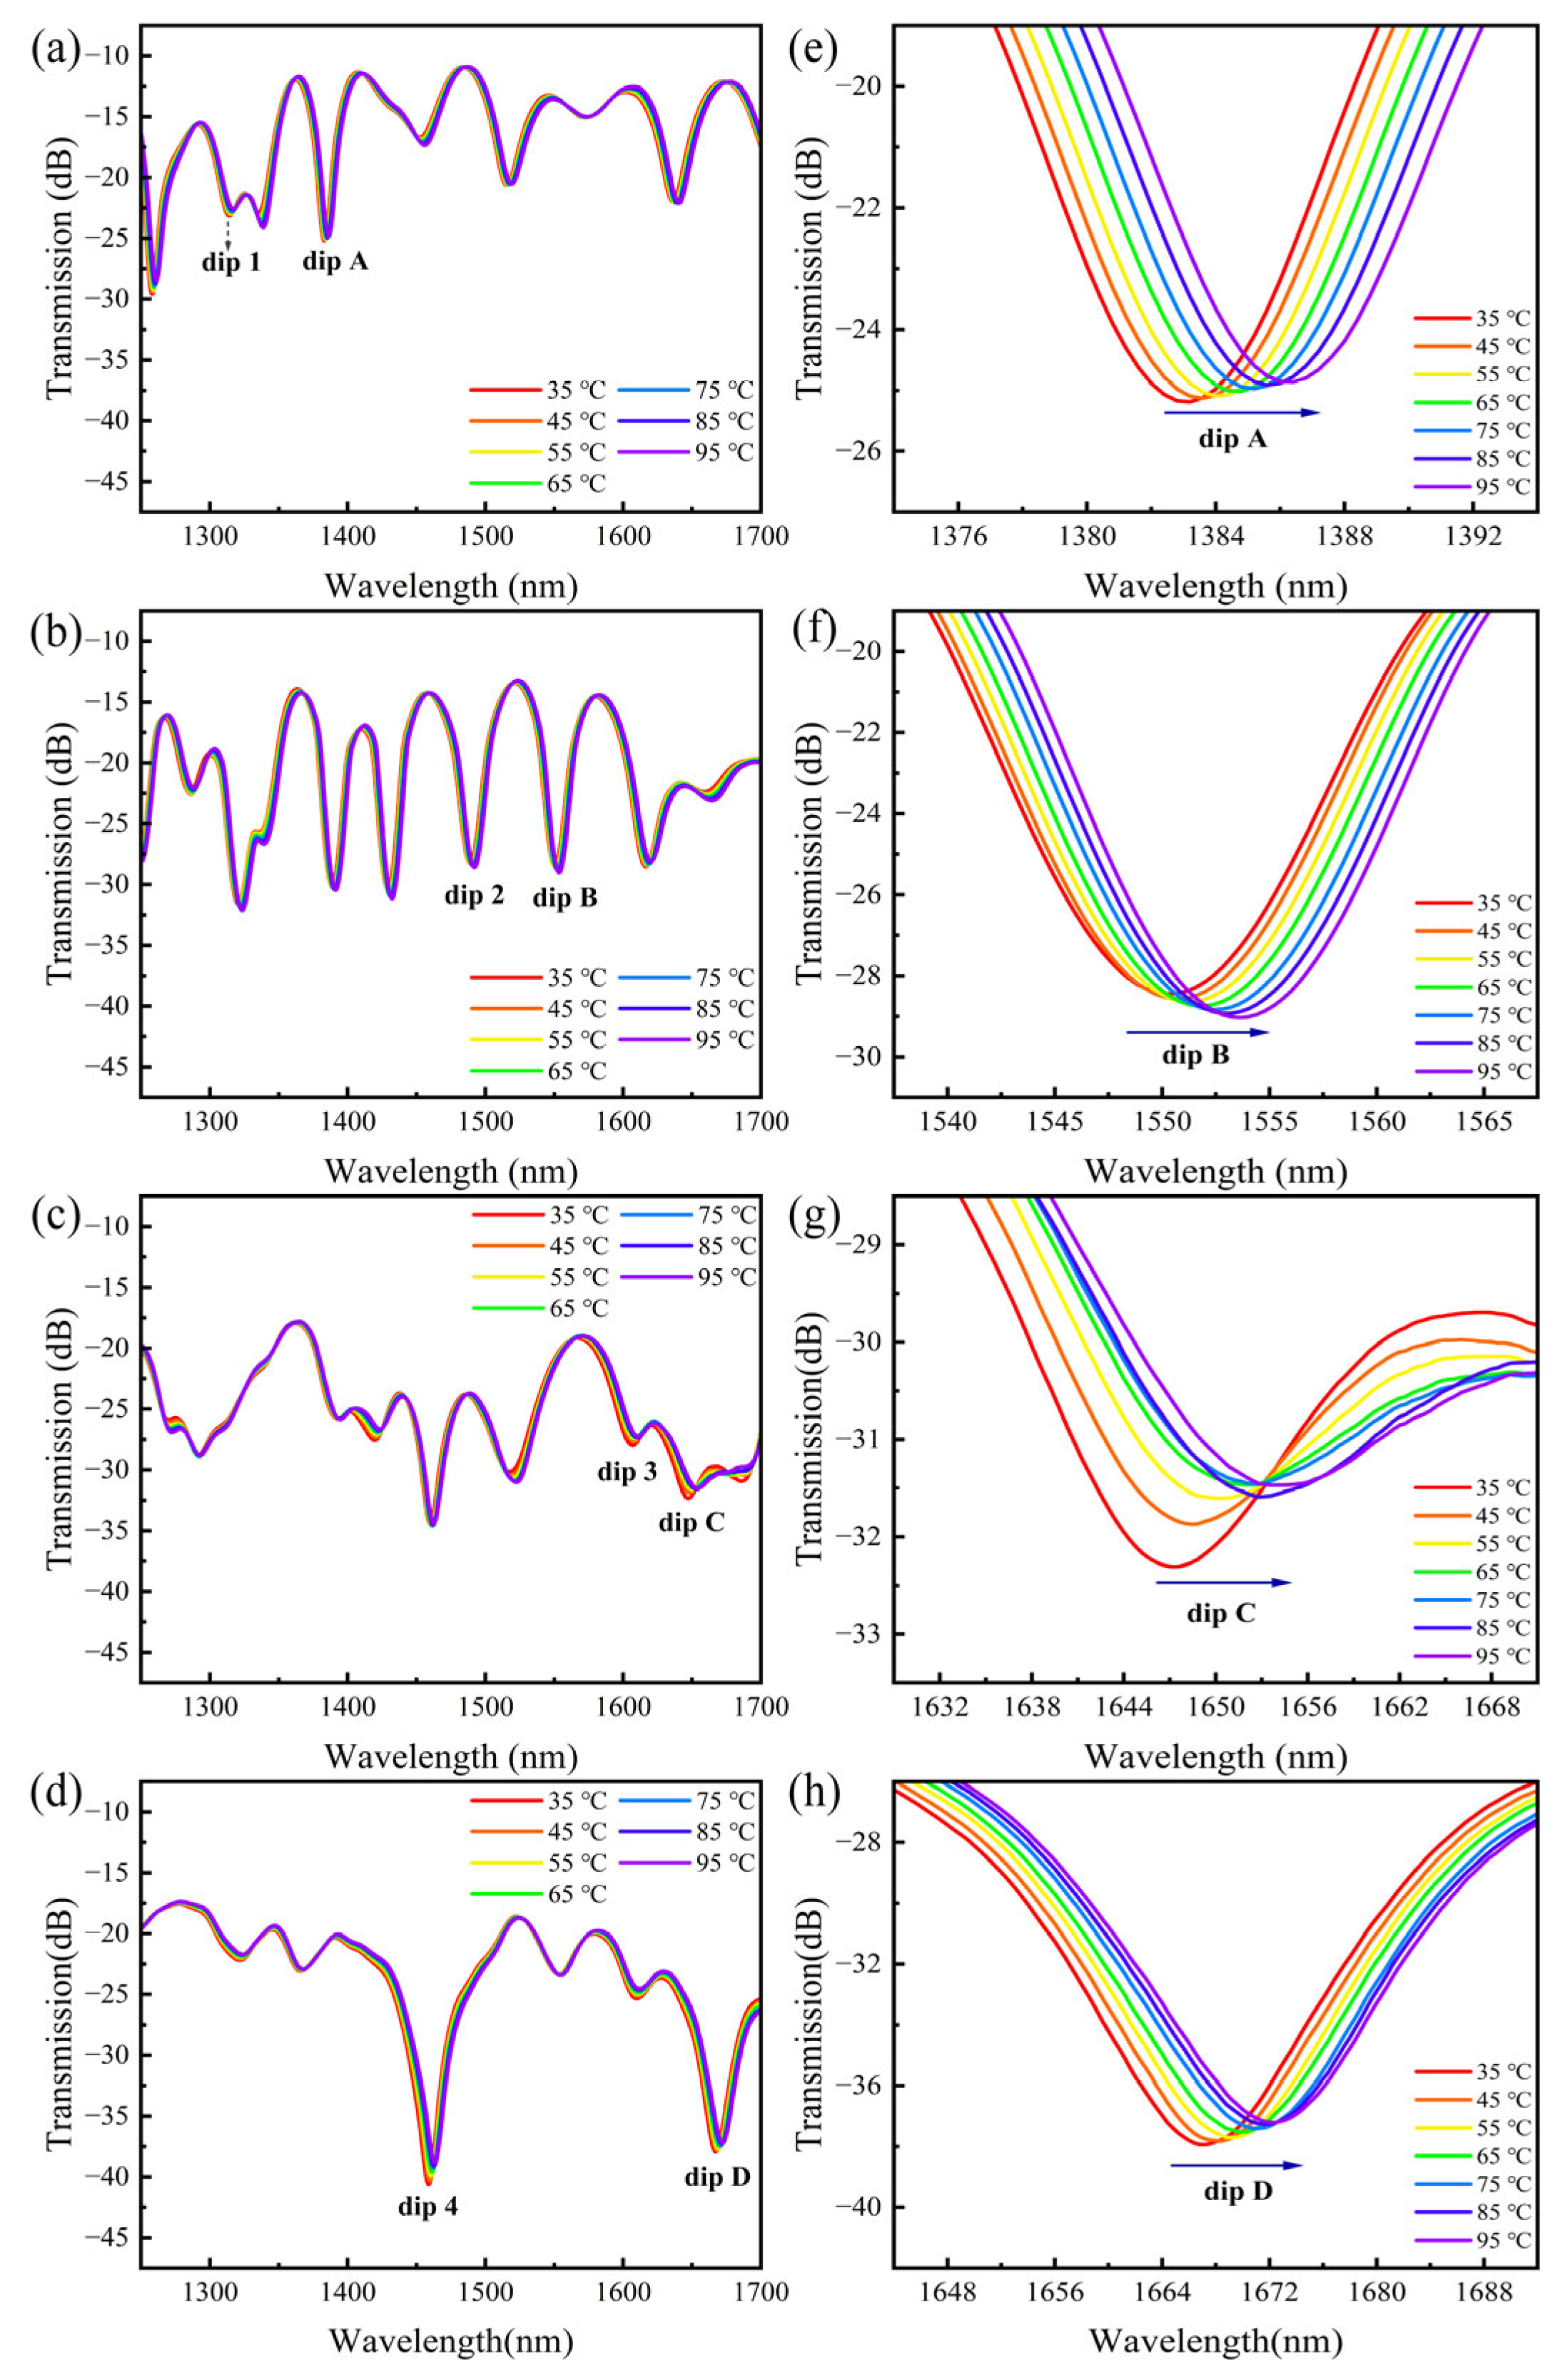
To investigate the relationship between the offset amount of the peanut-shaped structure and the temperature sensitivity of the sensor, temperature sensing experiments were conducted on four sensors with offset amounts of 0 µm, 12.6 µm, 24.35 µm and 35.61 µm by using the experimental device shown in Figure 8, which consists of an SLS, the displacement platforms, the thermostat (Bakon, Shenzhen, China, BK946S, temperature controlling range 20–350 °C), and the OSA. During the experiments, the four sensors were fixed on the thermostat under a strain-free condition. Within the temperature range of 35–95 °C, the transmission spectra were recorded at every 10 °C increment. The variations in transmission spectra with increasing temperatures are presented in Figure 9. The interference spectra of the four sensors change with the increasing temperature, and the interference dip with the highest temperature sensitivity in each sensor is labeled dip A, dip B, dip C and dip D, respectively. The insets in Figure 9 reveal a pronounced red shift in the wavelength of these dips with temperature variations.
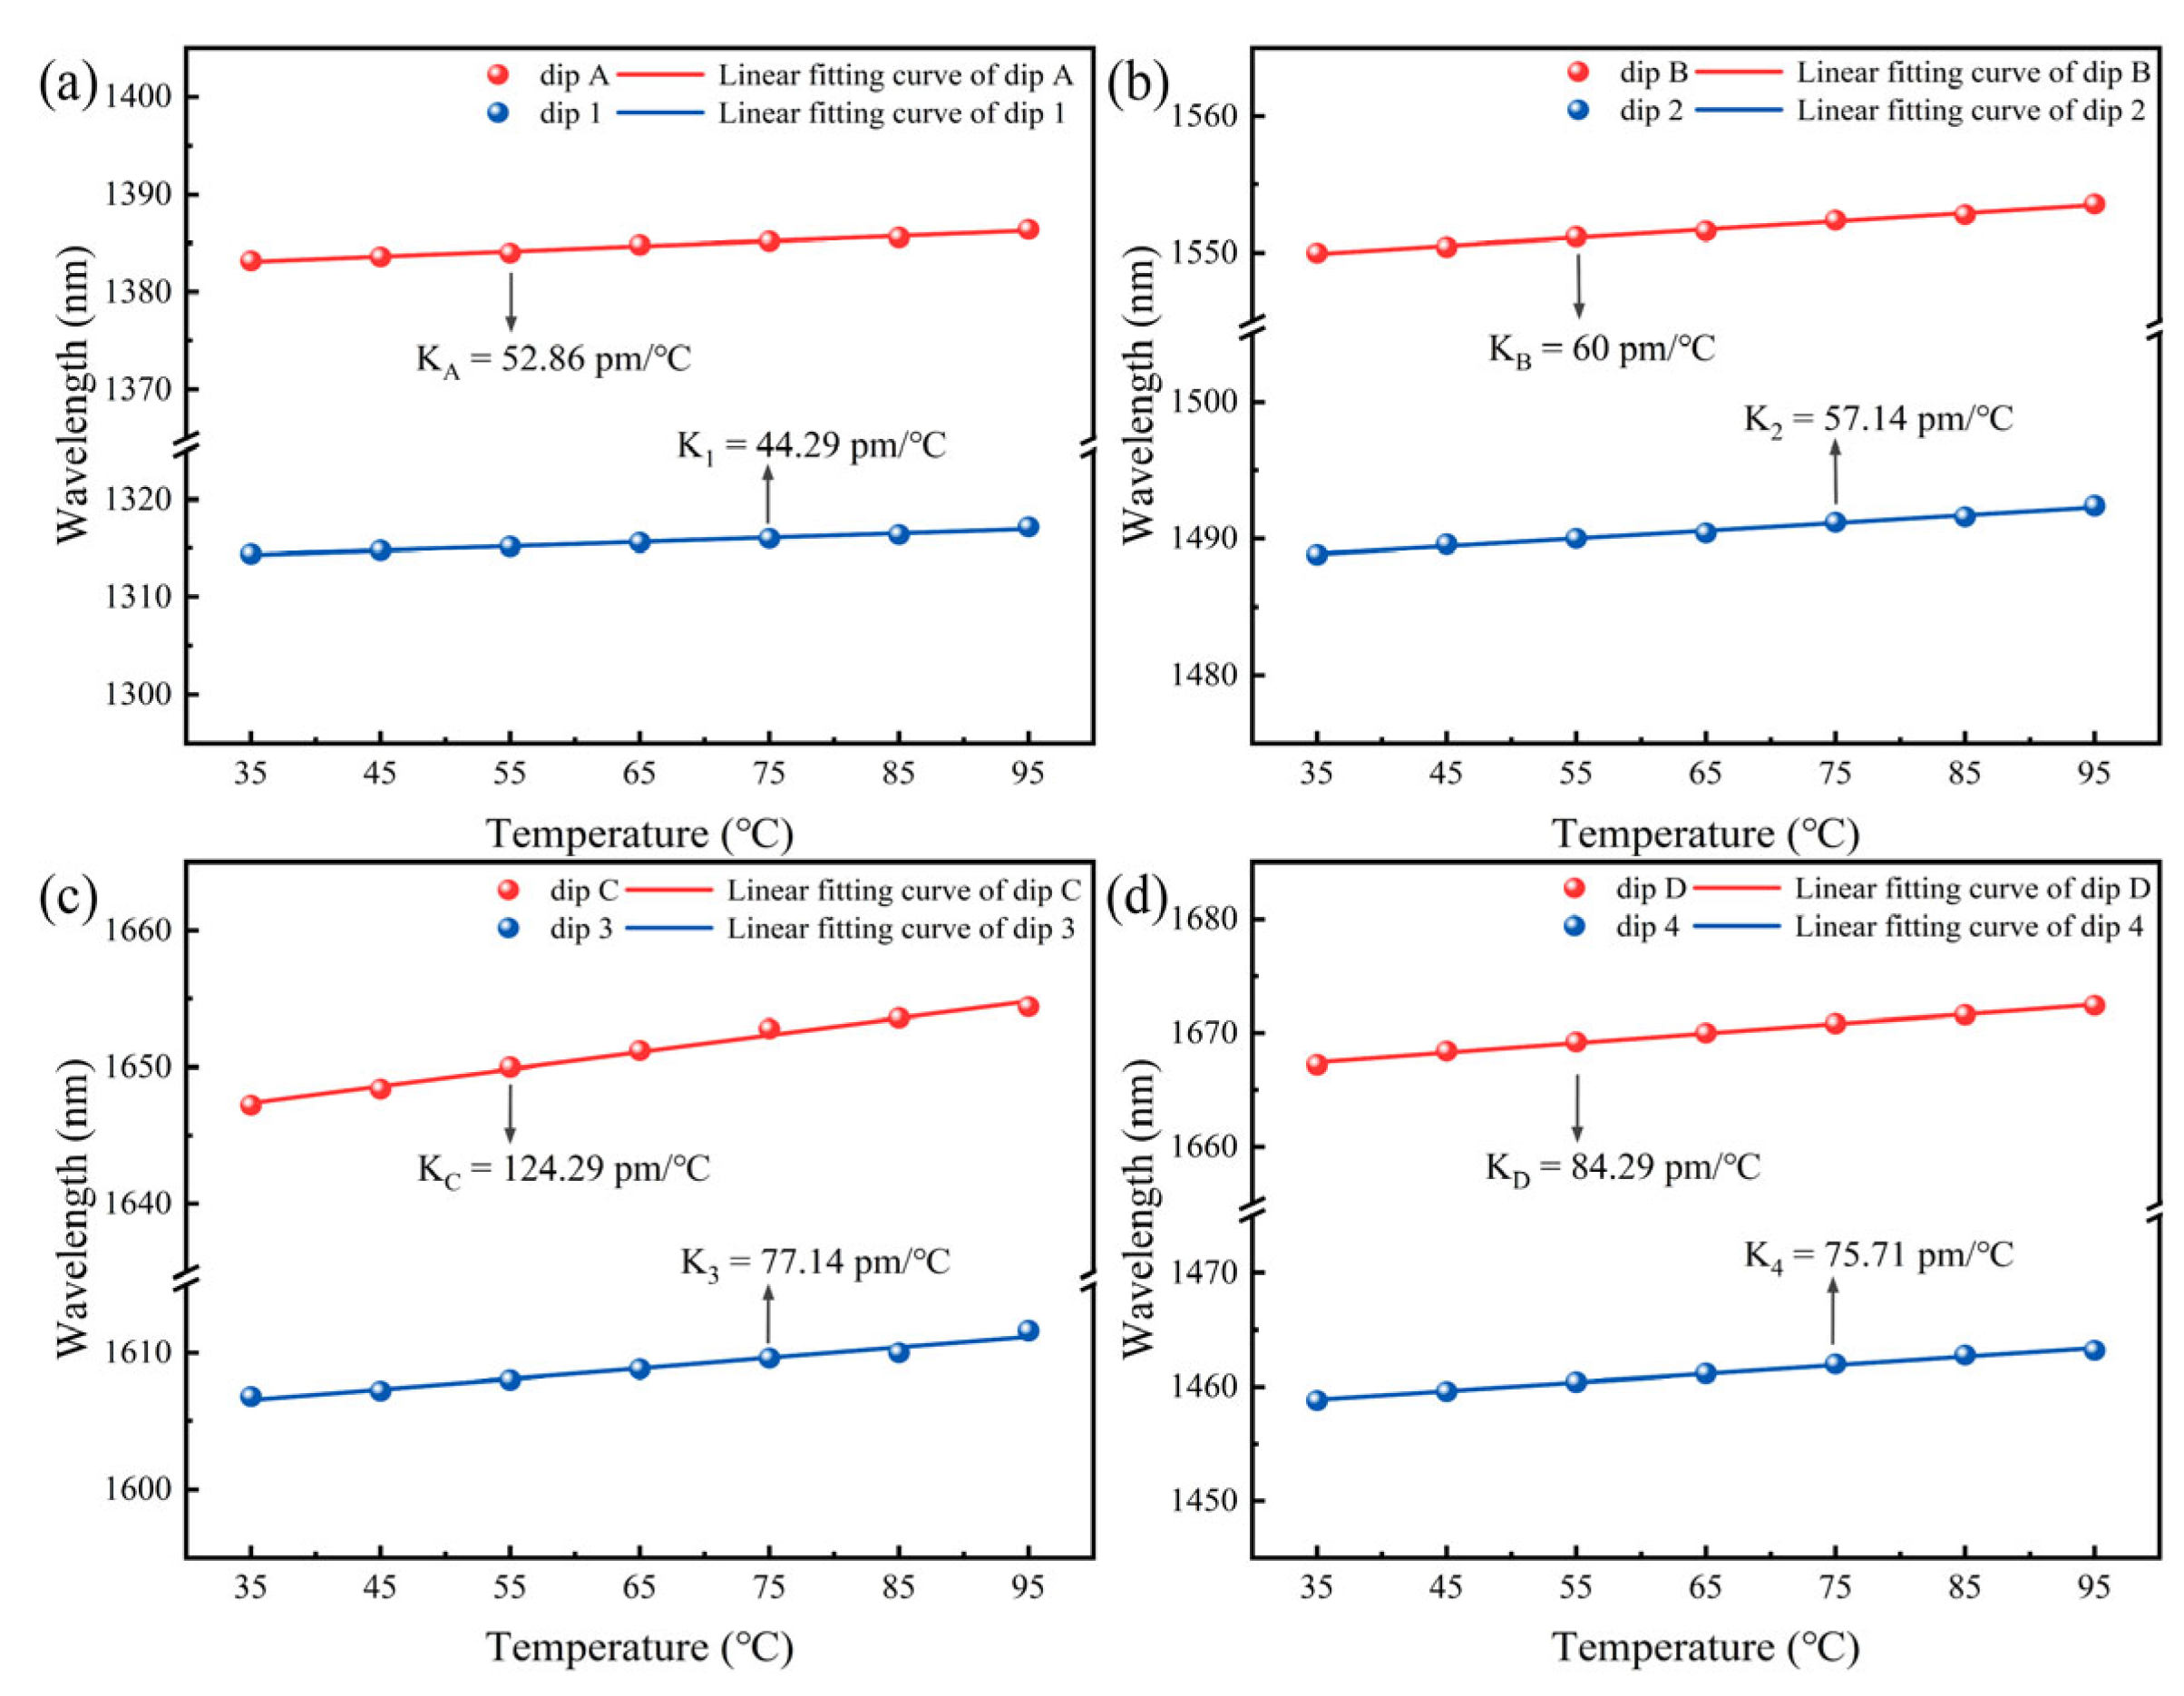
As shown in Figure 10, the temperature sensitivities of dip A to dip D are 52.86 pm/°C, 60 pm/°C, 124.29 pm/°C and 84.29 pm/°C, respectively. Meanwhile, the temperature sensitivities of dip 1 to dip 4 are 44.29 pm/°C, 57.14 pm/°C, 77.14 pm/°C and 75.71 pm/°C, respectively, which are all lower than those of dip A–dip D. Temperature sensitivity shows a distinct increasing trend among the first three sensors with an offset of 0 µm, 12.6 µm and 24.35 µm, respectively, when the offset of the peanut-shaped structure increases. It can be observed from the simulated optical field distribution in Figure 3 that the introduction of the offset excites more higher-order cladding modes, thereby increasing the effective refractive index difference between the core mode and the cladding mode. Meanwhile, the asymmetric characteristic of the misaligned peanut structure results in a more pronounced variation amplitude of the optical path difference caused by the thermal expansion effect in the sensing region during the temperature variation, compared with that of the non-misaligned peanut structure. When the ambient temperature of the sensor increases, under the combined effect of the two aforementioned critical factors, the phase difference between the core and cladding modes displays a more significant change. This ultimately results in a more pronounced wavelength shift in the spectrum, and the temperature sensitivity is consequently improved. However, this enhancement is not unlimited. As observed from the sensor with an offset of 35.61 µm, when the offset amount exceeds the critical value, the temperature sensitivity decreases instead. This phenomenon can be attributed to the excessive offset reducing the optical coupling efficiency between the core and cladding [22]. Therefore, the temperature sensitivity of the proposed sensor does not increase monotonically with the offset amount; instead, there exists a critical offset value, beyond which an excessive offset leads to a decrease in temperature sensitivity.

3.3. Simultaneous Measurement of Strain and Temperature

Based on the comprehensive analysis of the strain and temperature sensing experimental data, the sensor with an offset of 35.61 µm was ultimately selected for the simultaneous measurement of these two parameters due to its better overall performance. Within its spectrum, dip 4 and dip D were chosen for the sensing matrix because dip 4 has the highest strain sensitivity and dip D shows a high temperature sensitivity, providing good contrast for demultiplexing.
It can be observed from Figure 6 and Figure 10 that the strain sensitivities of dip 4 and dip D are −48.21 pm/µε and −47.04 pm/µε, respectively, while the corresponding temperature sensitivities are 75.71 pm/°C and 84.29 pm/°C. The sensitivity matrix for demodulating the two parameters can be expressed as [24]
Δ ε Δ T = 1 K ε , 4 K T , 4 K ε , D K T , D K T , D K T , 4 K ε , D K ε , 4 Δ λ D i p   4 Δ λ D i p   D
By substituting the strain and temperature sensitivities of dip 4 and dip D into the sensitivity matrix, we can obtain
Δ ε Δ T = 1 501.5 84.29   pm / ° C 75.71   pm / ° C 47 . 04   pm / μ ε 48 . 21   pm / μ ε Δ λ D i p   4 Δ λ D i p   D
When the strain and temperature applied to sensors change simultaneously, the corresponding variation can be obtained by measuring the wavelength shifts in the two resonance peaks (dip 4 and dip D) and substituting them into Equation (6). This method effectively eliminates the cross-sensitivity of the temperature variation on the strain measurement, which allows the simultaneous measurement of the temperature and strain, improving the accuracy and reliability of the sensor in complex conditions.
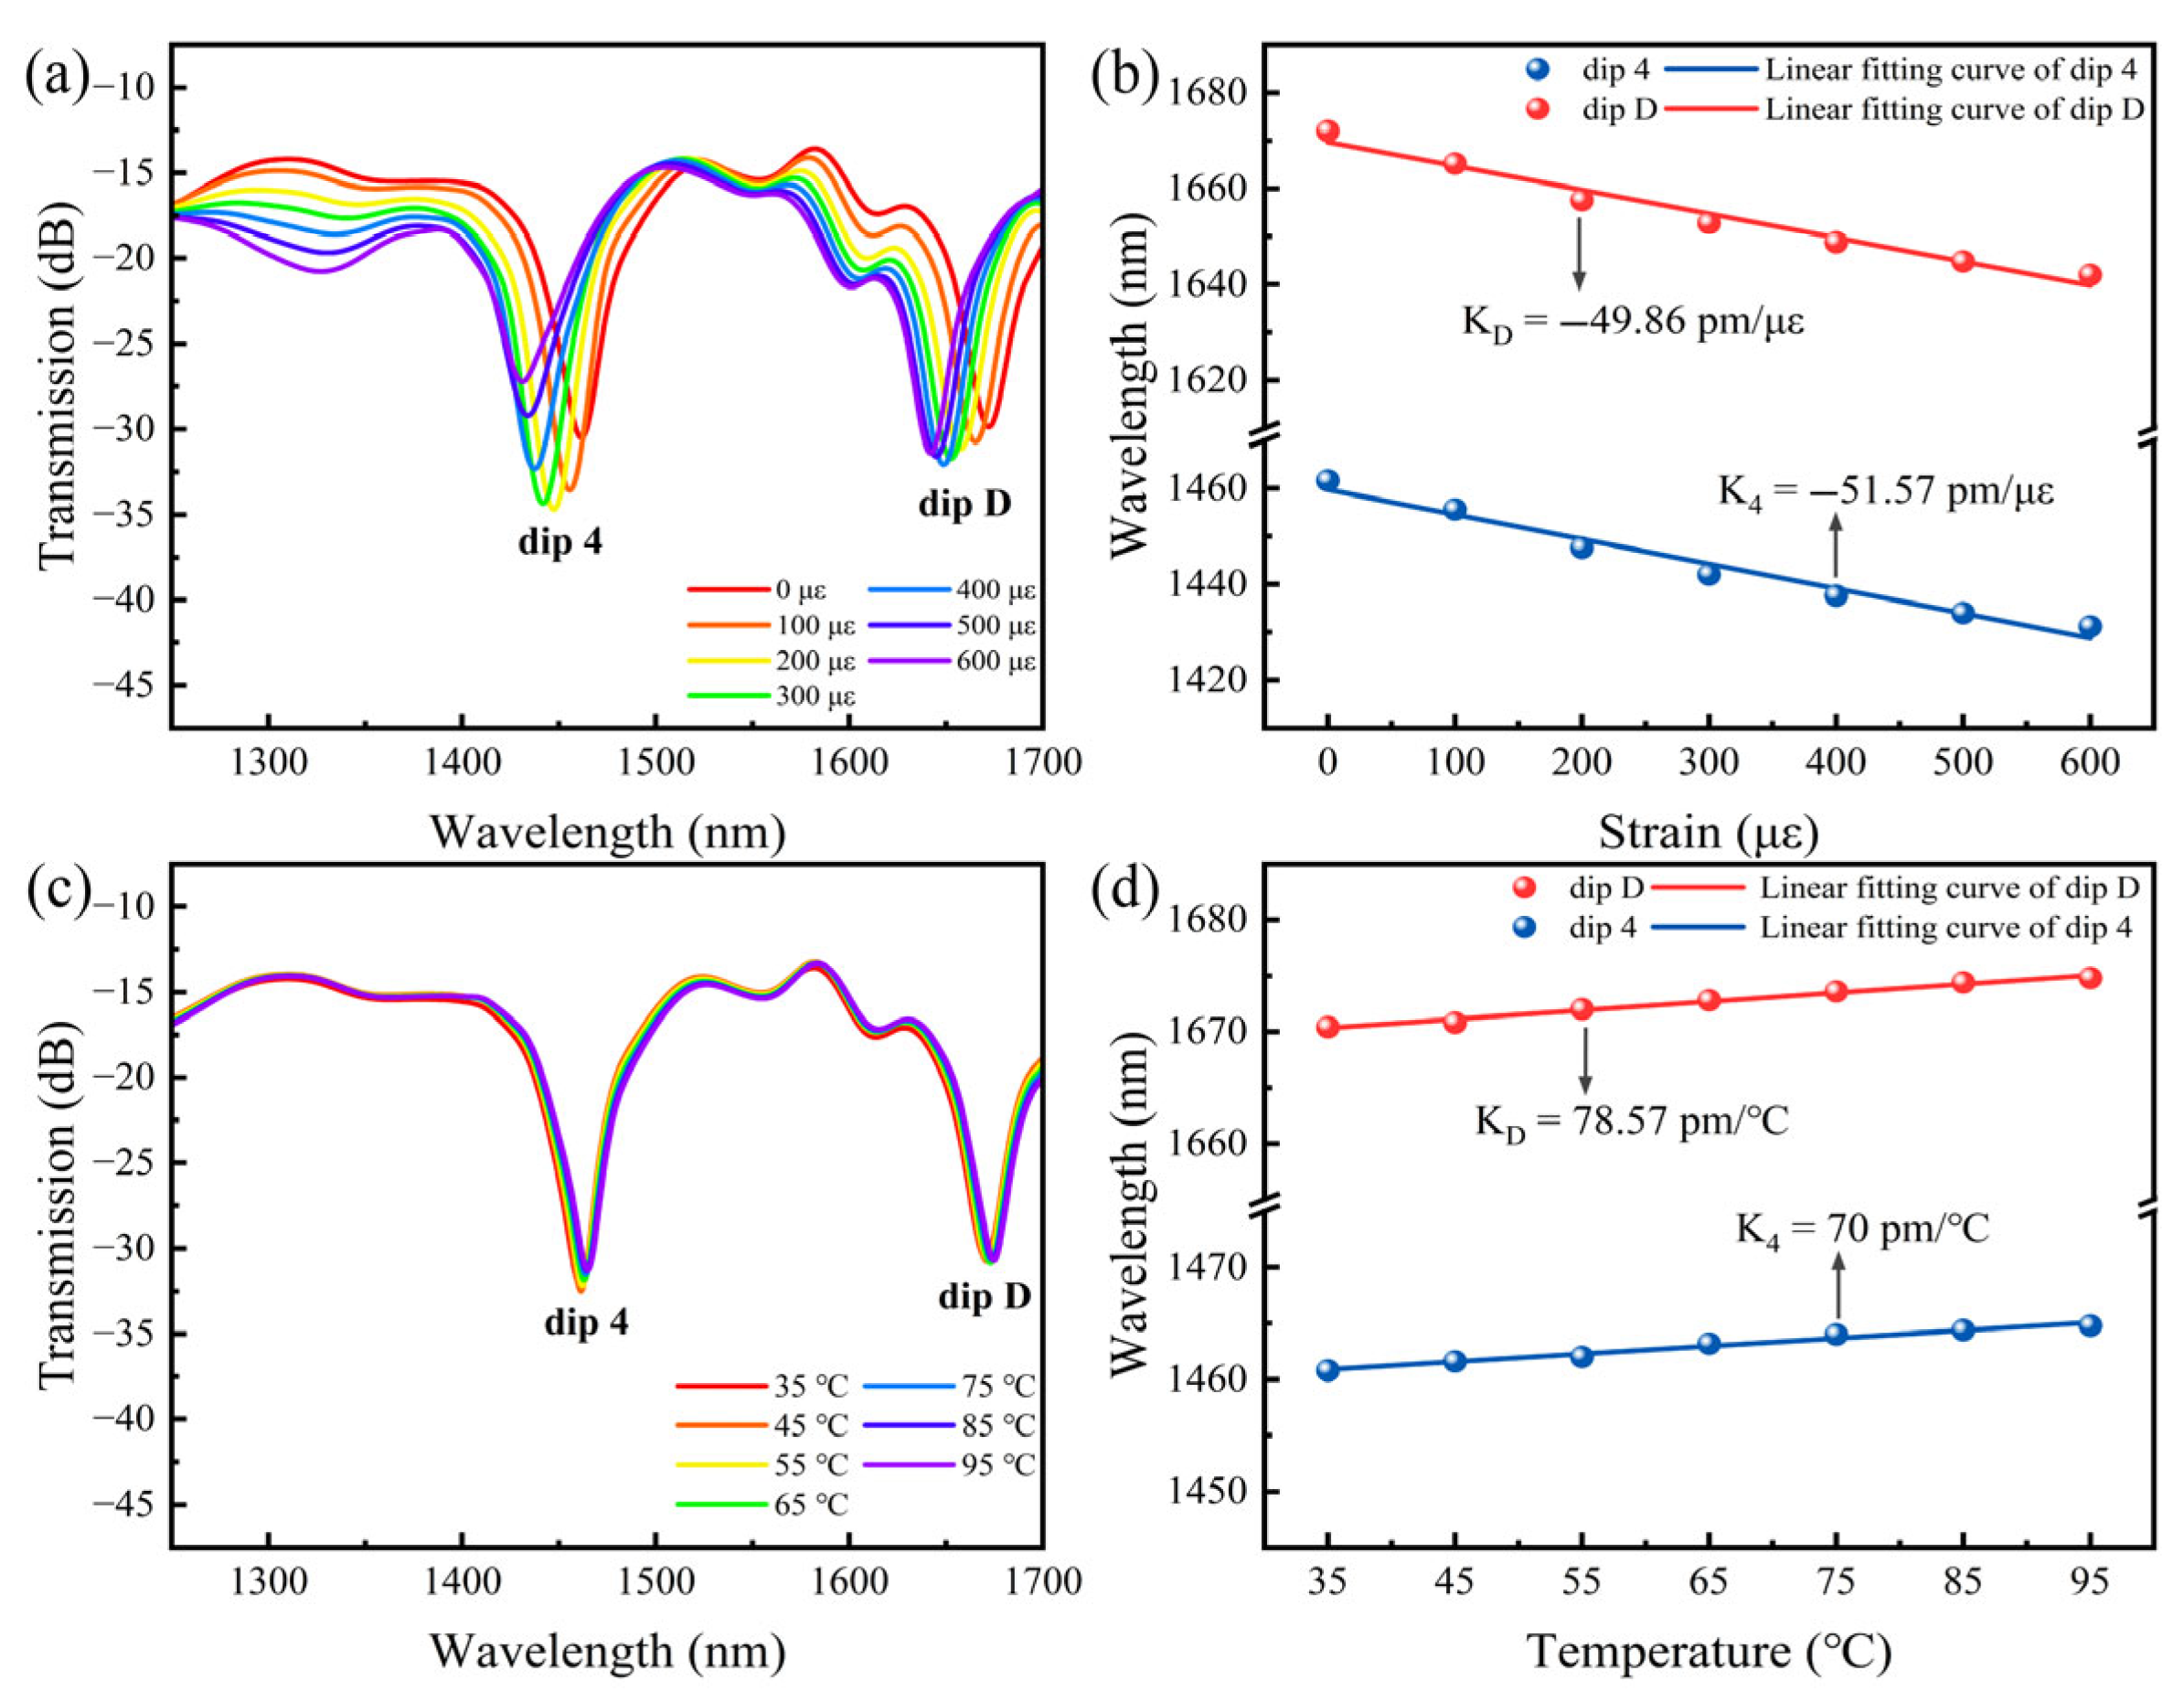
In addition, to verify the reproducibility of the sensor, we designated the sensor with the offset of 35.61 μm as sample 1 and fabricated sample 2 with identical parameters for comparison. The transmission spectra, strain sensitivity, and temperature sensitivity of sample 2 are presented in Figure 11. The similarity in the transmission spectra of the samples indicates that they have good consistency. The strain sensitivities for sample 2 were 51.57 pm/µε and 49.86 pm/µε for dip 4 and dip D, respectively. The temperature sensitivities for the two resonance dips were 70 pm/°C and 78.57 pm/°C, respectively. The experimental results demonstrate that the sensor has satisfactory reproducibility.
Table 1 summarizes a comparison of several optical fiber sensors with different structures. The sensor proposed in this work features a straightforward structure, utilizing only a commercially available standard SMF (9/125 µm) and MMF (105/125 µm). Additionally, this design not only reduces manufacturing costs but also achieves a high-sensitivity simultaneous measurement of strain and temperature.

4. Conclusions

This work presents an optical fiber sensor based on a cascaded structure consisting of an SMS structure and a misaligned peanut-shaped structure. Experimental results demonstrate that the strain sensitivity of the sensor significantly improves with increasing offsets, reaching a maximum sensitivity of −48.21 pm/µε for the sensor with an offset of 35.61 µm over a strain measurement range of 0–600 µε. In contrast, the temperature sensitivity exhibits a non-monotonic relationship with the offset, initially increasing to a maximum of 124.29 pm/°C at 24.35 µm before decreasing in the temperature range of 35–95 °C. Furthermore, this sensor enables the dual-parameter detection of temperature and strain by using a sensitivity matrix based on two resonance dips. The sensor combines a simple structure with straightforward fabrication and low costs, while maintaining high sensitivity, showing great potential for applications that require simultaneous multi-parameter sensing, such as the detection of micro-deformations in bridges within the field of structural health monitoring, as well as the real-time monitoring of human physiological signals in wearable medical devices within the medical field.

Author Contributions

Conceptualization, B.W. and F.P.; methodology, F.P.; software, Y.Z.; validation, C.L. and H.Z.; formal analysis, Z.G.; investigation, G.Z.; resources, F.P.; data curation, J.Z.; writing—original draft preparation, C.L., B.W. and F.P.; writing—review and editing, C.L., L.K. and F.P.; visualization, X.C.; supervision, B.W. and F.P.; project administration, F.P.; funding acquisition, F.P. All authors have read and agreed to the published version of the manuscript.

Funding

This research was funded by the National Natural Science Foundation of China (grant number 62305244, 61775044), the Natural Science Foundation of Shandong Province (grant number ZR2025MS944, ZR2025MS858), the Youth science and technology innovation team of Shandong Province institution of higher learning (grant number 2022KJ258), and the Independent Cultivation Program of Innovation Team of Ji Nan City (grant number 202333042).

Data Availability Statement

The data will be available upon request.

Conflicts of Interest

The authors declare no conflicts of interest.

References

  1. Dong, X.; Luo, Z.; Du, H.; Sun, X.; Yin, K.; Duan, J. Highly sensitive strain sensor based on a novel Mach-Zehnder mode interferometer with TCF-PCF-TCF structure. Opt. Lasers Eng. 2019, 116, 26–31. [Google Scholar] [CrossRef]
  2. Hu, Q.; Zhang, S.; Yang, W.; Geng, T.; Sun, W.; Sun, C.; Jin, X.; Yuan, L. Highly sensitive curvature sensor based on long period fiber grating with alternately splicing multiple single/multimode structure. Opt. Fiber Technol. 2017, 37, 69–73. [Google Scholar] [CrossRef]
  3. Yang, L.; Xue, L.; Che, D.; Qian, J. Guided-mode-leaky-mode-guided-mode fiber structure and its application to high refractive index sensing. Opt. Lett. 2012, 37, 587–589. [Google Scholar] [CrossRef]
  4. Zhang, G.; Ge, Q.; Wang, H.; Wu, X.; Yu, B. Simultaneous temperature and strain measurement using TCF based Mach-Zehnder interferometer. Opt. Fiber Technol. 2021, 67, 102687. [Google Scholar] [CrossRef]
  5. Hu, X.; Liu, Y.; Wei, H.; Teng, C.; Yu, Q.; Luo, Z.; Lian, Z.; Qu, H.; Caucheteur, C. Tilted Bragg grating in a glycerol-infiltrated specialty optical fiber for temperature and strain measurements. Opt. Lett. 2024, 49, 2869–2872. [Google Scholar] [CrossRef]
  6. Wei, Y.; Xiang, H.; Liu, C.; Kang, J.; Tang, Y.; Ren, P.; Wang, X.; Liu, Z. Highly sensitive threaded LPFG strain sensor. Measurement 2025, 242, 116012. [Google Scholar] [CrossRef]
  7. Han, B.; Zhang, Y.; E, S.; Wang, X.; Yang, D.; Wang, T.; Lu, K.; Wang, F. Simultaneous measurement of temperature and strain based on dual SPR effect in PCF. Opt. Laser Technol. 2019, 113, 46–51. [Google Scholar] [CrossRef]
  8. Wu, D.; Zhu, T.; Chiang, K.S.; Deng, M. All Single-Mode Fiber Mach-Zehnder Interferometer Based on Two Peanut-Shape Structures. J. Light. Technol. 2012, 30, 805–810. [Google Scholar] [CrossRef]
  9. Zhou, Y.; Liu, Y.; Zheng, J. Investigation of an inline fiber Mach-Zehnder interferometer based on hybrid joints of core-offset and peanut-shape for refractive index sensing. Opt. Fiber Technol. 2023, 81, 103521. [Google Scholar] [CrossRef]
  10. Zhu, X.; Pan, Y.; Sun, A.; Liu, W.; Song, M.; Liu, X.; Cao, J.; Zhang, G.; Yang, Y.; Liang, Z.; et al. High sensitivity Mach-Zehnder interferometer based on peanut-shaped hollow-core fiber. Opt. Commun. 2023, 542, 129566. [Google Scholar] [CrossRef]
  11. Zhu, X.; Liu, W.; Sun, A.; Pan, Y.; Li, S.; Cao, J.; Zhang, G.; Yang, Y.; Yang, F.; Wang, C.; et al. Highly sensitive temperature and curvature sensor based on seven-core fiber. Opt. Lasers Eng. 2023, 169, 107725. [Google Scholar] [CrossRef]
  12. Cao, Y.; Zhao, Y.; Tong, Z.R.; Wang, Y. Magnetic field sensor based on peanut-shape structure and multimode fiber. Optoelectron. Lett. 2017, 13, 184–187. [Google Scholar] [CrossRef]
  13. Sun, M.; Jin, Y.; Dong, X. All-Fiber Mach-Zehnder Interferometer for Liquid Level Measurement. IEEE Sens. J. 2015, 15, 3984–3988. [Google Scholar] [CrossRef]
  14. Yuan, S.; Tong, Z.; Zhao, J.; Zhang, W.; Cao, Y. High temperature fiber sensor based on spherical-shape structures with high sensitivity. Opt. Commun. 2014, 332, 154–157. [Google Scholar] [CrossRef]
  15. Lv, L.; Wang, S.; Jiang, L.; Zhang, F.; Cao, Z.; Wang, P.; Jiang, Y.; Lu, Y. Simultaneous measurement of strain and temperature by two peanut tapers with embedded fiber Bragg grating. Appl. Opt. 2015, 54, 10678–10683. [Google Scholar] [CrossRef]
  16. Xiao, S.; Wu, B.; Wang, Z.; Jiang, Y. A peanut taper based Mach-Zehnder interferometric sensor for strain and temperature discrimination. Opt. Fiber Technol. 2022, 70, 102871. [Google Scholar] [CrossRef]
  17. Wang, H.; Meng, H.; Xiong, R.; Wang, Q.; Huang, B.; Zhang, X.; Yu, W.; Tan, C.; Huang, X. Simultaneous measurement of refractive index and temperature based on asymmetric structures modal interference. Opt. Commun. 2016, 364, 191–194. [Google Scholar] [CrossRef]
  18. Yu, F.; Xue, P.; Zhao, X.; Zheng, J. Investigation of an in-line fiber Mach–Zehnder interferometer based on peanut-shape structure for refractive index sensing. Opt. Commun. 2019, 435, 173–177. [Google Scholar] [CrossRef]
  19. Dong, L.; Gang, T.; Bian, C.; Tong, R.; Wang, J.; Hu, M. A high sensitivity optical fiber strain sensor based on hollow core tapering. Opt. Fiber Technol. 2020, 56, 102179. [Google Scholar] [CrossRef]
  20. Wang, K.; Mizuno, Y.; Lee, H.; Dong, X.; Kurz, W.; Fink, M.; Jakobi, M.; Koch, A.W. Experimental demonstration of offset-induced sensitivity enhancement in SMS-based temperature and strain sensing. Appl. Phys. Express 2023, 16, 052003. [Google Scholar] [CrossRef]
  21. Su, H.; Zhang, Y.; Ma, K.; Yi, G.; Zhao, Y.; Yu, C. Slight-Offset Tapered Multimode Fiber With High Sensitivity for Low Refractive Index Range. IEEE Sens. J. 2020, 20, 9849–9855. [Google Scholar] [CrossRef]
  22. Majee, A.; Dey, K.; Roy, S. Role of lateral Core-Offset in the sensitivity enhancement of single Mode-No core-Single mode fiber cascaded structure. Opt. Fiber Technol. 2024, 85, 103812. [Google Scholar] [CrossRef]
  23. Niu, H.; Zhang, S.; Chen, W.; Liu, Y.; Li, X.; Yan, Y.; Wang, S.; Geng, T.; Sun, W.; Yuan, L. Optical Fiber Sensors Based on Core-Offset Structure: A Review. IEEE Sens. J. 2021, 21, 22388–22401. [Google Scholar] [CrossRef]
  24. Gao, X.; Ning, T.; Pei, L.; Zheng, J.; Li, J.; Wang, J.; Wang, C.; Xie, C. Simultaneous measurement of strain and temperature based on no-core fiber and two-core fiber. Sens. Actuators A Phys. 2021, 331, 113013. [Google Scholar] [CrossRef]
  25. Zhu, X.; Pan, Y.; Sun, A.; Sun, D.; Liu, W.; Cao, J.; Zhang, G.; Han, Z.; Zou, L.; Liang, Z.; et al. High sensitivity curvature sensor based on a double-sphere tapered no-core fiber Mach-Zehnder interferometer. Opt. Laser Technol. 2022, 155, 108364. [Google Scholar] [CrossRef]
  26. Li, X.; Chen, Q.; Ren, M.; Feng, G. An All-Fiber Curvature Sensor with High Sensitivity Based on Sphere-Shaped Misaligned Structure. Optics 2025, 6, 3. [Google Scholar] [CrossRef]
Figure 1. (a) A schematic diagram of the sensor structure and operational principle. (b) Micrograph of a peanut-shaped structure with an offset of 35.61 µm.
Optics 07 00012 g001
Figure 2. A schematic diagram of the sensor fabrication process.
Optics 07 00012 g002
Figure 3. (a) A schematic diagram of the sensor with 0 µm core-offset. (b) A simulated optical field diagram with a 0 µm core-offset. Simulated optical field distributions at different positions under core-offsets of (ce) 0 µm, (fh) 24.35 µm and (ik) 35.61 µm. In the figure, Z1, Z2 and Z3 refer to the end of the spliced MMF, the center position of the first spherical structure, and the center position of the second spherical structure, respectively.
Optics 07 00012 g003
Figure 4. The diagram of the strain sensing experimental device.
Optics 07 00012 g004
Figure 5. Transmission spectra of the sensor under different strains with offset amounts of (a) 0 µm, (b) 12.6 µm, (c) 24.35 µm and (d) 35.61 µm; (eh) show magnified views of dips 1–4 corresponding to panels (ad), respectively.
Optics 07 00012 g005
Figure 6. The corresponding strain sensitivity of the sensor under different strains with offset amounts of (a) 0 µm, (b) 12.6 µm, (c) 24.35 µm and (d) 35.61 µm.
Optics 07 00012 g006
Figure 7. Linear fitting curves of interference dip wavelength and strain for four sensors (dip 1 to dip 4) in three repeated experiments: (a) three repeated experiments on four sensors; (b) repeatability experiment 1; (c) repeatability experiment 2; and (d) repeatability experiment 3. “Dip 1-1” refers to the first repeated experiment data of dip 1, “LFC of dip 1-1” refers to the linear fitting curve of dip 1-1, and the same applies to other legends.
Optics 07 00012 g007
Figure 8. Diagram of the temperature sensing experimental device.
Optics 07 00012 g008
Figure 9. Transmission spectra of the sensor under different temperatures with offset amounts of (a) 0 µm, (b) 12.6 µm, (c) 24.35 µm and (d) 35.61 µm; (eh) show magnified views of dip A–D corresponding to panels (ad), respectively.
Optics 07 00012 g009
Figure 10. The corresponding temperature sensitivity of the sensor under different temperatures with offset amounts of (a) 0 µm, (b) 12.6 µm, (c) 24.35 µm and (d) 35.61 µm.
Optics 07 00012 g010
Figure 11. (a) Transmission spectra of sample 2 under different strains. (b) The corresponding strain sensitivity of sample 2. (c) Transmission spectra of sample 2 under different temperatures. (d) The corresponding temperature sensitivity of sample 2.
Optics 07 00012 g011
Table 1. Comparison with fiber optic sensors of different structures.
Sensing StructureStrain
Sensitivity
Measurement RangeTemperature SensitivityMeasurement RangeRef.
Spherical-Shaped Structures1.2 pm/µε0–1000 µε119.3 pm/°C25–735 °C[14]
Triple-Peanut-Taper SPS MZI−0.639 pm/µε0–700 µε78.29 pm/°C29–69 °C[16]
Double-Sphere Tapered No-Core Fiber--−5.79 pm/°C40–90 °C[25]
SFS-SSMS7.99 pm/µε0–330.4 µε3.958 pm/°C20–140 °C[26]
SMS With Core-Offset1.19 pm/µε0–1169 µε13.92 pm/°C30–70 °C[20]
Misaligned Peanut-Shaped Structure−48.21 pm/µε0–600 µε84.29 pm/°C35–95 °COur Work
Disclaimer/Publisher’s Note: The statements, opinions and data contained in all publications are solely those of the individual author(s) and contributor(s) and not of MDPI and/or the editor(s). MDPI and/or the editor(s) disclaim responsibility for any injury to people or property resulting from any ideas, methods, instructions or products referred to in the content.