Article

Optical Characterization of a Sensitive Lophine Layer for the Detection of Hydrogen Ions (H+)

by
Pedro Marcos Velasco-Bolom
1,
Jorge Luis Camas-Anzueto
1,*,
Rocío Meza-Gordillo
1,
Madaín Pérez-Patricio
1,
Marcoantonio Ramírez-Morales
1,
Gilberto Anzueto-Sánchez
2,
Rubén Grajales-Coutiño
1 and
José Antonio Hoyo-Montaño
3
1
Optomomechatronic and Photonics Group, Instituto Tecnológico de Tuxtla Gutiérrez, Tecnológico Nacional de México, Carretera Panamericana km. 1080, Tuxtla Gutiérrez 29050, Chiapas, Mexico
2
Fiber Laser Group, Centro de Investigaciones en Óptica (CIO), Loma del Bosque 115, León 37150, Guanajuato, Mexico
3
Photonics Group, Instituto Tecnológico de Hermosillo, Tecnológico Nacional de México, Av. Tecnológico 115, Hermosillo 83170, Sonora, Mexico
*
Author to whom correspondence should be addressed.
Optics 2025, 6(4), 58; https://doi.org/10.3390/opt6040058
Submission received: 9 September 2025 / Revised: 17 October 2025 / Accepted: 14 November 2025 / Published: 19 November 2025
(This article belongs to the Section Photonics and Optical Communications)

Abstract

The scientific community has been interested in lophine’s versatility and usage in various applications. Research has shown that humic acid is a material that exhibits interference with lophine. Humic molecules associate with each other in supramolecular conformations through weak hydrophobic interactions at alkaline or neutral pH and hydrogen bonds at low pH. This work presents the characterization of a sensitive lophine layer based on water’s hydrogen ions (pH). We conducted a spectroscopy study to analyze how the absorbance at different amounts of lophine depends on pH. This study demonstrates the hyperchromic behavior of imidazole at various pH values, which may be utilized in an intrinsic fiber optic pH sensor. The dynamic range of the fiber optic sensor was 5 to 11.3 pH units. The sensor was developed by coating a thinned fiber with a sensitive lophine layer. It achieves a sensitivity of 0.27 dB/pH and a response time of 5 s.

1. Introduction

Most organic materials are determined by their chemical structure and functional groups, which can adjust their absorbance and fluorescence in response to interaction parameters [1].
In this sense, external parameters intervene in molecular conformation, packing, and non-covalent interactions, leading to changes in their luminescence properties [2,3,4,5]. Luminescence changes have been studied from the behavior of organic compounds at different pH values. An example of these compounds is phenolphthalein, which changes to pink when exposed to the pH of the medium [6]; other compounds are phthalides [7], coumarin [8], azo dyes [9,10], and imidazole derivatives [11,12,13], most of them have been limited to responses in the pH range of 5 to 9, which is suitable for pH measurements in the neutral zone, but only few have been developed for lower or higher pH values [14,15].
In particular, imidazole derivatives are fluorophores that exhibit halochromism behavior. Furthermore, they can exhibit electron withdrawing or donating behaviors depending on their chemical conditions due to their π-conjugated structure and the acidity nature of the NH- group [6]. Furthermore, changing its absorption wavelength and emission intensity generates the phenomenon of solvatochromism, a characteristic of interest for use as solvent polarity sensors [16,17].
Especially, 2,4,5-triphenyl-1H-imidazole (lophine) has shown fluorescence and chemiluminescence properties by emitting yellow light when reacting with oxygen in strongly basic conditions [18,19,20,21,22,23]. The study developed by Hayashi and Maeda reported the chemiluminescence mechanism of 2,4,5-triphenylimidazole, known as lophine, where the presence of oxygen is necessary for this process [19], White and Hardinic describe the chemical processes that involve chemiluminescence and conclude that it is produced from the singlet state of the compounds and that oxygen is not present directly in this excited state, but in the production of a peroxide, whose decomposition gives rise to chemiluminescence [24]. Marino and collaborators mentioned the importance of lophine chemiluminescence in the analysis of trace metals in water samples, they achieved this by adding hydrogen peroxide in lophine solutions and determined the detection and interference limits of several metals and non-metals that influence the chemiluminescence signals, among the non-metals there are chemical species such as humic acid whose limit detection value was between 37 ppm and 0.5 ppm of interference [25]. The importance of the study of humic acid as a vehicle for the mobilization, transport, and immobilization of organic compounds and metals, which is due in part to the nature of this species as the hydrophobic acid fraction of humus that precipitates at pH 2, after extraction at pH 13–14.
In 1966, White and Sonnenberg described in their manuscript the mechanism of photochromism and thermochromism of the interactions of dimers and radicals obtained when oxidizing lophine [26]. Therefore, since lophine is a thermochromic material [27,28,29], it is necessary to control the temperature in all measurements.
The study proposed by the authors in the manuscript [20] showed a halochromic behavior at different pH values. They showed that all lophine derivatives presented a significant change when the pH was changed from a value of 7 to 1, but they did not observe a substantial change for values above 7. They detailed that lophine’s wavelength, λ (maximum), changed from 311 nm to 295 nm with reduced absorption intensity when changing from pH values 7 to 1. The isosbestic point was observed at 285 nm. These results indicated the formation of protonated lophine with decreasing pH values. The protonation was generated at the three positions of the imidazole ring where the nitrogen (N) atom is located.
By interacting with different pH values, it is possible to visualize the effect of the electron donor (push) or electron acceptor (pull) groups attached to the C-2 of the imidazole ring, primarily caused by the electron density of the structure, as well as the donor capacity of the N atom.
In this way, the main focus of this work has been to demonstrate the change in optical properties that lophine undergoes when pH changes in acidic, neutral, and basic conditions. The literature review did not reveal any studies on the interaction of lophine with pH changes over a broad range. This is the first time a study has been reported on the halochromic property of lophine, which can be incorporated as a sensing element in a section of optical fiber for pH measurement. This application is the innovation proposed in this study, considering that its incorporation as a coating on optical fibers is simple, easy, and practical.

2. Materials and Methods

2.1. Materials

The materials used to obtain the mixture were lophine (C6H21N1, 98%, Mw = 296.37), polyvinyl chloride (PVC), tributylphosphate (TB), and tetrahydrofuran (THF) acquired by Sigma-Aldrich (St. Louis, MO, USA). In addition, calibrated pH buffers with different pH values from the Hycel (Zapopan, Jalisco, Mexico) company were used. The buffers are colorless to avoid noise in measurements.
Regarding the optical characterization, standard VELAB (Mexico City, Mexico) brand glass slides were used, a THORLABS MBB1F1 LED light source (Newton, NJ, USA) with an emission spectrum of 470–850 nm was used, and an Ocean Optics HR4000CG spectrometer (Orlando, FL, USA) with a 200–1100 nm spectral window.

2.2. Liquid Phase

The preparation of the samples in the liquid phase was carried out by modifying the amount of lophine in the mixture used in [30]. As mentioned in the article, lophine was mixed with 2 mL of Tetrahydrofuran (THF), 160 µL of tributylphosphate (TB), and 80 mg of Polyvinylchloride (PVC). The homogeneous mixture was obtained by stirring for 10 min in a vortex at 3000 rpm. In addition, a blank reference sample was prepared, which consisted of 2 mL of THF, 160 μL of TB, and 80 mg of PVC to calibrate the spectrometer.

2.3. Solid Phase (Film)

After mixing the lophine with the other elements, the standard glass slides were cleaned with isopropyl alcohol and distilled water and dried for 30 min. Subsequently, 100 µL was added to an area of 5 mm × 10 mm of the volume of the total mixture and allowed to dry at a temperature of 25 °C for 72 h, obtaining films of the material. Figure 1 shows a photograph of the films of lophine on a microscope slide. It was taken using a compound microscope (CARL ZEISS-Primo Star, Oberkochen, Germany). The SLL shows microcrystal formation, and its thickness is approximately less than 2 µm. Figure 1a shows the formation of microcrystals observed under a microscope using a 4× objective. In this image, the region magnified with the 10× objective and presented in Figure 1b is outlined with a white dashed box. Similarly, the yellow box indicates the area observed at the highest magnification in Figure 1c, using a 40× objective. Finally, the box highlighted in Figure 1b corresponds to the region magnified with the 40× objective and shown in Figure 1d.
The crystalline branches of lophine are responsible for the modification of the refractive index in the optical fiber cladding when it is subjected to the protonation-deprotonation process. This phenomenon is due to the changes in the macroscopic optical properties that occur during this process, which explains the linear correlation observed in the optical response as a function of pH variations.

2.4. Manufacturing of Fiber Optic Sensor

In this stage, an FG105UCA multimode (THORLABS, Newton, NJ, USA) optical fiber was used with dimensions of 105 µm in core diameter and up to 125 µm in the cladding. The procedure to deposit the material on the surface of the optical fiber was first to thin the fiber by chemical attack. The thinning of the optical fiber was carried out by depositing 30 µL of hydrofluoric acid on a section of optical fiber in a length of 1 cm for 20 min; the characterization resulted in an attack rate of 2.82 µm/minute for ambient conditions of 25 °C and 100% hydrofluoric acid. With this chemical attack time, it was guaranteed to obtain a diameter of approximately 68.58 µm of the optical fiber, indicating the fiber core’s exposure. The repeatability of the procedure was verified by performing it five times; the results show a deviation of less than 2 µm.
After thinning the optical fiber, 100 µL of the total mixture of the components with the lophine was deposited to form a sensitive layer of the material on the optical fiber and allowed to dry for 72 h at 25 °C, as shown in Figure 2a. A photograph taken with an AmScope optical microscope (Irvine, CA, USA) of the material adhered to the optical fiber, where a distribution in micro-ramifications of lophine crystals adhered to the optical fiber is observed.
Figure 2b shows a schematic diagram of the sensitive element, in which the thinning of the optical fiber, corresponding to 68.5 µm, can be observed, as well as the sensitive layer of lophine adhered to the surface of the optical fiber, with a thickness greater than 200 µm. Based on the evanescent wave principle, the physical parameters of the optical fiber, and the corresponding refractive indices, it was determined that the penetration distance, D p , of the evanescent wave is approximately 15 µm. This parameter is relevant because it justifies that the arrangement of the sensitive layer around the fiber is not completely uniform, provided that its thickness is greater than that value.

3. Results

3.1. Spectroscopic Characterization Results

The experimental setup used for the characterization of the fabricated films and the effect at different pH values is shown schematically in Figure 3. An LED with a spectral width of 470–850 nm with a typical power of 0.3 mW, a TC-125 temperature controller that maintains the temperature at 25 °C throughout all measurements, and an Ocean Optics HR4000CG spectrometer with a 200–1100 nm spectral window.
The absorbance spectral response at different pH values of the films was characterized using pH buffers ranging from pH 1.68 to 11.3. The slides with the films were immersed in the water solution with a specific pH value in the temperature control (QPOD). The absorbance spectrum was recorded for each pH value. After each measurement, the slide with the films was washed with distilled water to remove residue from the previous solution.
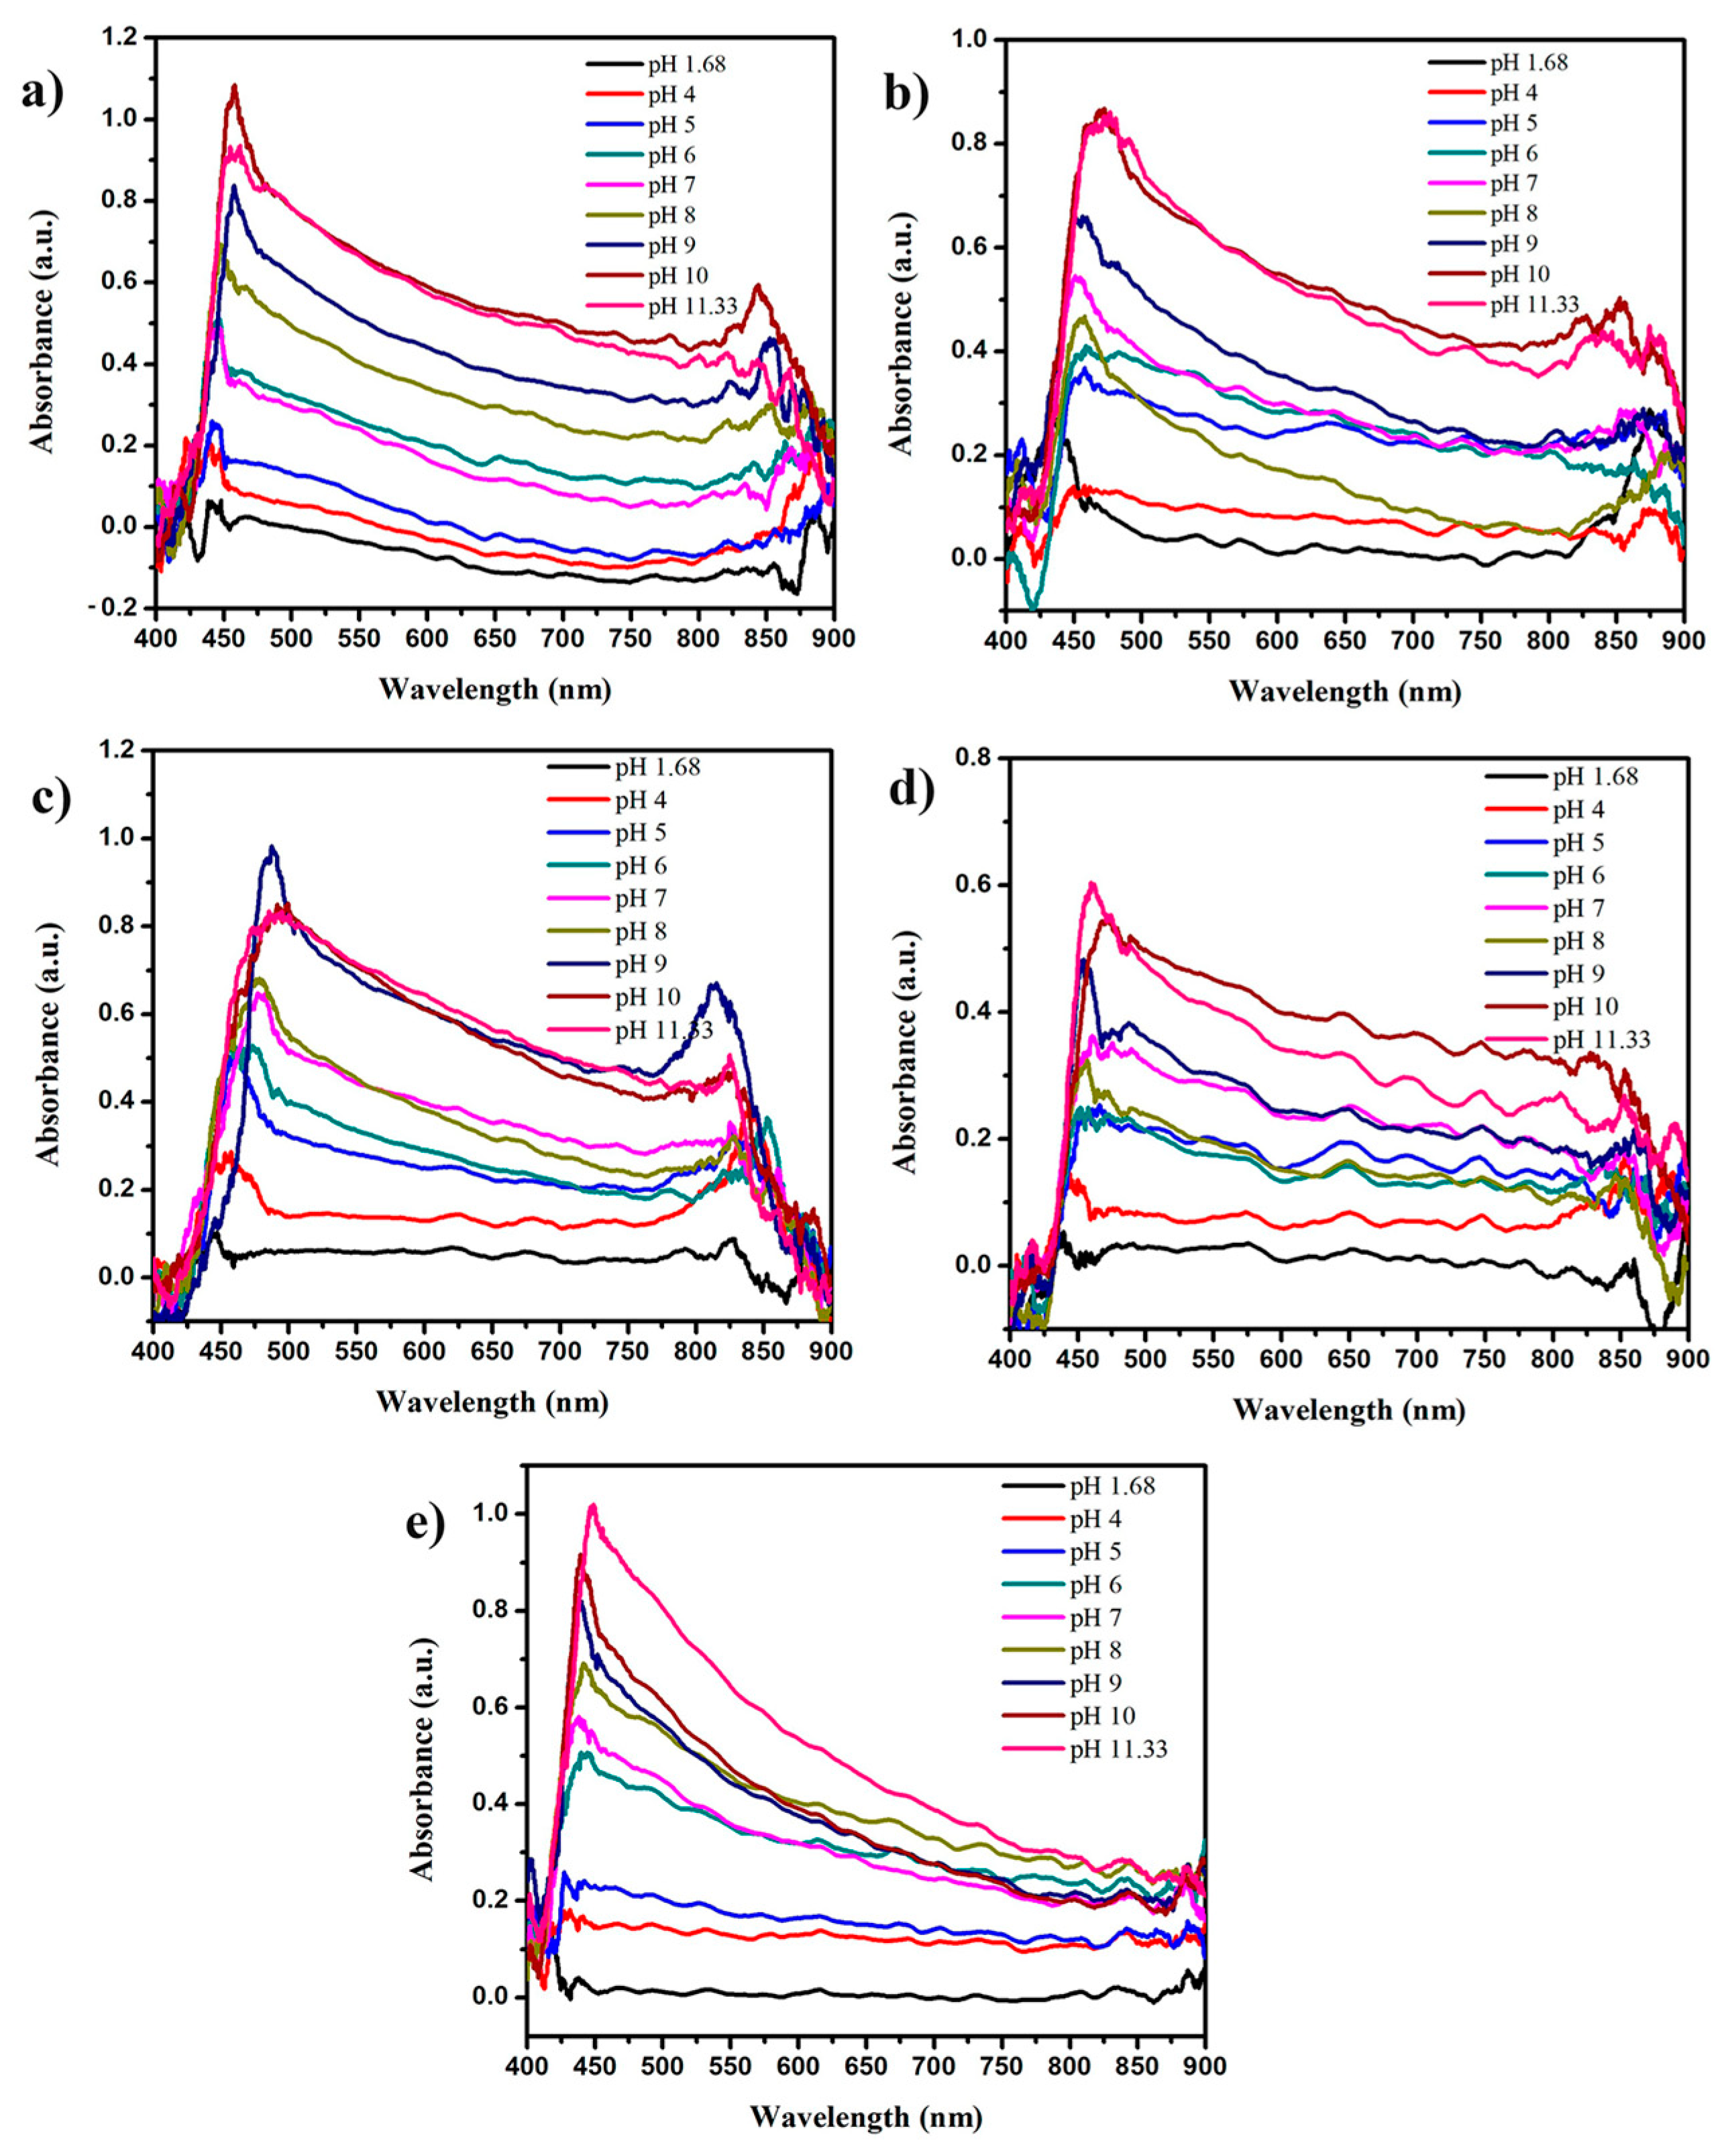
Figure 4 shows the absorbance intensity levels for each sample containing a determined amount of lophine. It is observed that there is a correlation between the absorbance intensity level and a function of pH value. The optical effect generated is the so-called hyperchromic effect, depending on the film which goes from an acid to an alkaline solution. The hyperchromic effect is caused by the interaction of the imidazole ring, specifically in the C-2 position, where the functional groups can accept or donate electrons to generate hydrogen bonds produced by the activity of hydrogen ions ( H + ) for acidic solutions and hydroxyl ions ( O H ) for alkaline solutions.
Figure 4a shows the dependence of absorbance, that is, the hyperchromic effect; however, the values corresponding to pH 10 and 11.3 make it impossible to discriminate the absorbance intensity value. For the case of the 20 mg sample shown in Figure 4b, there is an overlap of the absorbance at pH value 8 when carrying out the measurements. Figure 4c shows the result of the sample with 30 mg of lophine. For pH values 9–11.3, the spectrum presents the same intensity levels. The sample containing 40 mg of lophine corresponds to Figure 4d. In this case, with the values of pH 5, 6, and 8, it is impossible to identify a correlation between the pH value and the absorbance intensity. Finally, Figure 4e shows that with 50 mg of lophine, there is an identifiable correlation for each pH value and the absorbance intensity in an ascending manner when going from an acidic medium to an alkaline medium between the wavelengths of 470–500 nm. For wavelengths above 500 nm, the overlap is observed in the absorbance curve for this sample; therefore, the wavelength for the characterization of the proposed fiber optic sensor is selected in this spectral window.
Measurements were made for the samples of 60, 70, 80, 90, and 100 mg, but the behavior for these quantities did not present a correlation like those shown for smaller quantities. This new behavior is attributed to the saturation of crystals formed in the film on the slides.
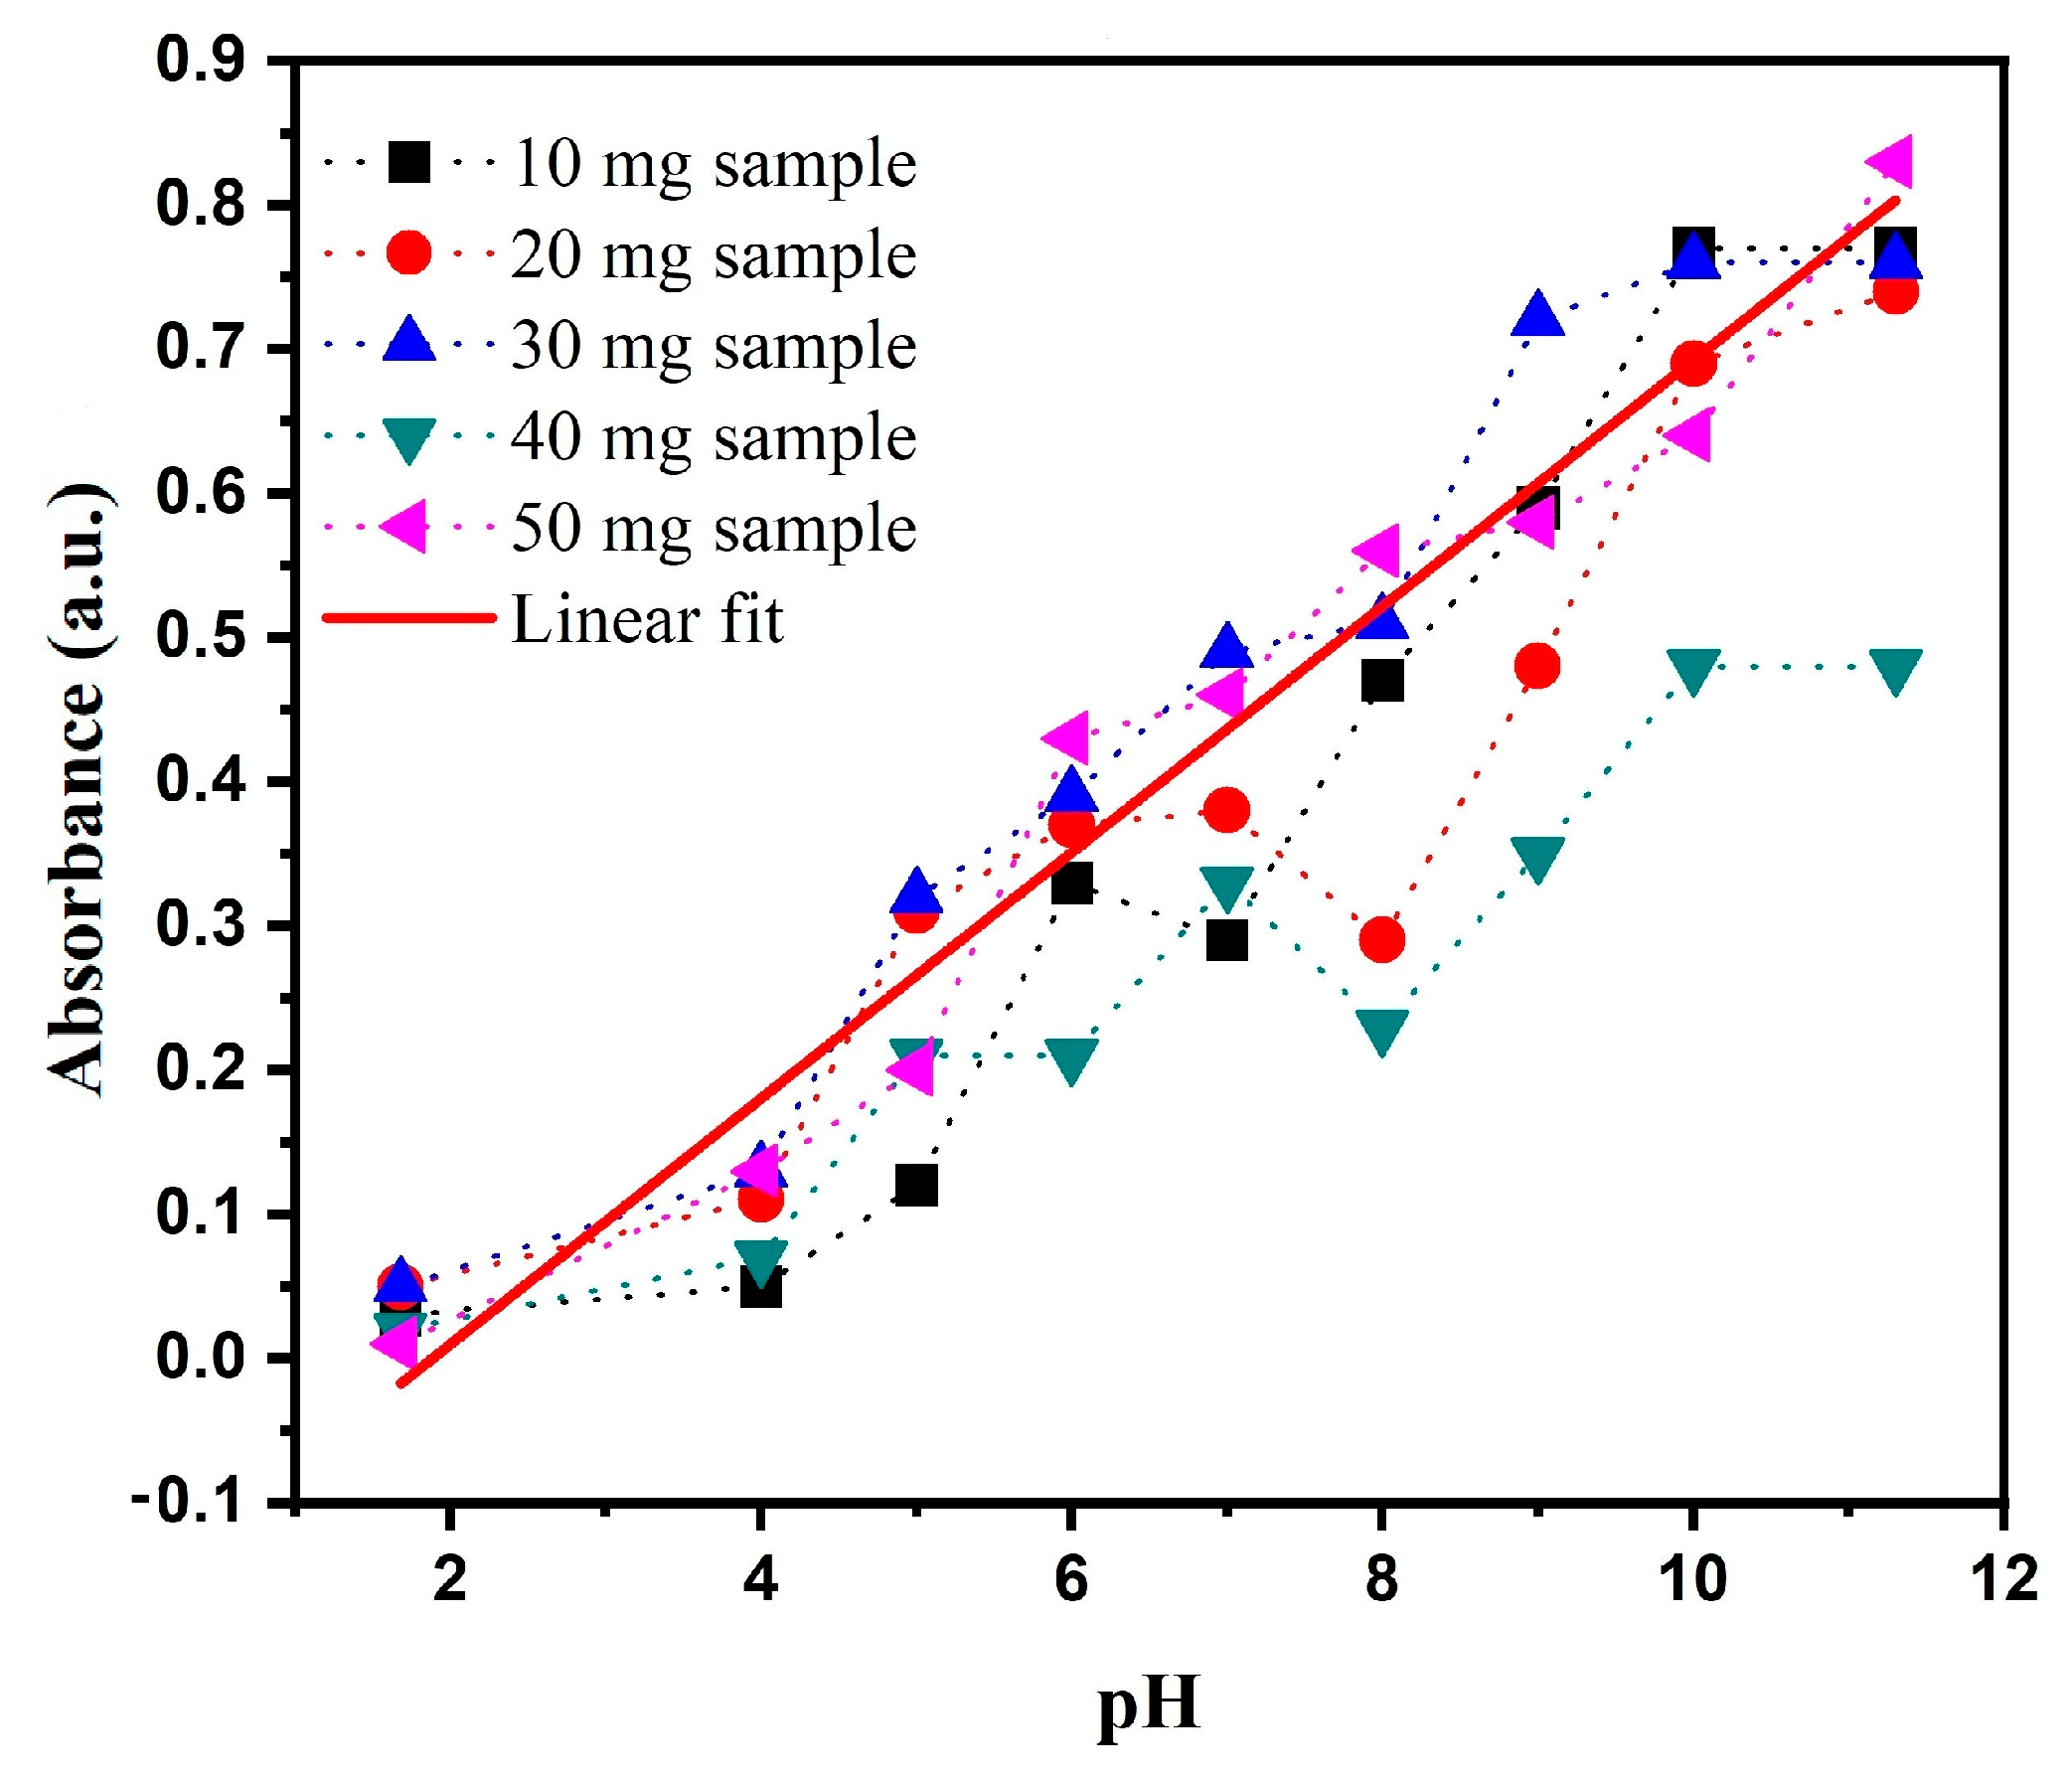
Figure 5 shows the sensitivity curves obtained from the absorbance spectra values presented in Figure 4. The wavelength chosen was 500 nm because the maximum point where the MBB1F1 light source reaches its maximum optical power is 500–600 nm. According to Figure 4, in that range, the absorbance spectrum has the same behavior but with higher intensity for the wavelength of 500 nm.
The results of the characterizations are the average obtained from performing three measurements for each pH value and each film manufactured. In Figure 5, a linear fit (red line) was performed to analyze the sensitivity trend, yielding an R2 of 0.85 and an error of 0.047 for the data set corresponding to the 50 mg lophine sample (pink curve). This value represents the lowest error among the samples analyzed, indicating a smaller deviation compared to the other curves. This result shows that the concentration of 50 mg of lophine correlates with the hyperchromic effect in the pH range of 1.68–11.3 and does not present an overlap in the absorbance curves for each pH value, this characteristic is the desired one for sensitive applications, where a linearity of the response with respect to each change is sought, in this sense, the decision was made to use the concentration of 50 mg to be deposited on a section of optical fiber.

3.2. Characterization of the Material on Optical Fiber

Figure 6 presents the experimental setup used to characterize the material deposited as a coating on a thinned optical fiber and observe the behavior of light power as a function of pH. In this experimental setup, an LED with a spectral width of 470–850 nm and a typical power of 0.3 mW, a Thorlabs TM105R3F1A fiber optic coupler (Newton, NJ, USA) (80:20), an S150C photodiode (Newton, NJ, USA), and aoptical power meter (Newton, NJ, USA), both from Thorlabs, are used.
The fiber coupler is an element that allows us to divide the input light signal into two ports. The first port transmits 80% of the signal, and the second transmits 20%. In the first, the thinned optical fiber is connected to the sensitive element (lophine), connected to channel 1 of the power meter. In contrast, the second port is connected directly to channel 2 of the power meter. The connection of both channels allows the measurement of the relative power change caused by the fiber sensor measurements and avoids power losses caused by the light source. In this sense, the measurements were obtained in units of decibels (dB), as provided by the measuring equipment PM320E.

3.3. Power Characterization as a Function of pH

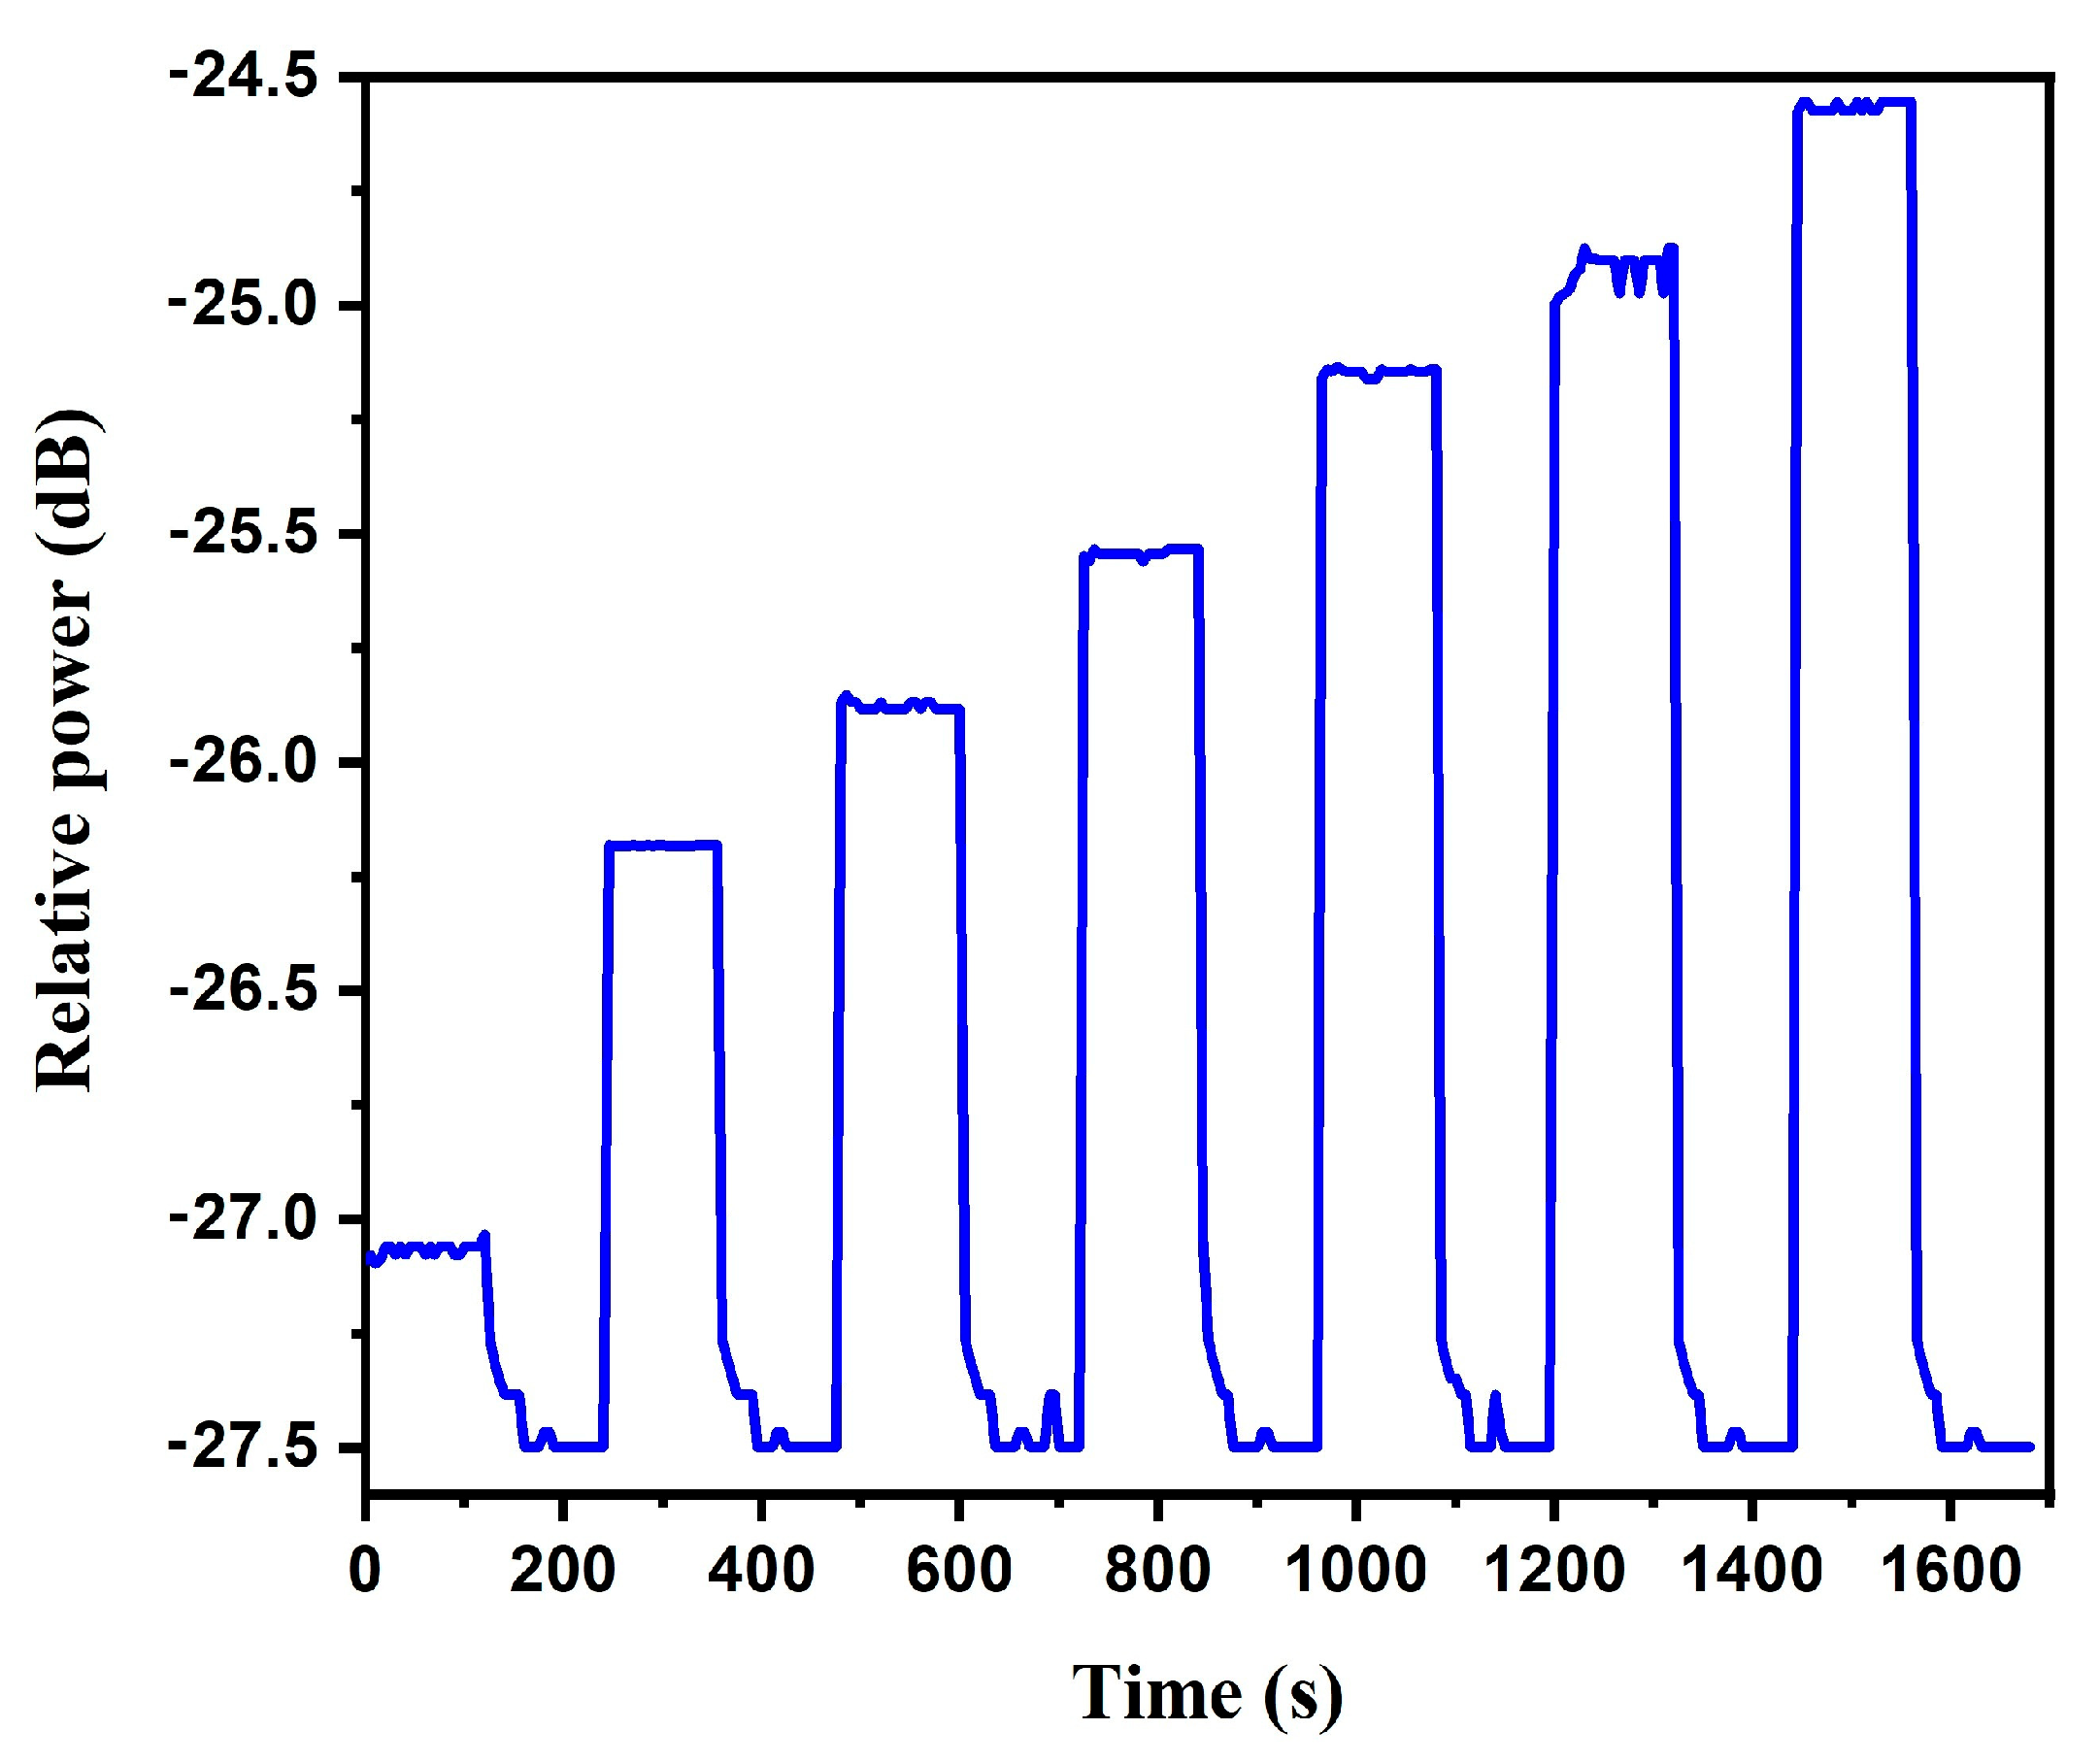
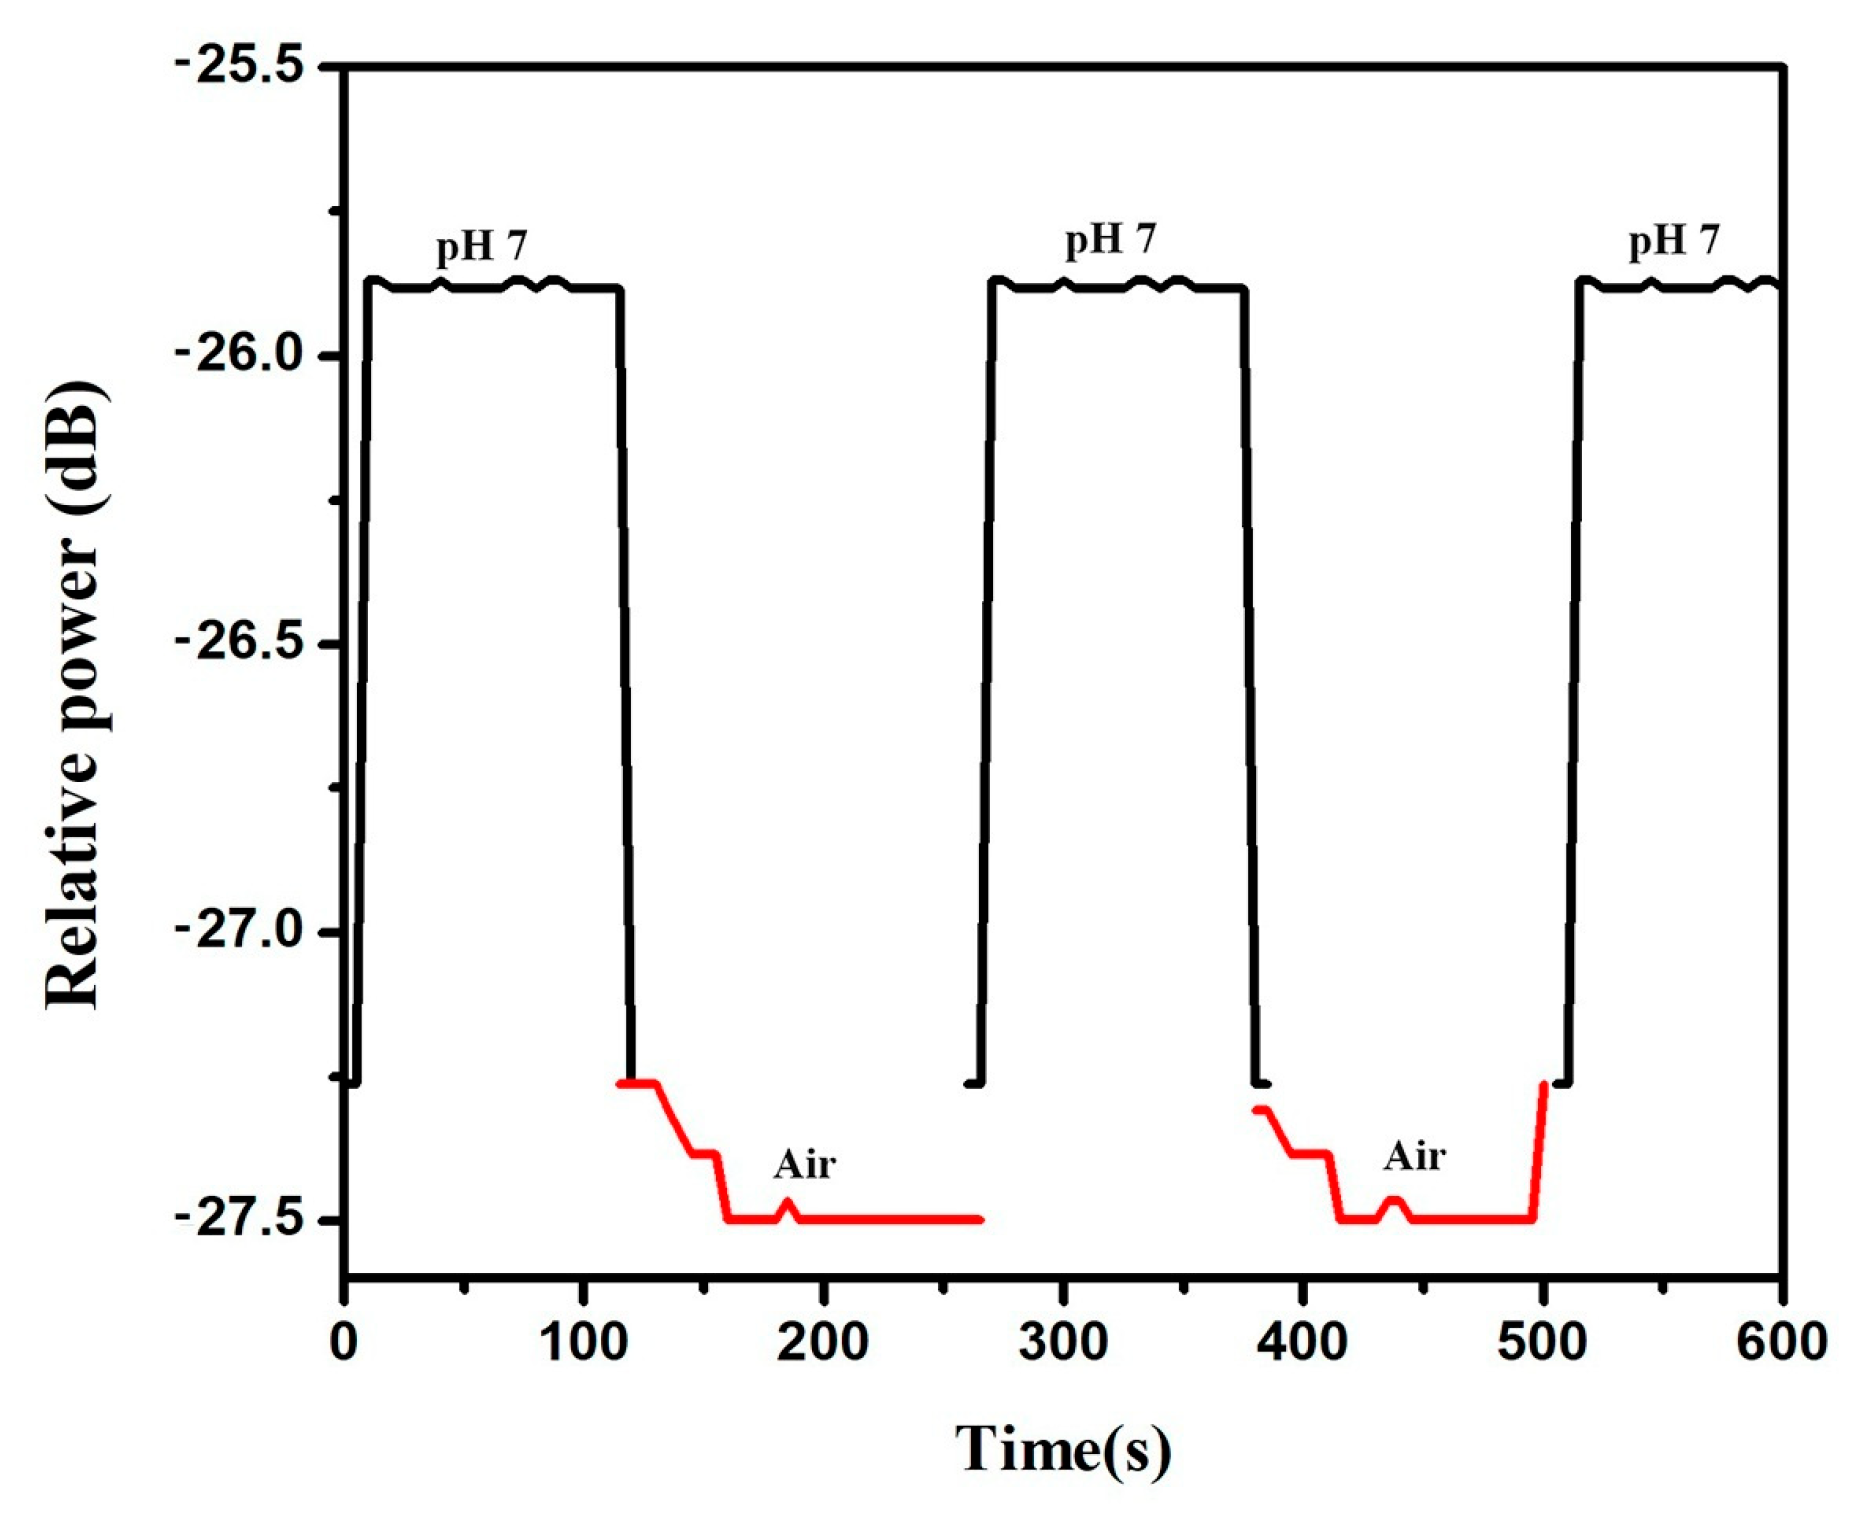
Figure 7 shows the graph for the pH 5–11.3 measurement range, which has a uniform growth in the optical power at each pH value. For values less than 5 pH units, the sensor behavior was erratic. This measurement was carried out by subjecting the fiber sensor to each pH value for 2 min (120 s) and 2 min in air. For each step, the sensor was washed with distilled water to remove excess material from the sensor. It is observed that the fiber sensor responds to the presence of pH, since when the sensor is in the air, it returns to the reference power level (−27.5 dB). While it was placed in a sample with a defined pH, the power changed, differentiating the power for each pH unit in water.

3.4. Fiber Optic Sensor Sensitivity and Repeatability

For the repeatability of the sensor, it was necessary to carry out three measurements under the same conditions of constant temperature and pH values in ascending order, from a pH value of 5 to a pH of 11.3. Figure 8a shows the behavior of the three measurements and a fourth curve representing the average. The standard deviation of the data from the mean curve is 0.015. Since this value is lower than typical measurements, it indicates that the data points are tightly clustered around the mean curve, implying high repeatability, as illustrated in Figure 8a. Therefore, it indicates that there are no variations in each repetition. Figure 8b shows the sensitivity graph obtained from the average of the measurements. The sensitivity obtained is 0.27 dB/pH with an R2 setting of 0.99, showing linear behavior.

3.5. Sensor Hysteresis and Stability

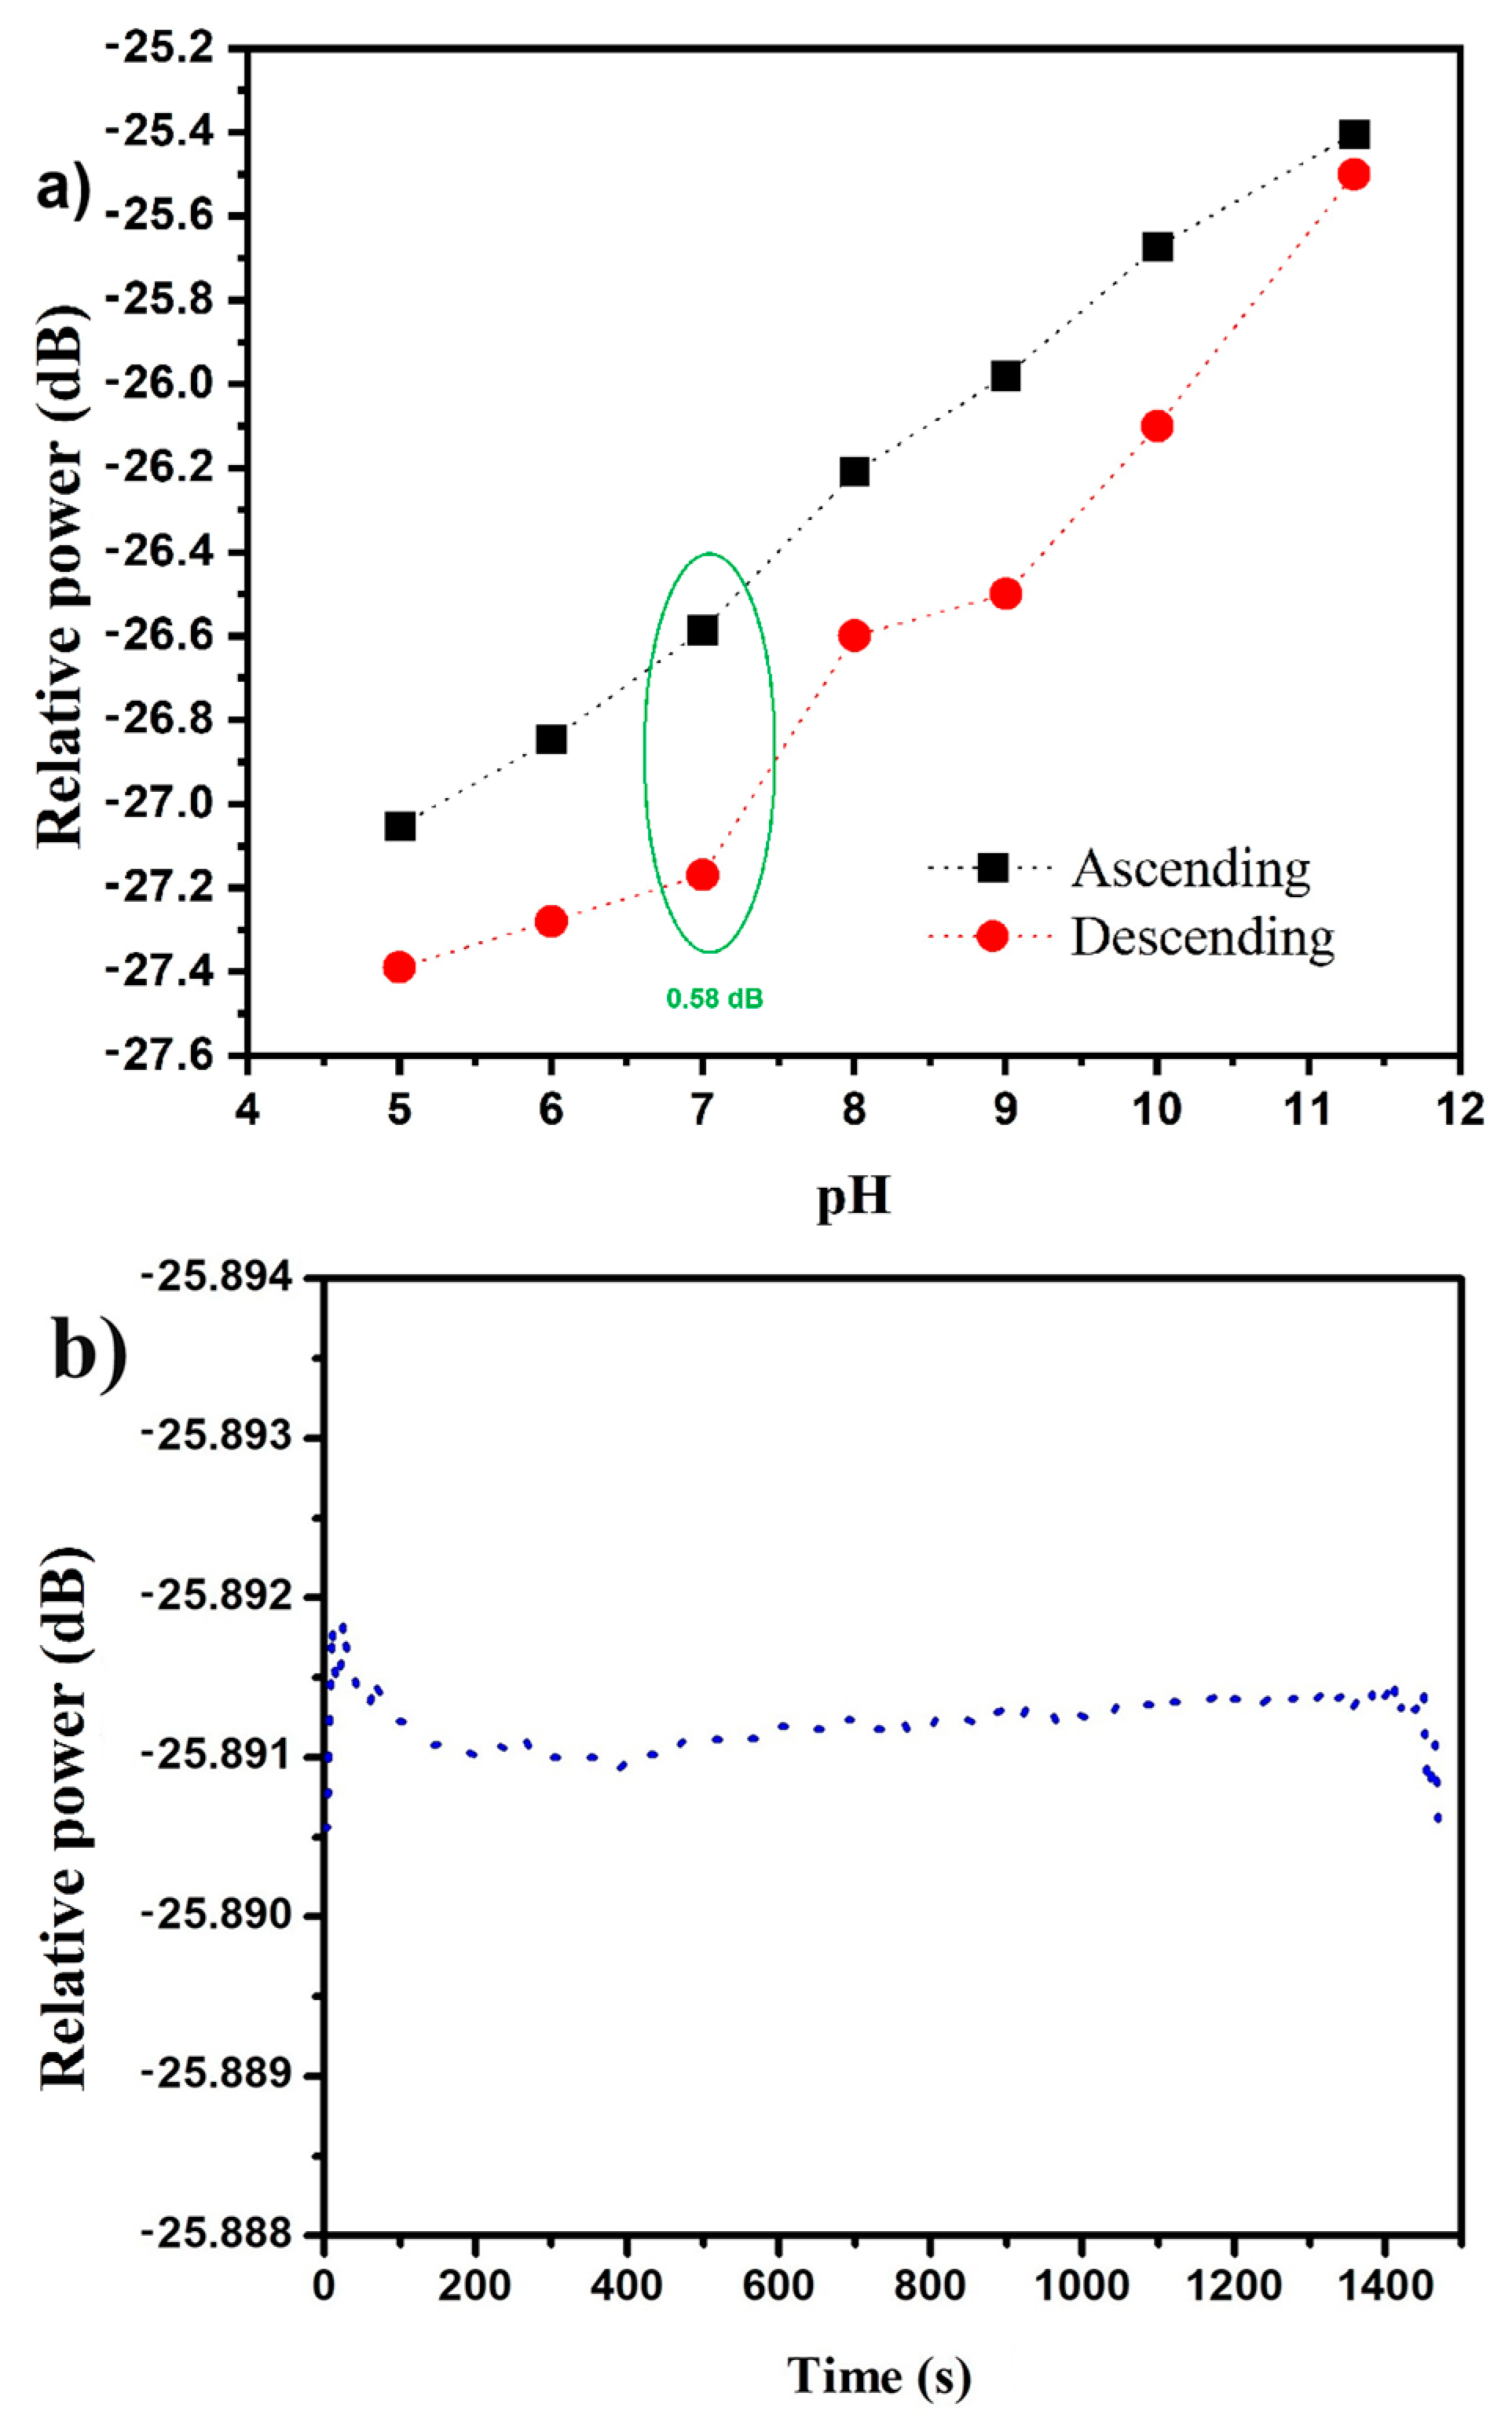
The hysteresis measurement of the fiber optic pH sensor is presented in Figure 9a. This measurement was obtained by measuring the pH values in ascending and descending order and their corresponding relative power shift. This proposed fiber optic sensor has a maximum power deviation of 0.58 dB at 7 units. For the calculation, Equation (1) is used:
h y s t e r e s i s = Y m a x Y × 100 %
where Y m a x represents the maximum deviation of the optical power during the measurement process, Y is the difference between the minimum and maximum power, which corresponds to 1.89 dB in the downward measurement; therefore, the hysteresis percentage of the sensor is 30%. Measurements were performed at 2 min intervals by increasing and decreasing pH values. The effect is attributed to the accumulation of hydroxide ions ( O H ) in the lophine structure, which causes its deprotonation. This protonation-deprotonation equilibrium induces modifications in the molecule’s electronic transitions, resulting in abrupt changes in the relative power measured by the fiber optic device.
The stability of the sensor was manifested by measuring a fixed pH value for 25 min. Figure 9b shows that after a few seconds, the optical power of the sensor stabilizes around −25.89 dB for a pH value of 11.3.

3.6. Sensor Response and Recovery Time

The last characterization was to measure the response and recovery time of the fiber optic sensor, as shown in Figure 10. In this part, the fiber optic pH sensor was subjected to the change in a pH value for 2 min and 2 min in the air, the procedure was similar to that shown in Figure 7 after each work cycle the time of rise, that is, the time it takes for the sensor to respond to a given pH value is less than 5 s and the recovery time in the air is on average 32 s.
The determined response time is suitable for applications requiring a gradual response in the detection of pH variations.

4. Discussion

The halochromic effect in Lophine is governed by the modulation of the electronic density of the imidazole ring as a function of pH [20]. The molecular origin of the optical response lies in its ability to act as a pH-sensitive chromophore due to the presence of the imidazole ring (show Figure 11). In its neutral state (a), Lophine exhibits an extended π - conjugated system through its three phenyl groups. The imidazole ring displays a mild electron-donating character. This donor behavior of the non-protonated nitrogen allows the establishment of intramolecular charge transfer ( π - π * ), which defines its absorption properties. Under acidic conditions (b), Lophine undergoes protonation at its most basic nitrogen atom (the one not bound to hydrogen). The addition of a proton suppresses the electron-donating character of the imidazole ring. This loss of donor ability reduces effective electronic conjugation. Consequently, the ground and excited states become more energetically separated, resulting in a hypochromic shift. In the presence of strong bases (c), the proton of the imidazole ring can be abstracted, generating an anionic species. The formation of this anion drastically increases the electronic density on the imidazole ring [31]. The anionic imidazole group acts as a much stronger electron donor than the neutral ring. This anion induces a more extensive intramolecular charge transfer. The excited state becomes more stabilized than the ground state, leading to a bathochromic shift.
The characterization of the proposed fiber optic sensor that has lophine as a coating shows promising results to be used in applications when measuring high pH values, that is, for base solutions, the use of the evanescent wave principle in the area coated with lophine. It shows us a linear behavior in the measurement range of pH 5–11.33 and a sensitivity of 0.27 dB/pH with a line adjustment of 0.99. For measurements with low pH values, the behavior was not linear, due to its strong charge conditions in its molecular structure, so it is proposed to dope it with another material using chemical functionalization techniques, as performed in [32] to obtain better behavior when deprotonating the imidazole molecule, since greater stability is required when capturing H + ions.
Table 1 shows a comparison of this proposal with other fiber optic sensors already reported that use the same operating principle, which is light-matter interaction through evanescent waves. Each of the exposed works presents a different fiber optic configuration. To facilitate comparison of results, the sensitivity obtained in this work, which corresponds to 0.27 dB/pH, was converted to power units to directly compare the results with those previously reported in the literature. To this end, it was considered that the light source used provides a typical output power of 0.3 mW for an optical fiber with diameters less than 200 μm. According to Figure 6, the power measured in channel 2 of the PM320E meter corresponds to 20% of the signal, which is equivalent to a power of 0.06 mW. From these values, the conversion was performed, obtaining a sensitivity of 63.84 μW/pH. Consequently, the proposal presented in this work shows greater sensitivity and a shorter response time compared to previous studies. In addition, it stands out for its ease of manufacture, practicality, and reproducibility.

5. Conclusions

A spectroscopic characterization of material with fluorescent and chemiluminescent characteristics, known as lophine, was carried out. Given its photochromic characteristic, it was observed that lophine presents a hyperchromic effect when subjected to different pH values by having an excitation source in the region of the visible electromagnetic spectrum. The change in absorbance intensities that cause this effect increases for certain wavelengths where the fiber optic pH sensor is linear as it passes into an alkaline solution. In addition, it was determined that the 50 mg lophine sample presents linear behavior at the wavelength of 500 nm in the pH range of 5–11.3. This amount of lophine was evaluated as a sensitive element to develop the previously uncoated fiber optic sensor by chemical attack, where it demonstrated a linearity of 0.99 in this same measurement range and a sensitivity of 0.27 dB/pH. The sensor response time is approximately 5 s, which is ideal for monitoring applications that require a gradual response to measure pH change.

Author Contributions

P.M.V.-B.: Methodology, Investigation, Visualization, and Characterization, Writing—original draft, Revision. J.L.C.-A.: Methodology, Investigation, Visualization, Project administration, Funding acquisition, and Characterization, Writing—original draft, Revision. R.M.-G.: Investigation, Conceptualization, Resources, Validation, Manuscript edit and Revision, Writing—review, editing and revision. M.P.-P.: Manuscript edit and Revision, Conceptualization, Writing—reviewediting and revision. M.R.-M.: Manuscript edit and Revision. Conceptualization, G.A.-S.: Manuscript edit and Revision, Validation, Writing—review, R.G.-C.: Manuscript edit and Revision, Conceptualization, Validation, Writing—review, editing and revision. J.A.H.-M.: Manuscript edit and Revision, Conceptualization, Writing—review, editing and revision. All authors have read and agreed to the published version of the manuscript.

Funding

This research was funded by Secretaría de Ciencia, Humanidades, Tecnología e Innovación (SECIHTI) de México (No. Ref.: CBF-2025-I-2863) and Tecnológico Nacional de México/IT de Tuxtla Gutiérrez (No. 22849.25-P).

Data Availability Statement

The experimental data presented in this study are available upon reasonable request from the corresponding author.

Conflicts of Interest

The author declare that they have no known competing financial interest or personal relationships that could have appeared to influence the work reported in this paper.

References

  1. Bernal, W.; Anandhan, K.; Percino, M.J.; Barbosa-García, O.; Pérez-Gutiérrez, E.; Cerón, M.; Maldonado, J.L.; Rivadeneyra, M.S.; Thamotharan, S. Optoelectronic properties of (Z)-3-(4-(4,5-diphenyl-1H-imidazole-2-yl)phenyl)-2-phenylacrylonitrile films under acid and thermal environments for tuning OLED emission. Dye. Pigments 2021, 187, 109115. [Google Scholar] [CrossRef]
  2. Srujana, P.; Radhakrishnan, T.P. Extensively reversible thermal transformations of a bistable, fluorescence-switchable molecular solid: Entry into functional molecular phase-change materials. Angew. Chem. Int. Ed. 2015, 54, 7270–7274. [Google Scholar] [CrossRef]
  3. Varghese, S.; Das, S. Role of molecular packing in determining solid-state optical properties of π-conjugated materials. J. Phys. Chem. Lett. 2011, 2, 863–873. [Google Scholar] [CrossRef]
  4. Venkatesan, P.; Cerón, M.; Pérez-Gutiérrez, E.; Castillo, A.E.; Thamotharan, S.; Robles, F.; Siegler, M.A.; Percino, M.J. Experimental and theoretical insights into the optical properties and intermolecular interactions in push-pull bromide salts. ChemistryOpen 2019, 8, 483–496. [Google Scholar] [CrossRef] [PubMed]
  5. Anthony, S.P. Organic solid-state fluorescence: Strategies for generating switchable and tunable fluorescent materials. ChemPlusChem 2012, 77, 518–531. [Google Scholar] [CrossRef]
  6. Anandhan, K.; Cerón, M.; Ceballos, P.; Ramos-Hernández, R.; Perumal, V.; Pérez-Gutiérrez, E.; Sosa-Rivadeneyra, M.; Thamotharan, S.; Percino, M.J. 1H-NMR, photophysical, and pH studies of 4-(4,5-diphenyl-1H-imidazol-2-yl)benzaldehyde through experimental and DFT theoretical analysis. ChemistrySelect 2020, 5, 415–425. [Google Scholar] [CrossRef]
  7. Christie, R.M. Colour Chemistry, 2nd ed.; Royal Society of Chemistry: Cambridge, UK, 2015. [Google Scholar]
  8. Mohammadi, A.; Khalili, B.; Haghayegh, A.S. A novel chromone based colorimetric sensor for highly selective detection of copper ions: Synthesis, optical properties and DFT calculations. Spectrochim. Acta A Mol. Biomol. Spectrosc. 2019, 222, 117193. [Google Scholar] [CrossRef]
  9. Shinde, S.; Sekar, N. Synthesis, spectroscopic characteristics, dyeing performance and TD-DFT study of quinolone based red emitting acid azo dyes. Dye. Pigments 2019, 168, 12–27. [Google Scholar] [CrossRef]
  10. Chairunisa, W.; Imawan, C. The effect of pH on the characteristics of the methyl red solution as a gamma-ray dosimeter. J. Phys. Conf. Ser. 2019, 1321, 022015. [Google Scholar] [CrossRef]
  11. Hamada, T.; Le, T.; Voegtle, M.J.; Doyle, B.; Rimby, J.; Isovitsch, R. Synthesis, photophysical and computational studies of two lophine derivatives with electron-rich substituents in the 2-position. J. Mol. Struct. 2017, 1130, 284–290. [Google Scholar] [CrossRef]
  12. Jayabharathi, J.; Thanikachalam, V.; Srinivasan, N.; Perumal, M.V. Fluorescence spectral studies of some imidazole derivatives. Spectrochim. Acta A Mol. Biomol. Spectrosc. 2012, 90, 125–130. [Google Scholar] [CrossRef]
  13. Jayabharathi, J.; Thanikachalam, V.; Srinivasan, N.; Perumal, M.V.; Jayamoorthy, K. Physicochemical studies of molecular hyperpolarizability of imidazole derivatives. Spectrochim. Acta A Mol. Biomol. Spectrosc. 2011, 79, 137–147. [Google Scholar] [CrossRef] [PubMed]
  14. Nourmohammadian, F.; Davoodzadeh, M.; Alizadeh, A.-A. New cyclopentadiene derivatives as novel pH indicators. Dye. Pigments 2007, 74, 741–743. [Google Scholar] [CrossRef]
  15. Kim, H.; Lim, H.K.; Cho, S.; Kim, H.J. An anthracene appended guanidine derivative as water soluble fluorescence sensor for high pH values and water content measurements. J. Photochem. Photobiol. A Chem. 2019, 383, 112023. [Google Scholar] [CrossRef]
  16. Kundu, A.; Karthikeyan, S.; Sagara, Y.; Moon, D.; Anthony, S.P. Unusual fluorescent photoswitching of imidazole derivatives: The role of molecular conformation and twist angle controlled organic solid state fluorescence. Phys. Chem. Chem. Phys. 2018, 20, 27385–27393. [Google Scholar] [CrossRef]
  17. Wiethaus, G.; Toldo, J.M.; da Silveira Santos, F.; da Costa Duarte, R.; Gonçalves, P.F.B.; Rodembusch, F.S. Experimental and theoretical investigation of long-wavelength fluorescence emission in push–pull benzazoles: Intra-molecular proton transfer or charge transfer in the excited state? Phys. Chem. Chem. Phys. 2019, 21, 4408–4420. [Google Scholar] [CrossRef]
  18. Cottman, E.W.; Moffett, R.B.; Moffett, S.M. The preparation and properties of chemiluminescent compounds of the lophine type. Proc. Indiana Acad. Sci. 1937, 47, 124–129. [Google Scholar]
  19. Hayashi, T.; Maeda, K. Mechanism of chemiluminescence of 2,4,5-triphenylimidazole. Bull. Chem. Soc. Jpn. 1962, 35, 2057–2058. [Google Scholar] [CrossRef]
  20. Hariharasubramanian, A.; Ravichandran, Y.D. Synthesis and studies of electrochemical properties of lophine derivatives. RSC Adv. 2014, 4, 54740–54746. [Google Scholar] [CrossRef]
  21. Liu, H.; Bai, Q.; Yao, L.; Zhang, H.; Xu, H.; Zhang, S.; Li, W.; Gao, Y.; Li, J.; Lu, P.; et al. Highly efficient near ultraviolet organic light-emitting diode based on a meta-linked donor–acceptor molecule. Chem. Sci. 2015, 6, 3797–3804. [Google Scholar] [CrossRef]
  22. Anandhan, K.; Cerón, M.; Perumal, V.; Ceballos, P.; Gordillo-Guerra, P.; Pérez-Gutiérrez, E.; Castillo, A.E.; Thamotharan, S.; Percino, M.J. Solvatochromism and pH effect on the emission of a triphenylimidazole-phenylacrylonitrile derivative: Experimental and DFT studies. RSC Adv. 2019, 9, 12085–12096. [Google Scholar] [CrossRef]
  23. Kulhánek, J.; Bureš, F. Imidazole as a parent π-conjugated backbone in charge-transfer chromophores. Beilstein J. Org. Chem. 2012, 8, 25–49. [Google Scholar] [CrossRef]
  24. White, E.H.; Harding, M.J.C. The chemiluminescence of lophine and its derivatives. J. Am. Chem. Soc. 1964, 86, 5686–5687. [Google Scholar] [CrossRef]
  25. Marino, D.F.; Ingle, J.D. Determination of chromium(VI) in water by lophine chemiluminescence. Anal. Chem. 1981, 53, 294–298. [Google Scholar] [CrossRef]
  26. White, D.M.; Sonnenberg, J. Oxidation of triarylimidazoles. Structures of the photochromic and piezochromic dimers of triarylimidazyl radicals. J. Am. Chem. Soc. 1966, 88, 3825–3829. [Google Scholar] [CrossRef]
  27. Camas-Anzueto, J.L.; Gómez-Valdéz, J.A.; Meza-Gordillo, R.; Pérez-Patricio, M.; Hernández de León, H.R.; León-Orozco, V. Sensitive layer based on lophine and calcium hydroxide for detection of dissolved oxygen in water. Measurement 2015, 68, 280–285. [Google Scholar] [CrossRef]
  28. Singh, A.K.; Zhu, Y.; Han, M.; Huang, H. Simultaneous load and temperature measurement using lophine-coated fiber Bragg gratings. Smart Mater. Struct. 2016, 25, 115019. [Google Scholar] [CrossRef]
  29. Fernández-Valdivielso, C.; Matías, I.R.; Arregui, F.J. Simultaneous measurement of strain and temperature using a fiber Bragg grating and a thermochromic material. Sens. Actuators A Phys. 2002, 101, 107–116. [Google Scholar] [CrossRef]
  30. Camas-Anzueto, J.L.; Aguilar-Castillejos, A.E.; Castañón-González, J.H.; Lujpán-Hidalgo, M.C.; Hernández de León, H.R.; Mota Grajales, R. Fiber sensor based on lophine sensitive layer for nitrate detection in drinking water. Opt. Lasers Eng. 2014, 60, 38–43. [Google Scholar] [CrossRef]
  31. Desai, S.; Bhoraniya, R.; Koladiya, M.; Bhopekar, V.; Patel, C.; Mori, T.; Modha, S. Solvatochromism and Halochromism in Nitro Lophine Derivatives: Photophysical Study, Computational Calculations and Applications as pH Sensing Material. J. Photochem. Photobiol. A Chem. 2024, 441, 115751. [Google Scholar] [CrossRef]
  32. Velasco-Bolom, P.M.; Ruiz-Pérez, V.I.; Pérez-Patricio, M.; Hernández-Gutiérrez, C.A.; Camas-Anzueto, J.L. Enhancement of the dynamic range of the measurement of pH using a sensitive layer of methyl red-lophine. Opt. Contin. 2025, 4, 939. [Google Scholar] [CrossRef]
  33. Zhang, Z.; Zhang, H.; Hou, L.; Jia, D.; Yao, K.; Meng, Q.; Qu, J.; Yan, B.; Luan, Q.; Liu, T. Highly sensitive fiber-optic chemical pH sensor based on surface modification of optical fiber with ZnCdSe/ZnS quantum dots. Anal. Chim. Acta 2024, 1294, 342281. [Google Scholar] [CrossRef] [PubMed]
  34. Chauhan, M.; Singh, V.K. PANI-ZnO clad modified multimode optical fiber pH sensor based on EWA. Curr. Appl. Phys. 2023, 50, 38–45. [Google Scholar] [CrossRef]
  35. Khanikar, T.; Singh, V.K. PANI-PVA composite film coated optical fiber probe as a stable and highly sensitive pH sensor. Opt. Mater. 2019, 88, 244–251. [Google Scholar] [CrossRef]
  36. Lu, F.; Wright, R.; Lu, P.; Cvetic, P.C.; Ohodnicki, P.R. Distributed fiber optic pH sensors using sol-gel silica based sensitive materials. Sens. Actuators B Chem. 2021, 340, 129853. [Google Scholar] [CrossRef]
Figure 1. Photograph of the surface of the SLL with 20 mg of Lophine: (a) 4×, the region magnified with the 10× objective is outlined with a white dashed box and the yellow box indicates the area observed at the highest magnification using a 40× objective, (b) 10×, the white box indicates the area observed at the highest magnification using a 40× objective, (c) 40×, (d) 40×.
Optics 06 00058 g001
Figure 2. (a) Micro-ramifications of lophine crystals adhered to the optical fiber, (b) Dimensions of the element sensitive.
Optics 06 00058 g002
Figure 3. Experimental arrangement for the characterization of lophine films on slides.
Optics 06 00058 g003
Figure 4. Absorbance spectrum for different amounts of lophine in the mixture: (a) 10 mg, (b) 20 mg, (c) 30 mg, (d) 40 mg, and (e) 50 mg for measurement of different pH values.
Optics 06 00058 g004
Figure 5. Intensity peaks of the absorbance of lophine subjected to different pH values, from the spectroscopic characterization at the wavelength of 500 nm.
Optics 06 00058 g005
Figure 6. Experimental arrangement for fiber optic sensor pH measurements.
Optics 06 00058 g006
Figure 7. Change in relative optical power depending on the measured pH values.
Optics 06 00058 g007
Figure 8. (a) Repeatability, (b) sensitivity of the fiber optic sensor.
Optics 06 00058 g008
Figure 9. (a) Hysteresis and (b) stability of the fiber optic sensor.
Optics 06 00058 g009
Figure 10. Characterization of the sensor’s response and recovery time.
Optics 06 00058 g010
Figure 11. The proposed scheme of the molecular structure of lophine around the rings at different pH values. (a) Lophine exhibits an extended π -conjugated system through its three phenyl groups, (b) Lophine undergoes protonation at its most basic nitrogen atom, and (c) the proton of the imidazole ring can be abstracted, generating an anionic species.
Optics 06 00058 g011
Table 1. Comparison of reported works and the one exposed in this proposal.
Sensitive MaterialFiber TypeSensitivityWork RangeResponsive TimeReference
Carboxyl ZnCdSe/ZnS quantum dotsTapered optical fiber0.139/pH6.0–9.0140 s[33]
PANI-ZnOEvanescent wave2.46 µW/pH2.0–10.0 [34]
PANI/PVACladding modification2.79 µW/pH2.0–9.08–12 s for 2–4 pH value
18–22 s for 4–9 pH value
[35]
Au-SiO2Evanescent wave with No core fiber19.9 T %/pH8.0–12.010 s[36]
LophineEvanescent wave63.84 µW/pH5.0–11.35 sThis work
Disclaimer/Publisher’s Note: The statements, opinions and data contained in all publications are solely those of the individual author(s) and contributor(s) and not of MDPI and/or the editor(s). MDPI and/or the editor(s) disclaim responsibility for any injury to people or property resulting from any ideas, methods, instructions or products referred to in the content.