Abstract
This work focuses on the characterization of the complex dielectric function of a polymer material, which is UV-cured dielectric ink 1092, used in the DragonFly IV 3D inkjet printer. Infrared spectroscopic ellipsometry was performed over the spectral range of 300–4000 cm−1 at multiple angles of incidence to extract both real and imaginary components of the dielectric response. In addition, polarized transmission measurements were taken over the spectral range from 300–6000 cm−1 to aid in characterization. We report an isotropic dielectric function model that is composed of oscillators with both Gaussian and Lorentzian broadening. This model reveals strong absorption bands at 925–1500 cm−1, 1600–1775, and 2840–3000 cm−1 while otherwise appearing largely transparent. This parameterized dielectric function is critical in first-principles modeling of infrared optical components and metamaterials fabricated using this polymer.
1. Introduction
Three-dimensional printed dielectric materials are increasingly important in emerging photonic and electronic applications, where tailored geometries and materials enable device miniaturization and rapid prototyping. Among these technologies, Nano Dimension’s (Waltham, MA, USA) DragonFly ™ system offers unique capabilities for multi-material additive manufacturing, allowing the simultaneous printing of conductive and dielectric inks with micron-scale resolution. While this platform has been widely adopted for RF and microwave devices, such as antennas [1], frequency-selective surfaces [2], and printed circuit boards (PCBs) [3], its potential in the infrared (IR) spectral domain remains largely unexplored.
The DragonFly IV system operates via the inkjet deposition of conductive and dielectric inks. Each material is dispensed through micron-scale nozzles as droplets, which are then cured layer-by-layer. The dielectric ink is ultraviolet (UV) cured, while the conductive ink, typically silver nanoparticle-based, is thermally sintered to increase electrical conductivity. For the dielectric ink, the system achieves a minimum lateral resolution of approximately 18 µm and a minimum layer thickness of around 10 µm; for the conductive ink, the reported thickness is approximately 1.18 µm [4]. This range of spatial resolutions could enable the fabrication of micron-scale dielectric structures suitable for IR applications. Accurate knowledge of the dielectric function in the IR is therefore essential for the design and simulation of such devices.
For context, other additive manufacturing (AM) techniques bound the DragonFly system in terms of resolution. Single-photon stereolithography (SLA) uses UV exposure of a photoresist in sequential two-dimensional layers to build three-dimensional structures. This exposure can be achieved using either masked illumination or direct laser writing. Commercial SLA printers, such as those from Formlabs and Anycubic, typically produce features (voxels) in the range of 25–100 µm [5], and have been used to fabricate THz optical components [6,7,8]. Two-photon stereolithography, or two-photon polymerization (TPP), also relies on direct laser writing, but uses near-infrared light (≈780 nm for Nanoscribe systems) to achieve significantly smaller voxel sizes. Depending on the objective lens used, the Nanoscribe Photonic Professional GT can produce features as small as 595 nm laterally and 3313 nm axially with a 25×/0.8 NA objective, and 340 nm laterally and 826 nm axially with a 63×/1.4 NA objective. These high-resolution capabilities make TPP a powerful method for fabricating IR optical and photonic structures [9,10,11].
With the advent of new AM techniques, polymers have been developed that are specifically compatible with each process. These materials have been shown to exhibit distinct optical properties depending on the fabrication method. For example, polymers used in two-photon polymerization, such as Nanoscribe IP-Dip and IP-L, display different infrared dielectric responses compared to polymers used in stereolithography, such as polymethacrylates [12,13]. Such variations in optical properties across the infrared range can lead to significant differences in optical performance. Therefore, for accurate modeling and design of optical components fabricated using different AM techniques, the dielectric properties of each polymer must be experimentally characterized and incorporated into device simulations.
In this work, we report the infrared dielectric function of the DragonFly polymerized dielectric resin, dielectric ink 1092, obtained through modeling of spectroscopic ellipsometry and polarized normal-incidence transmission measurements. The broadband, complex dielectric function presented here provides critical and accurate material properties for reliable first-principles modeling and simulation of 3D-printed optical structures operating in the IR spectral range. Additionally, the index of refraction and absorption coefficient of dielectric ink 1092 is compared to polymerized resins Nanoscribe “IP-dip” and FormLabs “black”, which have been used for similar applications [12,13].
2. Materials and Methods
Standard deposition parameters were used throughout the deposition process to ensure reproducibility. The build plate moves with a velocity of 100 mm/s and is accelerated at a rate of 1000 . The print head is moving orthogonally to the build plate with a velocity of 35 mm/s and is accelerated at a rate of 900 . The ink-jet-deposited monomer is polymerized using a UV curing head (ProPhotonic COBRA Cure FX, ProPhotonix, Boston, MA, USA) integrated into the Dragonfly IV deposition system. Two samples were fabricated using these standard deposition parameters; one with a thickness of 900 µm and another with a thickness 210 µm.
Ellipsometric measurements of the ellipsometric angles and were performed over the spectral range 300–4000 using a commercial infrared ellipsometer (IR-VASE Mark I, J.A. Woollam Co., Lincoln, NE, USA) [14]. The ellipsometric angles for isotropic materials are defined as the ratio of the complex Fresnel reflection coefficients and for light polarized parallel and perpendicular to the plane of incidence, respectively, as
A bulk sample of DragonFly polymer with a thickness of 900 µm was measured at angles of incidence of 70° and 75°. Additionally, polarized normal-incidence transmission measurements were performed in the spectral range 300–6000 on a sample with a thickness of 210 µm. These polarized transmission measurements include isotropic, and , and anisotropic, and , transmission components. Here, T denotes the transmission coefficient, with the first subscript indicating the polarization state of incident light and the second subscript indicating the detected polarization state. For reflection ellipsometry measurements, a thicker substrate was used to suppress backside reflections within the polymer from reaching the detection arm of the ellipsometer. In contrast, a thinner substrate was employed for transmission measurements to enhance the visibility of weaker absorption features. These transmission spectra were used to complement the ellipsometric data and aid in constraining the dielectric function over a broad spectral range.
The optical modeling was performed using a commercial ellipsometry analysis package (WVASE32™, J.A. Woollam Co., Lincoln, NE, USA) to extract the best model fit complex dielectric function from the measured and transmission spectra. The pseudo-dielectric functions obtained at the measured angles showed excellent overlap, indicating that the ellipsometric data were not affected by backside reflections or birefringence. Polarized transmission measurements show zero values for anisotropic transmission measurements and , again indicating that the polymer is not birefringent. Therefore, the sample was modeled as a semi-infinite isotropic substrate for the reflection ellipsometry model. The complex model dielectric function was used simultaneously to analyze the polarized normal-incidence transmission measurements.
The complex dielectric function can be modeled using a combination of oscillators with Lorentz and Gaussian broadening [15]. Here, the complex dielectric function was modeled using a high-frequency dielectric constant, a low-energy pole, and a sum of parameterized oscillators with Lorentzian [16] and Gaussian [17,18] broadening. The total dielectric function is given by
where is the high-frequency dielectric constant and the second term is a low-energy pole with amplitude A and resonant frequency . The third and fourth terms are the sum of the complex permittivity for oscillators with Lorentz and Gaussian broadening, respectively. The complex permittivity of each oscillator is parameterized by the amplitude A, the broadening , and the resonant frequency .
The expressions for the Lorentz oscillator and the imaginary part of the Gaussian oscillator are as follows:
where ensures the full-width at half maximum is represented by .
The real part of the dielectric function for the Gaussian oscillator, , was obtained from using the Kramers–Kronig transformation [19].
The parameterized model dielectric functions are fitted to experimental data across the entire spectral range using stratified optical layer calculations. This approach directly links the measured spectra to physically meaningful quantities such as oscillator frequencies, amplitudes, and broadenings. The adjustable model parameters are refined until the calculated and measured data achieve the best possible agreement. The Levenberg–Marquardt algorithm was used to minimize the weighted mean squared error function, , which includes the ellipsometric angles , and the transmission coefficients and [20]:
where S is the total number of measured data points and K is the number of varied model parameters. The superscript C denotes calculated values, and represents the corresponding experimental uncertainties [21,22]. This allows simultaneous fitting of ellipsometric and transmission data, ensuring that the extracted dielectric function accurately represents both reflective and transmissive optical responses.
3. Results
Figure 1 shows the experimental (, ) spectra (dashed green lines) and the calculated best-fit model (solid red lines) for an angle of incidence of 75°. Please note that only the data obtained at an incidence angle of 75° are shown for brevity. The experimental data are well reproduced by the best model calculated data for all angles measured. The strongest bands occur in the ranges 925–1500 (10.81–6.67 µm), 1600–1775 (6.25–5.63 µm), and 2840–3000 (3.52–3.33 µm) indicated in Figure 1. Outside of these regions, the polymer appears to be largely transparent.
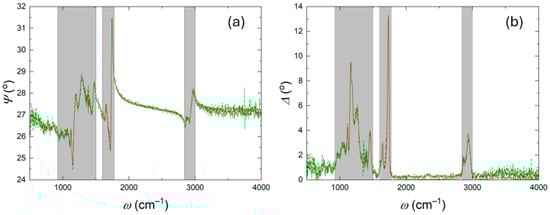
Figure 1.
The measured (dashed green) and best model calculated (solid red) ellipsometric parameters and for an angle of incidence of 75° are depicted in panels (a) and (b), respectively. The ellipsometric data show the largest changes over the spectral ranges of 925–1500 , 1600–1775 , and 2840–3000 , which are the regions of the highest absorption. These regions are shaded in gray.
Figure 2 presents the polarized normal-incidence transmission measurement (dashed green line) alongside the calculated best-fit model (solid red line). Only is shown here for clarity since and show excellent overlap. The strong absorption bands observed in and remain visible here, although their subtle features are unresolved. In addition, weaker absorption features are observed across the transmission spectrum. In the range 300–925 (33.33–10.81 µm), the transmission peaks approximately at 18%. Between 1500–1600 (6.67–6.25 µm), the maximum transmission is around 8%. From 1775–2550 (5.63–3.92 µm), the transmission is approximately 50%, decreasing toward the strong absorption band at 2840 (3.52 µm). A transmissive band with a peak of approximately 38% is present from 3000–3350 (3.33–2.99 µm) and is followed by a weaker absorption band from 3350–3650 (2.99–2.74 µm). This is followed by a transmissive region peaking at 68% near 3750 (2.67 µm) and falling to about 50% at 4300 (2.33 µm). The transmission then rises to approximately 80% for the remainder of the spectrum, up to 6000 (1.67 µm).
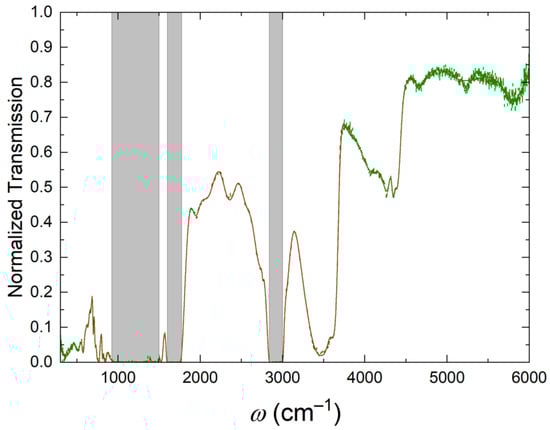
Figure 2.
The measured (dashed green) and modeled (solid red) polarized normal-incidence transmission. The transmission data also shows the major absorptions seen in the ellipsometric data without revealing subtle absorption features. These spectral regions, shown in gray shading, are 925–1500 , 1600–1775 , and 2840–3000 . The transmission data also shows smaller absorptions outside of these regions that the ellipsometric measurements obtained in reflection does not capture.
Figure 3 shows the parameterized best-model complex dielectric function, and . The parameterized dielectric function model successfully captures all of the aforementioned absorption features, including the subtle features observed in reflection ellipsometry and the weaker absorptions revealed by polarized transmission. Together, these results describe the infrared dielectric response of the DragonFly™ polymer ink 1092. Appendix A includes a table containing parameters for the oscillators used in this dielectric function model.
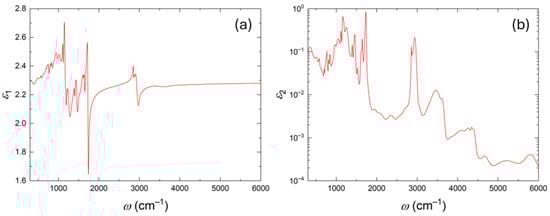
Figure 3.
The parameterized best-model complex dielectric function over a spectral range of 550–6000 which captures the dielectric response of the Dragonfly polymer ink 1092. (a) shows the real part of the complex dielectric function that is dominated by the strongest absorption features. (b) shows the imaginary part of the complex dielectric function . Note: is depicted on a logarithmic scale to reveal the subtle absorption features observed in the IR transmission measurements.
4. Discussion
With the increasing diversity of AM techniques, polymers developed for different processes exhibit distinct optical behaviors that must be considered for device design. Figure 4 compares the index of refraction and absorption coefficient of the polymerized DragonFly dielectric ink 1092 (red lines) with those of polymers commonly used in other AM systems, namely IP-Dip for two-photon polymerization (blue lines) and a FormLabs polymethacrylate based resin for stereolithography (dark gray lines). Figure 4a,b show the refractive index comparison with IP-Dip and the FormLabs resin, respectively, while Figure 4c,d display the corresponding absorption coefficient spectra.
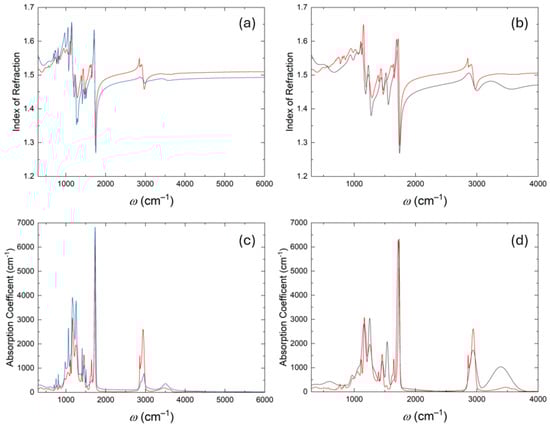
Figure 4.
A comparison of the refractive index and absorption coefficient of the polymerized DragonFly dielectric ink 1092 (red solid lines) with polymers from different additive manufacturing systems. (a,c) show comparisons with IP-Dip used in two-photon polymerization (blue solid lines). (b,d) show comparisons with the FormLabs polymerized black resin used in stereolithography (dark gray solid lines). Panels (a,b) display the refractive index. Panels (c,d) show the absorption coefficient.
The main absorption bands for all polymers occur near 925–1500 , 1600–1775 , and 2840–3000 . Although the absorption features are broadly similar among the three polymers, differences in band shape and strength lead to a noticeable offset in the refractive index in the transparent regions. These variations illustrate how small changes in the absorption behavior can significantly affect the real part of the optical response, which reflects intrinsic differences in the optical characteristics of polymers produced by different AM techniques.
5. Summary and Conclusions
In this work, we have modeled the complex dielectric function of the Dragonfly polymer in the IR spectral region from 300 to 6000 . The mixed oscillator model, which is composed of oscillators with Gaussian and Lorentzian broadening, accurately replicates the dielectric response over this spectral region. The combination of reflection ellipsometry and polarized normal-incidence transmission measurements revealed the complex vibrational behavior of this polymer. The parameterized dielectric function model allows for first-principles calculations of structures and optical components operating at wavelengths in the MWIR (3–5 µm) and LWIR (8–12 µm). Additional comparisons with polymers used in other additive manufacturing systems further demonstrate that, although the primary infrared absorption bands occur at similar spectral positions, small differences in their magnitude and shape lead to measurable offsets in the refractive index. These results highlight that polymers developed for different fabrication techniques can exhibit distinct optical responses, emphasizing the importance of experimentally characterizing each material for accurate optical modeling and design.
Author Contributions
Conceptualization, D.L., J.F.F., B.T., I.G. and T.H.; methodology, D.L., T.H. and G.D.B.; formal analysis, D.L., N.Z.S., J.E. and T.H.; sample preparation, S.I.G.; investigation, D.L. and J.E.; resources, G.D.B. and S.I.G.; writing—original draft preparation, D.L. and T.H.; writing—review and editing, D.L., N.Z.S., S.I.G., J.F.F., B.T., I.G., G.D.B. and T.H.; visualization, D.L. and T.H.; supervision, G.D.B. and T.H.; project administration, T.H. and G.D.B.; funding acquisition, T.H. and G.D.B. All authors have read and agreed to the published version of this manuscript.
Funding
The authors acknowledge the support from the National Science Foundation within the IUCRC Center for Metamaterials (2052745).
Data Availability Statement
The data underlying the results presented in this paper are not publicly available at this time but may be obtained from the authors upon reasonable request.
Acknowledgments
The authors would like to acknowledge the support from the Department of Physics and Optical Science of North Carolina at Charlotte, the Department of Physics at the New Jersey Institute of Technology, and the COMET initiative of the New Jersey Innovation Institute. We further acknowledge support from the Center for Optoelectronics and Optical Communications, the Division of Research, and the Klein College of Science at UNC Charlotte. We would also like to acknowledge Jayden Johnson at New Jersey Innovation Institute for his kind assistance with sample preparation.
Conflicts of Interest
The authors declare no conflicts of interest.
Appendix A
Table A1 lists the fitted oscillators used to construct the dielectric function for first-principles calculations. The columns are: Type (L/G), Amplitude (unitless), resonance frequency , and broadening . Entries are ordered by from low to high. These parameters are given with center values and their 90 % confidence limits. In addition, the high-frequency dielectric constant and pole values are , , and . The resonant frequency for the pole does not show 90% confidence limits since this value was fixed for fitting.

Table A1.
Dielectric-function oscillators sorted by increasing . Uncertainties are 90% confidence limits.
Table A1.
Dielectric-function oscillators sorted by increasing . Uncertainties are 90% confidence limits.
| Type | Amp | ||
|---|---|---|---|
| 1G | 340.03 ± 11.96 | 0.10727 ± 0.02926 | 139.84 ± 53.14 |
| 2G | 504.48 ± 8.27 | 0.01237 ± 0.01138 | 47.92 ± 39.98 |
| 3G | 507.24 ± 62.51 | 0.06016 ± 0.01843 | 264.76 ± 66.26 |
| 4G | 576.11 ± 2.52 | 0.01811 ± 0.00551 | 21.19 ± 6.43 |
| 5G | 637.47 ± 2.88 | 0.00428 ± 0.00166 | 19.12 ± 8.42 |
| 6G | 666.73 ± 2.65 | 0.00325 ± 0.00131 | 17.57 ± 9.31 |
| 7G | 700.01 ± 0.58 | 0.01255 ± 0.00169 | 10.98 ± 1.71 |
| 8G | 723.15 ± 1.58 | 0.01285 ± 0.00293 | 16.36 ± 3.85 |
| 9L | 755.95 ± 2.80 | 0.05950 ± 0.01311 | 37.64 ± 6.36 |
| 10L | 768.82 ± 1.79 | 0.04285 ± 0.01662 | 8.90 ± 6.22 |
| 11L | 813.07 ± 1.16 | 0.03009 ± 0.00612 | 13.40 ± 2.06 |
| 12G | 842.58 ± 1.35 | 0.04969 ± 0.00708 | 27.03 ± 3.10 |
| 13G | 965.25 ± 2.50 | 0.06055 ± 0.00562 | 43.88 ± 5.39 |
| 14G | 1044.20 ± 2.48 | 0.08258 ± 0.00727 | 72.25 ± 8.15 |
| 15G | 1115.50 ± 0.48 | 0.15462 ± 0.00996 | 17.06 ± 1.39 |
| 16G | 1151.40 ± 4.64 | 0.13068 ± 0.00980 | 437.25 ± 10.92 |
| 17G | 1162.50 ± 0.50 | 0.44053 ± 0.02041 | 25.08 ± 1.29 |
| 18G | 1186.80 ± 1.09 | 0.31790 ± 0.01516 | 29.05 ± 2.68 |
| 19G | 1253.80 ± 0.88 | 0.23990 ± 0.00867 | 69.25 ± 2.93 |
| 20L | 1397.00 ± 2.50 | 0.08515 ± 0.02091 | 18.67 ± 7.08 |
| 21G | 1454.70 ± 0.45 | 0.21272 ± 0.00520 | 35.50 ± 1.04 |
| 22G | 1525.50 ± 0.93 | 0.01964 ± 0.00186 | 29.43 ± 1.84 |
| 23G | 1615.30 ± 1.54 | 0.07076 ± 0.00581 | 32.24 ± 1.83 |
| 24L | 1644.90 ± 0.61 | 0.17228 ± 0.00889 | 18.77 ± 1.86 |
| 25L | 1714.20 ± 0.64 | 0.25766 ± 0.01386 | 34.78 ± 1.28 |
| 26G | 1731.40 ± 0.17 | 0.71991 ± 0.00848 | 20.63 ± 0.36 |
| 27G | 1942.20 ± 0.47 | 0.00128 ± 0.00007 | 104.94 ± 2.78 |
| 28G | 2078.40 ± 1.41 | 0.00283 ± 0.00002 | 274.20 ± 8.67 |
| 29G | 2360.00 ± 1.08 | 0.00268 ± 0.00003 | 214.34 ± 5.03 |
| 30G | 2564.10 ± 2.75 | 0.00223 ± 0.00008 | 170.72 ± 6.97 |
| 31G | 2718.90 ± 1.54 | 0.00329 ± 0.00010 | 158.23 ± 5.93 |
| 32G | 2761.40 ± 0.72 | 0.00033 ± 0.00004 | 13.90 ± 1.89 |
| 33L | 2857.80 ± 0.86 | 0.09671 ± 0.01226 | 12.17 ± 1.89 |
| 34G | 2880.10 ± 3.11 | 0.06936 ± 0.00798 | 39.27 ± 2.50 |
| 35G | 2940.00 ± 0.97 | 0.20264 ± 0.00438 | 63.80 ± 0.95 |
| 36L | 3034.90 ± 2.70 | 0.00432 ± 0.00018 | 144.59 ± 9.52 |
| 37G | 3334.50 ± 39.65 | 0.00492 ± 0.00111 | 288.71 ± 42.77 |
| 38G | 3486.00 ± 5.64 | 0.00995 ± 0.00188 | 208.69 ± 12.58 |
| 39G | 3626.20 ± 0.97 | 0.00422 ± 0.00022 | 76.79 ± 2.66 |
| 40G | 3791.80 ± 7.81 | 0.00037 ± 0.00004 | 172.35 ± 20.42 |
| 41G | 4099.60 ± 4.97 | 0.00140 ± 0.00001 | 492.75 ± 17.76 |
| 42G | 4277.70 ± 3.46 | 0.00060 ± 0.00003 | 112.95 ± 8.51 |
| 43G | 4345.20 ± 2.05 | 0.00094 ± 0.00004 | 36.58 ± 5.89 |
| 44L | 4396.30 ± 2.98 | 0.00042 ± 0.00009 | 81.51 ± 6.45 |
| 45G | 4677.00 ± 8.34 | 0.00094 ± 0.00004 | 250.41 ± 41.13 |
| 46G | 5195.90 ± 26.78 | 0.00027 ± 0.00002 | 627.03 ± 102.16 |
| 47G | 5809.10 ± 17.77 | 0.00038 ± 0.00003 | 407.05 ± 80.25 |
References
- Marasco, I.; Niro, G.; Rizzi, F.; D’Orazio, A.; De Vittorio, M.; Grande, M. Dual-band Flexible Planar Inverted-F Antenna for Internet of Healthcare Things Applications. In Proceedings of the Microwave Mediterranean Symposium (MMS), Pizzo Calabro, Italy, 9–13 May 2022. [Google Scholar] [CrossRef]
- Lv, X.; Yang, Y.; Luo, Z.; Tyo, J.S. Multimaterial 3-D-Printed FSSs for Ultrawide and Dual Passbands in the K–Ka Spectra. IEEE Trans. Microw. Theory Tech. 2024, 73, 75–86. [Google Scholar] [CrossRef]
- Samaitis, V.; Merfeldas, A.; Jankauskas, A.; Raišutis, R.; Jasiūnienė, E. From Print to Performance: A Comparative Study of Conductive and Radiated Emissions in FR-4 PCB Technology Versus DragonFly IV Additively Manufactured Electronics. ACS Appl. Electron. Mater. 2025, 7, 1381–1391. [Google Scholar] [CrossRef]
- Nguyen, M.D.; Yin, Z.; Del Rey, R.; Iacopi, F.; Yang, Y. Additive Manufacturing Materials and Processes for Passive Electronics in Wireless Communication. IEEE Trans. Mater. Electron Devices 2024, 1, 97–105. [Google Scholar] [CrossRef]
- Berglund, G.; Wisniowiecki, A.; Gawedzinski, J.; Applegate, B.; Tkaczyk, T.S. Additive manufacturing for the development of optical/photonic systems and components. Optica 2022, 9, 623–638. [Google Scholar] [CrossRef]
- Park, S.; Li, Y.; Norton, B.; McLamb, M.; Boreman, G.D.; Hofmann, T. One-Dimensional Photonic Crystals Fabricated Using Stereolithographic Single Layer Assembly for the Terahertz Spectral Range. J. Infrared Millim. Terahertz Waves 2020, 41, 542–551. [Google Scholar] [CrossRef]
- Fullager, D.B.; Park, S.; Hovis, C.; Li, Y.; Reese, J.; Sharma, E.; Lee, S.; Evans, C.; Boreman, G.D.; Hofmann, T. Metalized Poly-Methacrylate Off-Axis Parabolic Mirrors for Terahertz Imaging Fabricated by Additive Manufacturing. J. Infrared Millim. Terahertz Waves 2019, 40, 269–275. [Google Scholar] [CrossRef]
- Park, S.; Li, Y.; Fullager, D.B.; Schön, J.; Hofmann, T. Terahertz-Frequency Dielectric Anisotropy in Three-Dimensional Polymethacrylates Fabricated by Stereolithography. Opt. Lett. 2020, 45, 1982–1985. [Google Scholar] [CrossRef] [PubMed]
- Stinson, V.P.; Shuchi, N.; Louisos, D.; McLamb, M.; Boreman, G.D.; Hofmann, T. One-Dimensional Photonic Crystals with Mechanical Defects Fabricated by Two-Photon Polymerization. In Proceedings of the SPIE’s Optical Manipulation and Structured Materials Conference, Yokohama, Japan, 17–21 April 2023; SPIE: Bellingham, WA, USA, 2023; Volume 12606, p. 1260615. [Google Scholar] [CrossRef]
- Stinson, V.P.; Subash, U.; Poutous, M.K.; Hofmann, T. Towards Two-Photon Polymerization-Compatible Diffractive Optics for Micro-Mechanical Applications. Micromachines 2023, 14, 1319. [Google Scholar] [CrossRef] [PubMed]
- Li, Y.; McLamb, M.; Hofmann, T. Theoretical Study of Enhanced Plasmonic–Photonic Hybrid Cavity Modes in Reciprocal Plasmonic Metasurfaces. Plasmonics 2021, 16, 2241–2247. [Google Scholar] [CrossRef]
- Fullager, D.B.; Boreman, G.D.; Hofmann, T. Infrared dielectric response of Nanoscribe IP-Dip and IP-L monomers after polymerization from 250 cm−1 to 6000 cm−1. Opt. Mater. Express 2017, 7, 888–894. [Google Scholar] [CrossRef]
- Park, S.; Li, Y.; Fullager, D.B.; Schöche, S.; Herzinger, C.M.; Boreman, G.D.; Hofmann, T. Terahertz to Mid-infrared Dielectric Properties of Polymethacrylates for Stereolithographic Single Layer Assembly. J. Infrared Millim. Terahertz Waves 2019, 40, 971–979. [Google Scholar] [CrossRef]
- Fujiwara, H. Spectroscopic Ellipsometry: Principles and Applications; John Wiley & Sons: Chichester, UK, 2007. [Google Scholar] [CrossRef]
- Synowicki, R.; Tiwald, T.E. Optical properties of bulk c-ZrO2, c-MgO and a-As2S3 determined by variable angle spectroscopic ellipsometry. Thin Solid Films 2004, 455, 248–255. [Google Scholar] [CrossRef]
- Tompkins, H.; Irene, E.A. Handbook of Ellipsometry; William Andrew: Norwich, NY, USA, 2005. [Google Scholar]
- Meneses, D.S.; Malki, M.; Echegut, P. Structure and Lattice Dynamics of Binary Lead Silicate Glasses Investigated by Infrared Spectroscopy. J. Non-Cryst. Solids 2006, 352, 769–776. [Google Scholar] [CrossRef]
- Meneses, D.S.; Gruener, G.; Malki, M.; Echegut, P. Causal Voigt Profile for Modeling Reflectivity Spectra of Glasses. J. Non-Cryst. Solids 2005, 351, 124–129. [Google Scholar] [CrossRef]
- Peiponen, K.-E.; Vartiainen, E.M. Kramers–Kronig Relations in Optical Data Inversion. Phys. Rev. B 1991, 44, 8301–8303. [Google Scholar] [CrossRef] [PubMed]
- Press, W.H.; Flannery, B.P.; Teukolsky, S.A.; Vetterling, W.T. Numerical Recipes: The Art of Scientific Computing; Cambridge University Press: Cambridge, UK, 1988. [Google Scholar]
- Herzinger, C.M.; Snyder, P.G.; Johs, B.; Woollam, J.A. Ellipsometric determination of optical constants for silicon and thermally grown silicon dioxide via a multi-sample, multi-wavelength, multi-angle investigation. J. Appl. Phys. 1995, 77, 1715–1724. [Google Scholar] [CrossRef]
- Jellison, G.E. Spectroscopic ellipsometry data analysis: Measurement and analysis of optical functions of amorphous materials. Thin Solid Films 1998, 313–314, 33–39. [Google Scholar] [CrossRef]
Disclaimer/Publisher’s Note: The statements, opinions and data contained in all publications are solely those of the individual author(s) and contributor(s) and not of MDPI and/or the editor(s). MDPI and/or the editor(s) disclaim responsibility for any injury to people or property resulting from any ideas, methods, instructions or products referred to in the content. |
© 2025 by the authors. Licensee MDPI, Basel, Switzerland. This article is an open access article distributed under the terms and conditions of the Creative Commons Attribution (CC BY) license (https://creativecommons.org/licenses/by/4.0/).