Article

Parametric Dependence of Thermal Field in Laser-Assisted Turning of GH 4169

1
Center for Precision Engineering, Harbin Institute of Technology, Harbin 150001, China
2
Shenyang Aircraft Industry (Group) Co., Ltd., Shenyang 110850, China
*
Authors to whom correspondence should be addressed.
Optics 2025, 6(3), 44; https://doi.org/10.3390/opt6030044
Submission received: 14 August 2025 / Revised: 7 September 2025 / Accepted: 12 September 2025 / Published: 19 September 2025

Abstract

While laser-assisted turning (LAT) improves the machinability of GH 4169 through heating-induced thermal softening, revealing the influence of the laser processing parameters on its thermal field and machining efficiency is crucial. In this study, the influence of different laser processing parameters on the thermal field during the preheating process of LAT is systematically investigated by combining finite element (FE) simulation and experimentation, from which the optimal processing parameters of the LAT of GH 4169 are obtained. Firstly, the experimental platform of LAT is established, and a 2D FE model of the LAT of GH 4169 is constructed. Secondly, the absorption coefficient of GH 4169 with a 1064 nm wavelength laser is calibrated through experimentation and FE simulation, which lay an accurate foundation for the subsequent thermal field analysis. Furthermore, the FE simulation of the preheating process of the LAT of GH 4169 is carried out, focusing on the influence of laser power, laser spot diameter, laser spot movement speed and laser spot–tool edge distance on the thermal field, in terms of the peak and final preheating temperatures. The results show that laser power, laser spot movement speed and laser spot diameter have a significant influence on both of the two temperatures, while laser spot–tool edge distance only affects the final preheating temperature. In addition, the regression equations of the peak and final preheating temperatures are obtained based on the FE simulation results, and the optimal processing parameters are determined by combining the boundary conditions (peak temperature of 650–950 °C and initial preheating temperature of ≤190 °C). Comparison experiments with conventional turning (CT) show that under the optimal processing parameters, LAT can effectively reduce the cutting force, surface roughness and tool flank wear, which indicates that a rational selection of laser processing parameters is crucial for improving the capability of LAT of GH 4169.

1. Introduction

GH 4169, also known as Inconel 718, is a nickel-based superalloy that features a matrix composed of high-temperature elements: cobalt, molybdenum and doped carbon, aluminum and iron [1,2,3]. It exhibits superior properties of yield strength, ultimate tensile strength, fatigue resistance and corrosion resistance, particularly at high operating temperatures, making it extensively utilized in sophisticated fields such as in gas turbines, rocket engines, and the structural components of spacecraft [4,5,6]. In these applications, GH 4169 must be meticulously machined into parts with specific structural configurations to fulfill their intended functions. However, the high hardness of GH 4169 presents significant challenges to traditional machining processes, leading to issues such as severe tool wear and low machined surface quality [7]. The importance of achieving a high surface quality in parts fabricated from GH 4169 must be underscored, as this is imperative not only for mitigating stress concentration, but also for maximizing the fatigue strength and corrosion resistance of the parts when subjected to extreme operating conditions, such as high temperature and pressure. Moreover, superior surface quality contributes to a reduction in frictional losses during interaction with other mating parts, thereby enhancing the operational reliability and extending the service life of the entire assembly [8,9,10].
In the realm of strategies that have been investigated to enhance the efficacy of CT processes, several approaches have demonstrated potential for improving turning performance, including ultrasonic-vibration-assisted technology [11], magnetic assistance technology [12] and micro-lubrication-assisted technology [13], as well as laser-assisted heating technology [6]. In particular, laser-assisted machining (LAM) stands out as a sustainable and eco-friendly technology, primarily due to its advantage of eliminating the need for cutting fluids [14,15]. Additionally, it significantly reduces energy consumption during cutting and minimizes tool wear [16,17,18].
LAM reduces the hardness and strength of heated materials by locally preheating and softening the workpiece material, thereby providing cutting assistance. Therefore, it is crucial to control the softening efficacy of laser local preheating on materials to ensure the machining efficacy of LAM. Wang et al. [19] performed both LAT and CT experiments on Si3N4 ceramic, complemented by numerical modeling and thermal field simulations. By manipulating the peak temperature during the laser preheating phase, they successfully reduced cutting force and machining defects, thereby enhancing the surface integrity of the workpiece. Wiedenmann et al. [20] conducted thermo-mechanical FE simulations on the laser-assisted milling of sophisticated materials to investigate the influence of various material parameters on the thermal field. Through these simulations, they optimized both the laser and milling processing parameters to attain a manageable thermal field during the machining process. This optimization improved material machinability, reduced tool wear and increased material removability. Zhai et al. [21] investigated the variation in laser power, laser spot diameter and laser spot movement speed on the thermal field using a combination of experimental and simulation methods. Their findings revealed that both the physical attributes of the material and the laser processing parameters collectively influenced the distribution of the thermal field. Arrizubieta et al. [22] constructed a 3D numerical model of the LAT of 42CrMo4 steel coated with WC-17Co, which was utilized to predict the peak temperature encountered during the machining process, thereby providing a valuable method for assessing the state of the thermal field in LAT under various processing conditions. Feng et al. [23] investigated the impact of preheating temperature on tool wear by adjusting the laser power and laser spot–tool edge distance, through which they developed an analytical predictive model specifically for flank wear in laser-assisted milling processes.
While the challenge of GH 4169 machining stems from its high strength, the laser-induced local heating and softening of the material substantially diminishes the yield strength of GH 4169 in LAM, thereby reducing the difficulty of machining processes. Zhao et al. [24] employed laser preheating technology on Inconel 718 accompanied by integrating it with a fast tool-stopping device to achieve complete chips. They analyzed the thermal field distribution during laser irradiation and the process of orthogonal cutting chip formation via FE simulation. The findings indicated that with a laser power of 70 W and cutting speed ranging from 100 to 400 mm/s, the quality of cutting was significantly improved, and tool wear was substantially reduced. Wu et al. [25] employed a temperature feedback control method to adjust the laser power, ensuring a constant peak temperature of the material during the laser preheating of Inconel 718, thereby facilitating a stable LAM process. Lu et al. [26] constructed a 3D simulation model through Abaqus to simulate and analyze the process of laser-assisted micro-milling of Inconel 718 and found that with a laser power of 25 W and a laser spot diameter of 200 μm, the temperature of the material during cutting was ideal, and the cutting force and surface roughness were significantly improved. Kong et al. [27] conducted a study on the LAT process of GH 4169, taking into account factors such as heat dissipation rate, preheating thermal field, and the coupling effect of cutting force. They analyzed both the laser preheating and material cooling processes to examine their effect on residual stress evolution in the processing surface, and found that a faster cooling rate of the surface resulted in significant residual tensile stresses.
In the LAM process, the preheating process consists of a laser heating phase and a subsequent material cooling phase. During the preheating process, there is a peak temperature and a final preheating temperature for the material. An excessive peak temperature leads to material ablation, which alters the material properties and may cause micro-cracks to develop within the material. The final preheating temperature of the material affects the softening effect within the cutting zone. A high final preheating temperature can cause excessive material mobility, leading to the formation of plow furrow structures on the machining surface, which negatively affects surface roughness. Therefore, the peak and final preheating temperatures in the LAT process must be effectively controlled to ensure significant reduction in surface roughness and cutting force.
Currently, the thermal field in LAM of GH 4169, particularly the regulation of the peak and final preheating temperatures, is still insufficient. On the one hand, previous studies mainly focused on single-temperature indicators, such as analyzing only the impact of peak temperature on material phase transformation or solely exploring the effect of final preheating temperature on cutting force, failing to reveal the comprehensive influence of the dynamic preheating temperature variation process on the machining quality. On the other hand, most previous studies derived their final processing parameter schemes by analyzing variations in machined surface roughness and tool wear under different conditions. A quantitative mapping relationship between the peak and final preheating temperatures and laser processing parameters has yet to be established, which hinders the precise control of preheating temperatures through parameter optimization, thereby limiting the full realization of the advantages of LAT. To this end, this study employs FE simulations to establish the thermal field of the local heating process in the LAT of GH 4169. The study focuses on the influence of key laser processing parameters on peak and final preheating temperatures during laser preheating of materials, including laser power, laser spot diameter, laser spot movement speed and the laser spot–tool edge distance. The emphasis of the current study is on the dynamic response characteristics of the peak and final preheating temperatures during the preheating process. Based on simulation data, this study establishes regression equations for the peak and final preheating temperatures, incorporating the aforementioned parameters. Coupled with the heating temperature boundary conditions in LAT, the study derives an optimization scheme for processing parameters, taking into account the peak and final preheating temperatures. In order to verify the effectiveness of the scheme, comparative experiments between CT and LAT are carried out based on the optimized processing parameters, so as to further clarify the effect of temperature regulation and the enhancement of machining performance by LAT through the optimized processing parameters.

2. Methodology

2.1. Experimental Setup of LAT of GH 4169

In this study, cylindrical workpieces made of GH 4169 from Shenzhen Baishun Metal Materials Company, Shenzhen, China, with a diameter of 25 mm and a thickness of 9 mm are roughly machined by in situ cutting prior to cutting experiments to prevent surface unevenness affecting the experimental results.
Figure 1 shows the LAT experimental setup, which is built according to the experimental requirements. This setup includes a four-axis machine, a laser preheating system and a cutting force measurement system. The four-axis machine includes a rotary spindle (C-axis), horizontally oriented X- and Y-axes, a workpiece fixture and a cutting tool. The cutting experiments are conducted with a commercial polycrystalline diamond (PCD) tool, model DCMT-070204 from CWB Jingwei CNC Tooling Company, Taizhou, China, which possesses the following tool parameters: nose radius of 0.4 mm, tool rake angle of 0° and tool clearance angle of 7°. The laser preheating system employs a continuous fiber laser with a 1064 nm wavelength; the detailed product specifications are listed in Table 1. It is equipped with a focusing lens with a focal length of 150 mm, which allows for the adjustment of the laser spot diameter through defocusing. The laser preheating system also contains a micro-motion stage assembly equipped with three linear degrees of freedom and one rotational degree of freedom to precisely adjust the attitude of the laser during the experiment. The cutting force measurement system consists of a cutting force dynamometer (Kistler 9119AA2, Winterthur, Switzerland), a charge amplifier and a data collector with a measuring range of ±4 kN. In order to fully highlight the effectiveness of laser assistance in enhancing the performance of LAT, dry cutting mode is used in the experiment without cutting fluid to exclude the interference of the cooling factor.

2.2. FE Model of LAT of GH 4169

Figure 2 shows a schematic diagram of LAT. In LAT, the laser and the tool are relatively stationary, while the workpiece moves. Specifically, as shown in Figure 2a, during the laser preheating process, the laser irradiates the workpiece to increase its temperature. This preheating process not only softens the material, reducing its Young’s modulus, shear modulus, and yield strength, but also directly influences the strength of the cutting heat source during the subsequent tool cutting process, as shown in Figure 2b.
Consequently, LAT decreases cutting force, extends tool life and reduces surface roughness. Notably, the laser preheating process is crucial for achieving these effects. Laser processing parameters, such as laser power-P, laser spot diameter-D, laser spot movement speed-V, and laser spot–tool edge distance-L, significantly affect workpiece temperature. To achieve good results with LAT, it is necessary to consider the effect of all laser processing parameters on workpiece temperature. In this study, the laser heating source is a Gaussian heat source, and the Gaussian heat source energy density is shown in Equation (1) [28]:
q = 2 A P π r 2 e x p ( 2 L 2 r 2 )
where P is the laser power (W), r is the radius of the laser spot (mm), L is the distance relative to the center of the laser spot (mm) and A is absorption coefficient, initially set to 1.
In the actual LAT process of this study, the laser beam is oriented at an angle relative to the workpiece surface. A planar Gaussian heat source distribution model is utilized to simulate the actual laser irradiation. When the laser beam is tilted onto the workpiece surface, the resulting laser spot assumes an elliptical shape. The dimensions of the elliptical spot’s major and minor axes are determined based on the laser spot diameter and the tilt angle of the laser beam. Based on these principles, a VDFLUX subroutine for Abaqus 2020 is compiled using Fortran to calculate and simulate the heat flux distribution.
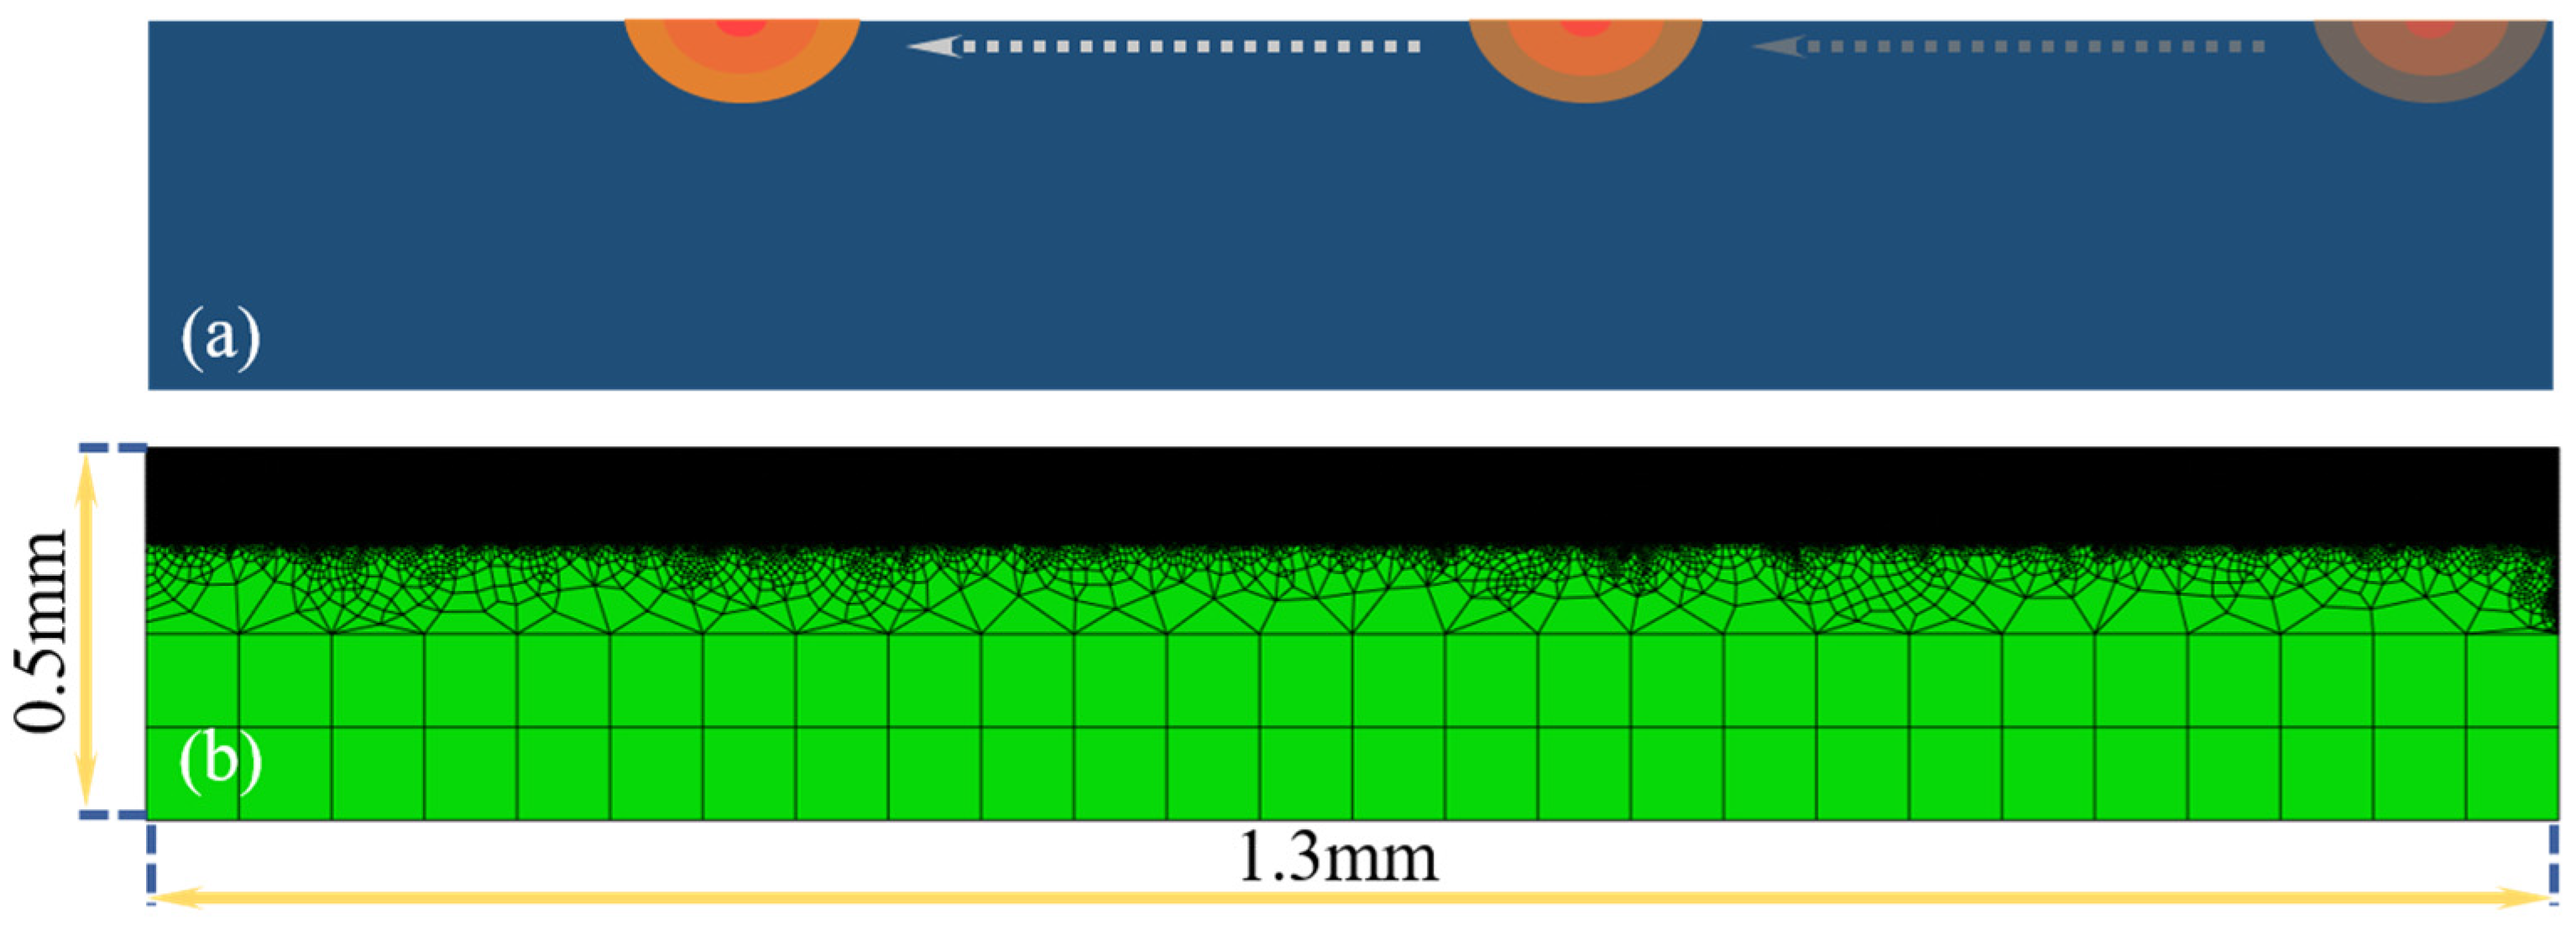
Table 2 lists the material parameters for GH 4169. Utilizing the VDFLUX subroutine and the material parameters of GH 4169, a 2D FE model for the laser preheating of GH 4169 can be constructed. Adhering to the principle of laser preheating, the distance between the laser spot center and the tool edge of the cutting tool in LAT is maintained within the range of 0 to 2 cm. In practice, the trajectory of the laser relative to the workpiece during preheating can be approximated as a straight line compared to the trajectory of the laser sweeping across the surface of the workpiece during one cycle of rotational movement of the workpiece. Therefore, a 2D FE model of the laser preheating of GH 4169 is built using Abaqus, and the simulation route with a stationary workpiece and laser spot movement is adopted. The upper part of the workpiece model is meshed with a fine mesh, and the lower part is meshed with a coarse mesh. Fixed constraints are added on the left side and the bottom of the model, and the model is shown in Figure 3. The mesh type of the workpiece model is CPE4RT, and the minimum mesh size is 0.5 μm.
The simulation model in this study is based on the following assumptions: (1) the laser heat source is in the form of a surface heat source; (2) GH 4169 is an isotropic material; and (3) the heat loss from thermal convection as well as thermal radiation of the material during the laser preheating process is neglected.

2.3. Calibration Setup of Absorption Coefficient for GH 4169

Due to different materials having different absorption coefficients for different wavelengths of laser, it is necessary to calibrate the absorption coefficients of GH 4169 for the 1064 nm wavelength laser used in the experiments to ensure the accuracy of the FE simulations. This study combines laser heating experiments and FE simulations to calibrate absorption coefficients of GH 4169. A simulation model of the same size as the heating experiment model is used. To ensure accuracy and reduce simulation time, a spot with a diameter of 1 mm is chosen for the absorption coefficients calibration experiment.
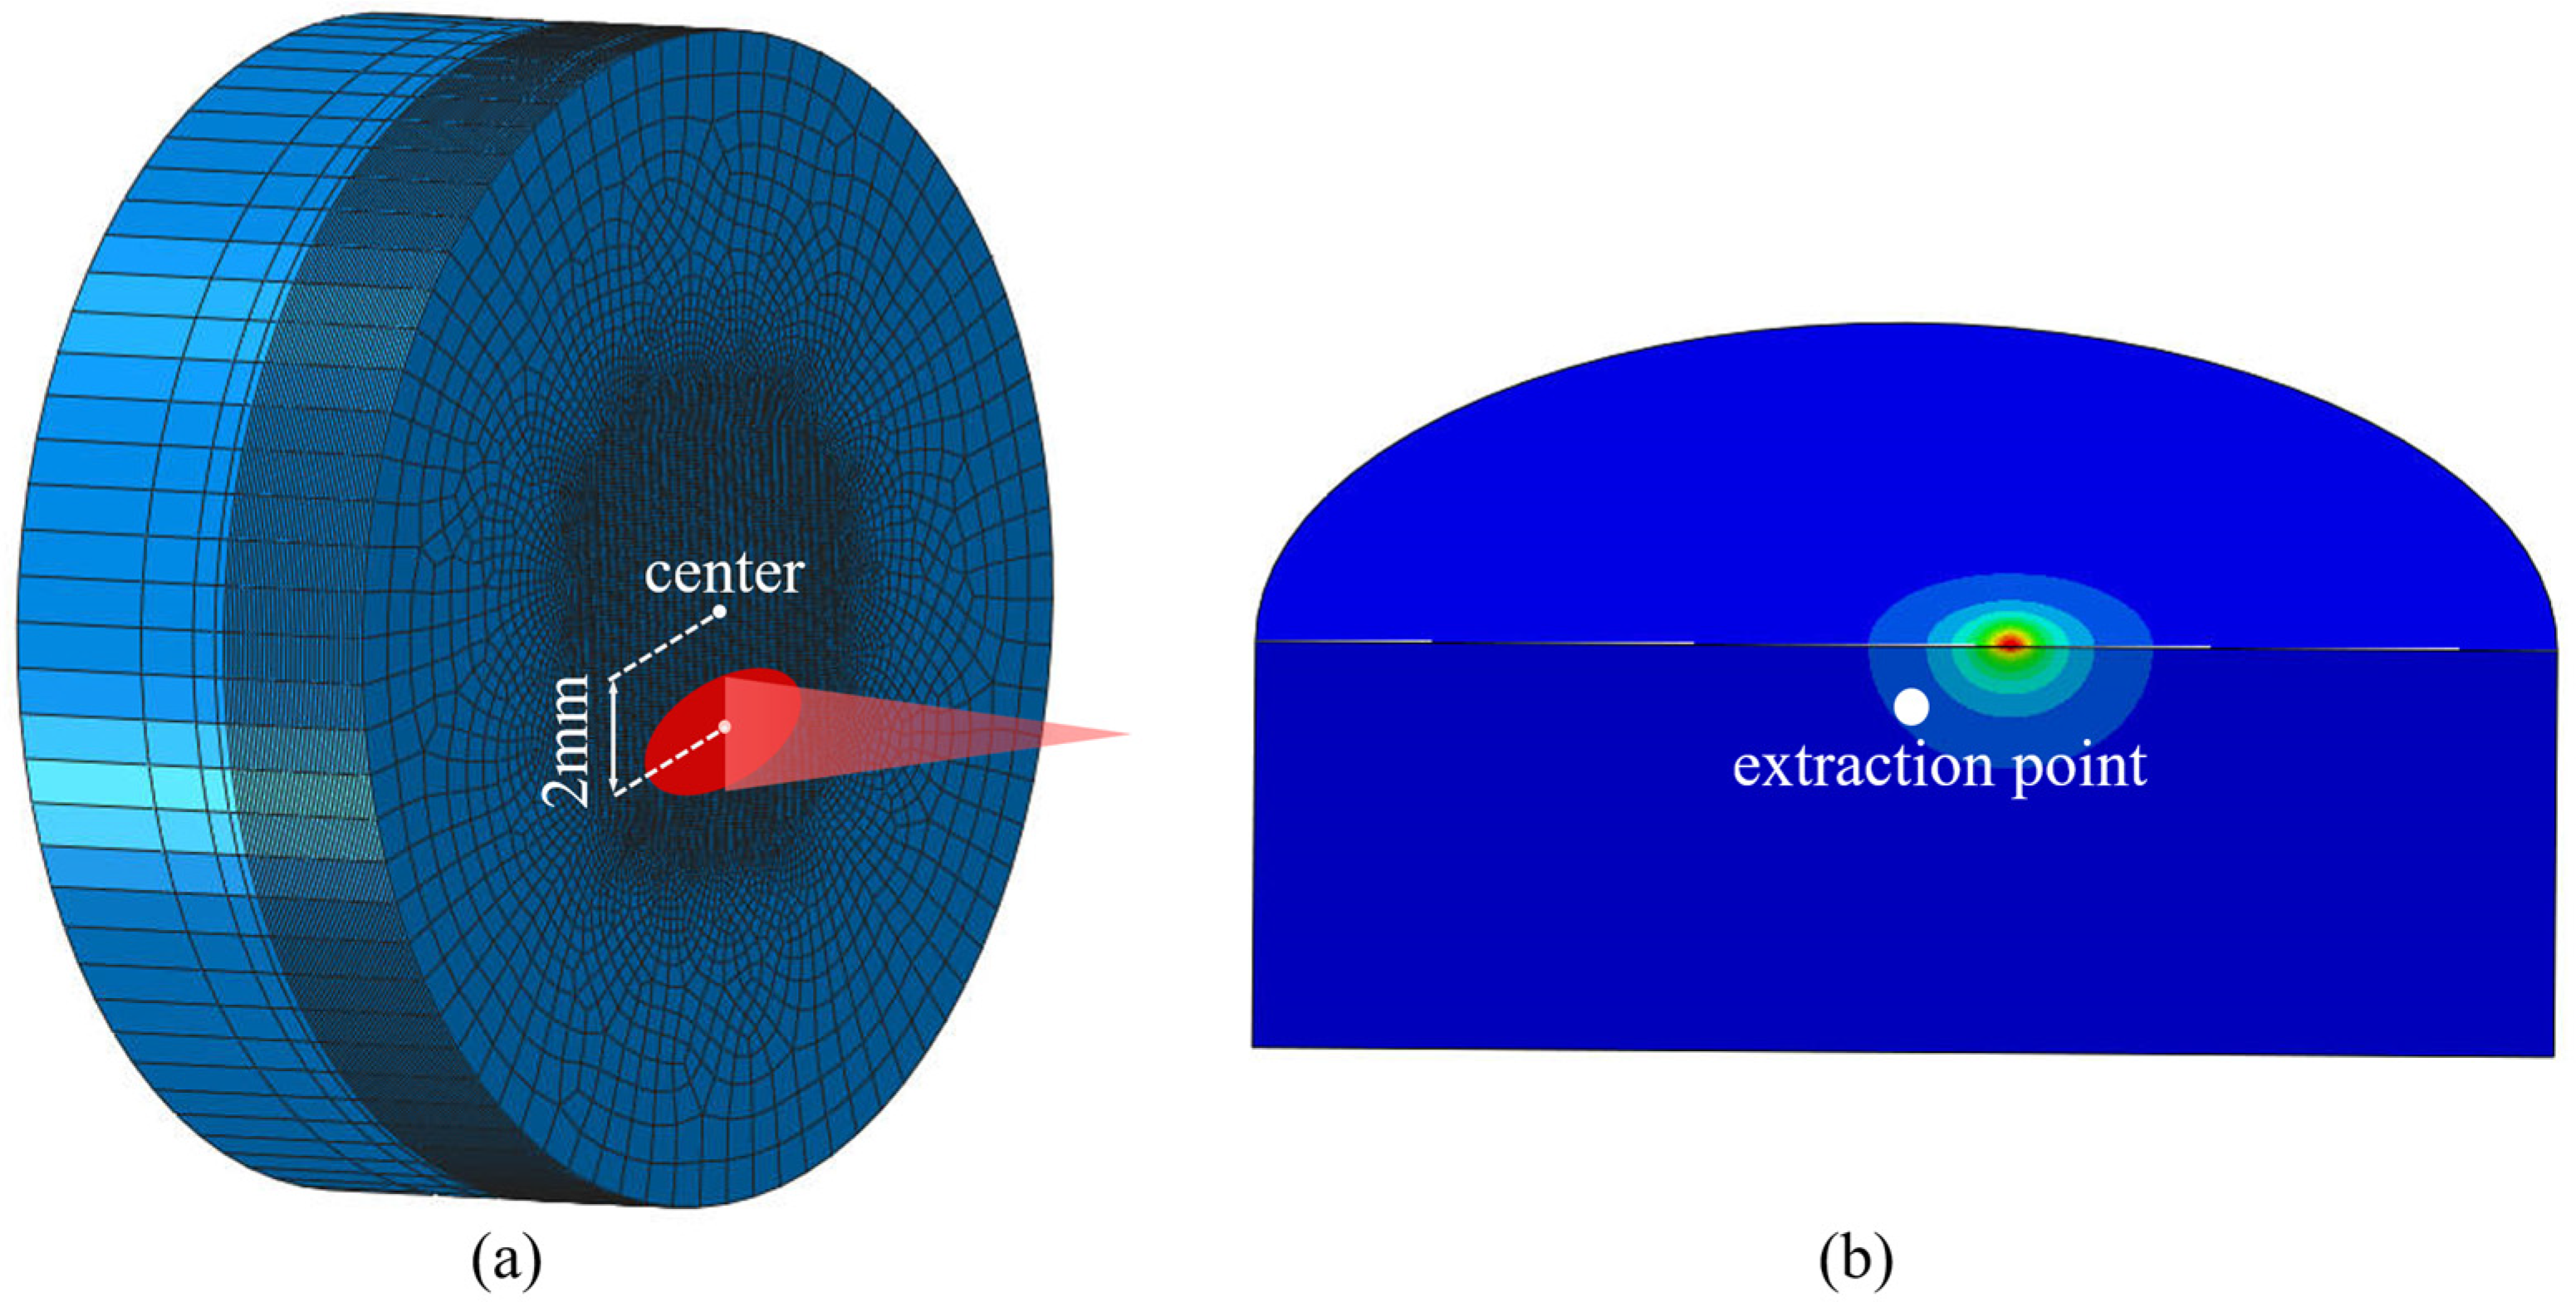
Figure 4 shows the experimental platform for laser heating temperature measurement during the calibration of the absorption coefficients, which consists of a thermocouple pyrometer, a data logger, a laser heat source and a workpiece to be measured. The thermocouple pyrometer consists of a Type K thermocouple from Shenzhen Yili Company, Shenzhen, China, with a measurement range spanning −20 °C to 1200 °C. This fully covers the required measurement range for the experiment. Its 0.1-s sampling time ensures the accuracy of the measurement results. Prior to the laser heating temperature measurement, the workpiece is pre-treated in the same method as described in Section 2.1. Meanwhile, a hole with a diameter of 1.5 mm and a depth of 1.5 mm is machined in the workpiece for placing the thermocouple. In the laser heating experiments, the thermocouple is located 2 mm above the center of the laser spot, in the direction of the minor axis of the laser spot. In the FE simulation work, in order to reduce the simulation time while guaranteeing the simulation accuracy, a finer mesh is used in the center of the model and a coarser mesh is used in the periphery of the model, as shown in Figure 5. The mesh type of the workpiece model is DC3D8R and the minimum mesh size is 0.1 mm. Fixed constraints are used at the bottom. In the post-processing process, the temperature values of the measured point are extracted and compared with the results of the laser heating experiment, and the absorption coefficients are calculated repeatedly until the error between the simulated temperature, and the actual laser heating experiment temperature is less than 5%.

3. Results and Discussion

3.1. Calibration of Laser Absorption Coefficients for GH 4169

In order to ensure the accuracy of the simulation results, the calibration of the absorption coefficients for the 1064 nm laser by GH 4169 is carried out first. Table 3 lists the selected processing parameters (laser power-P, laser spot diameter-D, laser tilt angle-θ and laser heating time-t). Three experiments are carried out for each serial of parameters, the heating temperature results are detected by thermocouple thermometer, and the average values of the results are taken as the final test result; the results are shown in Table 4.
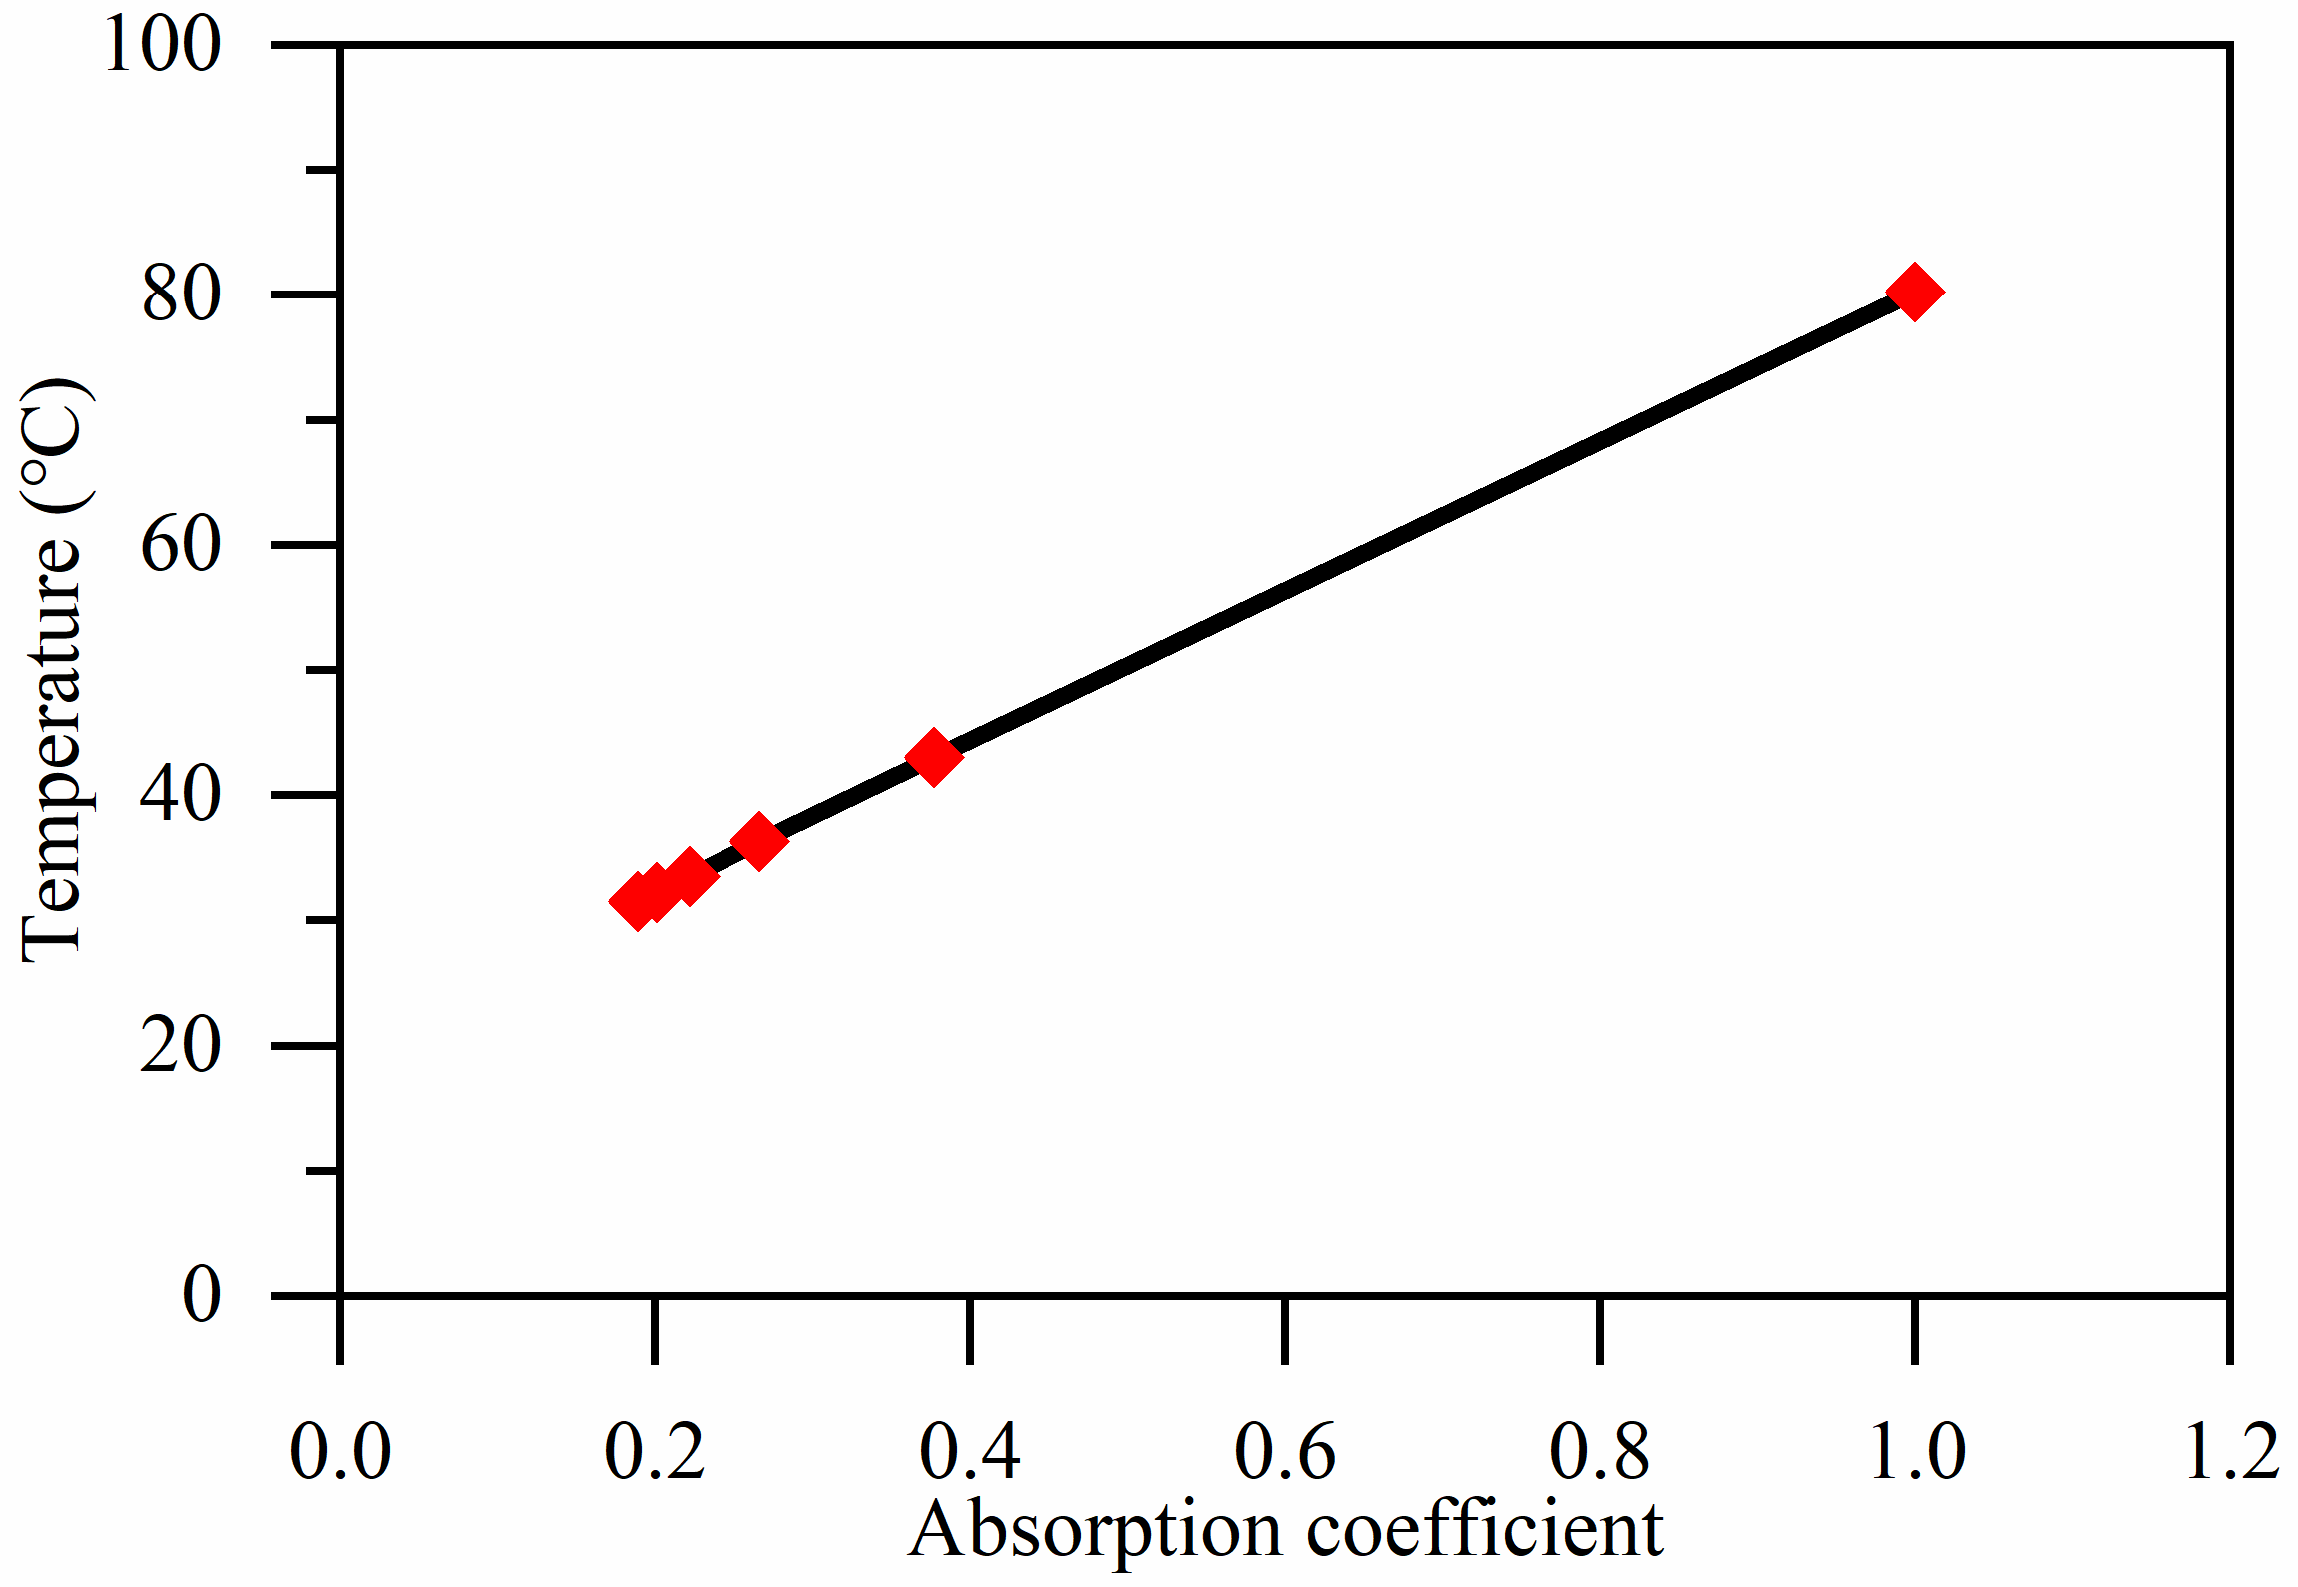
Subsequently, FE temperature simulations are carried out under the corresponding parameter conditions, absorption coefficients are set to one initially, and the simulation temperature results are compared with the monitoring temperature values obtained from the laser heating experiments. Then, the absorption coefficients are iterated, and the temperature simulations are repeated. The absorption coefficients of GH 4169 for the 1064 nm wavelength laser are obtained through several iterations. The iterative process of calibrated absorption coefficients under Serial 1 parameter conditions is shown in Figure 6. As can be seen, the absorption coefficients quickly converge, generally reaching a stable value after 5 iterations.
Table 5 shows the calibration results of the absorption coefficients of GH 4169 for a 1064 nm wavelength laser under different laser powers. Based on the calibrated absorption coefficients, the experimental monitoring temperature values of laser heating are compared with the simulation temperature results, and the comparison results are shown in Figure 7. With the increase in laser power, the temperature value of the experimentally obtained temperature measurement point also increases gradually, and the overall error between the experimental temperature values and the temperature values obtained from simulations does not exceed 5% at most.

3.2. Influence of Laser Processing Parameters on Peak and Final Preheating Temperatures

LAT reduces the hardness and strength of the heated material by local preheating to soften the workpiece material, so as to achieve the purpose of assisted cutting. Thus, the laser preheating process is an important part of the softening of the material by the local heating of the laser. In order to understand the temperature regulation range of the workpiece in the preheating process as well as the variation rule of temperature, it is necessary to carry out FE simulation of the peak and final preheating temperatures of the preheating process.
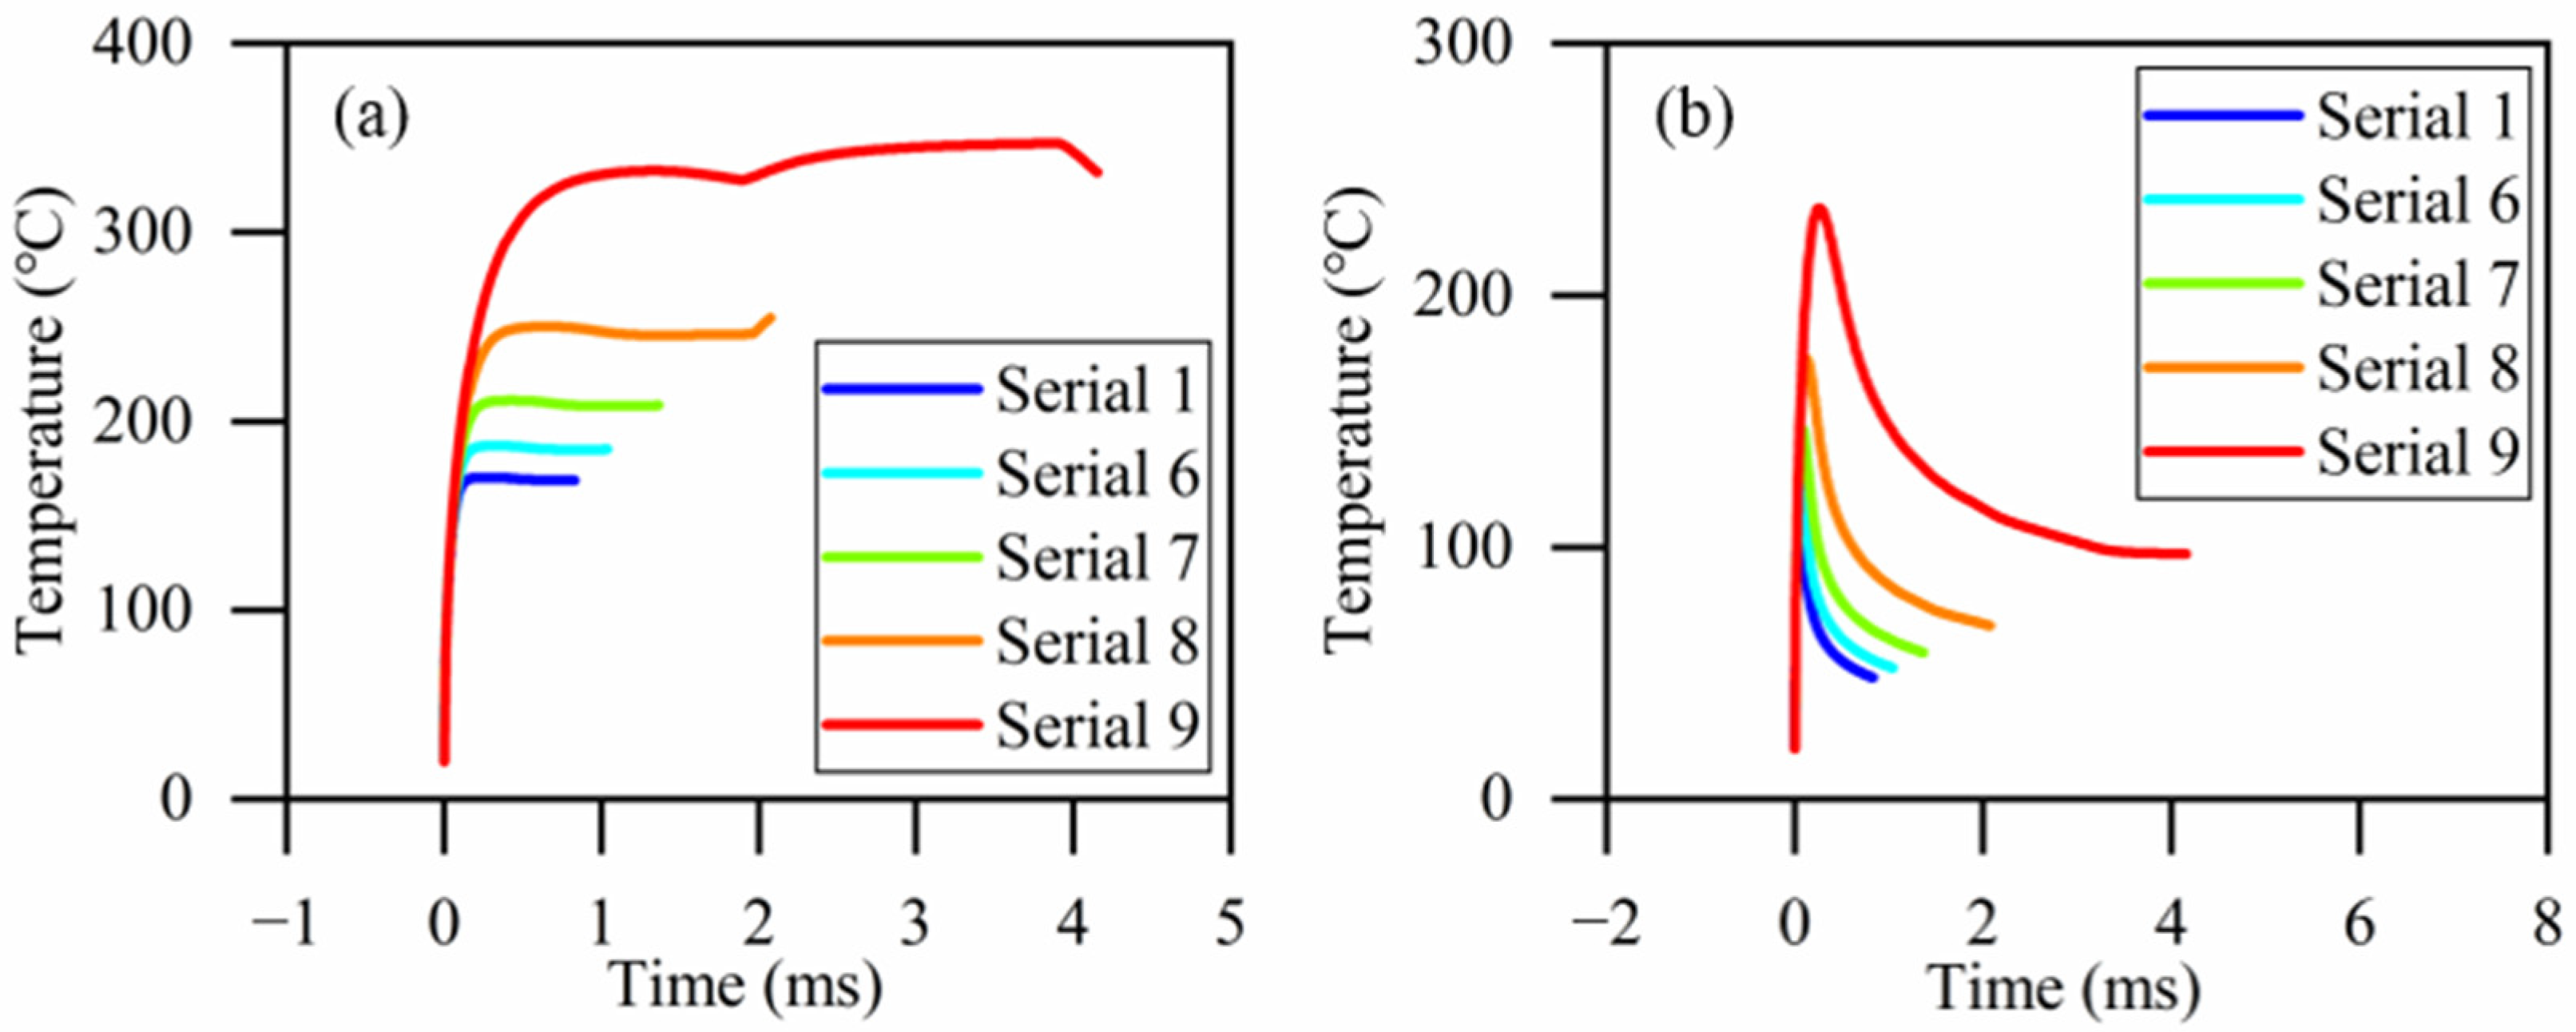
In the 2D thermal field simulation, the laser power-P, the laser spot diameter-D, the laser spot–tool edge distance-L, as well as the laser spot movement speed-V may affect the peak and final preheating temperatures. In the machining process of this study, the laser and the tool are relatively stationary, so in the simulation process, L can be interpreted as the distance of the laser’s movement relative to the workpiece during the preheating process until the tool begins to contact the workpiece to perform the cutting. Table 6 shows the experimental scheme to carry out a single-factor simulation experiment of the laser preheating process, and the peak temperature of each frame during laser preheating and the final preheating temperature at point A on the workpiece are extracted as shown in Figure 8 to investigate the effect of laser processing parameters on the thermal field during laser preheating.

3.2.1. Laser Power

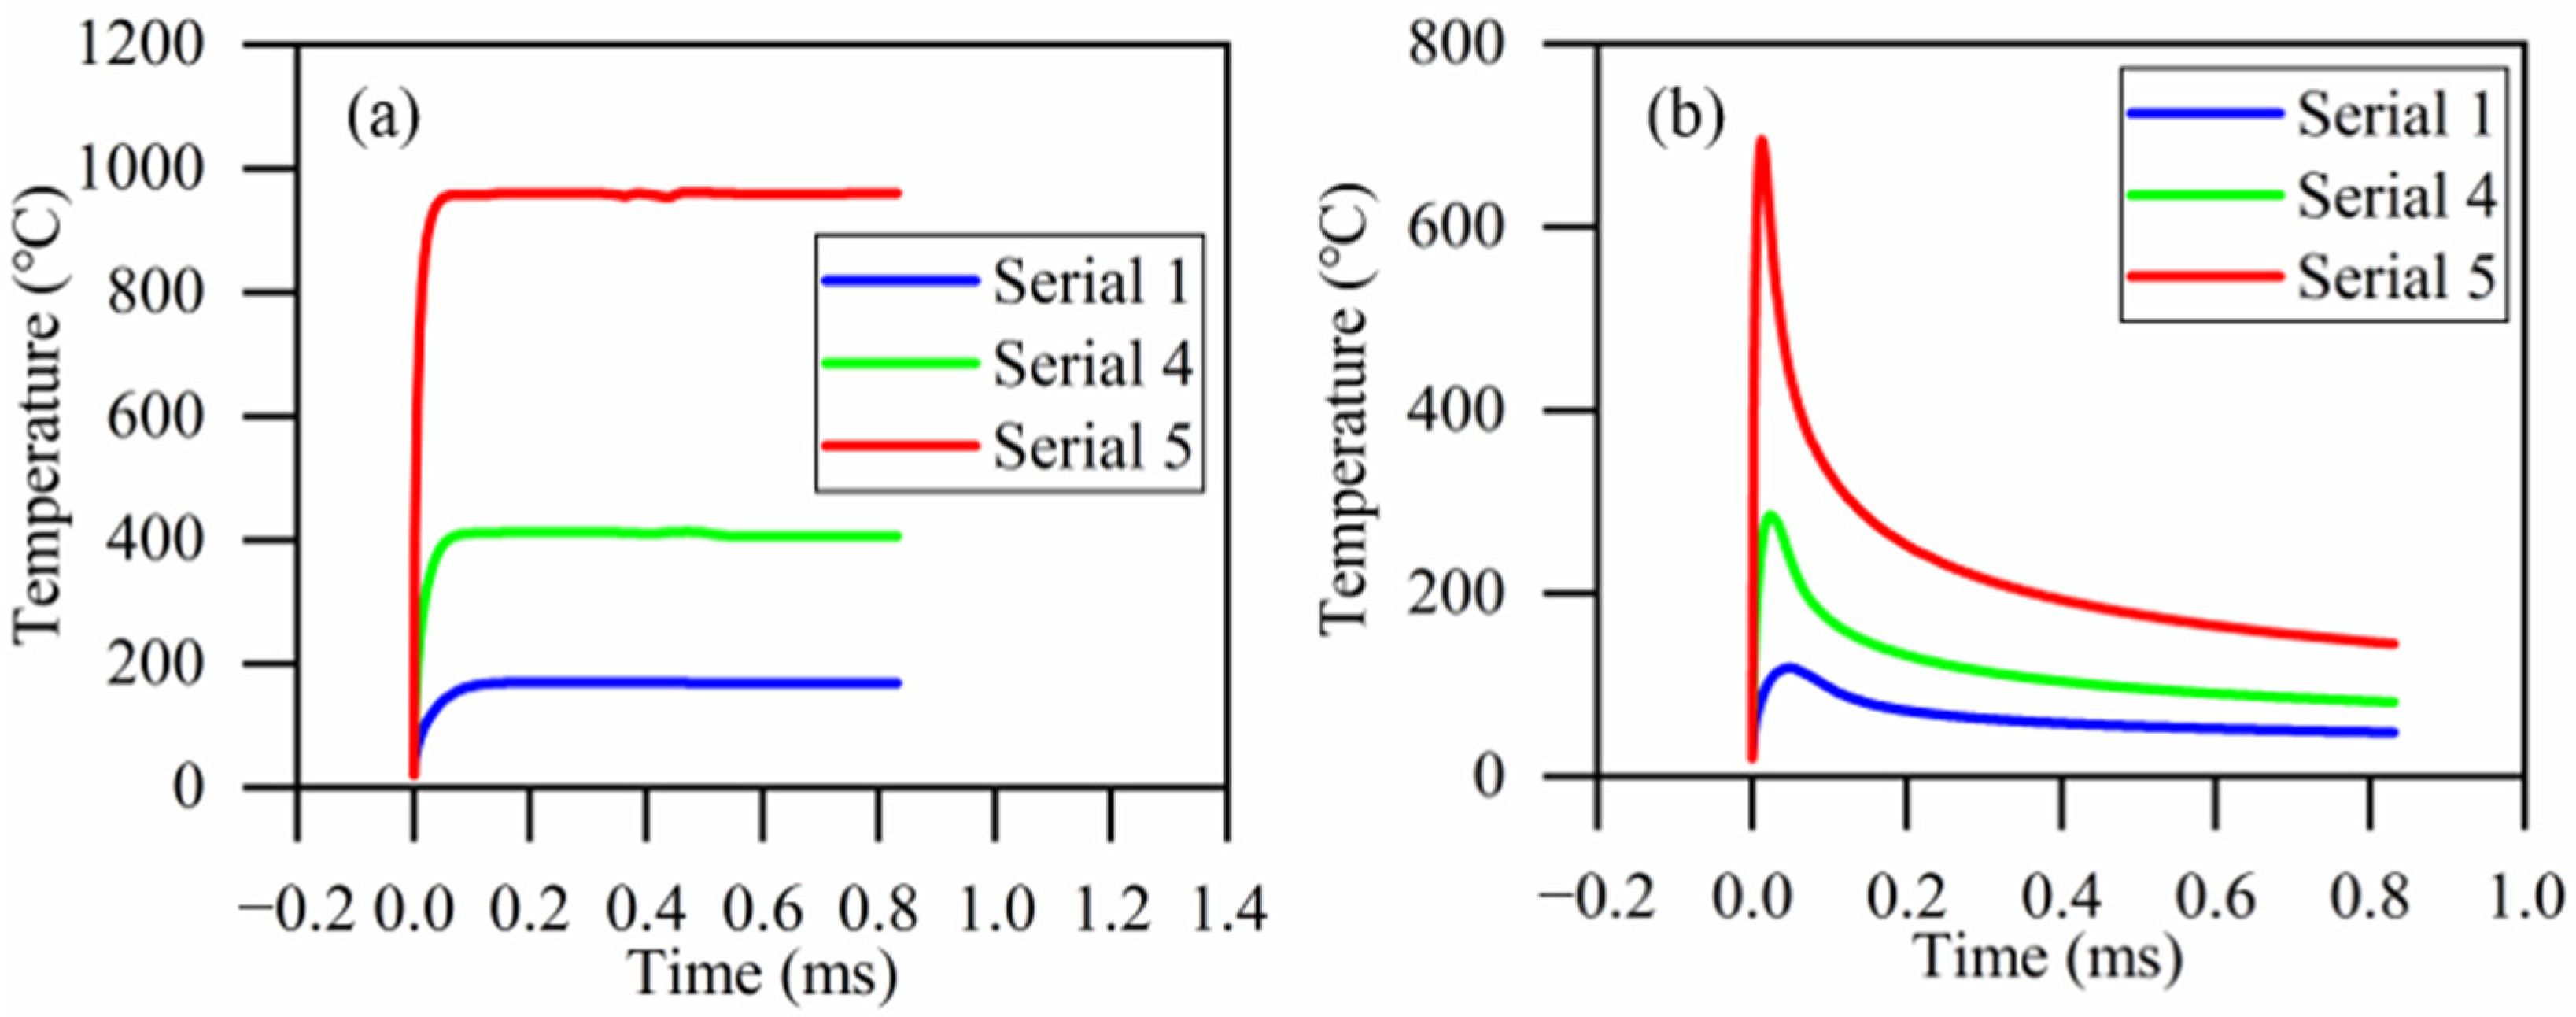
Figure 9 shows the simulation results of the peak and final preheating temperatures under different laser powers. Due to the limitation of the calculation principle of FE simulation, the peak temperature after stabilizing fluctuates, and the maximum error of the fluctuation is within 5%. Figure 9a shows the laser preheating process’s peak temperatures over time under different laser power conditions during laser irradiation of the workpiece surface. When the laser sweeps the surface of the irradiated material, the laser energy is continuously transferred to the surface of the workpiece, and the peak temperature of the heated workpiece rises rapidly and reaches a thermal balance after 0.05 ms. As the laser power increases, more energy input intensifies the heat conduction process between the laser and the material, prompting a rapid increase in material temperature, resulting in a larger peak temperature after stabilization. The peak temperature is 170.37 °C when the laser power is 10 W. And when the laser power is increased to 30 W, the peak temperature is 402.99 °C.
Figure 9b shows the variation in the preheating temperature at point A over time for different powers. The preheating temperature rises rapidly and reaches a maximum when the laser reaches this point and decreases rapidly after the laser passes through this point. As the laser power increases, the increasing as well as decreasing gradient of the temperature increases, and the difference between the maximum temperature at this point and the final preheating temperature after cooling down becomes larger. When the laser power is 10 W, the final preheating temperature is 48.24 °C. And when the laser power increases to 30 W, the final preheating temperature is 94.73 °C.
During the laser preheating process, when the laser power increases by 200%, the peak temperature increases by 136.54% and the final preheating temperature rises by 96.39%. During the preheating process, variation in laser power has a significant effect on the peak temperature of the material, as well as the final temperature at point A. There are positive correlations between laser power and each of these factors.

3.2.2. Laser Spot Diameter

Figure 10 shows the simulation results of the peak and final preheating temperatures for different laser spot diameters. Figure 10a shows the laser preheating process’s peak temperature with time under different laser spot diameters during laser irradiation of the workpiece surface. As the laser spot diameter increases, equal laser energy is dispersed over a larger area, and the energy received per unit area decreases, resulting in a lower energy density. The decrease in energy density means the laser energy delivered per unit of time is reduced, so the peak temperature of the workpiece is reduced. When the spot diameter is 0.05 mm, the peak temperature is 961.85 °C. And when the spot diameter is 0.2 mm, the peak temperature is 170.37 °C.
Figure 10b shows the variation in the preheating temperature at point A with time for different laser spot diameters. Due to the larger spot diameter, this point is irradiated by the laser for a longer period of time and therefore a longer time is taken to reach the maximum temperature. Additionally, the increase in laser spot diameter also leads to a decrease in laser power density, thereby reducing the final preheating temperature. When the spot diameter is 0.05 mm, the final preheating temperature is 144.55 °C. When the spot diameter is 0.2 mm, the final preheating temperature is 48.24 °C.
During the laser preheating process, when the spot diameter increases by 300%, the peak temperature decreases by 82.29%, and the final preheating temperature decreases by 66.63%. The variation in laser spot diameter has a significant effect on the peak temperature of the material, as well as the final preheating temperature at point A. There are negative correlations between laser spot diameter and each of these factors.

3.2.3. Laser Spot Movement Speed

Figure 11 shows the temperature simulation results for different laser spot movement speeds. Figure 11a shows the process of the peak temperature over time at different laser spot movement speeds during the laser irradiation of the workpiece surface. As the laser spot movement speed decreases, the laser irradiates the material surface for a longer time, therefore the peak temperature increases after stabilization. When the laser spot movement speed is 1204.28 mm/s, the peak temperature is 170.37 °C. And when the laser spot movement speed decreases to 240.86 mm/s, the peak temperature is 347.15 °C.
Figure 11b shows the variation in the preheating temperature at point A over time for different laser spot movement speeds. Similarly to the principle in the spot diameter change simulation experiment, a decrease in the laser spot movement speed provides the laser with a longer time to irradiate and heat each spot. Therefore, as the movement speed decreases, the time to reach the maximum temperature becomes longer. With the continuous movement of the laser, after the spot passes through a point, the temperature of that point begins to decrease, but due to the influence of the material’s own heat conduction, the rest of the area heated by the laser will still provide energy for that point. Moreover, the lower the speed is, the more energy the laser inputs, resulting in the rest of the area providing more energy, so with a decrease in the movement speed, the final preheating temperature increases. When the laser spot movement speed is 1204.28 mm/s, the final preheating temperature is 48.24 °C. And when the laser spot movement speed is reduced to 240.86 mm/s, the final preheating temperature is 97.53 °C.
During the laser preheating process, when the laser spot movement speed decreases by 80%, the peak temperature increases by 103.76%, and the final preheating temperature increases by 101.43%. The variation in laser spot movement speed has significant effects on the peak temperature and the final preheating temperatures and is negatively correlated with both.

3.2.4. Laser Spot–Tool Edge Distance

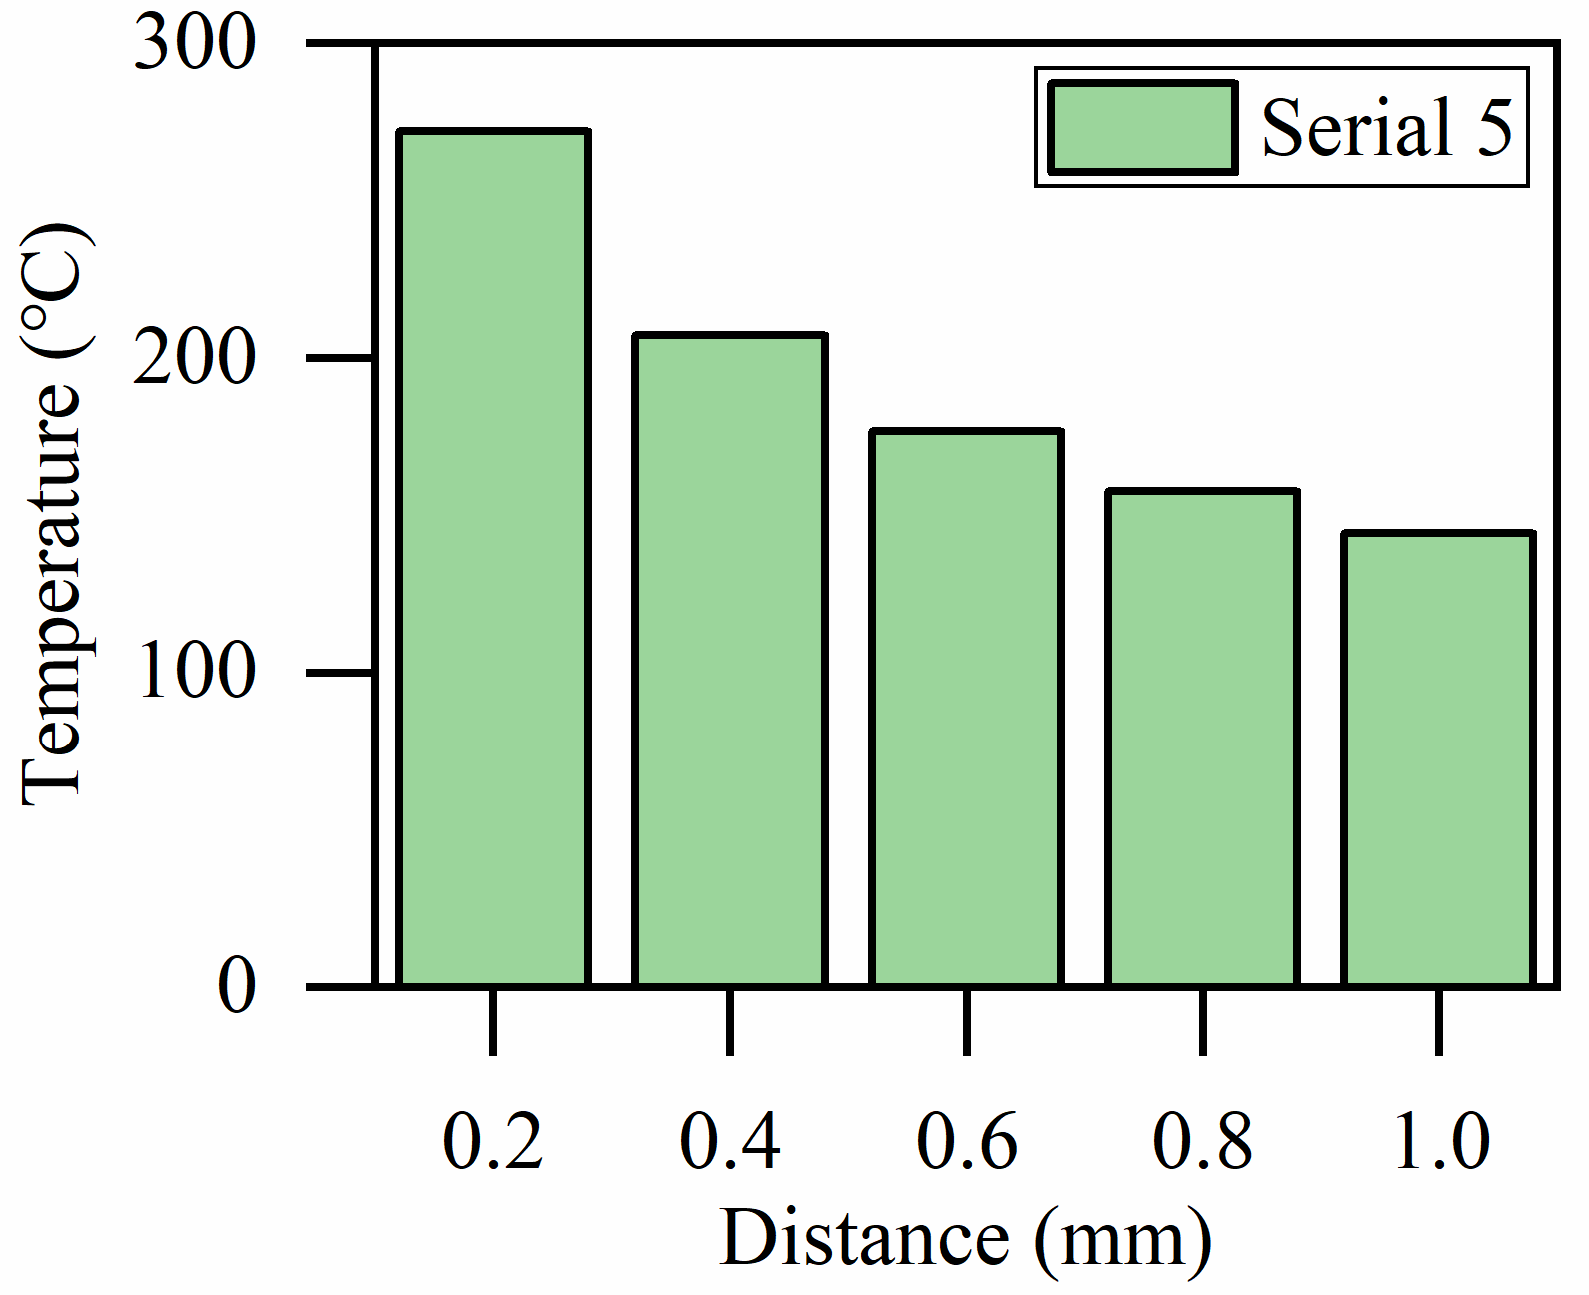
During LAT, the material undergoes laser preheating, environmental cooling and cutting removal. The shorter the laser spot–tool edge distance, the lower the heat dissipation time after laser preheating. Taking the Serial 5 simulation data as an example, the final preheating temperature at point A at different distances is shown in Figure 12. With a decreasing distance, the cooling time becomes shorter, and more temperature is retained in the material. When the distance decreases to 0.2 mm, the laser preheating phase at point A is completed, ensuring that the peak temperature remains constant. Additionally, the final preheating temperature increases.
In the laser preheating process, when the laser spot–tool edge distance reduces by 80%, the final preheating temperature increases by 81.15%. In this study, the variation in the laser spot–tool edge distance has no effect on the peak temperature but has a strong effect on the final preheating temperature at point A and shows a negative correlation.

3.3. Temperature Regulation for GH 4169

3.3.1. Temperature Regression Equation for GH 4169

The laser spot–tool edge distance can be understood as the distance of the laser spot movement relative to the workpiece when the tool reaches point A during the preheating process, so the peak temperature during laser preheating—Tmax and the final preheating temperature of point A—TA are extracted in the ODB file at different laser spot movement distances. This study focuses on the laser preheating phase, during which the cutting tool has not yet established substantive cutting contact with the workpiece. Furthermore, during this phase the TA is directly correlated with the softening degree of the workpiece material, which in turn modulates the generation mechanism and magnitude of cutting heat in the subsequent machining stage. Therefore, in subsequent analyses, the heat source from the cutting zone is excluded, and only the influence of the laser heat source is considered. During preheating, the workpiece temperature expression is shown in Equation (2) [21]. Taking logarithm on both sides of the equation, the multiple linear regression equation is obtained. Tmax is independent of L in this study, so the parameter L data are not used in the Tmax regression analysis. Multiple linear regression is carried out using SPSS 27 to obtain the multiple linear regression equations of Tmax and TA, and then these two equations are restored to obtain the regression equations of Tmax and TA as shown in Equation (3) and Equation (4). The correlation coefficients of the multiple regression equations of Tmax and TA, R2, are 0.999 and 0.997, respectively, and the exponent value of each parameter of the regression equations corresponds with the analyzed results in Section 3.2, which indicates that the multiple linear regression equations are capable of reflecting the effect of processing parameters on temperature.
T = a P a 1 D a 2 V a 3 L a 4
where a is the regression formula coefficient, P is the laser power (W), D is the laser spot diameter (mm), V is the laser spot movement speed (mm/s), L is the laser spot–tool edge distance (mm) and a1, a2a3 and a4 are parameter indices.
T m a x = e 4.458 P 0.779 D 1.258 V 0.443
T A = e 4.010 P 0.665 D 0.854 V 0.436 L 0.332 8

3.3.2. Parameter Optimization for LAT of GH 4169

Based on the regression equations of Tmax and TA obtained in Section 3.3.1, LAT-suitable machining parameters are obtained. To show the processing effect of LAT, a comparison experiment between CT and LAT is carried out. In the previous study, the peak temperature during the heating process of GH 4169 was supposed to be in the range of 650–950 °C [29], and the final preheating temperature was not to exceed 190 °C [30]. Therefore, based on published research, Tmax and TA are determined as follows: Previous studies indicate that LAT requires controlling the peak temperature within the range of 650–950 °C to balance achieving the desired material softening effect with avoiding thermal damage to the workpiece. To address parameter variations caused by differing experimental conditions across the literature and reduce potential errors, this study adopts the average value within this peak temperature range as Tmax at 800 °C. Furthermore, existing research indicates that the final preheating temperature should not exceed 190 °C; thus, this upper limit is set as the value for TA. Therefore, Tmax is selected to be the average of the peak temperature range of 800 °C and TA to be 190 °C. To ensure a unique solution when simultaneous regression equations are calculated, it is necessary to predefine the values of two independent variables. In Section 3.2.4, it is shown that the L directly affects the final preheating temperature; an excessively large L reduces the final preheating temperature and fails to achieve effective material softening, while an excessively small L elevates the temperature beyond the optimal range and causes laser reflection to accelerate tool degradation. In Section 3.2.3, it is demonstrated that the V significantly influences both peak temperature and preheating temperature; an excessively high V shortens laser irradiation time and weakens the material softening effect, while an excessively low V leads to excessive heat input and induces surface ablation. To avoid extreme temperatures, L = 0.4 mm and V = 722.57 mm/s are preset as two independent variables. Based on the predefined parameters L = 0.4 mm and V = 722.57 mm/s, the calculated values are P = 13 W and D = 0.08 mm. However, during face turning, the cutting speed varies continuously due to the continuous feed movement of the tool, making it impossible to maintain a constant V = 722.57 mm/s. To minimize the impact of cutting speed variations on turning results, a concentric ring with an outer diameter of 24 mm and an inner diameter of 22 mm is turned. By employing the average radius of the concentric rings and the V value, a constant spindle speed of n = 600 rpm is derived. Through this method, the maximum variation in cutting speed during the machining process is constrained to within 5%. According to studies by Li et al. [31] and Pan et al. [32], the minimum surface roughness (Ra) achievable during GH4169 machining ranges from approximately 0.697 μm when feed rates (F) are between 0.05 and 0.25 mm/r. Building upon these findings, this study aims to further reduce surface roughness by employing a smaller F of 0.83 μm/r and leveraging the material softening effect induced by laser preheating. A reduction exceeding 50%, less than 0.35 μm in surface roughness, is anticipated. Therefore, the experimental scheme is obtained as shown in Table 7.
Based on the experimental scheme, a comparison experiment between CT and LAT is carried out to detect the cutting force and examine the surface roughness after machining as well as the tool profile. During the turning process, due to the relatively small F, tool movement is difficult to observe directly. Therefore, a monitoring camera is used to observe the turning status.
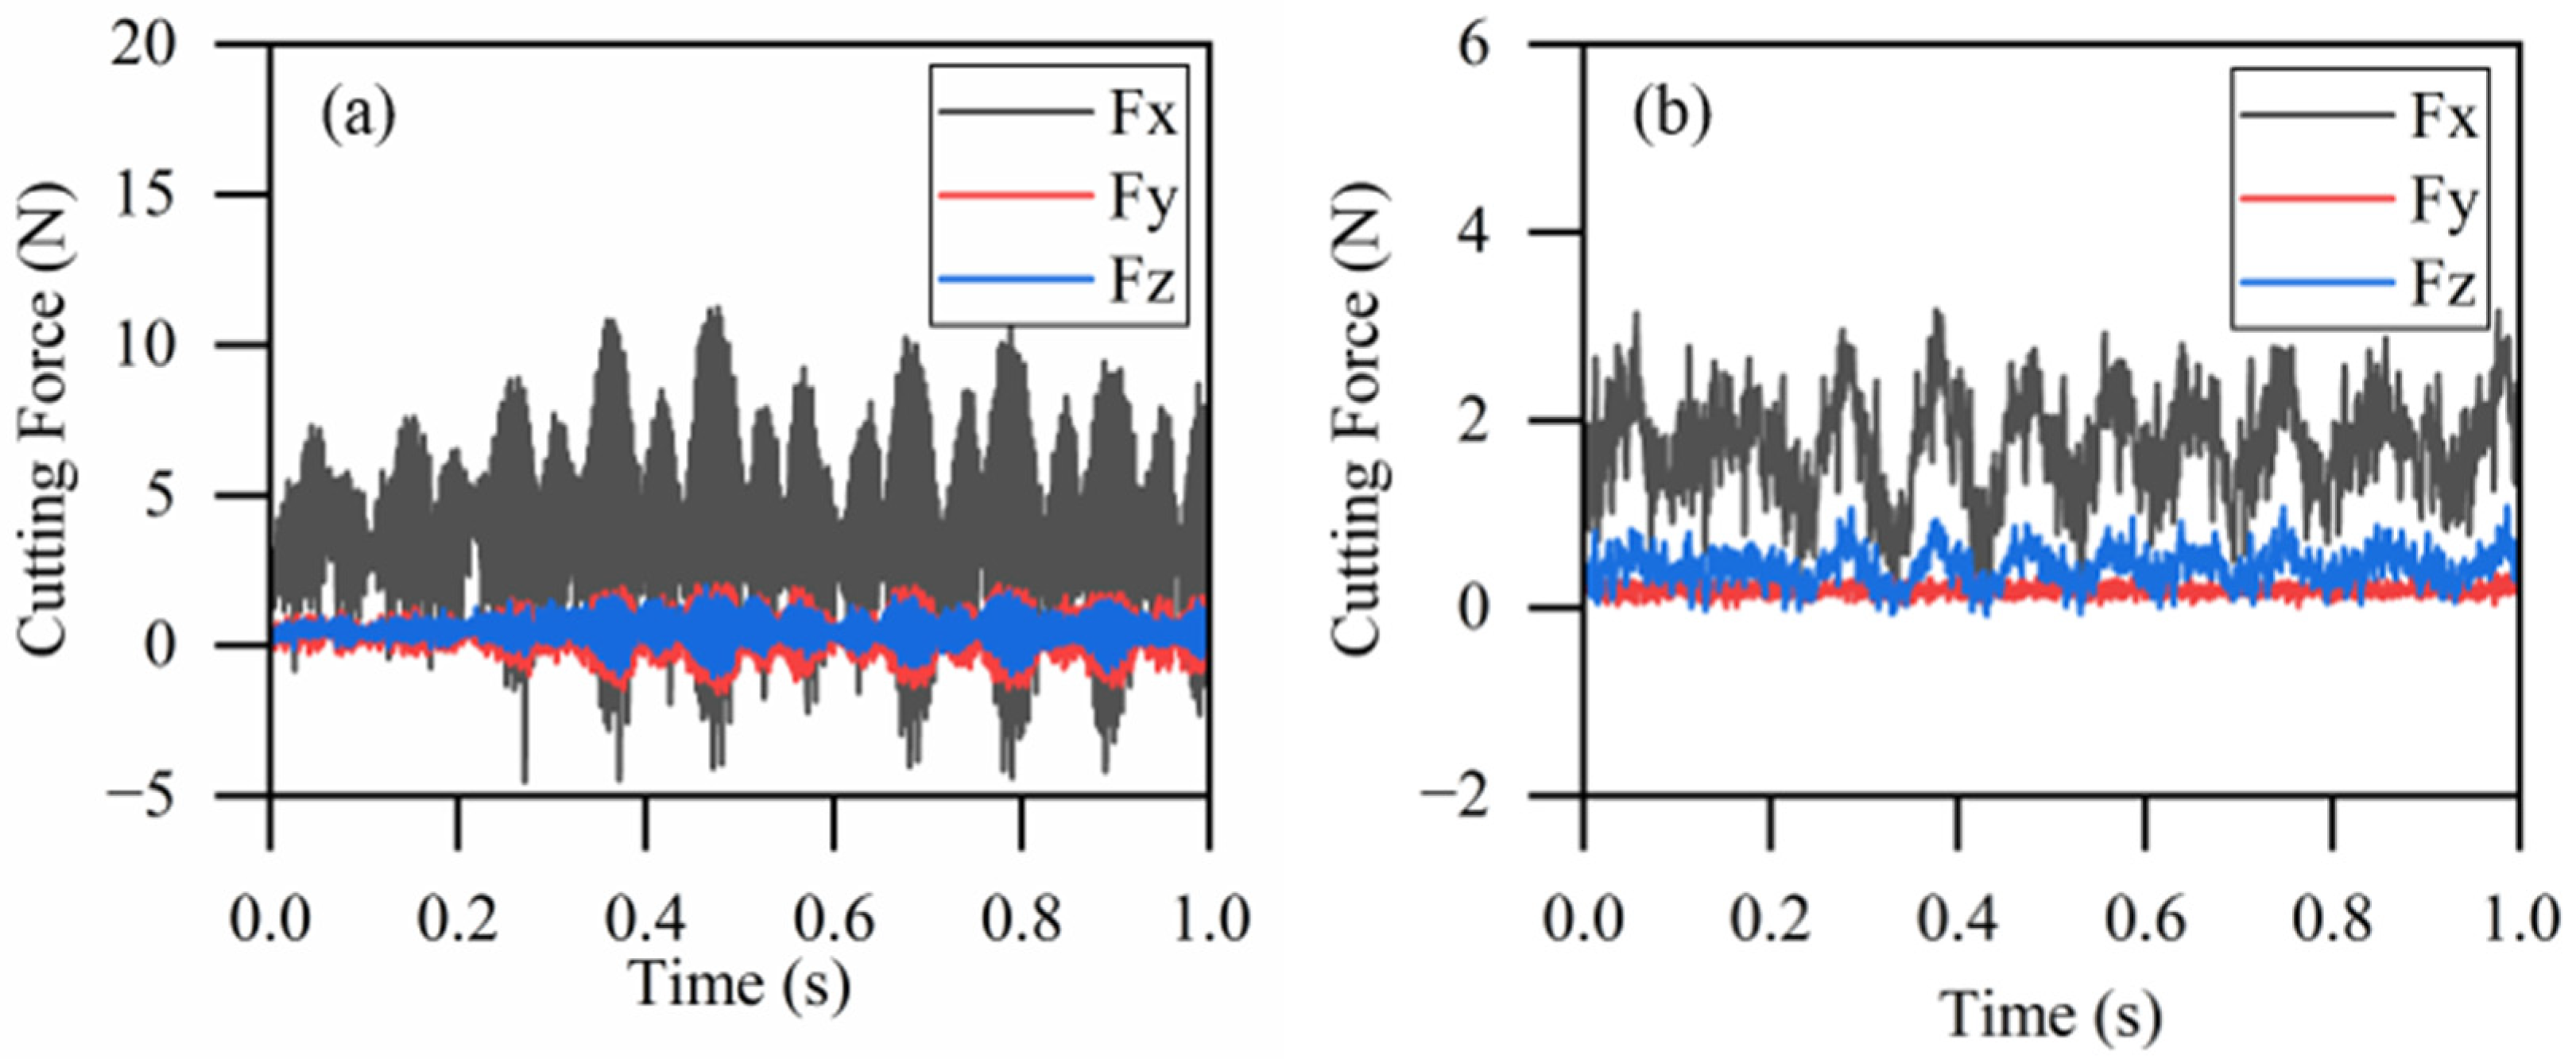
Figure 13 shows the results of CT and LAT cutting force measurements. In CT, due to the high hardness and toughness of GH 4169, high cutting resistance between the tool and workpiece results in cutting force curves exhibiting large-amplitude and high-frequency periodic vibration. The average cutting force in the X, Y and Z direction is 3.470 N, 0.341 N and 0.512 N, respectively, as shown in Figure 13a. Figure 13b shows the cutting force measurement results for LAT in each direction. The amplitude of LAT is significantly reduced, and the numerical fluctuation tends to be smoother, indicating higher overall stability in the cutting process. The average cutting force in the X, Y and Z directions is 1.719 N, 0.195 N and 0.435 N, respectively. Compared with CT, the average cutting force of LAT was reduced by 50.46%, 42.82% and 15.04% in the X, Y and Z directions, respectively.
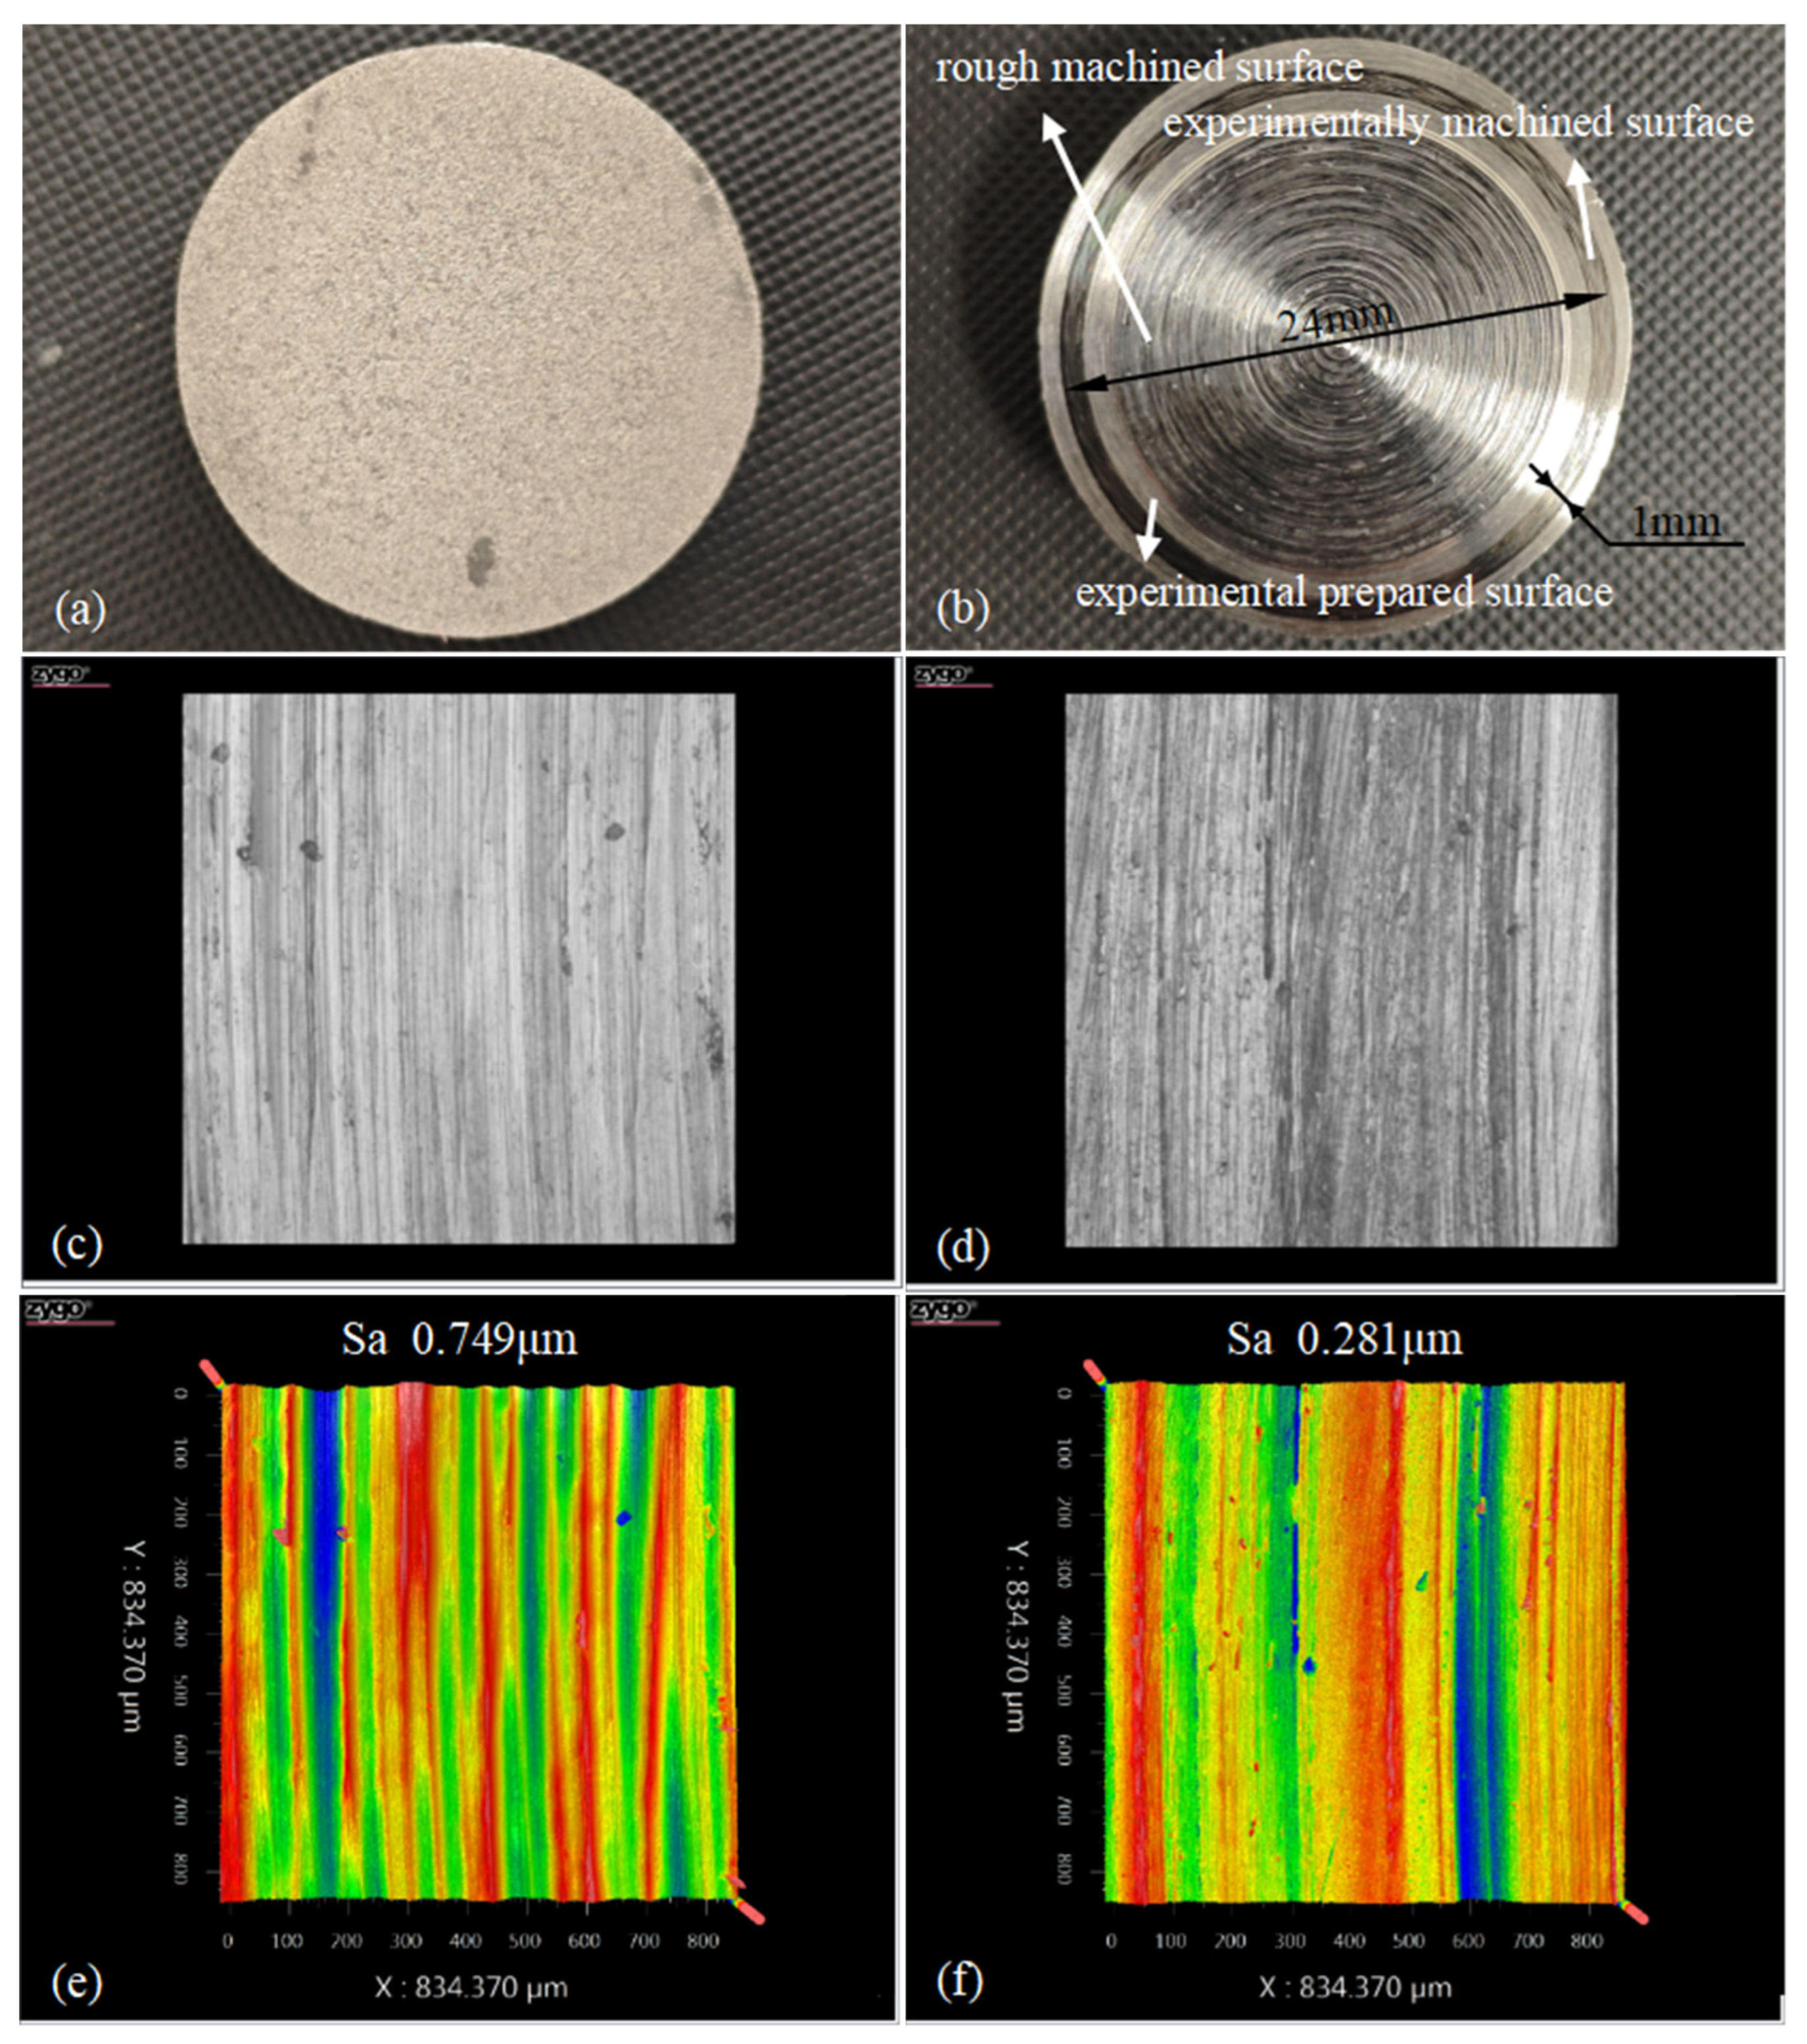
Figure 14 shows the surface topographies of GH 4169 by CT and LAT, including the original surface shown in Figure 14a and post-machining surface by CT shown in Figure 14b. In Figure 14b, a machined surface that is not uniformly flat can be observed. The machined surface’s morphologies are further characterized by optical microscope and white light interferometer. Figure 14c and Figure 14d, respectively, show the machined surfaces of CT and LAT. The CT-machined surface in Figure 14c exhibits tool cutting marks characterized by grooves of varying depths and uneven spacing distribution. In contrast, the cutting marks on the LAT-machined surface shown in Figure 14d appear more uniform and smoother. In Figure 14e, the machining surface of CT appears rough and uneven, with tool marks of varying depths. These groove-like textures are direct results of the intense friction between the tool and the high-hardness material. The surface roughness measured is 0.709 μm. As shown in Figure 14f, the machining surface of LAT is relatively smoother, with a surface roughness of 0.281 μm. Compared to CT, the surface roughness is reduced by 60.37%.
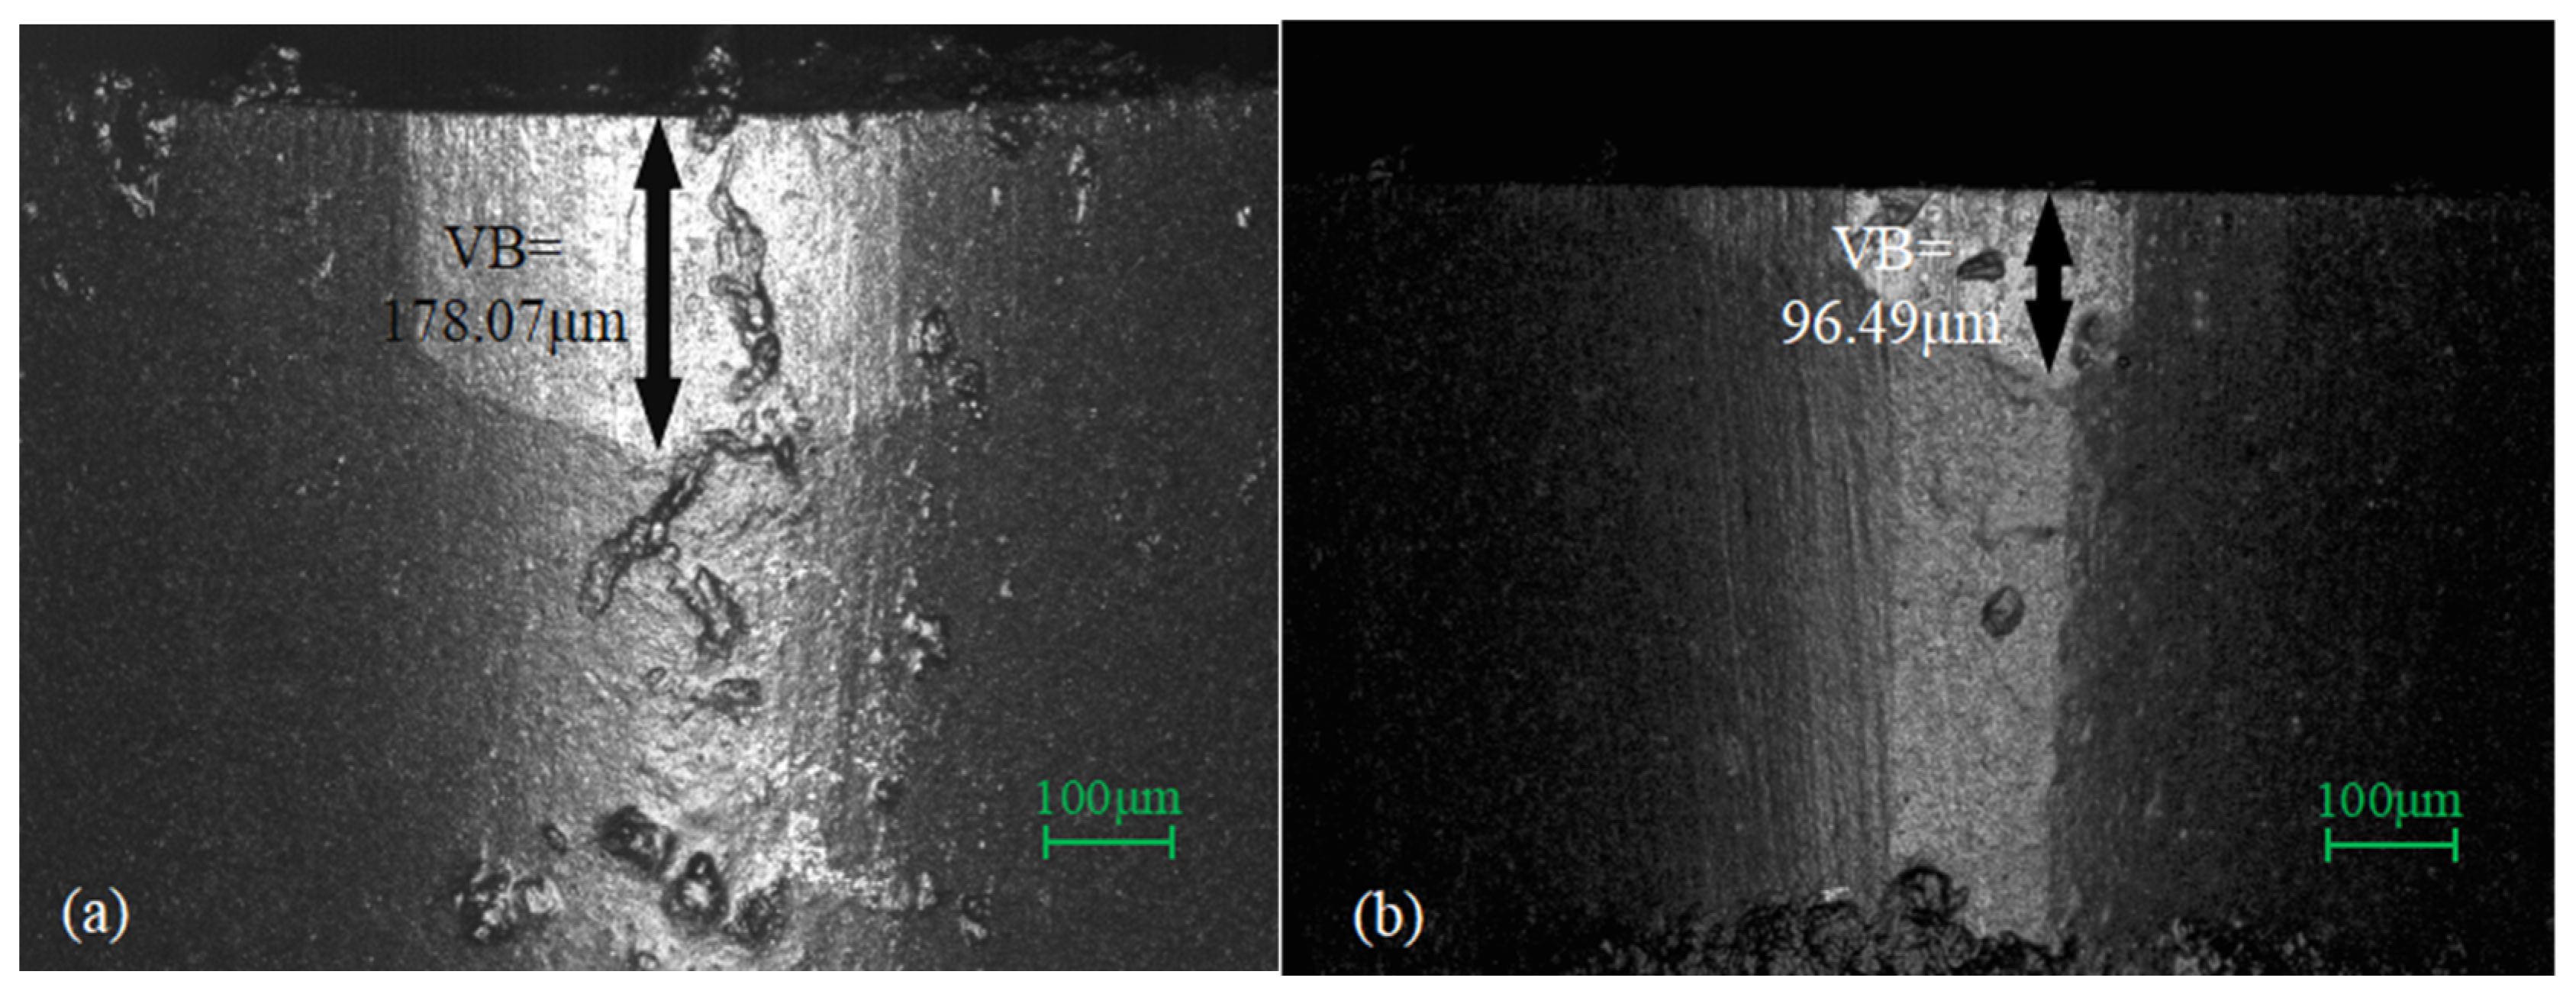
Figure 15 shows the profile of the tool after machining. The flank face of the CT tool exhibits a large area of wear, with the wear zone extending along the cutting edge direction. The tool surface has a significant amount of material adhesion, and the flank face wear VB value is 178.07 μm, as shown in Figure 15a; As shown in Figure 15b, the wear range on the flank face of the LAT tool is significantly decreased, and the width of the wear zone is narrowed. Material adhesion on the tool is also notably reduced. The VB value of the flank face wear is 96.49 μm, representing a 45.81% reduction compared to CT.

4. Conclusions

In order to investigate the influence of laser processing parameters on the local preheating thermal field during the process of LAT of GH 4169, relevant experiments and simulations were carried out. The following conclusions are drawn.
(1) The absorption coefficient of GH 4169 for a 1064 nm wavelength laser decreases with increasing laser power.
(2) Three laser processing parameters (P, D and V) have effects on the peak temperature, and four laser processing parameters (P, D, V and L) have effects on the final preheating temperature, which affects the effectiveness of LAT of GH 4169.
(3) The machining parameter combination suitable for LAT obtained through regression equations and boundary conditions is as follows: P = 13 W, D = 0.08 mm, L = 0.4 mm, F = 0.83 μm/r, n = 600 rpm, ap = 1 μm. Compared with CT, LAT has more stable cutting force, with reductions of 50.46%, 42.82% and 15.04% in the X, Y and Z directions, respectively. The machined surface is also smoother, with surface roughness reduced by 60.37%. Additionally, the tool flank face wear VB value is reduced by 45.81%. LAT significantly reduces cutting forces, suppresses tool wear and lowers surface roughness during the turning of GH 4169, as compared to CT.

Author Contributions

Conceptualization, S.Z., J.X., L.Z., Z.L. and J.Z.; Methodology, S.Z., L.Z., Y.Y. and J.Z.; Validation, S.Z.; Writing—original draft, S.Z.; Writing—review & editing, J.X., L.Z., Y.Y. and J.Z.; Supervision, J.X., L.Z., Z.L. and J.Z. All authors have read and agreed to the published version of the manuscript.

Funding

This research received no external funding.

Data Availability Statement

The original contributions presented in this study are included in the article. Further inquiries can be directed to the corresponding authors.

Conflicts of Interest

Authors Jiwen Xu, Liang Zhao, and Yuqi Yang were employed by the company Shenyang Aircraft Industry (Group) Co., Ltd. The remaining authors declare that the research was conducted in the absence of any commercial or financial relationships that could be construed as a potential conflict of interest.

Abbreviations

The following abbreviations are used in this manuscript:
LATLaser-assisted turning
FEFinite element
CTConventional turning
LAMLaser-assisted machining
PCDPolycrystalline diamond
PLaser power
DLaser spot diameter
LLaser spot–tool edge distance
VLaser spot movement speed
FFeed rate
nSpindle speed
apDepth of cut
TmaxPeak temperature of laser preheating
TAFinal preheating temperature of point A

References

  1. Bartolomeis, A.D.; Newman, S.T.; Jawahir, I.; Biermann, D.; Shokrani, A. Future research directions in the machining of Inconel 718. J. Mater. Process. Technol. 2021, 297, 117260. [Google Scholar] [CrossRef]
  2. Sui, S.; Tan, H.; Chen, J.; Zhong, C.; Li, Z.; Fan, W.; Gasser, A.; Huang, W. The influence of Laves phases on the room temperature tensile properties of Inconel 718 fabricated by powder feeding laser additive manufacturing. Acta Mater. 2019, 164, 413–427. [Google Scholar] [CrossRef]
  3. Hosseini, E.; Popovich, V.A. A review of mechanical properties of additively manufactured Inconel 718. Addit. Manuf. 2019, 30, 100877. [Google Scholar] [CrossRef]
  4. Lu, X.; Du, J.; Deng, Q.; Zhuang, J. Stress rupture properties of GH4169 superalloy. J. Mater. Res. Technol. 2014, 3, 107–113. [Google Scholar] [CrossRef]
  5. An, X.L.; Zhang, B.; Chu, C.L.; Zhou, L.; Chu, P.K. Evolution of microstructures and properties of the GH4169 superalloy during short-term and high-temperature processing. Mater. Sci. Eng. A 2019, 744, 255–266. [Google Scholar] [CrossRef]
  6. Kong, X.; Hu, G.; Wang, J.; Hou, N.; Zhao, M. Surface integrity of laser-assisted turning of the GH4169 alloy. Appl. Opt. 2023, 62, 8–15. [Google Scholar] [CrossRef] [PubMed]
  7. Saleh, B.; Liu, S.; Zhang, L.; Ahsana, N.; Zhao, L. Wear characteristics of GH4169 superalloy at elevated temperatures. Arch. Civ. Mech. Eng. 2025, 25, 39. [Google Scholar] [CrossRef]
  8. Liang, X.; Liu, Z.; Wang, B. State-of-the-art of surface integrity induced by tool wear effects in machining process of titanium and nickel alloys: A review. Measurement 2019, 132, 150–181. [Google Scholar] [CrossRef]
  9. Liao, Z.; Monaca, L.A.; Murray, J.; Speidel, A.; Ushmaev, D.; Clare, A.; Axinte, D.; M’Saoubi, R. Surface integrity in metal machining—Part I: Fundamentals of surface characteristics and formation mechanisms. Int. J. Mach. Tools Manuf. 2021, 162, 103687. [Google Scholar] [CrossRef]
  10. Sarıkaya, M.; Gupta, M.K.; Tomaz, I.; Pimenov, D.Y.; Kuntoğlu, M.; Khanna, N.; Yıldırım, Ç.V.; Krolczyk, G.M. A state-of-the-art review on tool wear and surface integrity characteristics in machining of superalloys. CIRP J. Manuf. Sci. Technol. 2021, 35, 624–658. [Google Scholar] [CrossRef]
  11. Hu, G.; Zhang, M.; Xin, W.; Zhou, S.; Lu, Y.; Lu, J. An Experiment Study on Surface Topography of GH4169 Assisted by Ultrasonic Elliptical Vibration Ultra-Precision Turning. Appl. Sci. 2024, 14, 5515. [Google Scholar] [CrossRef]
  12. Tang, C.; Ye, Y.; Zhang, Y.; Huang, B.; Huang, T.; Zhang, D.; Zhang, X.; Ye, C. Improving surface integrity of GH4169 alloy through magnetic-assisted cutting. Manuf. Lett. 2024, 41, 605–609. [Google Scholar] [CrossRef]
  13. Ma, J.; Cui, E.; Zheng, G.; Li, W.; Cheng, X.; Liu, H. Investigation of the effects of GnP-ZrO2 hybrid nanofluids minimum quantity lubrication (NMQL) on the machinability of GH4169. Int. J. Adv. Manuf. Technol. 2024, 134, 5841–5853. [Google Scholar] [CrossRef]
  14. Liu, Q.; Liu, J.; Ming, Z.; Cui, B.; Wang, J. Research Progress on Laser-Assisted Precision Machining Technology. Micromachines 2025, 16, 173. [Google Scholar] [CrossRef]
  15. Zeng, H.; Yan, R.; Wang, W.; Zhang, H.; Yan, J.; Peng, F. Analytical modeling of the heat-affected zone in laser-assisted milling of AerMet100 steel. Int. J. Adv. Manuf. Technol. 2020, 109, 2481–2490. [Google Scholar] [CrossRef]
  16. Khatir, F.A.; Sadeghi, M.H.; Akar, S. Investigation of surface roughness in laser-assisted hard turning of AISI 4340. Mater. Today Proc. 2021, 38, 3085–3090. [Google Scholar] [CrossRef]
  17. Rao, A.; Tak, M.; Rao, N.; Vallleti, K.; Bathe, R. Investigations on laser-assisted turning of IN625 alloy with hot hardness approach using uncoated and CrAlSiN coated WC tools. Proc. Inst. Mech. Eng. 2024; online first. [Google Scholar] [CrossRef]
  18. Dai, D.; Zhao, Y.; Cao, C.; Dong, R.; Zhang, H.; Liu, Q.; Song, Z.; Zhang, X.; Zheng, Z.; Zhao, C. Experimental Investigation on Process Parameters during Laser-Assisted Turning of SiC Ceramics Based on Orthogonal Method and Response Surface Methodology. Materials 2022, 15, 4889. [Google Scholar] [CrossRef]
  19. Li, Y.; Zhang, Q.; Wang, L.; Chen, J. Mechanism of surface quality formation in laser-assisted turning of Si3N4 ceramics. J. Mater. Eng. Perform. 2025, 34, 1–12. [Google Scholar] [CrossRef]
  20. Wiedenmann, R.; Langhorst, M.; Zaeh, M.F. Computerized Optimization of the Process Parameters in Laser-Assisted Milling. Phys. Procedia 2011, 12 Pt A, 607–616. [Google Scholar] [CrossRef]
  21. Zhai, C.; Sun, G.; Xu, J.; Zhao, B. Numerical simulation of temperature field in C/SiC laser-assisted machining. In Proceedings of the 2021 IEEE International Conference on Manipulation, Manufacturing and Measurement on the Nanoscale (3M-NANO), Xi’an, China, 2–6 August 2021. [Google Scholar] [CrossRef]
  22. Arrizubieta, J.I.; Klocke, F.; Gräfe, S.; Arntz, K.; Lamikiz, A. Thermal Simulation of Laser-assisted Turning. Procedia Eng. 2015, 132, 639–646. [Google Scholar] [CrossRef]
  23. Feng, Y.; Hung, T.-P.; Lu, Y.-T.; Lin, Y.-F.; Hsu, F.-C.; Lin, C.-F.; Lu, Y.-C.; Liang, S.Y. Flank tool wear prediction of laser-assisted milling. J. Manuf. Process. 2019, 43 Pt A, 292–299. [Google Scholar] [CrossRef]
  24. Zhao, B.; Xu, J.; Chen, G.; Zhai, C.; Zhou, F.; Li, J. Study on chip formation and surface integrity of nickel-based superalloy Inconel 718 by laser assisted micro-cutting. J. Manuf. Process. 2024, 113, 34–46. [Google Scholar] [CrossRef]
  25. Wu, X.; Chen, J. The temperature process analysis and control on laser-assisted milling of nickel-based superalloy. Int. J. Adv. Manuf. Technol. 2018, 98, 223–235. [Google Scholar] [CrossRef]
  26. Lu, X.; Xu, K.; Wang, X.; Chen, C.; Zeng, F.; Liang, S.Y. Modeling of laser-assisted micro-milling Inconel718. Precis. Eng. 2024, 88, 854–866. [Google Scholar] [CrossRef]
  27. Kong, X.; Wang, Z.; Liu, X.; Hou, N.; Wang, M. Evolution mechanism of residual stress under the influence of thermomechanical coupling in laser-assisted machining of superalloy GH4169. Int. J. Adv. Manuf. Technol. 2025, 138, 4005–4018. [Google Scholar] [CrossRef]
  28. Xu, J.; Chu, C.; Zhao, Z.; Wang, X. Building of Laser-assisted Micromachining Temperature Field. In Proceedings of the 2015 CSIC International Conference on Computer Science and Intelligent Communication, Zhengzhou, China, 18–19 July 2015. [Google Scholar] [CrossRef]
  29. Zhang, H.; Chen, F.; Li, Z.; Hu, W.; Sun, T.; Zhang, J. Investigation of Laser-Assisted Micro-Milling Process of Inconel 718. J. Manuf. Mater. Process. 2023, 7, 149. [Google Scholar] [CrossRef]
  30. Hsu, C.Y.; Lin, Y.Y.; Lee, W.S.; Lob, S.P. Machining characteristics of Inconel 718 using ultrasonic and high temperature-aided cutting. J. Mater. Process. Technol. 2008, 198, 359–365. [Google Scholar] [CrossRef]
  31. Li, L.; Wu, M.; Liu, X.; Cheng, Y.; Yu, Y. The prediction of surface roughness of PCBN turning GH4169 based on adaptive genetic algorithm. Integr. Ferroelectr. 2017, 180, 118–132. [Google Scholar] [CrossRef]
  32. Pan, L.; Wu, Z.R.; Fang, L.; Song, Y.D. Investigation of surface damage and roughness for nickel-based superalloy GH4169 under hard turning processing. Proc. Inst. Mech. Eng. Part B J. Eng. Manuf. 2019, 234, 679–691. [Google Scholar] [CrossRef]
Figure 1. Experimental setup of the LAT platform: (a) schematic diagram and (b) experimental realization.
Optics 06 00044 g001
Figure 2. Schematic diagram of LAT: (a) laser preheating process and (b) tool cutting process.
Optics 06 00044 g002
Figure 3. Two-dimensional FE model of the laser preheating of GH 4169: (a) laser movement direction and (b) model mesh division.
Optics 06 00044 g003
Figure 4. Platform for laser heating temperature measurement: (a) model mesh division and (b) extraction point position.
Optics 06 00044 g004
Figure 5. Three-dimensional FE model for absorption coefficient calibration: (a) model mesh division and (b) extraction point position.
Optics 06 00044 g005
Figure 6. Iterative process of calibrated absorption coefficients.
Optics 06 00044 g006
Figure 7. Measured temperatures under different laser powers by experiments and FE simulations.
Optics 06 00044 g007
Figure 8. Temperature extraction position during laser preheating process.
Optics 06 00044 g008
Figure 9. Simulation results of the (a) peak and (b) final preheating temperatures under different laser powers.
Optics 06 00044 g009
Figure 10. Simulation results of the (a) peak and (b) final preheating temperatures under different laser spot diameters.
Optics 06 00044 g010
Figure 11. Simulation results of the (a) peak and (b) final preheating temperatures under different laser spot movement speeds.
Optics 06 00044 g011
Figure 12. Simulation results of the final preheating temperatures under different laser spot–tool edge distances.
Optics 06 00044 g012
Figure 13. Cutting force of (a) CT and (b) LAT of GH 4169.
Optics 06 00044 g013
Figure 14. Surfaces and scan topographies of GH 4169: (a) original, (b) post-machining, (c) CT morphology, (d) LAT morphology, (e) CT scan and (f) LAT scan.
Optics 06 00044 g014
Figure 15. Profile of cutting edge after (a) CT and (b) LAT of GH 4169.
Optics 06 00044 g015
Table 1. Product parameters for the continuous fiber laser.
ManufacturerModel NumberPower Output Range
W
Power StabilityWavelength
nm
Operating Mode
IPG, New York, NY, USAYLM-100-AC0–100±1%1064Continuous
Table 2. Material parameters of GH 4169.
Temp
°C
Conductivity
mW/(mm × °C)
Density
×10−9 Toone/mm3
Young’s Modulus
MPa
Poisson’s RatioExpansion
×10−5/°C
Specific Heat
×108 mJ/(Ton × °C)
2013.48.242.100.31.184.51
20015.91.921.304.82
30017.8 1.354.87
40018.31.851.414.92
50019.6 1.445.14
60021.21.731.485.39
70022.8 1.545.73
80023.61.541.706.15
90027.6 1.846.57
Table 3. Processing parameters for laser heating temperature measurement.
SerialP
W
D
mm
θ
°
t
s
1101605
220
330
Table 4. Laser heating temperature measurement results.
SerialMeasurement Results
°C
130.3
240.7
350.9
Table 5. Absorption coefficients calibration results.
SerialAbsorption Coefficient
10.189
20.175
30.171
Table 6. Experimental scheme of single-factor simulation experiment.
SerialP
W
L
mm
D
mm
V
mm/s
11010.21204.28
2200.21204.28
3300.21204.28
4100.11204.28
5100.051204.28
6100.2963.40
7100.2722.57
8100.2481.71
9100.2240.86
Table 7. Experimental scheme of comparison experiment.
SerialP
W
D
mm
L
mm
F
μm/r
n
rpm
ap
μm
CT---0.836001
LAT130.080.40.836001
Disclaimer/Publisher’s Note: The statements, opinions and data contained in all publications are solely those of the individual author(s) and contributor(s) and not of MDPI and/or the editor(s). MDPI and/or the editor(s) disclaim responsibility for any injury to people or property resulting from any ideas, methods, instructions or products referred to in the content.