Article

Growth and Properties of (Yb-Er) Co-Doped ZnO Thin Films Deposited via Spray Pyrolysis Technique

1
Ecole Normale Supérieure (ENS)-Physics Department, Mohammed V University, Rabat 5118, Morocco
2
Materials and Nanomaterials for Photovaltaic conversion and and Electrochemical Storage (MANAPSE), Faculty of Sciences, Mohammed V University, Rabat 1014, Morocco
3
Group of Semiconductors and Environmental Sensor Technologies, Energy Research Center, Faculty of Science, Mohammed V University, Rabat 1014, Morocco
4
Institute of Physics and Chemistry of Materials of Strasbourg, University of Strasbourg, 67200 Strasbourg, France
*
Author to whom correspondence should be addressed.
Optics 2025, 6(2), 14; https://doi.org/10.3390/opt6020014
Submission received: 7 October 2024 / Revised: 3 November 2024 / Accepted: 15 November 2024 / Published: 3 April 2025
(This article belongs to the Special Issue Optoelectronic Thin Films)

Abstract

:
YbxEryZnO thin films with a low concentration (x = 5%, y = 0, 1, 3%) were made on glass substrates using the spray pyrolysis method. The films were characterized through the use of specific techniques to investigate their structural, optical, and electrical properties. The XRD structural analysis of the films revealed that they are polycrystalline with a hexagonal wurtzite structure and a preferential orientation in the (002) direction. The optical characterization of the co-doped layers in the range of 200 to 800 nm revealed that co-doping had a significant impact on the values of transmission. A well-defined peak in the infrared domain centered around 980 nm was observed in photoluminescence measurements. This peak signifies the transition between the electronic levels 2F5/2 (ground state) and 2F7/2 (excited state), proving that photons are efficiently transferred between the ZnO matrix and the Yb3+ ion. All layers exhibited n-type conduction and an electrical resistivity decrease to 6.0 × 10⁻² Ω cm according to Hall effect measurements at room temperature.

1. Introduction

Zinc oxide is a type II-VI transparent semiconductor compound with n-type natural conductivity, which can be assured by defects related to interstitial zinc atoms and oxygen vacancies. Its notable properties, including a gap width in the order of 3.37 eV at 300 K, a high cohesion energy of 1.89 eV [1], a high optical gain (300 cm−1) [2], a high mechanical stability [3,4], a high exciton binding energy (60 meV) [5], and its photon transparency with wavelengths in the visible range (400–800 nm), make it a material that competes with other oxides in the technology application market. Zinc oxide (ZnO) thin films have been of considerable importance in various fields of research in recent years because of their many potential applications in optoelectronics, such as in gas detectors [6], transparent conductive electrodes in photovoltaic cells [7], and photodegradation and energy storage [8]. Despite extensive research into pure ZnO, there is growing interest in enhancing its properties through doping with rare earth elements.
The doping process can result in either n-type or p-type conductivity, depending on the valence of the dopants, implant sites, acceptors, or donors. The insertion of a significant amount (>0.5%) of foreign elements into the crystal, which will be the host matrix (in this case, ZnO), has several important consequences, including the modification of optoelectronic properties when doping with Tb [9], Al, Ga [10], F [11], Eu [12], Er [13], and Yb [14].
The use of rare earth elements as dopants aims to improve the optical properties of ZnO. In the case of photovoltaic solar cells, ZnO doped by rare earth elements is likely to provide better absorption of the solar photons lost through the conventional photovoltaic cell due to thermalization or transparency. The explanation for this may come from the fact that the 4f layer of rare earth is not completely filled, so it seems that the unoccupied levels of the 4f layer may be responsible for the luminescence properties in the visible or infrared region.
Co-doping ZnO with rare earth elements such as ytterbium (Yb) and erbium (Er) offers a promising approach to tuning its properties. Rare earth dopants can introduce new energy levels within the ZnO bandgap, potentially enhancing its luminescence, modifying its electronic behavior, and enabling novel functionalities. While previous studies have explored various doping elements, the co-doping of ZnO with low concentrations of Yb and Er remains relatively underexplored. According to the literature, co-doping with (Yb-Er) was carried out according to several different methods of elaboration and at high temperatures [15,16]. Therefore, the idea is to experiment with this co-doping at a temperature not exceeding 350 °C to confirm or deny its functionality in the ZnO matrix under such elaboration conditions.
In this work, we focus on the deposition of YbxEryZnO thin films using the spray pyrolysis method due to its simplicity, low cost, ease of adding doping materials, and the ability to modify the films’ luminescent properties by altering the composition of the starting solution. This method can also provide encouraging results for uniform large-area coatings for solar cell applications and optoelectronic devices. Our study is unique in its investigation of low dopant concentrations and its comprehensive analysis of the resulting structural, morphological, optical, and electrical properties. The novelty of this research lies in its detailed examination of how low levels of Yb and Er co-doping impact the properties of ZnO, potentially leading to new insights and applications. Understanding these effects could pave the way for improved ZnO-based devices and contribute to the broader field of semiconductor materials.
By addressing these aspects, this study aims to provide valuable information on the design and optimization of ZnO thin films for advanced technological applications.

2. Experimental Details

YbxEryZnO films were prepared using the spray pyrolysis technique on Silica glass substrates (SiO2). The preparation of the solution involved dissolving the precursors in distilled water at room temperature. We dissolved Zinc Acetate (Zn(CH3COO)2, 2H2O) (Sigma-Aldrich 99.9%, St. Louis, MO, USA) (molar concentration C = 0.05 mol/L) and Ytterbium Chloride Hexahydrate (YbCl3, 6H2O) (Sigma-Aldrich 99.9%, St. Louis, MO, USA) with a fixed concentration of x = 5% and Erbium Chloride Hexahydrate (ErCl3, 6H2O) (Sigma-Aldrich 99.9%, St. Louis, MO, USA) with two different molar ratios of Er (y = 1% and 3%) in 200 mL of distilled water. Subsequently, these compounds were in the solid state but were soluble in water. To increase their solubility in the solution and to eliminate any potential precipitation, a few drops of acetic acid were added and stirred magnetically for 30 min at room temperature. After cleaning the glass substrate with ethanol and distilled water, it was then dried under nitrogen gas flow before deposition. After putting the substrate on a ceramic heating plate, the temperature was gradually increased until it reached the deposition temperature. The solution flow rate was fixed at 2.6 mL/min, and all films were deposited at 350 °C for 30 min.
The films were examined with an X-ray diffractometer (XRD, Malvern Panalytical, Almelo, The Netherlands) (X’Pert Pro) (Cu Kα radiation, λ = 0.154056 nm) to determine their phase purity and crystallinity. This diffraction model involves estimating the intensity diffracted by displacing the sample and detector at the same time, with angles of θ and 2θ (using the Bragg–Brentano geometry (θ–2θ)) with a pitch of 0.05° using an integration time of 20 s. A Transmission Electron Microscope (TEM) (JEOL Ltd., Hillsboro, OR, USA) was used to examine the shape of the particles of Yb co-doped Er-ZnO (EYZO) thin films with a point-to-point resolution of 0.19 nm. An energy dispersion X-ray spectroscopic (EDS) (JEOL JSM-6700F, Akishima, Japan) system was employed to determine the compositional analysis of the selected areas. The EDS X-ray detector (JEOL Ltd., Hillsboro, OR, USA) determines the proportion of X-rays that are emitted in relation to their energy range of 0–10 keV. The detector is a solid-state device made of lithium-drifted silicon. At normal incidence in wavelengths between 300 and 1000 nm with an accuracy of 0.08 nm in the UV-Vis region, the Lambda 900 UV/VIS/NIR (Perkin Elmer, Waltham, MA, USA) spectrometer measures the spectral optical transmission. We employed a double-beam recording spectrophotometer that has the ability to operate in either transmission mode or reflection mode. It is made up of three main elements: the radiation source, the sample holder, and reference. Photoluminescence (PL) measurements were made at room temperature and a 355 nm excitation line was used in a frequency-tripled neodymium-doped yttrium aluminum garnet Nd-YAG laser (HORIBA, Kisshoin, Minami-ku, Kyoto, Japan). The electrical properties of the films were evaluated at room temperature by utilizing an ECOPIA Hall effect (Ecopia Semiconductor, Suwon, Republic of Korea) measurement system.

3. Results and Discussion

3.1. Micro-Structural and Morphological Properties

Figure 1 presents the undoped and co-doped X-ray diffraction pattern for different percentages of erbium (EYZO). The XRD pattern of the YbxEryZnO thin films shows prominent peaks at 31.77°, 34.42°, and 36.23°, which correspond to the (100), (002), and (101) planes of the wurtzite ZnO structure, as referenced in JCPDS card 89-1397 [17]. The observed peaks all align closely with the standard positions, confirming that the doped ZnO films maintain the wurtzite crystal structure. The XRD technique’s detection limit does not reveal any impurity phase, so it is possible that Er3+ and Yb3+ were introduced to the ZnO host, or that amorphous Er2O3 and Yb2O3 were produced. The growth of the peaks (101) and (100) is clearly visible in the co-doped layers. The general trend that is extracted from this effect is that we observe an impact of co-doping on the crystallinity of the layers. The (002) direction is the preferred orientation for all films, although the directions (001) and (002) coincide, as shown by peak intensity analysis. The increase in intensity peaks (100) and (103) in the EYZO films, as shown in (Figure 1), compared to the undoped ZnO films indicates changes in crystallographic orientation. This can be interpreted as follows: Increased orientation: The additional peaks suggest that the co-doping with Er and Yb influences the crystallographic alignment of the ZnO matrix. This could be due to the introduction of new phases or changes in the crystal growth dynamics driven by the co-dopants. Orientation effects: The presence of these new peaks could also imply enhanced preferential orientation or alignment of the ZnO grains due to the presence of Er and Yb. This aligns with the idea that the co-dopants are not simply substituting into the lattice but are affecting the overall crystallographic structure.
This result is attested and proved by the study of the coefficient of texture Tc (hkl) [18]. Undoped and co-doped ZnO films have different Tc (002) values, as reported in Table 1. Also, we notice a decrease in the peak relative to the orientation (001) in comparison with the undoped one; however, it remains constant after co-doping. The addition of erbium may reduce the crystal mesh [19]. On the other hand, the parameter c does not follow any trend. RBS measurements [20] will have to be made to confirm the preferential presence of Er, either in interstitial or substitution.
The average crystallite size was calculated from the FWHM (full width at half maximum) of the peak (002) [21]. After co-doping Er and Yb, the size decreased from 76 nm to 28 nm according to the values obtained. The comparison of D values shows that co-doping has a real influence on this value. Note that the size values considered are approximately constant, which tends to confirm the assumption of a very close shape. To enhance the assessment of film quality, we calculated the coefficient of layer dislocation density δ [22]. In contrast to the grain size behavior, the lattice deformation increased during co-doping. This effect creates several imperfections, namely, the coefficient of dislocation density (δ), the values of which are given in Table 1. Therefore, network deformation can be produced in large quantities when the films have a high concentration of defects.
Table 1. Different structural parameters for the different layers (ZnO-Yb-Er).
SamplesD (nm)Tc
(002)
δ
(Lines·µm−2)
a
(nm)
c
(nm)
Ref
Undoped ZnO 762.71730.32620.5201This work
5% Yb 833.5 0.32600.5202[23]
1% Er2713700.32550.5265[24]
5% Yb_1% Er 281.6 1270 0.31870.5204This work
5% Yb_3% Er 281.6 1270 0.31880.5207This work
The in-plane lattice constant of Er- and Yb-doped ZnO (EYZO) films is found to be smaller than that of undoped ZnO, despite the larger atomic sizes of Er and Yb compared to Zn. Er and Yb may be substituting Zn in the lattice. Although these dopants possess larger atomic radii, they could exist in different oxidation states or adopt distinct coordination environments, leading to lattice contraction instead of expansion [16]. Studies have shown that rare earth dopants can influence the lattice parameters through substitutional mechanisms [25]. The reduced lattice constant may also indicate a high level of doping efficiency, where the dopants are incorporated in a way that induces local distortions and contraction within the lattice. This effect can arise from differences in charge states or the formation of complex defects that alter the structural integrity [26]. Enhanced doping efficiency has been linked to the modification of electronic properties and local lattice distortions in doped semiconductors.
The TEM micrographs (Figure 2) reveal that the grains agglomerate to form hexagons and spheres inserted in the hexagons. More in-depth investigation is needed to understand the mechanism of agglomeration. The structure of Er-doped ZnO films has a significant impact on their photoelectric properties, as demonstrated by the testing and analysis of their surface topography [27]. The particle size of the co-doped ZnO films varies between 9 nm and 11 for ZnO: 5% Yb_1% Er and ZnO: 5% Yb_3% Er, respectively. In special cases, the crystallite size and particle size may be the same, but in most cases, the crystallite size is not equal to the particle size. Then, after XRD or TEM analysis, we can usually say whether each particle could be amorphous, single crystalline, or polycrystalline. This aggregation is characterized by the visible clumping of particles rather than a uniform distribution. This phenomenon may be attributed to several factors: deposition temperatures and solution concentrations during the spray pyrolysis process can promote particle coalescence. Additionally, the introduction of Yb and Er may alter the surface properties of the ZnO particles, potentially increasing their tendency to aggregate.
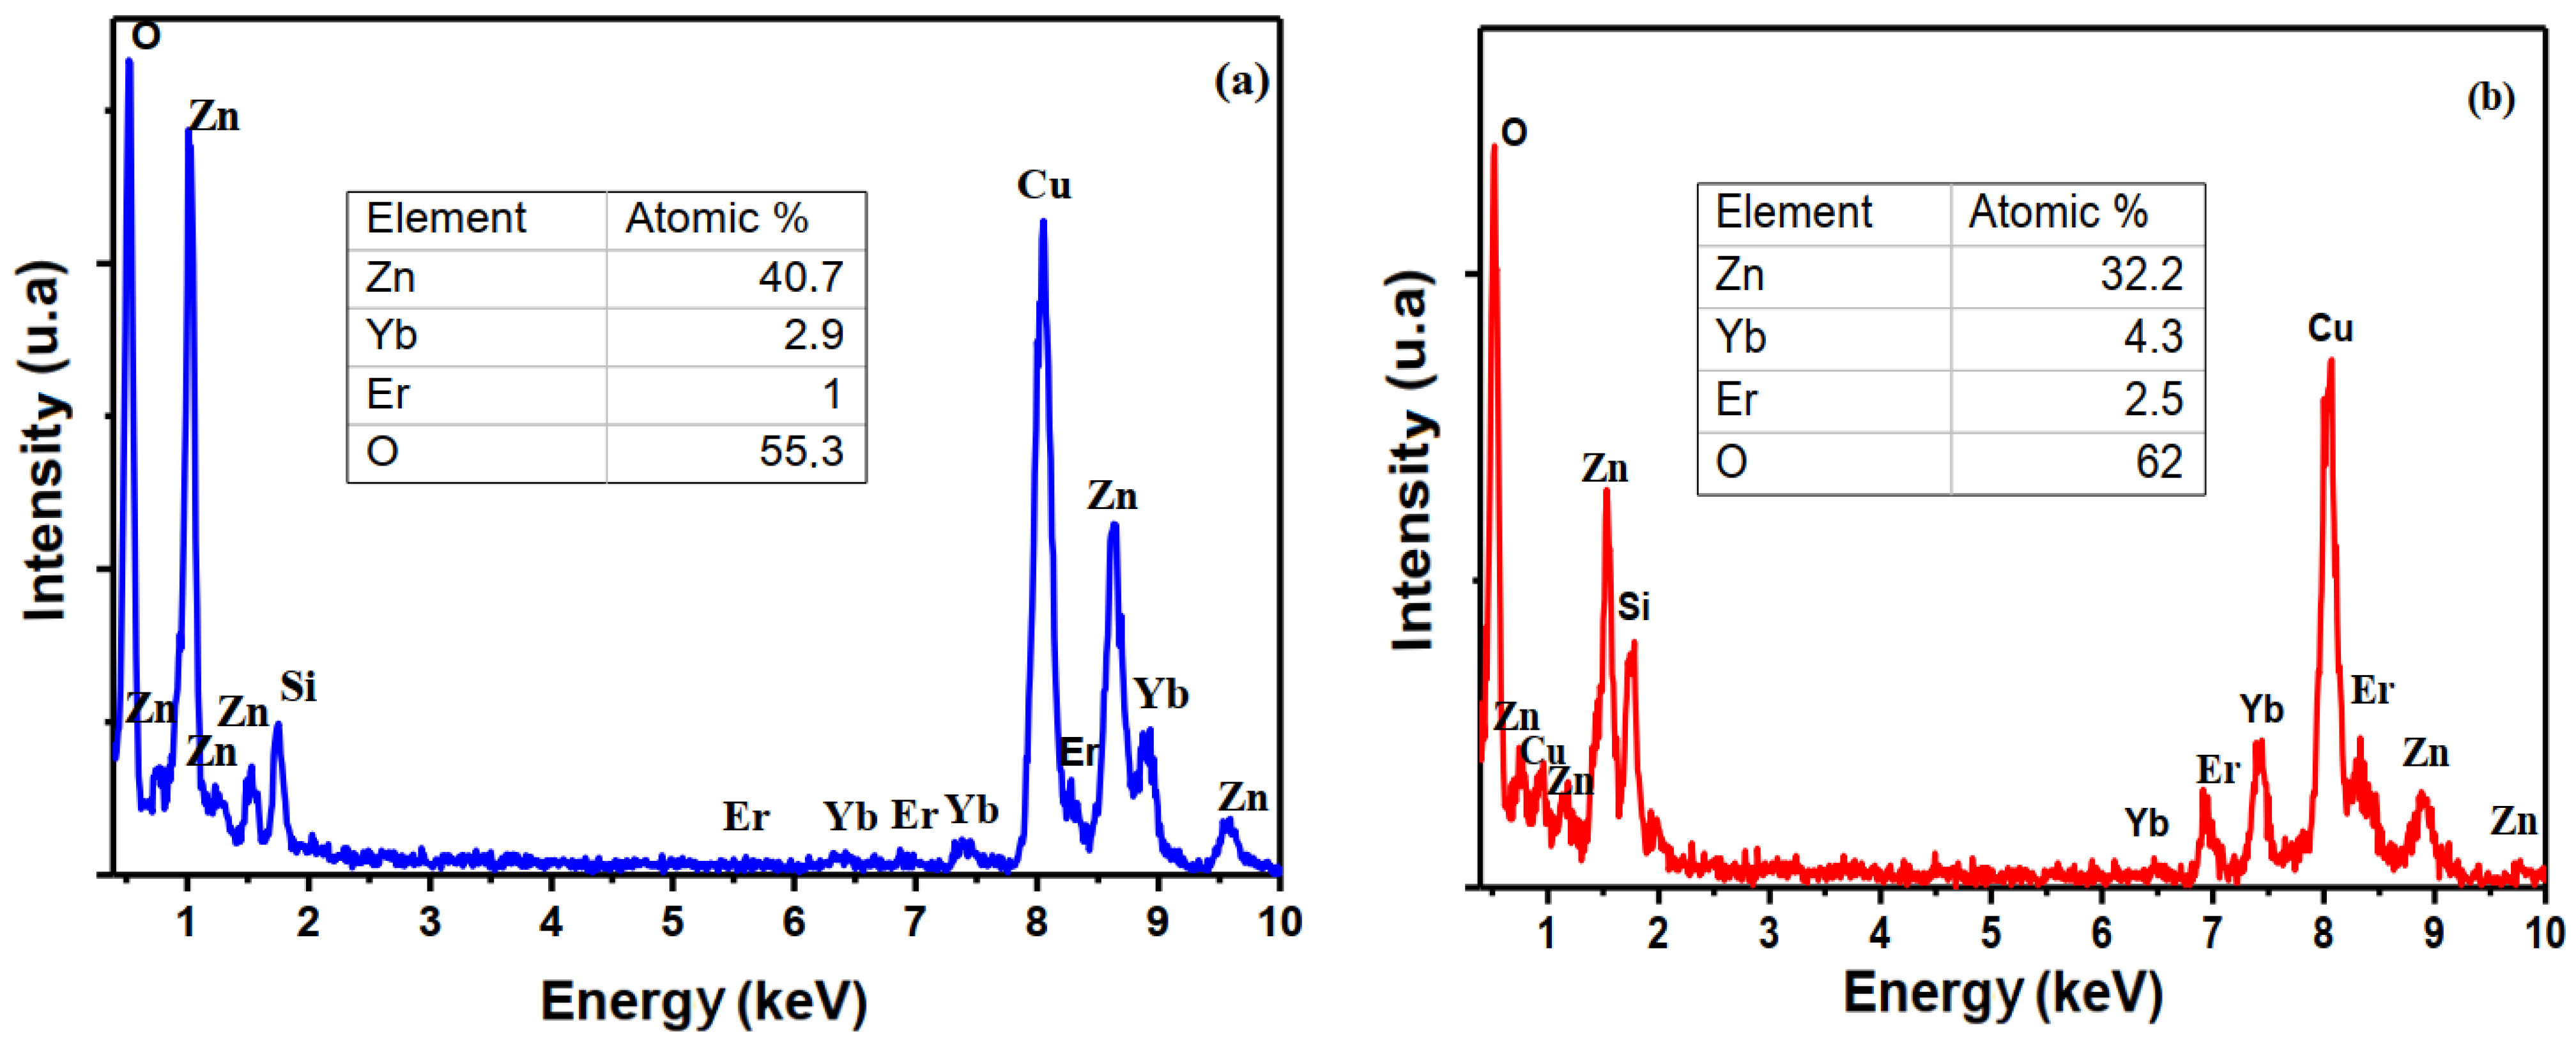
Figure 3 displays the EDS spectrum for co-doped thin layers, with varying levels of Er. The presence of various constituent films, such as oxygen, zinc, ytterbium, and erbium, as well as some impurities such as silicon and copper, can be seen in these spectra. This study’s main objective is to compare the concentration of dopants in the starting solution with the concentration obtained after deposition. In the tables included in the figures above, we report the percentages of Zn, O, Er, and Yb obtained through this analysis. The detection limit of EDS in TEMs is practically about ~0.5 atomic % for most elements. When compared to the nominal value and the percentage values of Er and Yb, the concentrations are slightly understated. According to the EDS studies, the ratio [Zn]/[O] is less than 1. This indicates that zinc oxide sis not form stoichiometrically with a lack of zinc and, therefore, an excess of oxygen, and this could show that Er and Yb were in the form of oxides in the ZnO film on the one hand, and part of it is due to the glass substrate (SiO2) on the other hand.

3.2. Optical Properties and Photoluminescence

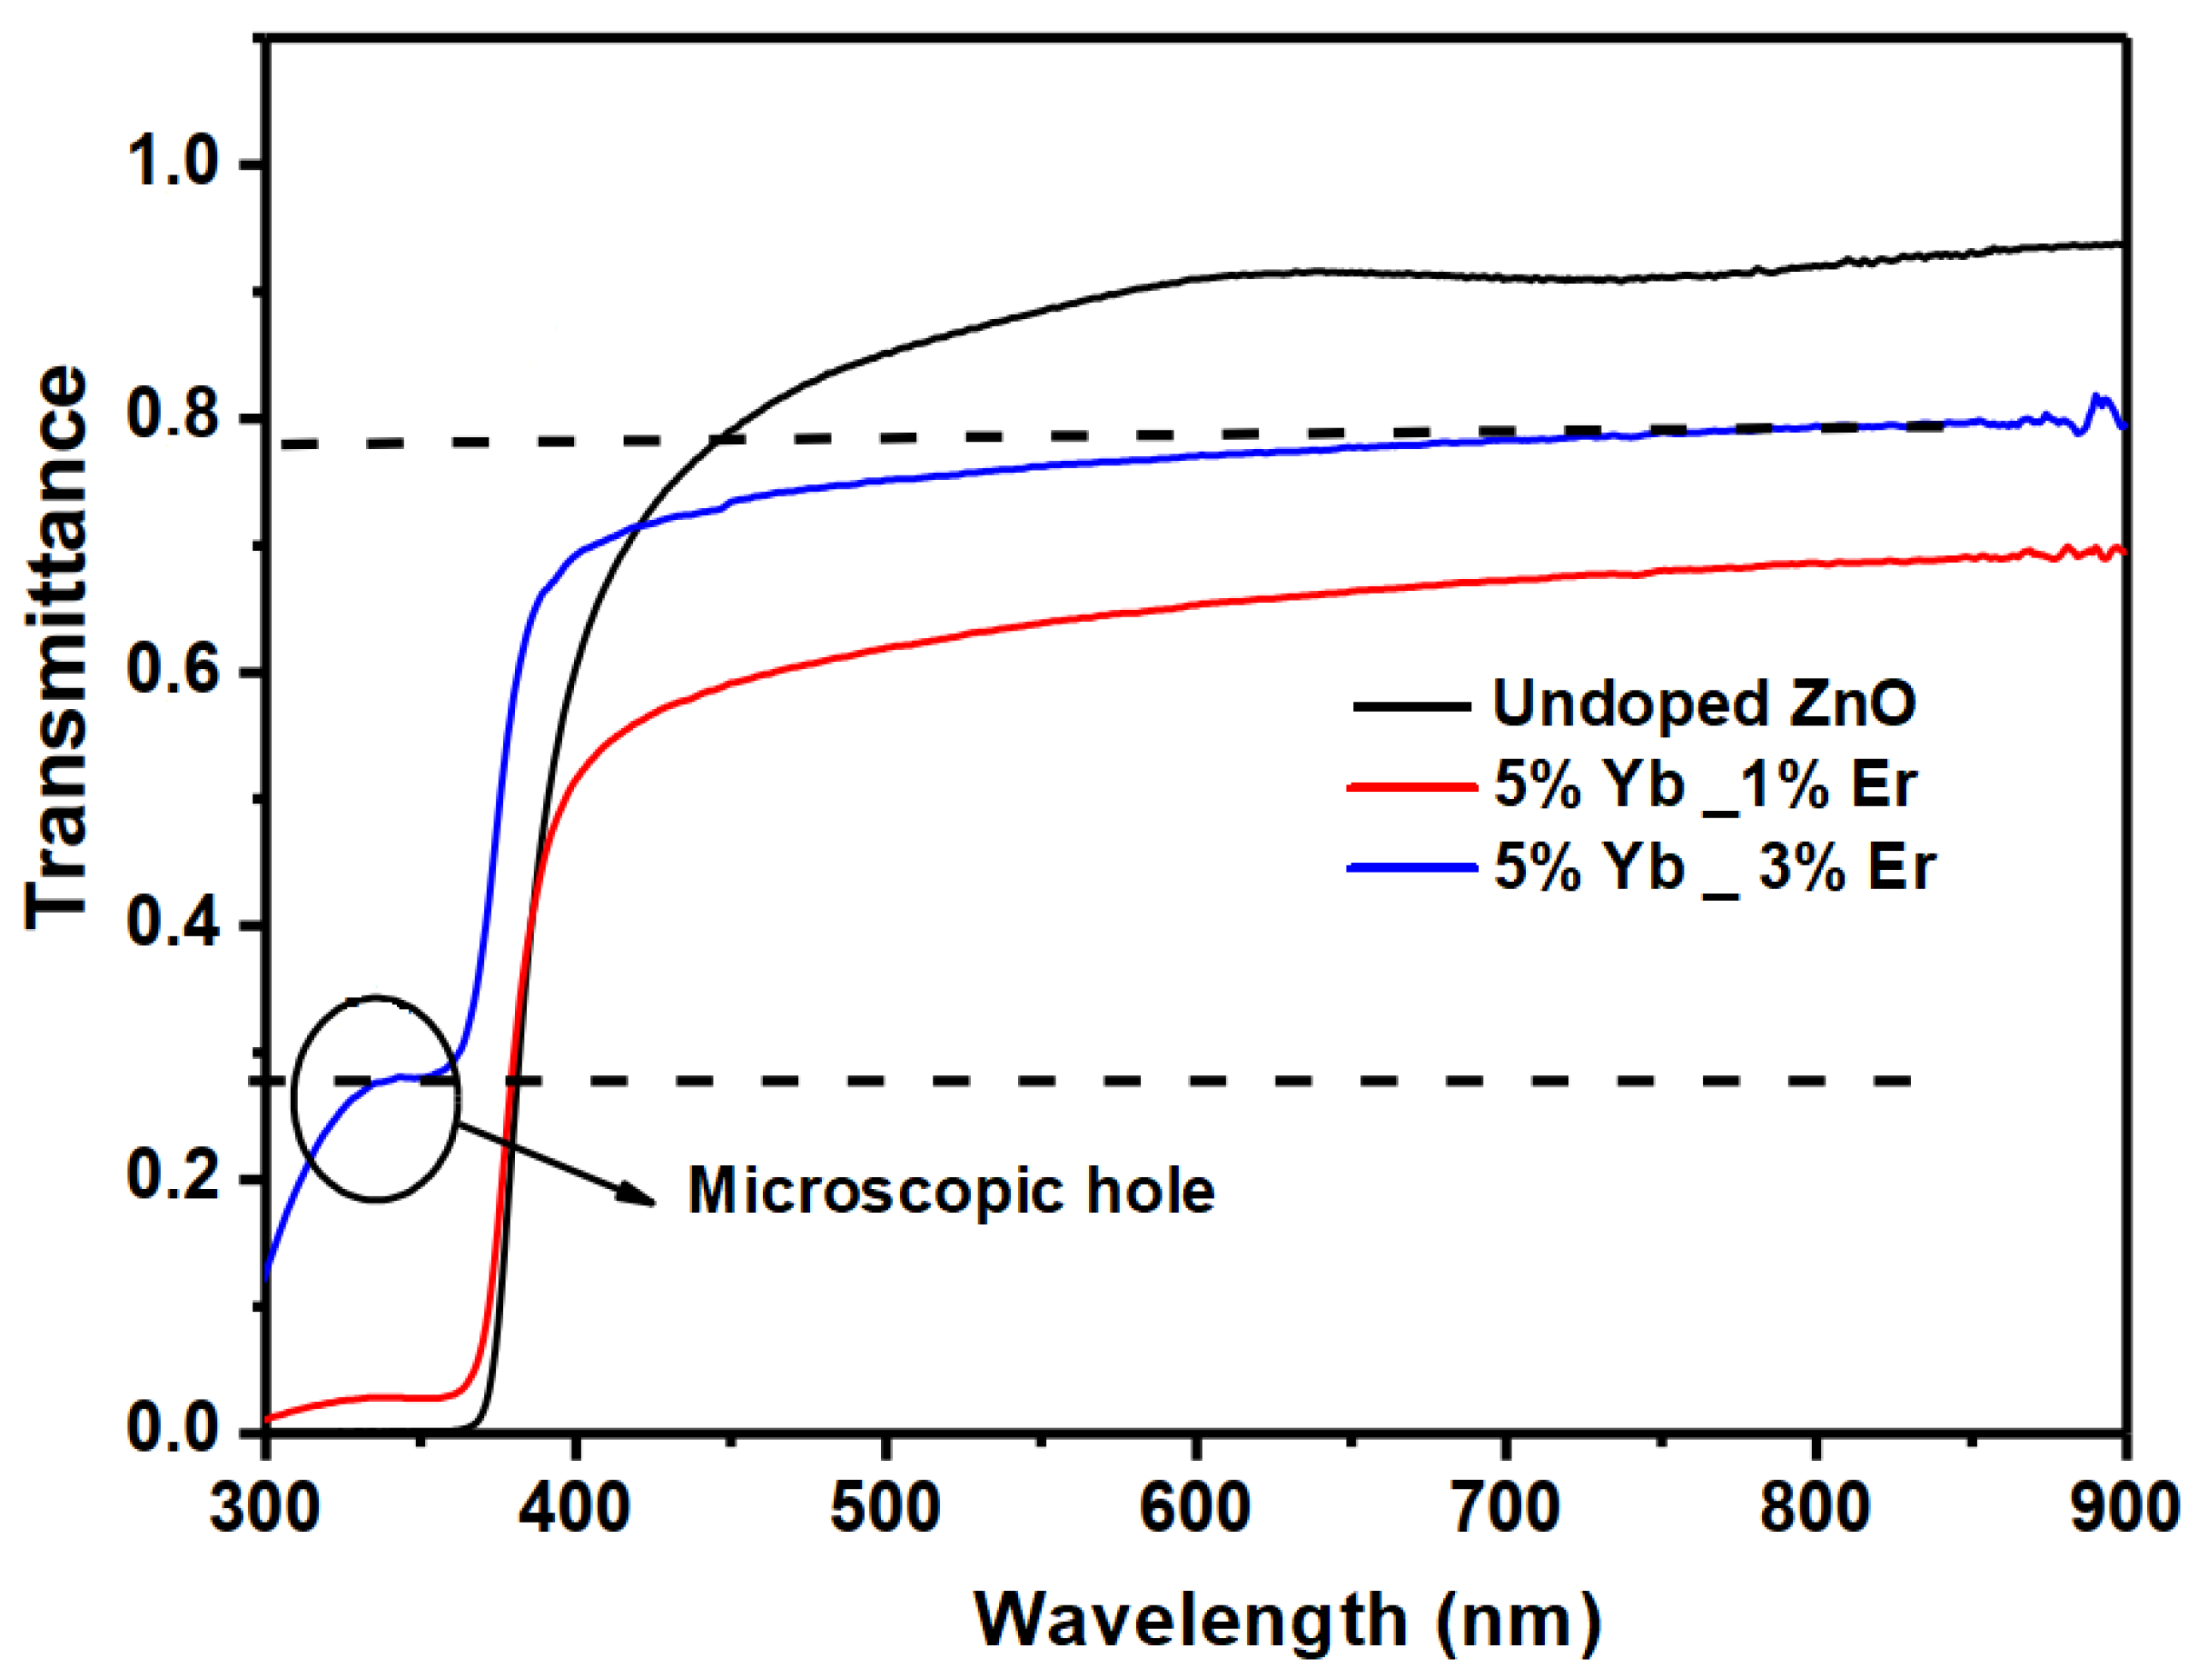
Figure 4 shows the optical transmission spectra of ZnO (Yb-Er) thin films. We find that all layers of EYZO have an optical transmission that varies between 66% and 79% when the concentration of erbium increases. The marked decrease in transmission for λ < 500 nm is related to the increase in absorption in this region. We note that the fraction in the absorption edge is abrupt and shifts to short wavelengths as the Er concentration increases. This displacement of the absorption edge is normally related to the difference in the optical gap of the layers. Porosity, defined as the void fraction in the volume of the porous layer [28], depends on the deposition temperature–deposition time. It is seen in Figure 4 that the ZnO layer: 5% Yb-3% Er has a bump in the area of high absorption. The shape of this transmission pattern is attributed to that of a porous layer [29]. The conclusion that we can draw is the existence of a microscopic pore; this result can be analyzed using the BET method (Brunauer, Emmett and Teller) [30] and controlled via annealing.
As we have seen, the characterization of the films produced by UV–visible spectro-photometry led us to notice that all the films have an optical transmission varying between 66 and 79% in the visible region. The best result is given by the ZnO layer: 5% Yb-3% Er. We used transmission measurements to estimate the value of the bandgap [31], the values of which are given in Table 2. The Eg values thus obtained are slightly different. There is a possibility that the disorder may be due to the defects in the ZnO matrix caused by the co-doping of different ionic radii by different elements (Yb and Er).
Overall, co-doping with rare earth elements causes a slight decrease in transmission, which is distinguished by a change in the absorption profile. This modification may be due to oxygen deficiency or hybridization of the rare earth 4f orbitals with the 2p oxygen or 3d Zn2+ orbitals [32]. The first hypothesis seems more likely, if we rely on measurements of photoluminescence. This decrease is accentuated when co-doping with (Yb-Tb) [32]. The displacement of the transmission spectrum is the result of variation in the optical gap, which is related to the rate and types of dopants. These optical gap values are related to transitions of band tails in the forbidden band. Exceptional behavior is seen in the spectrum of the ZnO thin film: 5% Yb–3% Er, which shows a lump in the zone of strong absorption. This can be explained by the presence of a microscopic hole [33].
According to Behra and Asharya [34], photoluminescence is frequently used to detect energy levels that indicate defects in the ZnO matrix. During a photoluminescence experiment, the samples were excited with a continuous laser with a wavelength of 355 nm. We chose this wavelength because we wanted to highlight the indirect excitation phenomena via the ZnO matrix; the latter absorbs strongly at 379 nm. To do this, we took care to choose a wavelength not resonant with rare earth ions to avoid direct excitation. PL measurements in the UV–visible domain were performed at room temperature for samples of undoped and co-doped ZnO (Yb/Er).
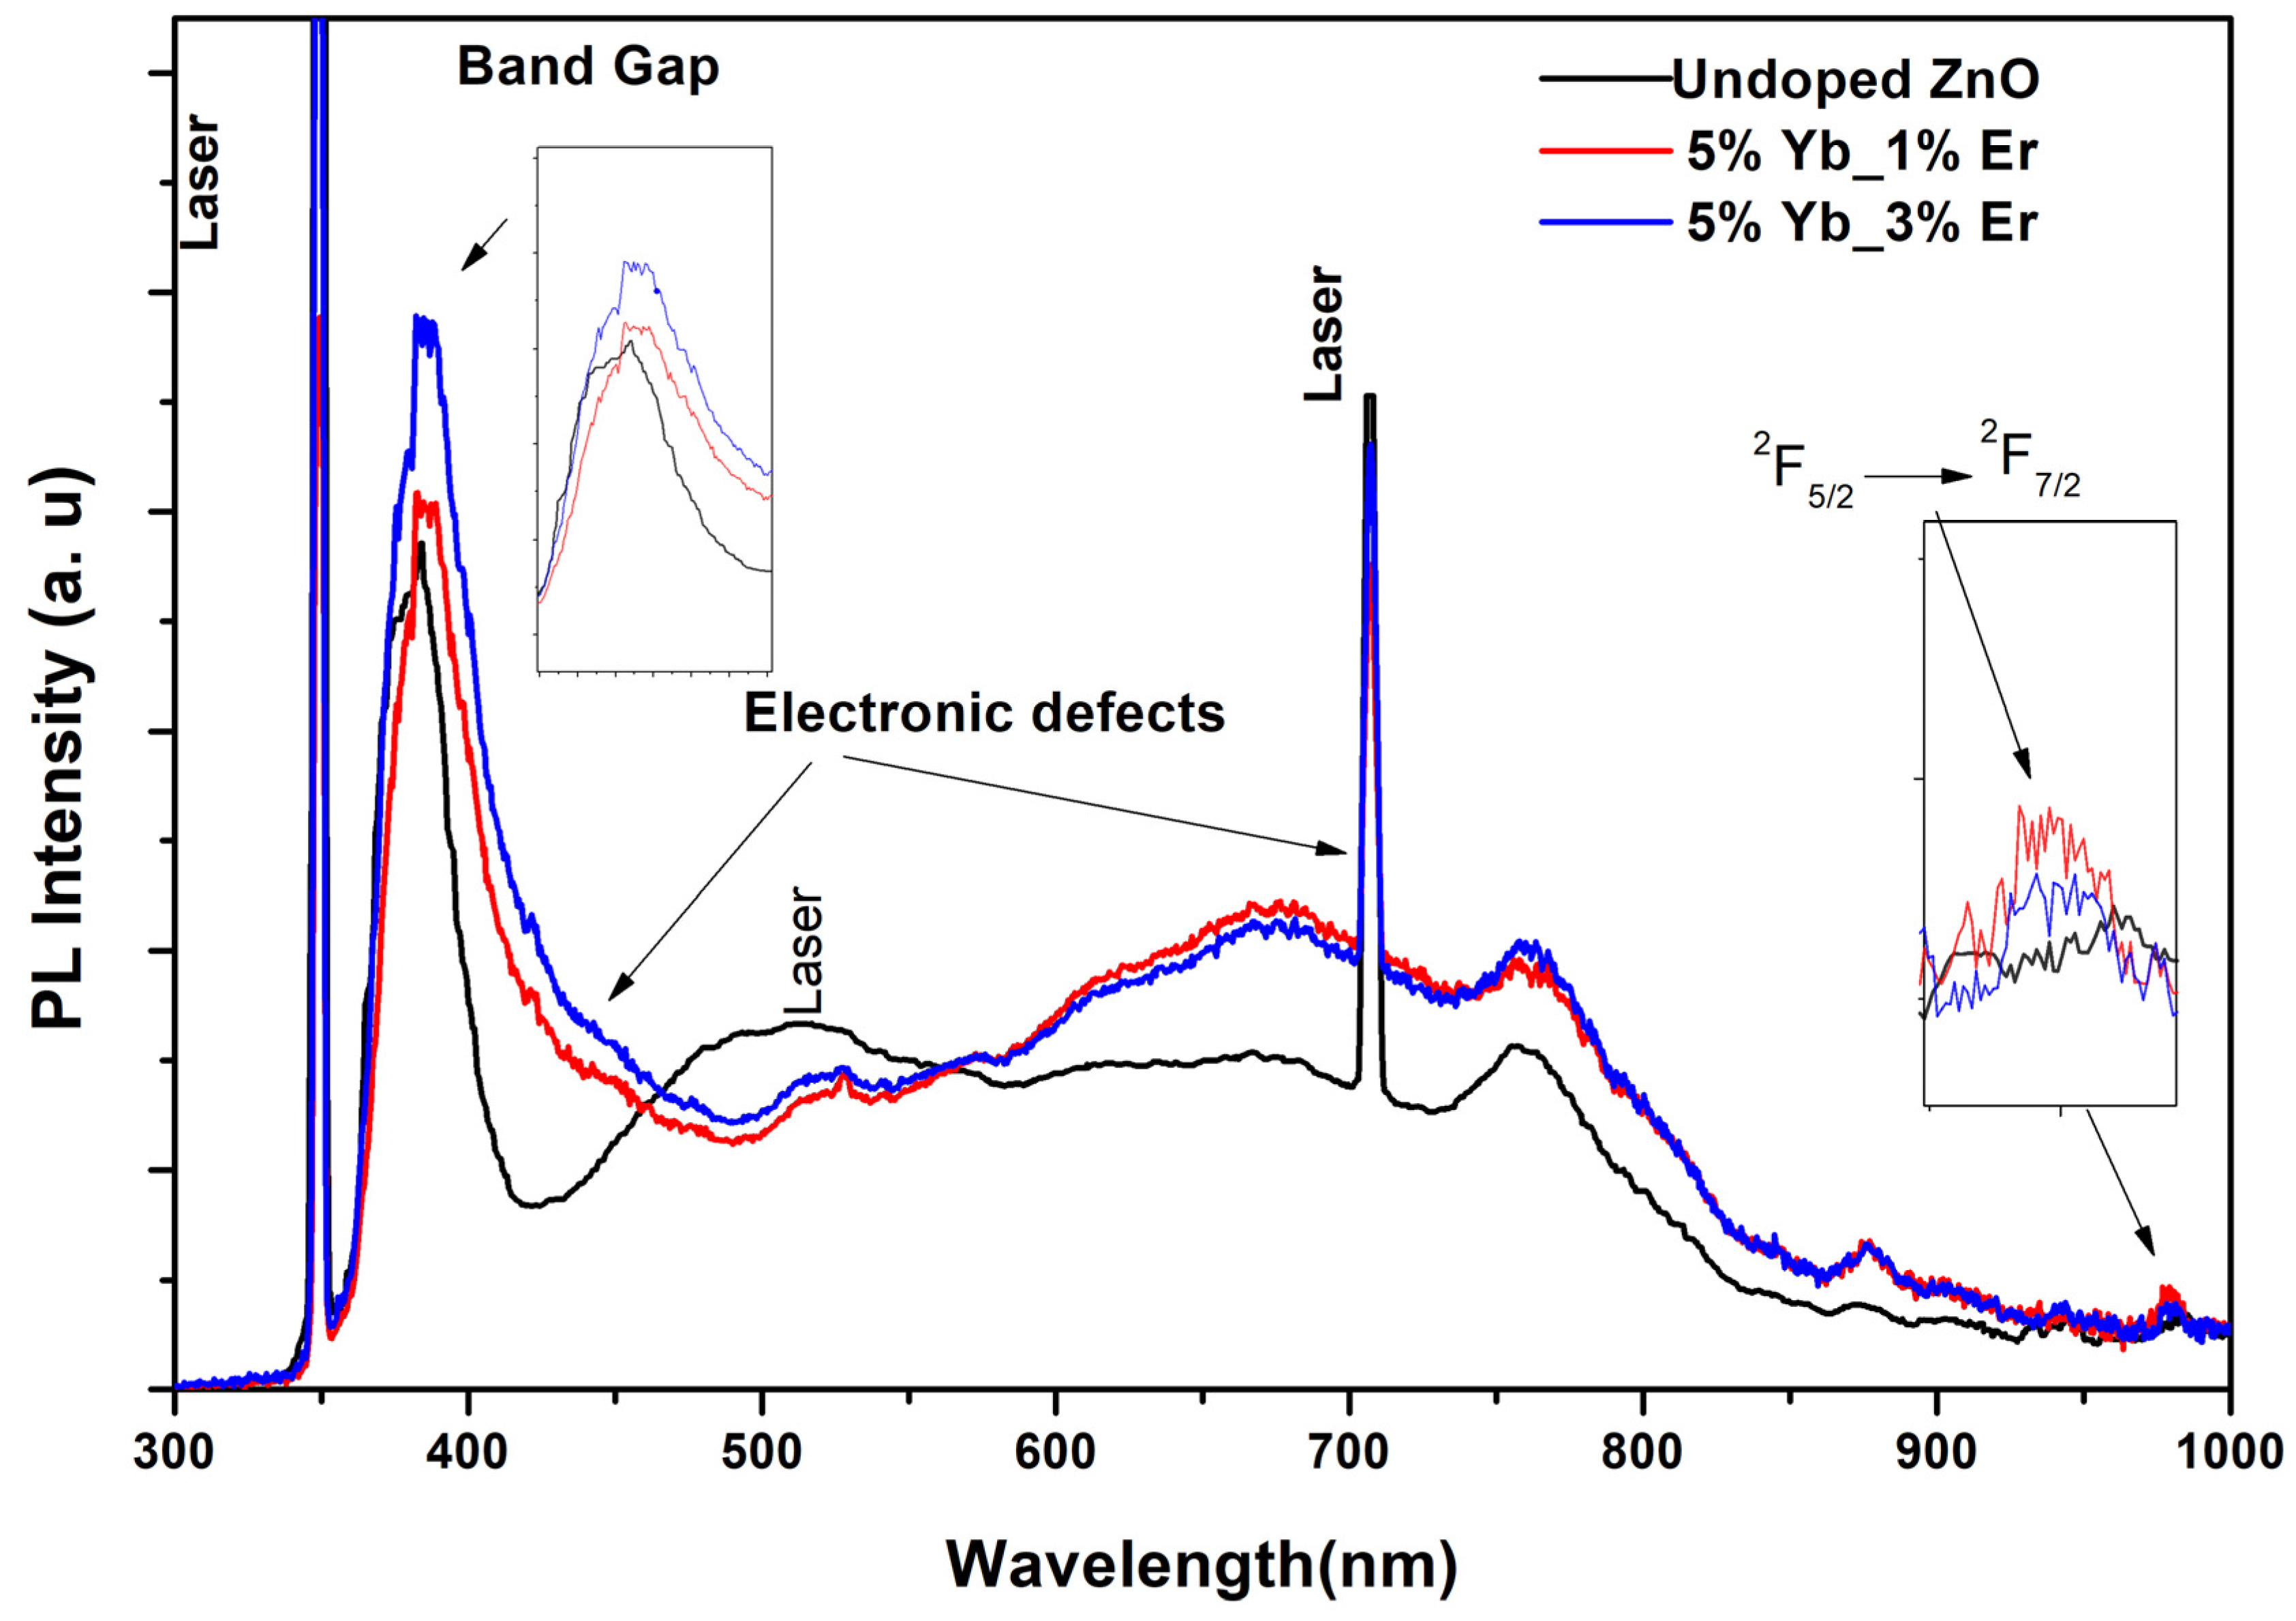
These measurements were carried out using a Nd-YAG laser (Neodymium-doped Yttrium Aluminum Garnet) with a wavelength of 1064 nm. The sample was excited using triple the frequency of this wavelength to 355 nm (3.5 eV). Figure 5 illustrates that there are three main emission regions in the thin films obtained through photoluminescence (PL) spectra. All other peaks have a known origin, except for the 870 nm peak that is common among all spectra.
The high luminescence band at about 380 nm corresponds to the excitonic emission, which is the recombination of electrons and holes through the sample gap. At 760 nm, it is feasible to observe the second order of this PL band. ZnO is known for its intrinsic defects, which include oxygen deficiencies (VO), interstitial zinc (Zni), zinc deficiencies (VZn), and interstitial oxygen (Oi). The visible broadband comprises the peaks that are attributed to energy levels within the bandgap and that are linked to both intrinsic and extrinsic defects caused by doping [34,35,36,37,38] in the ZnO matrix. The intensity of this band is noted initially, with co-doping between 450 and 550 nm when compared to ZnO with 5% Yb.
The decay is caused by the transition energy of the interstitial zinc electron (Zni) and the zinc gap (VZn) as well as the transition energy of the oxygen gap electron (VO) to interstitial oxygen (Oi), respectively [39]. The emission at 529 nm remains uncertain and likely due to various imperfections, such as VZn, VO, Zni, and Oi [40,41]. The increase in band intensity between 550 and 680 nm is significant due to the excess oxygen (Oi) and Zni [42]. Although there is no consensus on the origin of the different emission bands, there are certain hypotheses that more or less complement each other, and this is due to the large variety of defects, possible size, and morphology of ZnO crystallites. The intensity of this band increases with co-doping, when compared to that of no-doped ZnO, Yb-doped ZnO [43], and Tb-doped ZnO [44]. The reason for this behavior is both the increase in active optical centers and the non-radiative transitions caused by the incorporation of rare earth ions. In conclusion, we can argue that the incorporation of rare earths into the ZnO host causes an increase in defects due to the difference in Zn ionic rays and the rare earth ion.
At 978 nm, we saw another peak in the infrared domain, which is the electronic transition between the fundamental level (2F5/2) and the excited level (2F7/2) of the Yb3+ ion in the ZnO matrix. The efficiency of photon energy transfer between ZnO and Yb3+ ion is demonstrated in this interesting emission result. Therefore, it is possible to say that ZnO nanocrystals absorb excitatory energy and transfer it in a non-radiative way to the levels of Yb ions. The nanocrystals release energy from excitons corresponding to the difference in energy between levels 2F7/2 and 2F5/2. This promotes strong coupling because the transition is resonant. We can also note that these processes, which are not radiative, are attributed to dipole–dipole interactions. These transfer processes are a method for indirect excitation of ytterbium ions, which means that these ions are not only excited directly by a light source but also indirectly through ZnO nanocrystals.
The emission of Yb3+ ion is well explained in many studies [45,46]. First, the Yb3+ ion energy level diagram consists of only two levels: 2F5/2 and 2F7/2. The ground state of Yb3+ consists of 2F7/2 and only one excited level, 2F5/2. This diagram alone decreases the probability of non-radiative de-excitation between Yb3+ ions. The electronic configuration of the Yb3+ ions is influenced by the presence of a crystalline field created by host matrix atoms, which creates a more effective energy exchange by interacting with the ZnO matrix. After annealing samples at a temperature of 600 °C for 0.5 h under an O2 atmosphere, a similar result is observed [47]. Secondly, the single emission of Yb3+ is around 980 nm. The latter is precisely above the forbidden beam energy of Si and is, therefore, very efficient for solar cells of Si (which currently dominate the market of photovoltaic cells). We observe that the emission intensity of Yb3+ at 979 nm decreases with the increase in Er.
The samples do not show any Er3+ ions emission in the [400–1000 nm] wavelength range, which suggests that there was no transfer of energy from ZnO to rare earth ions at this temperature and wavelength range. According to a recent article, erbium will only become active when it clusters with oxygen (ErO6) in the ZnO matrix or at the grain boundaries. Annealing at 800 °C under an atmosphere of O2 is the only way to see this phase, as it only forms ErO4 phases by replacing Zn2+ without annealing [16]. The reason for this result is the importance of oxygen in the local environment of Er3+ ions for the optical activation of these. Then, the amount of oxygen plays a crucial role in the emission of Er3+ ions.
As for the gap energy (Eg), we can observe a slight “red shift” in the bandgap width on the photoluminescence spectrum, which reflects the decrease in the value of Eg. Zheng et al. [48] explained this decline in the growth of electronic defects, which leads to a disorder that can cause localized states. The band edges that are defined by valence (Ev) and conduction (Ec) energies may disappear in favor of the band tails at the bandgap boundaries in the valence and conduction band [49].
This optical outcome is in congruence with the results achieved by co-doping ZnO with Gd and Al [50]. It is probable that the bandgap reduction is caused by multiple factors, such as grain size, free carrier concentration, stoichiometry deviation, and mesh stress [51,52,53,54]. These values are in good agreement with the results of electrical and XRD measurements.

3.3. Electrical Properties

The results of the Hall effect measurements performed on the ZnO layers (Yb-Er) are summarized in Table 3, which also shows the results of the erbium doping, which were inserted for comparison. For YEZO samples, the conductivity is n-type. This result is due to the increase in the number of defects due to the Yb and Er ions probably not being inserted, which causes a decrease in the resistivity. Table 3 shows a decrease in the mobility of three samples, but the ZnO-5% Yb_3% Er sample shows an increase in mobility, so the decrease in mobility indicates an increase in resistivity, which is closely related to the quality and purity of thin films developed, compared with undoped ZnO. The existence of ionized impurities and the presence of defects within the samples increase the probability of free carrier collisions [55]. The vibration of the atoms in the crystalline lattice around their equilibrium position is, likewise, an obstacle for the free electrons, which causes a decrease in the number of free carriers in the samples by comparing with the doping by (Yb) [56]. This decay is probably a consequence of the insertion of the dopant into the interstitial positions. For the system to keep its balance, the concentration of zinc gaps increases. These can act as acceptor levels with high activation energy [57]. These defects act as “electron killers”, which fit perfectly with the estimation of the percentages of Zn given by EDS. The scattering of electrons within samples with a large amount of grain boundaries is generally explained by the small grain size. This results in a decrease in the life time of the carriers, causing, in turn, a decrease in the mobility and concentration of the carriers. The calculated mean free-range values (Table 3) are considerably smaller than the grain size calculated using XRD. This evidence indicates that ionized impurities and/or neutral impurities are the primary means of diffusion in these layers [58].

4. Conclusions

The focus of this work was on conducting a study focused on zinc oxide in the form of thin layers doped and co-doped with rare earth ions, with the objective of developing and then investigating the structural, morphological, optical, and electrical properties. The films have a polycrystalline structure with a hexagonal wurtzite structure and a preference orientation in the (002) direction, according to the structural study of films by XRD analysis. This clearly indicates that the dopants are incorporated into the ZnO network without any segregation of phases occurring in these films. Optical characterization of the co-doped layers in the range of 200 to 800 nm reveals that co-doping has a notable impact on the transmission values. Characterization by UV–visible spectroscopy showed that the layers have a high transmission of about 80% in the visible region, with a sharp drop in absorption at about 380 nm. Photoluminescence measurement shows that a band of 980 nm indicates the intrashell transitions of 2F5/22F7/2 from the Yb3+ ion, which implies energy transfer from the ZnO matrix to the doped Yb3+ centers. No emission of Er3+ ions is observed in the wavelength range 400–1000 nm, which proves the absence of energy transfer between the latter and the ZnO matrix at this temperature and in this wavelength domain. At room temperature, Hall effect measurements indicated that conduction is n-type for all layers, whether they are co-doped or not. Also, the electrical resistivity dropped after doping or co-doping to reach values around 6.0 × 10⁻² Ω cm.

Author Contributions

Conceptualization, A.E.H. and I.C.; methodology, A.E.H.; software, R.E.; validation, I.C., B.F. and A.D.; formal analysis, M.R.; investigation, A.F.L.; data curation, I.C.; writing—original draft preparation, A.E.H. and R.E; writing—review and editing, A.E.H.; visualization, A.E.H. and A.D.; supervision, M.A.-L. All authors have read and agreed to the published version of the manuscript.

Funding

This research received no external funding.

Data Availability Statement

Data are contained within the article.

Conflicts of Interest

The authors declare no conflicts of interest.

References

  1. Rahman, M.; Kamruzzaman, M.; Zapien, J.A.; Afrose, R.; Anam, T.K.; Liton, M.N.H.; Helal, M.A.; Khan, M.K.R. Conversion of n-type to p-type conductivity in ZnO by incorporation of Ag and Ag-Li. Mater. Today Commun. 2022, 33, 104278. [Google Scholar] [CrossRef]
  2. Suman, A.; Chahal, S.; Kumar, S.; Kumar, A.; Duhan, S.; Kumar, P. Magnetism in Zinc Oxide (ZnO). In Defect-Induced Magnetism in Oxide Semiconductors; Woodhead Publishing: Sawston, UK, 2023; pp. 547–561. [Google Scholar]
  3. Li, X.; Yan, J.; Yu, T.; Zhang, B. Versatile nonfluorinated superhydrophobic coating with self-cleaning, anti-fouling, anti-corrosion and mechanical stability. Colloids Surf. A Physicochem. Eng. Asp. 2022, 642, 128701. [Google Scholar] [CrossRef]
  4. Le, A.T.; Ahmadipour, M.; Pung, S.-Y. A review on ZnO-based piezoelectric nanogenerators: Synthesis, characterization techniques, performance enhancement and applications. J. Alloys Compd. 2020, 844, 156172. [Google Scholar] [CrossRef]
  5. Fujii, S.; Adachi, Y.; Uchino, T. Excitonic stimulated emission from MgxZn1− x O films due to enhanced exciton binding energy. Phys. Rev. B 2020, 102, 075204. [Google Scholar] [CrossRef]
  6. Gherendi, F.; Dobrin, D.; Nistor, M. Transparent Structures for ZnO Thin Film Paper Transistors Fabricated by Pulsed Electron Beam Deposition. Micromachines 2024, 15, 265. [Google Scholar] [CrossRef]
  7. Badgujar, A.C.; Yadav, B.S.; Jha, G.K.; Dhage, S.R. Room temperature sputtered aluminum-doped ZnO thin film transparent electrode for application in solar cells and for low-band-gap optoelectronic devices. ACS Omega 2022, 7, 14203–14210. [Google Scholar] [CrossRef]
  8. Saadi, H.; Khaldi, O.; Pina, J.; Costa, T.; Seixas de Melo, J.S.; Vilarinho, P.; Benzarti, Z. Effect of Co doping on the physical properties and organic pollutant photodegradation efficiency of ZnO nanoparticles for environmental applications. Nanomaterials 2024, 14, 122. [Google Scholar] [CrossRef]
  9. Malyutina-Bronskaya, V.; Zalesski, V.; Zhyhulin, D.; Mudryi, A. Structural, optical and photoelectric properties of Tb doped ZnO thin films for device applications. Opt. Mater. 2022, 127, 112305. [Google Scholar] [CrossRef]
  10. Alsaad, A.M.; Ahmad, A.A.; Qattan, I.A.; Al-Bataineh, Q.M.; Albataineh, Z. Structural, optoelectrical, linear, and nonlinear optical characterizations of dip-synthesized undoped ZnO and group III elements (B, Al, Ga, and In)-doped ZnO thin films. Crystals 2020, 10, 252. [Google Scholar] [CrossRef]
  11. Abdel-Galil, A.; Hussien, M.S.; Yahia, I.S. Synthesis and optical analysis of nanostructured F-doped ZnO thin films by spray pyrolysis: Transparent electrode for photocatalytic applications. Opt. Mater. 2021, 114, 110894. [Google Scholar] [CrossRef]
  12. Kumawat, A.; Chattopadhyay, S.; Kumar Verma, R.; Prakash Misra, K. Eu doped ZnO nanoparticles with strong potential of thermal sensing and bioimaging. Mater. Lett. 2022, 308, 131221. [Google Scholar] [CrossRef]
  13. Gong, X.; Tang, L.; Wang, R.; Guo, Z.; Huang, P.; Zhou, L.; He, R. Achieving efficient photocatalytic uranium extraction within a record short period of 3 min by Up-conversion erbium doped ZnO nanosheets. Chem. Eng. J. 2022, 450, 138044. [Google Scholar] [CrossRef]
  14. Cerrato, E.; Zickler, G.A.; Paganini, M.C. The role of Yb doped ZnO in the charge transfer process and stabilization. J. Alloys Compd. 2020, 816, 152555. [Google Scholar] [CrossRef]
  15. Bai, Y.; Wang, Y.; Yang, K.; Zhang, X.; Song, Y.; Wang, C.H. Enhanced upconverted photoluminescence in Er3+ and Yb3+ codoped ZnO nanocrystals with and without Li+ ions. Opt. Commun. 2008, 281, 5448. [Google Scholar] [CrossRef]
  16. Lluscà, M.; López-Vidrier, J.; Antony, A.; Hernández, S.; Garrido, B.; Bertomeu, J. Up-conversion effect of Er-and Yb-doped ZnO thin films. Thin Solid Film 2014, 562, 456. [Google Scholar] [CrossRef]
  17. Shinde, S.; Shinde, V.; Wadkar, P. Rapid Response and Quick Recovery LPG Sensor Fabricated Using Aqueous Sol–Gel Synthesized ZnO/Zn (OH)2 Hexagonal Nanoparticles. J. Electron. Mater. 2024, 53, 5222–5237. [Google Scholar] [CrossRef]
  18. Wang, Y.; Tang, W.; Zhang, L. Crystalline size effects on texture coefficient, electrical and optical properties of sputter-deposited Ga-doped ZnO thin films. J. Mater. Sci. Technol. 2015, 31, 175–181. [Google Scholar] [CrossRef]
  19. Sadatgol, M.; Bihari, N.; Joshua, M.P.; Durdu, O.G. calable honeycomb top contact to increase the light absorption and reduce the series resistance of thin film solar cells. Opt. Mater. Express 2019, 9, 256–268. [Google Scholar] [CrossRef]
  20. Ribeiro, J.M.; Correia, F.C.; Salvador, P.B.; Rebouta, L.; Alves, L.C.; Alves, E.; Barradas, N.P.; Mendes, A.; Tavares, C.J. Compositional analysis by RBS, XPS and EDX of ZnO: Al, Bi and ZnO: Ga, Bi thin films deposited by dc magnetron sputtering. Vacuum 2019, 161, 268–275. [Google Scholar] [CrossRef]
  21. Scherrer, P. Gott. Nachrichten 1918, 2, 98. [Google Scholar]
  22. Prabhu, Y.T.; Sreedhar, B.; Pal, U. Achieving enhanced photocatalytic activity of ZnO supported on MWCNTs towards degradation of pollutants under visible light. Mater. Today Proc. 2019, 8, 419–426. [Google Scholar] [CrossRef]
  23. Soumahoro, I.; Schmerber, G.; Douayar, A.; Colis, S.; Abd-Lefdil, M.; Hassanain, N.; Berrada, A.; Muller, D.; Slaoui, A.; Rinnert, H.; et al. Structural, optical, and electrical properties of Yb-doped ZnO thin films prepared by spray pyrolysis method. J. Appl. Phys. 2011, 109, 033708. [Google Scholar] [CrossRef]
  24. Kumar, K.D.A.; Valanarasu, S.; Ponraj, J.S.; Fernandes, B.J.; Shkir, M.; AlFaify, S.; Murahari, P.; Ramesh, K. Effect of Er doping on the ammonia sensing properties of ZnO thin films prepared by a nebulizer spray technique. J. Phys. Chem. Solids 2020, 144, 109513. [Google Scholar] [CrossRef]
  25. Makoed, I.I.; Liedienov, N.A.; Pashchenko, A.V.; Levchenko, G.G.; Tatarchuk, D.D.; Didenko, Y.V.; Amirov, A.A.; Rimski, G.S.; Yanushkevich, K.I. Influence of rare-earth doping on the structural and dielectric properties of orthoferrite La0.50R0.50FeO3 ceramics synthesized under high pressure. J. Alloys Compd. 2020, 842, 155859. [Google Scholar] [CrossRef]
  26. Xu, P.; Sun, Y.; Shi, C.; Xu, F.; Pan, H. Electronic structure of ZnO and its defects. Sci. China Ser. A Math. 2001, 44, 1174–1181. [Google Scholar] [CrossRef]
  27. Lin, T.H.; Lan, W.H.; Shih, M.C.; Wang, M.C.; Chang, K.J.; Lin, J.C.; Lee, S.Y.; Lin, W.J.; Huang, C.J. Resistance Study of Er-doped Zinc Oxide Diode by Spray Pyrolysis. Sens. Mater. 2018, 30, 939–946. [Google Scholar]
  28. Kretzschmar, B.S.M.; Wendler, E.; Heft, A.; Köcher, R.; Voigt, C.; Ronning, C.; Grünler, B.; Rädlein, E. Comprehensive porosity determination of combustion-deposited SiOx thin films and correlation with FTIR signal. Surf. Coat. Technol. 2019, 375, 256–265. [Google Scholar] [CrossRef]
  29. Samuel, E.; Joshi, B.; Kim, M.-W.; Kim, Y.; Swihart, M.T.; Yoon, S.S. Hierarchical zeolitic imidazolate framework-derived manganese-doped zinc oxide decorated carbon nanofiber electrodes for high performance flexible supercapacitors. Chem. Eng. J. 2019, 371, 657–665. [Google Scholar] [CrossRef]
  30. Rathgeber, C.; Schmit, H.; Hiebler, S.; Voigt, W. Application of the modified BET model to concentrated salt solutions with relatively high water activities: Predicting solubility phase diagrams of NaCl+ H2O, NaCl+ LiCl+ H2O, and NaCl+ CaCl2+ H2O. Calphad 2019, 66, 101633. [Google Scholar] [CrossRef]
  31. El Hat, A.; Hadri, A.; Chafi, F.Z.; Fares, B.; Hassanain, N.; Mzerd, A. Effect of cu on the physical properties of ZnO synthesized by spray pyrolysis technique. Rom. J. Mater./Rev. Romana Mater. 2017, 47, 71–77. [Google Scholar]
  32. El Hat, A.; Chaki, I.; Essajai, R.; Mzerd, A.; Schmerber, G.; Regragui, M.; Belayachi, A.; Sekkat, Z.; Dinia, A.; Slaoui, A.; et al. Growth and characterization of (Tb, Yb) Co-doping sprayed ZnO thin films. Crystals 2020, 10, 169. [Google Scholar] [CrossRef]
  33. Qin, R.; Meng, F.; Khan, M.W.; Yu, B.; Li, H.; Fan, Z.; Gong, J. Fabrication and enhanced photocatalytic property of TiO2-ZnO composite photocatalysts. Mater. Lett. 2019, 240, 84–87. [Google Scholar] [CrossRef]
  34. Behera, D.; Acharya, B.S. Nano-star formation in Al-doped ZnO thin film deposited by dip-dry method and its characterization using atomic force microscopy, electron probe microscopy, photoluminescence and laser Raman spectroscopy. J. Lumin. 2008, 128, 1577. [Google Scholar] [CrossRef]
  35. Reynolds, D.C.; Look, D.C.; Jogai, B.; Litton, C.W.; Collins, T.C.; Harsch, W.; Cantwell, G. Neutral-donor–bound-exciton complexes in ZnO crystals. Phys. Rev. B Condens. Matter 1998, 57, 12151. [Google Scholar] [CrossRef]
  36. Thonke, K.; Gruber, T.; Teofilov, N.; Schonfelder, R.; Waag, A.; Sauer, R. Donor–acceptor pair transitions in ZnO substrate material. Phys. B Condens. Matter 2001, 945, 308. [Google Scholar] [CrossRef]
  37. Kong, Y.C.; Yu, D.P.; Zhang, B.; Fang, W.; Feng, S.Q. Ultraviolet-emitting ZnO nanowires synthesized by a physical vapor deposition approach. Appl. Phys. Lett. 2001, 78, 407. [Google Scholar] [CrossRef]
  38. Teng, X.M.; Fan, H.T.; Pan, S.S.; Ye, C.; Li, G.H. Photoluminescence of ZnO thin films on Si substrate with and without ITO buffer layer. J. Phys. D Appl. Phys. 2006, 39, 471. [Google Scholar] [CrossRef]
  39. Xu, P.S.; Sun, Y.M.; Shi, C.S.; Xu, F.Q.; Pan, H.B. The electronic structure and spectral properties of ZnO and its defects. Nucl. Instrum. Methods Phys. Res. B 2003, 199, 286. [Google Scholar] [CrossRef]
  40. Mahamuni, S.; Borgohain, K.; Bendre, B.S.; Leppert, V.J.; Risbud, S.H. Spectroscopic and structural characterization of electrochemically grown ZnO quantum dots. J. Appl. Phys. 1999, 85, 2861. [Google Scholar] [CrossRef]
  41. Srinet, G.; Varshneya, P.; Kumar, R.; Sajal, V.; Kulriya, P.K.; Knobel, M.; Sharma, S.K. Structural, optical and magnetic properties of Zn1− xCoxO prepared by the sol–gel route. Ceram. Int. 2013, 39, 6077. [Google Scholar] [CrossRef]
  42. Zeferino, R.S.; Flores, M.B.; Pal, U. Photoluminescence and Raman scattering in Ag-doped ZnO nanoparticles. J. Appl. Phys. 2011, 109, 014308. [Google Scholar] [CrossRef]
  43. Elfakir, A.; Douayar, A.; Diaz, R.; Chaki, I.; Prieto, P.; Loghmarti, M.; Belayachi, A.; Abd-Lefdil, M. Elaboration and characterization of sprayed Tb-doped ZnO thin films. Sens. Transducers 2014, 27, 161. [Google Scholar]
  44. Balestrieria, M.; Ferblantier, G.; Colis, S.; Schmerber, G.; Ulhaq-Bouillet, C.; Muller, D.; Dinia, A. Structural and optical properties of Yb-doped ZnO films deposited by magnetron reactive sputtering for photon conversion. Sol. Energy Mater. Sol. Cells 2013, 117, 363. [Google Scholar] [CrossRef]
  45. Shestakov, M.V.; Baranov, A.N.; Tikhomirov, V.K.; Zubavichus, Y.V.; Kuznetsov, A.S.; Veligzhanin, A.A.; Kharin, A.Y.; Rösslhuber, R.; Timoshenko, V.Y.; Moshchalkov, V.V. Energy-transfer luminescence of a zinc oxide/ytterbium oxide nanocomposite. R. Soc. Chem. Adv. 2012, 2, 8783. [Google Scholar] [CrossRef]
  46. Luo, Q.; Qiao, X.; Fan, X.; Zhang, X. Near-infrared emission of Yb3+ through energy transfer from ZnO to Yb3+ in glass ceramic containing ZnO nanocrystals. Opt. Lett. 2011, 36, 2767. [Google Scholar] [CrossRef]
  47. Okada, R.; Miao, W.; Terai, Y.; Tsuji, T.; Fujiwara, Y. Sputtering-assisted metal-organic chemical vapor deposition of Yb-doped ZnO for photonic conversion in Si solar cells. Phys. Status Solidi C 2014, 11, 1292. [Google Scholar] [CrossRef]
  48. Zheng, J.H.; Song, J.L.; Zhao, Z.; Jiang, Q.; Lian, J.S. Optical and magnetic properties of Nd-doped ZnO nanoparticles. Cryst. Res. Technol. 2012, 47, 713. [Google Scholar] [CrossRef]
  49. Urbach, F. The long-wavelength edge of photographic sensitivity and of the electronic absorption of solids. Phys. Rev. 1953, 92, 1324. [Google Scholar] [CrossRef]
  50. Lin, W.; Ma, R.; Shao, W.; Liu, B. Structural, electrical and optical properties of Gd doped and undoped ZnO: Al (ZAO) thin films prepared by RF magnetron sputtering. Appl. Surf. Sci. 2007, 253, 5179. [Google Scholar] [CrossRef]
  51. Yakuphanoglu, F.; Caglar, Y.; Ilican, S.; Caglar, M. The effects of fluorine on the structural, surface morphology and optical properties of ZnO thin films. Phys. B 2007, 394, 86. [Google Scholar] [CrossRef]
  52. Tomakin, M.; Altunbas, M.; Bacaksız, E.; Polat, I. Preparation and characterization of new window material CdS thin films at low substrate temperature (< 300 K) with vacuum deposition. Mater. Sci. Semicond. Process. 2011, 14, 120. [Google Scholar]
  53. Freund, L.B.; Suresh, S. Thin Film Materials; Cambridge University Press: Cambridge, UK, 2003; p. 192. [Google Scholar]
  54. Lee, Y.H.; Lee, W.J.; Kwon, Y.S.; Yeom, G.Y.; Yoon, J.K. Effects of CdS substrates on the physical properties of polycrystalline CdTe Films. Thin Solid Films 1999, 341, 172. [Google Scholar] [CrossRef]
  55. Zhou, Z.; Lan, C.; Wei, R.; Ho, J.C. Transparent metal-oxide nanowires and their applications in harsh electronics. J. Mater. Chem. C 2019, 7, 202–217. [Google Scholar] [CrossRef]
  56. Huang, Z.; Ruan, H.; Zhang, H.; Shi, D.; Li, W.; Qin, G.; Wu, F.; Fang, L.; Kong, C. Conversion mechanism of conductivity and properties of nitrogen implanted ZnO single crystals induced by post-annealing. J. Mater. Sci. Mater. Electron. 2019, 30, 4555–4561. [Google Scholar] [CrossRef]
  57. Pan, L.L.; Li, G.Y.; Lian, J.S. Structural, optical and electrical properties of cerium and gadolinium doped CdO thin films. Appl. Surf. Sci. 2013, 274, 365. [Google Scholar] [CrossRef]
  58. Oshima, M.; Yoshino, K. Electron scattering mechanism of FTO films grown by spray pyrolysis method. J. Electron. Mater. 2010, 39, 819. [Google Scholar] [CrossRef]
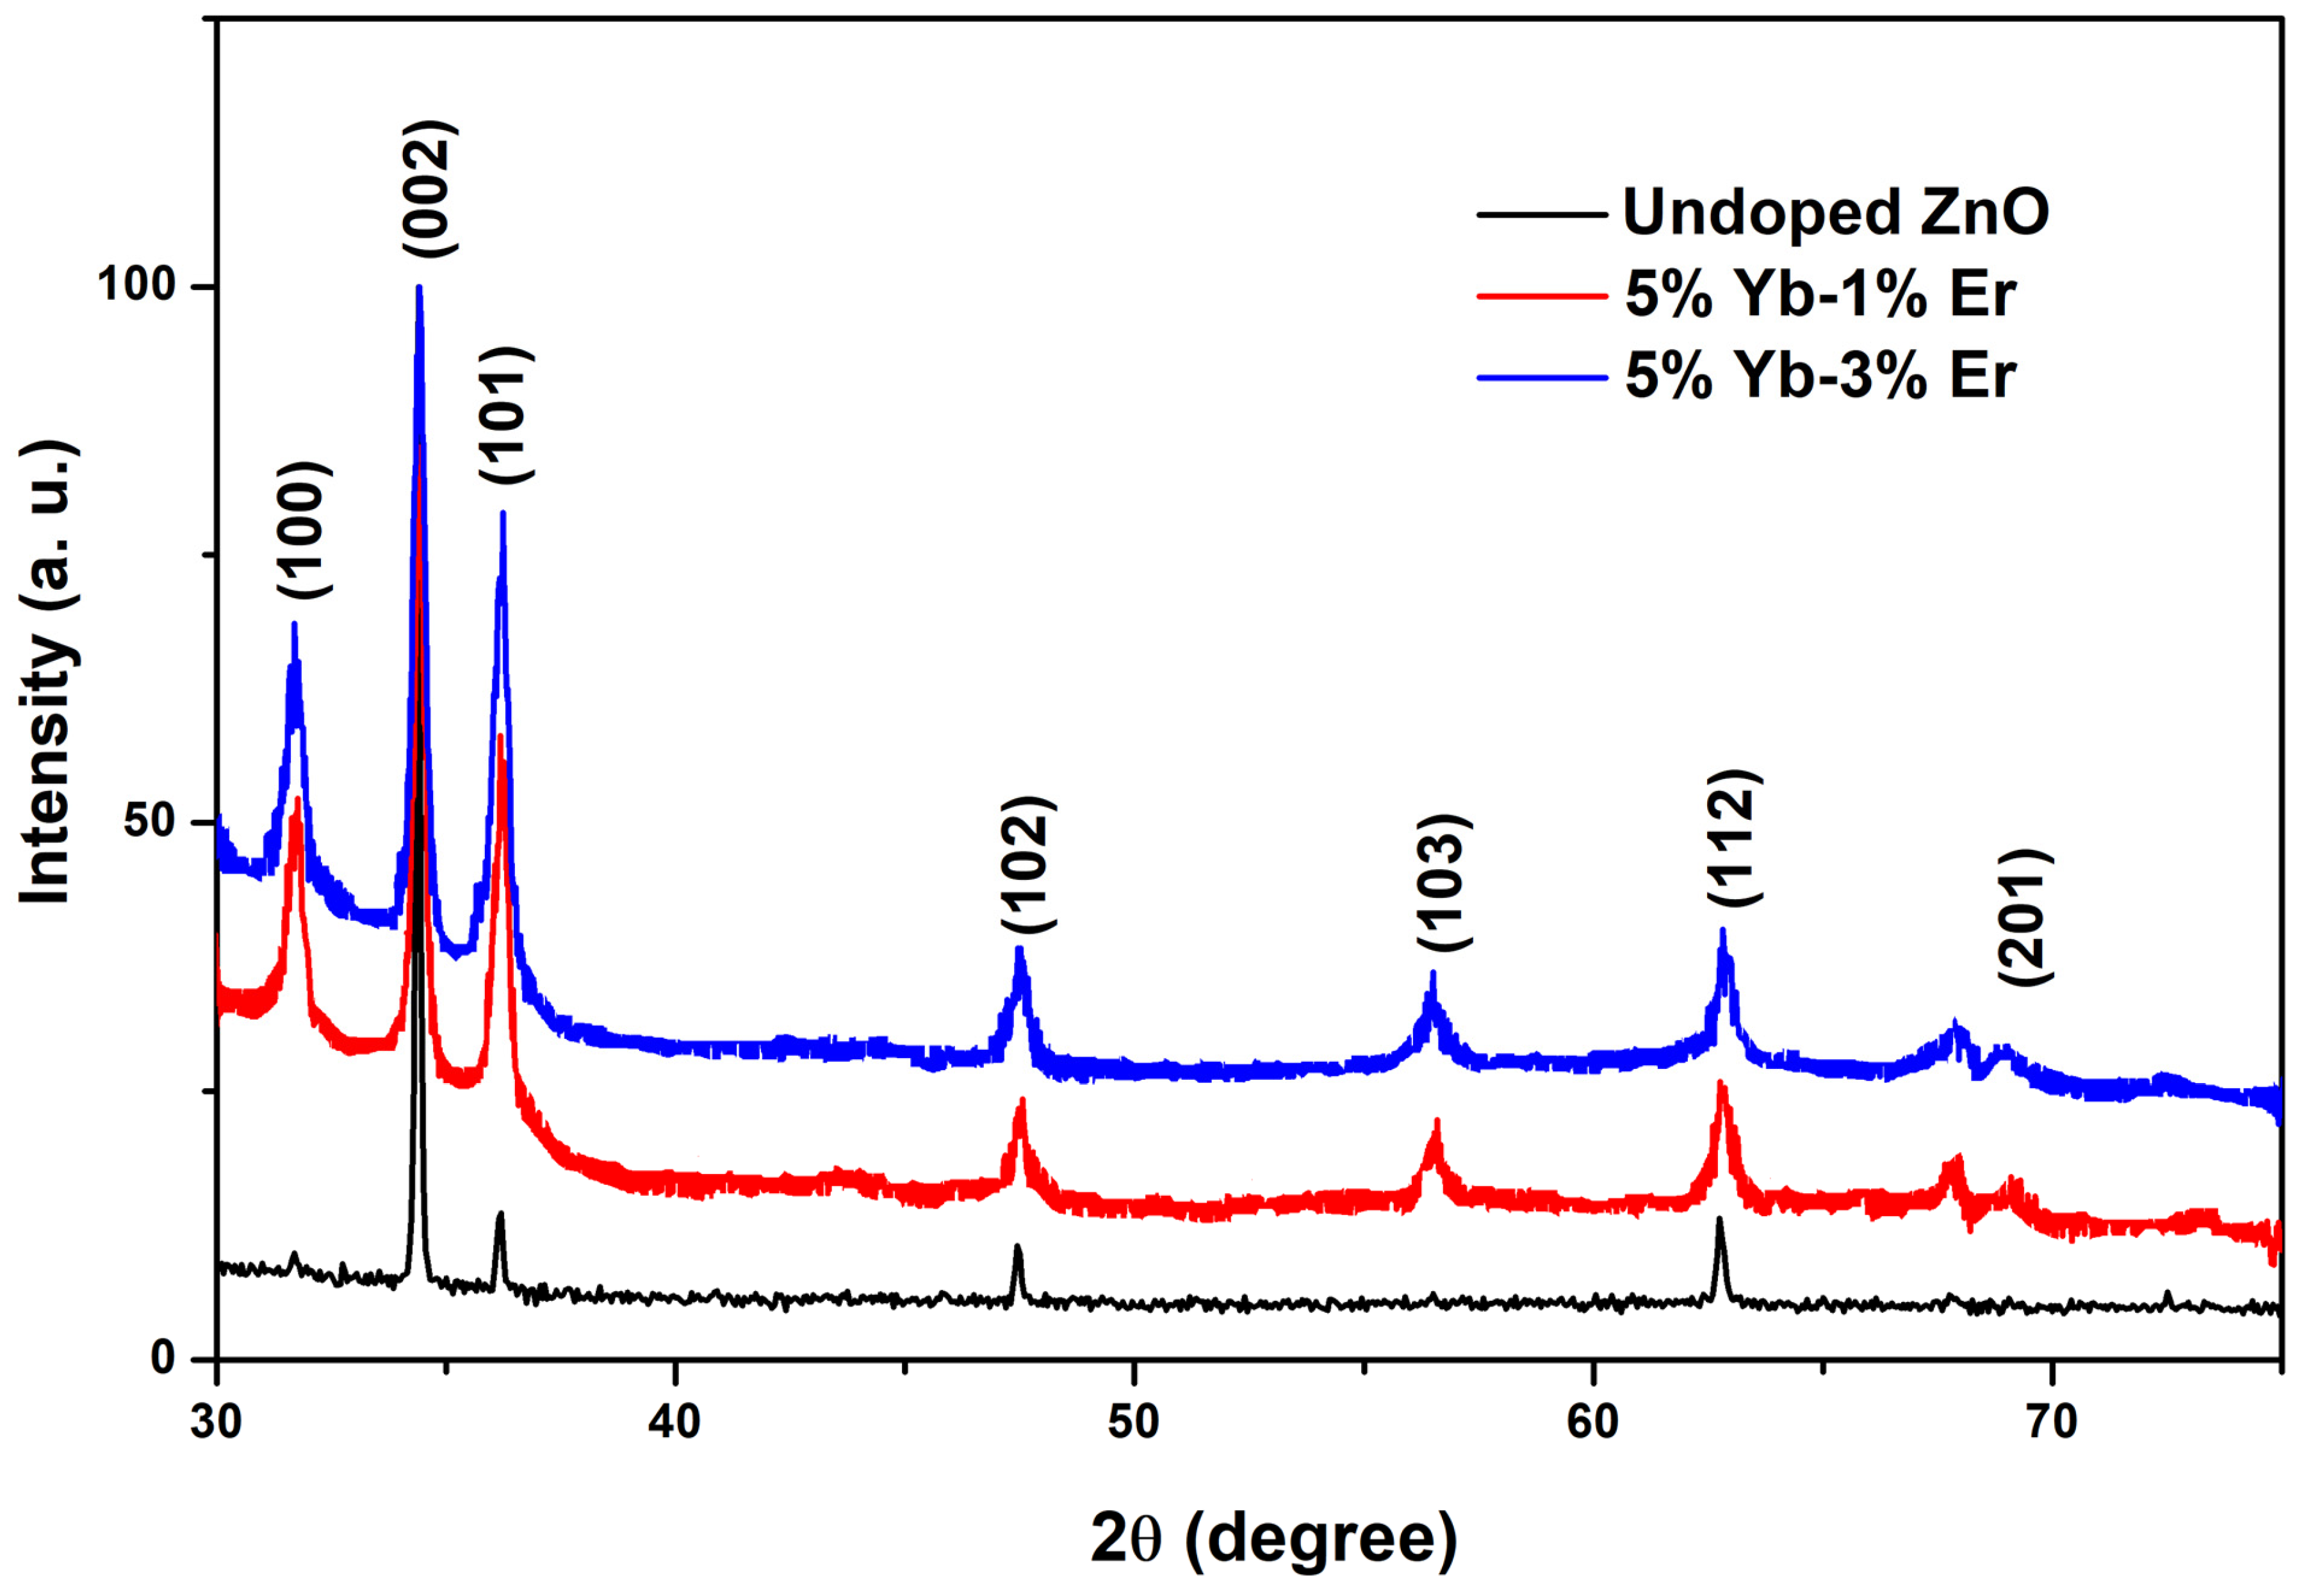
Figure 1. X-ray diffraction pattern of the EYZO layers.
Optics 06 00014 g001
Figure 2. TEM micrographs: (a) ZnO: 5% Yb_1% Er; (b) ZnO: 5% Yb_3% Er.
Optics 06 00014 g002
Figure 3. EDX spectra (a) ZnO: 5% Yb_1% Er; (b) ZnO: 5% Yb_3% Er.
Optics 06 00014 g003
Figure 4. Transmission spectrum of thin films of EYZO.
Optics 06 00014 g004
Figure 5. Photoluminescence for undoped ZnO, ZnO: 5% Yb–1% Er and 5% Yb–3% Er films.
Optics 06 00014 g005
Table 2. Optical parameters of thin films of ZnO and EYZO.
SamplesThickness
(nm)
Eg
(eV)
T%
(600 nm)
T%
(800 nm)
Ref
Undoped ZnO 4303.279192This work
5% Yb3+4553.3388[23]
1% Er3883.2675[24]
5% Yb_1% Er4553.2465 68This work
5% Yb_3% Er4653.2177 79This work
Table 3. Electrical measurements of thin layers of YEZO.
Samplesne
(1020 cm−3)
ρ
(10−2 Ω cm)
µ
(10−1 cm2/V·s)
l
(nm)
Ref
Undoped ZnO0.1364.57.34.8This work
5% Yb928.000.120.42[23]
5% Yb_1% Er107.450.300.203This work
5% Yb_3% Er166.000.660.024This work
Disclaimer/Publisher’s Note: The statements, opinions and data contained in all publications are solely those of the individual author(s) and contributor(s) and not of MDPI and/or the editor(s). MDPI and/or the editor(s) disclaim responsibility for any injury to people or property resulting from any ideas, methods, instructions or products referred to in the content.