1. Introduction
Complex oxide materials are key elements behind a variety of important applications in electronics, fiber optics, coherent light sources, and light frequency conversion. Oxide properties, such as transparency in the optical range of frequencies, high direct bandgap, optical anisotropy, and carrier mobility, combined with high thermal conductivity, make them an exceptional class of materials suitable for technological applications. Strong interest in transparent ternary oxides, with perovskite structure and wide bandgap, is due to their potential uses in important device applications. These can range from transparent logic and memory devices to light-emitting diodes to applications in solar cells and flat panel displays. One of the crucial parameters for microelectronic logic device applications is the high electrical mobility of carriers at room temperature that oxides can provide, while retaining their properties at heterojunction interfaces. If one approaches this issue from the quantitative side, the best values for room temperature mobility and conductivity in the model perovskite oxide semiconductor SrTiO
3 (STO) is below 10 cm
2/(Vs) and 500 (Ω × cm)
−1 [
1]. Very recently, significantly higher room temperature mobility and the corresponding conductivity of bulk BaSnO3 (BSO) have been reported. Luo et al. [
2] were the first to demonstrate that room temperature mobility can be higher than 100 cm
2/(V × s) in the n-doped BSO crystals with a carrier concentration of 8 × 10
19 cm
−3. Later, as the research progressed, with key optimizations to the crystal growth process established, much higher mobility and conductivity (~320 cm
2/(V × s) and 4 × 10
3 (Ω × cm)
−1, respectively) have been demonstrated [
2,
3]. In addition, detailed studies of the material’s band structure within STO and LaAlO
3 (LAO) heterojunctions resulted in conduction band offsets that favor modulation and polarization doping schemes that are essential for the use of these structures in power electronic applications. However, one major drawback is that the mobility drops to 150 cm
2/(V × s) for thin film samples. The latter represents the best currently achieved value [
1] for BSO films grown on PrScO
3 substrates, while the BSO films grown on STO substrates show even lower carrier mobility values, within 80–120 cm
2/(V × s) [
4]. The main mechanism that adversely impacts the carrier mobility parameter in epitaxially grown thin films are thought to be impurities and dislocations induced by the substrate material due to lattice mismatch. The problem can be mitigated by using special doping techniques. This results in compensation effects, whereas mechanisms attributed to screened electron–phonon and carrier–carrier interactions can certainly play a major role regarding both bulk and thin film samples, depending on the doping level, temperature, and substrate interfaces. Eventually, transient properties of phonon-plasmon modes and carrier-phonon scattering mechanisms impose the fundamental limit on carrier mobility. All these mechanisms have been the subject of careful investigations, especially for III-V semiconducting systems [
5,
6]. Carrier scattering mechanisms are absolutely crucial in determining the mobility, as it follows from the basic dependence of the mobility (
μ) on the carrier’s effective scattering time (
τ) and its effective mass (
m*), i.e.,
μ = eτ/
m*. In a defect-free bulk crystal, the only scattering mechanism that affects the mobility is inelastic electron-phonon scattering. Knowledge of mechanisms for polar phonon interactions and phonon decay routes in a system where the screening of ionic potential is relatively weak is very important. This provides key information and quantitative data that can be used to analyze the results for doped samples (for both bulk and thin films) and better quantify and estimate the impact of other scattering mechanisms. Experiments on phonon decay will help to test hypotheses and explain recent results for carrier transport as concerning factors that limit electronic mobility and conductivity that can be realistically attained in doped complex oxide systems.
Metal-oxide inorganic compounds have also shown wide applications in generating high-power coherent light. Among these are non-centrosymmetric materials, such as potassium titanyl phosphate (KTiOPO
4), potassium titanyl arsenate (KTiOAsO
4), and others with exceptionally high optical nonlinearity and transparency that stretch from UV (350 nm) to middle-infrared (3.5 μm) levels. The large electro-optic coefficient for the materials, the low dielectric constant, and the ion exchange properties also make them suitable for electro-optic [
7] and waveguided laser devices [
8]. The high nonlinear optical coefficient combined with high birefringence make these materials exceptionally attractive and widely used in IR-visible frequency conversion applications for the output of source lasers, especially from the backbone Nd-doped crystal based 1064 nm laser sources. Renewed interest in the materials came about due to stimulated Raman scattering (SRS) experiments based on a high third-order nonlinear gain due to the properties of the material’s phonon spectra. Thus, the materials possess high second and third-order nonlinearity associated with several Raman active vibrations at a high-frequency range and are of interest from the standpoint of generating a frequency comb that would ultimately support attosecond waveforms [
9]. Detailed knowledge of the properties of lattice vibrations (phonons) is thus important in light of the applications of this material as the nonlinear gain (second- and third-order) medium.
2. Materials and Methods
In this work, we present results for the direct measurement of the phonon decay in single-crystal cubic BaSnO
3 perovskite, paraelectric SrTiO
3, and KTiOPO
4 crystal. Ultrafast time resolution and excellent sensitivity of a specially designed version of the coherent anti-Stokes Raman scattering (CARS) spectroscopy technique provided valuable insight into the dynamics of multiple phonon lines within the frequency range of 350–1500 cm
−1. Time-domain coherent Raman spectroscopies have demonstrated impressive results in the past with regard to studying vibrational modes in liquids and solids, as well as in atomic/molecular media [
10,
11,
12,
13,
14,
15]. Our approach is based on using a high repetition rate and widely tunable sources that allow us to trace time-domain signals within a high dynamic range and obtain an equivalent spectral resolution as good as 0.1 cm
−1. In addition, the experimental approach has not yet been applied to the class of materials under study. Damping rates of the characteristic Raman active modes in the high-bandgap materials have been determined with excellent precision, which is not attainable using other experimental methods. The obtained information is valuable, both from the standpoint of problems in fundamental physics and understanding carrier transport properties, including mechanisms that put limits on achieving high electronic mobility. Results on phonon decay in the KTP crystal are also important, as they provide guidance when designing laser systems with frequency conversion.
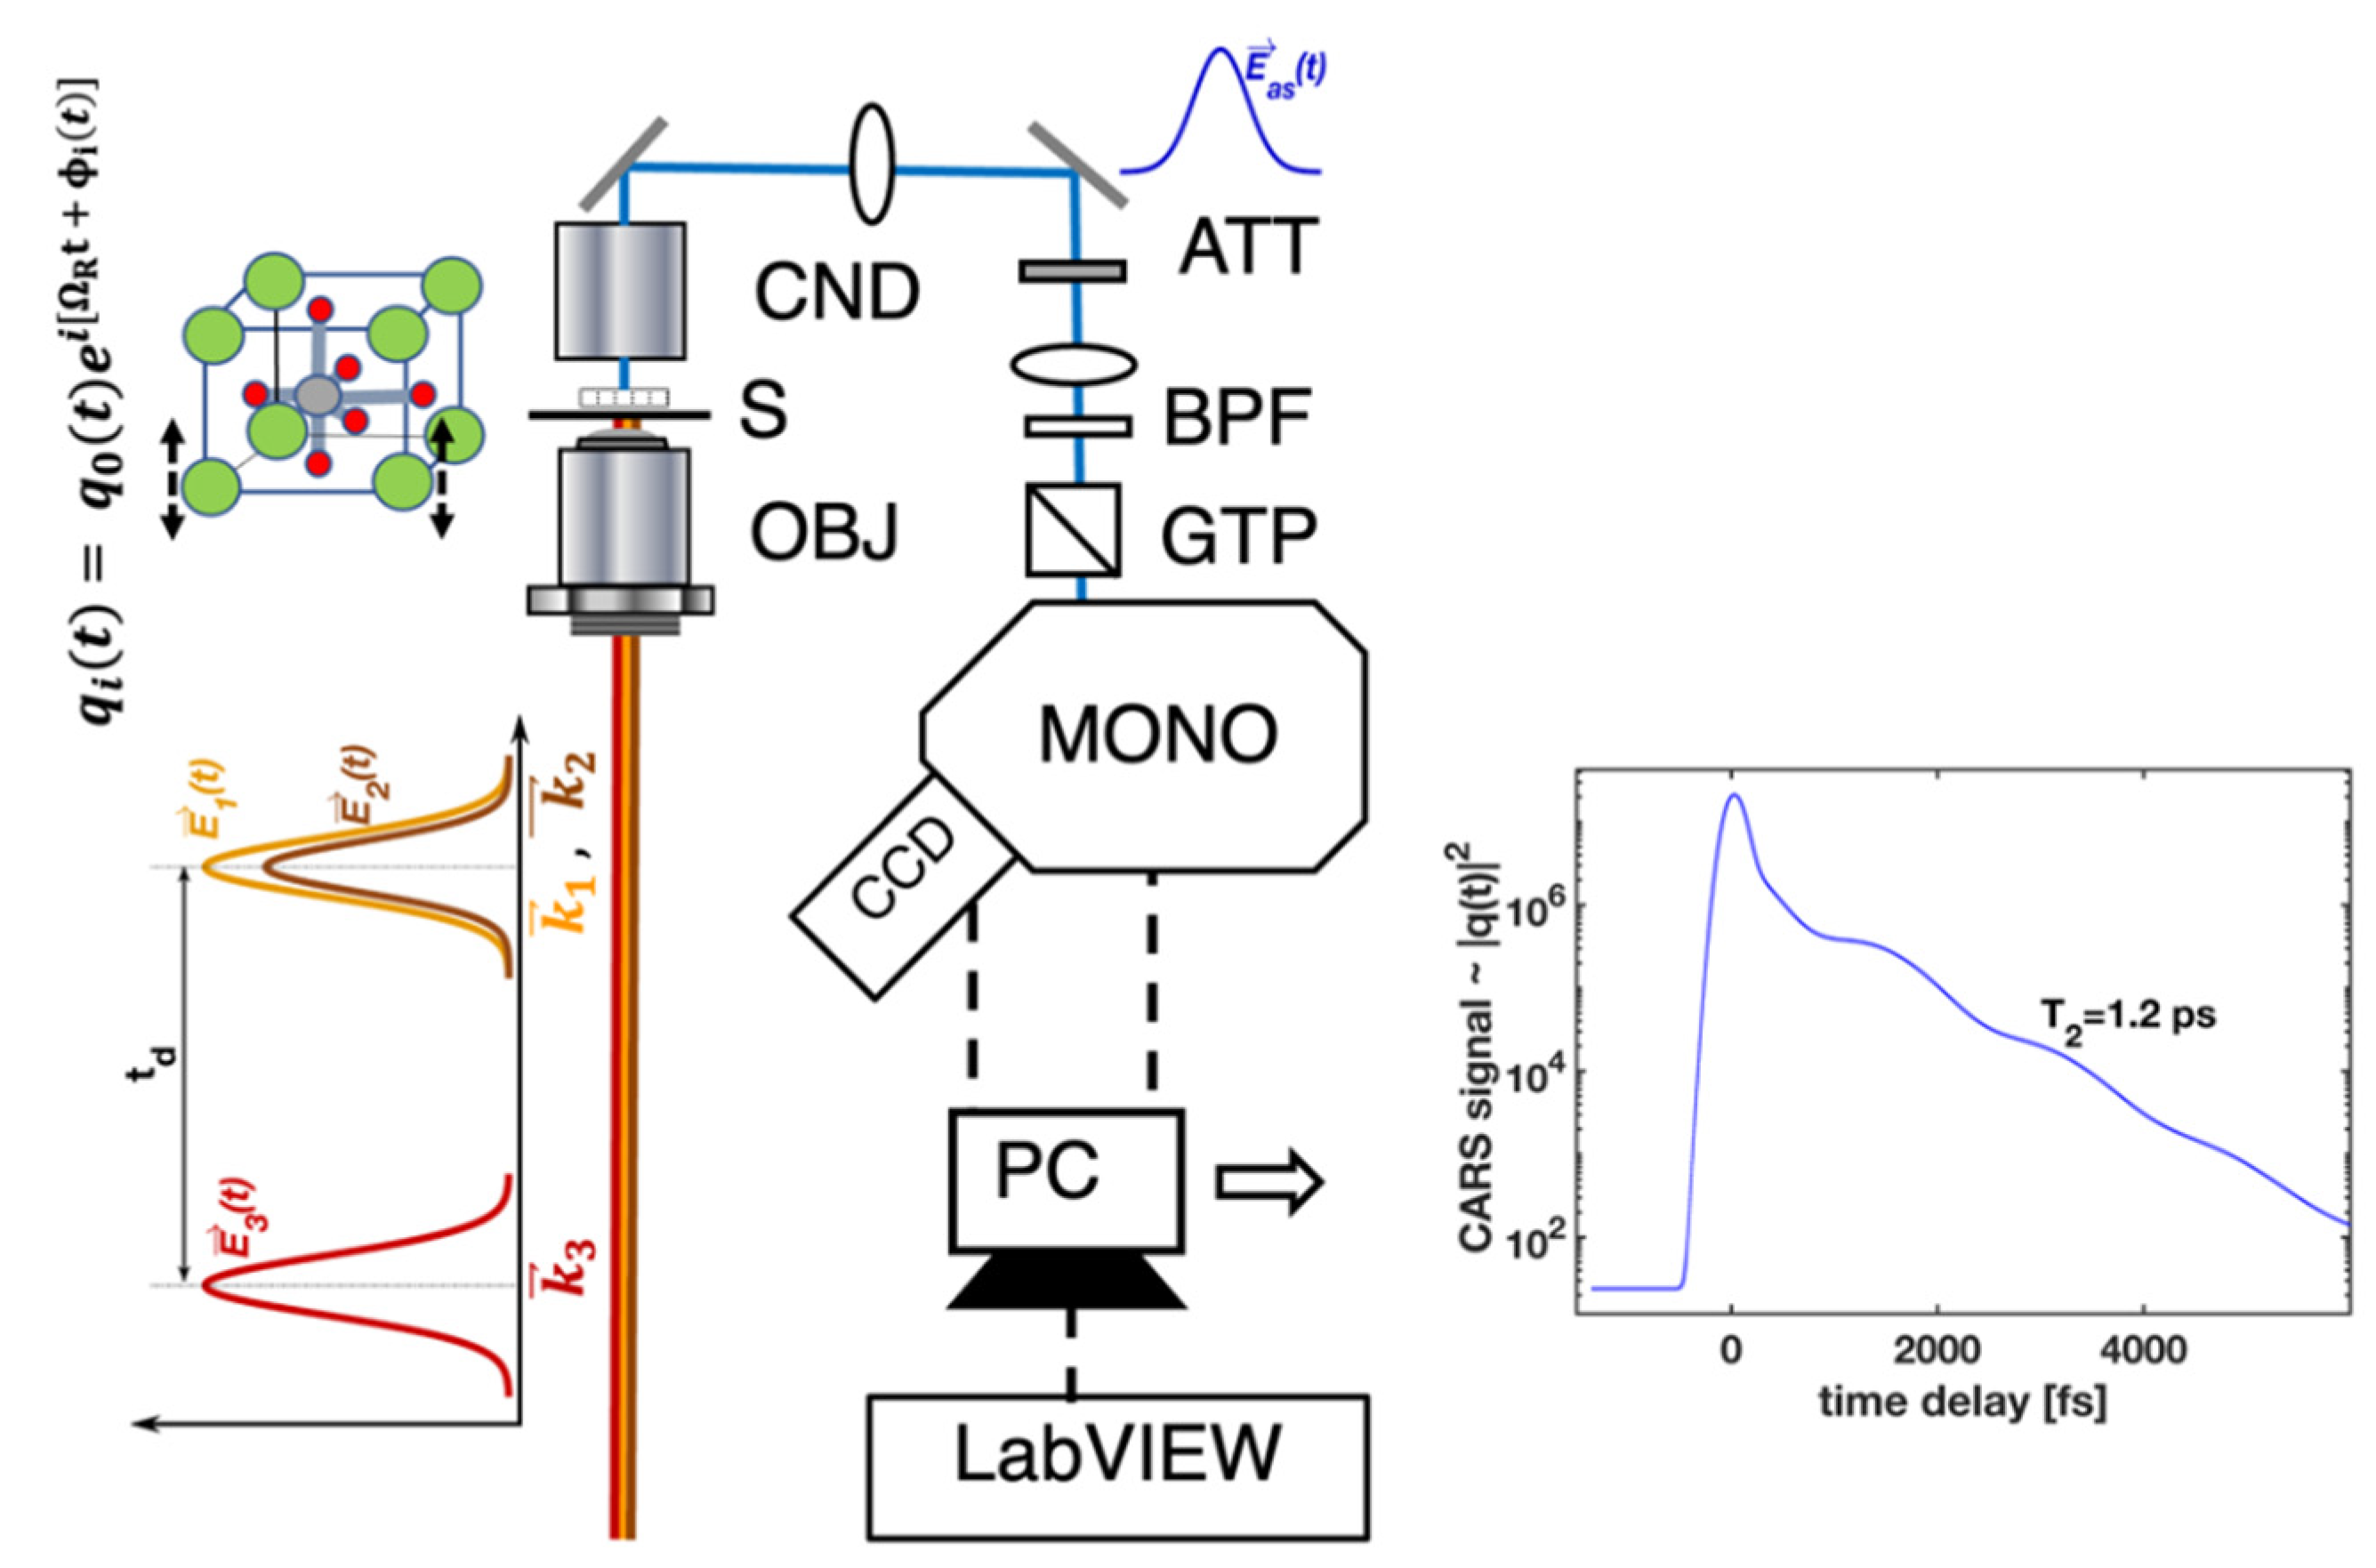
The CARS process, with ultrashort pulses and time resolution, can be considered as a scattering of the probe pulse (
E3(
t)) on the coherent excitation in a material created by the first two pulses (
E1(
t),
E2(
t)) in the vicinity of Raman resonances. In this approach, for time-resolved measurements, excitation and probing processes are separated in time by a delay (
td), and the time-dependent nonlinear polarization can be expressed with the help of the coherent amplitude (
Q) created in the material, characterized by an atomic/molecular density
N and polarizability tensor
α [
16]:
The detected wave is at the anti-Stokes frequency (
ωas = ω1 −
ω2 + ω3) with the corresponding field amplitude
Eas. To efficiently drive lattice vibrations, frequencies
ω1 and
ω2 should be tuned so that the difference (
ω1 −
ω2) matches the characteristic lattice vibration (phonon) frequency (Ω
R). The transient value of
Q(
t) is found from relevant equations [
12,
16] that account for the driving force for vibration and relaxation mechanisms quantified by a time constant
T2. The solutions for
Q(
t) and the time-dependent CARS signal
S(
td) are given by the following equations:
In the equations above, is the driving fields-to-material coupling constant, H(t) is Heaviside’s step function, and are the pulsed fields with the central frequencies , that drive specific vibration(s) at a difference frequency , and is the macroscopic coherent amplitude within the effective focused fields volume. In the case of high-quality crystals, the phase of the individual vibrations (in Equation (2)) is not changed after the pulsed excitation and therefore, one can effectively measure the time-dependent change in the amplitude of . The time constant effectively represents the phonon amplitude decay time. This is the case for homogenously broadened Raman active vibrations, and the corresponding linewidth for the homogenously broadened mode is . The time-dependent CARS signals can be modeled using the theoretical approach outlined by Equations (1)–(5). The experimental results (Figures 2–4) have been fitted using Equations (1)–(4), the final expression (Equation (5)) for , and by varying the time constant until the best fit was found.
Figure 1 provides the main details of the experimental setup. The laser portion of the experimental layout is based on a high-power, mode-locked Ti: sapphire oscillator delivering 120 fs pulses (~30 nJ/pulse) at a 76 MHz repetition rate. The output is split into three parts. Two equal parts (~1 W each) of the output simultaneously pump lab-built, widely tunable optical parametric oscillators (OPO
1,2). The OPOs are widely tunable; the OPO
1 wavelength is maintained at approximately 1015 nm (
), while the OPO
2 output can be tuned within 1030–1250 nm (
).
and
correspond to
and
, the optical frequencies required for CARS. Other details for the OPOs operation and their characteristics are provided in Refs. [
17,
18]. The third portion (~150 mW) of the Ti: S output is used as
E3(
t)—pulse (or probe) beam. Two dichroic mirrors are used to spatially overlap the three outputs—OPO
1,2 and the probe—while the delay stage is used to temporally overlap the pulses. The wavelengths and spectra are monitored with an optical spectrum analyzer (OSA). The three beams are focused with an objective lens (NA = 1.2) onto the sample to produce a CARS signal within a small volume (200 × 550 nm
2 rotational ellipsoid). In the described arrangement,
E1,2(
t) pulses, delivered by OPO
1,2, create a macroscopic coherence (with an amplitude
Q) within the sample material. The delayed probe pulse probes the time evolution of the coherence at successive delay times. Within the signal detection portion, the generated CARS signal, at a wavelength of
, is directed through a condenser, attenuator and lens trail, into a diffraction grating monochromator, and finally, into a cooled CCD detector. Spectrally and time-resolved CARS signal data are acquired and recorded with the help of the LabView program and a PC to provide real-time monitoring and data recording during the experiments. The spectrally and time-resolved CARS signal can be traced in time within nearly 80 dB, with better than 120 fs time resolution [
19].
3. Results and Discussions
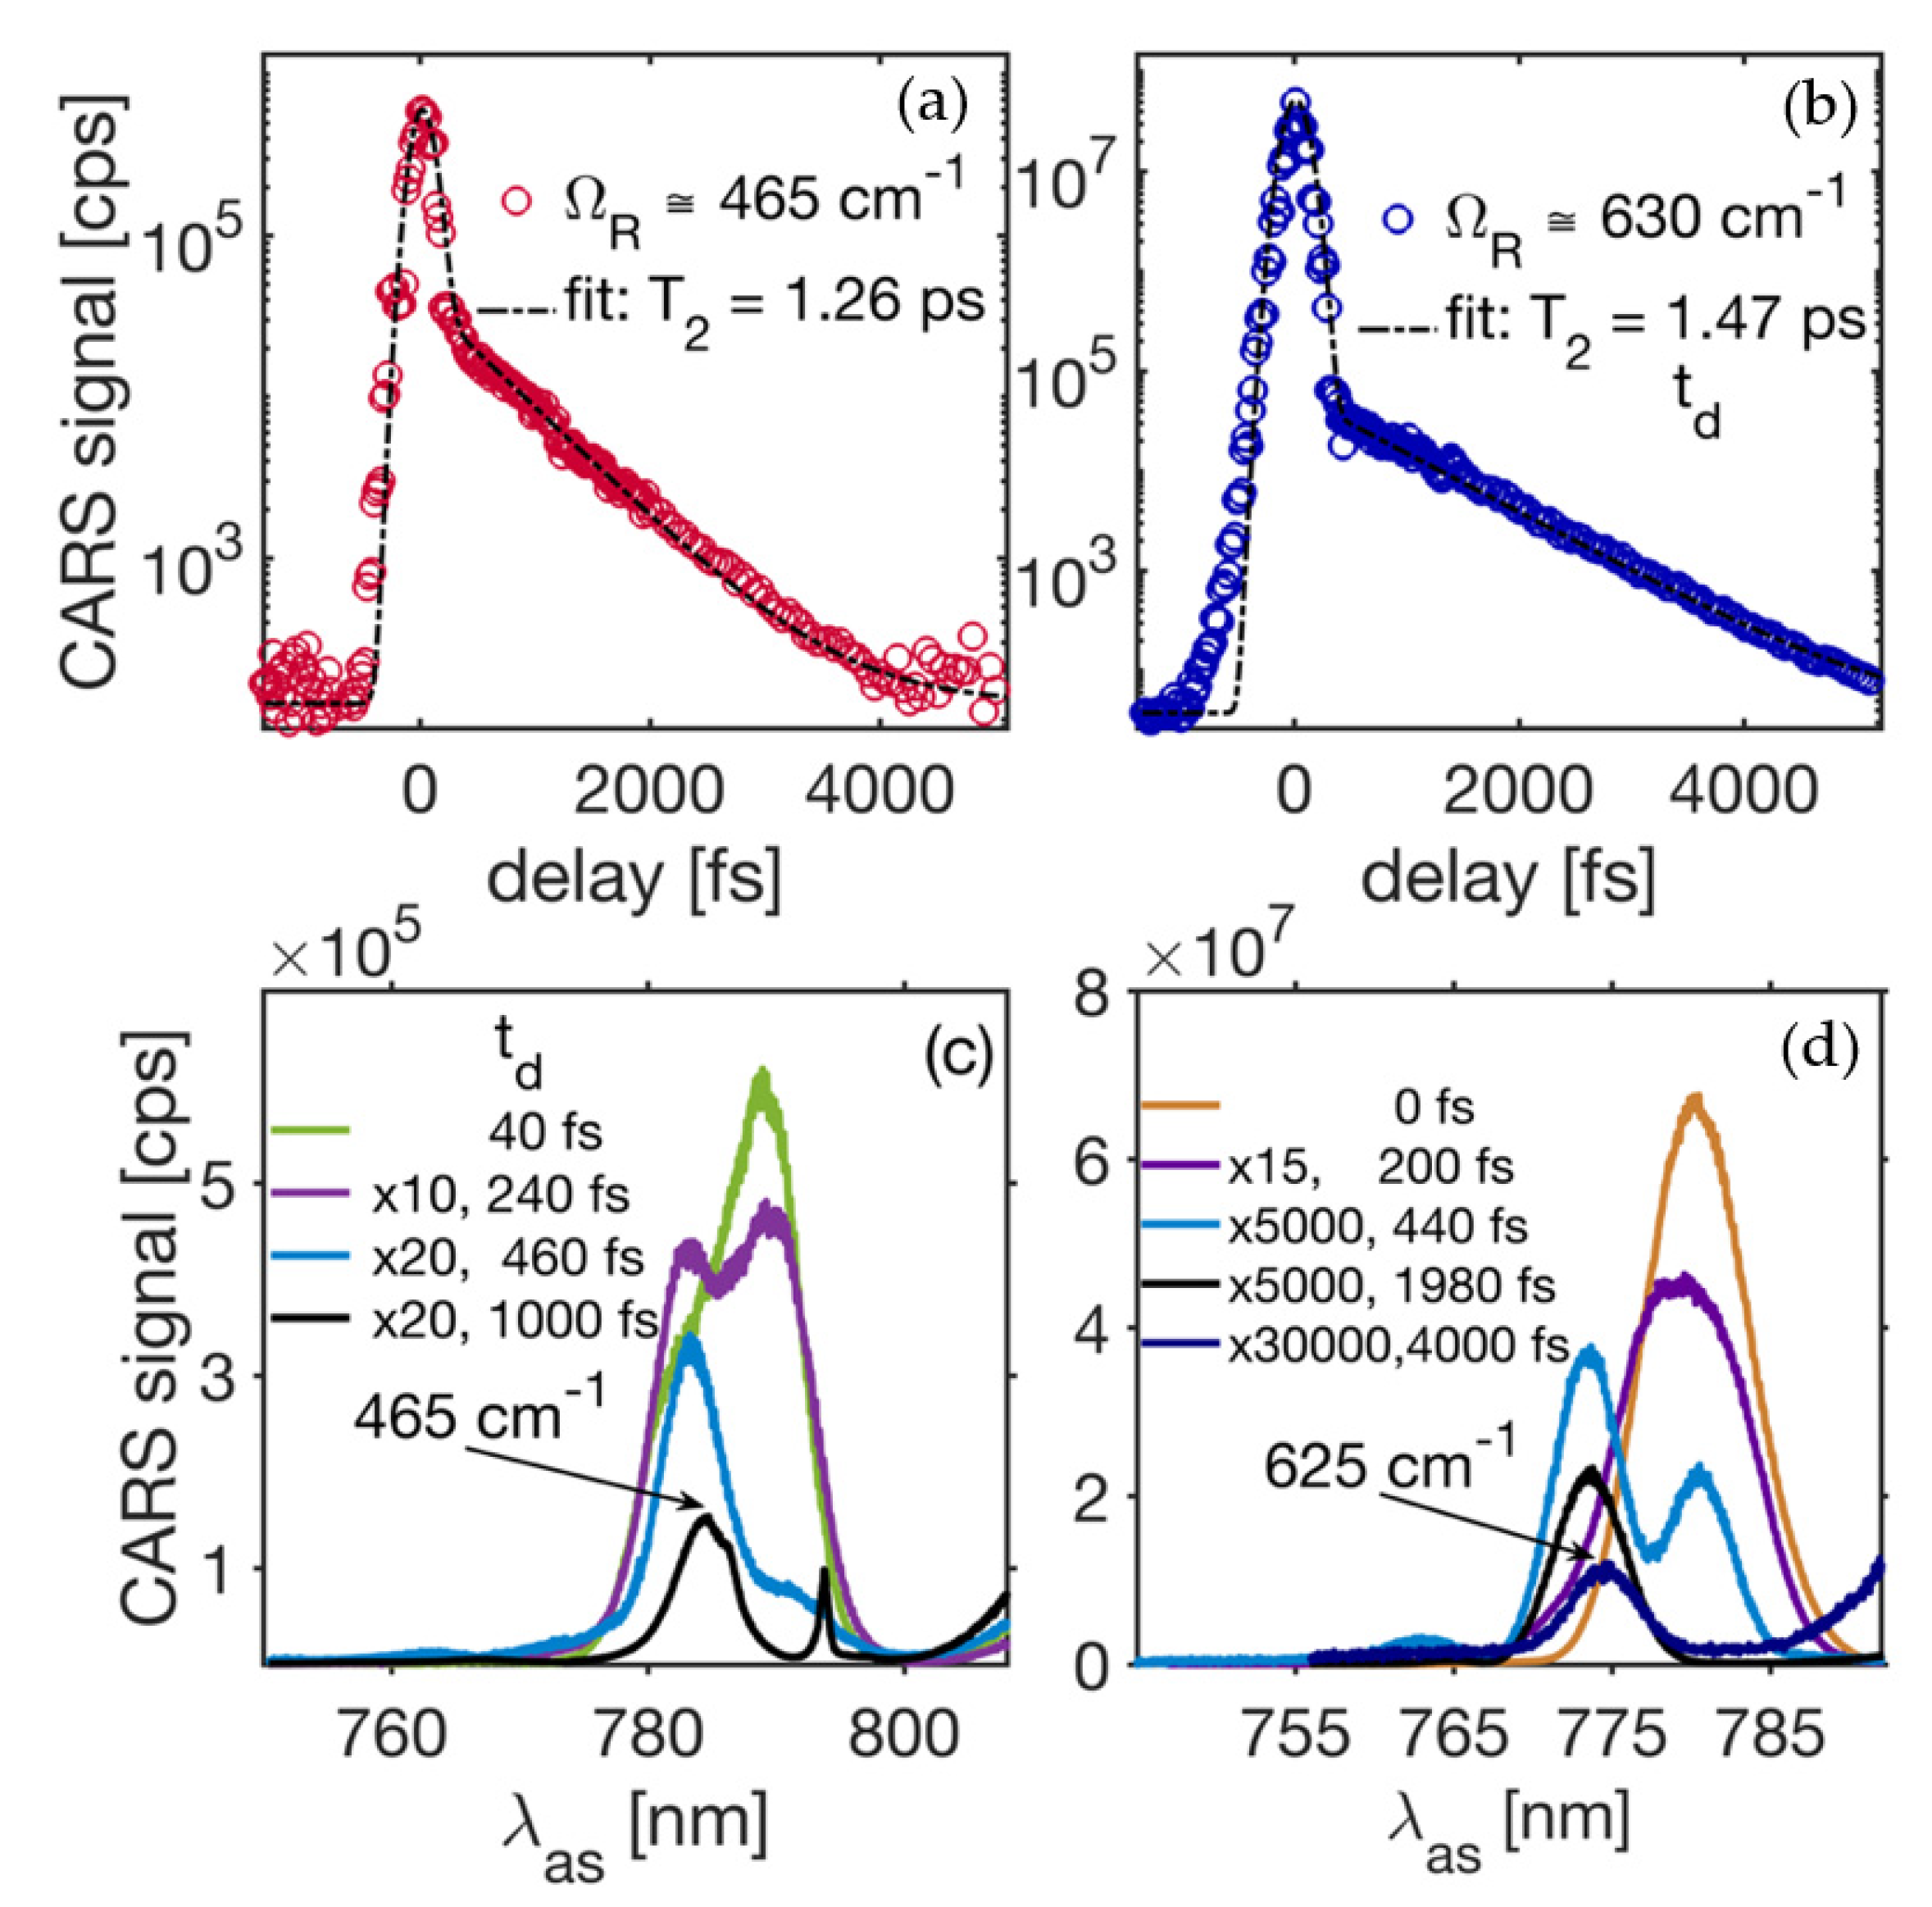
Figure 2a,b show CARS transients measured in cubic BaSnO
3 (BSO) single crystal. In these measurements, the phonon modes at ~465 cm
−1 and ~630 cm
−1 have been targeted. Analyzing spectral data using DFT studies shows that the detected signals correspond to the LO
2 and LO
3 modes. The time-resolved CARS spectra corresponding to the CARS transient in
Figure 2a (red circles) representing the LO
2 mode are shown in
Figure 2c, and the time-resolved CARS spectra corresponding to the CARS transient in
Figure 2b (blue circles) representing the LO
3 phonon mode are shown in
Figure 2d. The decay constant related to the corresponding CARS transients can be precisely obtained by fitting the experimental data for the time-resolved CARS signal with a theoretical model described by Equations (1)–(5). The initial ultrafast decay near the zero-delay time in
Figure 2a,b is time (pulse width) resolution limited and is due to the non-resonant third-order electronic nonlinearity with an equivalent
time less than a few fs [
20]. Opposite to that, the slower decaying portion of a transient CARS date corresponds to the resonant third-order optical nonlinearity due to the driven Raman active mode(s). The phase-matching is an important parameter to generate maximized intensity levels for CARS signals. However, in the tight beam focusing case (i.e., 0.25 × 0.25 × 0.7 μm
3), the phase-matching condition is relaxed due to the short interaction length (L~0.7 μm) so that
k
L << 1. The intensity noise in our measurements is determined by intensity fluctuations for the three fields, and it is estimated to be less than <6% rms. Variations in pulse-to-pulse width are believed to be lower than a few percentage points. The ratio between the resonant and non-resonant components of the signal indicates the strength of the Raman active resonances. The CARS transient in
Figure 2a,b shows a perfect exponential decay corresponding to the probed phonons at different frequencies. Fitting these experimental data with the theoretical model predicts the decay constants at room temperature
and
, corresponding to
Figure 2a,b, respectively. The signal decay constant
yields the corresponding damping rates
and linewidths for the Raman active vibrations. The linewidths corresponding to the LO
2 and LO
3 phonons are
and
respectively, with a spectral resolution of better than
. Both the phase (dephasing) and amplitude slips of the phonon vibration play a key role and determine the time-domain behavior of the CARS transients. However, lattice vibration phase shifts can be neglected in our case, as we have a high-quality crystal in which the spatial disorder and free residual carrier concentrations are under control and thus, very small. Therefore, the pure dephasing mechanism is not contributing, in this case. The amplitude evolution in time for the phonon modes is determined by the efficiency of the phonon interactions due to the anharmonicity of the crystal potential.
The decay of a zone-center (Γ-point) LO-phonon into other phonons is treated in terms of the lowest-order anharmonic term in the crystal potential [
21]. Here, the zero-wavevector phonons normally decay into phonons of lower energy and opposite wavevectors, so that both the energy and the momentum are conserved within the process. The most probable decay path for the traced 465 cm
−1 phonon (LO
2) in our CARS experiment is to split into zone-edge phonons of lower energy (~300 cm
−1 and 160 cm
−1) that have opposite wavevectors. With this assumption, we can estimate that the zero-temperature linewidth, which is directly connected to the anharmonic potential’s third derivative [
21], is 3.89 cm
−1. The latter was with the help of the Δv[cm
−1] = Γ/2
πc relationship between the linewidth (Δv) and the decay rate (Γ) as the linewidth parameter is more commonly used and analyzed in spectroscopy. The LO
3 (~630 cm
−1) vibration matches well with the theoretical predictions for its frequency [
22,
23]. The density functional theory (DFT) results of [
22] show that two momentum- and energy-conserving decay channels are possible. The possible overtone paths will result in final phonons with equal energy (315 cm
−1) and opposite wavevectors, while the combination channel involves two LO-phonons with energies of 480 cm
−1 and 160 cm
−1. Moreover, there are decay paths that involve a pair of LO- and TO-vibrations with energies around 385 cm
−1 and 240 cm
−1, as well as a path that results in the final phonon states at ~490 cm
−1 and ~140 cm
−1. The above arguments, combined with data presented in
Figure 2b for the ~630 cm
−1 mode, yield the decay rate at zero-temperature to be within 0.63–0.89 ps
−1 (or 2.38–3.36 cm
−1 for the linewidths).
Figure 3 shows the time-domain CARS data from the SrTiO
3 single crystal. Two different phonon lines have been assigned as the main LO
3 and LO
4 zone center phonons in earlier works [
24,
25,
26], although the anti-stokes wavelength appears to be somewhat blue-shifted in our experiment.
The two-phonon state (LO
1 + LO
4) that is close to the high-frequency phonon data (
Figure 3b) is believed to be broad [
24] and therefore, should have resulted in a much faster phonon decay time (
). Based on the available data, we conclude that the LO
3 phonon decay is via the phonon split into the LO
1 (~173 cm
−1) and LO
2 (~265 cm
−1) phonons, resulting in the zero-temperature decay rate of 0.86 ps
−1 (linewidth of ~4.6 cm
−1). The detected LO
4 phonon decay appears to be slightly faster, which we explain by the existence of a few different decay channels. Among these is the direct overtone channel that results in two LO
3 phonons that exhibit higher phonon density states, as well as a few other channels that involve parametric interactions of higher order with TO
4 (~550 cm
−1) and LO
1,2 and TO
2,3 phonons of lower energies.
Figure 4 presents time-domain CARS data obtained from KTP (KTiOPO
4) crystal when targeting vibrations around ~724 cm
−1 and ~995 cm
−1. The flux-grown KTP crystal used in the experiment was cut at f = 40° and q = 90°. Therefore, all four A
1–A
4 symmetry tensor components can be involved. The crystal’s multiatomic unit cell makes the lattice spectra complex, as it can consist of about one hundred Raman active peaks, and the phonon line assignments may bring ambiguous results. However, contributions to Raman and infrared spectra from major atomic units within the primitive cell, as represented by TiO
6 octahedra and PO
4 tetrahedra, have been elucidated from previous studies [
27,
28,
29]. We must note that the KTP Raman spectra in the vicinity of 650–850 cm
−1 have shown a rich structure consisting of several strong Raman active lines. We have been able to differentiate between them by resolving the components spectrally within the anti-Stokes spectra and separately tracing the CARS signal decay in the time domain. The resonant contribution for the excited and probed ~830 cm
−1 mode, shown in
Figure 4a, is dominant, as the time resolution limited peak is absent. The experimental CARS signal shows nearly perfect exponential decay, with close to a straight-line signal trend (on the semilogarithmic plot) for over four decades. The exponential decay over several orders of magnitude proves that the Raman line is homogenously broadened. Indeed, the Fourier-transform calculations [
30] for the CARS signal show less than a percent deviation from the Lorentzian line shape. The decay rate, obtained from the best-fitting results and shown as a dashed line in
Figure 4a, indicates a
time constant of 470 fs. The corresponding homogeneous linewidth is Δv = 22.6 cm
−1. Again, we stress that the line broadening is solely due to the loss of vibrational energy to other (lower energy) vibrational modes. The fast decay rate (broad linewidth) is explained by the fact that the final phonon states are the ones with high density, and that this is the main factor for the fast 824 cm
−1 phonon decay rate compared to other modes. The latter are presented with an example of probing the lattice vibration mode at ~995 cm
−1. The mode is substantially weaker, as can be seen by a strong enough non-resonant contribution to the signal compared to the lower and much slower decaying resonant portion. The corresponding T
2 time is found to be 1.58 ps, which results in a linewidth of 6.7 cm
−1. We believe that the decay paths into lower energy phonon modes are impeded by a lack of channels with high enough density of states for the final phonons of ~ 400–600 cm
−1 energy.


