Abstract
The increasing reliance on conventional coatings such as WC-Co raises serious environmental and health concerns due to the toxicity of cobalt and the ecological footprint of these materials. To address this challenge, the present study explores the development of eco-friendly multifunctional coatings via the Plasma Spray (PS) process, using titanium (Ti), silicon carbide (SiC), and tungsten carbide-cobalt (WC-Co) mixtures as alternative feedstocks. Steel substrates were coated under different deposition strategies (powder mixing, layer-by-layer) and current settings (800-900 A). The coatings were characterized by scanning electron microscopy (SEM/EDX), 3D profilometry, sliding wear testing, and potentiodynamic corrosion measurements. Results showed that Ti-WC (mix, 900 A) and Ti-SiC (layer, 900 A) coatings achieved the most favorable performance, combining excellent adhesion, uniform coverage, reduced porosity, and improved resistance to wear and corrosion compared to conventional Cr2O3 coatings. Notably, Ti-WC coatings provided surface roughness values comparable to Cr2O3, while significantly lowering the environmental impact. These findings demonstrate that PS-based Ti-WC and Ti-SiC systems can serve as sustainable and high-performance alternatives for protective applications in harsh environments, particularly in marine industries, supporting the transition toward coatings with reduced ecological footprint.
1. Introduction
In recent years, Thermal Spray (TS) processes are widely used in various industries, and their use is expected to continue to increase. Thermal Spray comprises a set of procedures wherein a heat source converts both metallic and non-metallic materials into molten or semi-molten particles. These particles are then sprayed and deposited onto a properly prepared substrate [,,,,]. Any material that retains its integrity without undergoing sublimation or decomposition at temperatures close to its melting point can undergo the thermal spray (TS) process. These materials can exist in the form of powder, wire, or rod during the spraying application []. Thermal spray (TS) coatings exhibit various properties, including substrate wear protection, resistance to substrate oxidation and corrosion, compatibility with specific substrates, thermal insulation, and electrical conductivity. These coatings find application in a diverse range of industries, including spacecraft, aircraft engines, gas turbines, chemical reactors, mills, thread guides, bridges, pumps, compressors, medical implants, and more [,].
Various thermal spray coating methods exist, including Flame Spray, High-Velocity Oxy-Fuel (HVOF), High-velocity Air Flame (HVAF), Electric/Wire Arc Spraying, and Plasma Spray (PS) [,,]. Plasma spraying was first introduced by Reinecke in 1939 and has since become a well-established method, widely used for wear, corrosion, and oxidation protection. By the mid-1960s, it had largely supplanted flame and arc spraying, particularly in applications involving wear, corrosion, and oxidation protection. Notably, in the 1980s, plasma spray coatings saw significant advancements in the realm of advanced low-pressure spray materials [,,].
The PS process necessitates a spray gun to generate an arc, which in turn creates plasma by ionizing a continuous flow of gas (typically Ar or N2). The arc is contained between a water-cooled copper anode and a refractory-metal cathode. Historically, thoriated tungsten electrodes were used; however, thorium-free cathodes (e.g., lanthanated or ceriated tungsten) are now widely available and are often preferred to avoid radioactive additives. This process is often termed non-transferred arc spraying because the arc remains confined to the plasma gun. Typically operating within a power range of 20-100 kW, current and voltage depend on electrodes, gas flows, and compositions. Plasma temperatures reach 10,000–15,000 °C (≈5500 °C at the exit), and plasma velocities typically range from 200 to 600 m/s [,,].
In recent years, extensive research has been conducted using powders such as titanium (Ti), silicon carbide (SiC), and tungsten carbide-cobalt (WC-Co) for plasma spraying. In the present work, Ti-WC and Ti-SiC systems are investigated as alternative compositions to conventional WC-Co and Cr2O3 coatings. Titanium alloys are extensively utilized in aerospace, medical equipment, and various other fields due to their advantageous properties such as low density, high toughness, and strong corrosion resistance []. Titanium silicon carbide has garnered considerable attention owing to its notable combination of metallic and ceramic properties, including high electrical and thermal conductivity, a high elastic modulus (320 GPa), enhanced fracture toughness (7 MPa/m2), excellent high-temperature stability (approximately 1700 °C), and good machinability [,]. Another commonly used type of powder, either individually or in combination, is WC-Co. WC-Co coatings are renowned for their outstanding wear resistance and fracture toughness, making them a popular choice for enhancing the wear resistance of various engineering components [,]. WC-Co, introduced in 1927, has since been produced with various ceramics and metals to enhance their properties. Coatings based on TiC, Ti (C, N), and WC-Co binders are used on metals as Co, Fe, Mo, Ni, or alloys and are now widely utilized across different industries [,]. In this study, Ti-WC and Ti-SiC systems were selected as candidate materials because they combine advantageous ceramic and metallic properties, offering a balance of hardness, toughness, corrosion resistance, and thermal stability, while also being relatively cost-effective and commercially available in powder form suitable for plasma spraying. Titanium promotes strong adhesion and corrosion resistance, while WC and SiC provide hardness and wear resistance. Compared to other superhard ceramics such as cubic boron nitride (cBN), hexagonal boron nitride (hBN), or boron carbide (B4C), the selected systems offer easier processing by thermal spray techniques, lower raw material cost, and better compatibility with metallic substrates. These considerations make Ti-WC and Ti-SiC more suitable for developing multifunctional, eco-friendly coatings within the scope of this work. Previous studies have highlighted the toxic nature of WC-Co particles in a dose- and time-dependent manner, along with their significant negative environmental impact []. Consequently, there is a raising need to introduce new innovative materials and deposition processes for developing coatings that offer protection against wear and corrosion while also delivering multifunctionality (e.g., high hardness, self-lubrication, enhanced mechanical properties, good thermal behavior). These coatings should also possess environmentally friendly potential, with a reduced minimal ecological footprint in terms of both materials and processes.
Despite the widespread success of WC-Co and Cr2O3 coatings in wear- and corrosion-resistant applications, their continued use is challenged by environmental and health concerns. Cobalt-containing powders are known to be toxic in a dose- and time-dependent manner, while the production and application of Cr2O3 coatings involve a considerable ecological footprint. These drawbacks highlight a pressing need for new coating systems that combine excellent wear and corrosion resistance with lower environmental impact. Titanium- and silicon-carbide-based composites are promising candidates, offering high strength, thermal stability, and corrosion resistance, while being more environmentally sustainable. The Plasma Spray (PS) process provides a versatile platform for developing such coatings; however, systematic investigations of Ti-WC and Ti-SiC systems are still limited. Addressing this gap is critical to advancing sustainable surface engineering solutions for demanding industrial and marine environments.
The objective of this work is to develop and evaluate environmentally friendly multifunctional coatings produced by the Plasma Spray process, using Ti-WC and Ti-SiC systems as alternatives to conventional WC-Co and Cr2O3 coatings. To achieve this objective, the research tasks focused on preparing steel substrates and depositing coatings under different conditions (powder mixing versus layer-by-layer, at 800–900 A); characterizing coating morphology, porosity, and microstructure by SEM and EDX; evaluating surface roughness using 3D white light profilometry; assessing wear behavior through tribological testing; and investigating corrosion resistance by electrochemical methods in NaCl solution. Finally, the results obtained from Ti-WC and Ti-SiC coatings were systematically compared with conventional Cr2O3 coatings to highlight their performance and eco-friendly potential for demanding industrial and marine environments.
The novelty of this work lies in the systematic development and evaluation of Ti-WC and Ti-SiC coatings by plasma spraying as eco-friendly alternatives to WC-Co and Cr2O3, with combined morphological, tribological, and electrochemical assessment under identical processing conditions.
2. Materials and Methods
2.1. Materials
The chemical composition of the substrate steel and the sprayed powders, as provided by the supplier, is summarized in Table 1. Both Ti-WC and Ti-SiC were produced by mechanically mixing powders of their compounds for approximately 1 h using a mixer. Another set of samples with the same substrate and coatings underwent a layer-by-layer deposition of Ti-WC and Ti-SiC, respectively (e.g., one layer of Ti, one layer of WC). Additionally, Plasma Spray was employed on a set of steel substrate samples using common coating powder of Cr2O3 in order to compare them with the other coatings in terms of environmental impact. Figure 1 presents all coated specimens used in this study, while Table 2 provides their respective characteristics. Especially as far as the powders used for the manufacturing stage are concerned, their characteristics were as follows: (a) Al2O3 for sand blasting: angular shape of −325 mesh size, (b) Ti: angular shape of 20–100 μm size, (c) Cr2O3: angular shape, 10–50 μm size, (d) Ni-Al (90/10 at.%) intermediate layer: atomized, 20-50 μm size, (e) SiC: angular shape, 20–80 μm size, (f) WC-Co (83/17 wt.%): angular shape, 20–80 μm size. All sizes (except of Al2O3 which was provided by the supplier) were measured using ImageJ for Windows, version 1.52v (National Institutes of Health, Bethesda, MD, USA). In the Ti-WC and Ti-SiC systems, cobalt was included as a binder phase in order to improve the cohesion between hard ceramic particles and the metallic matrix, a well-established approach in WC-Co coatings. The ductile Co phase facilitates better particle packing, reduces brittleness, and enhances adhesion to the substrate. Although direct adhesion strength testing (e.g., ASTM C633 pull-off test) was not performed in this study, cohesion was evaluated indirectly through SEM/EDX analysis, porosity measurements, and wear/corrosion testing, which consistently indicated strong interfacial bonding and mechanical integrity of the coatings.

Table 1.
Chemical composition of the substrate steel and sprayed powders.

Figure 1.
Macroscopic panoramic view of the coated specimens, including Ti-WC/Co and Ti-SiC coatings (layer-by-layer and mix deposition at 800 and 900 A) and reference Cr2O3 coatings.

Table 2.
Characteristics of the samples used in this study, including substrate type, coating composition, deposition method (powder mixing or layer-by-layer), plasma spray parameters (current), and reference Cr2O3 specimens for comparison.
Prior to spraying, all powders were dried at 110 °C for 2 h to remove residual moisture and sieved to eliminate large agglomerates, ensuring good flowability during feeding. The granulometric composition of the powders was determined by optical microscopy followed by quantitative image analysis using ImageJ, which confirmed particle size distributions within the 20–80 µm range suitable for plasma spraying. This range was selected as optimal because it provides a balance between sufficient melting (finer particles melt more easily) and reduced oxidation or overspraying (coarser particles ensure deposition stability). Such a particle size window is well known to promote good adhesion to the substrate and limit porosity in the deposited layers by enabling adequate particle flattening and inter-splat cohesion.
2.2. Plasma Spray Process
The Plasma Spray (PS) technique was utilized to coat various powders with different parameters. The substrates in all applications were steel (S235) samples (50 × 50 × 6.25 mm), which underwent sandblasting (using Al2O3), with pressure 6-8 bar and a duration of 10–15 s to ensure thorough cleaning (refer to Figure 2) and were sprayed with a NiC-Al layer to enhance the adhesion of the coatings.

Figure 2.
Sandblasting procedure applied to the S235 steel substrates prior to plasma spraying.
The apparatus for the Plasma Spray deposition technique is shown in Figure 3, with constant coating parameters except for the current, which varied to 800 and 900 Amber(A) (as shown at Table 2). Specifically, within a suitably shaped chamber, a base was utilized on which the samples were welded, and a spray gun was employed to generate an arc, thereby creating plasma through ionizing a continuous flow of Ar and He gas for powder deposition. Coatings were deposited using a DC non-transferred arc plasma torch, equipped with a water-cooled copper anode/nozzle and a thorium-free tungsten cathode. Argon was employed as the primary plasma gas and helium as the secondary gas to increase jet enthalpy and thermal conductivity. The torch operated at a constant current of 800 A or 900 A (Table 3), and the corresponding measured voltages were 43 V and 39.3 V, yielding ≈ 34–35 kW of power (system rating 40 kW). The spray distance was maintained at 80 mm, and the gun was mechanized at 30 m·min−1 over the sample surface. Powder was delivered from a dual-hopper feeder and injected into the plasma jet at 90°. All other parameters were kept constant for all coatings. Helium was used as a secondary gas in combination with argon in order to increase the enthalpy and thermal conductivity of the plasma jet, thereby improving particle heating and accelerating the molten particles toward the substrate. Compared with hydrogen, which is also commonly used as a secondary gas, helium was preferred because it is chemically inert and avoids the risks of oxidation and hydride formation in Ti-containing powders, while also eliminating the safety hazards associated with hydrogen handling. Additionally, a control panel was present to facilitate the selection of required settings, along with two powder receptacles. The utilization factor (deposition efficiency) of the sprayed powders was determined as the ratio of the coating mass deposited on the substrate to the total powder mass supplied during spraying, according to Equation (1):
where mfed is the total powder mass supplied and mcoating is the coating mass deposited. The coating mass was calculated from the coating thickness, density, and sprayed area. This measurement allowed direct comparison of deposition efficiency among the different systems.
η = (mcoating/mfed) × 100%

Figure 3.
Schematic representation of the plasma spray apparatus. The system comprises the spraying chamber with mounted substrates, the spray gun, and the control panel with powder feeders.

Table 3.
Plasma spray process parameters.
To further rationalize the influence of spraying parameters, phenomenological equations were employed to link the process conditions with coating properties. Following the response-surface approach widely used in thermal spray studies, porosity (P) can be expressed as a function of particle temperature (Tp) and velocity (Vp), which themselves depend on arc current (I), gas settings (Q), and spray distance (S):
where F is powder feed rate, dp the particle size, and v the traverse speed. Adhesion strength (σβ) is modeled as inversely proportional to porosity and positively correlated with the particle state, for example:
Tp = a0 + a1I + a2Q − a3S
Vp = b0 + b1I + b2Q − b3S
P(%) = k Tp (−α) Vp (−β) Sγ Fδ dpε vζ
σβ = σmax e (−κP) (1 + η1Tp + η2Vp)
2.3. Methods
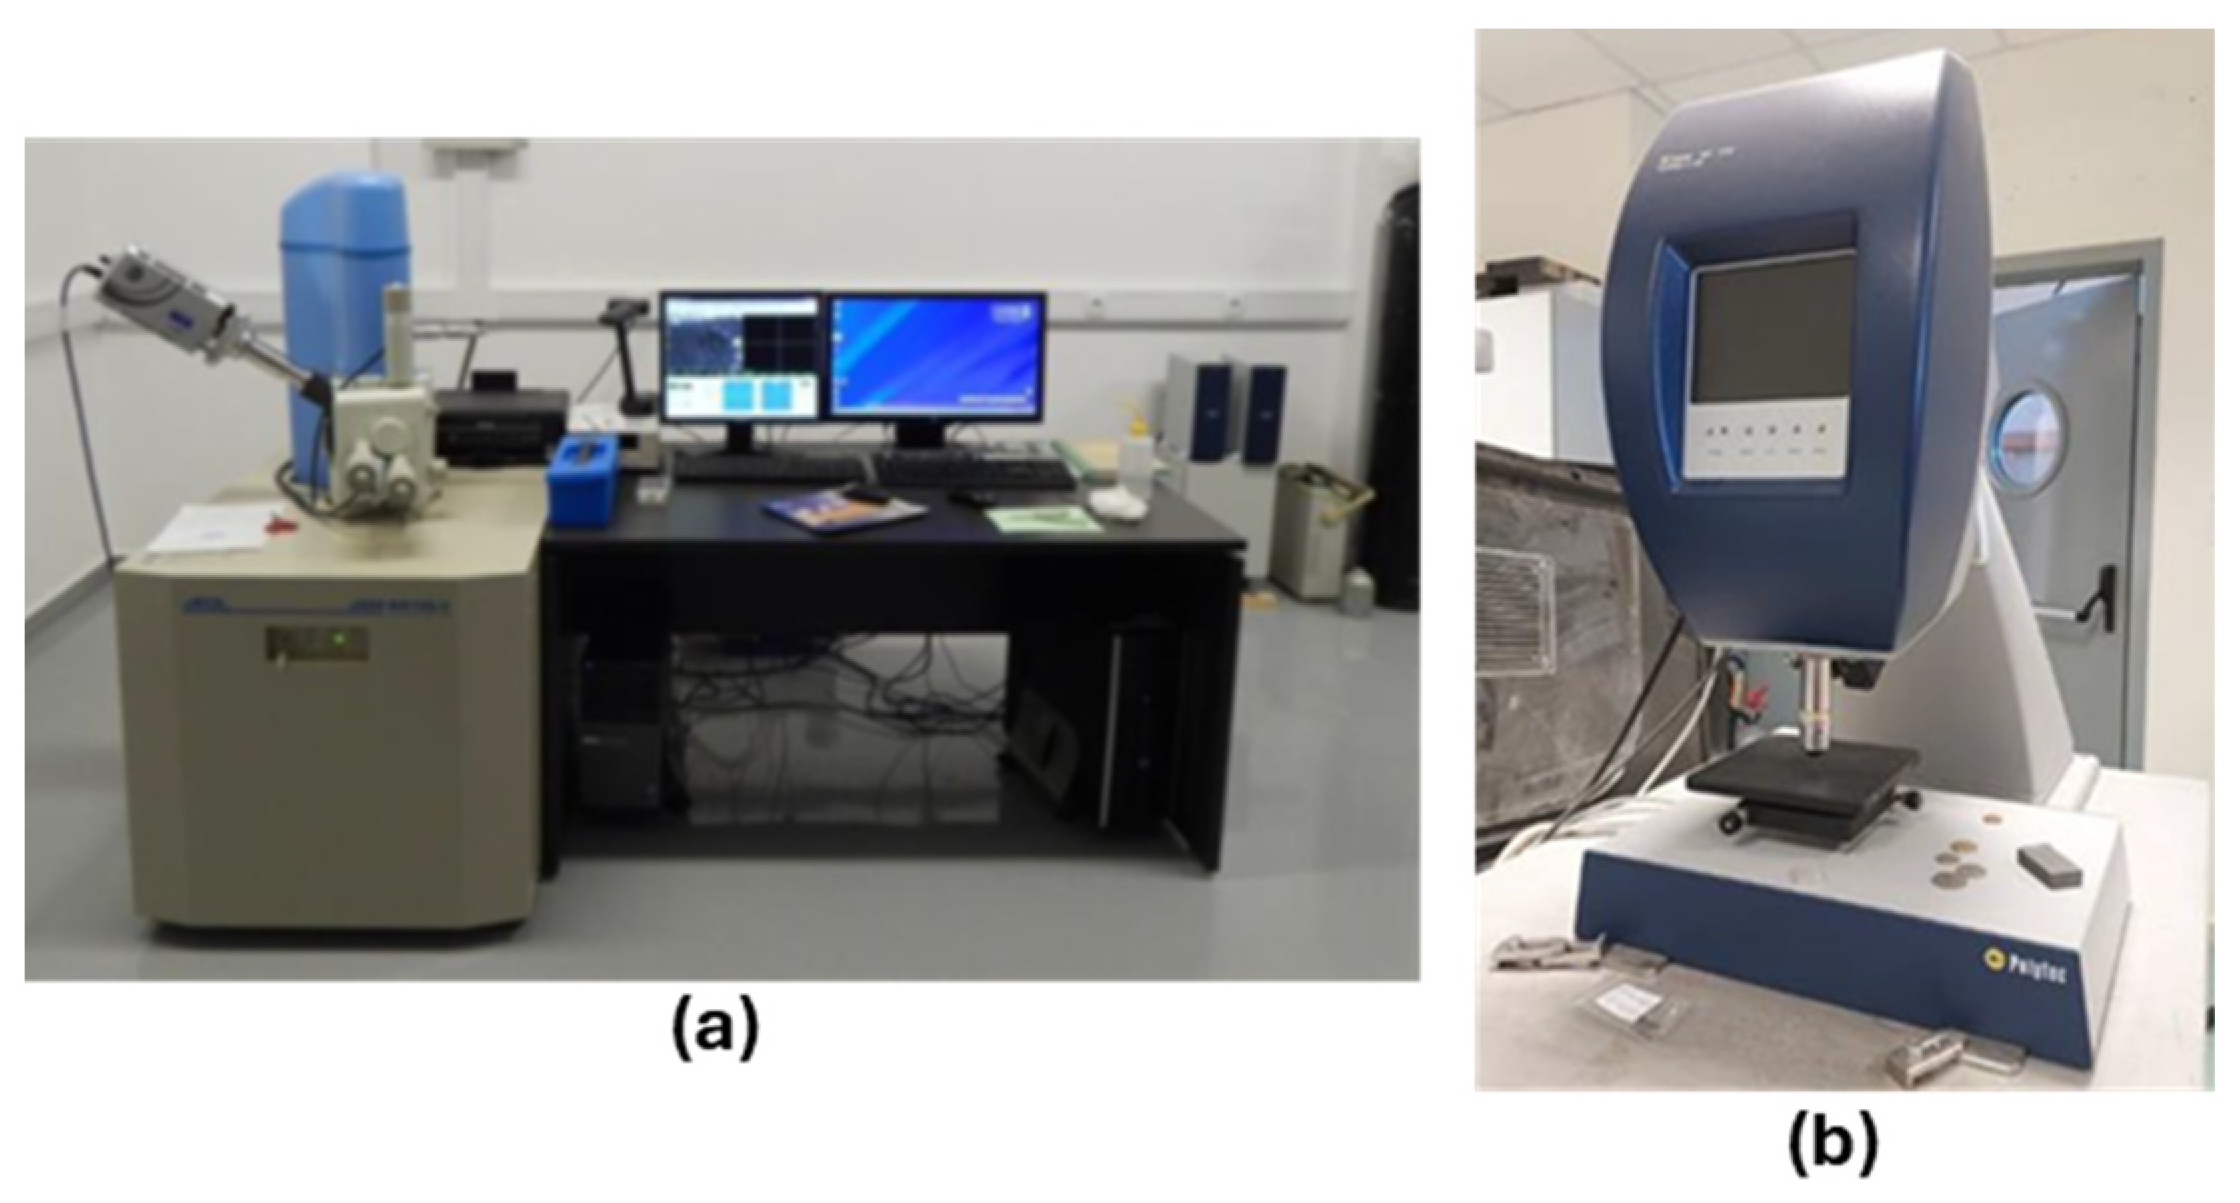
The coatings were characterized by a combination of complementary techniques. Microstructural and compositional features were examined using Scanning Electron Microscopy (SEM) coupled with Energy-Dispersive X-ray spectroscopy (EDX), which provide non-destructive and rapid results across various substrates [,,,,,]. Surface roughness and texture were assessed by 3D white light profilometry, one of the latest non-destructive methods for quantifying micro-scratches and machining patterns [,,]. Corrosion behavior was evaluated by electrochemical testing, a key tool for assessing material performance in aggressive environments [,,], while tribological testing was carried out to determine wear resistance, which is closely related to coating microstructure and properties [,,,]. The morphological characteristics of the coatings were evaluated using a scanning electron microscope (JEOL 6510LV, JEOL Ltd., Akishima, Tokyo, Japan) equipped with EDX analysis (X-act, Oxford Instruments plc, Abingdon, Oxfordshire, UK) as shown in Figure 4a. The surface roughness of the specimens has been determined via a white light profilometer (TMS-1200, Polytec GmbH, Waldbronn, Germany) by Polytec Company (Figure 4b). Two-dimensional and three-dimensional imaging with a 634.35 nm × 634.52 nm resolution is available. The scanning area, measuring 883.02 µm × 659.9 µm, was consistent across all samples. The root means square roughness (Sq) was calculated according to ISO 25178. For each coating, three different regions were analyzed to ensure reproducibility. Image J software was used for the quantification of various morphological features, such as coating thickness, porosity, cracks/flaws. More specifically, the porosity of the coatings was determined by quantitative image analysis of polished cross-sectional SEM micrographs, following the procedure of ASTM E2109 []. Representative backscattered electron (BSE) images were acquired at different magnifications, and pores were distinguished by contrast thresholding. The porosity percentage was then calculated as the area fraction of pores relative to the total analyzed area using ImageJ software. For each coating, at least five different regions were analyzed to ensure statistical reliability.

Figure 4.
(a) Scanning Electron Microscope (SEM) JEOL 6510 LV and (b) white light profilometer (TMS-1200) by Polytec.
The sliding wear experiments were conducted using a ball-on-disk (CSM-Instruments SA, Peseux, Switzerland) TRIBOMETER (Figure 5a). The measurement parameters were set as follows: load of 2 N, wear radius of 3 mm, and speed of 10 cm/s. A 100Cr6 steel ball with a diameter of 6 mm served as the counterpart material, and the sliding distance was set to 1000 m. At regular intervals (every 200 m), measurements were halted, and the debris was collected. Subsequently, the samples were cleaned with acetone, weighed, and returned to the tribometer for further measurement. The wear imprint on the opposing surface was examined using electron microscopy. Cyclic polarization testing was conducted using a Gamry Reference 600 potentiostat/galvanostat from Gamry Instruments, located in Warminster, PA, USA, as illustrated in Figure 5b. The testing consists of a standard three-electrode cell configuration, with saturated calomel serving as the reference electrode (SCE) and a graphite gauge utilized as the counter electrode. Corrosion behavior was investigated in an aerated 3.5% NaCl solution with a pH of 7. The open-circuit potential (Eocp) was measured after 1 h of immersion in the solution and the scan rate for the polarization testing was set at 10 mV/min. The initial potential for the measurement was established at −200 mV versus the open circuit, and the apex was set at +200 mV (the point where the reverse curve begins) relative to the Eocp. If corrosion did not reach the set apex potential, the reverse curve commenced when the current exceeded 1 mA/cm2.

Figure 5.
(a) CSM-Instruments ball-on-disk tribometer and (b) Organology of Gamry Reference 600 for the corrosion test.
Adhesion/cohesion of the plasma-sprayed coatings was assessed indirectly through (i) cross-sectional SEM/EDX observations of the coating/substrate interface, (ii) quantification of porosity and microcracks, and (iii) performance metrics from tribological and electrochemical tests, which are sensitive to interfacial integrity. Continuous interfaces without interfacial gaps, low porosity, and stable wear/corrosion responses were used as indicators of good coating cohesion and adhesion to the steel substrate. No direct quantitative adhesion test was performed in this study. For completeness, we note that tensile adhesion per ASTM C633/ISO 14916 [] (bond strength by pull-off) and progressive-load scratch testing per ASTM C1624 [] (critical load for coating delamination) are widely used standards to obtain numerical adhesion/cohesion values in thermal-spray coatings and will be considered in future work.
3. Results and Discussion
3.1. SEM-EDX Analysis
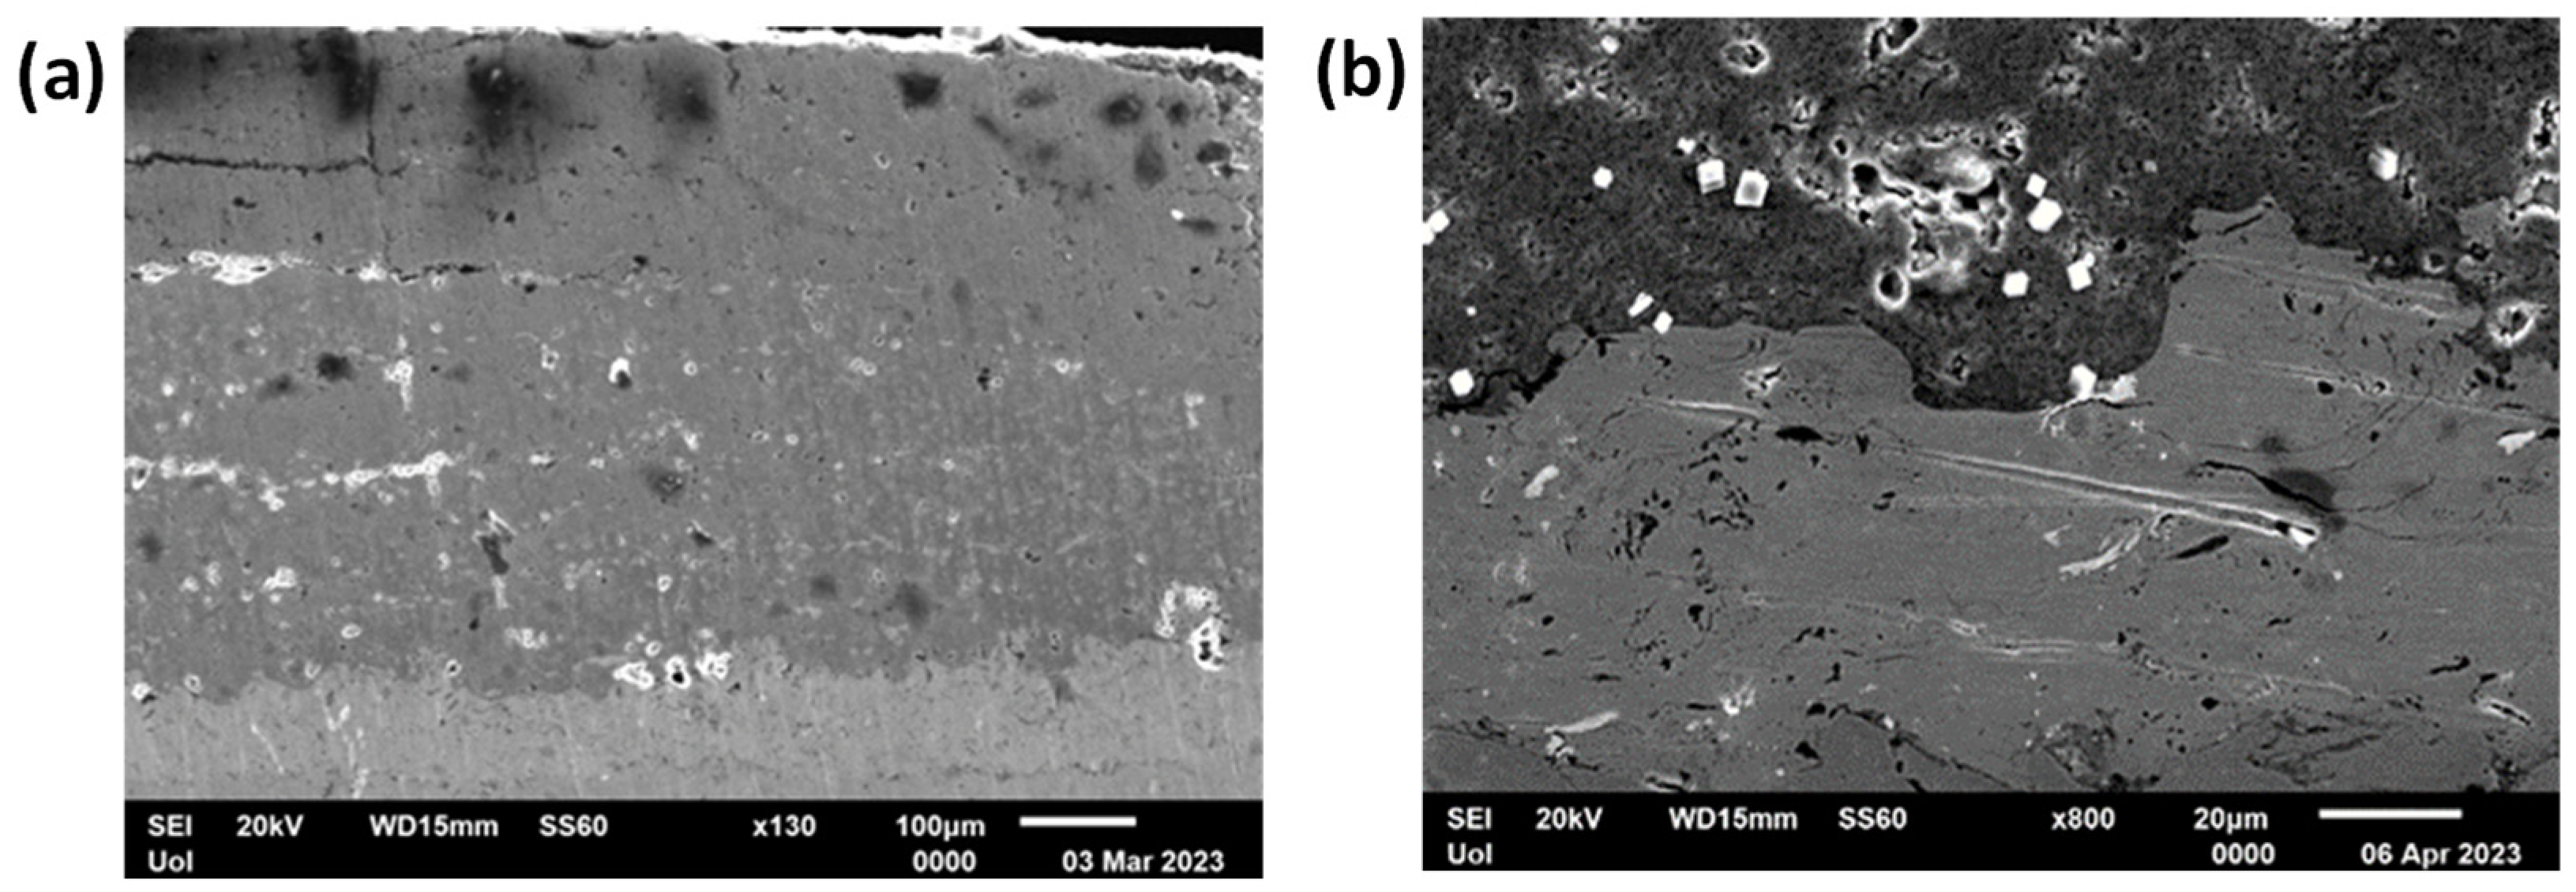
An indicative image of the Cr2O3 coatings is shown in Figure 6a,b. The microstructure of the Cr2O3 coating at 800 A, observed at ×130 magnification as depicted in Figure 6a, reveals uniformity and good adhesion to the substrate with minimal discontinuities. Some porosity and cracks can be seen mainly within the Cr2O3 layer. The initial Ni-Al layer was measured to be around 100 μm, whereas the Cr2O3 layer was measured to be within the range of 400–500 μm. Porosity and microcracks/flaws were measured to be 11–13% of the total area. The microstructure of the Cr2O3 coating at 900 A, observed at ×800 magnification as shown in Figure 6b. Here, the attention is focused on the primary Ni-Al layer where the presence of some porosity along with microcracks can be observed. Microcracks and porosity were measured to be also within the range of 11–13% surface coverage. There is a slight unevenness in thickness, yet good adhesion to the substrate is demonstrated despite the few discontinuities. The coating thickness was measured to be 60–70 μm for the primary Ni-Al layer and 50–60 μm for the Cr2O3. This difference in thickness was not deliberately selected but it was a rather random outcome during the manufacturing stage. The measured utilization factor ranged between 55 and 65%, depending on the coating system and current. The highest values were recorded for Ti-WC coatings sprayed at 900 A, confirming the improved melting and adhesion achieved at higher spraying energy.

Figure 6.
SEM micrographs of Cr2O3 coatings at (a) 800 A and (b) 900 A. Both coatings exhibit good adhesion to the substrate. Porosity and microcracks are visible, more pronounced in the 900 A sample.
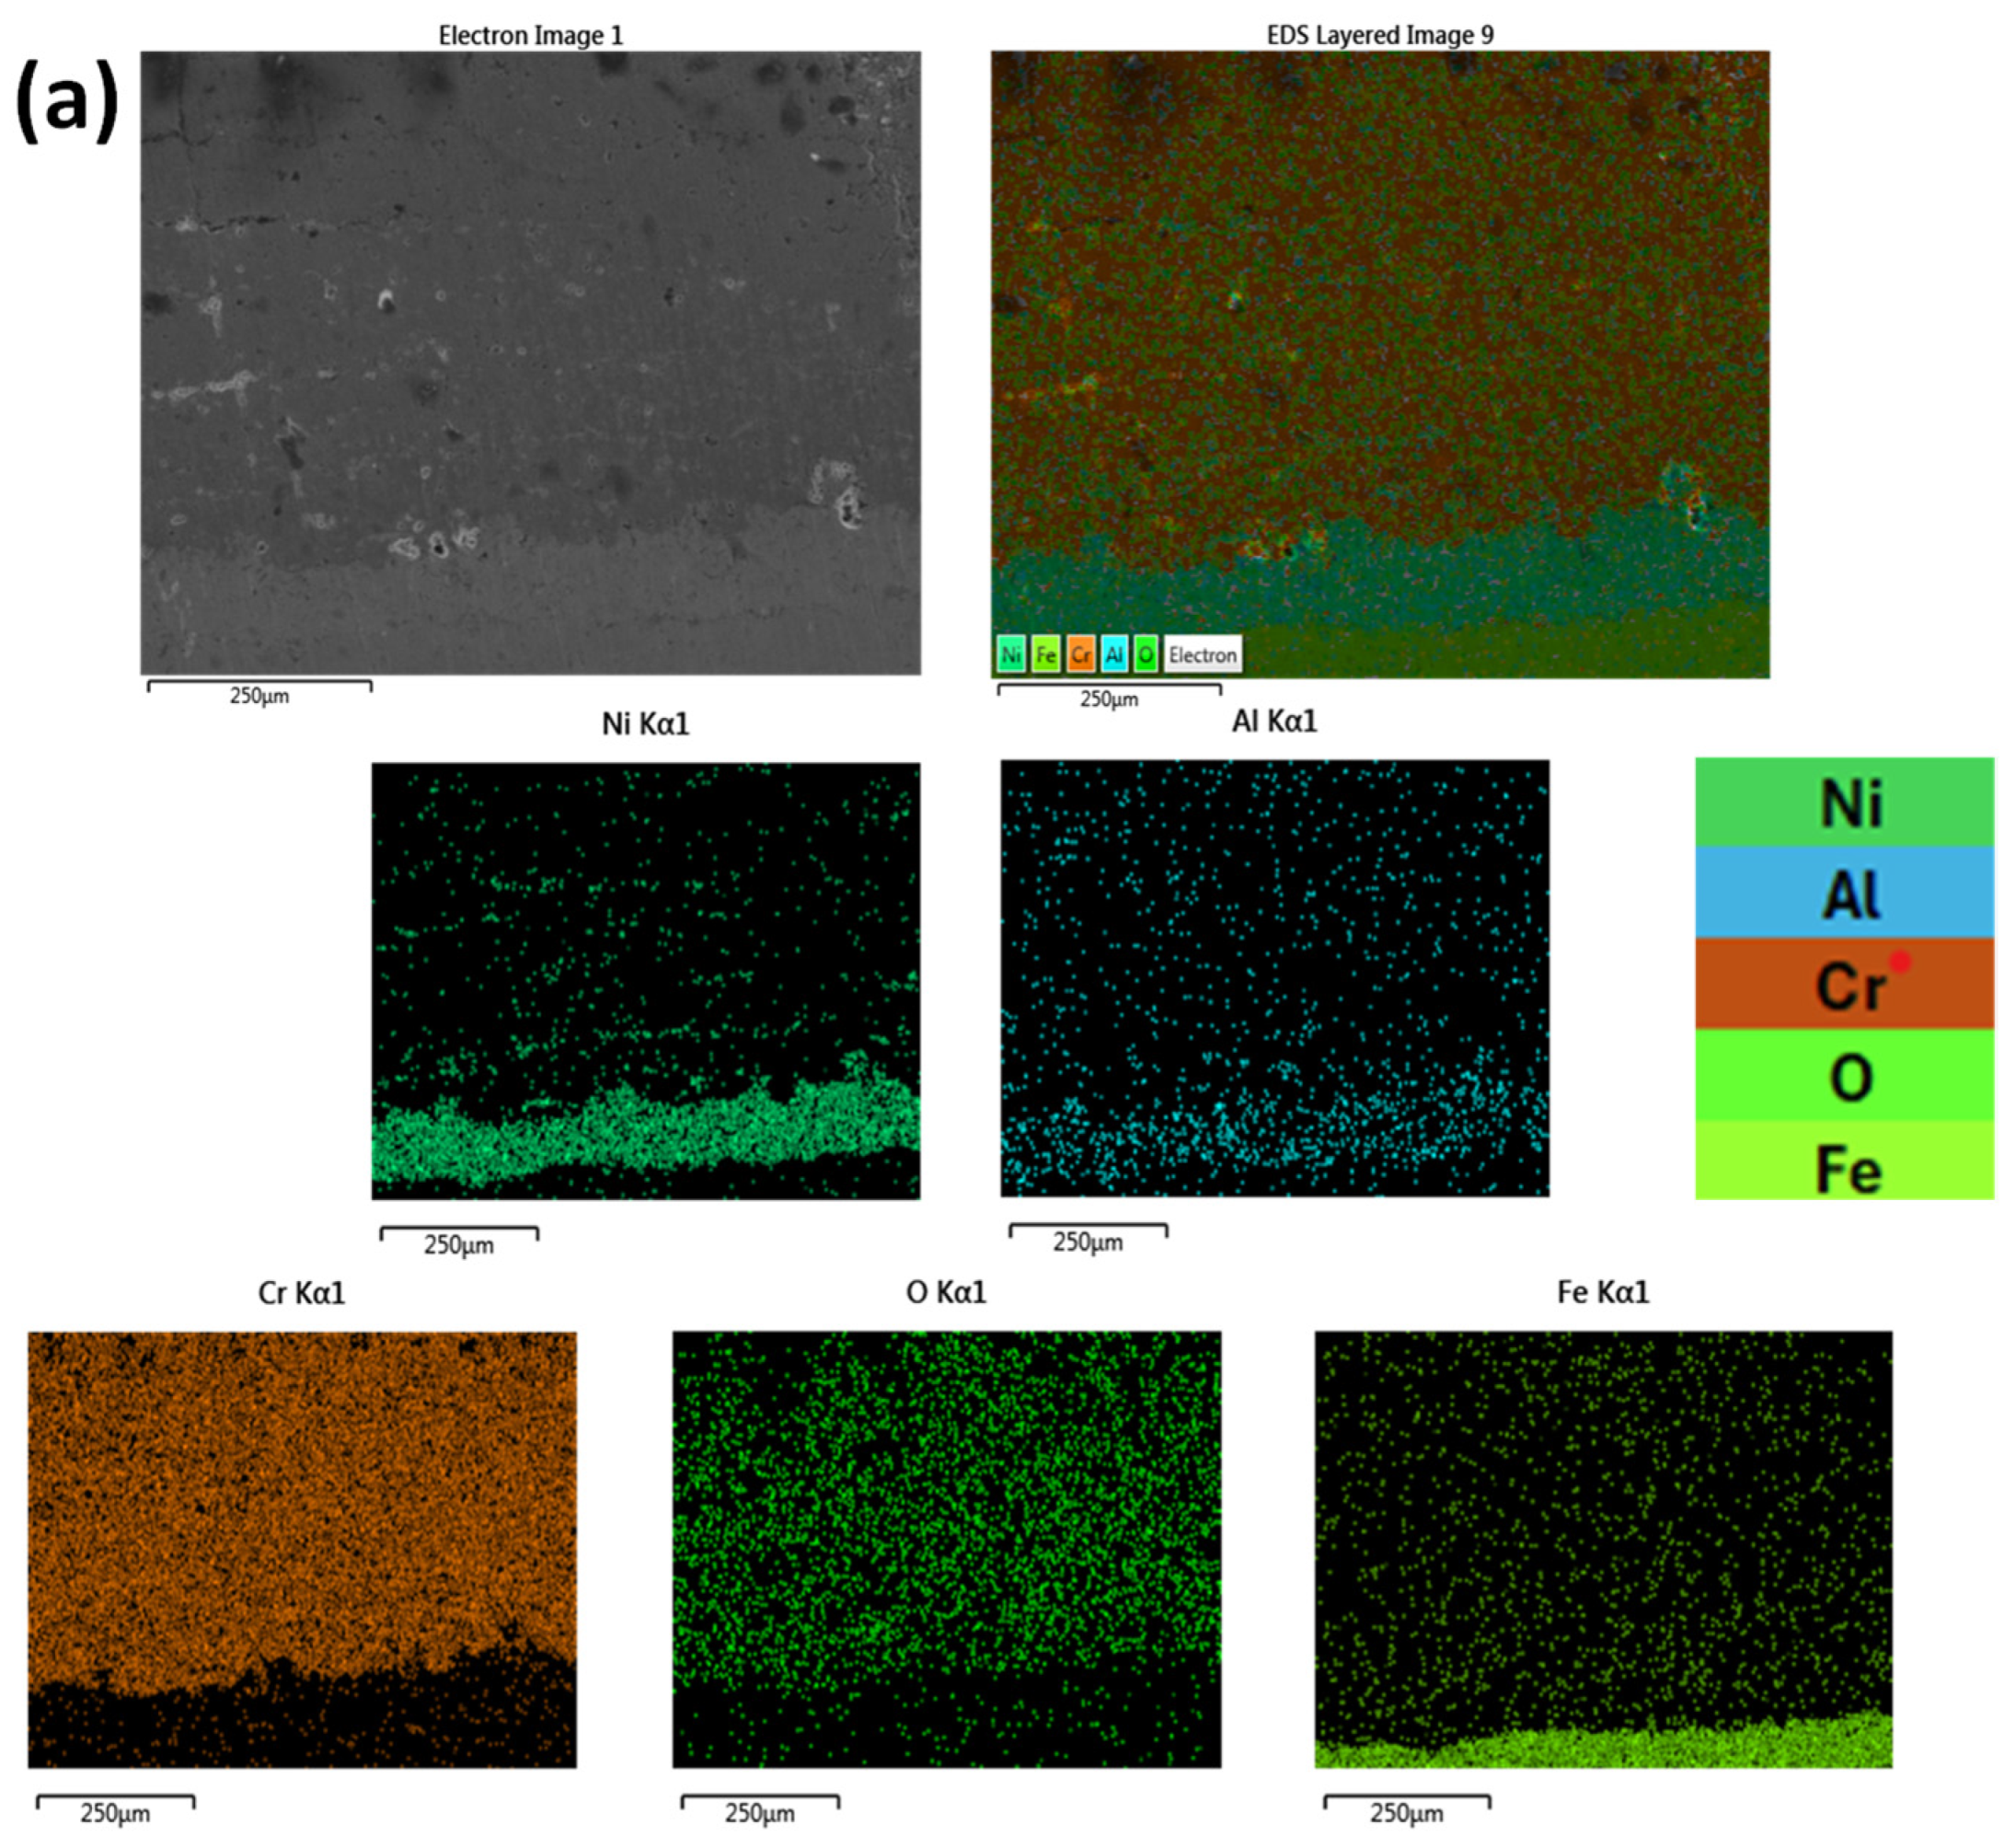
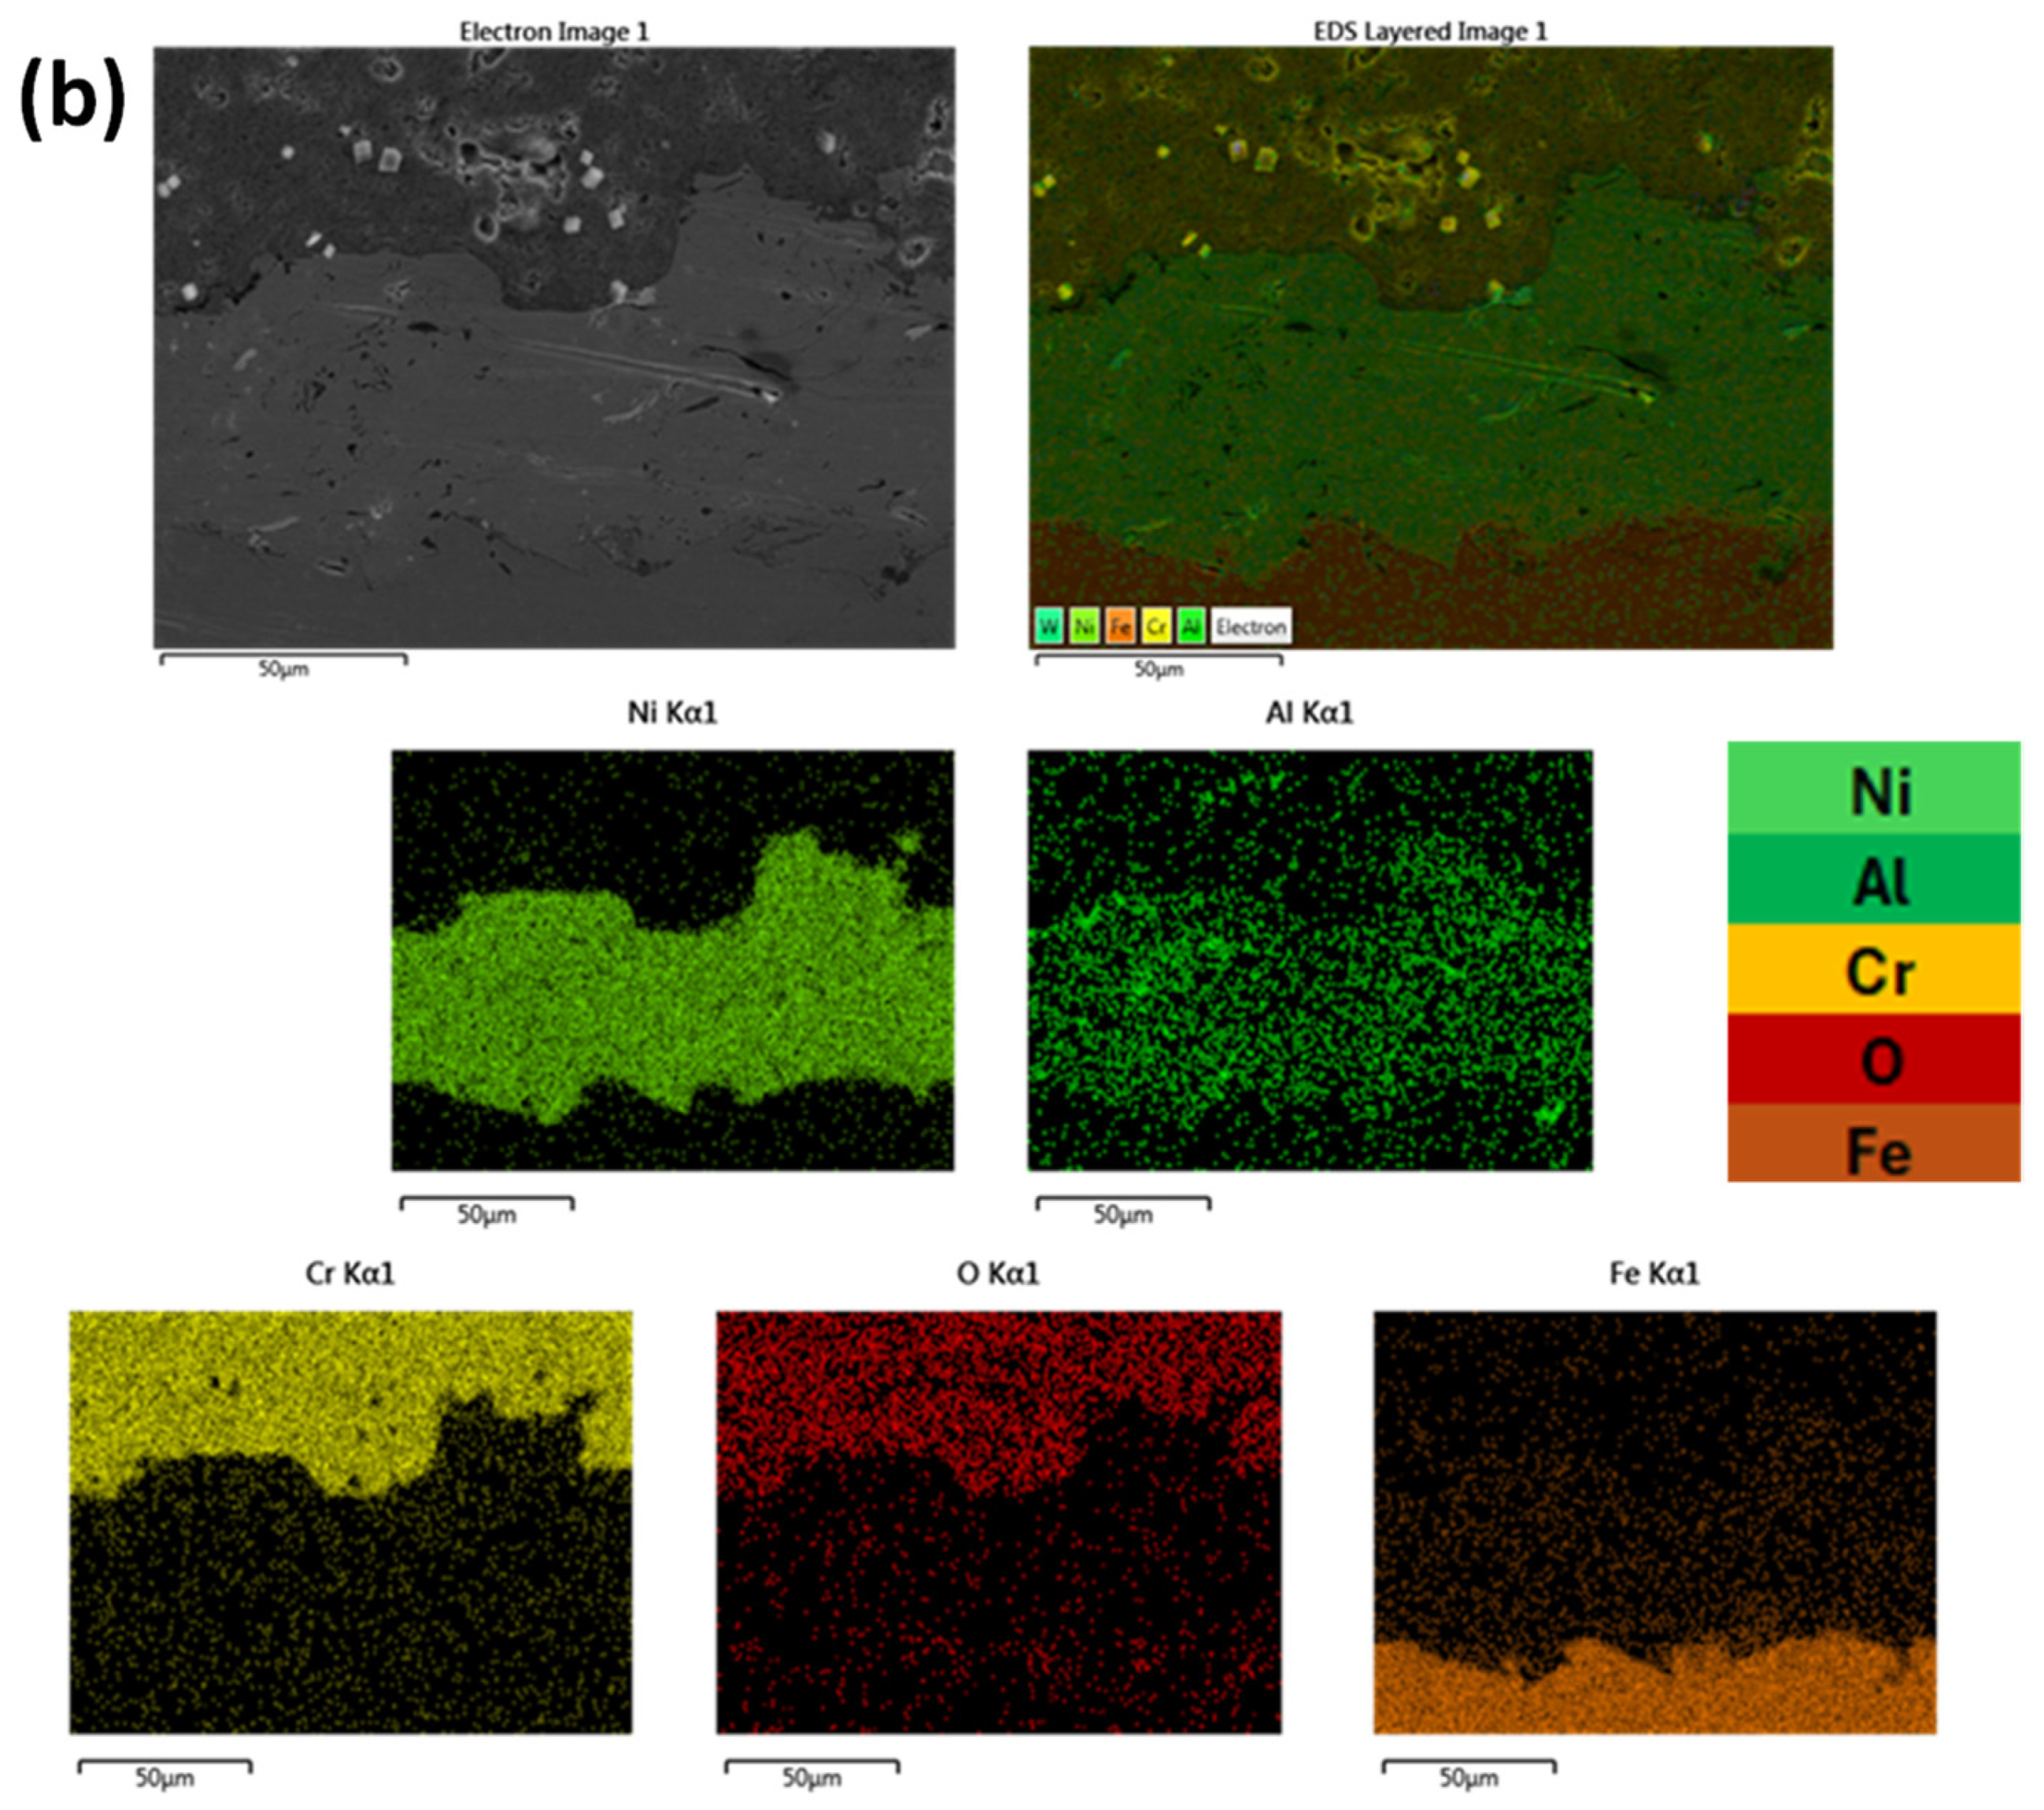
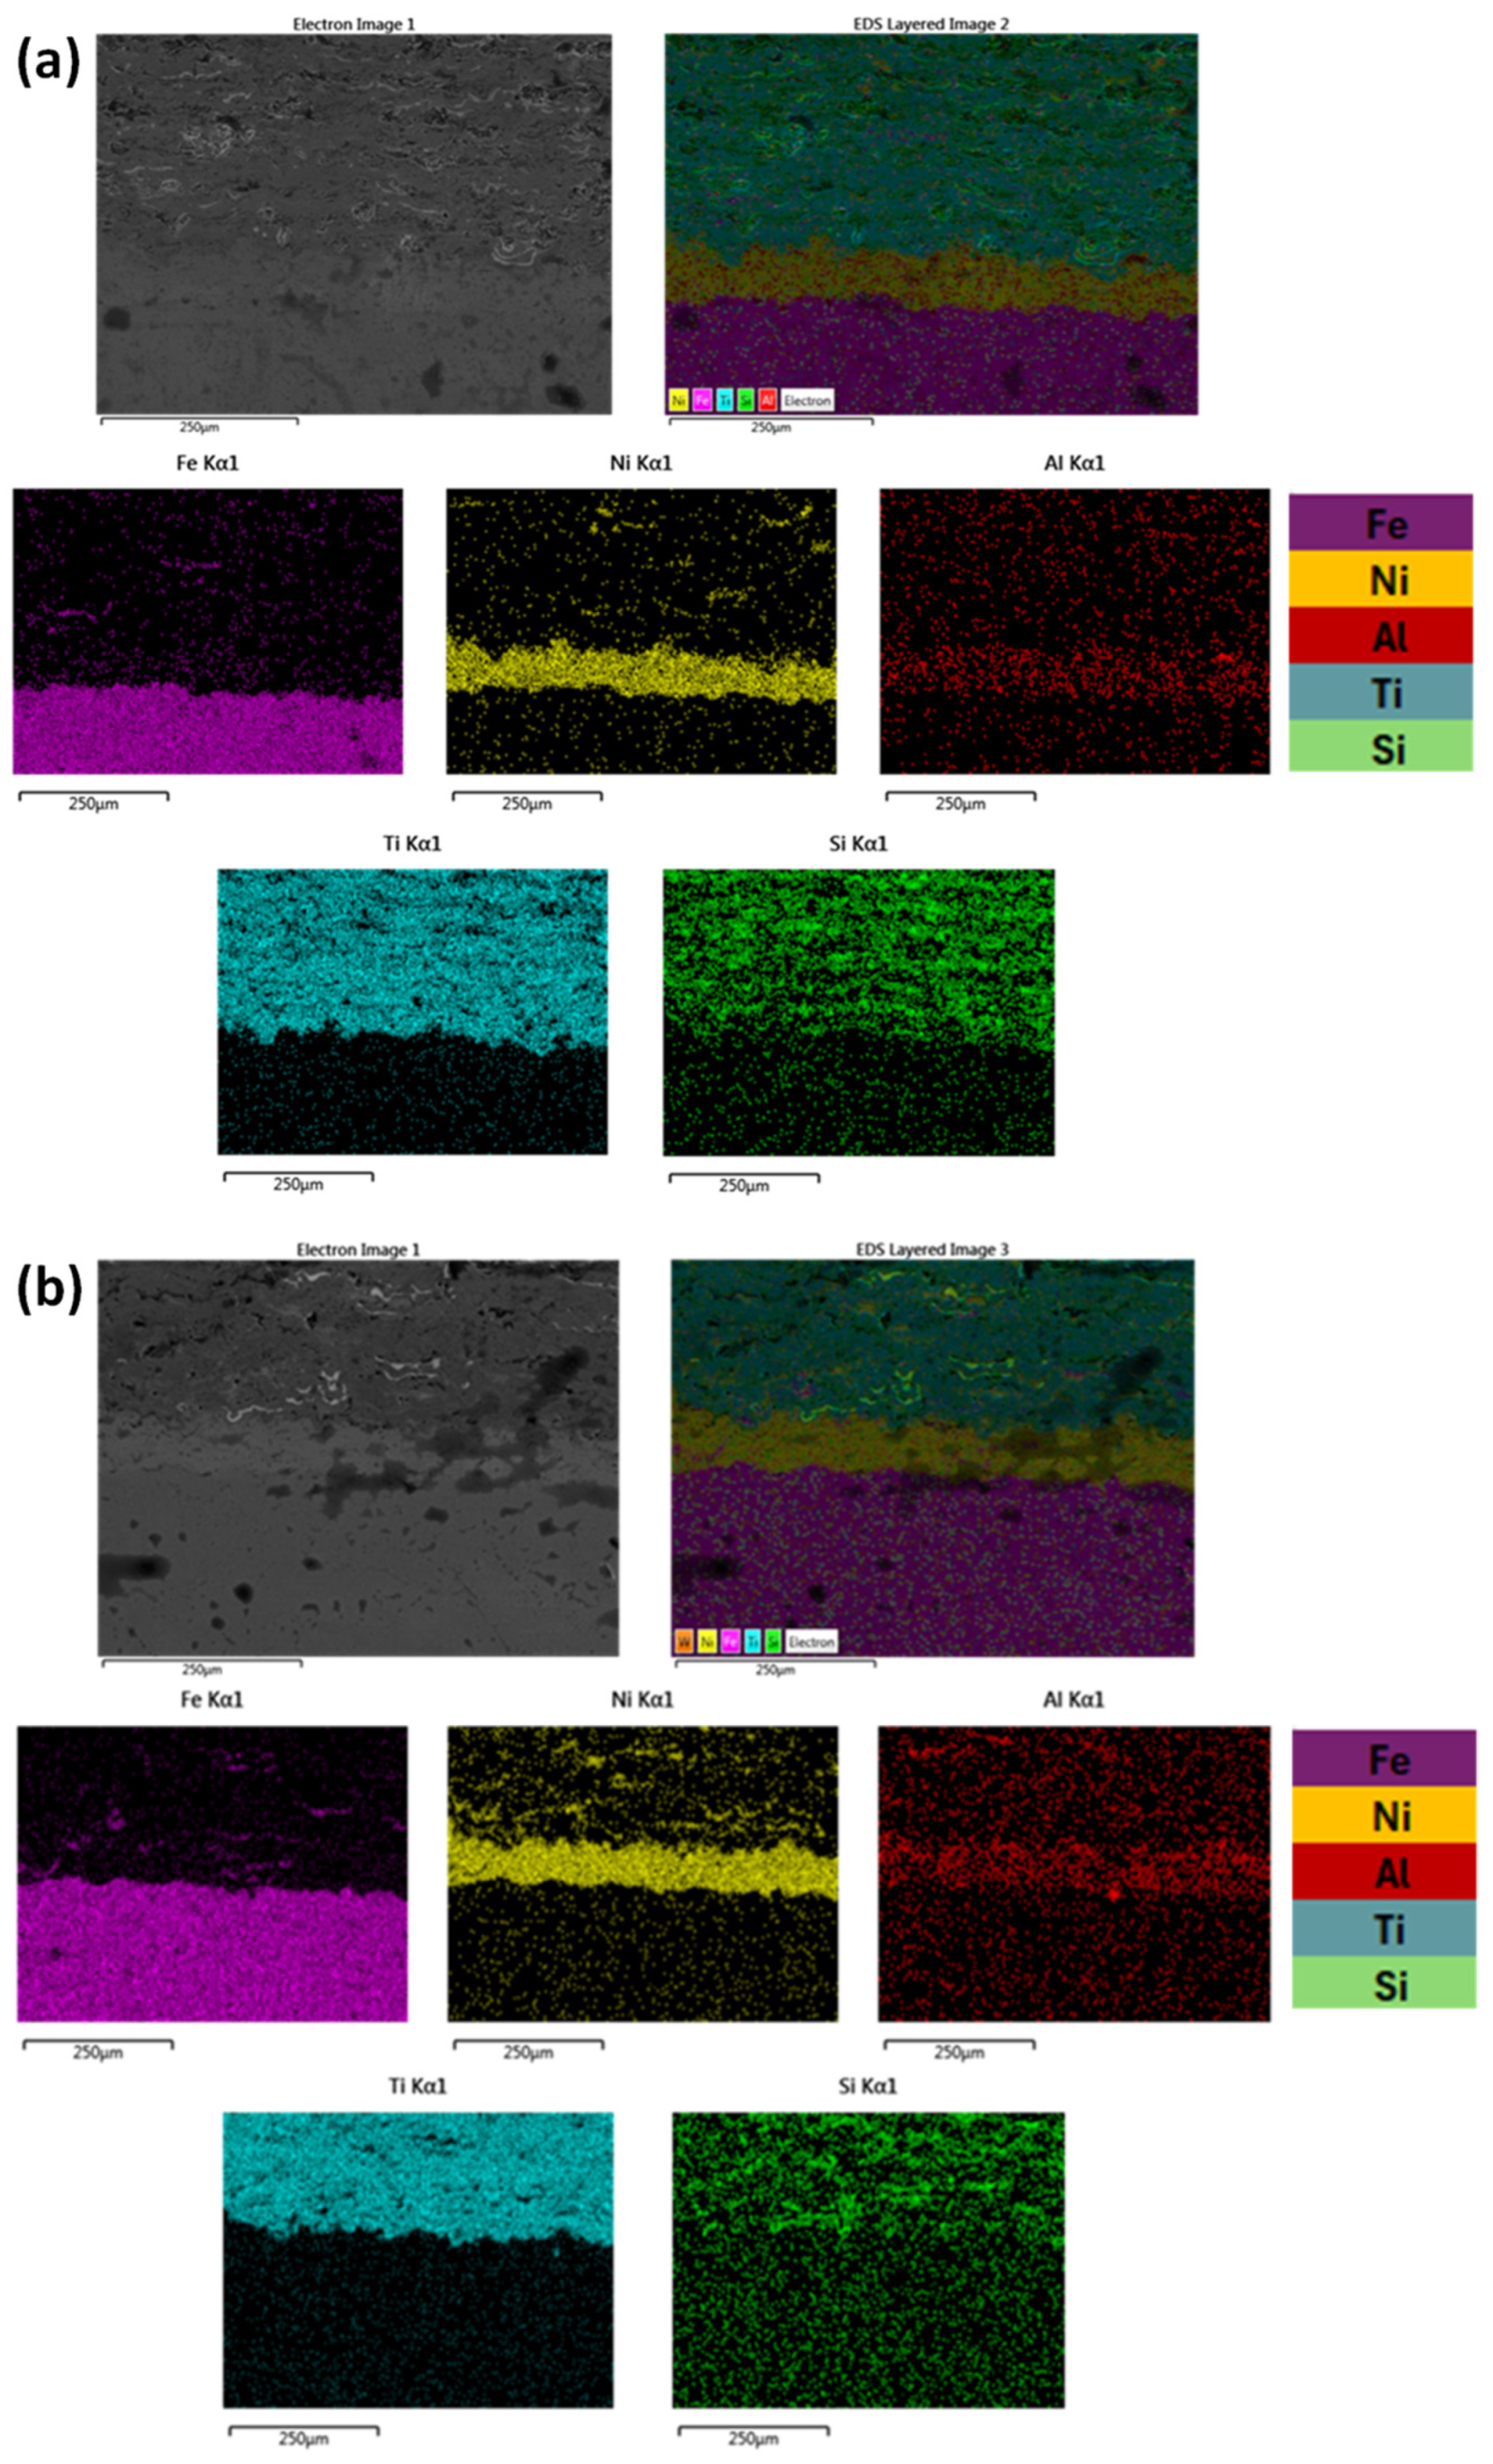
The elemental distribution of the Cr2O3 coatings was examined using EDX mapping analysis (Figure 7a,b).


Figure 7.
Elemental analysis mapping of Cr2O3 coatings, (a) 800 A and (b) 900 A.
It can be observed from Figure 7, that in both cases, the distribution of elements are uniform and in alignment with the different deposition layers. Based both on Figure 6 and Figure 7 and especially as far as the substrate/primary Ni-Al layer is concerned, there is not significant evidence of intensive chemical reactivity and subsequent reaction phases. Some elemental interdiffusion between the two areas is expected to have taken place, contributing to enhancement—apart from the mechanical interlocking—of the interphase bonding.
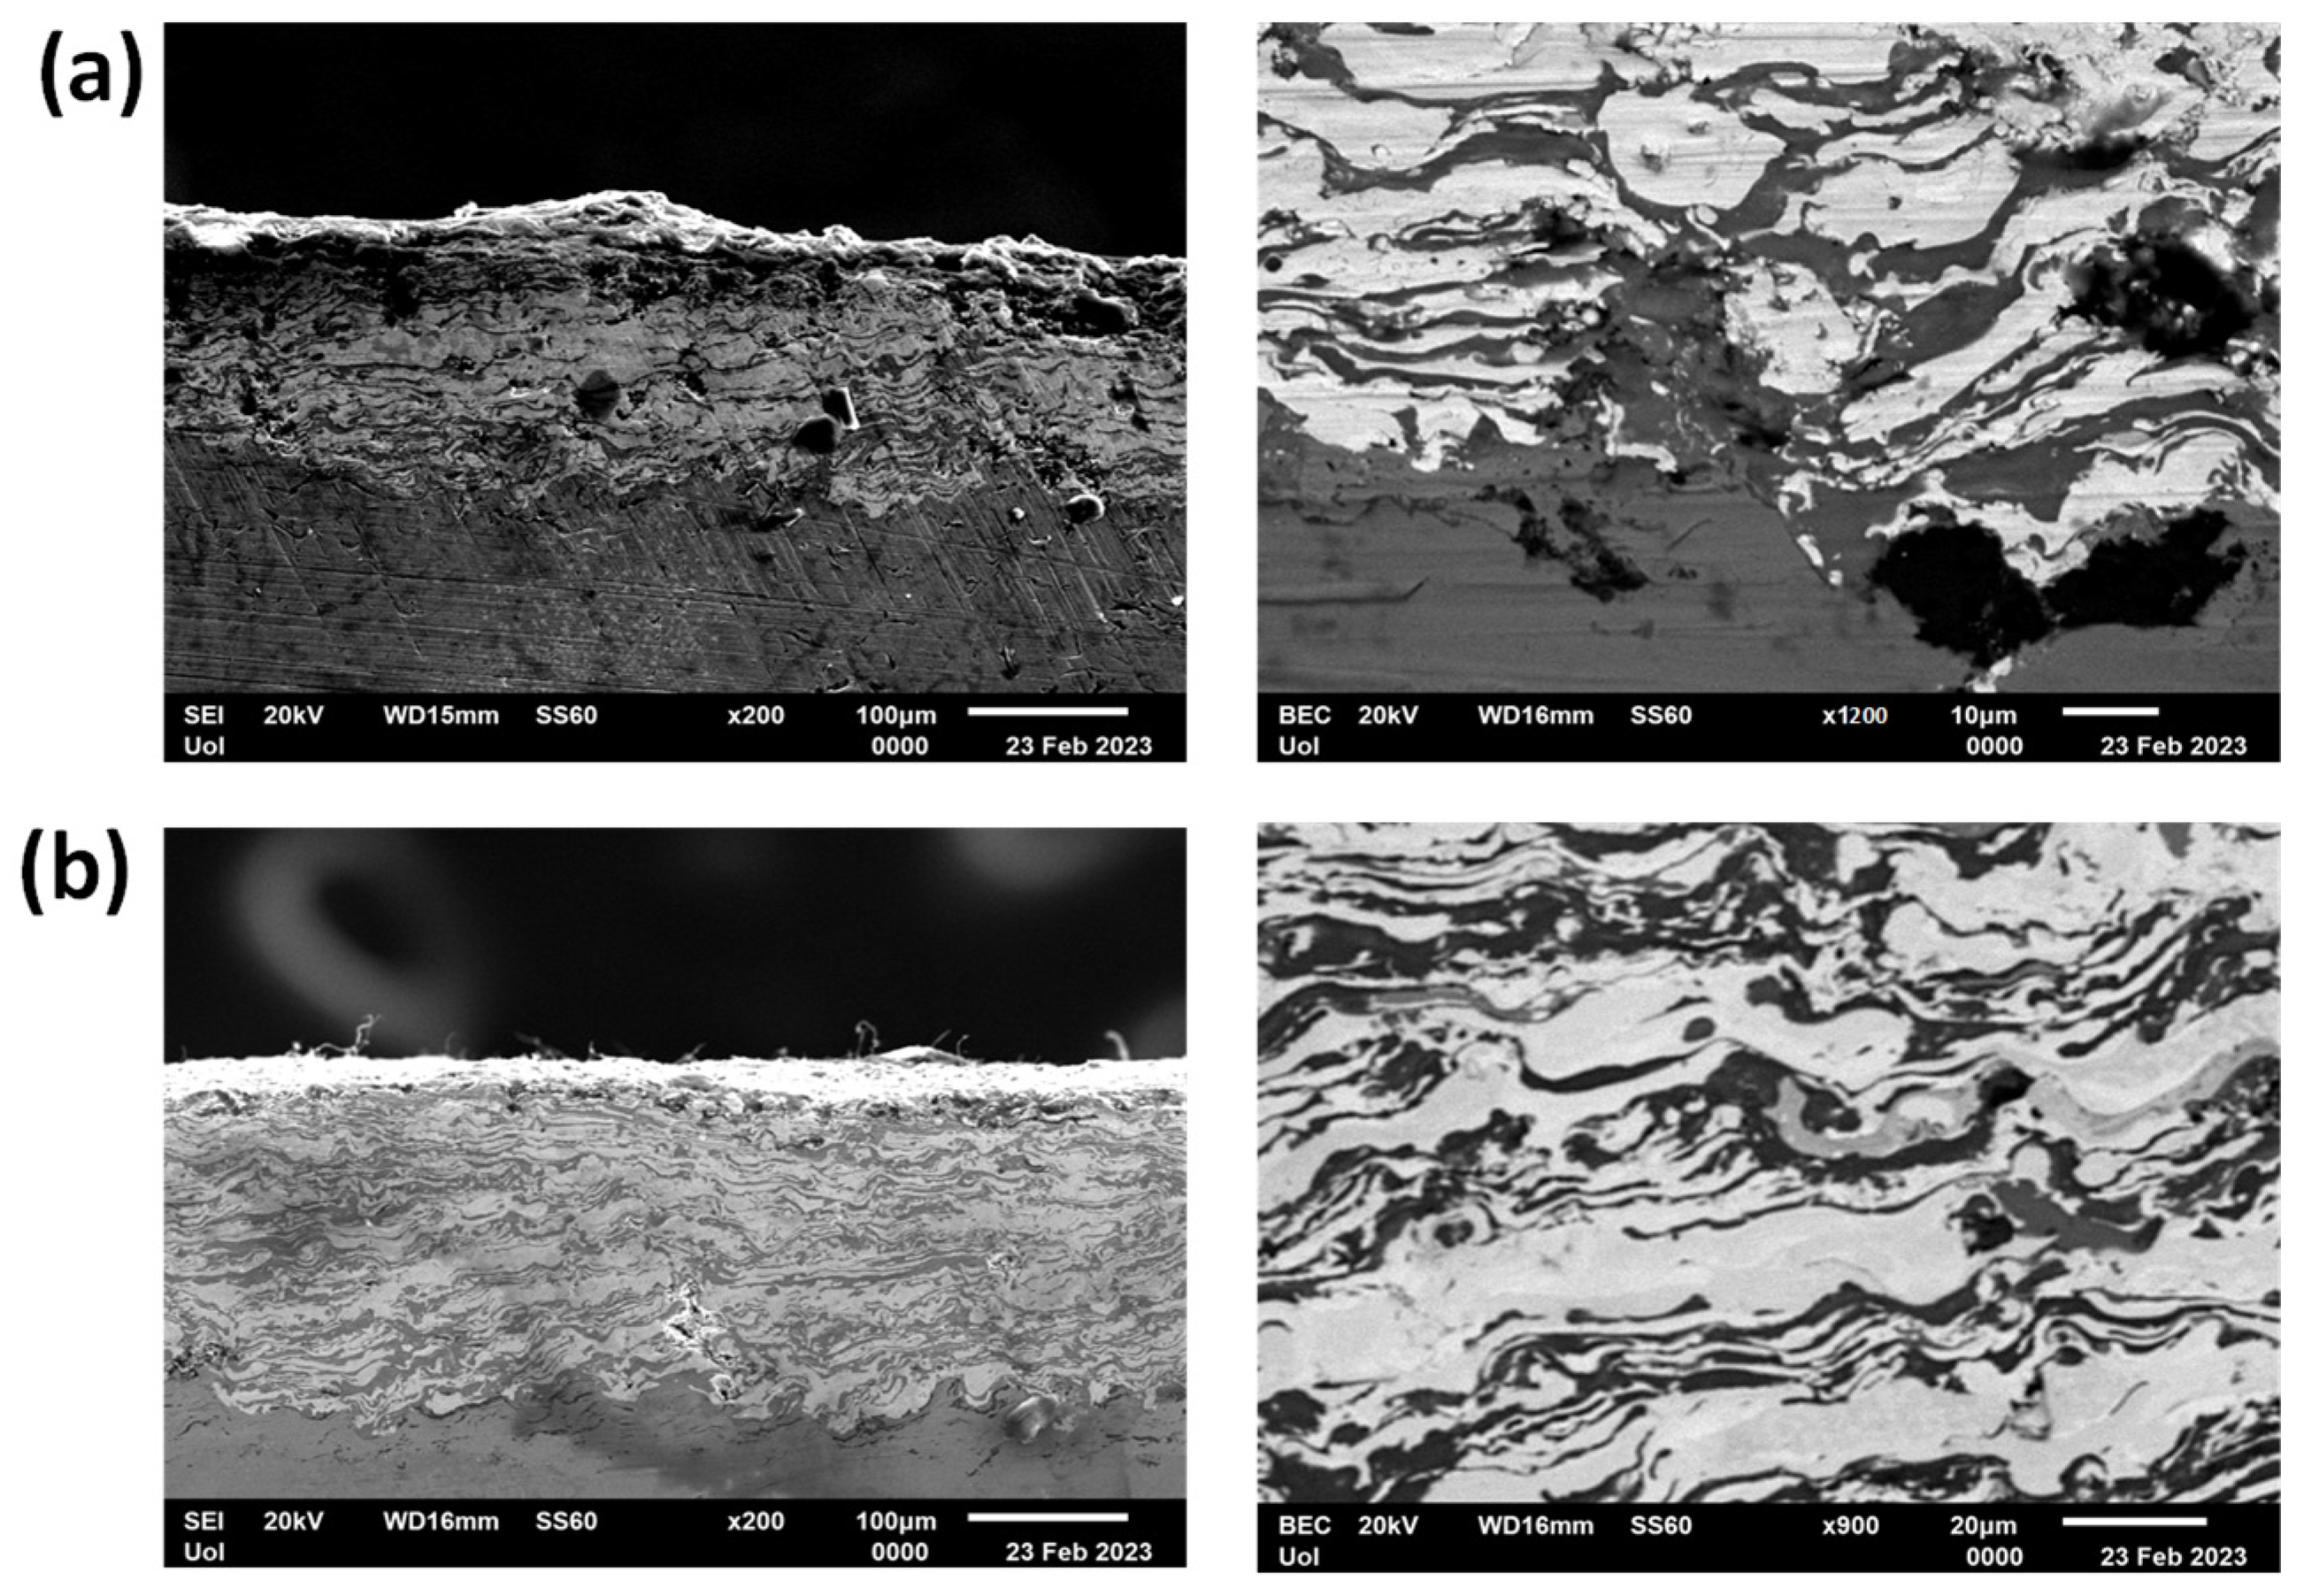
The microstructure characterization of the Ti-WC/Co coatings layer-by-layer at 800 A and ×200 and ×900 magnification and, is presented in Figure 8a. The coating exhibits unevenness, lacking uniform thickness, and showing suboptimal adhesion to the substrate. Furthermore, a discrete separation between the different deposited layers is not obvious. Microcracks/flaws and porosity are evident with the latter in some cases being of big size. Porosity and microcracks were measured to cover a 15–16% of the area. The measured thickness of the coating was measured to be 180–200 μm for the Ni-Al layer and 55–85 μm for the Ti-WC/Co layer. On the other hand, the microstructure characterization of the Ti-WC/Co layer-by-layer coatings at 900 A and at ×200 and ×700 magnification is depicted in Figure 8b. Overall, the coating exhibits a more uniform behavior compared to the Ti-WC/Co layer-by-layer coatings at 800 A. Specifically, while the coating does not have uniform thickness, the layers appear thinner, with coating thickness measured to be around 50–75 µm for the Ni-Al layer and 70–120 μm for the Ti-WC/Co. As in the case of the Cr2O3 coatings, this difference in thickness is a random outcome of the manufacturing process. Some microcracks/flaws and porosity is also evident, which were measured to be within the range of 5–6% of surface coverage. Additionally, it seems that a better adhesion of the coating to the substrate has been established.

Figure 8.
SEM of Ti-WC/Co layer-by-layer coatings, (a) 800 A and (b) 900 A. The integrity and homogeneity of the first sample (a) are worse compared to those of sample (b). The coating-substrate interphase seems to be more rigid in the case of sample (b).
The composition of Ti-WC/Co coatings deposited layer by layer at 800-900 A was assessed using EDX analysis, as illustrated in Figure 9.


Figure 9.
Elemental mapping (EDX) of Ti-WC/Co coatings deposited layer-by-layer at (a) 800 A and (b) 900 A. High-resolution images show the distribution of Ti, W, Co, and Ni. The elemental maps are displayed with color bars for clarity, and improved homogeneity is evident at 900 A.
Based on both Figure 8 and Figure 9 as far as the coating-substrate interphase region is concerned, it can be seen that in both cases, a similar extent of mechanical interlocking contributes to the final bonding. Some in homogeneities are present in both cases. Especially in the case of 800 A sample, there is a significant indication of reaction products to have been formed.
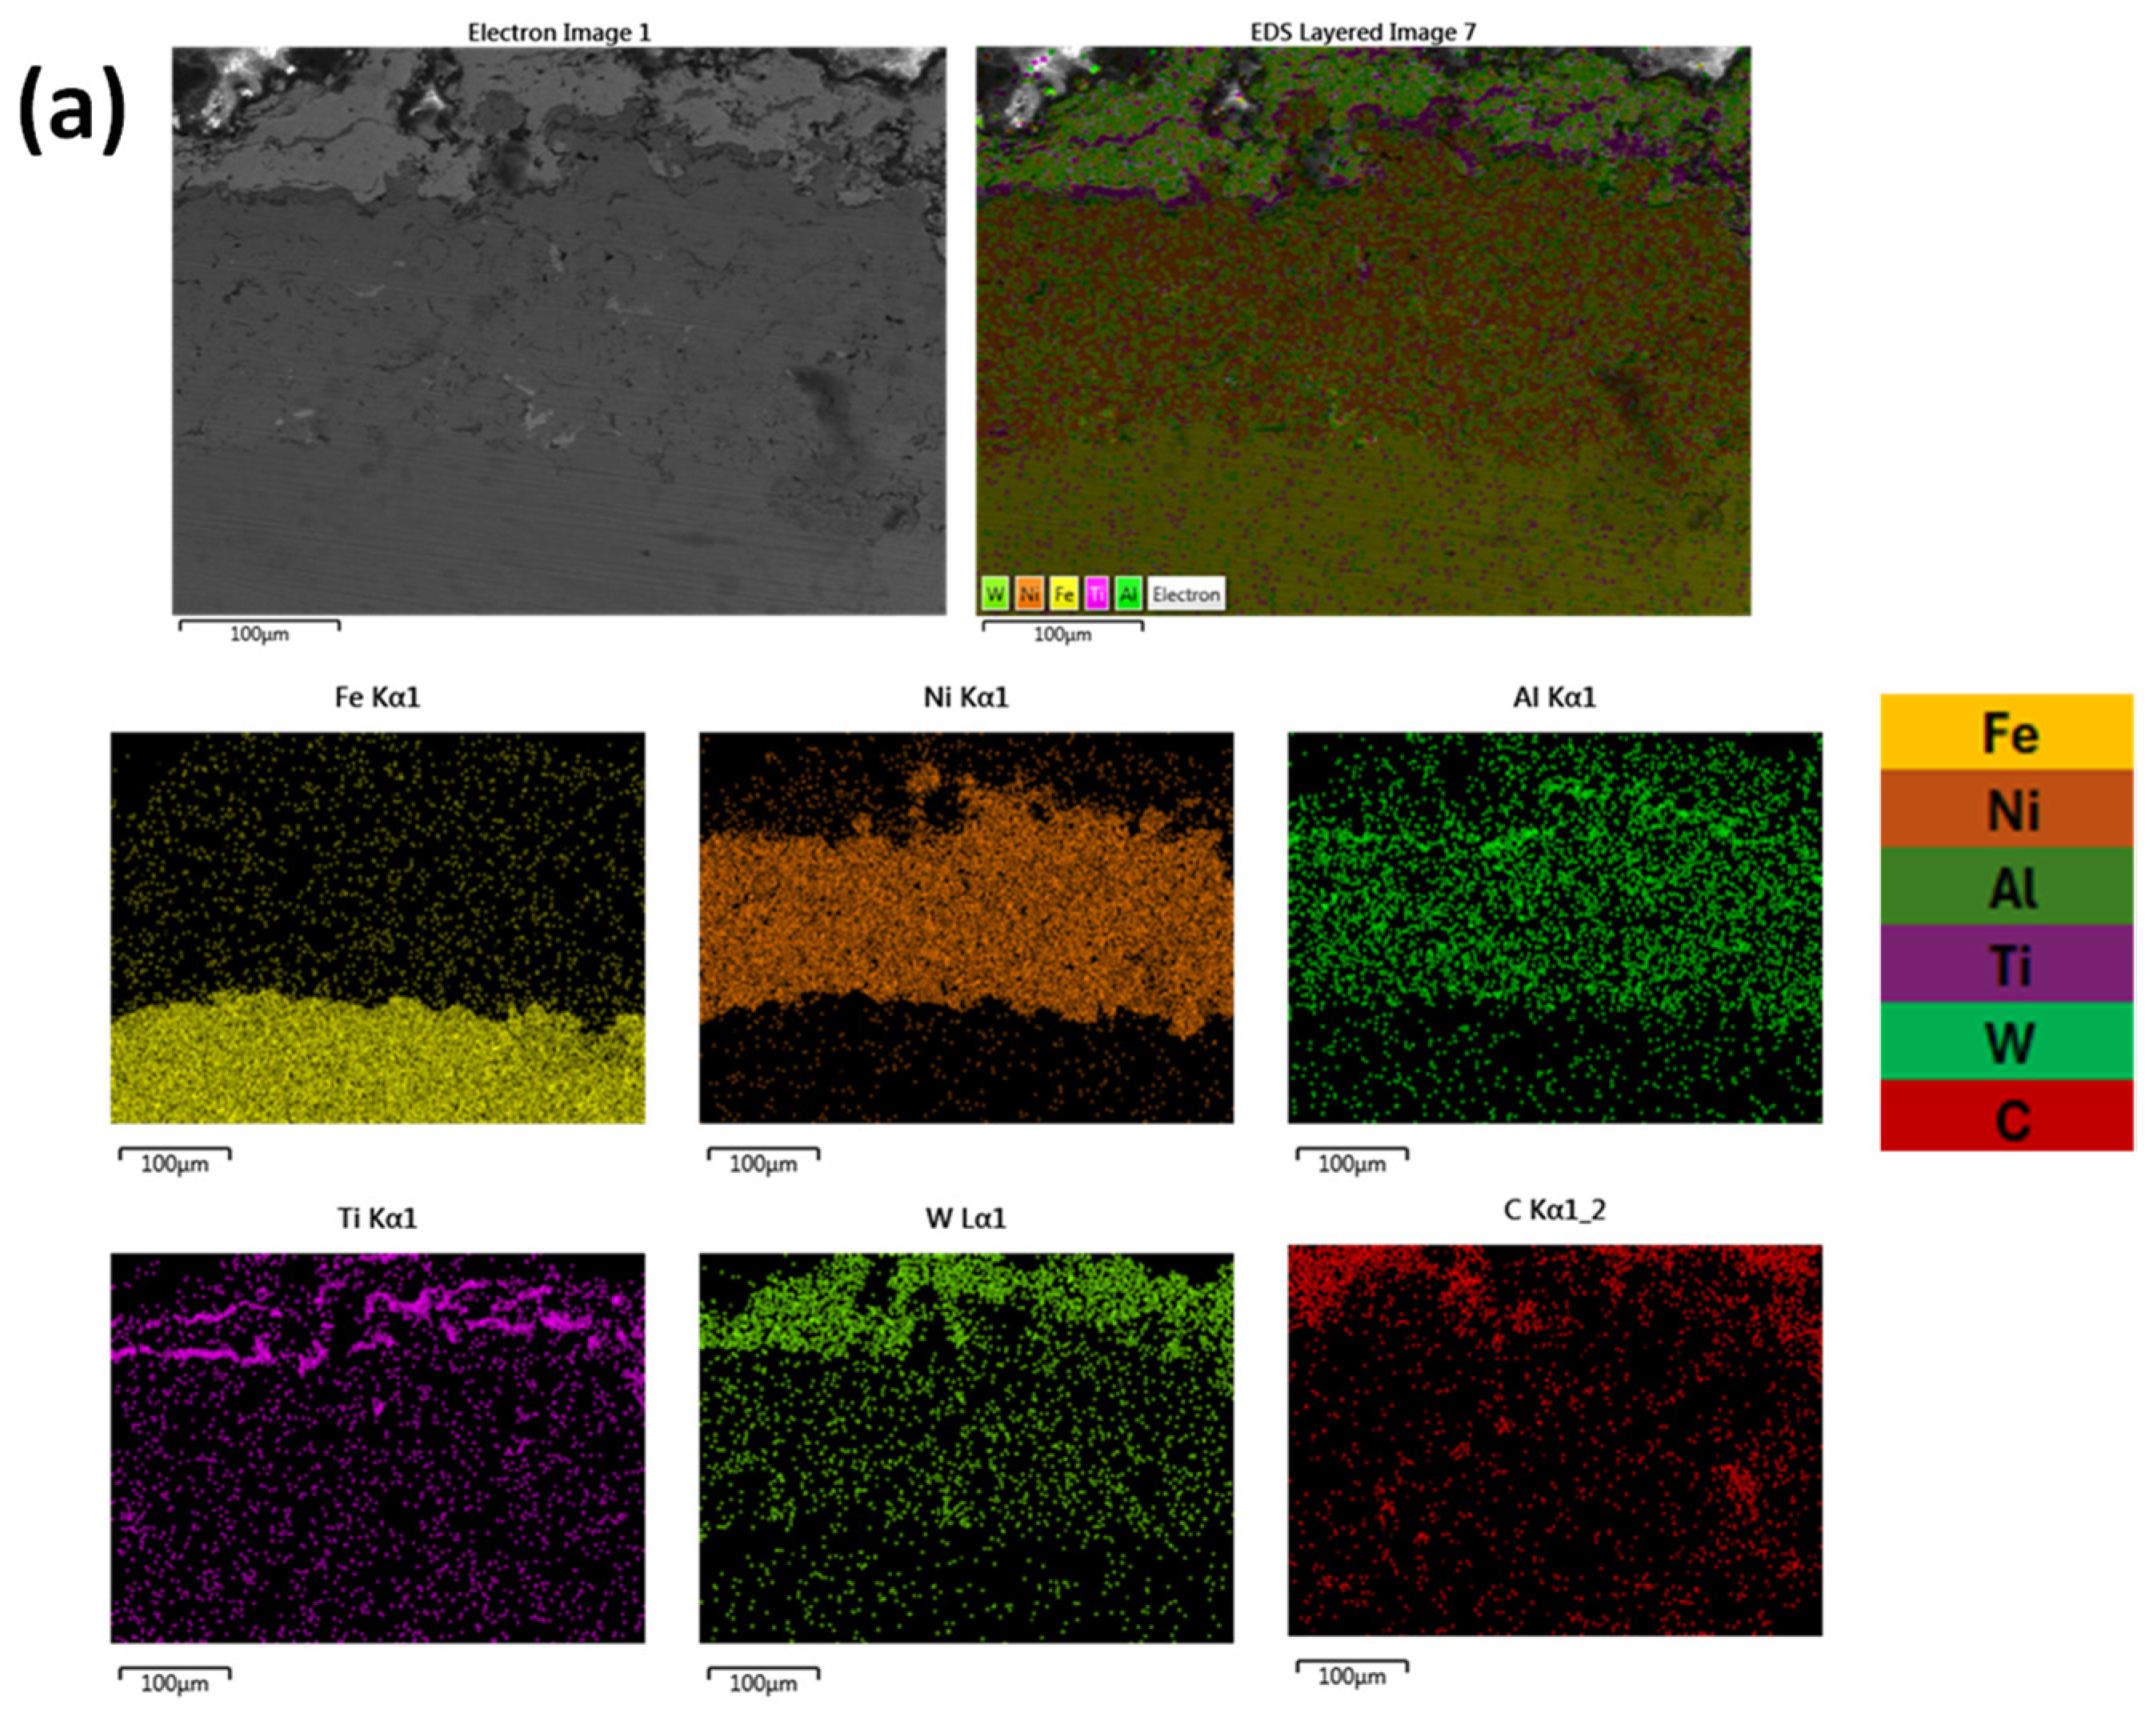
The microstructure of the Ti-WC/Co Mix coatings at 800 A, observed at various magnifications (×200 and ×1200), is illustrated in Figure 10a. In particular, the coating demonstrates relative uniformity and improved coverage compared to previous coatings. Some porosity is present, yet not that extensive as in the previous cases. Porosity was measured to be around 2.5–4% coverage. Notably, the adhesion with the substrate is significantly rigid and continuous, the coating is relatively consistent in thickness which was measured to be around 150 μm for the Ti-WC/Co layer and around 20 μm for the initial Ni-Al layer. Furthermore, a well-defined layering is observed. Similarly, the microstructure characterization of the Ti-WC Mix coatings at 900 A, observed at ×200 and ×900 magnifications, is presented in Figure 10b. This coating depicts excellent coverage compared to previous coatings, showcasing rigid and continuous adhesion to the substrate, uniform thickness across the entire surface (measured around 100 µm and 30–40 μm for the Ti-WC/Co and the Ni-Al layers, respectively), limited porosity (measured around 3–3.5% coverage), and finer layering.

Figure 10.
SEM of Ti-WC/Co Mix coatings, (a) 800 A and (b) 900 A. Both coatings show almost excellent adhesion and fine layering. Some limited, nevertheless, porosity is observed in the case of sample (a).
The elemental distribution of the Ti-WC/Co Mix coatings was analyzed via EDX analysis. The overlay mapping is depicted in Figure 11. Both Figure 10 and Figure 11 show a very good interface between the coating and the substrate with negligible porosity of other imperfections. No significant evidence of reaction products can be observed.


Figure 11.
Elemental mapping (EDX) of Ti-WC/Co mix coatings at (a) 800 A and (b) 900 A. High-resolution images show a uniform distribution of Ti, W, Co, and Ni across the coating. Distinct colors represent each element in the maps, and the improved resolution enhances their clarity.
The characterization of the microstructure of the Ti-SiC coatings layer by layer at 800 A at ×350 and ×900 magnifications is illustrated in Figure 12a. The coating is observed to depict good adhesion and a relatively uniform thickness over the entire surface of the coating, but the necessary layering has not been carried out of the coating powders, which is confirmed by the overall thickness of the coating, which is quite small (measured 25–30 μm and 50–75 μm for the Ti-SiC and the Ni-Al areas, respectively). The interphase between the substrate and the coating is, in general, considerably rigid and continuous with few pores and microflaws being present. Some porosity is also evident within the coating region, which was measured to be 9–10% of the area. The characterization of the microstructure of the Ti-SiC layer coatings at 900 A at ×150 and ×500 magnifications is illustrated in Figure 12b. The coating appears to exhibit very good adhesion and a uniform thickness over the entire surface of the coating, which was measured to be around 350 µm and 100 μm for the Ti-SiC and the Ni-Al layers, respectively, while the coatings layer by layer are clearly visible over the entire surface of the coating. Some porosity and microcracking can also be observed within the coating area, measured around 9–10% coverage.

Figure 12.
SEM of Ti-SiC layer-by-layer coatings, (a) 800 A and (b) 900 A.
Both samples show very good adhesion of the coating to the substrate. The various layers of the deposition process can be observed, yet the Ti-SiC coating thickness in the case of the 800 A sample is very narrow. Limited to negligible porosity can be distinguished.
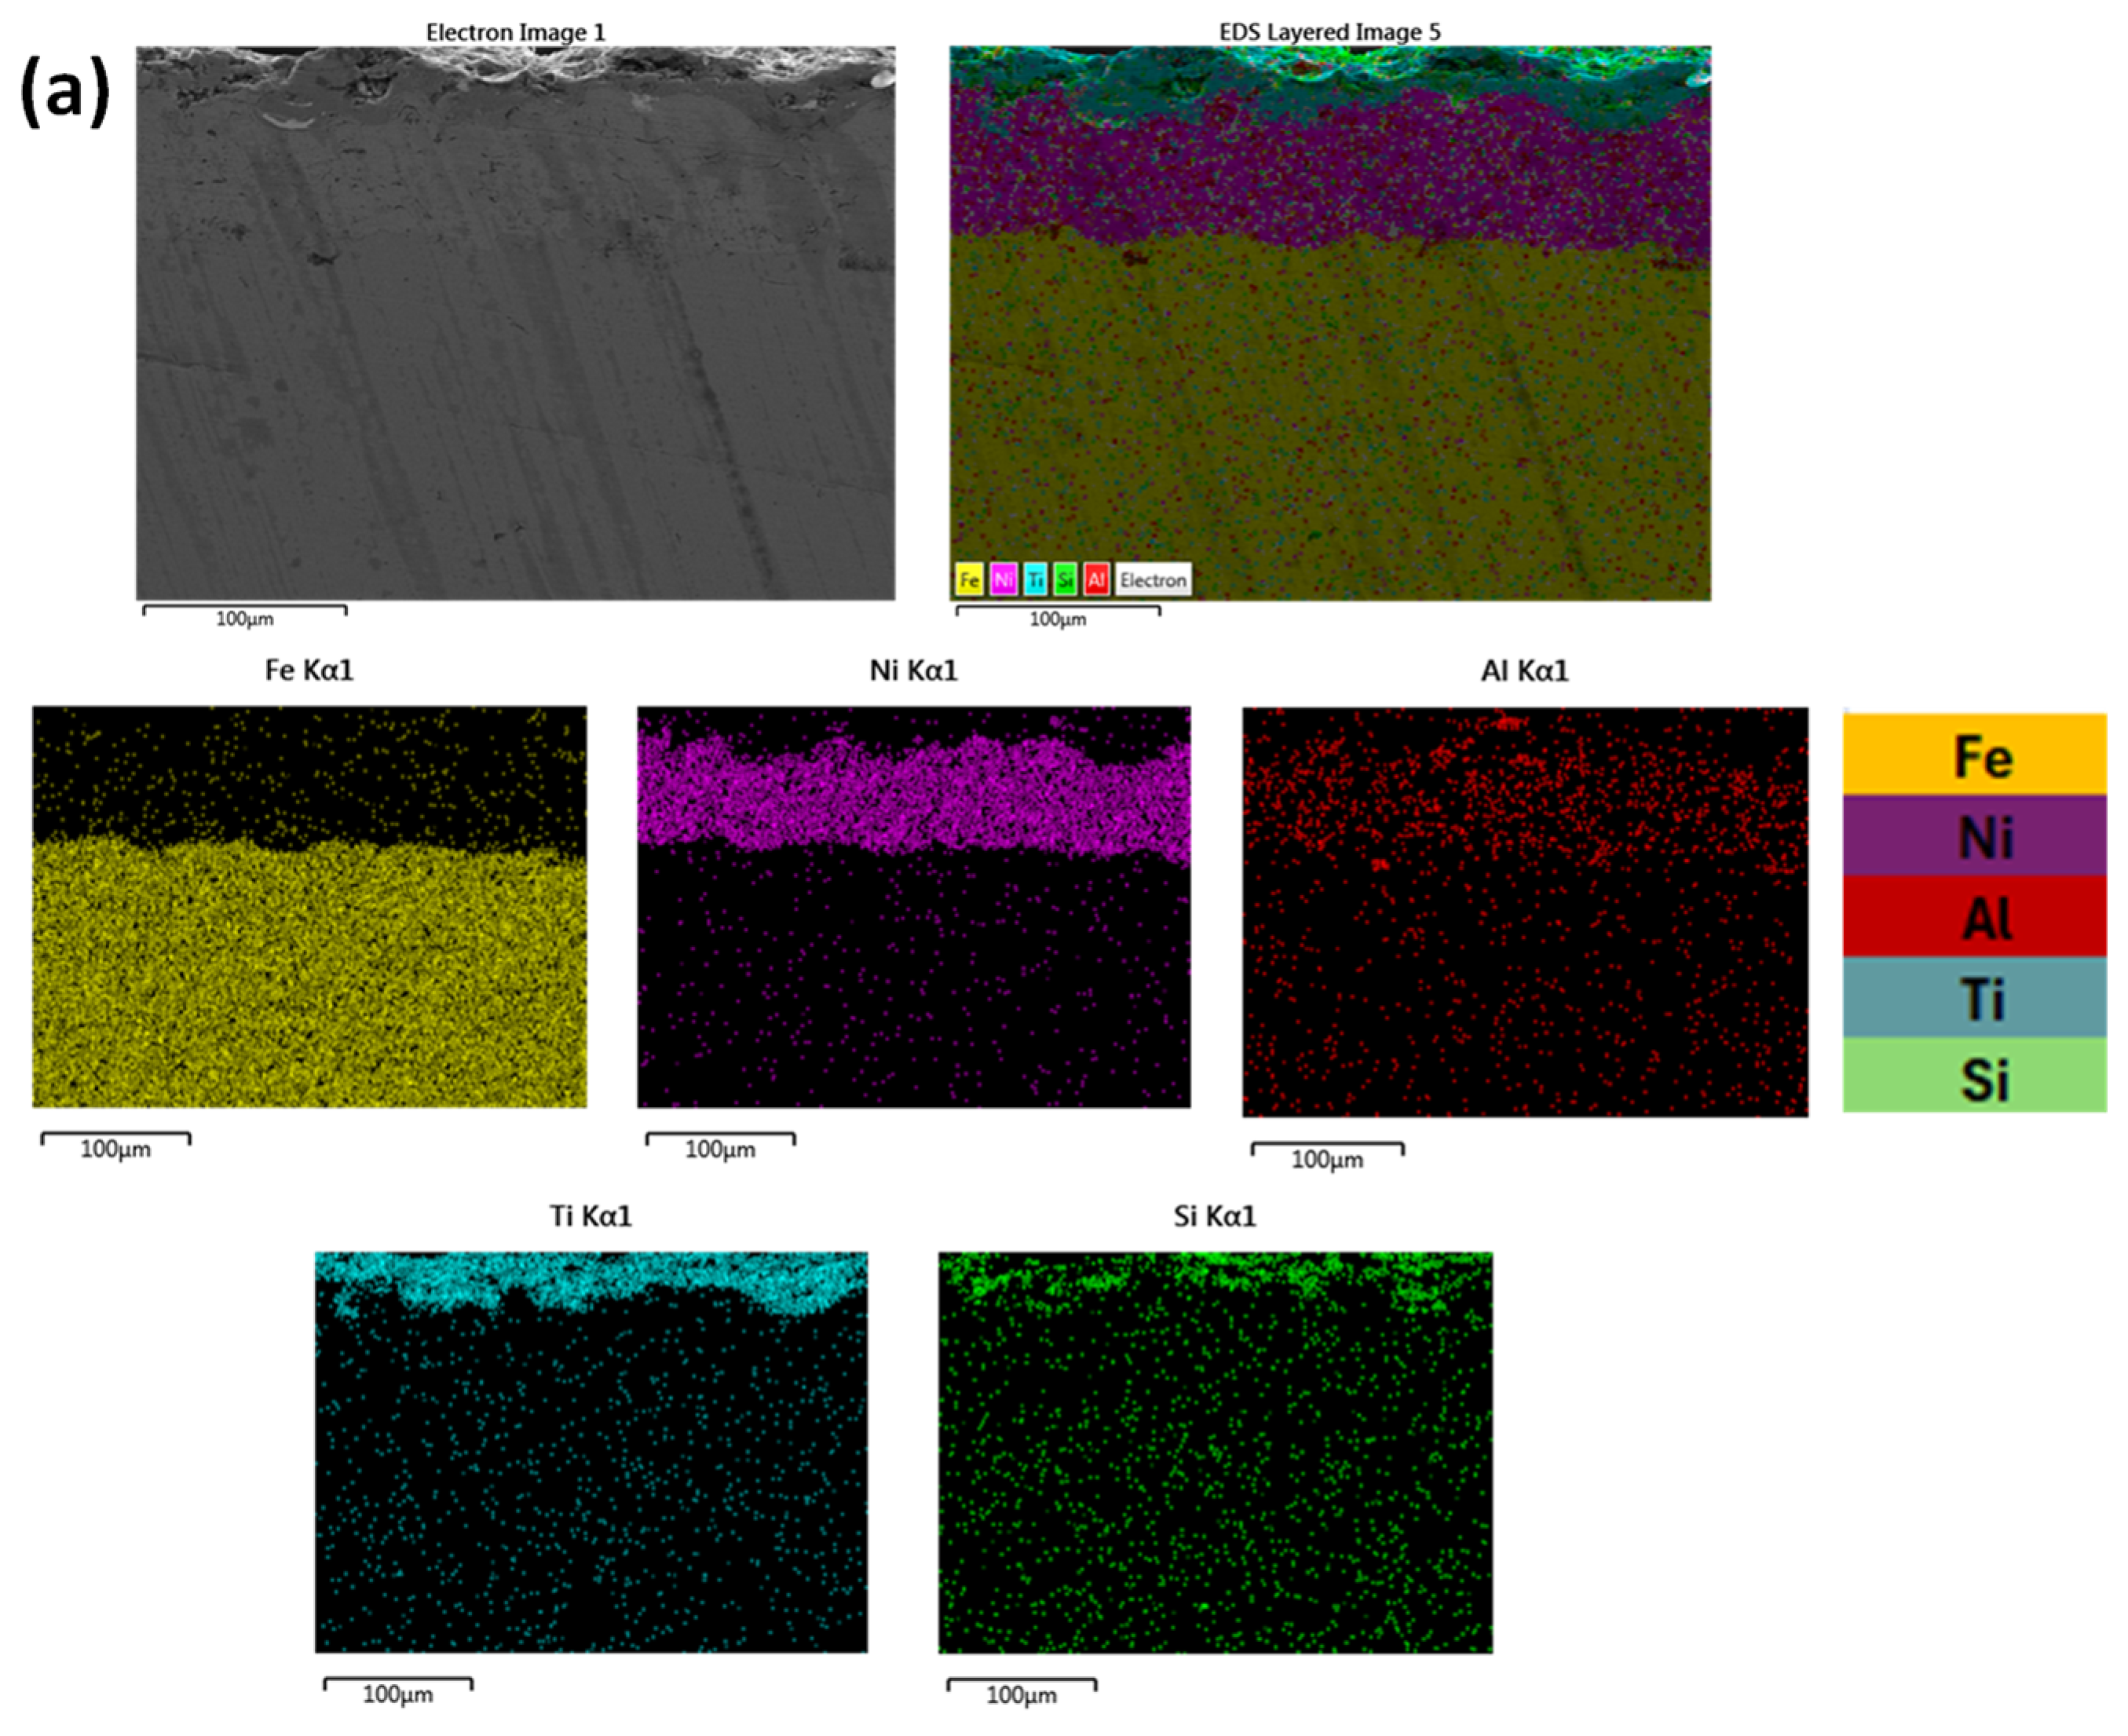
EDX elemental mapping of the Ti-SiC layers at 800 A was performed, as depicted in Figure 13. The Ni-Al overlay is clearly discernible, but the Ti-SiC overlay appears relatively small, consistent with the SEM images presented earlier. Conversely, the 900 A sample shows excellent distinguishable layering and a coating of high overall thickness. The interfacial area is relatively clean and continuous in both samples and no significant evidence of considerable chemical reactivity can be observed, based on both Figure 12 and Figure 13.


Figure 13.
Elemental analysis mapping of Ti-SiC layer-by-layer coatings, (a) 800 A and (b) 900 A. The presence of the Ti-SiC layers is very restricted in the case of sample (a), whereas a fine distinguishable layering is profound in the case of sample (b).
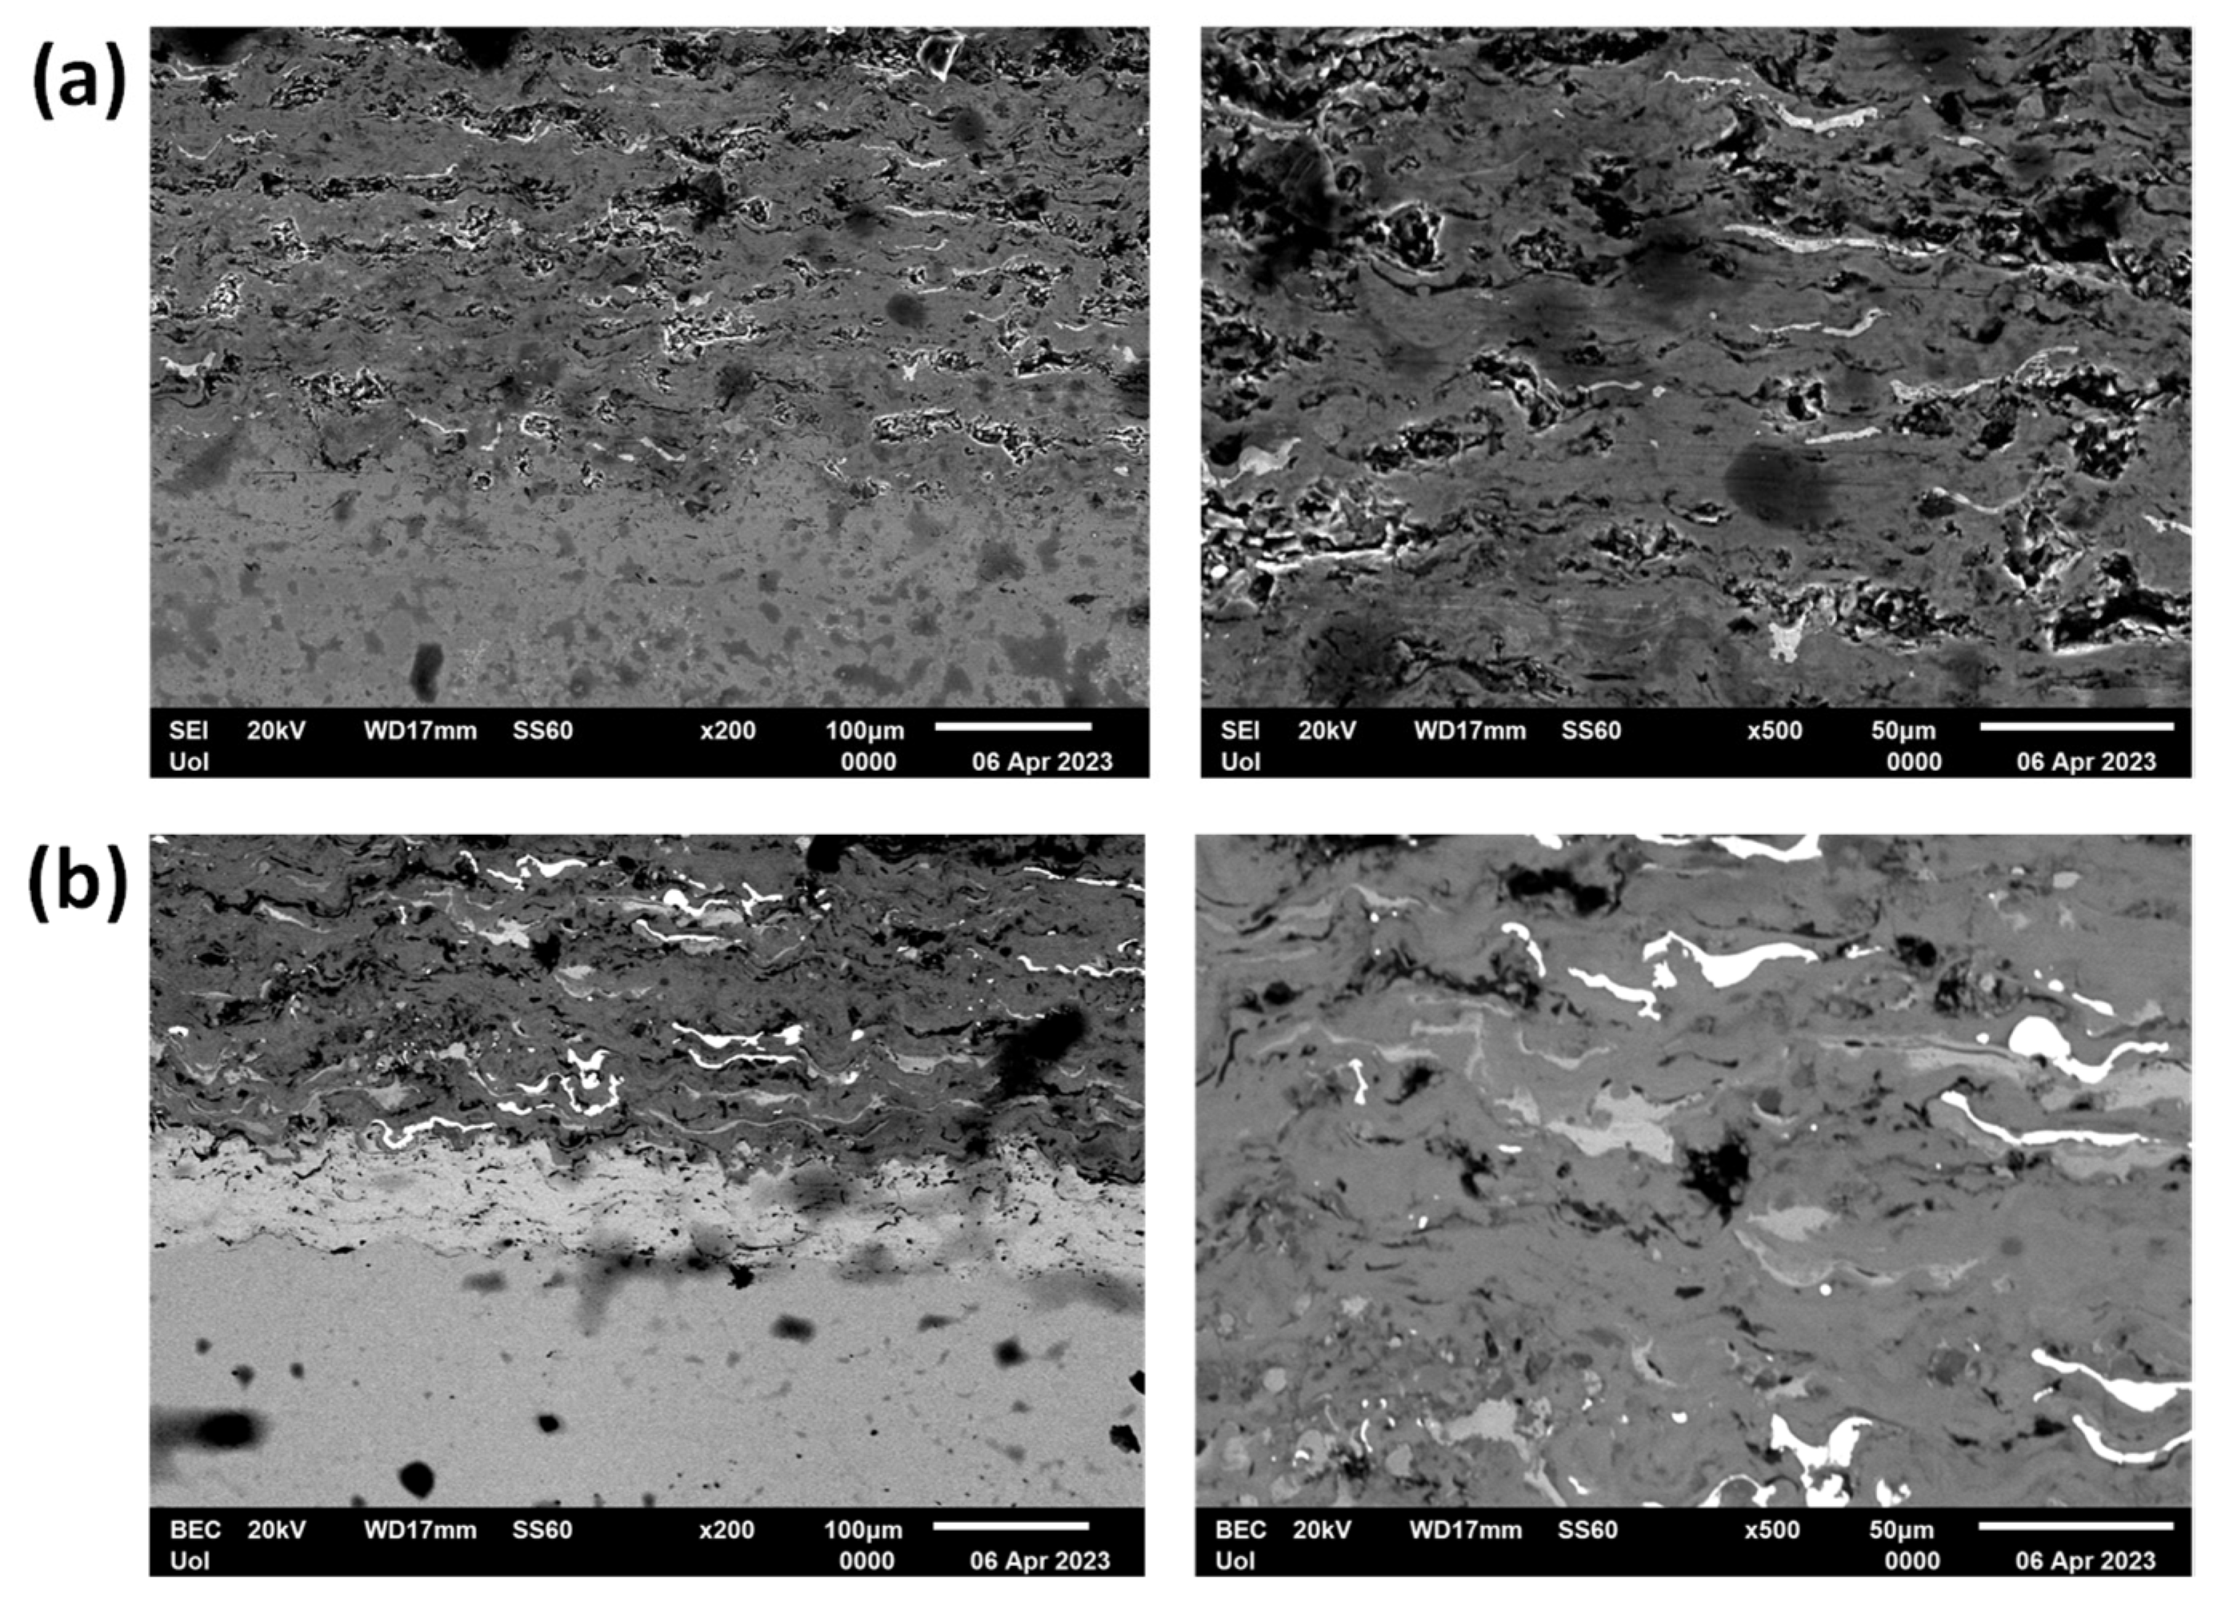
The microstructure characterization of Ti-SiC Mix coatings at 800 and 900 A, observed at ×200 and ×500 magnifications, is presented in Figure 14 (a and b, respectively). At 800 A, the coating depicts good adhesion, with a uniform thickness (measured to be approximately of 250 µm for the Ti-SiC layer and 60–80 μm for the Ni-Al layer) across the entire surface. Some porosity can be observed within the coating area, measured to be around 12–14% of the surface. Similarly, at 900 A, the coating exhibits equally good adhesion and a uniform thickness (measured to be approximately of 200 µm for the Ti-SiC layer and 60–75 μm for the Ni-Al layer) across the entire surface. Some porosity and microcracks can also be observed, measured to cover 9.5–12.5% of the area.

Figure 14.
SEM of Ti-SiC Mix coatings, (a) 800 A and (b) 900 A. Good interfacial adhesion can be observed. Some porosity and microcracks are evident within the coating region in both cases.
The compositions of the Ti-SiC Mix coatings were assessed via EDX analysis, as depicted in Figure 15. The distribution of the elements is homogeneous within the different layers. The interphase region between the substrate and the coating is even and rigid and no significant evidence of reaction products can be observed.

Figure 15.
Elemental analysis mapping of Ti-SiC Mix coatings, (a) 800 and (b) 900 A.
A summary of the EDX compositional analysis for all the different deposits is presented in Table 4.

Table 4.
EDX analysis for all the different deposits.
Table 5 summarizes the data concerning the porosity/microcracks coverage and the coating thickness for the various systems.

Table 5.
Thickness and porosity/microflaws measurements for the various deposited systems.
The following remarks, concerning all the differed deposited coatings, have to be addressed at this point. More specifically:
- (1)
- It was observed a variety of thickness between the different coatings. This phenomenon is associated with the manufacturing stage, where the coating thickness was not targeted as a strict parameter and, as such, the spraying conditions were not optimized towards this direction. The primary target was the feasibility or not to produce these different type of coatings, a target which was, in general, accomplished.
- (2)
- It is worth mentioning the potential tendency, as far as the different amperage used different coatings. Although not absolutely proved, it seems that in the case of the Ti-based system, the higher amperage led to slightly, occasionally, better coating quality by means of the presence and porosity and microcracks/flaws. This observation could most likely be attributed to the fact that higher amperage leads to higher temperatures, which in turn may cause more extensive melting and/or a more prolonged reservation of the liquid phase during deposition. In such cases, the presence of the preserved liquid phase restricts potential pores and/or microcracks to form or, at least, to propagate and expand. The authors, however, do recognize that a more thorough investigation is required towards this direction.
- (3)
- The cross-sectional SEM images showed continuous coating layers with limited pores and microcracks, which are indicative of satisfactory adhesion to the steel substrate. Although no direct adhesion test was performed, the absence of interfacial gaps and the stable wear and corrosion responses presented in later sections further support the conclusion that the coatings exhibit good cohesion and adhesion. Importantly, no continuous cracks or delamination were observed at the coating-substrate interfaces, indicating satisfactory adhesion.
Compared to conventional Cr2O3.
3.2. Profilometry Analysis
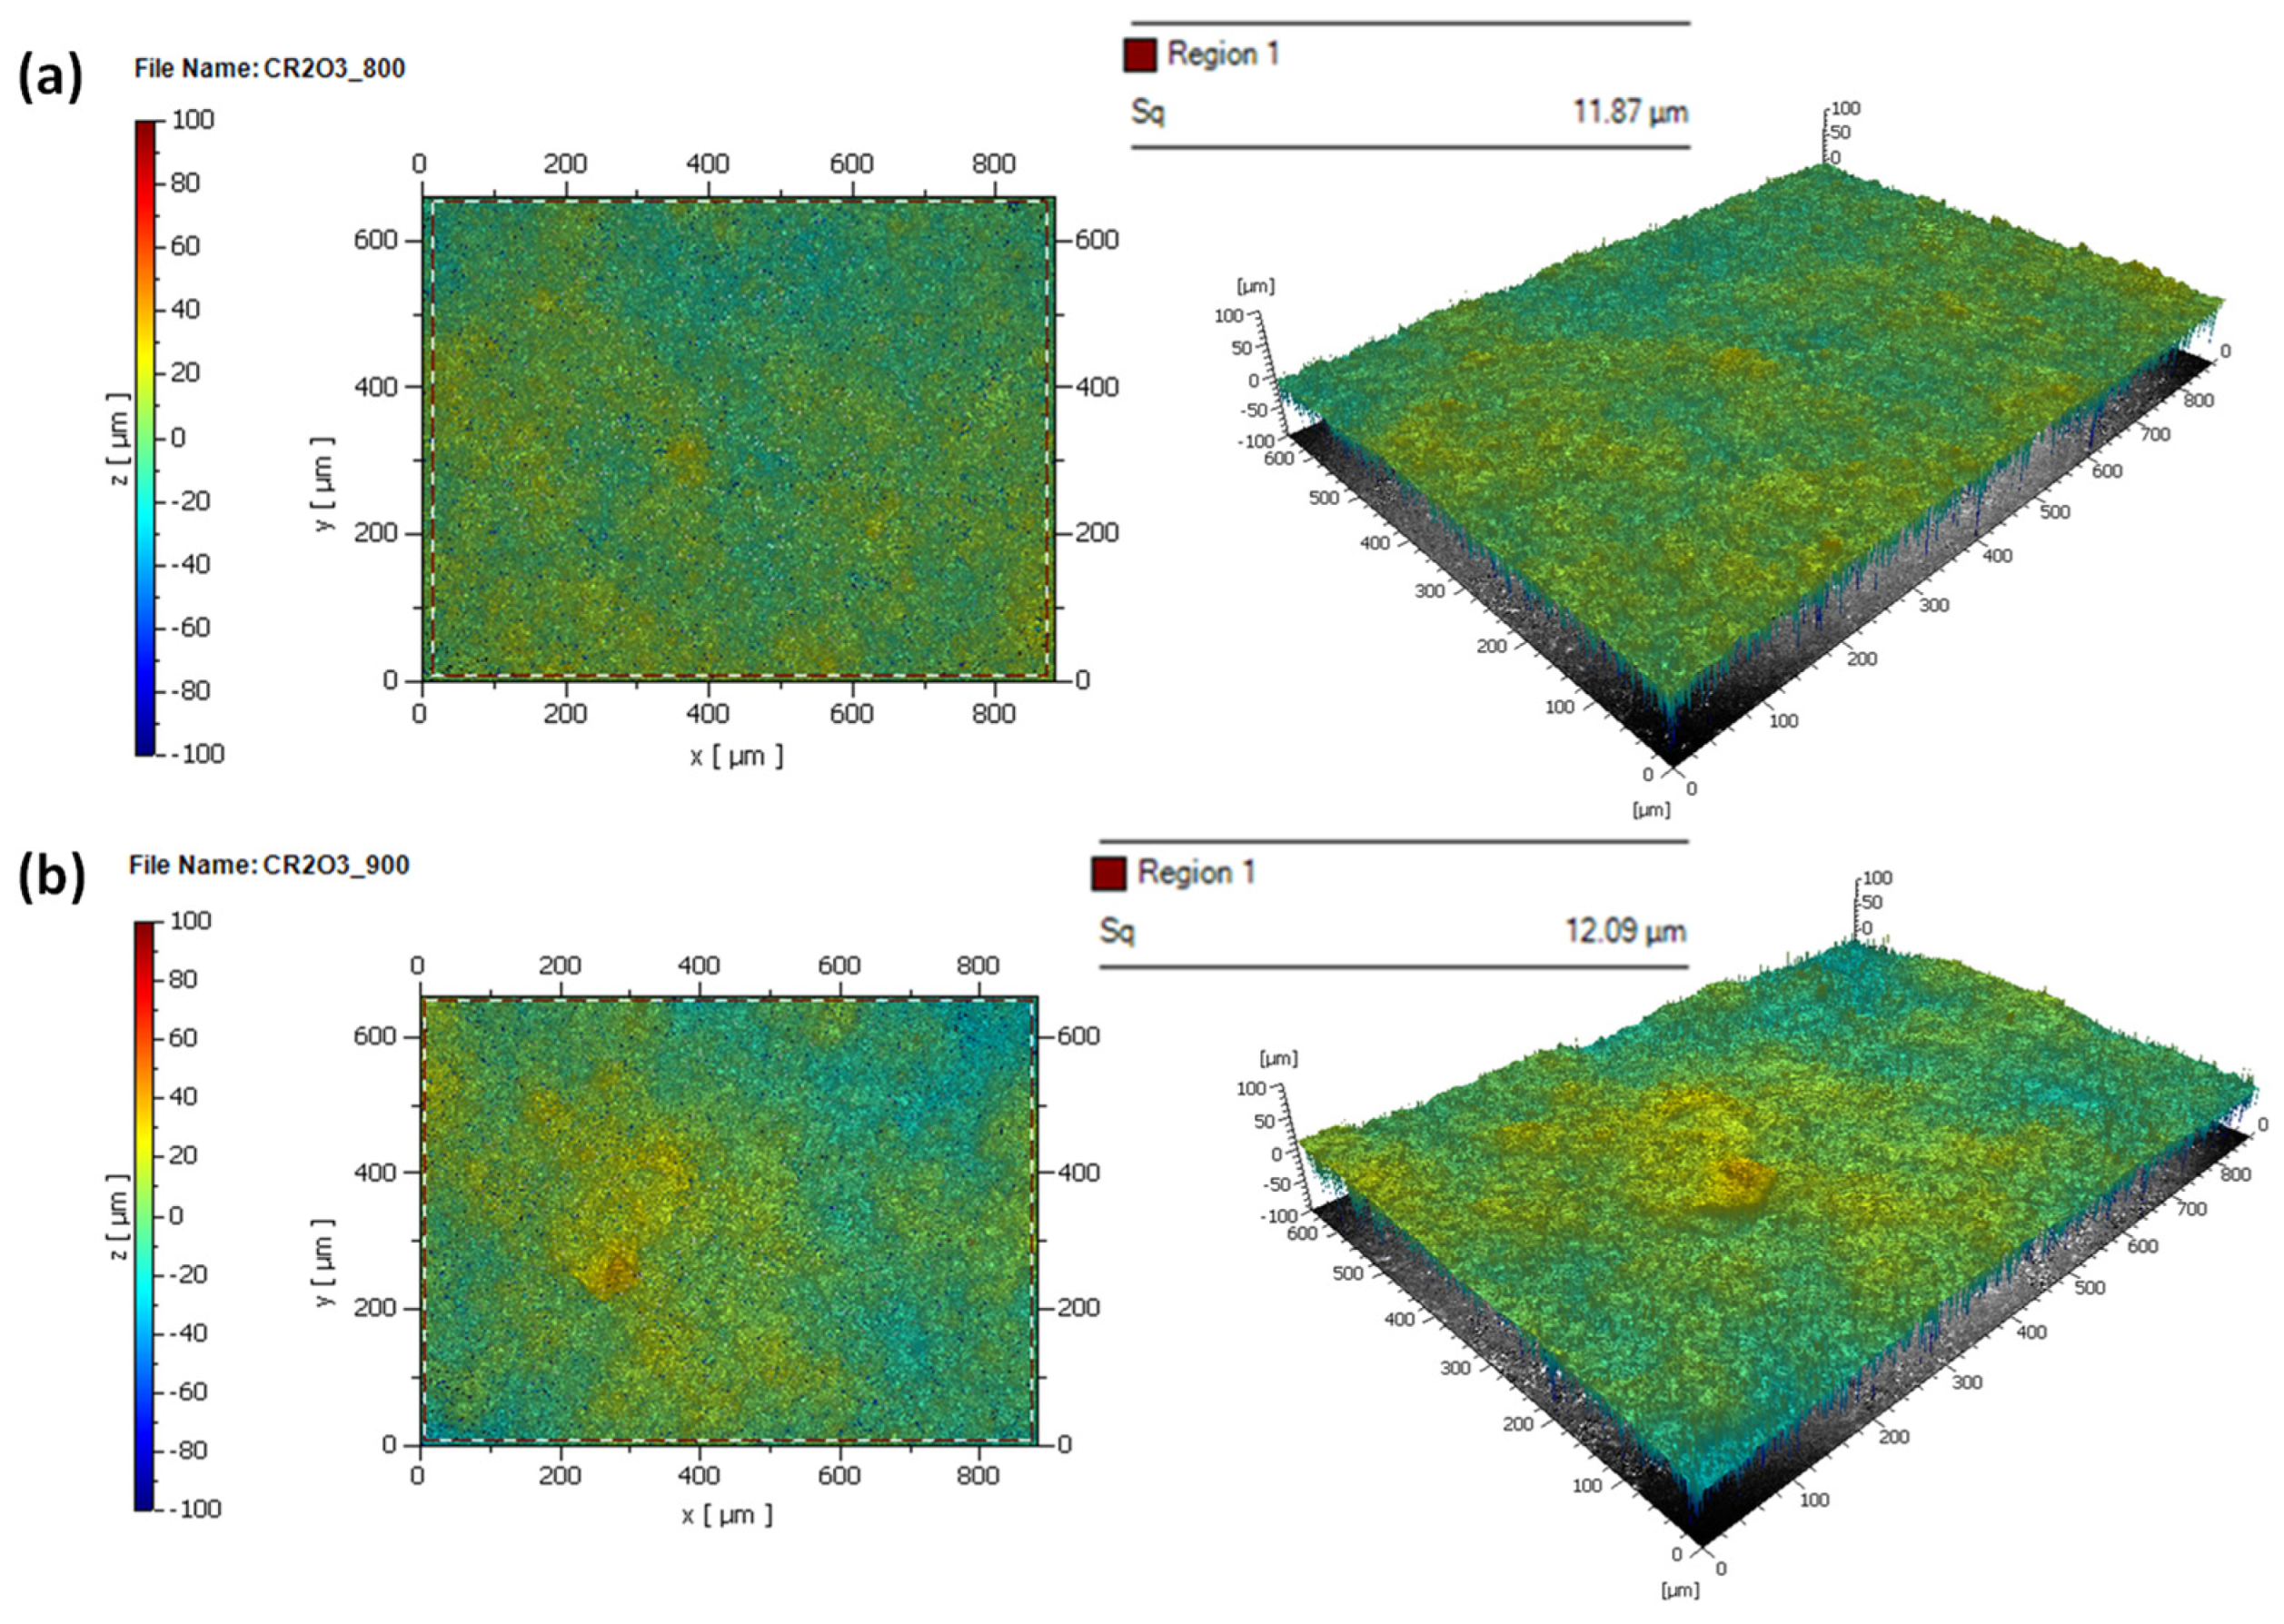
The results of two-dimensional and three-dimensional profilometry for samples coated with Cr2O3 are presented in Figure 16. The results at 800 A are shown in Figure 16a, with the average roughness value (Sq) measured at 11.87 µm. Respectively, in Figure 16b, corresponding to 900 A, the value is 12.09 µm. Thus, the average roughness value remains similar at both current values.

Figure 16.
Typical two-dimensional (2D) and three-dimensional (3D) illustration of Plasma Spray Cr2O3 coatings: (a) coating at 800 A, (b) coating at 900 A.
The two-dimensional and three-dimensional representations of profilometry results on samples with Ti-WC/Co coatings are presented in Figure 17, which corresponds to the (a) layer-by-layer coating at 800 A, (b) layer-by-layer coating at 900 A, (c) mix coating at 800 A, and (d) mix coating at 900 A. At 800 A, the average roughness value of the layer-by-layer coating is 17.98 µm, while at 900 A it is 20.72 µm. For the mix coatings, the average roughness value at 800 A is 12.57 µm, while at 900 A it is 11.96 µm. Therefore, the roughness values of coatings with Ti-WC/Co mix are nearly identical to those of Cr2O3, which is noteworthy considering that Ti-WC/Co mix coatings could potentially have a reduced environmental impact compared to Cr2O3. The comparison of roughness values between Cr2O3 and Ti-WC coatings highlights that the Ti-WC mix coatings achieve similar surface roughness to Cr2O3. This is significant because Cr2O3 is a widely used but environmentally harmful material, whereas Ti-WC offers a more sustainable alternative. Demonstrating comparable roughness supports the suitability of Ti-WC as an eco-friendly substitute for applications where surface topography is critical.

Figure 17.
Typical two-dimensional (2D) and three-dimensional (3D) illustration of Ti-WC/Co profilometry results of Ti-WC/Co coatings: (a) layer-by-layer at 800 A, (b) layer-by-layer at 900 A, (c) mix at 800 A, and (d) mix at 900 A.
The two-dimensional and three-dimensional profilometry results of Ti-SiC/Co coatings are presented in Figure 18, with corresponding to the (a) layer-by-layer coating at 800 A, (b) layer-by-layer coating at 900 A, (c) mix coating at 800 A, and (d) mix coating at 900 A. For the layer-by-layer coatings, the average roughness values were 7.13 µm at 800 A and 6.72 µm at 900 A. For the mix coatings, the roughness values were 6.95 µm at 800 A and 7.21 µm at 900 A. These values are substantially lower than those of both Ti-WC and Cr2O3 coatings, indicating that Ti-SiC produces smoother surfaces. This reduction in roughness is significant because it enhances corrosion resistance and may contribute to improved tribological behavior, further supporting the potential of Ti-SiC as an eco-friendly alternative to conventional Cr2O3 coatings.

Figure 18.
Typical two-dimensional (2D) and three-dimensional (3D) illustration of Ti-SiC (a) layer-by-layer at 800 A, (b) layer-by-layer at 900 A, (c) mix at 800 A, and (d) mix at 900 A.
3.3. Wear Assessment
The graph in Figure 19 depicts, indicatively, the wear rate based on mass loss and sliding distance and Table 6 shows the percentage variations in the samples. Across all samples, a similar behavior is observed, with an initial increase in the rate for the first 200 m, attributed to the “incubation stage,” wherein initial surface discontinuities and defects contribute to this rise, followed by a constant rate of material loss. Particularly in the Ti-WC/Co samples, it is noted that the surface layer of the coating primarily comprises WC carbides.

Figure 19.
Wear rates () for the 0–200, 200–1000 m, and overall distance of each sample. It can be observed that the Ti-WC/Co mix system at 900 A is the system with the lowest wear rated compared to the other systems.

Table 6.
Percentage variations in the samples at wear assesment (minus stands for reduction).
The trace patterns are depicted as punctate degradations of the surface with radial direction. The presence of punctate traces and not radial traces led to the conclusion that the counter body has left the outer layer of the coatings intact. This is also proved via SEM analysis images (Figure 20), where zero surface degradation appears and the results of the measurements are consistent with those in the literature []. In these images, the yellow lines indicate the wear track widths that were measured for the quantitative assessment of wear. Through the early stage of the wear test, peaks and hacks were destroyed (coarse surface), thus a reduction in mass appears. The impact of the steel ball, a significantly softer material than the coating, contacting the metal-ceramic surface leads to wear, primarily exhibiting signs of adhesion wear. This observation holds true across all cases and is substantiated by the elemental analysis of the surface conducted via SEM, revealing the presence of iron (Fe) traces manifested as dense aggregates arranged in a curved pattern, which is a characteristic indication of wear, a typical example is depicted in Figure 21 (Ti-SiC layer 800 A). At the conclusion of the study, the ball exhibited visible wear, characterized by a flattened contact surface. The overall appearance of the wear tracks suggests limited material removal due to presence of the hard particles (WC, SiC, Cr2O3). Limited material detachment can be observed (especially in the case of Ti-based coatings. Despite the individual system differences, overall, the systems are characterized of high wear resistance.

Figure 20.
SEM images of wear surface coatings. The yellow lines indicate the measured wear track widths used for the quantitative assessment of wear.

Figure 21.
Elemental analysis mapping of Ti-SiC layer 800 A in wear surface coatings.
3.4. Corrosion Evaluation
The representative potentiodynamic cyclic polarization curves of the samples in aqueous corrosion are shown in Figure 22 (Ti-WC mix 900 A and Cr2O3 800 A samples), while Table 6 provides the corresponding values extracted from the curves of all samples, including the equilibrium open circuit potential (Eocp), corrosion potential (Ecorr), reverse corrosion potential (Ecorr rev), and corrosion current (Icorr) and Table 7 illustrates the corrosion current density percentage change in PS coatings compared to Cr2O3. Figure 22 illustrates this behavior, where the Ti-WC mix coating at 900 A shows lower corrosion current and a more stable passivation loop compared to the Cr2O3 coating at 800 A. In the samples Ti-WC/Co mix (800–900 A) and Ti-SiC mix-layer (800–900 A), during the anodic part, a region of active corrosion emerges. Subsequently, an increase in current density occurs alongside a rise in potential until the conclusion of the anodic part; this behavior is confirmed by the literature [,,]. Following this, the reverse curve shifts to the left, forming a positive lag loop. Moreover, considering that the reverse potential exceeds the potential of the rectum, it can be inferred that this sample does not exhibit localized forms of corrosion. Furthermore, the fact that these samples demonstrate very low corrosion currents indicates a highly effective anti-corrosion behavior. In the Cr2O3 samples, the anodic part in the right bias section exhibits the same behavior as the Ti-WC/Co layer samples. The reverse curve shifts from the right, forming a small loop. Notably, the reversal potential is only a few millivolts above the corrosion potential. Consequently, localized forms of corrosion are not prominent issues in these tests, and the corrosion currents are of very low intensity. Specifically, at 800 A, the coating shows mostly general corrosion, as evidenced by the similarity between the forward and reverse curves.

Figure 22.
Representative curves of circular potentiodynamic polarizations of Ti-WC mix 900 A and Cr2O3 800 A samples.

Table 7.
Corresponding values extracted from the curves of all samples.
Table 7 summarizes the electrochemical parameters obtained from the polarization curves for all coatings. Lower corrosion current density (Icorr) values indicate reduced corrosion rates, while more positive corrosion potentials (Ecorr) generally reflect improved corrosion resistance. From the results, it is evident that Ti-WC and Ti-SiC coatings exhibit much lower Icorr values than the reference Cr2O3 coatings. For example, the Ti-WC mix coating at 900 A shows Icorr = 4.82 μA, compared to 19.2 μA for Cr2O3 at 800 A, confirming its superior resistance in chloride-rich environments. Likewise, Ti-SiC coatings also demonstrate consistently lower Icorr values than Cr2O3 across both deposition methods and currents. Table 8 further illustrates this improvement by presenting the percentage reduction in Icorr relative to Cr2O3. Notably, the Ti-SiC layer coating at 900 A achieved up to 89% reduction, while the Ti-WC mix coating at 900 A showed a 78% reduction. These results highlight that increasing the spraying current to 900 A produces denser coatings with reduced porosity, which translates into significantly enhanced corrosion resistance compared to the conventional Cr2O3 system.

Table 8.
Corrosion current density percentage change in PS coatings compared to Cr2O3.
Overall, the choice of Ti, WC, SiC, and Cr2O3 was based on their complementary contributions to coating performance. Ti enhances adhesion and corrosion resistance, WC and SiC provide hardness and wear protection with different balances of toughness and stability, while Cr2O3 serves as a widely accepted benchmark material. Although extensively studied individually, their combined assessment under the same plasma spray conditions in this work highlights that Ti-WC and Ti-SiC coatings can offer multifunctional performance and represent eco-friendly alternatives to conventional WC-Co systems. To further rationalize the influence of spraying parameters, phenomenological equations were employed to link the process conditions with coating properties, as described in the Materials and Methods section (Equations (2)–(5)).
These relations are phenomenological, but they support our findings: higher arc current (900 A) increases Tp and Vp, resulting in lower porosity and improved adhesion, which is consistent with the experimental results. Specifically, Ti-WC coatings at 900 A showed porosity as low as 3–3.5% (Table 4), the lowest corrosion current densities (Table 6 and Table 7, Figure 22), and superior wear resistance (Table 5). Thus, the mathematical representation confirms the experimentally observed trends that higher spraying energy yields denser coatings with stronger adhesion and enhanced functional performance.
4. Conclusions
In this research, metal-ceramic powders were employed as substitutes for conventional WC-Co and Cr2O3 powders traditionally used in coatings. Steel samples were coated using the plasma spray technique under different deposition strategies and current settings (800–900 A). The results demonstrated that the technological parameters of plasma spraying strongly influence the microstructure and performance of the coatings. In particular, operation at a higher current (900 A) improved the melting of feedstock powders, producing denser coatings with reduced porosity, stronger adhesion, and enhanced wear and corrosion resistance compared to 800 A. Other processing factors, such as gas composition, spray distance, and powder feed rate, were also found to play important roles in particle heating and deposition, thereby affecting coating thickness, porosity, and mechanical integrity.
Microstructural analysis by SEM/EDX confirmed that the coatings exhibited good adhesion to the substrate with limited porosity and no significant discontinuities or delamination. The most favorable performance was observed in the Ti--WC mix at 900 A and the Ti-SiC layer at 900 A. Profilometry measurements showed that Ti-SiC mix coatings presented roughness values comparable to the Ti-SiC layer, while Ti-WC coatings displayed values similar to Cr2O3, confirming their suitability as eco-friendly substitutes in applications where surface topography is critical.
Tribological testing revealed very good wear resistance across all coatings, with the best results obtained at 900 A, where surfaces remained largely intact after testing. Electrochemical tests demonstrated that Ti-WC and Ti-SiC coatings exhibited significantly lower corrosion current densities than Cr2O3, in some cases achieving up to 78–89% reduction. In particular, the Ti-WC mix (900 A) and Ti-SiC layer (900 A) coatings showed stable passivation behavior and resistance to localized corrosion, confirming their superior electrochemical stability in chloride-rich environments.
Finally, the phenomenological equations introduced in Section 3.4 supported the experimental findings by quantitatively linking process parameters to porosity and adhesion strength. These models confirmed that higher spraying energy reduces porosity and enhances adhesion, which translates directly into improved mechanical and electrochemical performance.
Overall, this study provides new insights into the development of eco-friendly multifunctional coatings via plasma spraying. Beyond demonstrating viable alternatives to hazardous WC-Co and Cr2O3 coatings, the work contributes predictive models that can guide parameter optimization in future investigations. The findings are therefore valuable for the scientific community by advancing sustainable surface engineering while offering a framework that can be extended to other material systems and industrial applications.
Author Contributions
Preparation of specimens, S.G.F., D.A.E. and V.K.; characterization measurements and interpretation methodology, S.G.F., D.A.E., P.T.D. and E.A.A.; experimental data analysis and interpretation, S.G.F., D.A.E., P.T.D., E.A.A. and A.E.K.; SEM-EDX, S.G.F. and A.E.K.; profilometry analysis, P.T.D.; wear assessment, E.A.A.; corrosion evaluation, E.A.A.; writing—original draft preparation, S.G.F.; writing—review and editing, S.G.F., D.A.E., A.E.K. and T.E.M.; supervision, T.E.M.; project administration, T.E.M.; funding acquisition, T.E.M. All authors have read and agreed to the published version of the manuscript.
Funding
This project, titled “GREEN nano-structured multifunctional protective COATings (GREENCOAT)”, was funded by the Operational Programme “Competitiveness, Entrepreneurship and Innovation” (EPAnEK) under the call “RESEARCH – CREATE – INNOVATE (2nd Cycle)”, and co-financed by the European Union and Greek national funds (Project code: MIS 5063784).
Institutional Review Board Statement
Not applicable.
Informed Consent Statement
Not applicable.
Data Availability Statement
The datasets generated for this study are available upon request to the corresponding author due to privacy.
Conflicts of Interest
Author Vasileios Kechagias was employed by Superalloys Engineering S.A. The remaining authors declare that the research was conducted in the absence of any commercial or financial relationships that could be construed as a potential conflict of interest.
References
- Sathish, M.; Radhika, N.; Saleh, B. Duplex and composite coatings: A thematic review on thermal spray techniques and applications. Met. Mater. Int. 2023, 29, 1229–1297. [Google Scholar] [CrossRef]
- Meghwal, A.; Anupam, A.; Murty, B.S.; Berndt, C.C.; Kottada, R.S.; Ang, A.S.M. Thermal spray high-entropy alloy coatings: A review. J. Therm. Spray Technol. 2020, 29, 857–893. [Google Scholar] [CrossRef]
- Smith, R.W.; Knight, R. Thermal spraying I: Powder consolidation—From coating to forming. JOM 1995, 47, 32–39. [Google Scholar] [CrossRef]
- Bhushan Mharat, G.B.K. Handbook of Tribology; McGraw-Hill Inc.: New York, NY, USA, 1991. [Google Scholar]
- Scott, K.; Kingswell, R. Advanced Surface Coatings; Rickerby, D.S., Mathews, A., Eds.; Chapman and Hall: New York, NY, USA, 1991. [Google Scholar]
- van den Berge, F.M.J. Thermal Spray Processes: An Overview. Adv. Mater. Process. 1998, 154, 31–35. [Google Scholar]
- Davis, J.R. Handbook of Thermal Spray Technology; ASM International: Almere, The Netherlands, 2004. [Google Scholar]
- Exarchos, D.A.; Sima, A.D.; Ananiadis, I.; Dalla, P.A.; Tragazikis, I.; Kordatou, T.; Farmaki, S.; Gontzamanis, A.; Kechagias, V.; Kechagias, L.; et al. Development and characterization of environmentally friendly multifunctional protective coatings. In NDE 4.0, Predictive Maintenance, and Communication and Energy Systems in a Globally Networked World; SPIE: Cergy, France, 2022; p. 5. [Google Scholar]
- Thakur, L.; Vasudev, H. Thermal Spray Coatings; CRC Press: Boca Raton, FL, USA, 2021. [Google Scholar]
- Boulos, M.I.; Fauchais, P.L.; Heberlein, J.V. Thermal Spray Fundamentals: From Powder to Part; Springer: Berlin/Heidelberg, Germany, 2021. [Google Scholar]
- Latka, L.; Pawlowski, L.; Winnicki, M.; Sokolowski, P.; Małachowska, A.; Kozerski, S. Review of functionally graded thermal sprayed coatings. Appl. Sci. 2020, 10, 5153. [Google Scholar] [CrossRef]
- Pawłowski, L. The Science and Engineering of Thermal Spray Coatings, 2nd ed.; John Wiley & Sons Ltd.: Hoboken, NJ, USA, 2008. [Google Scholar]
- Smith, R. Plasma Spray Processing—The State of the Art and Future from a Surface to a Materials Processing Technology. In Proceedings of the 2nd Plasma-Technik-Symposium, Lucerne, Switzerland, 5–7 June 1991; pp. 17–38. [Google Scholar]
- Steffens, H.-D.; Mack, M. Plasma spraying as an advanced tool in surface engineering. Pure Appl. Chem. 1990, 62, 1801–1808. [Google Scholar] [CrossRef]
- Unabia, R.; Candidato, R.; Pawłowski, L. Current progress in solution precursor plasma spraying of cermets: A review. Metals 2018, 8, 420. [Google Scholar] [CrossRef]
- Zaat, J.H. A quarter of a century of plasma spraying. Annu. Rev. Mater. Sci. 1983, 13, 9–42. [Google Scholar] [CrossRef]
- Gao, Z.; Zhang, Z.; Zhang, X.; Kulczyk-Malecka, J.; Liu, H.; Kelly, P.; Withers, P.J.; Xiao, P. A conformable high temperature nitride coating for Ti alloys. Acta Mater. 2020, 189, 274–283. [Google Scholar] [CrossRef]
- Pasumarthi, V.; Chen, Y.; Bakshi, S.R.; Agarwal, A. Reaction synthesis of Ti3SiC2 phase in plasma sprayed coating. J. Alloy. Compd. 2009, 484, 113–117. [Google Scholar] [CrossRef]
- Li, C.; Zhou, Z.; Hu, L.; He, J.; Zheng, G.; Zhao, H.; Dong, Y.; Yang, Y.; Qin, Y.; Yin, F. Fabrication of plasma-sprayed TiC-Ti5Si3-Ti3SiC2 composite coatings from the annealed Ti/SiC powders. Surf. Coatings Technol. 2021, 417, 127227. [Google Scholar] [CrossRef]
- Ghadami, F.; Sohi, M.H.; Ghadami, S. Effect of bond coat and post-heat treatment on the adhesion of air plasma sprayed WC-Co coatings. Surf. Coatings Technol. 2015, 261, 289–294. [Google Scholar] [CrossRef]
- Sathish, S.; Geetha, M.; Asokamani, R. Comparative Studies on the Corrosion and Scratchbehaviors of Plasma Sprayed ZrO2 and WC-Co Coatings. Procedia Mater. Sci. 2014, 6, 1489–1494. [Google Scholar] [CrossRef]
- Ettmayer, P.; Lengauer, W.J.P.M.I. The story of cermets. Int. J. Powder Metall. 1989, 21, 37–38. [Google Scholar]
- Rajabi, A.; Ghazali, M.; Daud, A. Chemical composition, microstructure and sintering temperature modifications on mechanical properties of TiC-based cermet—A review. Mater. Des. 2015, 67, 95–106. [Google Scholar] [CrossRef]
- Bhaumik, S.; Upadhyaya, G.; Vaidya, M. Alloy design of WC-10Co hard metals with modifications in carbide and binder phases. Int. J. Refract. Met. Hard Mater. 1992, 11, 9–22. [Google Scholar] [CrossRef]
- Braic, M.; Vladescu, A.; Parau, A.C.; Pruncu, C.I.; Braic, V. Tribological properties of alloyed TiSi-stainless steel carbide coatings deposited by reactive cathodic arc method. Wear 2020, 460–461, 203456. [Google Scholar] [CrossRef]
- Idris, A.M.; El-Zahhar, A.A. Indicative properties measurements by SEM, SEM-EDX and XRD for initial homogeneity tests of new certified reference materials. Microchem. J. 2019, 146, 429–433. [Google Scholar] [CrossRef]
- Hassani, S.; Li, D.; Martinu, L.; Klemberg-Sapieha, J.E. Highly elastic hard PECVD TiSiC:H/a-SiC:H coatings with enhanced erosion and corrosion resistance: The trampoline effect. J. Vac. Sci. Technol. A 2023, 41, 043105. [Google Scholar] [CrossRef]
- Baiamonte, L.; Pulci, G.; Gisario, A.; Paglia, L.; Marino, A.L.; Tului, M.; Marra, F. WC-Ti coatings deposited via cold gas spray and modified by laser and furnace heat treatments. J. Therm. Spray Technol. 2021, 30, 2083–2098. [Google Scholar] [CrossRef]
- Moropoulou, A.; Delegou, E.; Vlahakis, V.; Karaviti, E. Digital processing of SEM images for the assessment of evaluation indexes of cleaning interventions on Pentelic marble surfaces. Mater. Charact. 2007, 58, 1063–1069. [Google Scholar] [CrossRef]
- Alexakis, E.; Delegou, E.; Lampropoulos, K.; Apostolopoulou, M.; Ntoutsi, I.; Moropoulou, A. NDT as a monitoring tool of the works progress and the assessment of materials and rehabilitation interventions at the Holy Aedicule of the Holy Sepulchre. Constr. Build. Mater. 2018, 189, 512–526. [Google Scholar] [CrossRef]
- Gambaro, S.; Valenza, F.; Cacciamani, G.; Muolo, M.; Passerone, A.; Toche, F.; Chiriac, R.; Dezellus, O. High-temperature-reactivity of Al-Ti alloys in contact with SiC. J. Alloy. Compd. 2020, 817, 152715. [Google Scholar] [CrossRef]
- Monisha, K.; Shariff, S.; Raju, R.; Manonmani, J.; Jayaraman, S. Titanium boride and titanium silicide phase formation by high power diode laser alloying of B4C and SiC particles with Ti: Microstructure, hardness and wear studies. Mater. Today Commun. 2022, 31, 103741. [Google Scholar] [CrossRef]
- Mitaľ, G.; Dobránsky, J.; Ružbarský, J.; Olejárová, Š. Application of laser profilometry to evaluation of the surface of the workpiece machined by abrasive waterjet technology. Appl. Sci. 2019, 9, 2134. [Google Scholar] [CrossRef]
- Islam, M.A.; Jiang, J.; Xie, Y.; Fiala, P. Investigation of erosion-corrosion behavior of (WTi)C based weld overlays. Wear 2017, 390–391, 155–165. [Google Scholar] [CrossRef]
- Travaglini, J.; Barsoum, M.; Jovic, V.; El-Raghy, T. The corrosion behavior of Ti3SiC2 in common acids and dilute NaOH. Corros. Sci. 2003, 45, 1313–1327. [Google Scholar] [CrossRef]
- Baboian, R. Corrosion Tests and Standards: Application and Interpretation; ASTM International: West Conshohocken, PA, USA, 2005; Volume 20. [Google Scholar]
- Hazra, S.; Sabiruddin, K.; Bandyopadhyay, P.P. Plasma and HVOF sprayed WC-Co coatings as hard chrome replacement solution. Surf. Eng. 2012, 28, 37–43. [Google Scholar] [CrossRef]
- Das, M.; Bysakh, S.; Basu, D.; Kumar, T.S.; Balla, V.K.; Bose, S.; Bandyopadhyay, A. Microstructure, mechanical and wear properties of laser processed SiC particle reinforced coatings on titanium. Surf. Coatings Technol. 2011, 205, 4366–4373. [Google Scholar] [CrossRef]
- Das, M.; Balla, V.K.; Basu, D.; Bose, S.; Bandyopadhyay, A. Laser processing of SiC-particle-reinforced coating on titanium. Scr. Mater. 2010, 63, 438–441. [Google Scholar] [CrossRef]
- Tang, J.; Saha, G.C.; Richter, P.; Kondás, J.; Colella, A.; Matteazzi, P. Effects of post-spray heat treatment on hardness and wear properties of Ti-WC high-pressure cold spray coatings. J. Therm. Spray Technol. 2018, 27, 1153–1164. [Google Scholar] [CrossRef]
- ASTM E2109-01; Standard Test Methods for Determining Area Percentage Porosity in Thermal Sprayed Coatings. ASTM International: West Conshohocken, PA, USA, 2001.
- ASTM C633-13; Standard Test Method for Adhesion or Cohesion Strength of Thermal Spray Coatings. ASTM International: West Conshohocken, PA, USA, 2013.
- ASTM C1624-05; Standard Test Method for Adhesion Strength and Mechanical Failure Modes of Coatings by Quantitative Single Point Scratch Testing. ASTM International: West Conshohocken, PA, USA, 2015.
- Borisov, Y.; Borisova, A.; Dyad’Ko, E. Composite Ti-Si-C System Coatings. Mater. Manuf. Process. 1995, 10, 831–835. [Google Scholar] [CrossRef]
- Fayyaz, O.; Bahgat Radwan, A.; Sliem, M.H.; Abdullah, A.M.; Hasan, A.; Shakoor, R.J.A.o. Investigating the properties of electrodeposited of Ni-P-ZrC nanocomposite coatings. ACS Omega 2021, 6, 33310–33324. [Google Scholar] [CrossRef] [PubMed]
- Fayyaz, O.; Khan, A.; Shakoor, R.A.; Hasan, A.; Yusuf, M.M.; Montemor, M.F.; Rasul, S.; Khan, K.; Faruque, M.R.I.; Okonkwo, P.C. Enhancement of mechanical and corrosion resistance properties of electrodeposited Ni-P-TiC composite coatings. Sci. Rep. 2021, 11, 5327. [Google Scholar] [CrossRef]
- Shahzad, K.; Radwan, A.B.; Fayyaz, O.; Shakoor, R.; Uzma, M.; Umer, M.A.; Baig, M.; Raza, A. Effect of concentration of TiC on the properties of pulse electrodeposited Ni-P-TiC nanocomposite coatings. Ceram. Int. 2021, 47, 19123–19133. [Google Scholar] [CrossRef]
Disclaimer/Publisher’s Note: The statements, opinions and data contained in all publications are solely those of the individual author(s) and contributor(s) and not of MDPI and/or the editor(s). MDPI and/or the editor(s) disclaim responsibility for any injury to people or property resulting from any ideas, methods, instructions or products referred to in the content. |
© 2025 by the authors. Licensee MDPI, Basel, Switzerland. This article is an open access article distributed under the terms and conditions of the Creative Commons Attribution (CC BY) license (https://creativecommons.org/licenses/by/4.0/).