1. Introduction
The moiré effect is an optical interaction between superimposed layers with periodically modulated transmittance [
1]. Researchers have extensively studied the moiré effect in optics [
2,
3,
4,
5].
The moiré patterns in superimposed (overlapped) regular or nearly regular structures (arrays) appear as light and dark interference fringes, which look like repeated lines, circles, or dots, depending on the geometry of the layers. “Repetitive structures (such as screens, grids or gratings) are superposed or viewed against each other” [
1], causing the moiré effect. Important is “a new pattern of alternating dark and bright areas which is clearly observed at the superposition, although it does not appear in any of the original” [
1]. Reference [
6] also noted, “the moiré effect denotes a fringe pattern formed by the superposition of two grid structures of similar period.” When black (opaque) lines of one array are superimposed on white (transparent) spaces between the lines of another array, dark (on average) areas of moiré patterns are formed, and when the black lines of both objects coincide, light moiré areas are formed. The moiré effect is the formation of patterns with longer periods resulting from the interference between similar periodic structures with shorter periods, followed by averaging [
7]. The studies [
1,
8,
9,
10] provide a solid theoretical basis.
The period of the moiré patterns is longer than that of overlapping structures [
1]. The moiré is a formation of large-scale patterns (bands or fringes) owing to the interference between similar periodic structures of shorter periods [
9,
11]. The formal definition of the moiré effect is as follows [
7]: the moiré effect is the effect of the formation of measurable patterns of a longer period caused by a point-by-point interaction in “corresponding” points between similar periodic structures of shorter periods and the averaging in the neighborhood of those points. This definition is also valid for projections of the structures onto the same screen. In the current paper, we refer to these structures (arrays, gratings) as grids.
Note that the grids involved in the moiré effect are not diffraction gratings with the typical period of hundreds of nanometers but are structures with a period of several millimeters or centimeters, which is much longer than the wavelength of visible light.
The grids should be similar and have close periods and orientations. The difference between grids (or rather, their projections) should not be significant; otherwise, the effect will be weak or undetectable. Since the grids must be visible through each other, at least one of them must be transparent.
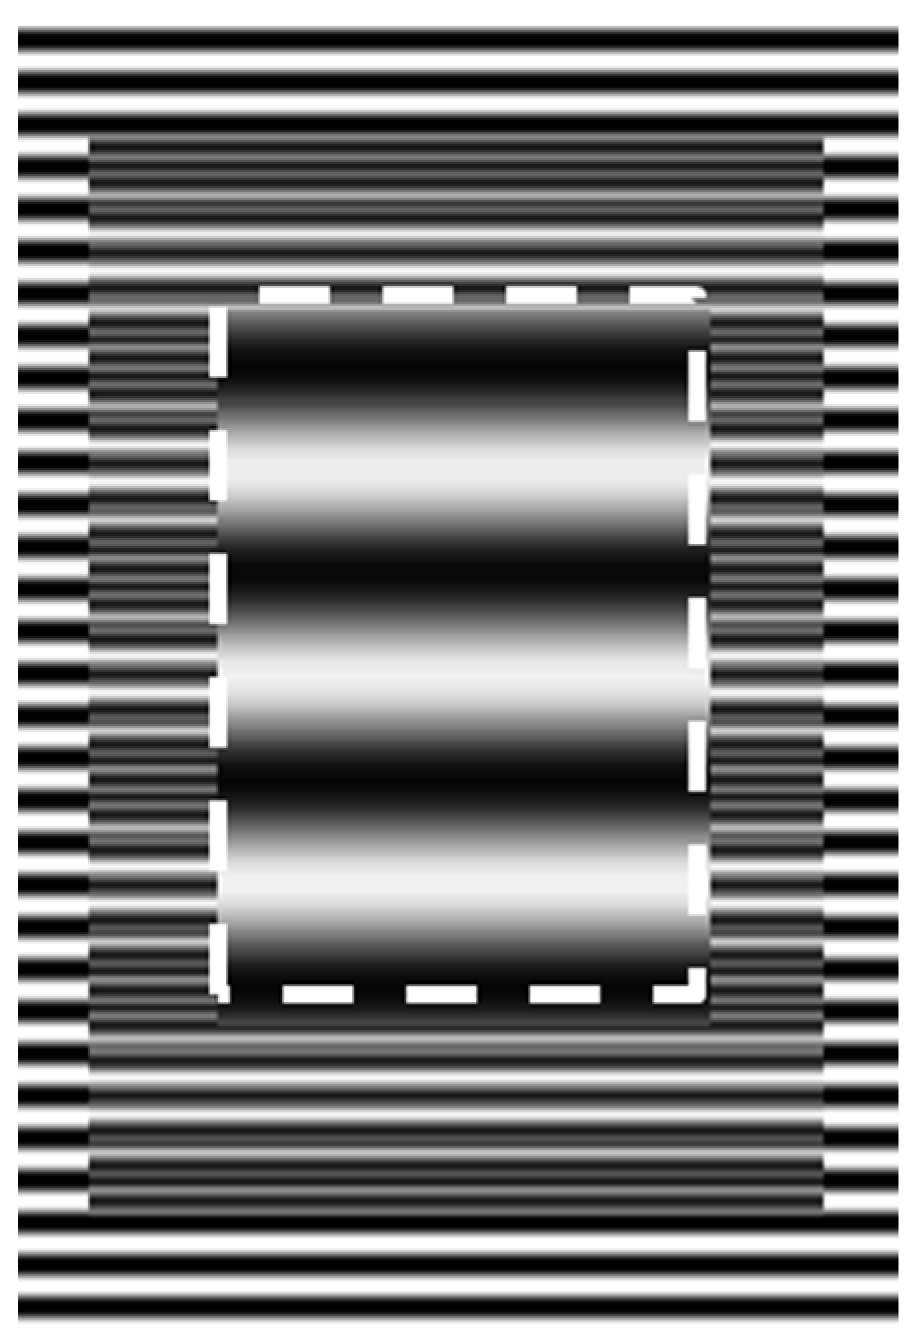
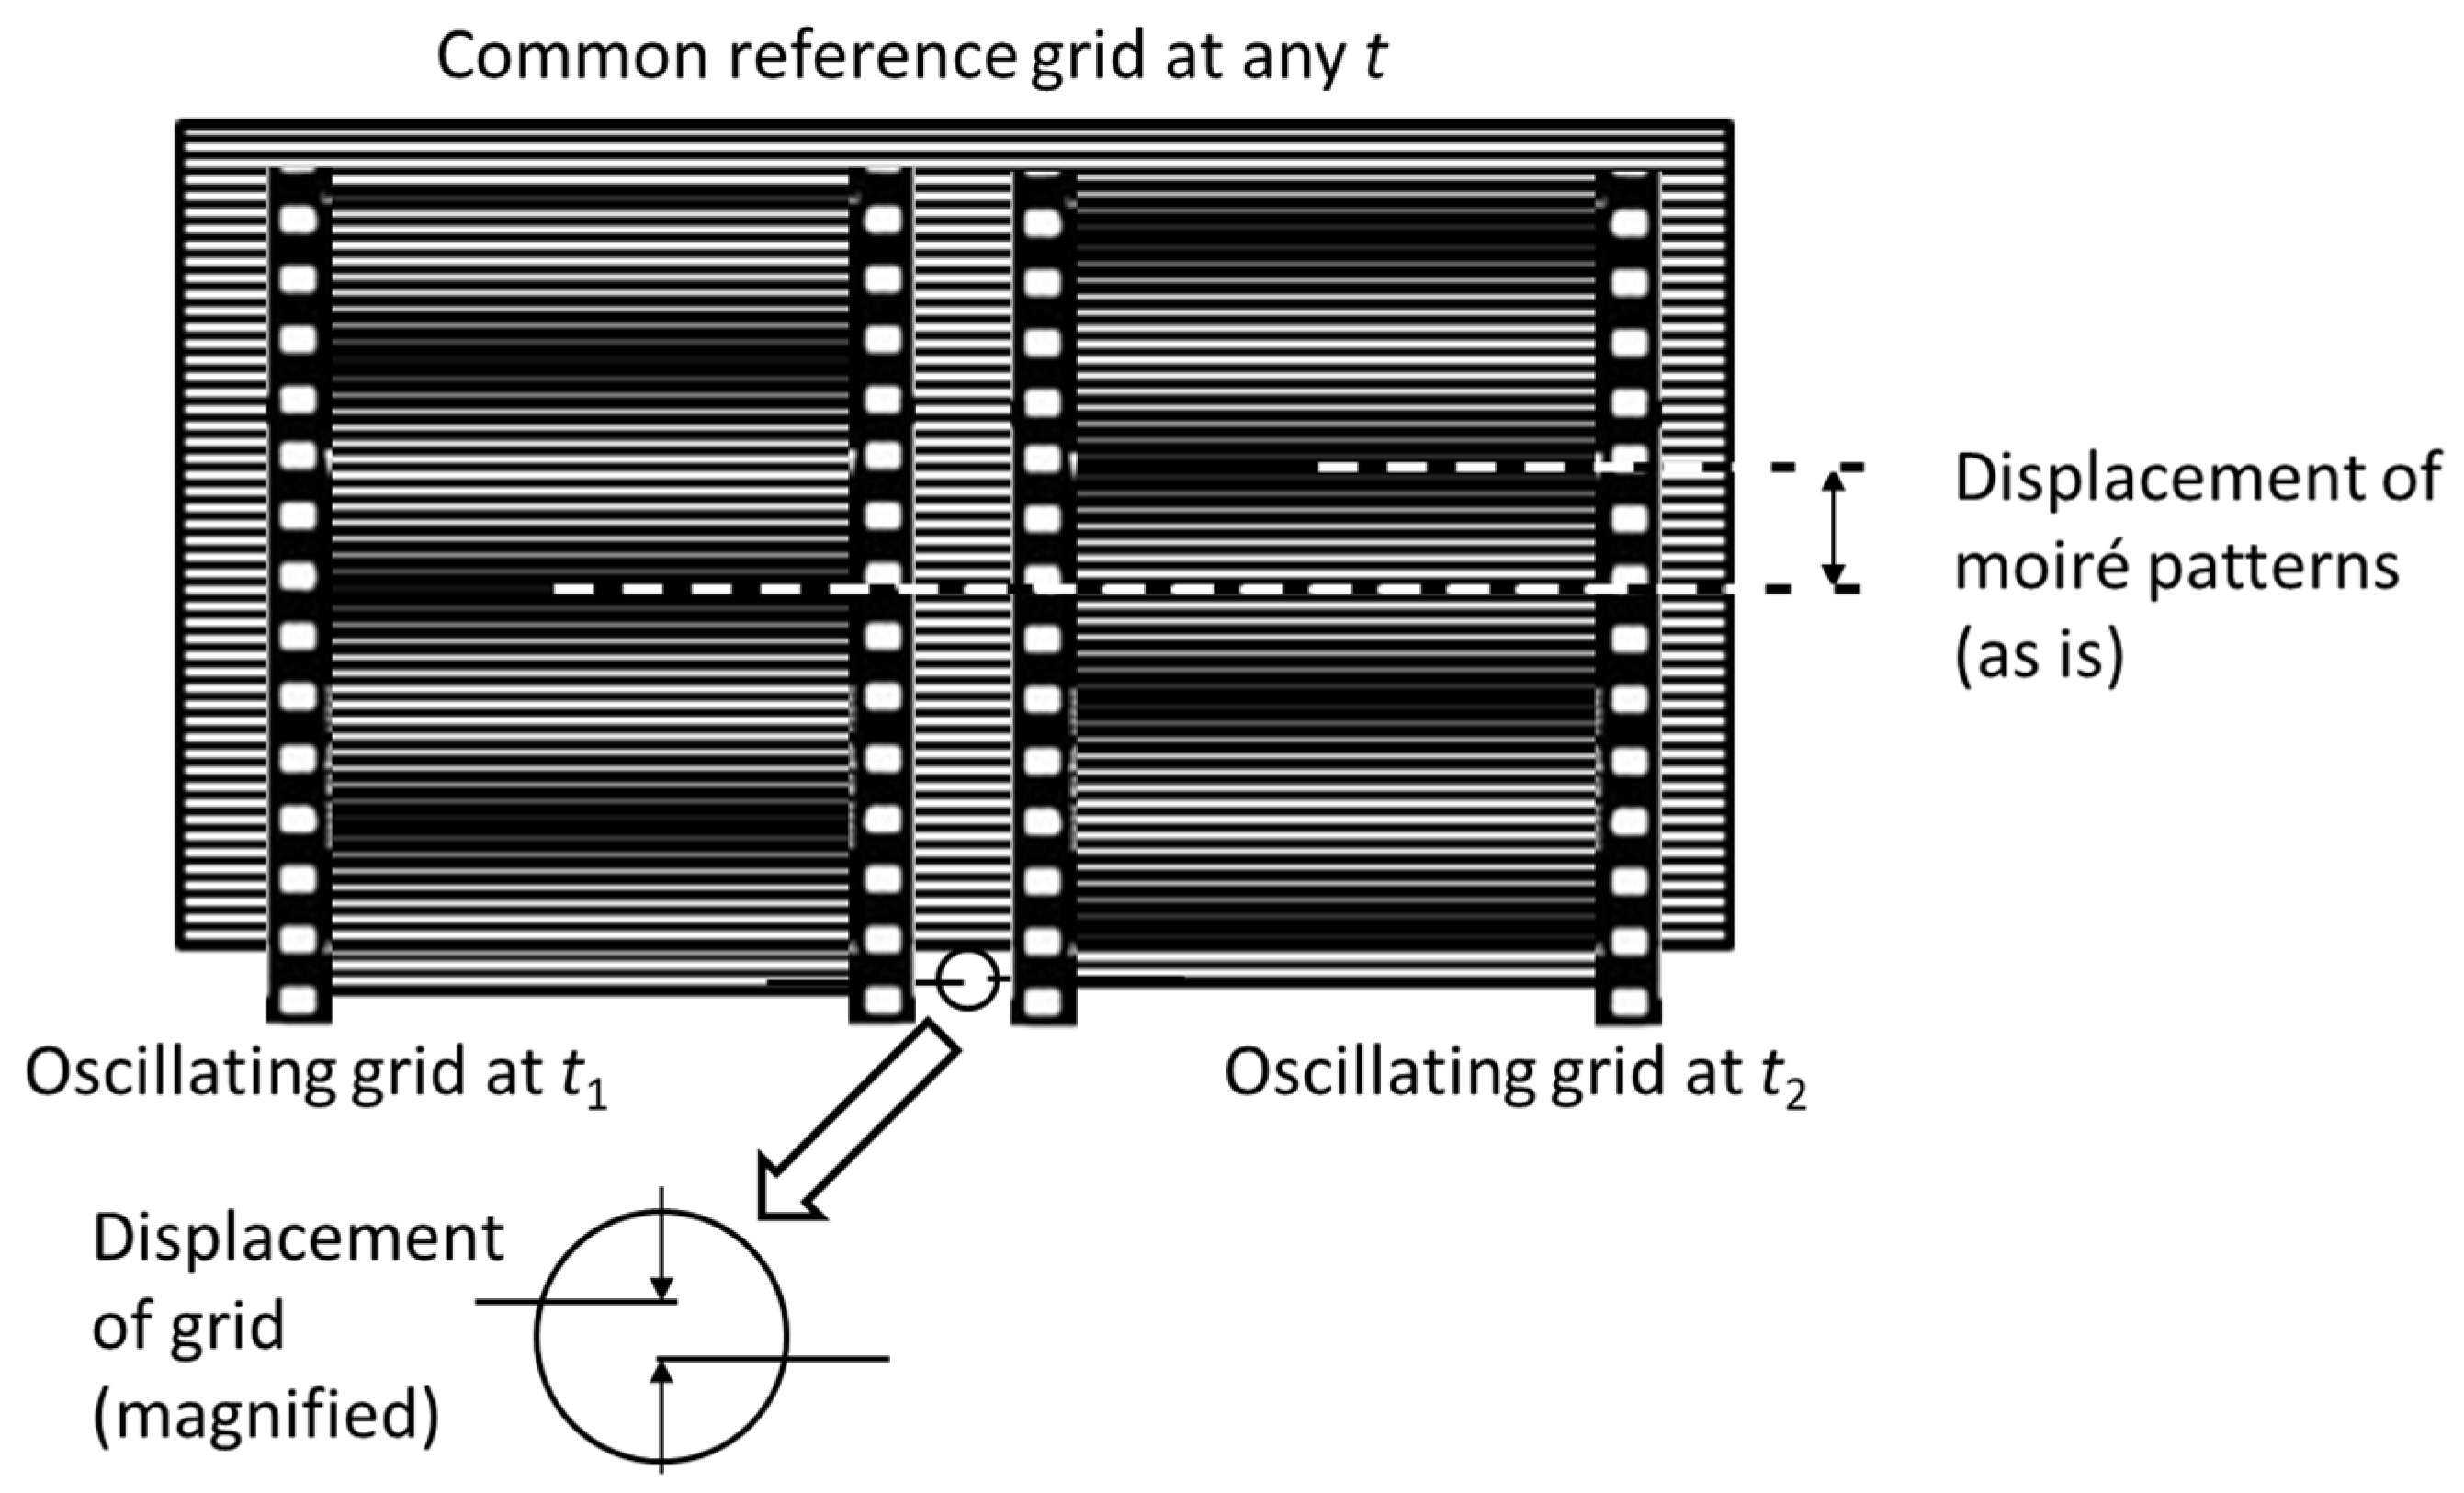
The result of the superposition is a mixture of images of the original grids and a new pattern with a longer period. To see clear moiré patterns, it is necessary to extract the low-frequency component of the mixture, for example, by applying a low-pass filter (e.g., averaging). An example of the moiré effect is shown in
Figure 1. Along the perimeter of the overlap area, a mixture of the original grids and a new pattern can be seen. Near the center (inside the dotted rectangle), the pure (filtered) moiré patterns are visible.
The appearance of the moiré patterns depends on the geometry and relative position of the layers (period, phase, and angle). In simple cases, such as coplanar periodic layers of simple structures, the moiré patterns can be estimated using the moiré magnifier concept [
12]. The higher the similarity of the layers and their regularity are, the stronger the moiré effect is, and the brighter the moiré patterns are. An example is the moiré patterns in a liquid crystal display, which shows magnified pixels. The moiré patterns often reproduce an enlarged and twisted structure of the layers [
1,
12,
13]. An opposite example is the research [
14], which confirms that the moiré effect in dissimilar layers (namely, in square and hexagonal grids) is practically absent.
To observe the moiré patterns, it is unnecessary to recognize the lines on the grids. Even if the tiny structure of a grid is beyond the resolution, the large-scale patterns can be observed.
The use of the moiré effect is not unknown in metrology and optical measurements [
15,
16,
17,
18,
19,
20,
21,
22]. Particularly, the moiré effect is efficiently used in profilometry (contour lines) [
23] and interferometry [
24,
25], particularly, to measure the shape, position, or deformation of objects [
26,
27].
One practical application of the moiré effect is the non-contact measurement of the displacement (movement) of distant objects [
4]. The moiré measurement is conceptually based on the moiré magnification [
12] and the phase proportionality [
1]. The phase of the magnified moiré patterns (magnified displacement) is linearly proportional to the phase difference between the grids (grid displacement). For linear measurements, the magnification provides sensitivity, and the phase indicates a displacement, as in [
28]. During measurements, the position of a vibrating grid is compared with a static reference grid. (The displacement less than one camera pixel is not a principal problem, because the moiré effect magnifies it to a measurable value.)
A valuable application of the moiré effect is the measurement of linear displacement (motion or vibration) of distant objects using a digital camera [
29]. The moiré effect and digital cameras offer advantages over other measurement methods without moiré, as confirmed by many authors, e.g., [
30]. The measurement system [
31] is divided into two subsystems: data acquisition and data processing. The first subsystem records the video of a vibrating (moving) object; the second subsystem processes this video in the laboratory. The subsystems are almost independent, which allows some practical flexibility. In the first subsystem (in the field), a video of the grid attached to a moving object is recorded. The second subsystem (in the laboratory) involves generating the second (reference) grid and processing the moiré patterns of the recorded video. The method works at a non-fixed distance, almost without geometric constraints that might be caused, for example, by the resolution capacity or the pixel size of the camera, as in moiré sampling (CCD moiré) [
32,
33,
34,
35,
36,
37,
38]. Alternatively, this method can be implemented in real time [
39].
Theoretically known [
31], the sub-pixel sensitivity of moiré measurements may seem unachievable in practice. To deal with this, we developed computer programs that generate simulated motion with arbitrary (non-integer and fractional) vibration amplitudes. We conducted experiments using these videos.
Among papers on the estimation of the moiré sensitivity, the sensitivity of less than 0.1 mm (projection moiré) is demonstrated in [
40]. A sensitivity to the rotation angle of approximately 0.1° was demonstrated in [
41] for display panels. In [
42], a method for calibrating the moiré system (shadow moiré) is proposed.
Recently, new applications of the moiré effect have emerged, for instance, the moiré effect in fractal structures [
43,
44], image encryption [
45], laser thermal lensing [
46], singular optics [
47,
48], 3D displays based on the moiré effect [
49,
50,
51,
52], and many others.
The paper is arranged as follows. The materials and methods are described in
Section 2, including moiré magnification, the estimation of sensitivity, the principle of moiré measurements, simulated motion, and the experimental setup. The verification of the measurement system is presented in
Section 3, including the manual mechanical movement, experimental sensitivity threshold, and direct observation of sub-pixel motion.
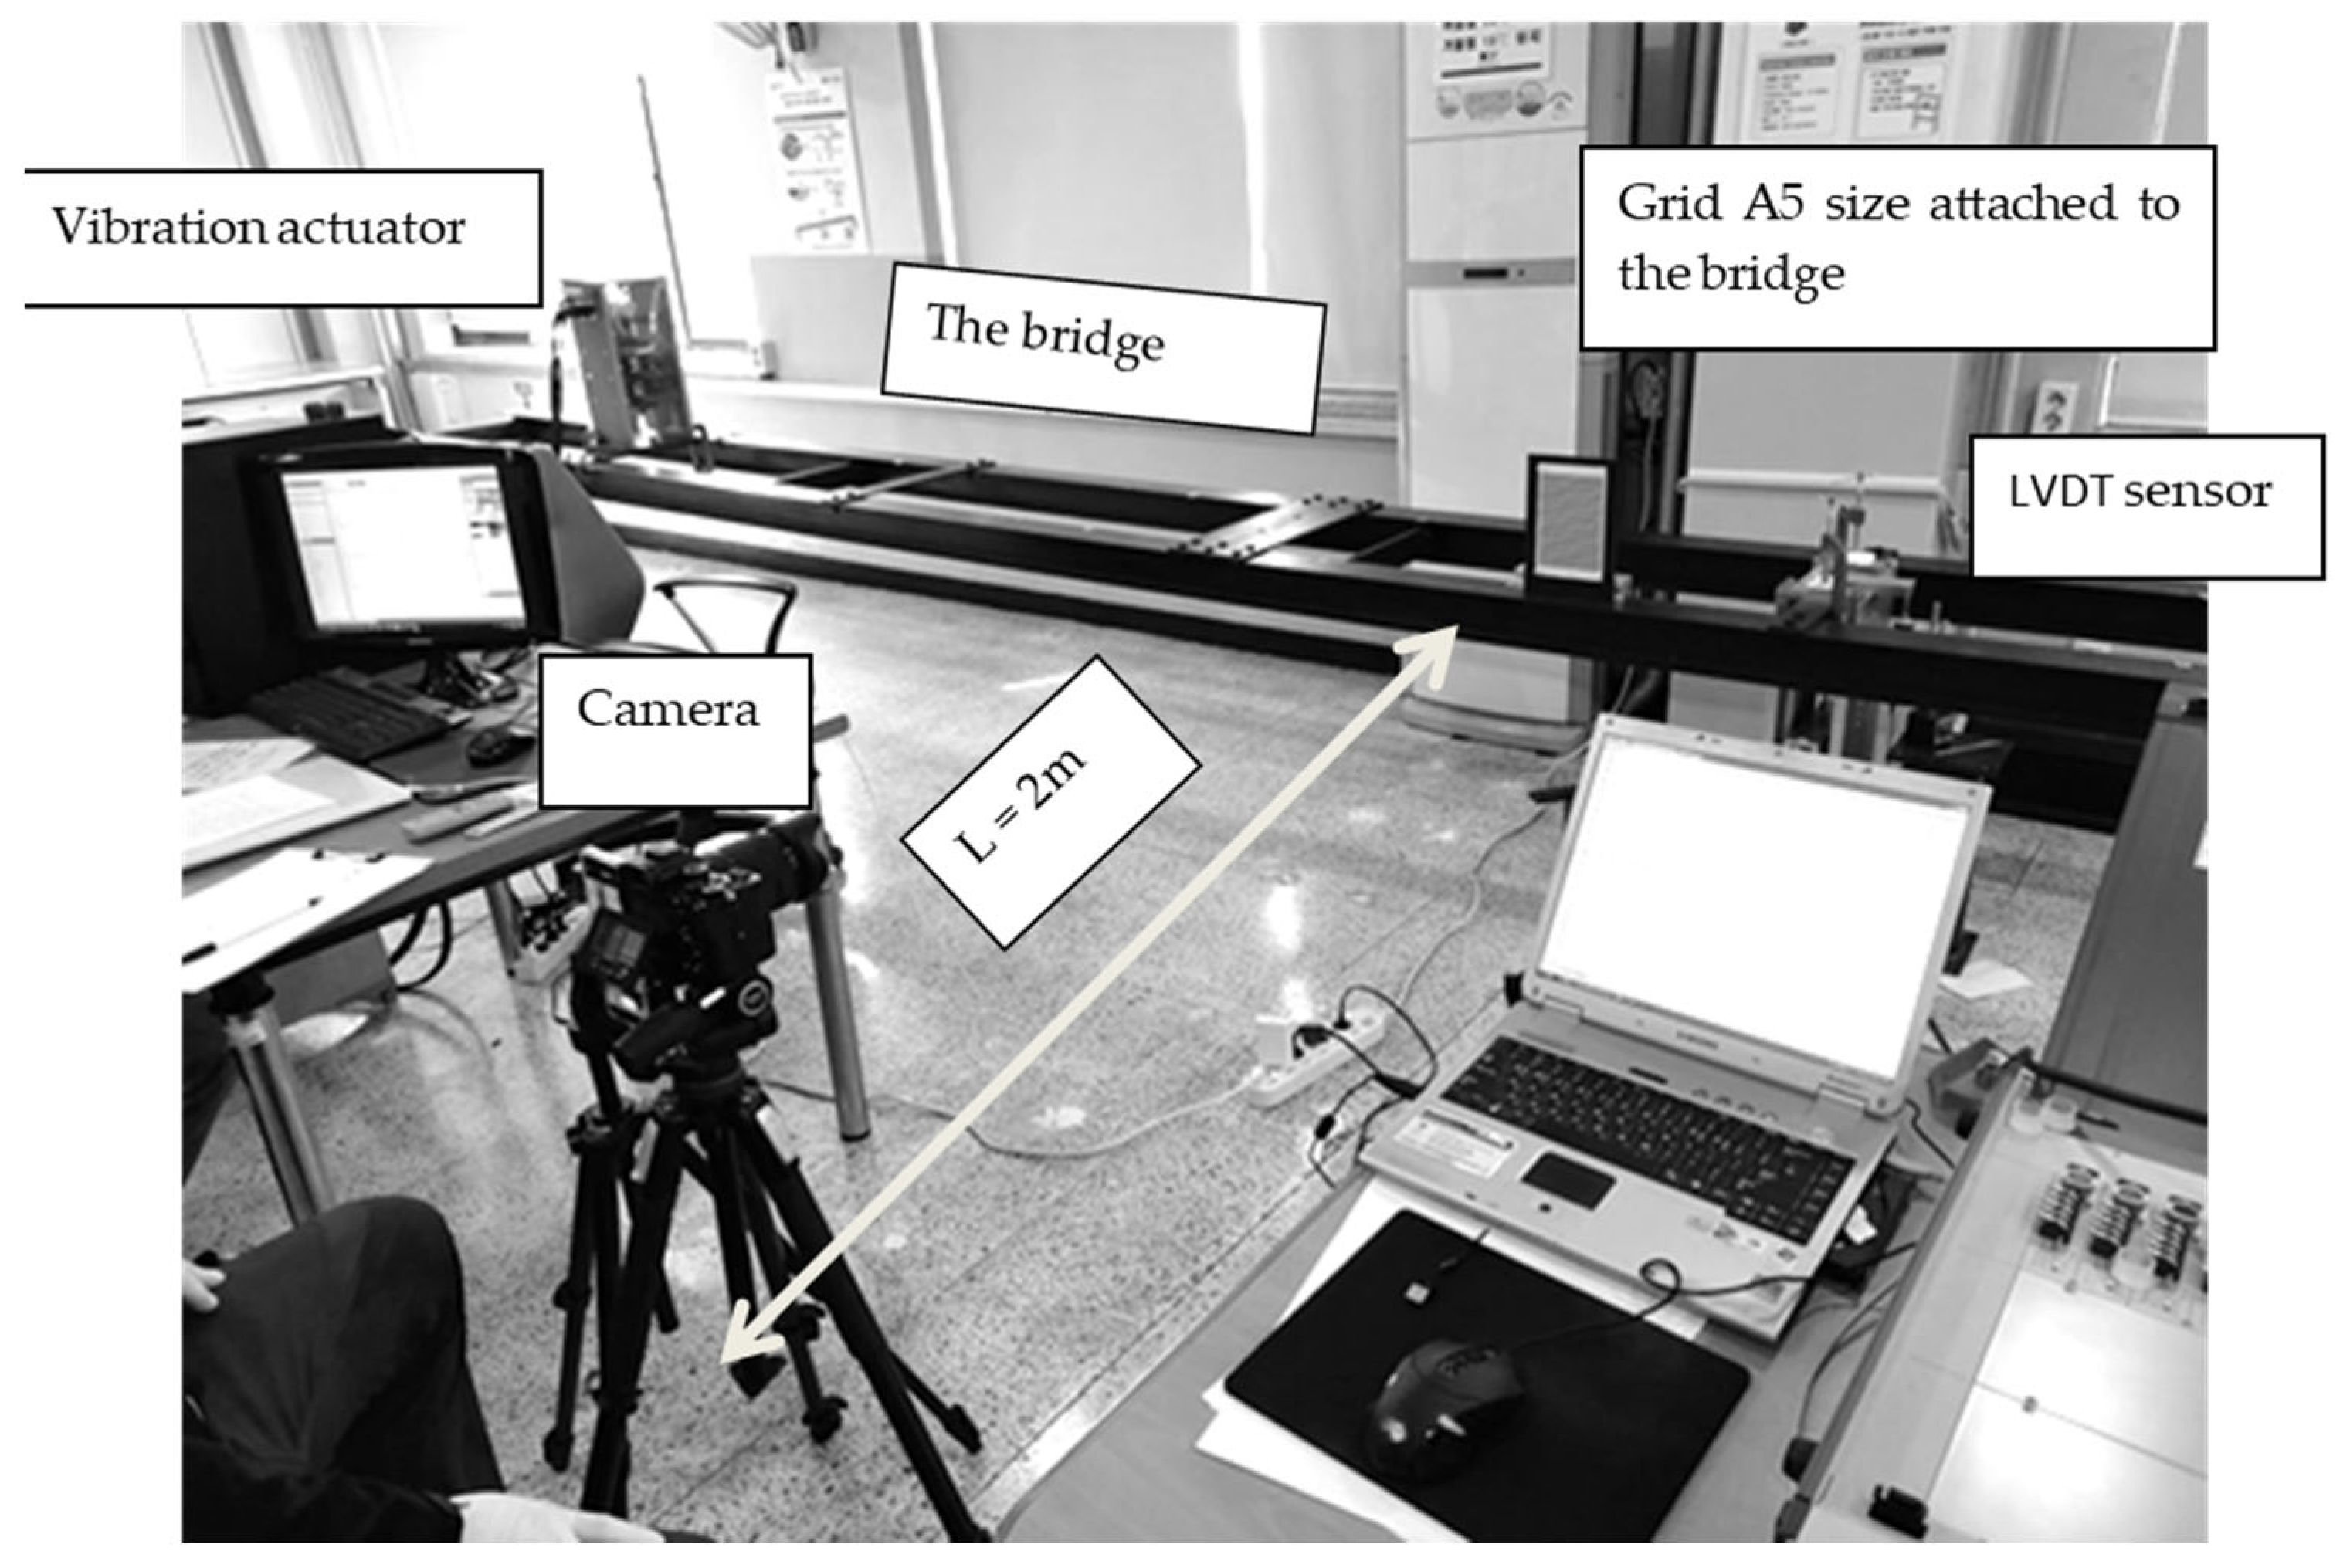
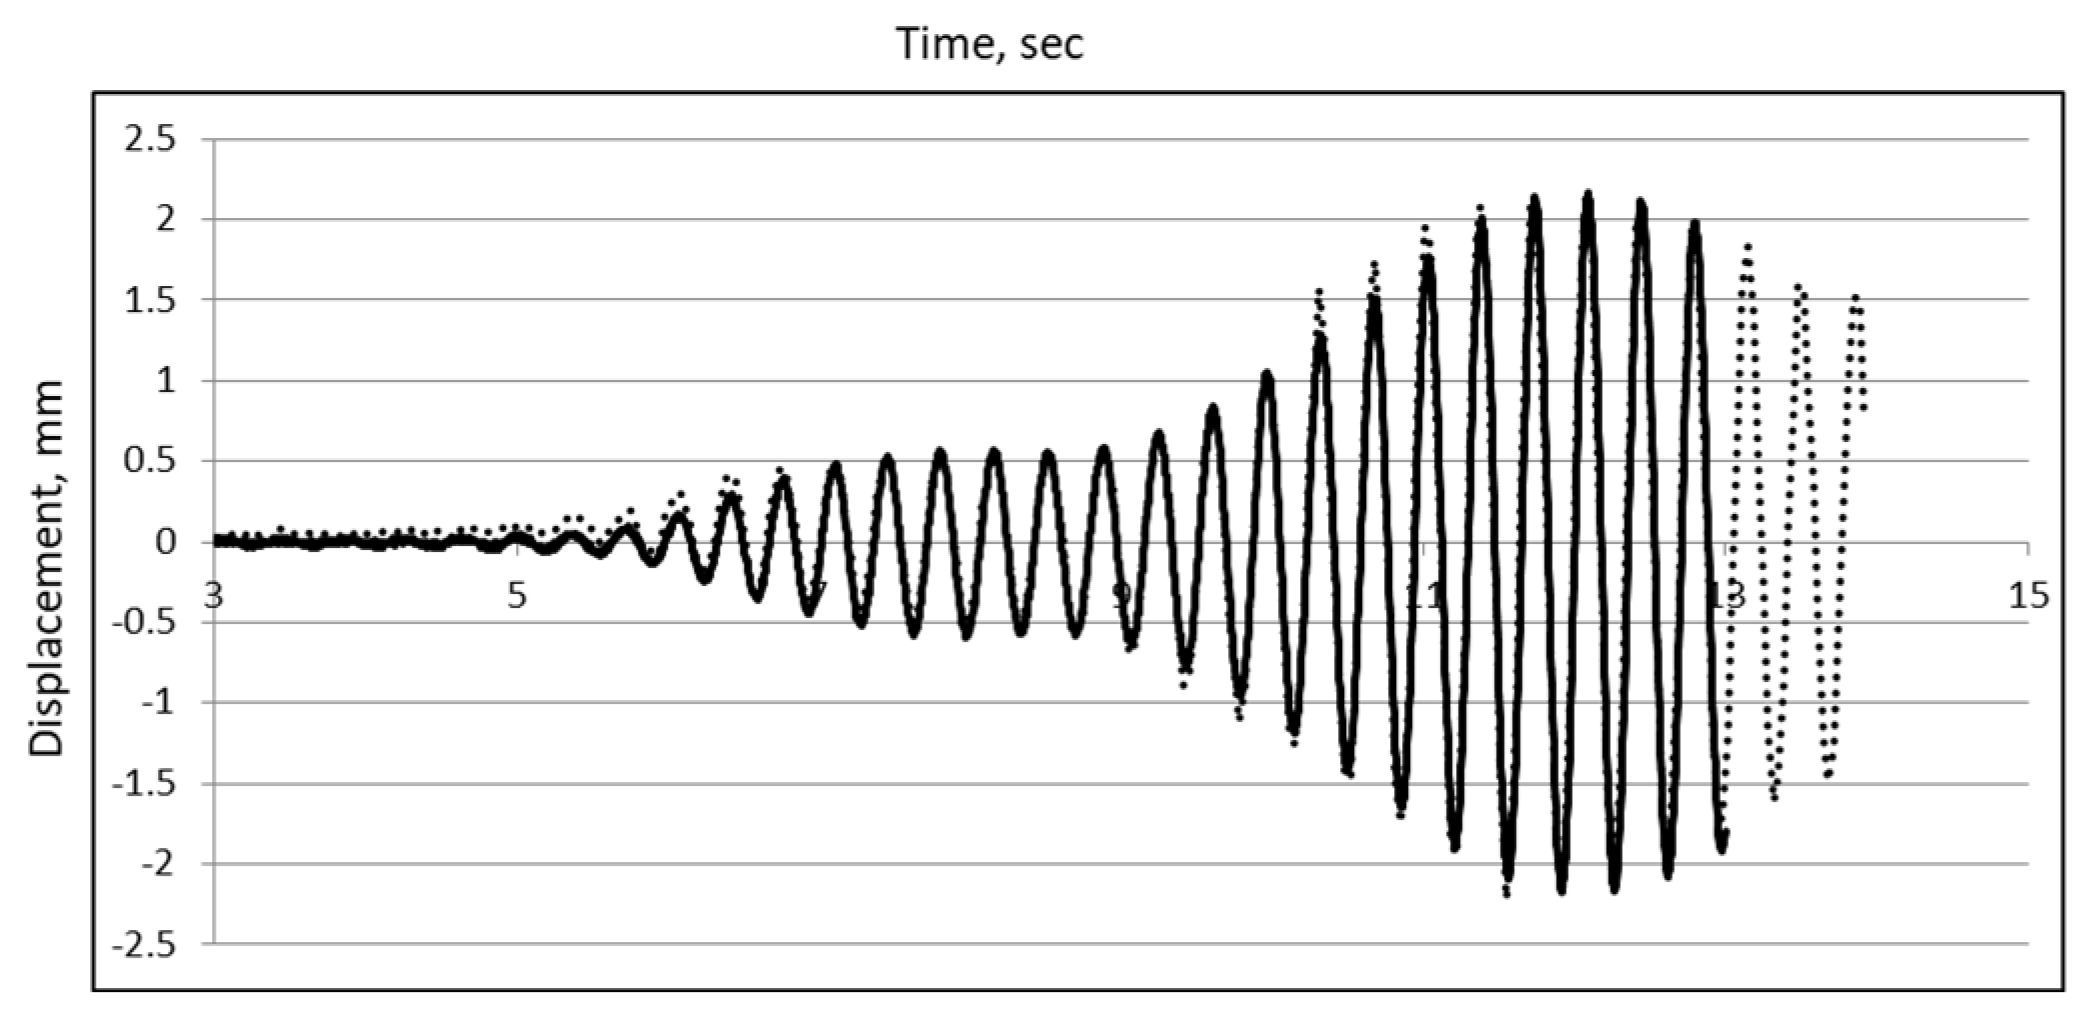
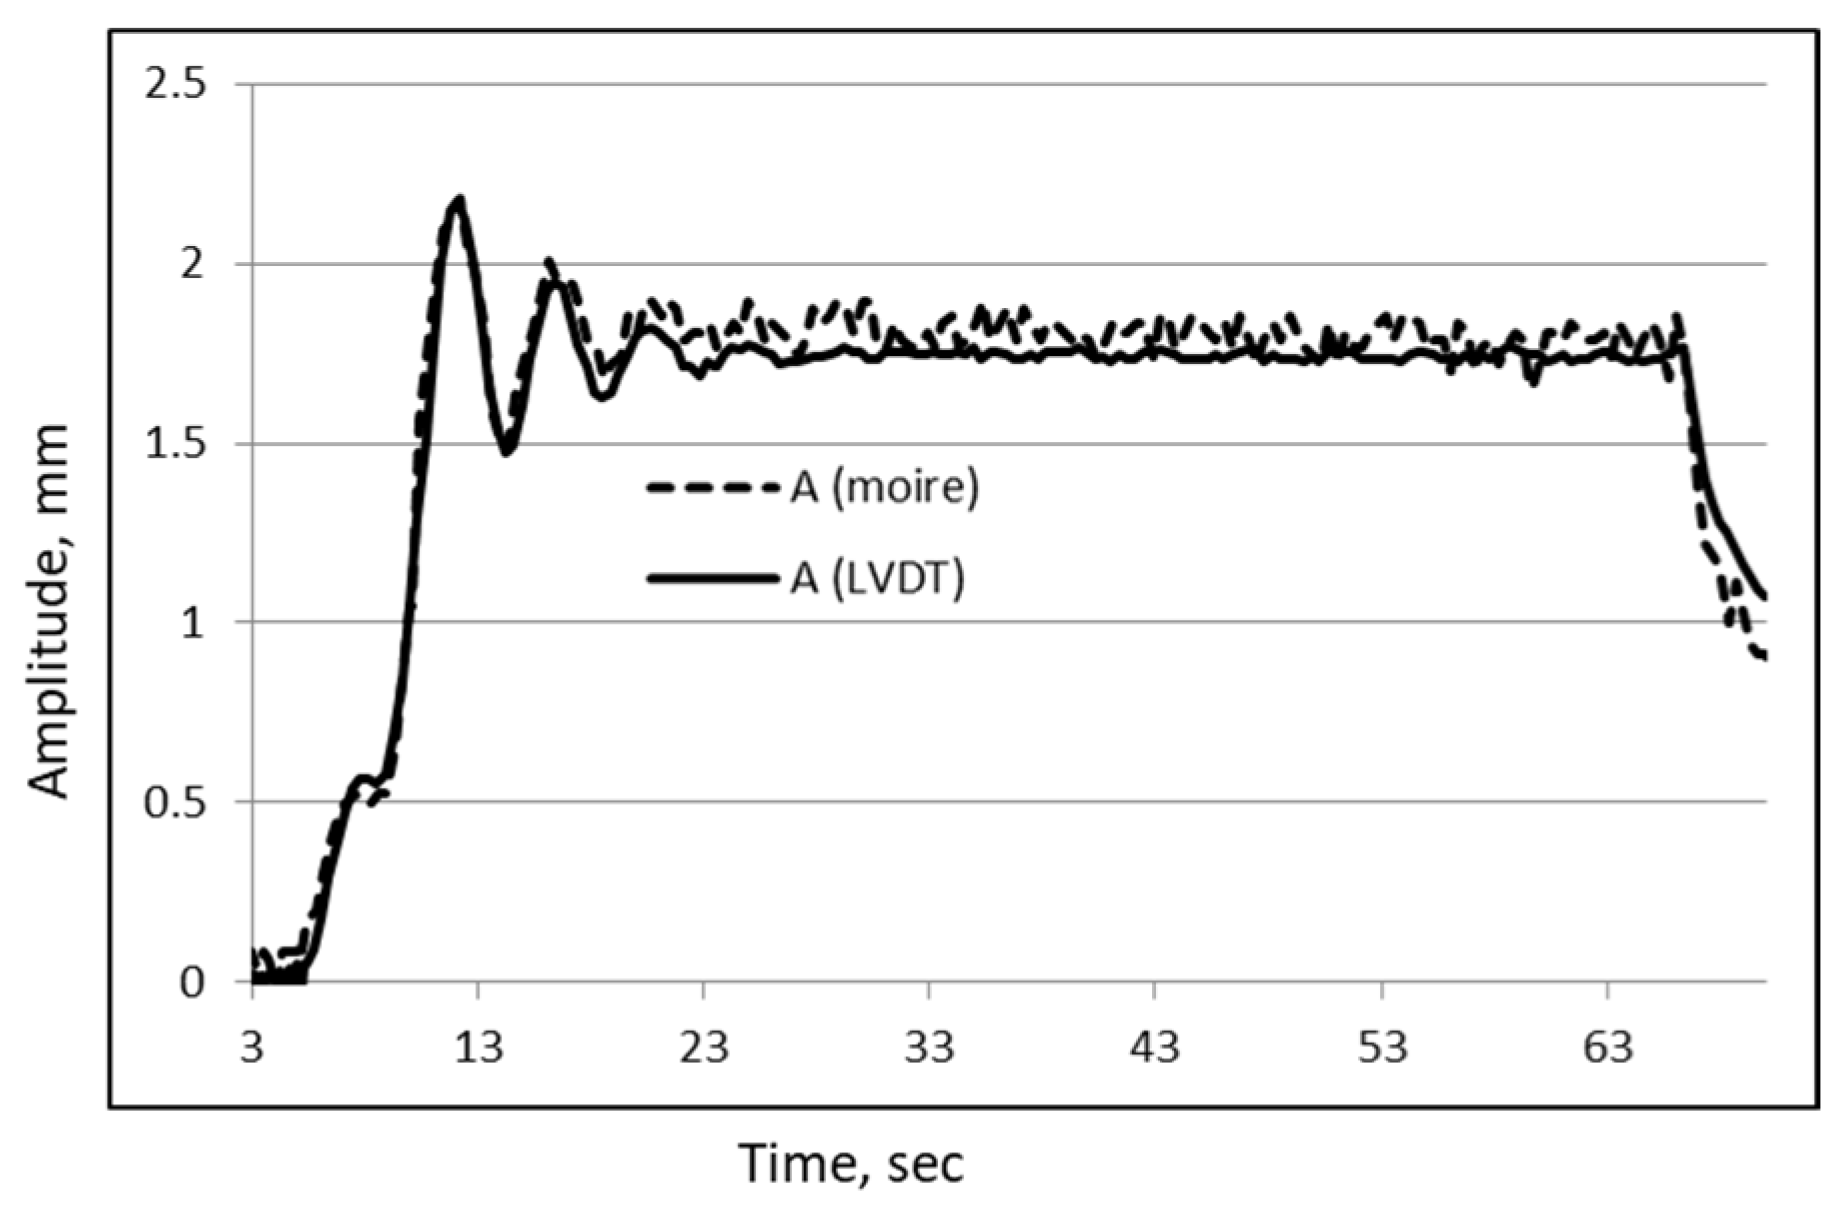
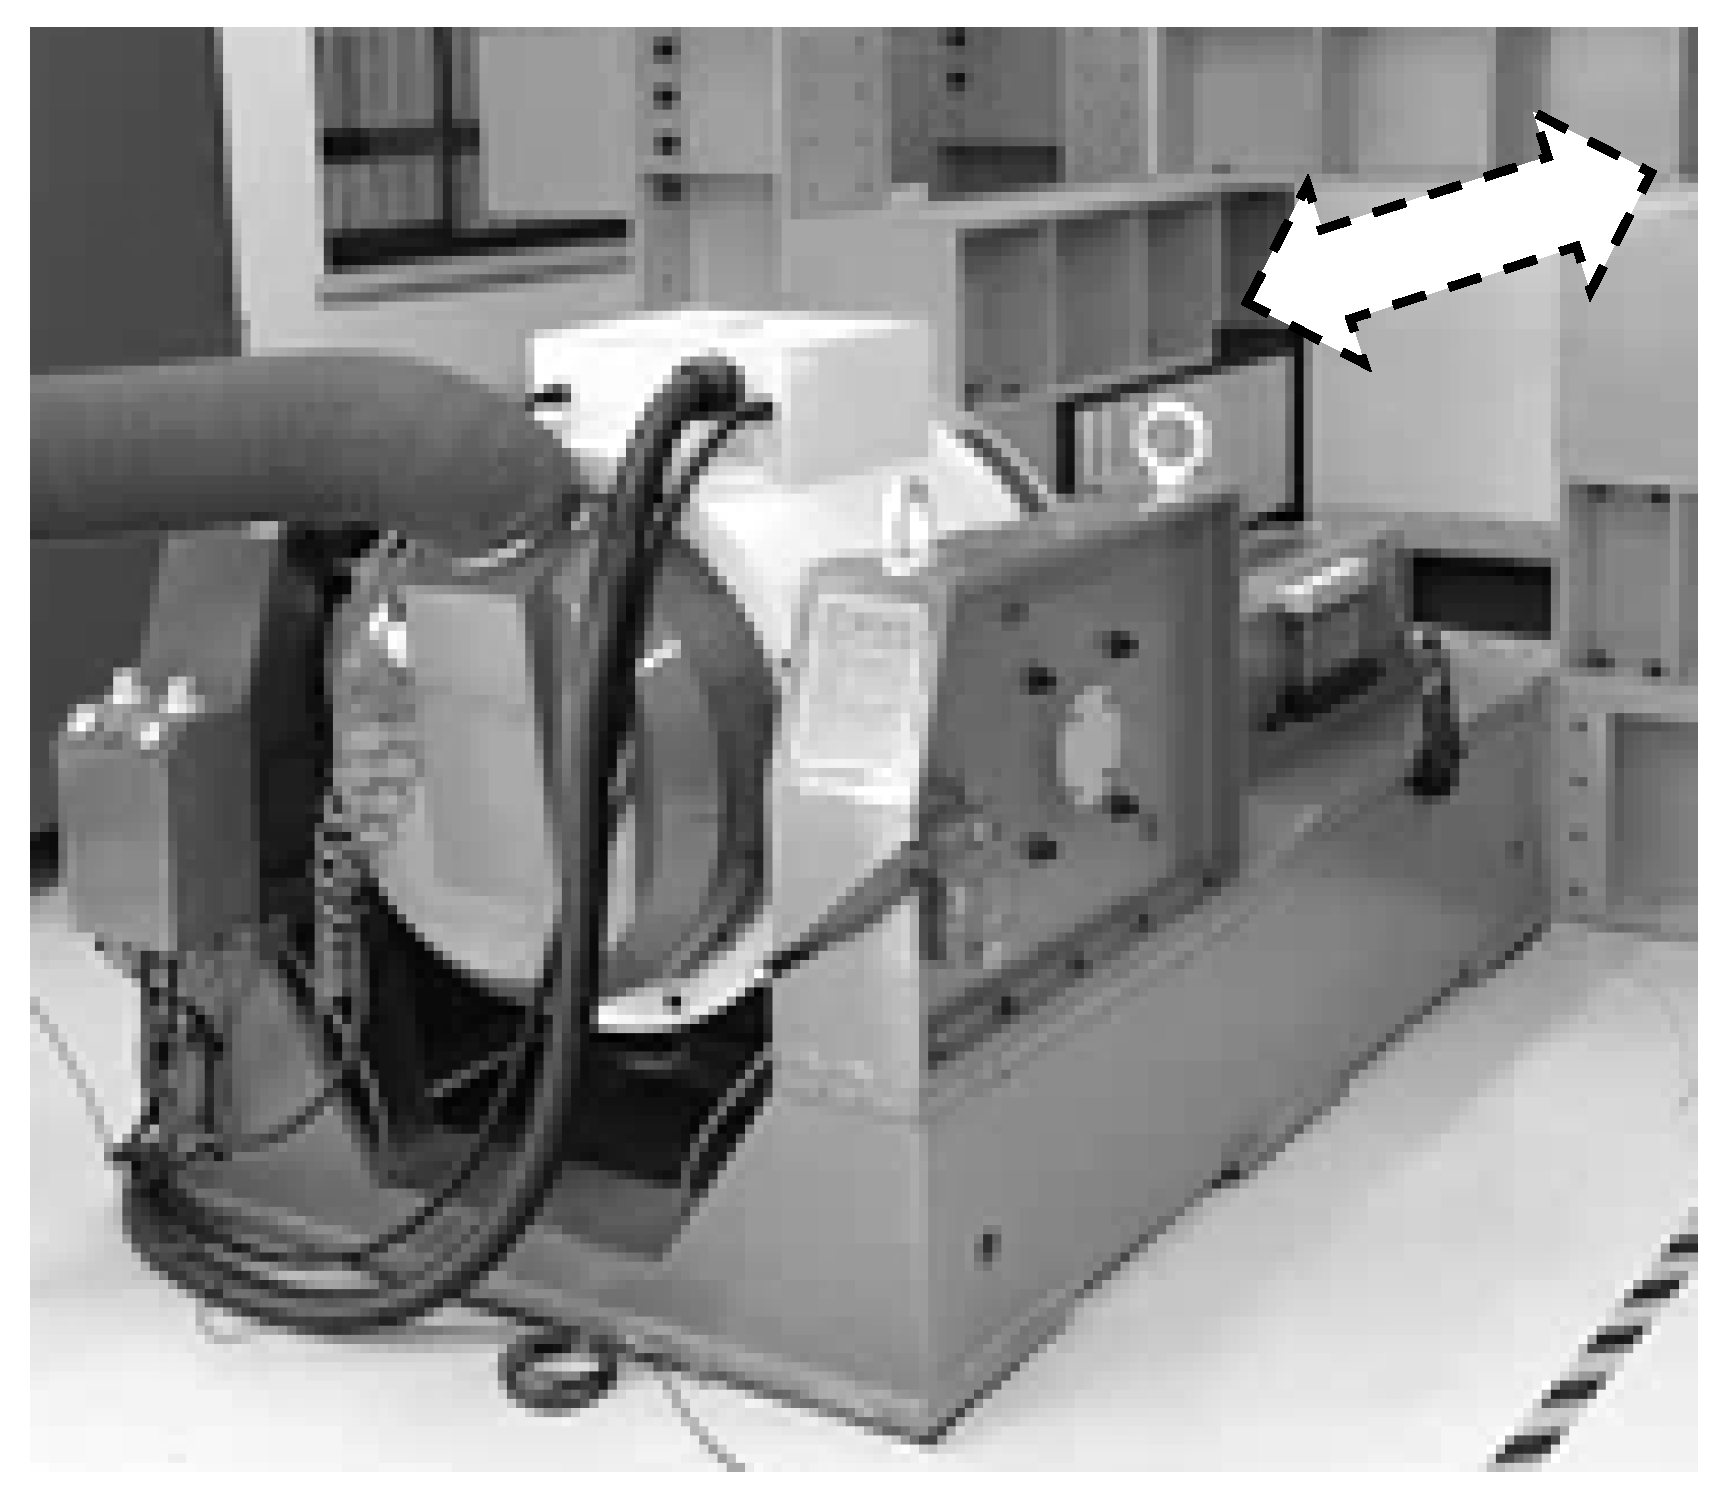
Section 4 presents comparison with other measurement methods using the model bridge equipped with a mechanical sensor and vibration machine featuring an accelerometer. In
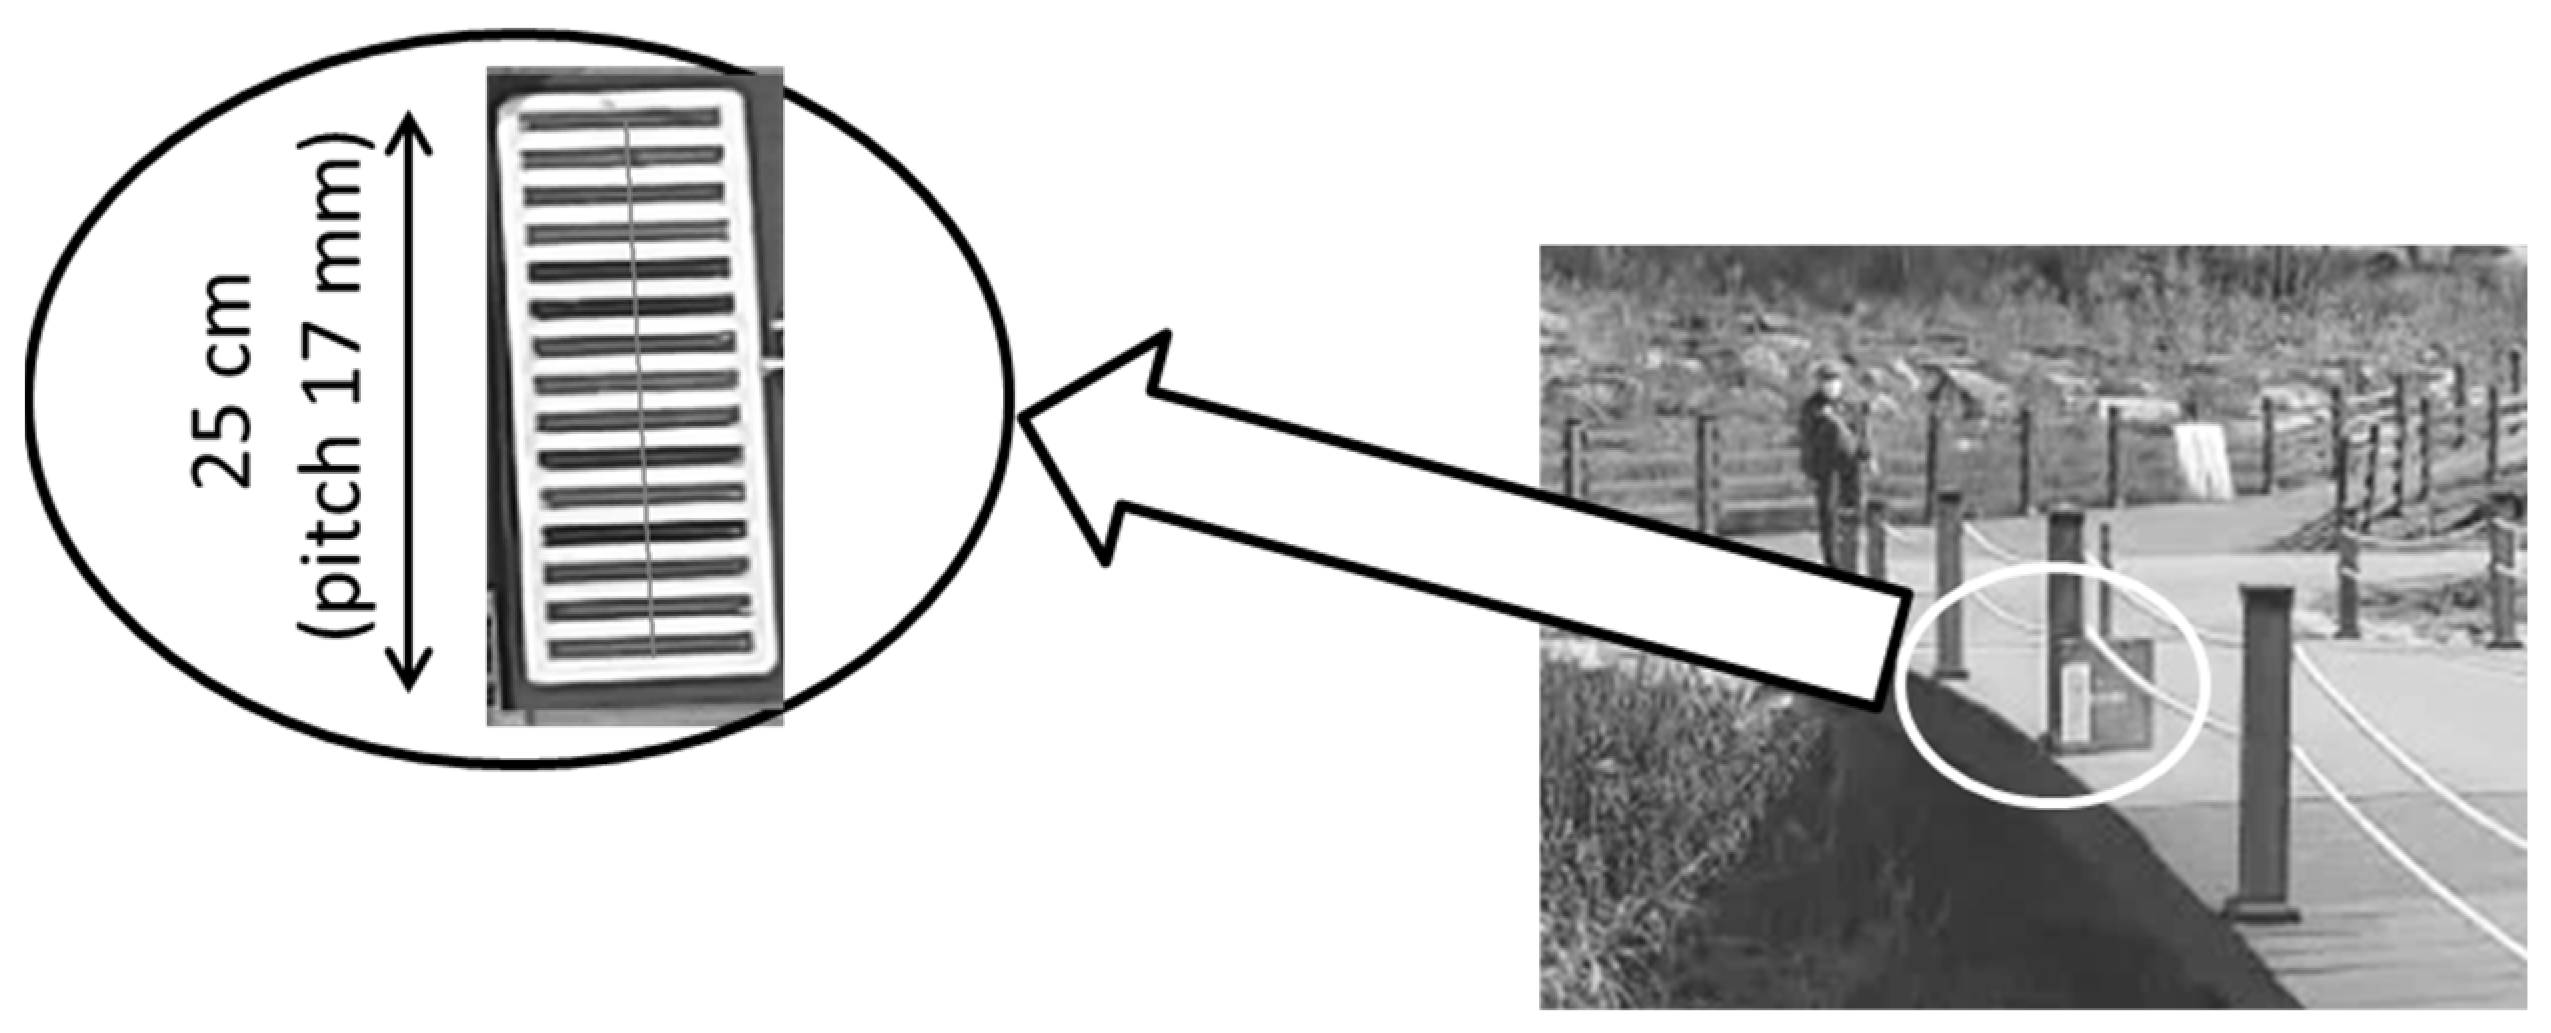
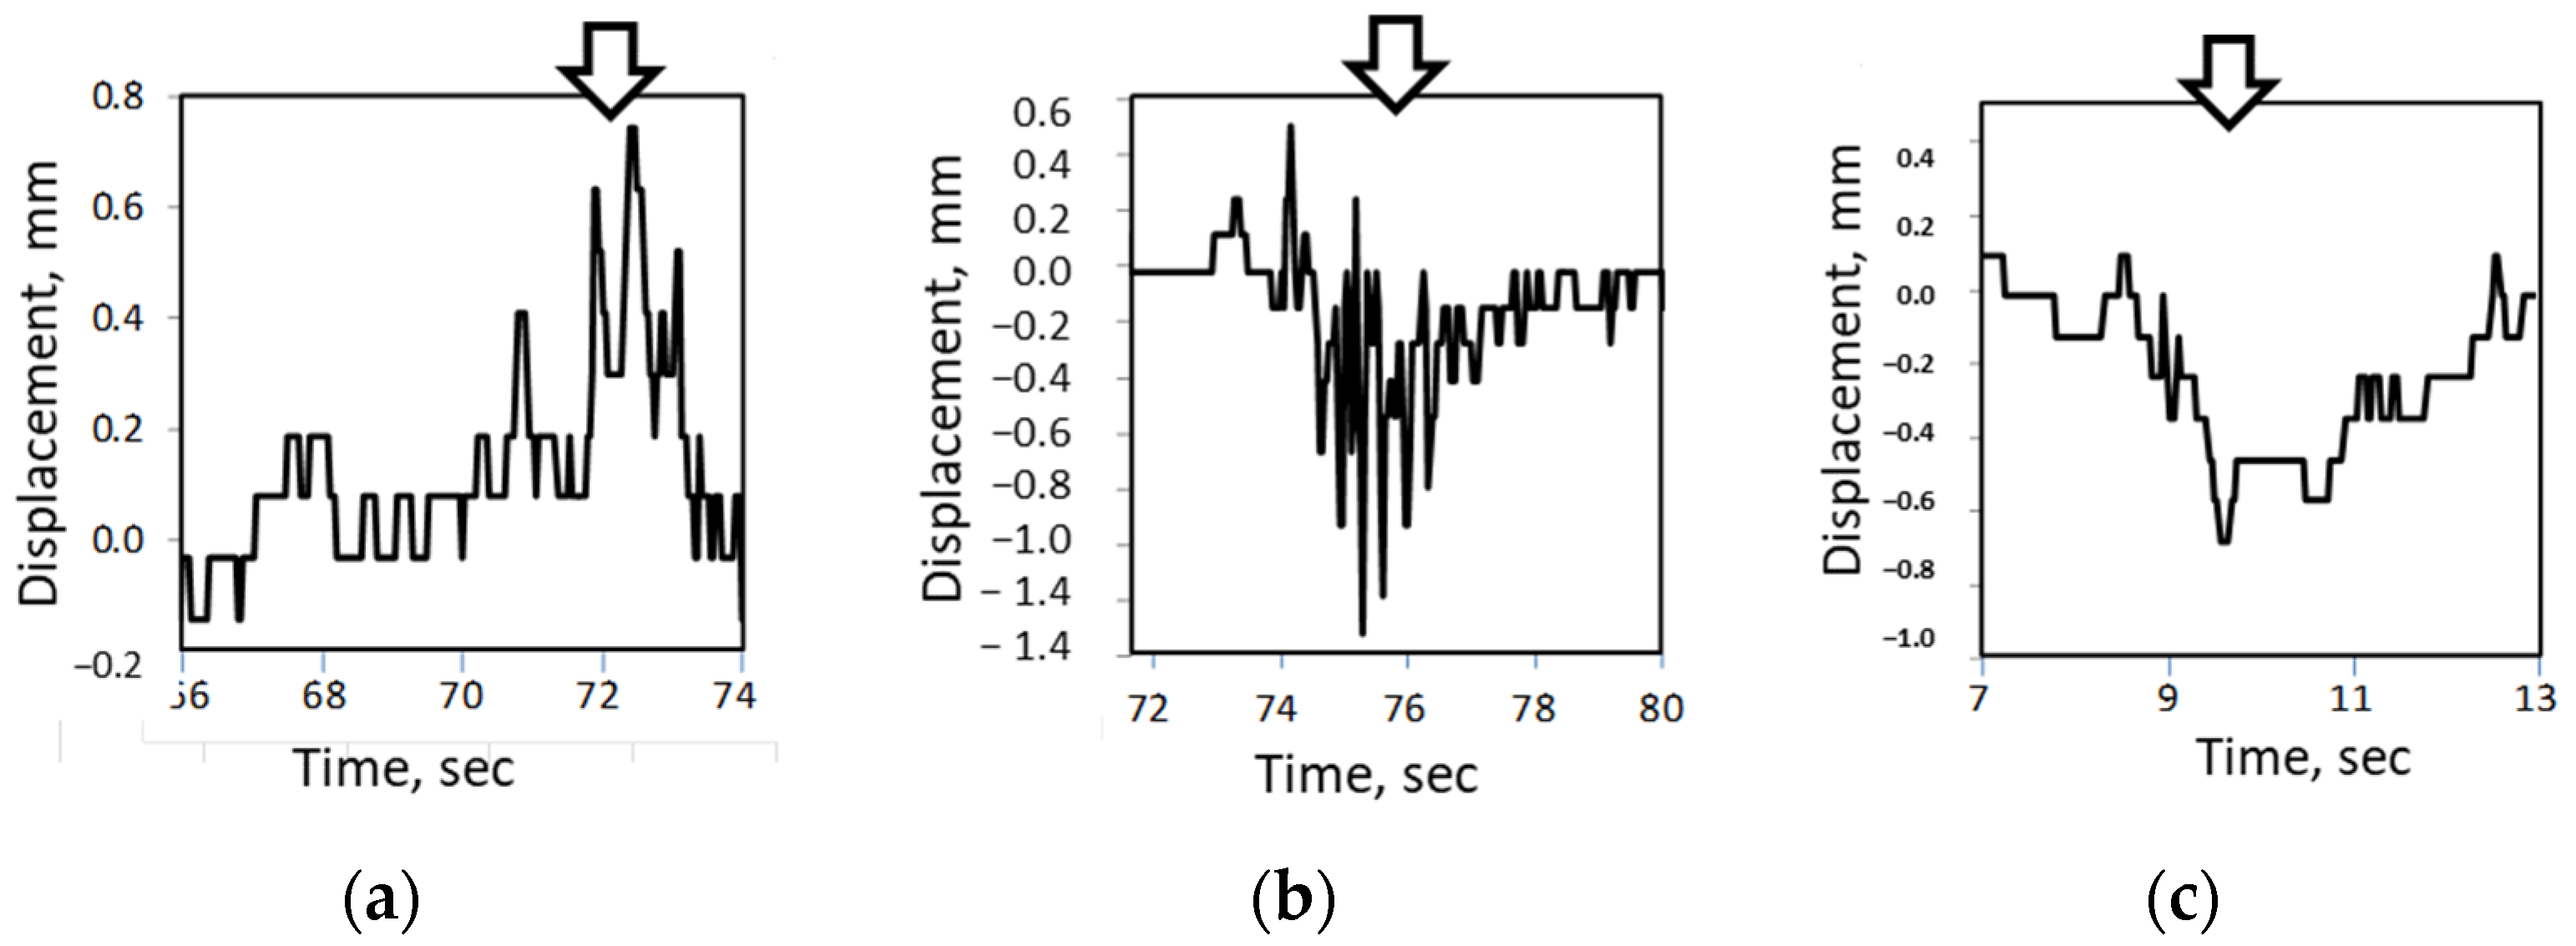
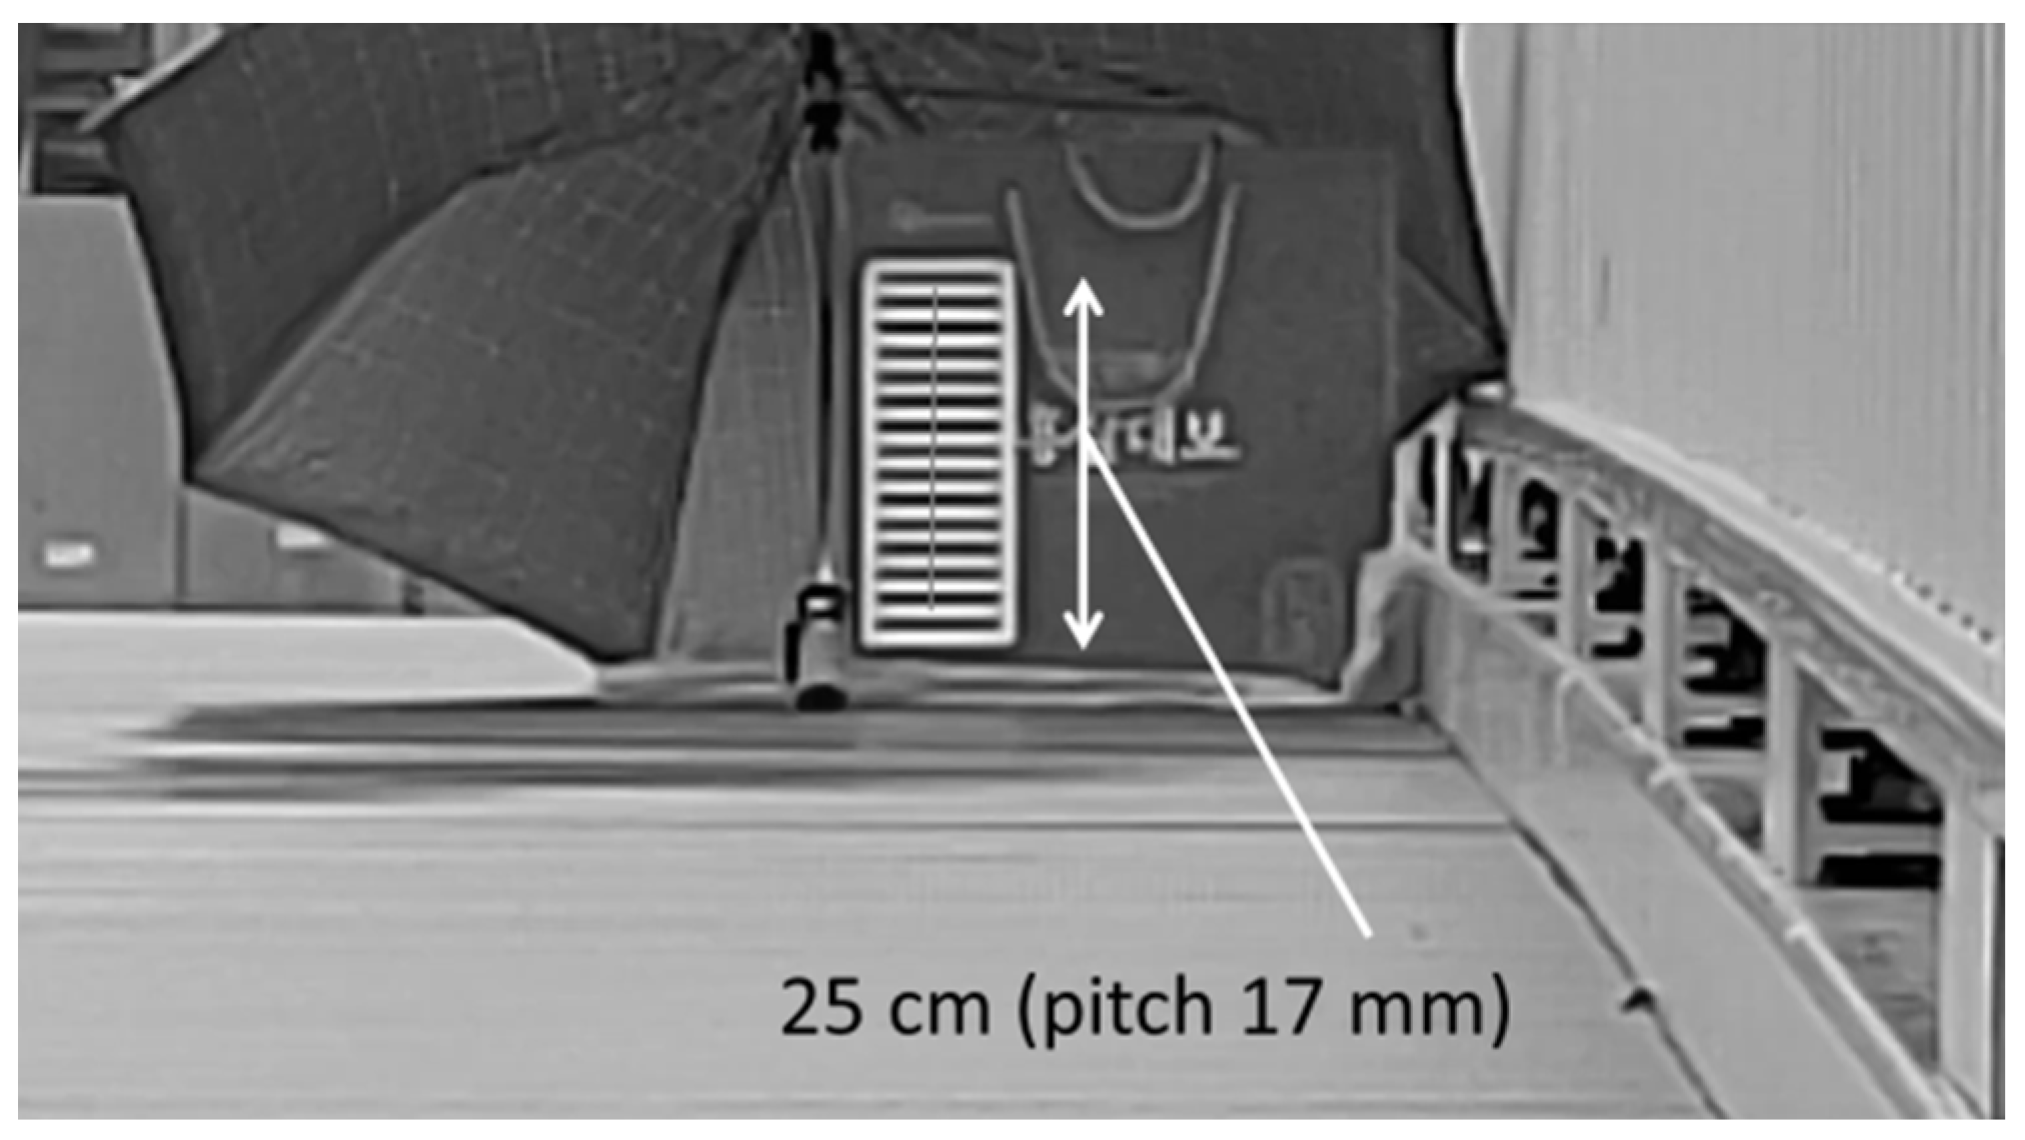
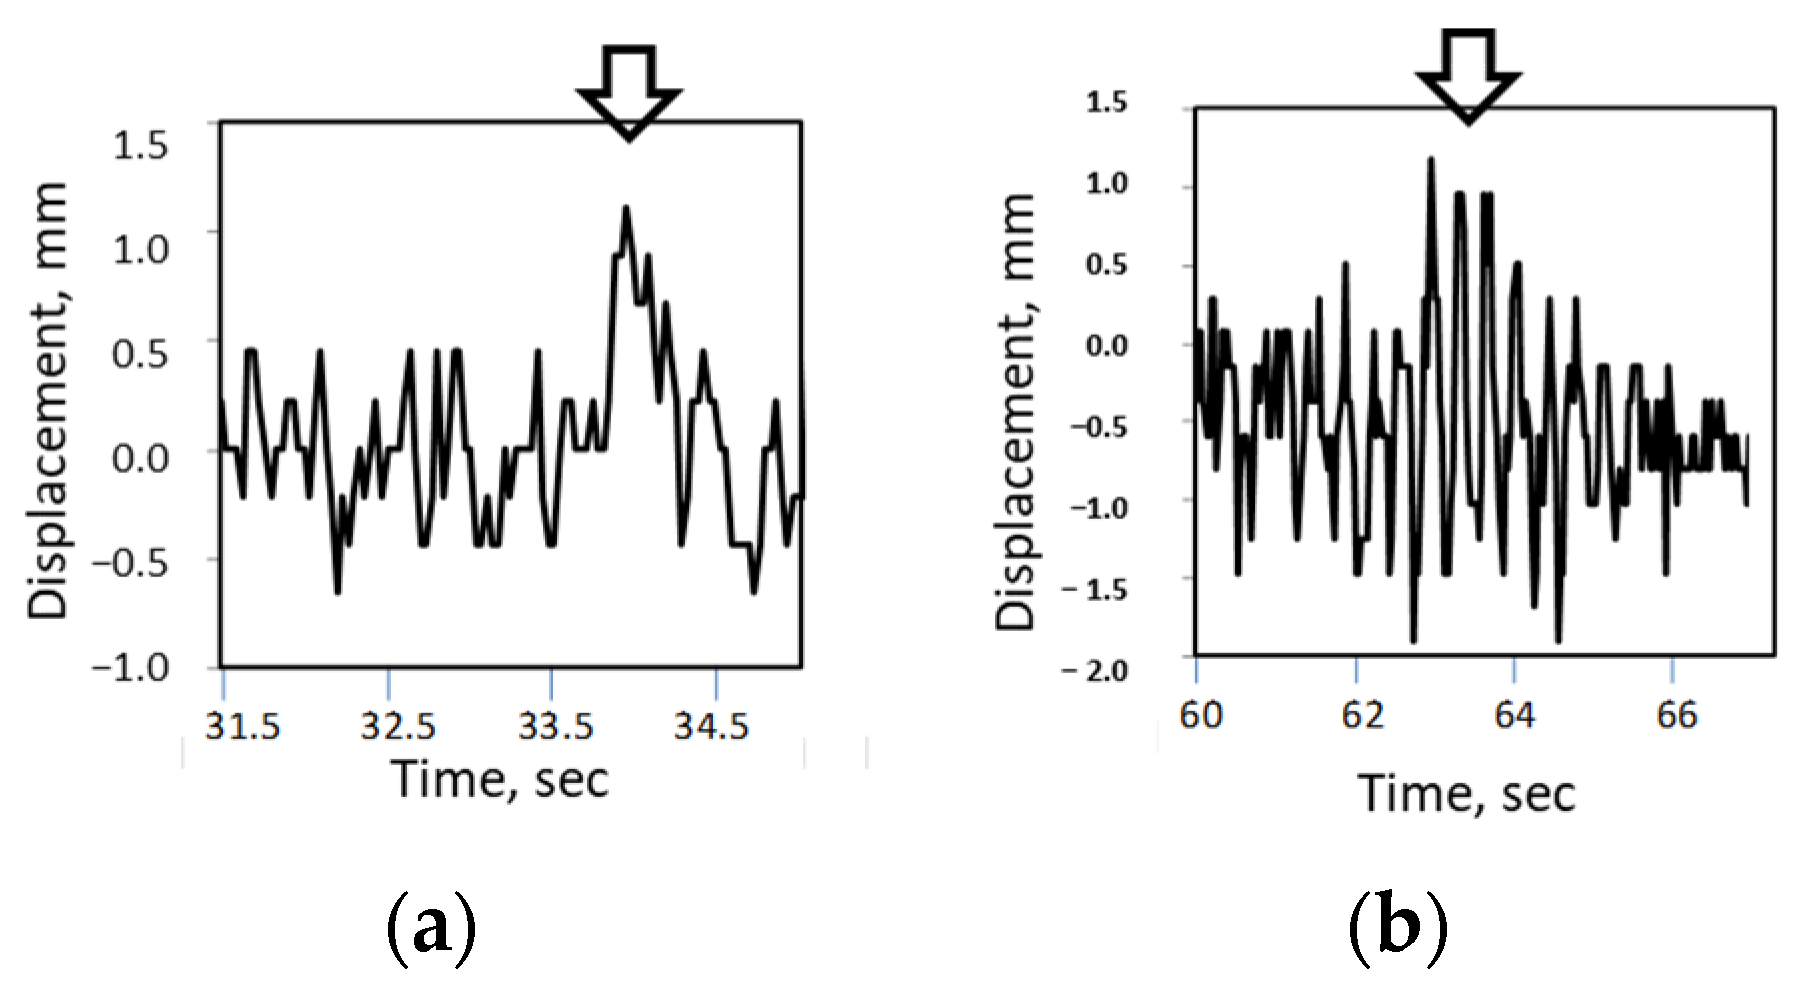
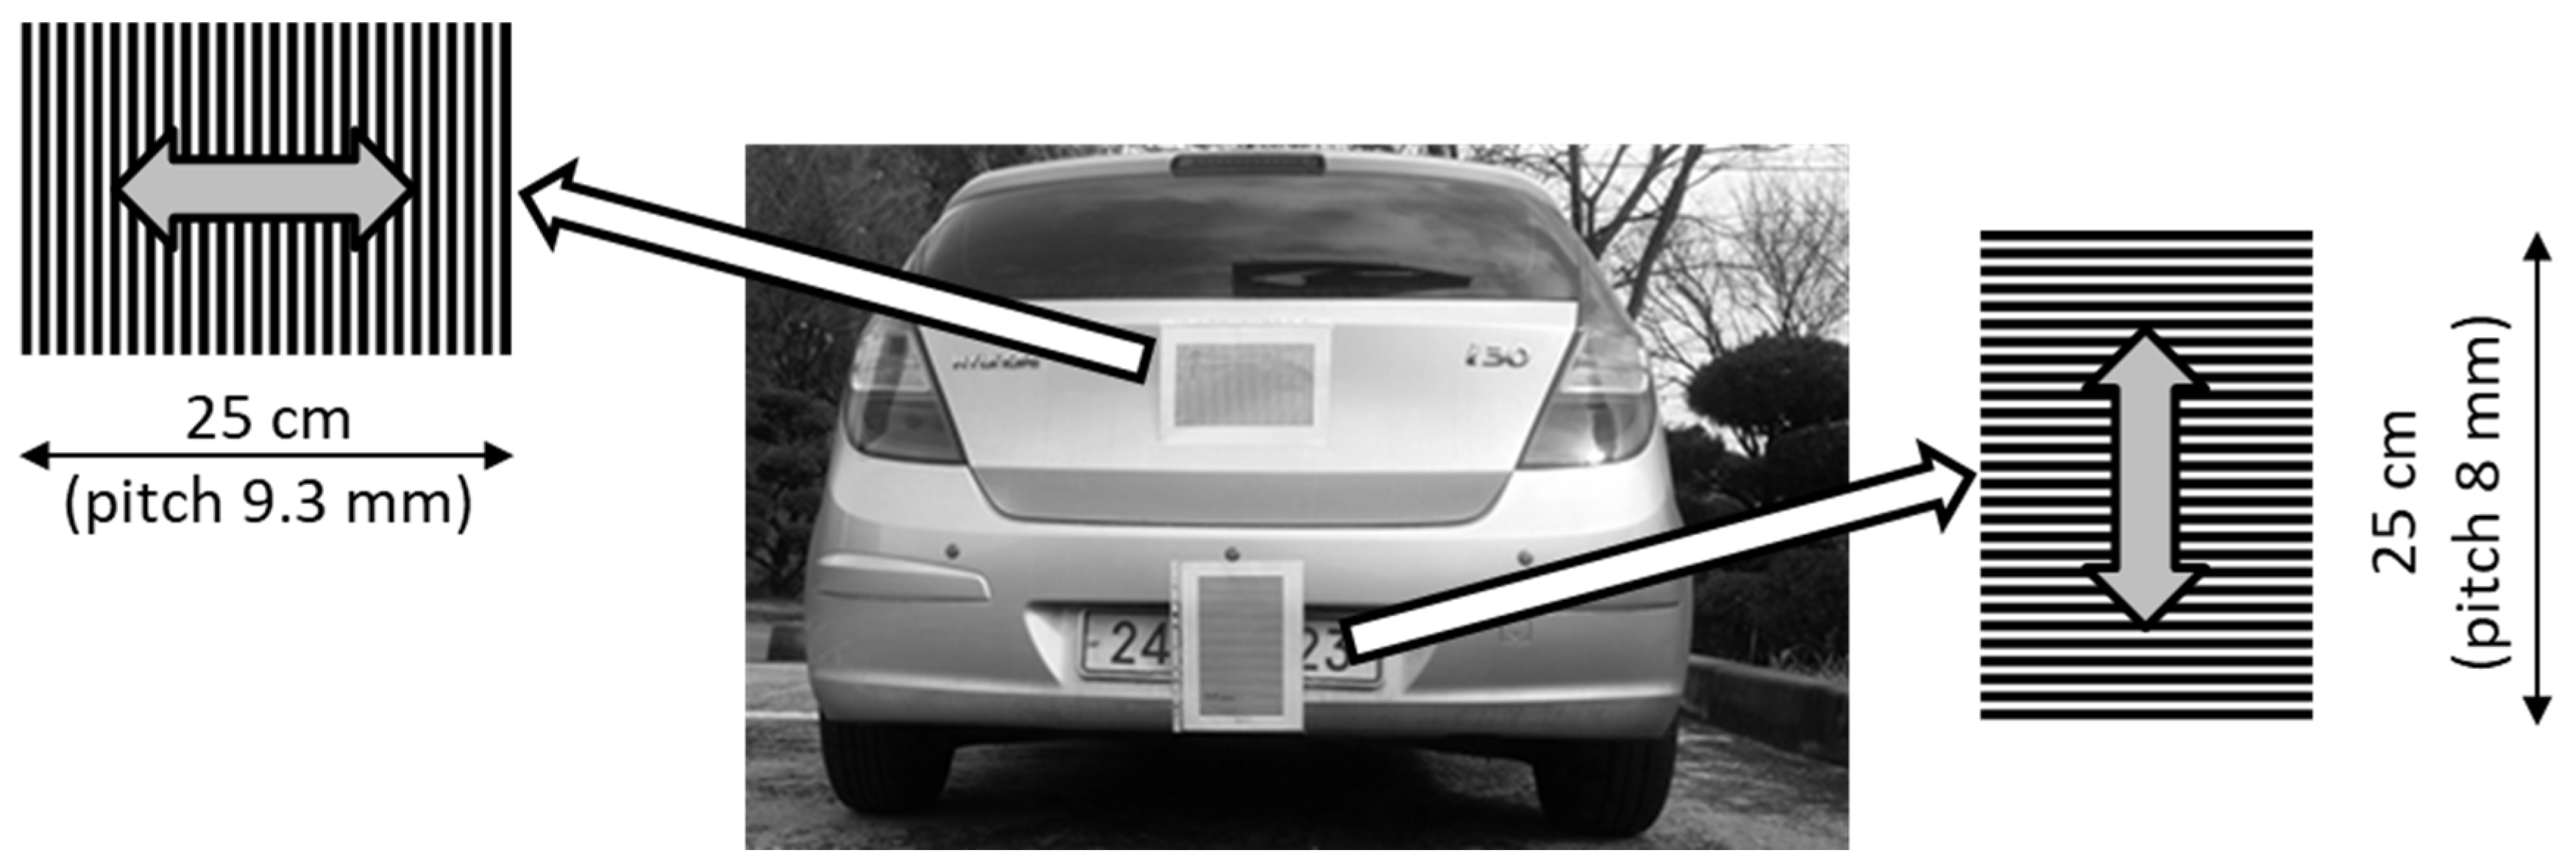
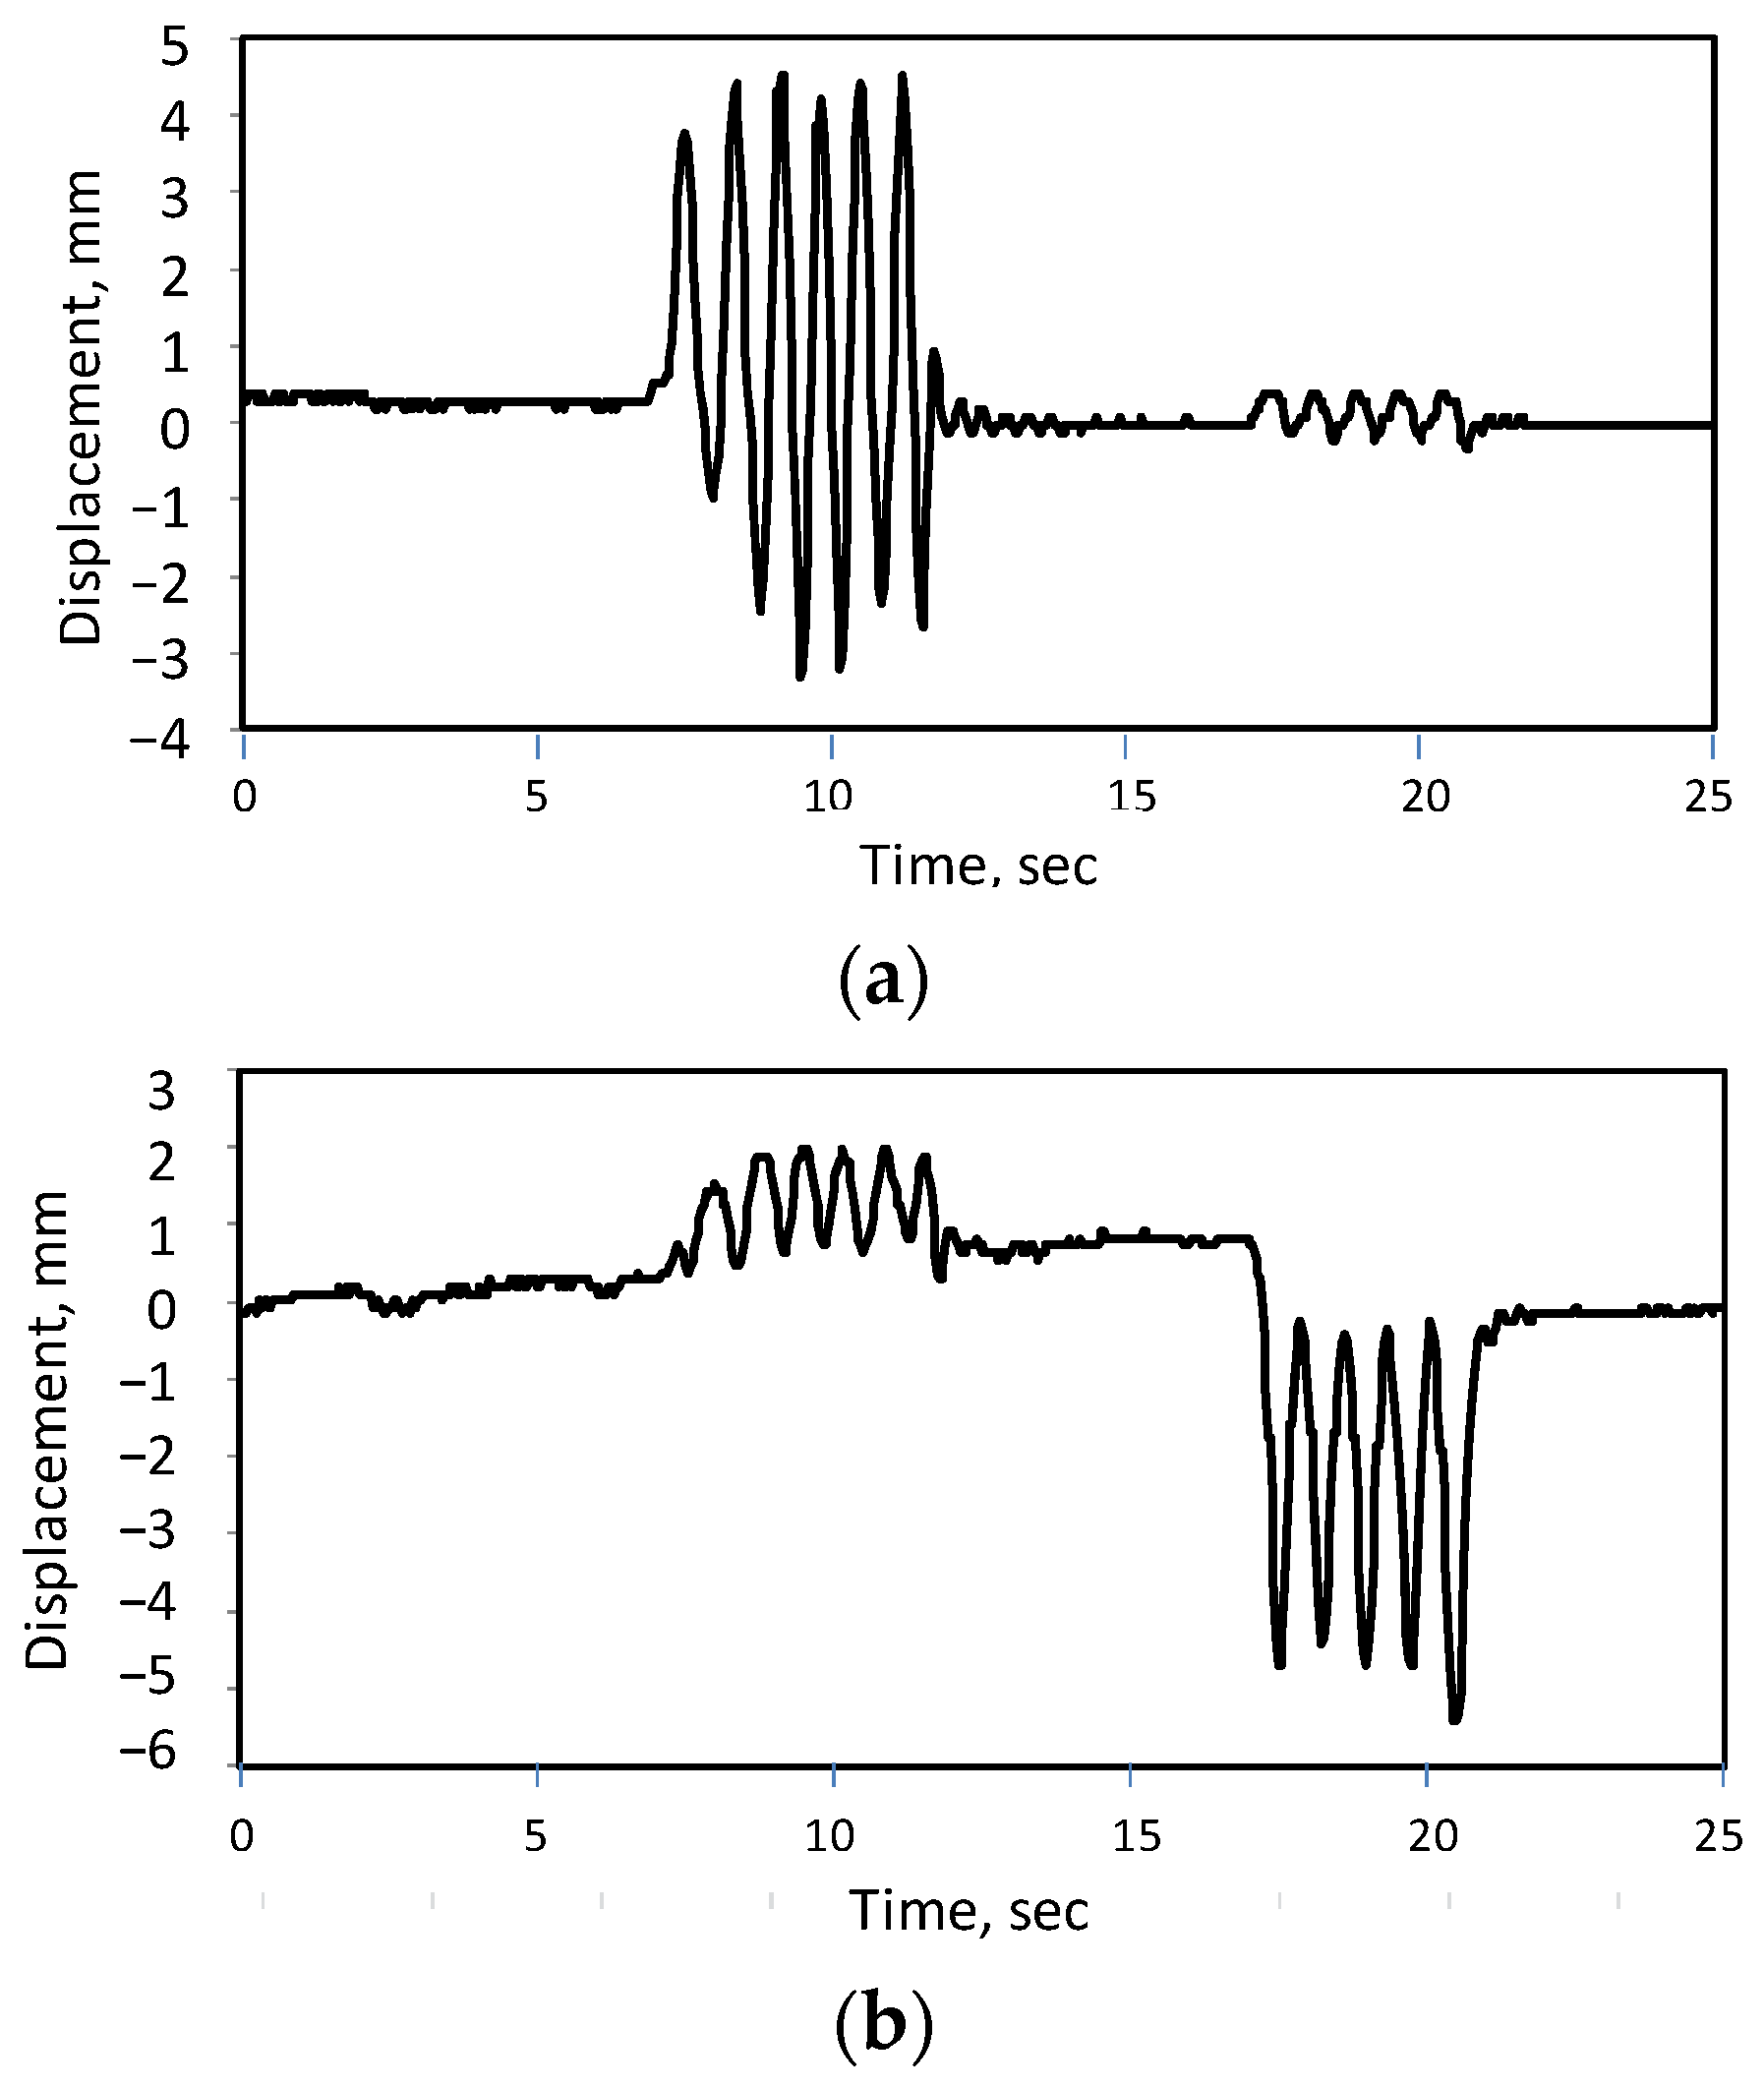
Section 5, practical examples of moiré measurements are given, including the detection of pedestrians, measurements of vehicle vibrations (simultaneously in two directions), and the detection of cracks in parameter space.
Section 6 and
Section 7 contain discussions and conclusions.
2. Materials and Methods
2.1. Moiré Magnification
According to [
1], the spatial period of the moiré patterns
TM in parallel coplanar grids of different periods is
where
T1 and
T2 are spatial periods of the grids.
In many cases,
TM is proportional to
T1, and the use of a relative coefficient seems to be convenient. Thus, instead of the moiré period, we prefer to use the moiré magnification coefficient
μ, defined as a ratio of periods of the patterns and the grid,
Then, the classic formula for the period Equation (1) can be rewritten as
Equation (3) indicates that the ratio of the pitches of grids is the only significant parameter affecting magnification in parallel coplanar layers. (Implicitly, this formula shows that the displacement of the patterns can be measured, even if the displacement of the object in the video is visually unrecognizable (i.e., less than one pixel), because the moiré magnification enlarges the displacement of the patterns and exceeds the size of a pixel).
In a regular periodic grid, its period
T is equal to the size of the grid
L (the length of the overlapping area) divided by the number of grid lines
N,
(The number of intervals between the lines is equal to the number of grid lines minus one).
Similarly, the period of the moiré patterns
TM is
where
NM is the number of the moiré patterns.
Using Equations (1) and (4), Equation (2) can be rewritten as
because the overlapped grids occupy the same length
L.
Equation (6) shows that the moiré magnification coefficient is equal to the number of lines in one grid (an integer number) divided by the difference in the number of lines (another integer). For any integer numbers N1 and N2, their difference could be either 0 (a “practically useless” case which means the infinite magnification, i.e., the infinite period of the moiré patterns, when nothing can be practically measured) or one of integers 1, 2, 3, …, larger or equal than one. The quotient of two integers cannot be larger than the numerator, i.e., the moiré magnification cannot be larger than the number of intervals. Note that we do not directly specify which grid is the first and which is the second; and for estimation, we can put the larger of them into the numerator. Thus, the maximum of the two numbers N1 and N2, determines the maximum moiré magnification.
Equation (6) can be rewritten in the equivalent form
According to Equation (7), the displacement of the grid increases by times. The ratio of larger integers can be close to one. When N1 and N2 are close to each other, the magnification coefficient becomes high, especially considering the number of lines in the reference grid is chosen by us. As a result, the more lines that are in a grid, the greater moiré magnification we can achieve. Although we can make measurements with various numbers of lines, the grid with the largest line count provides the most significant moiré magnification.
The moiré patterns are formed within the common area of the length
L; then, from Equation (2),
Combining Equations (6) and (8), we obtain
According to Equation (9), the number of moiré patterns is equal to the absolute difference in the number of lines. If the number of lines is close to each other, there will be few moiré fringes. For example, if N1 = 40 and N2 = 44, there are four moiré stripes, and according to Equation (6), the magnification coefficient μ is 10.
Detecting small signal changes (in our case, displacements) is crucial for measurements. The sensitivity threshold is defined as the minimum value of the input signal that causes a noticeable change in the output signal. The sensitivity is defined as the ratio of the specified output signal to the sensitivity threshold.
To characterize sensitivity using a digital camera, we distinguish between two types of measurements. A direct measurement measures the displacement of an object from photographs by directly counting the pixels that represent the object’s position. In contrast, a measurement based on moiré effect and utilizing the magnification is referred to as a moiré measurement.
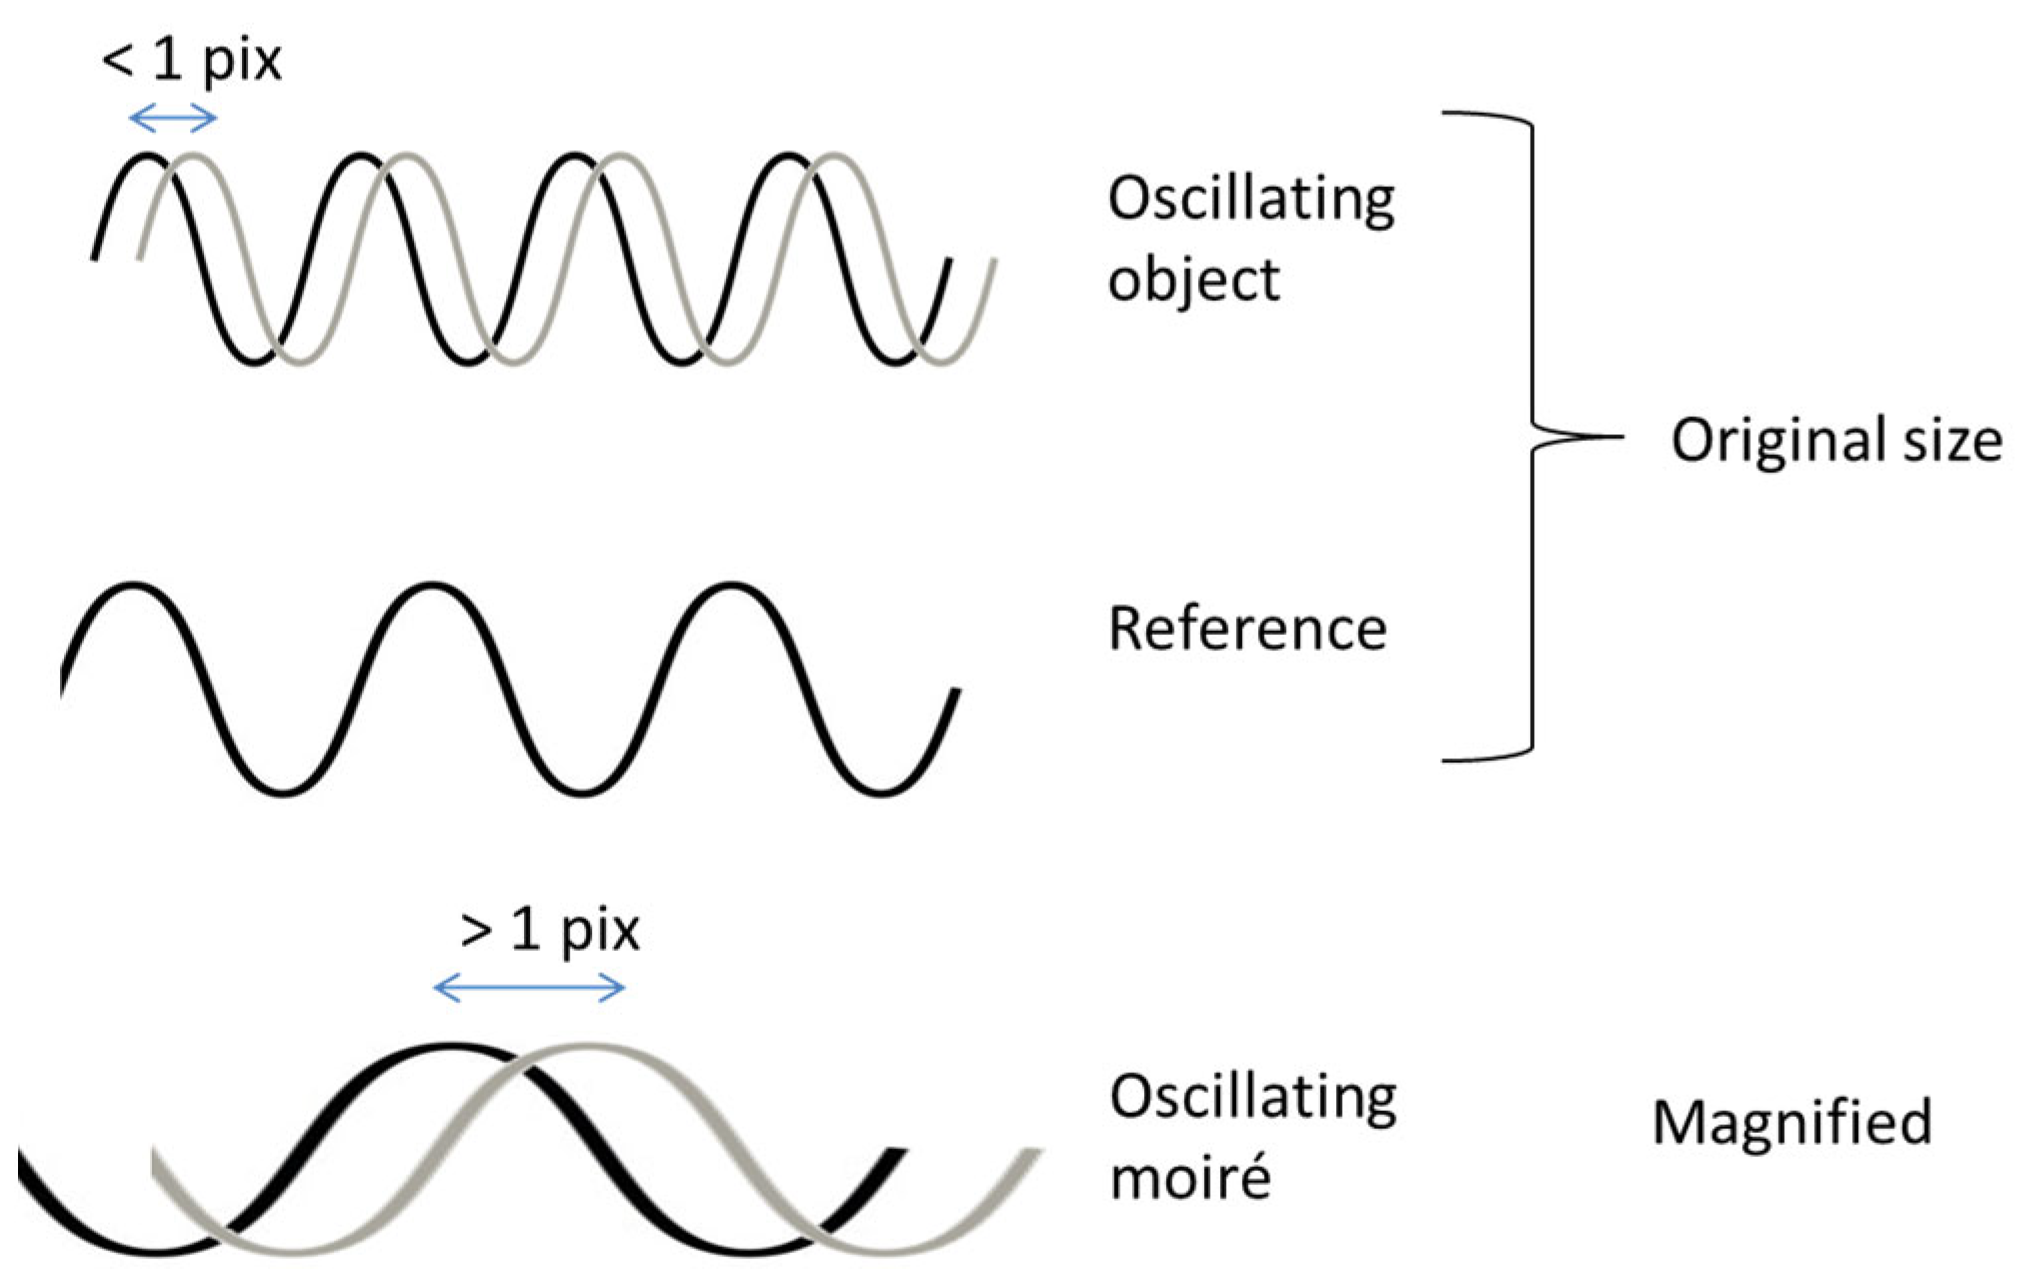
The moiré magnification enhances the sensitivity of moiré measurements by allowing a slight displacement of the object to produce a significant displacement of the moiré patterns. However, the physical effect itself is independent of the specific resolution capacity of the human eye or the camera. It simply exists. So even if we cannot recognize the sub-pixel movement of grid lines, we can potentially see the moiré patterns and their movement. This potentially provides a sensitivity of less than one pixel in the imageб which may not be directly detected. The moiré sensitivity is illustrated in
Figure 2.
Therefore, a visually undetectable sub-pixel displacement can be measured using the moiré effect.
2.2. Geometric Estimation of Sensitivity
The resolution capacity of the camera limits the sensitivity; in particular, the sensitivity threshold of the direct measurement cannot be smaller than the elementary unit of a digital image (pixel).
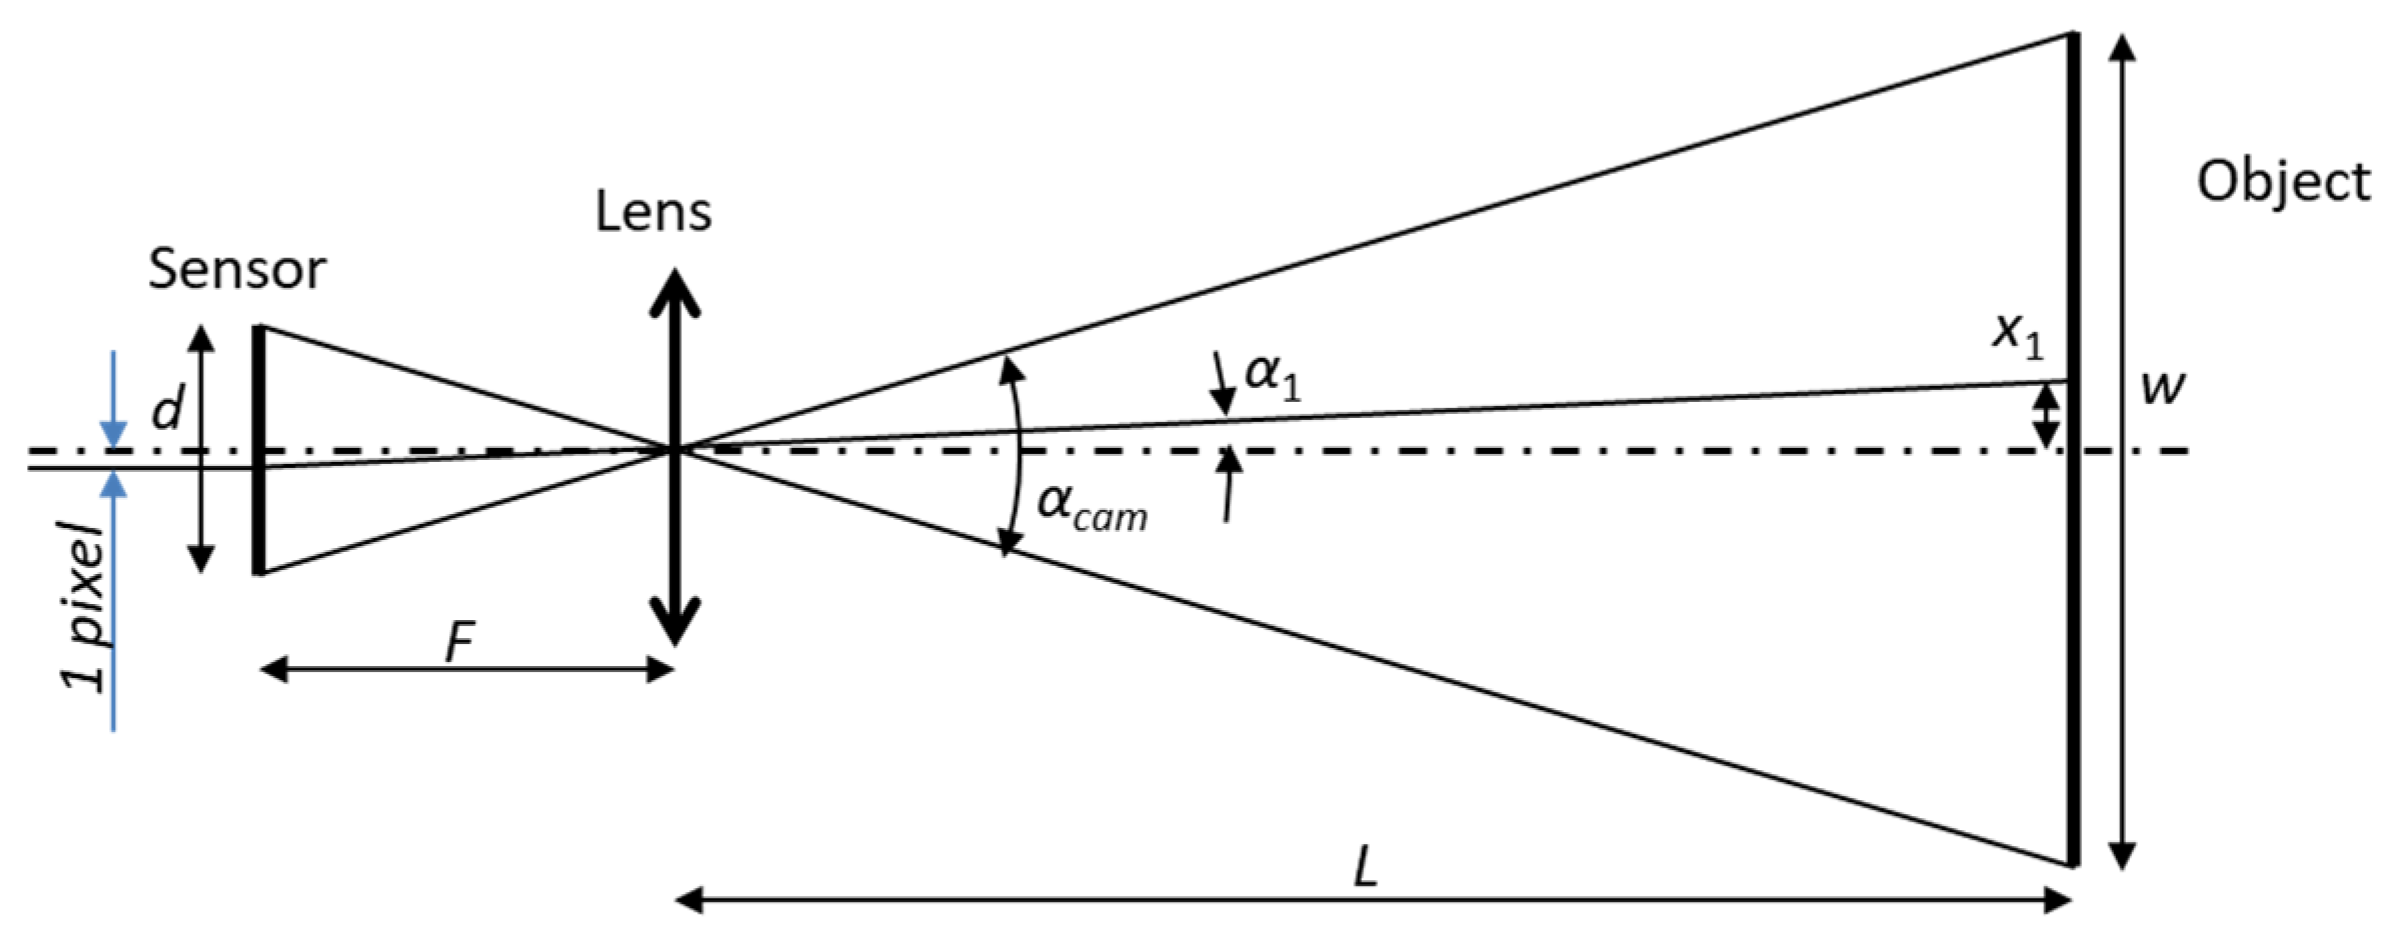
The minimal displacement detectable in a camera is illustrated in
Figure 3 for a large
L. The thin lens formula relates the values of
F and
L; however, when
L is much longer than
F, the distance from the lens to the sensor is approximately equal to
F. Consider geometric relations for this case.
A digital image sensor consists of multiple light-sensing units (pixels). If
N is the number of pixels along one dimension, the size of one pixel is equal to the sensor size in that dimension divided by
N. Based on the geometry, we may consider that the pixels of the sensor are projected onto the object. Let us estimate the sensitivity threshold of the direct measurements. The angle of view of the camera
αcam (see
Figure 3) is defined as:
where
d is the size of the image sensor, and
F is the focal length of the camera, as shown on the left side of
Figure 3.
From Equation (10) (for any lens except for a wide-angle fisheye lens), we approximately have
or
where the object size w and the object distance
L are shown on the right side of
Figure 3.
One pixel of the image sensor is visible at the angle
α1 (shown on the left side of
Figure 3 and projected onto the right side). The angle
α1 is equal to the angle of view divided by the number of pixels,
Recalling Equation (12), we have
Then, the size of one pixel geometrically projected onto the object (grid), i.e., the sensitivity threshold of the direct measurements is
The sensitivity of the moiré measurements is enhanced because of the moiré magnification. Thus, the sensitivity threshold of the moiré measurements is
When using a zoom lens (for both direct and moiré measurements), the sensitivity threshold is still determined by Equations (15) and (16), as the number of pixels in the grid image changes according to the zoom factor.
2.3. Principle of Measurements
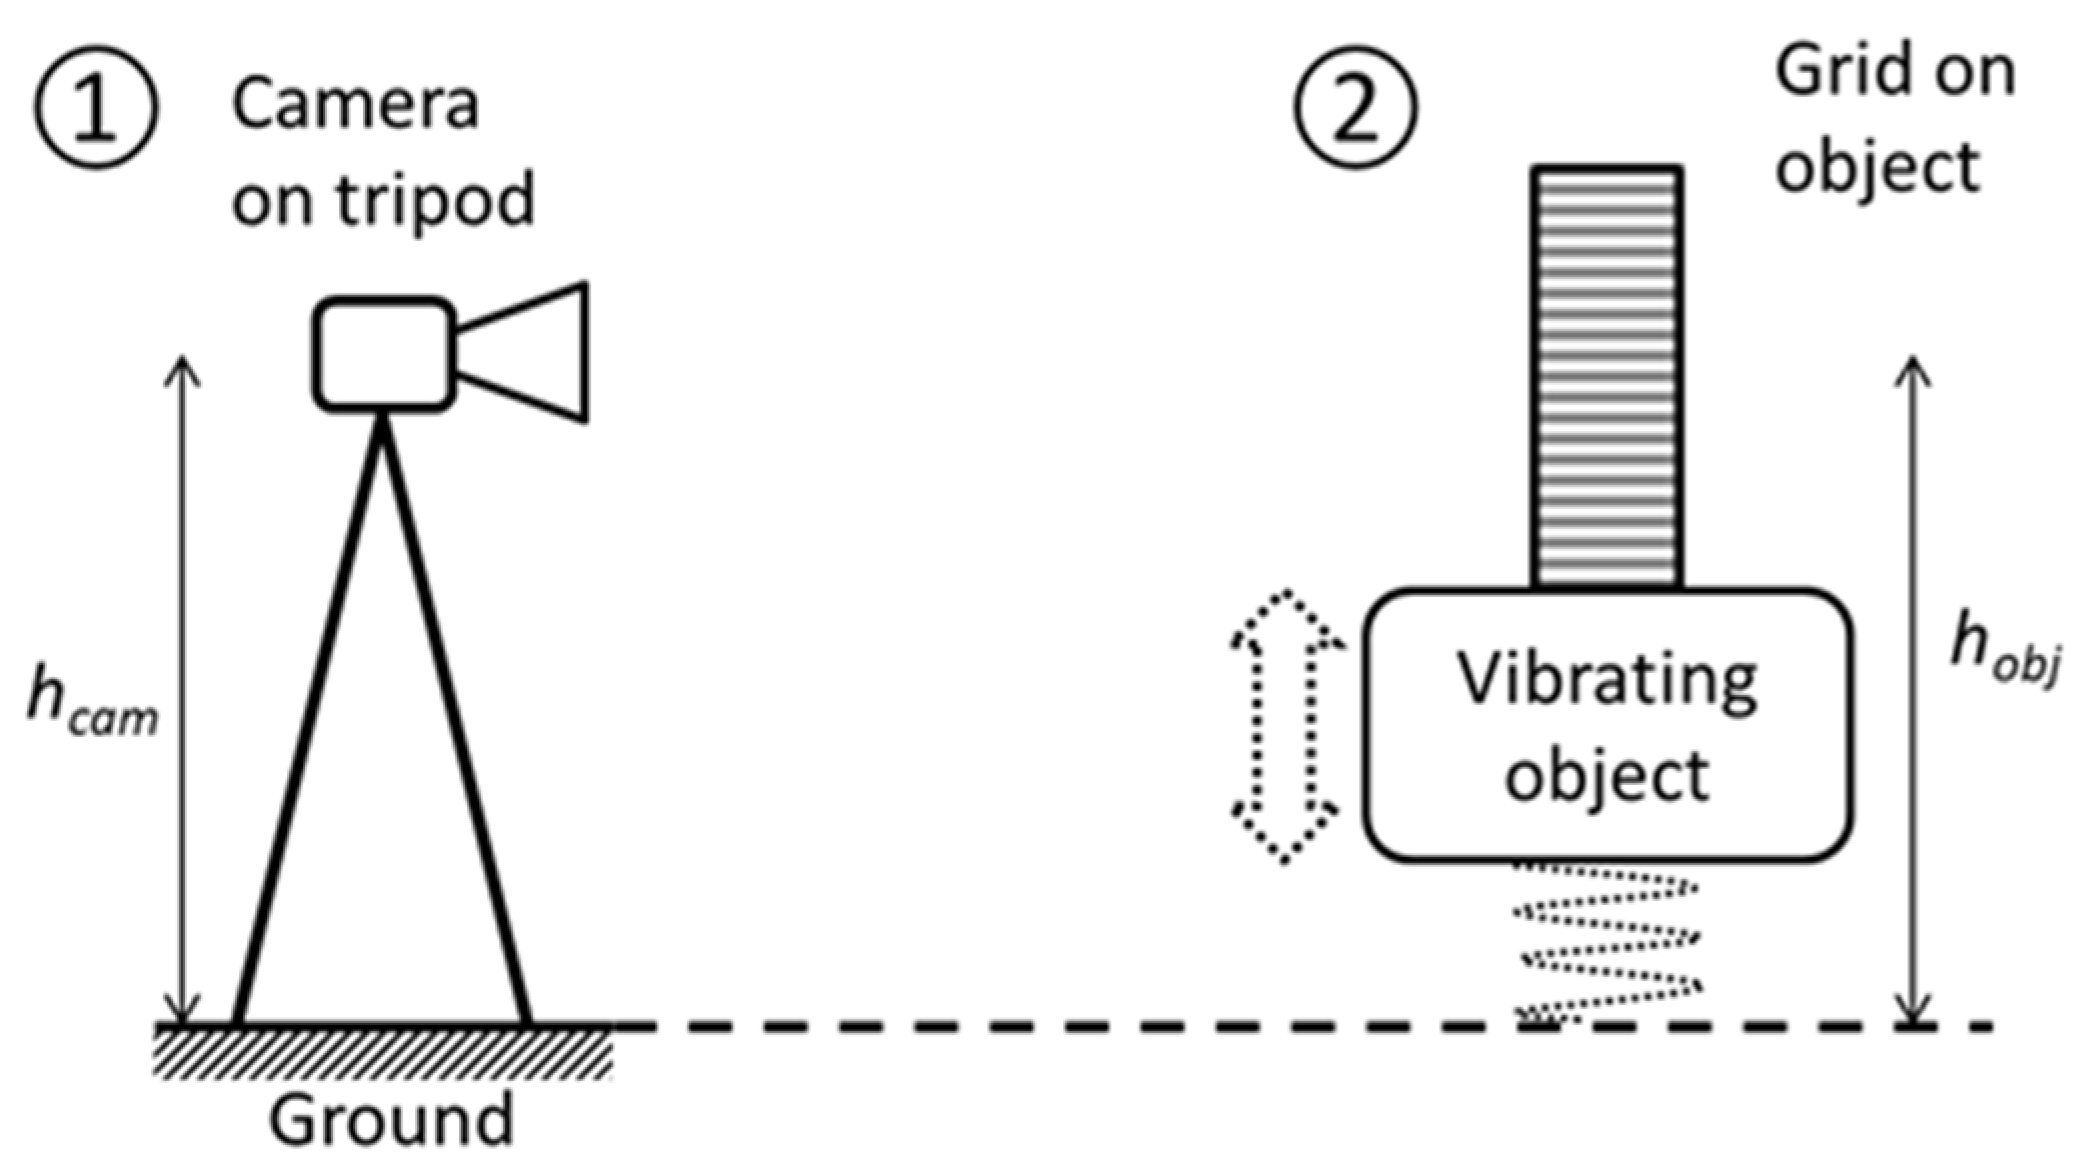
In the measurement system, a grid was attached to an object whose displacement (oscillation) was measured. The computer generates another grid. (Our method is not moiré sampling, where the second grid is the grid of camera pixels.) Thus, there are two functional blocks in the measurement system: block ① on solid ground and block ② on the vibrating object, as shown in
Figure 4.
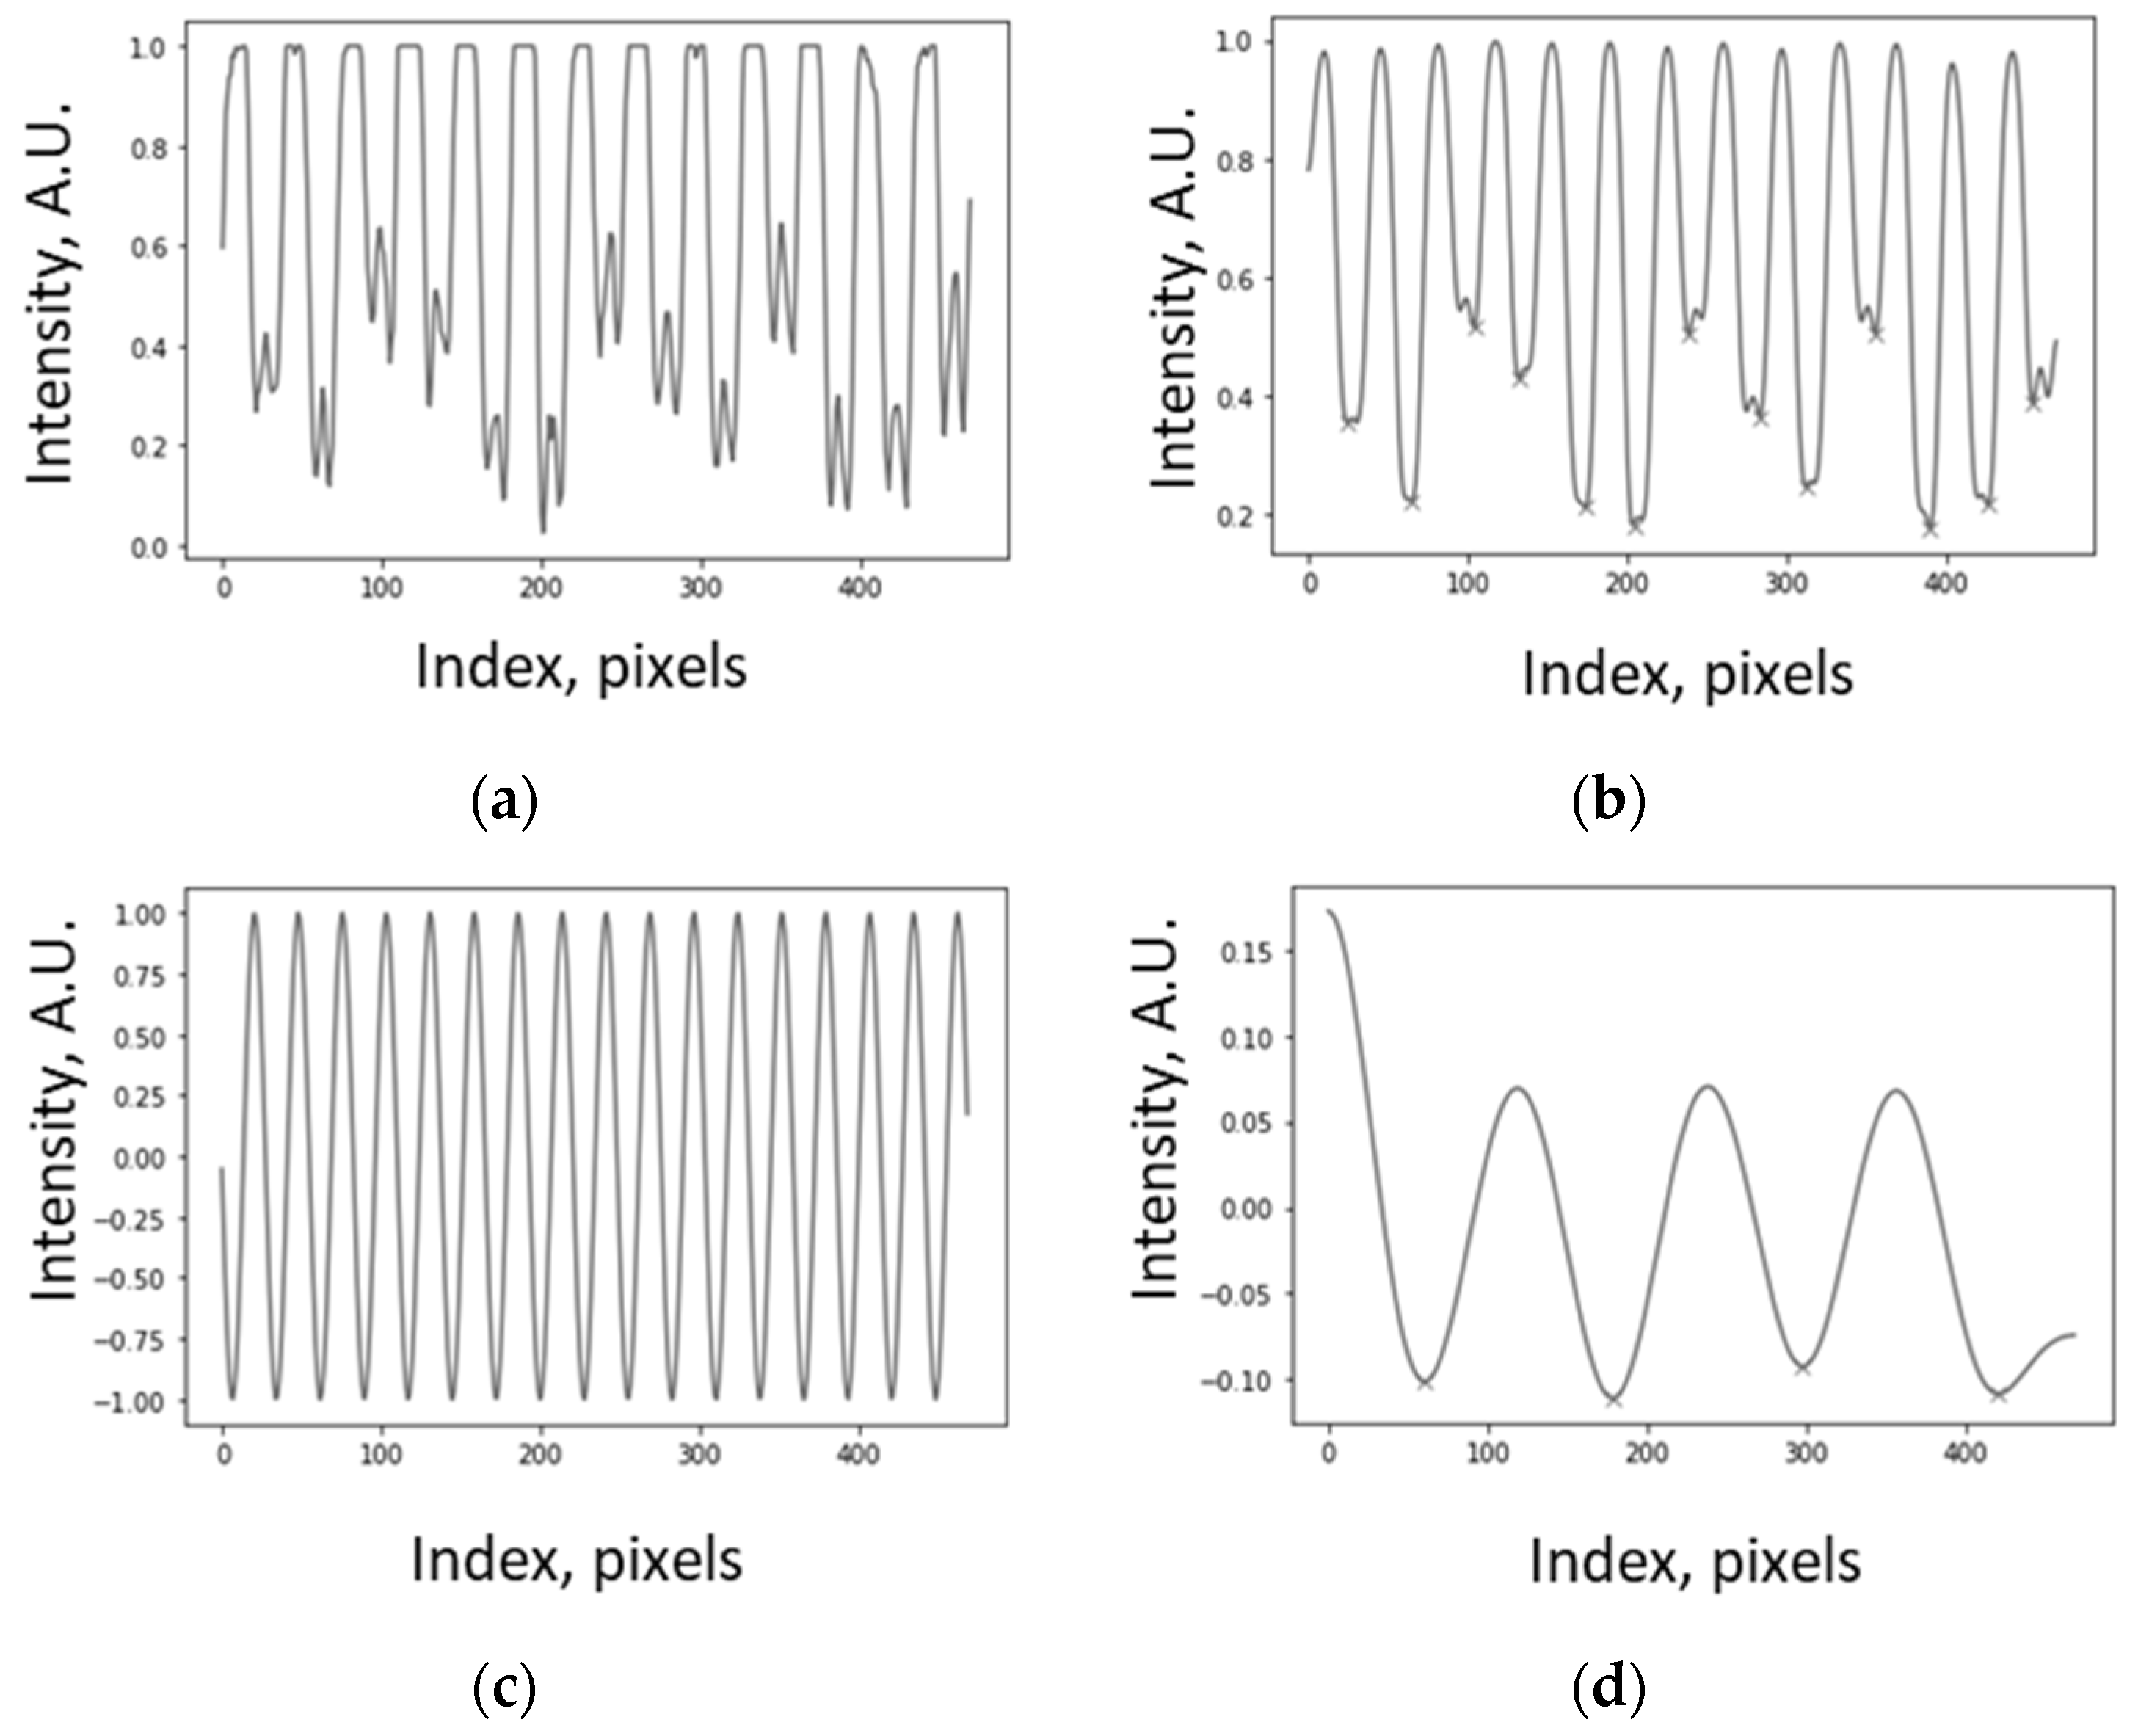
In the processing subsystem, the moiré patterns are obtained by superposing the image of the oscillating grid on a reference grid in each video frame of a video sequence.
The computer-generated grid is prepared before measurements and serves as a standard reference for the entire video.
The moiré patterns appear in the overlap area of the photographed and computer-generated grids (effectively in the image plane of the camera), as shown in
Figure 5. Compare the slight shift in the grid with the noteworthy shift in the moiré patterns that results from the moiré magnification.
The physically measured value is the difference in height between two points: the camera height
hcam and the grid height
hobj, as shown in
Figure 4. Changing one of these heights results in a phase shift of the moiré patterns. Therefore, the moiré measurements are always relative. The measured displacement is averaged over the grid area and effectively applied at its center.
Because of the phase proportionality [
1], a changed grid phase (i.e., displacement of the object) results in an identical phase shift of the patterns. This can be expressed as
where
x and
xM,
T and
TM are the displacements and periods of the grid and the moiré patterns.
Among the values involved in Equation (17),
x and
T are expressed in physical units (e.g., mm), whereas
xM and
TM are expressed in pixels. From Equation (17), we obtain:
Equation (18) shows the displacement of the grid in linear units (mm or cm) based on known and measured values. The spacing of the moiré patterns TM was determined when the reference grid was generated before measurements. The pitch of the grid T is known in advance, and a computer program measures the phase.
To obtain the absolute displacement, we only need to know the size of the grid (which we created ourselves, so we do know it), according to Equation (18). As a result, no calibration procedure is required, that is, the method is self-calibrated.
2.4. Experimental Setup
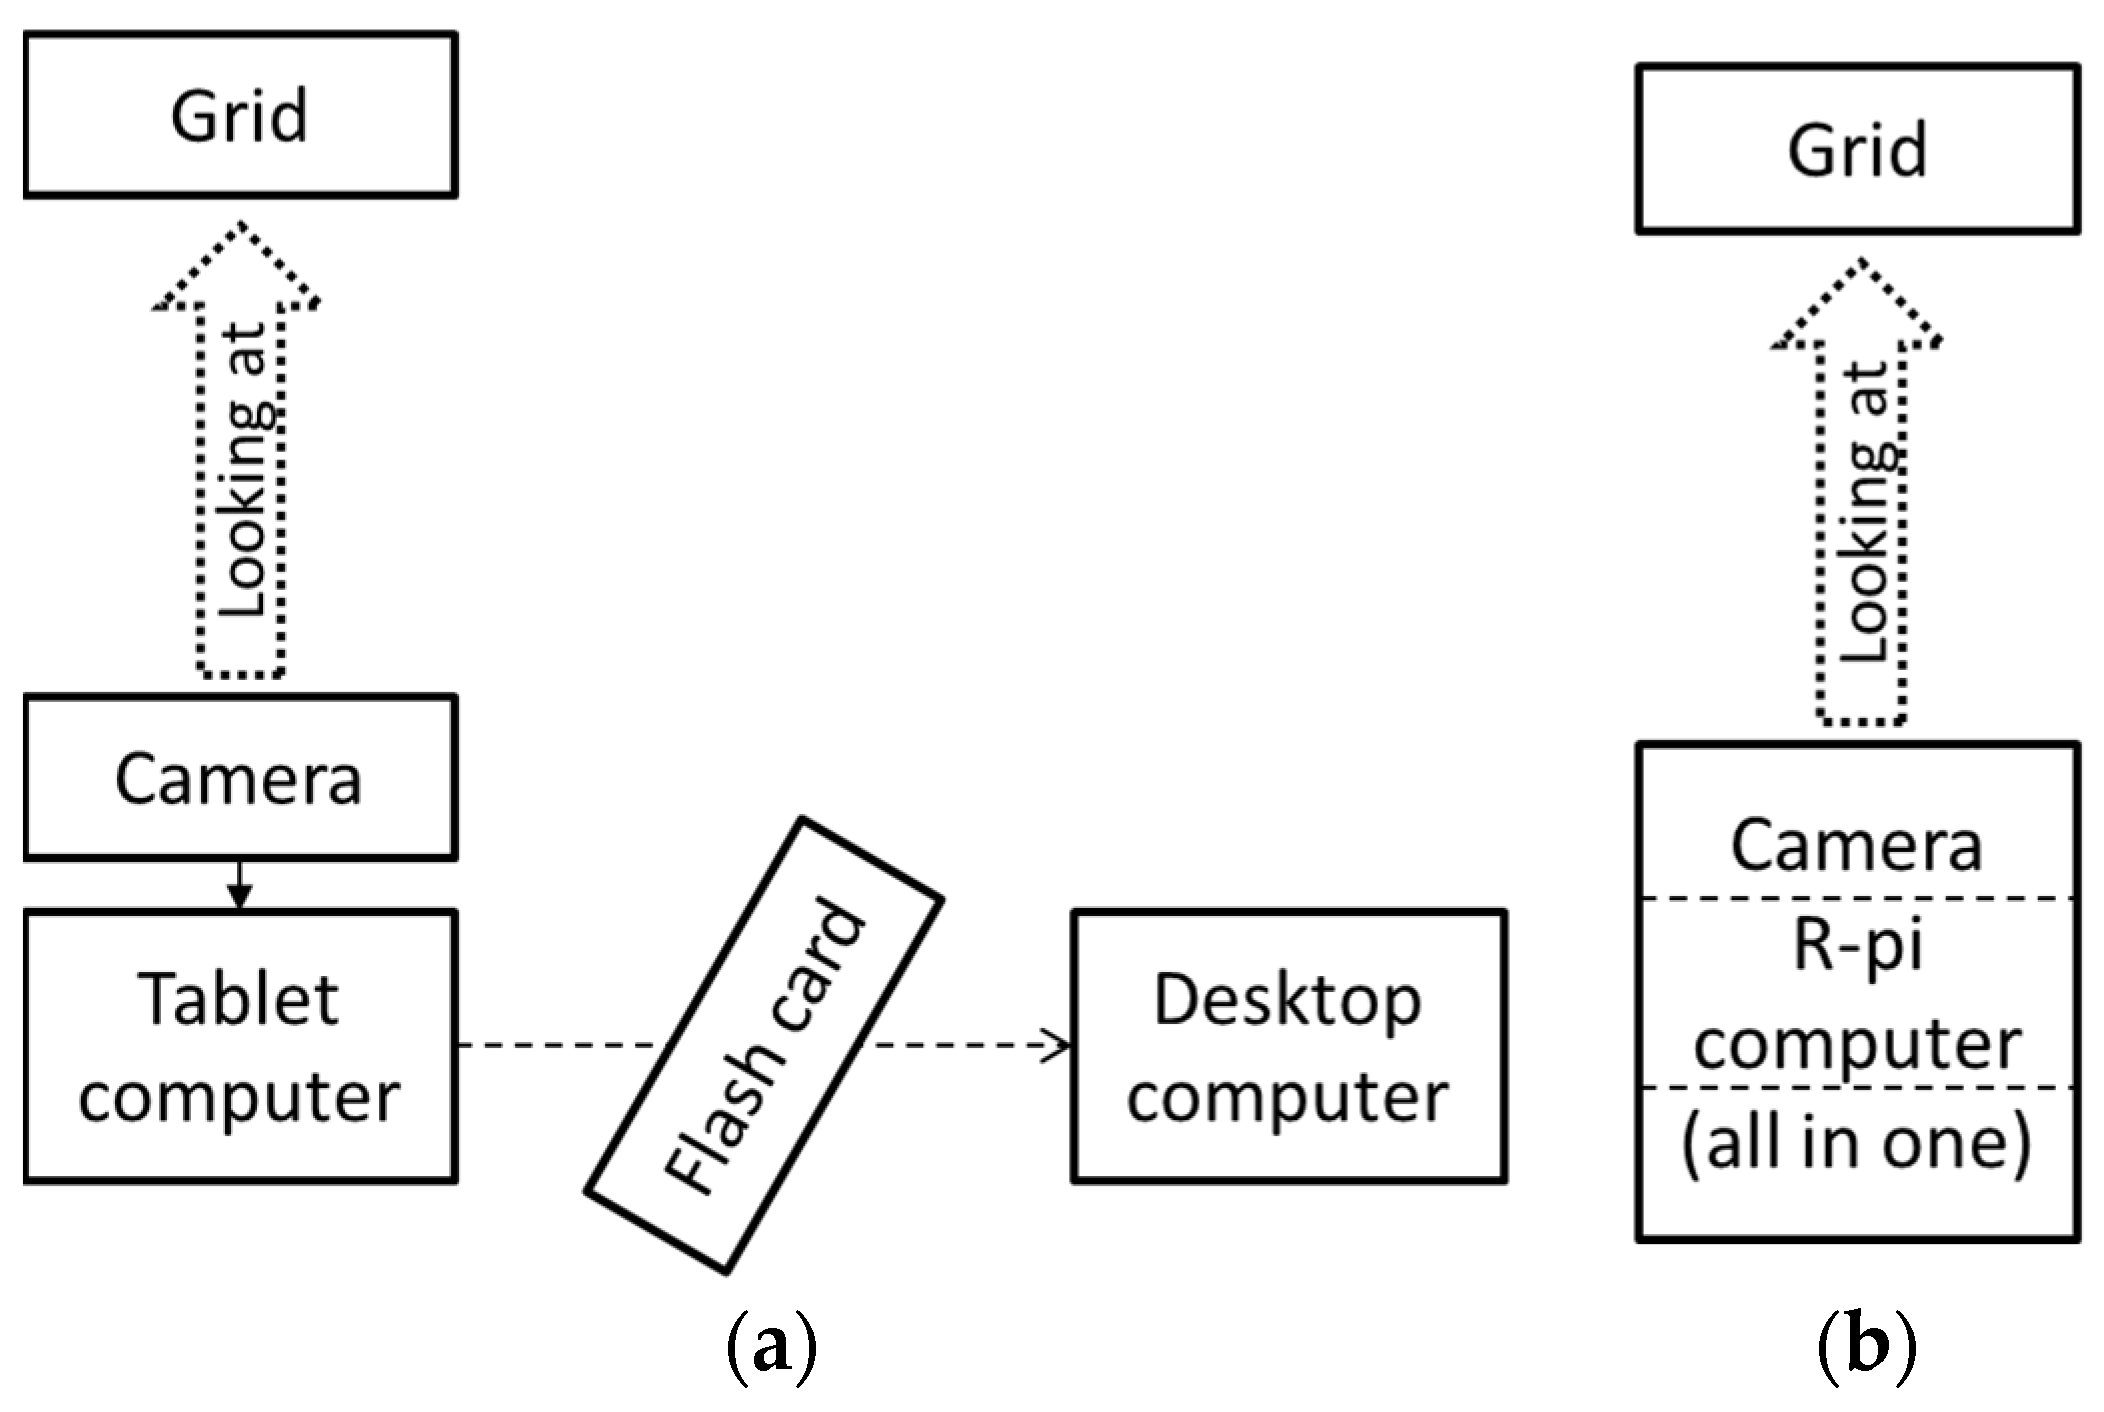
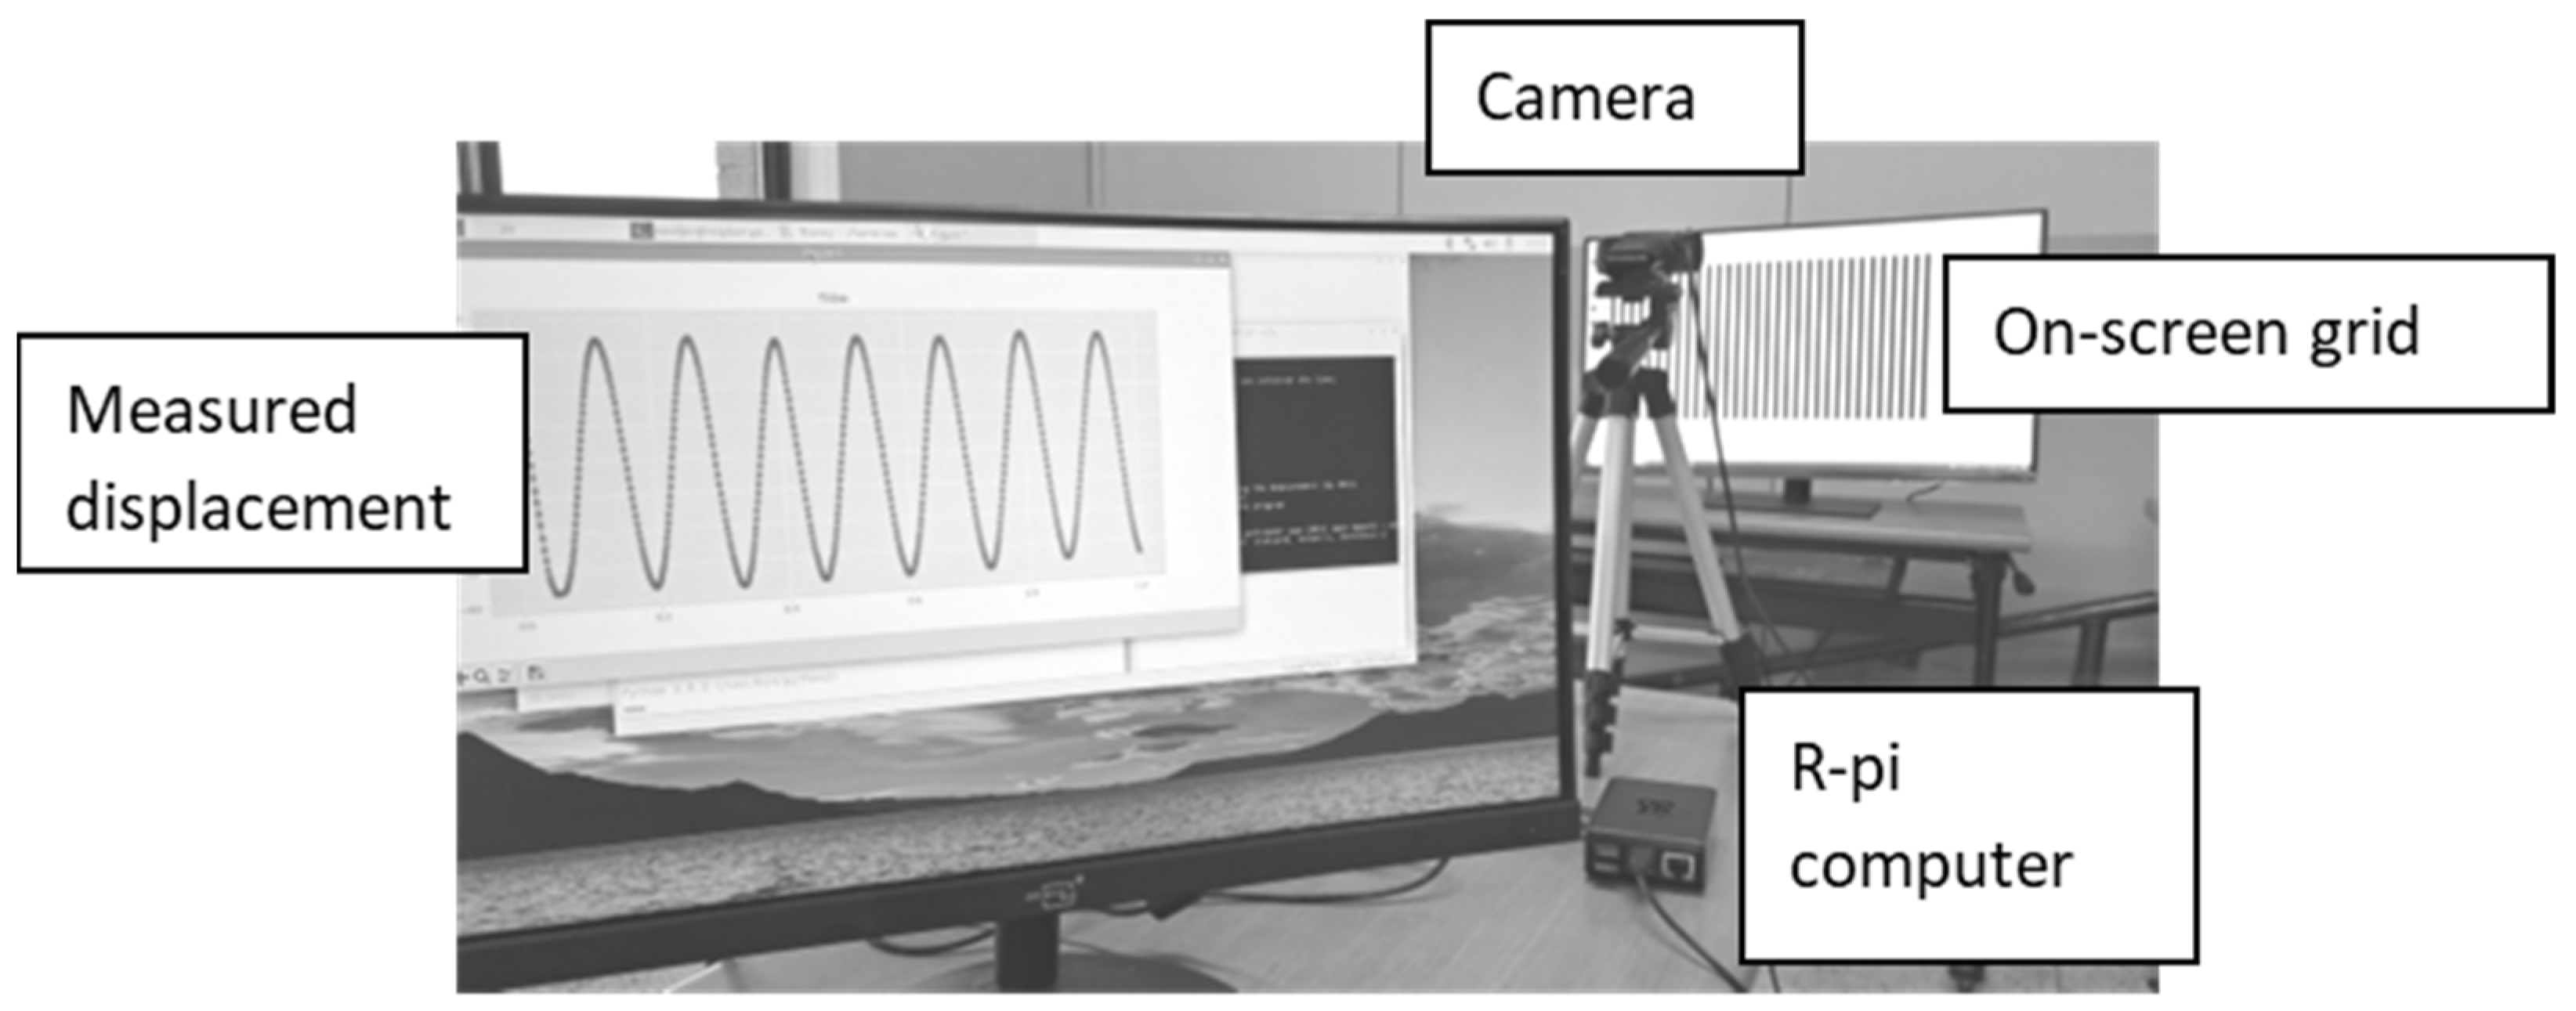
The experimental setup consists of a camera, a grid, and a computer, see
Figure 6. In both cases, we use a USB camera.
In measurements, we used various cameras, including a high resolution 8-megapixel camera ELP-USB8MP02G-SFV with the frame rate of 30 frames per second (FPS), as well as high-speed 2-megapixel cameras ELP-USB1080P01-MFV, ELP-USBFHD04M-SFV with 60 and 120 FPS, and 10× zoom (Shenzhen Ailipu Technology Co., Ltd., Shenzhen, China). Sometimes, it was enough to use such simple models as the DRGO web camera (FHD2K, 1080 p, Dareum International, Goyang, Republic of Korea) or a mobile phone (Galaxy S5, 1920 × 1080, Samsung Electronics, Suwon, Republic of Korea), both 30 FPS. Except for parameters such as resolution and frame rate, the camera model is not of decisive importance. The camera settings were made according to the standard manual.
Lighting conditions are not critical for modern cameras. The illumination conditions varied from approximately 300 lux in the laboratory room to 11,000 lux outdoors under the direct sunlight. A practical difference is the lack of automatic brightness control in ELP cameras, which can be adjusted manually, anyway.
The grids were either printed on laser printer with its regular accuracy of 600 dpi (0.04 mm) or displayed on the computer monitor (pixel pitch 0.28 mm or the like).
An estimation of the angular misalignment was discussed in [
53]. Namely, a dot matrix (e.g., of squares) requires more precise angular alignment than the line grid, because at the misalignment angle of arctan (1/2n) (when the scan line will move out of the row of squares at another end of the image of the moiré marker), a sudden change of the intensity can occur. It can be treated as a false moiré pattern, which can produce a measurement error. The line grid does not suffer from such angular misconfiguration.
We had no special vibration insulation; instead, we had a stable support for the camera on a solid ground, providing a vibration-independent platform. For additional stability, the grid and the camera can be equipped with an extra weight on the bottom.
In the deferred case (
Figure 6a), a tablet computer is used as a recording device (a simple but flexible equivalent of a professional camera). Alternatively, one can use other devices, such as a photo camera or a mobile phone with a camera, to shoot a video sometimes. The video file is processed in the second subsystem on another computer in the laboratory. In the real-time case (
Figure 6b), a Raspberry-pi (R-pi) computer performs the real-time processing, i.e., the subsystems are combined together.
In the deferred system, sections of the algorithm are separated and executed on different computers within different subsystems, allowing them to be implemented in various programming languages. In the real-time system, the image processing for the moiré pattern phase and its scanning are implemented simultaneously. Technically, the measurements were carried out along the measurement axis (perpendicular to the grid lines), selected by the operator before the measurement.
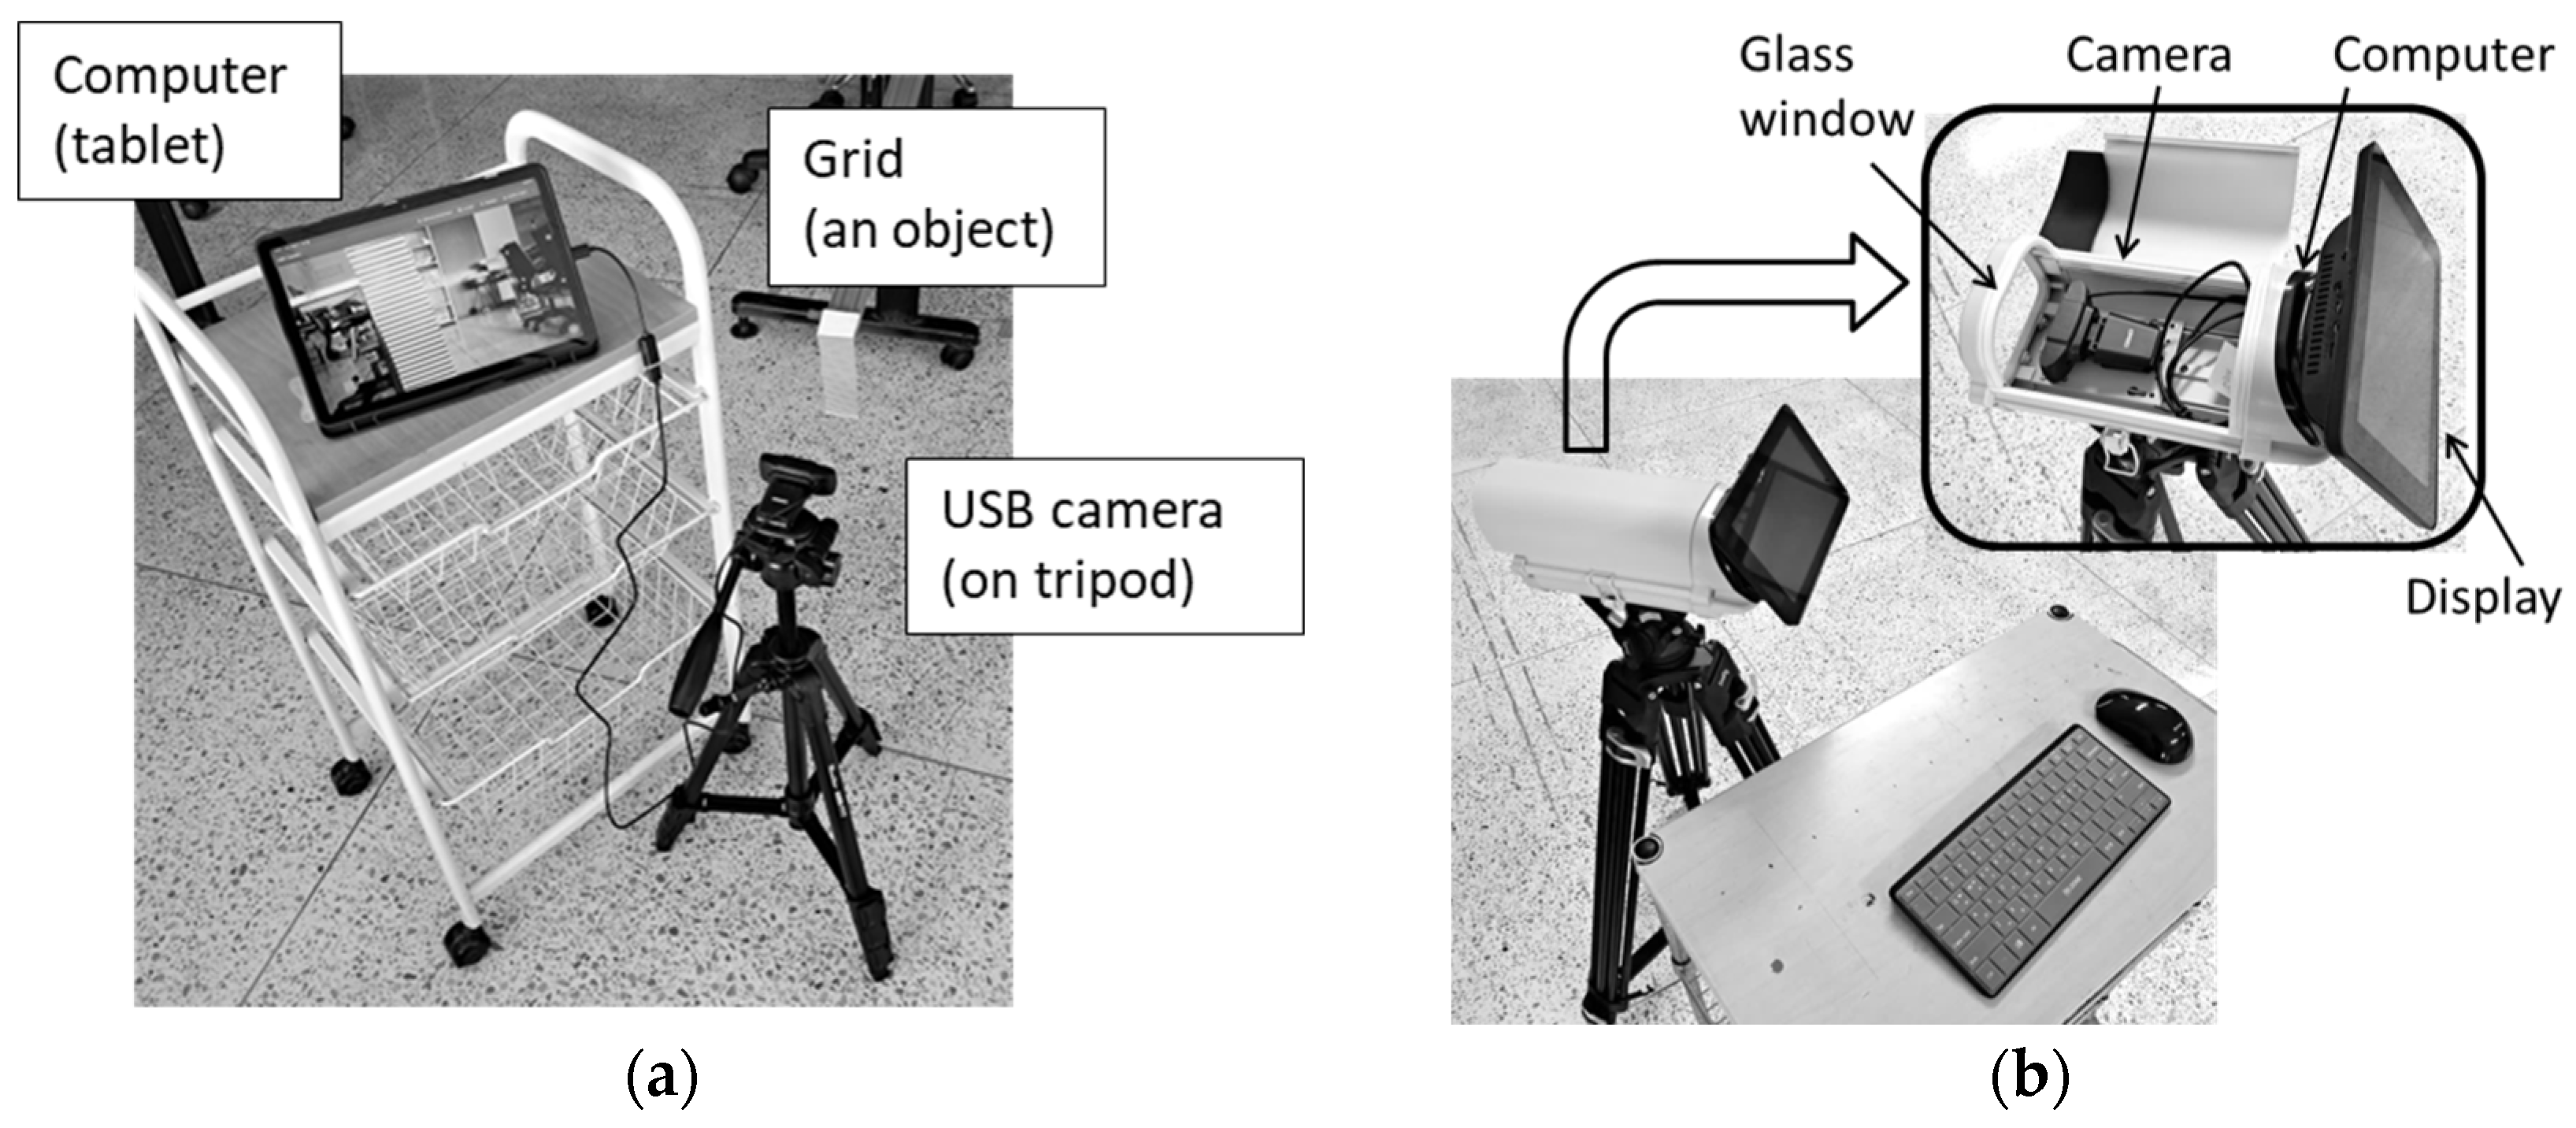
In the deferred version, the Samsung Galaxy Tab FE 10.9” computer (model SM-X510, 128 GB, 6 GB RAM, Samsung Electronics, Suwon, Republic of Korea) was used; in the real-time version, the Raspberry-pi 4 computer (model B, 64-bit quad-core Cortex A-72 processor, 8 GB RAM, Raspberry Pi Ltd., Cambridge, UK) was used. In both versions, the USB camera can be easily replaced. We used various FHD USB cameras for measurements, ranging from a web-camera (model DRGO-WC1080, 30 FPS, Dareum International, Goyang, Republic of Korea) to an ELP-USBFHD04M-SFV camera with a 10× varifocal lens and a maximal frame rate of 120 FPS, Shenzhen Ailipu Technology Co., Ltd., Shenzhen, China. Photographs of the deferred and portable real-time versions of the measurement system, based on the Raspberry-pi computer, are shown in
Figure 7.
2.5. Unfolding in Image Processing
Factors that affect sensitivity, accuracy, and stability include unfolding. The presented method is essentially a phase measurement. When measuring the phase, an ambiguity may arise due to enfolding of potentially infinite function into a finite interval, like a fan or an accordion. This effect is similar to multivalued functions in mathematics.
As an example, consider a wheel rotating at a constant speed. The angular coordinate (the phase) is a smooth and continuous linear function ωt + φ. However, the measured phase is always within the interval of 2π. Then, instead of an actual infinite smooth function of the time, the measured angle is a limited, discontinuous sawtooth function. As so, wrapping can be a serious problem in practical measurements.
Therefore, a necessary part of the processing is to bring the wrapped phase into order, i.e., to make it smooth (as it actually is); in other words, to unwrap it. The purpose of unwrapping is to eliminate phase jumps.
To solve this problem, we follow [
54], where one period is added or subtracted in response to a detected jump. Thus, the result is dependent on the known or measured value of the period. An additional problem is a noise; in the absence of noise, the method is 100% accurate; however, noise can cause false jumps in the output signal.
2.6. Simulated Motion
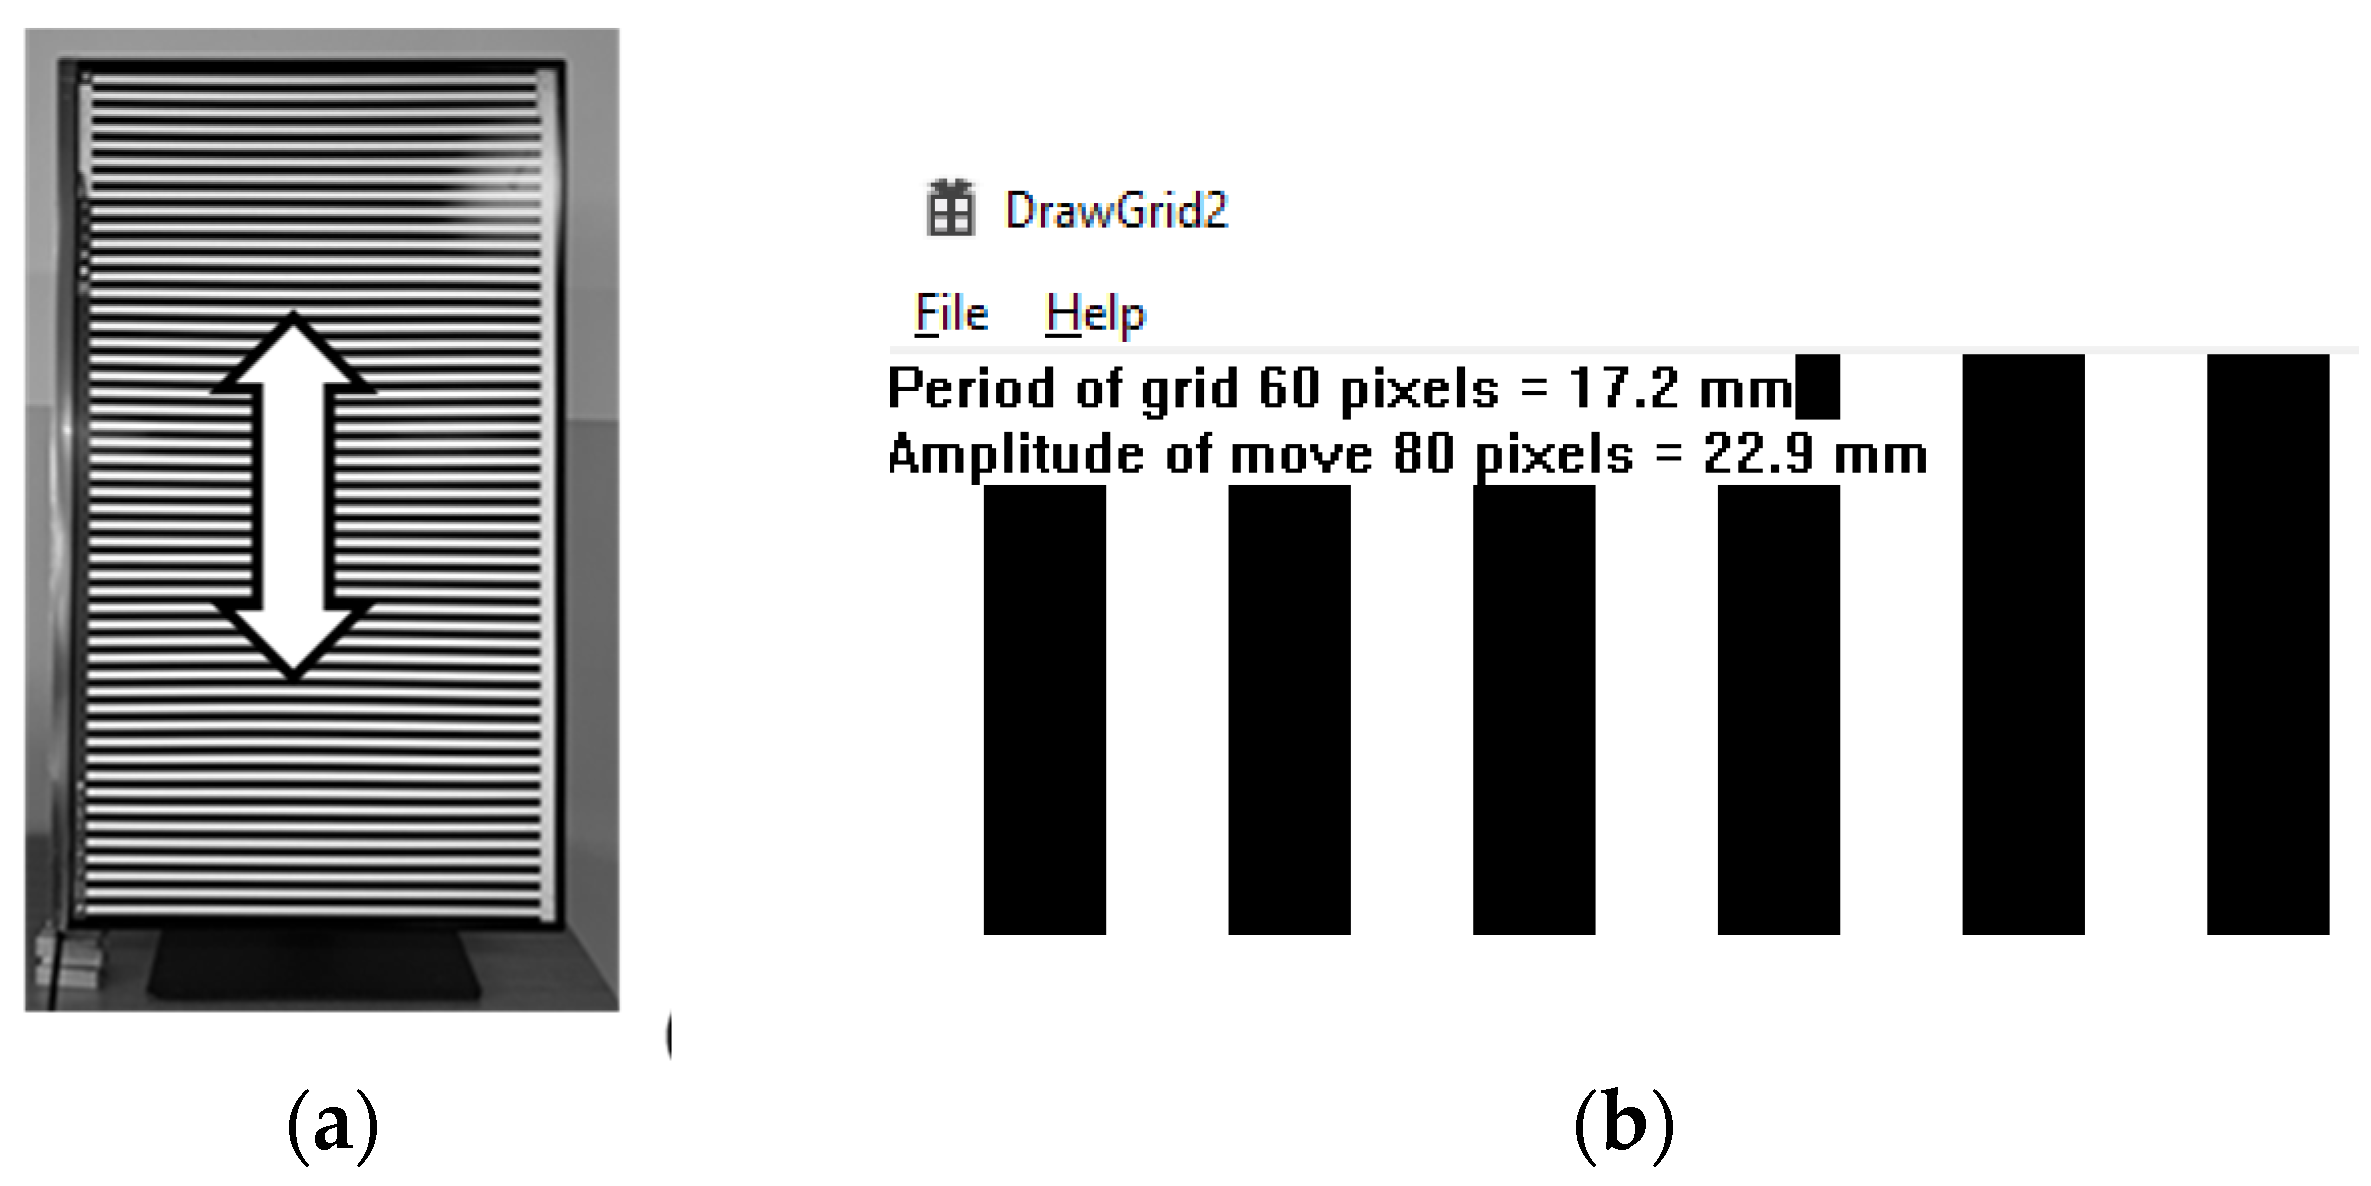
The mechanical motion may be inconvenient in laboratory tests. To improve their capabilities, it can be excluded from the tests. Instead of a physically vibrating grid, an on-screen image of a grid can be used, the oscillations of which (see
Figure 8) were controlled by a computer [
55].
The program works pixel by pixel, so the grid displacement is known exactly at any moment. In camera images, such a simulation appears to be a mechanical motion. Different measurement conditions can be simulated without rearranging the laboratory equipment. Practically, we developed two computer programs.
The first program displays a grid with a given profile, period, amplitude, and waveform (vibration pattern). Various waveforms are available, including sinusoidal (optionally with harmonics), triangle, and trapezoid; an example is shown in
Figure 9.
Particularly, a controlled amount of harmonics can be added to the sine wave; the amplitude of the added harmonics is inversely proportional to their index, similar to the Fourier spectrum of a continuous signal.
The parameters are controlled interactively from the keyboard. The current values of parameters are displayed in the corner of the screen. Although all dimensions are initially measured in pixels, they are converted to millimeters according to the pixel pitch of the monitor, see
Figure 8b.
Figure 10 shows an example of measurements using the simulated motion.
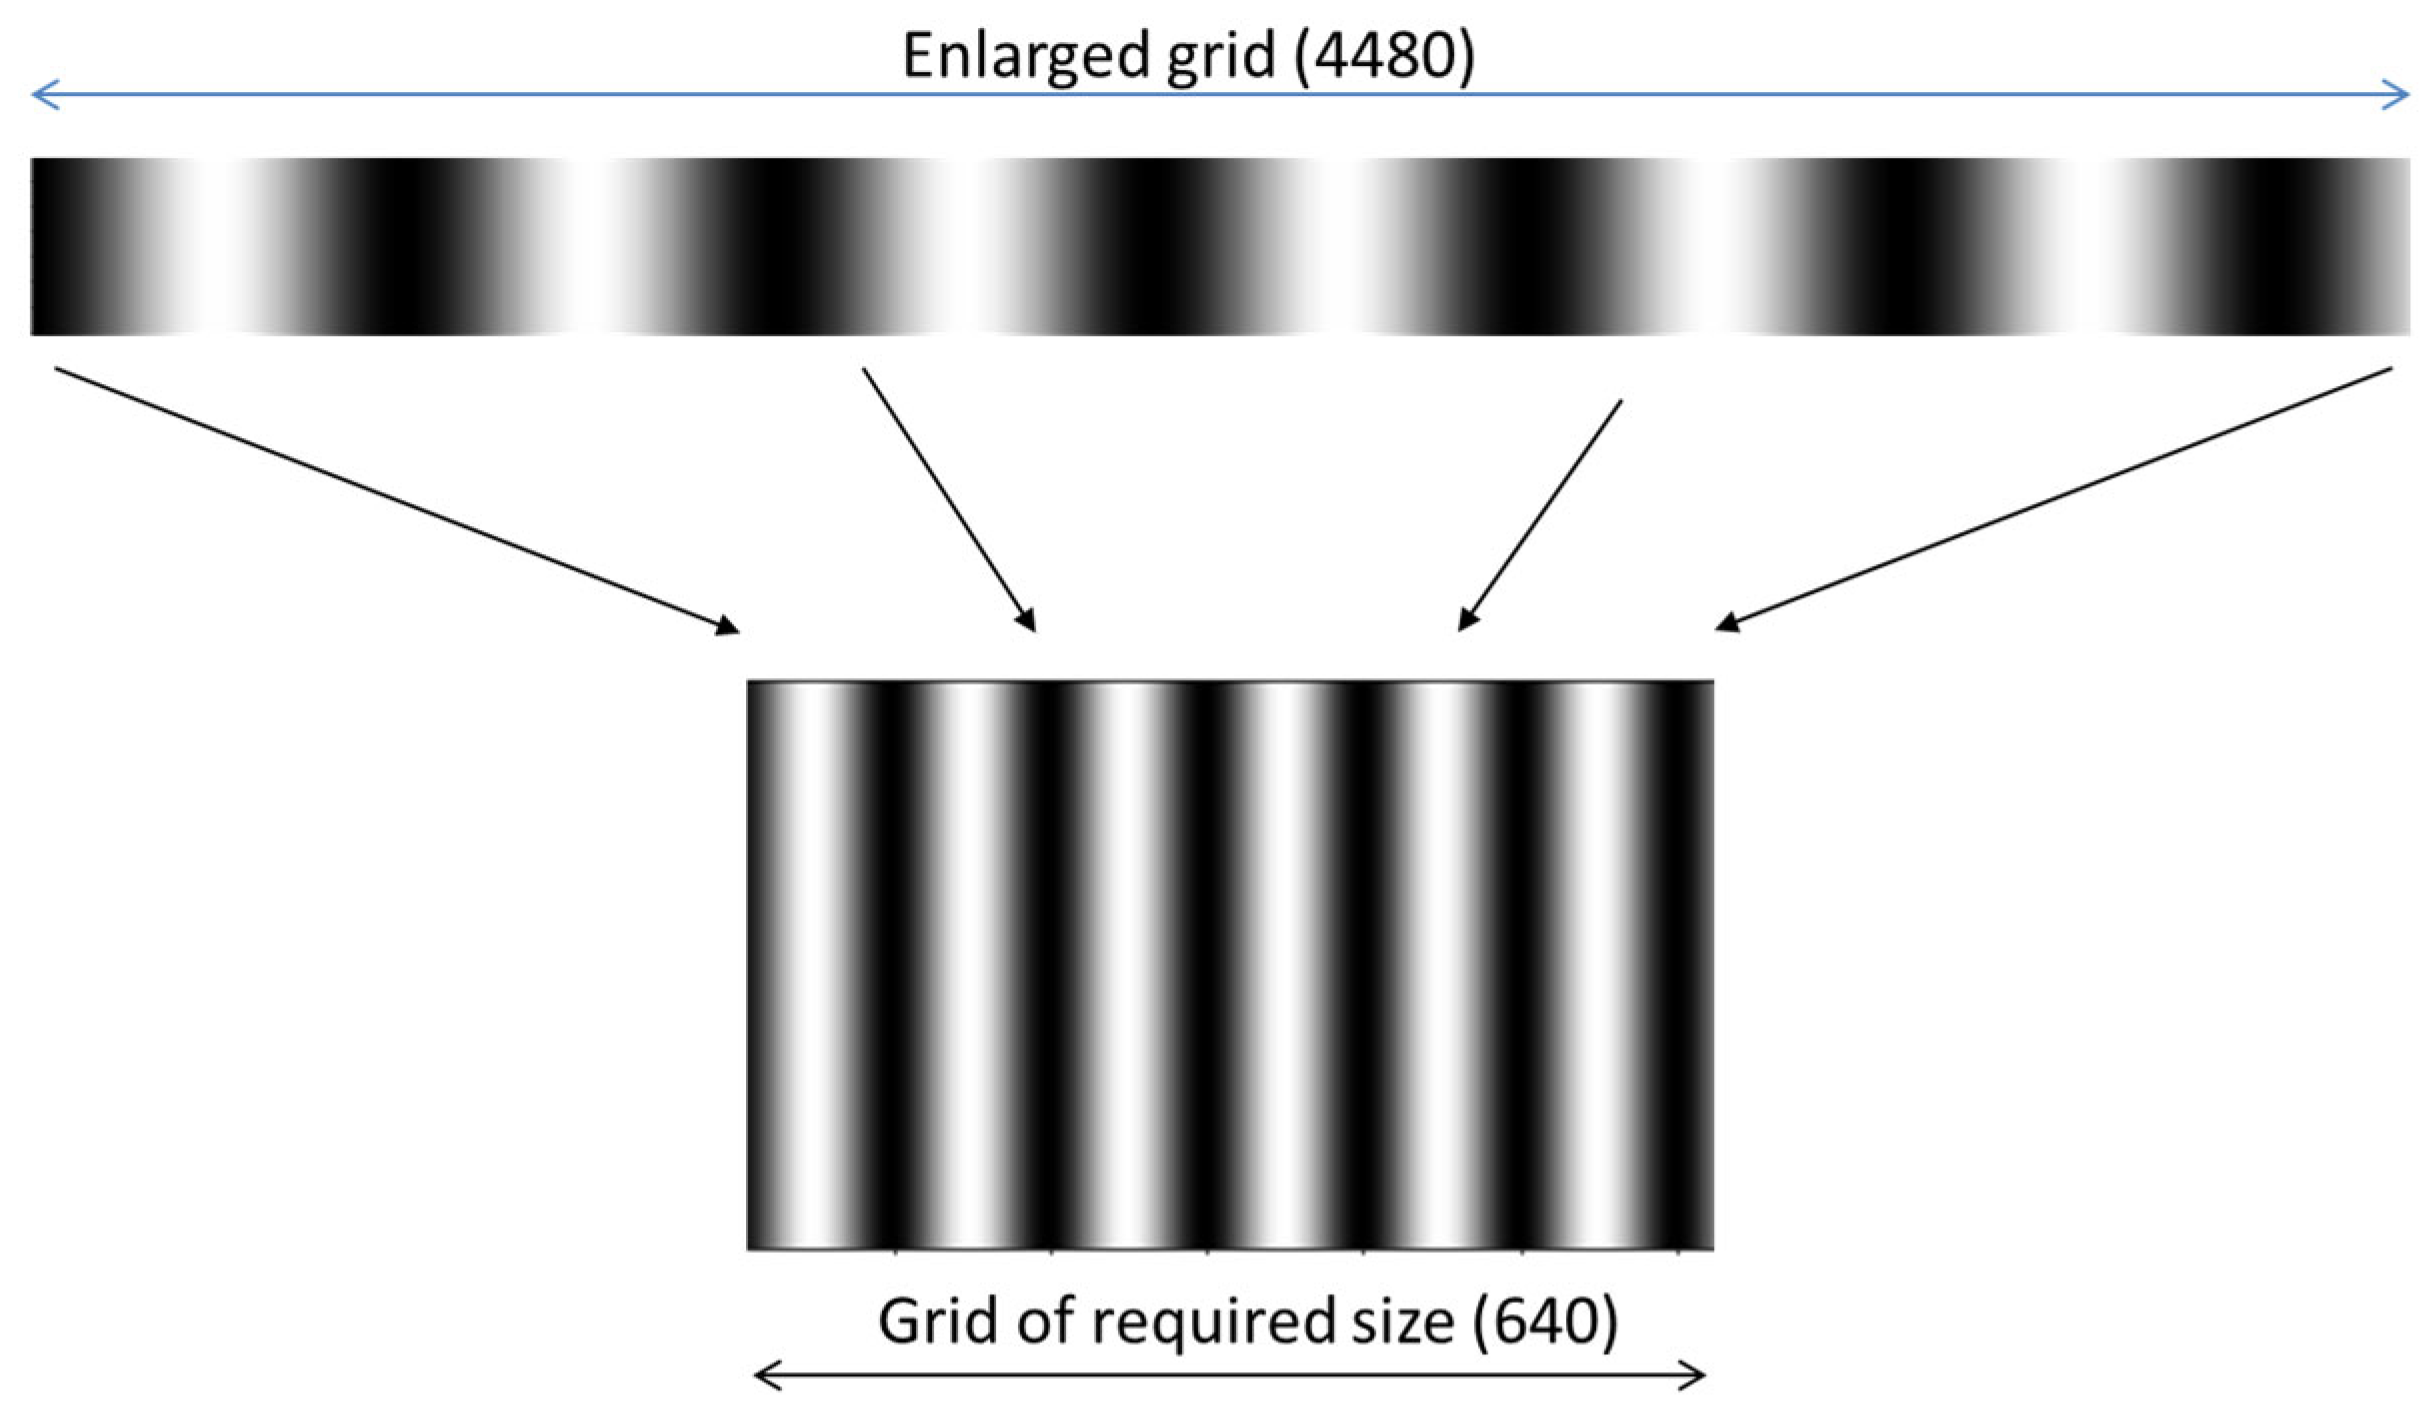
In preparing a test video, we typically generate an image of a specified size, for example, 640 × 480 pixels, considering pixels as the smallest units. However, in the real world, the vibration magnitude can vary from micrometers to mm or cm, including fractions.
To overcome the integer limitation and make the simulation realistic, the second test program was developed. It is not an interactive tool but generates a video in advance. In this program, instead of generating a test video of the exact required size (e.g., 1280 × 720) as in [
55], we first generate a video several times wider than needed (for a factor of 7, its width is 8960 pixels). Then, to simulate a motion, we shift each frame by the number of pixels corresponding to the waveform multiplied by the same factor. Finally, we resize the shifted video frame to the correct size and store it as a frame of the video sequence, as shown in
Figure 11.
The resulting video contains non-integer transients due to averaging at the last generation step (downsizing). The current values of parameters are included in the filename. This way, we generated test videos with non-integer or fractional amplitudes of oscillations, including intermediate steps.
3. Verification
3.1. Manual Mechanical Movement (Preliminary Experiment)
For the verification of the processing algorithm at the initial stage of development, we measured the grid displacement during its mechanical (manual) horizontal movement with the micrometer slider. The caliper ruler controls the grid displacement [
31].
The grid size was ranged from 17 to 74 cm. At all distances (1–25 m), the displacements (0.5, 1, 2, and 5 mm), including the smallest ones, were measured correctly, although the relative noise at longer distances was higher. The experimental data are given in
Table 1 and in
Figure 12.
The experiment was repeated 25 times. These experimental values were not minimal displacements. This simple experiment only confirmed the principle of measurement and the design of the measurement system.
3.2. Experimental Sensitivity Threshold
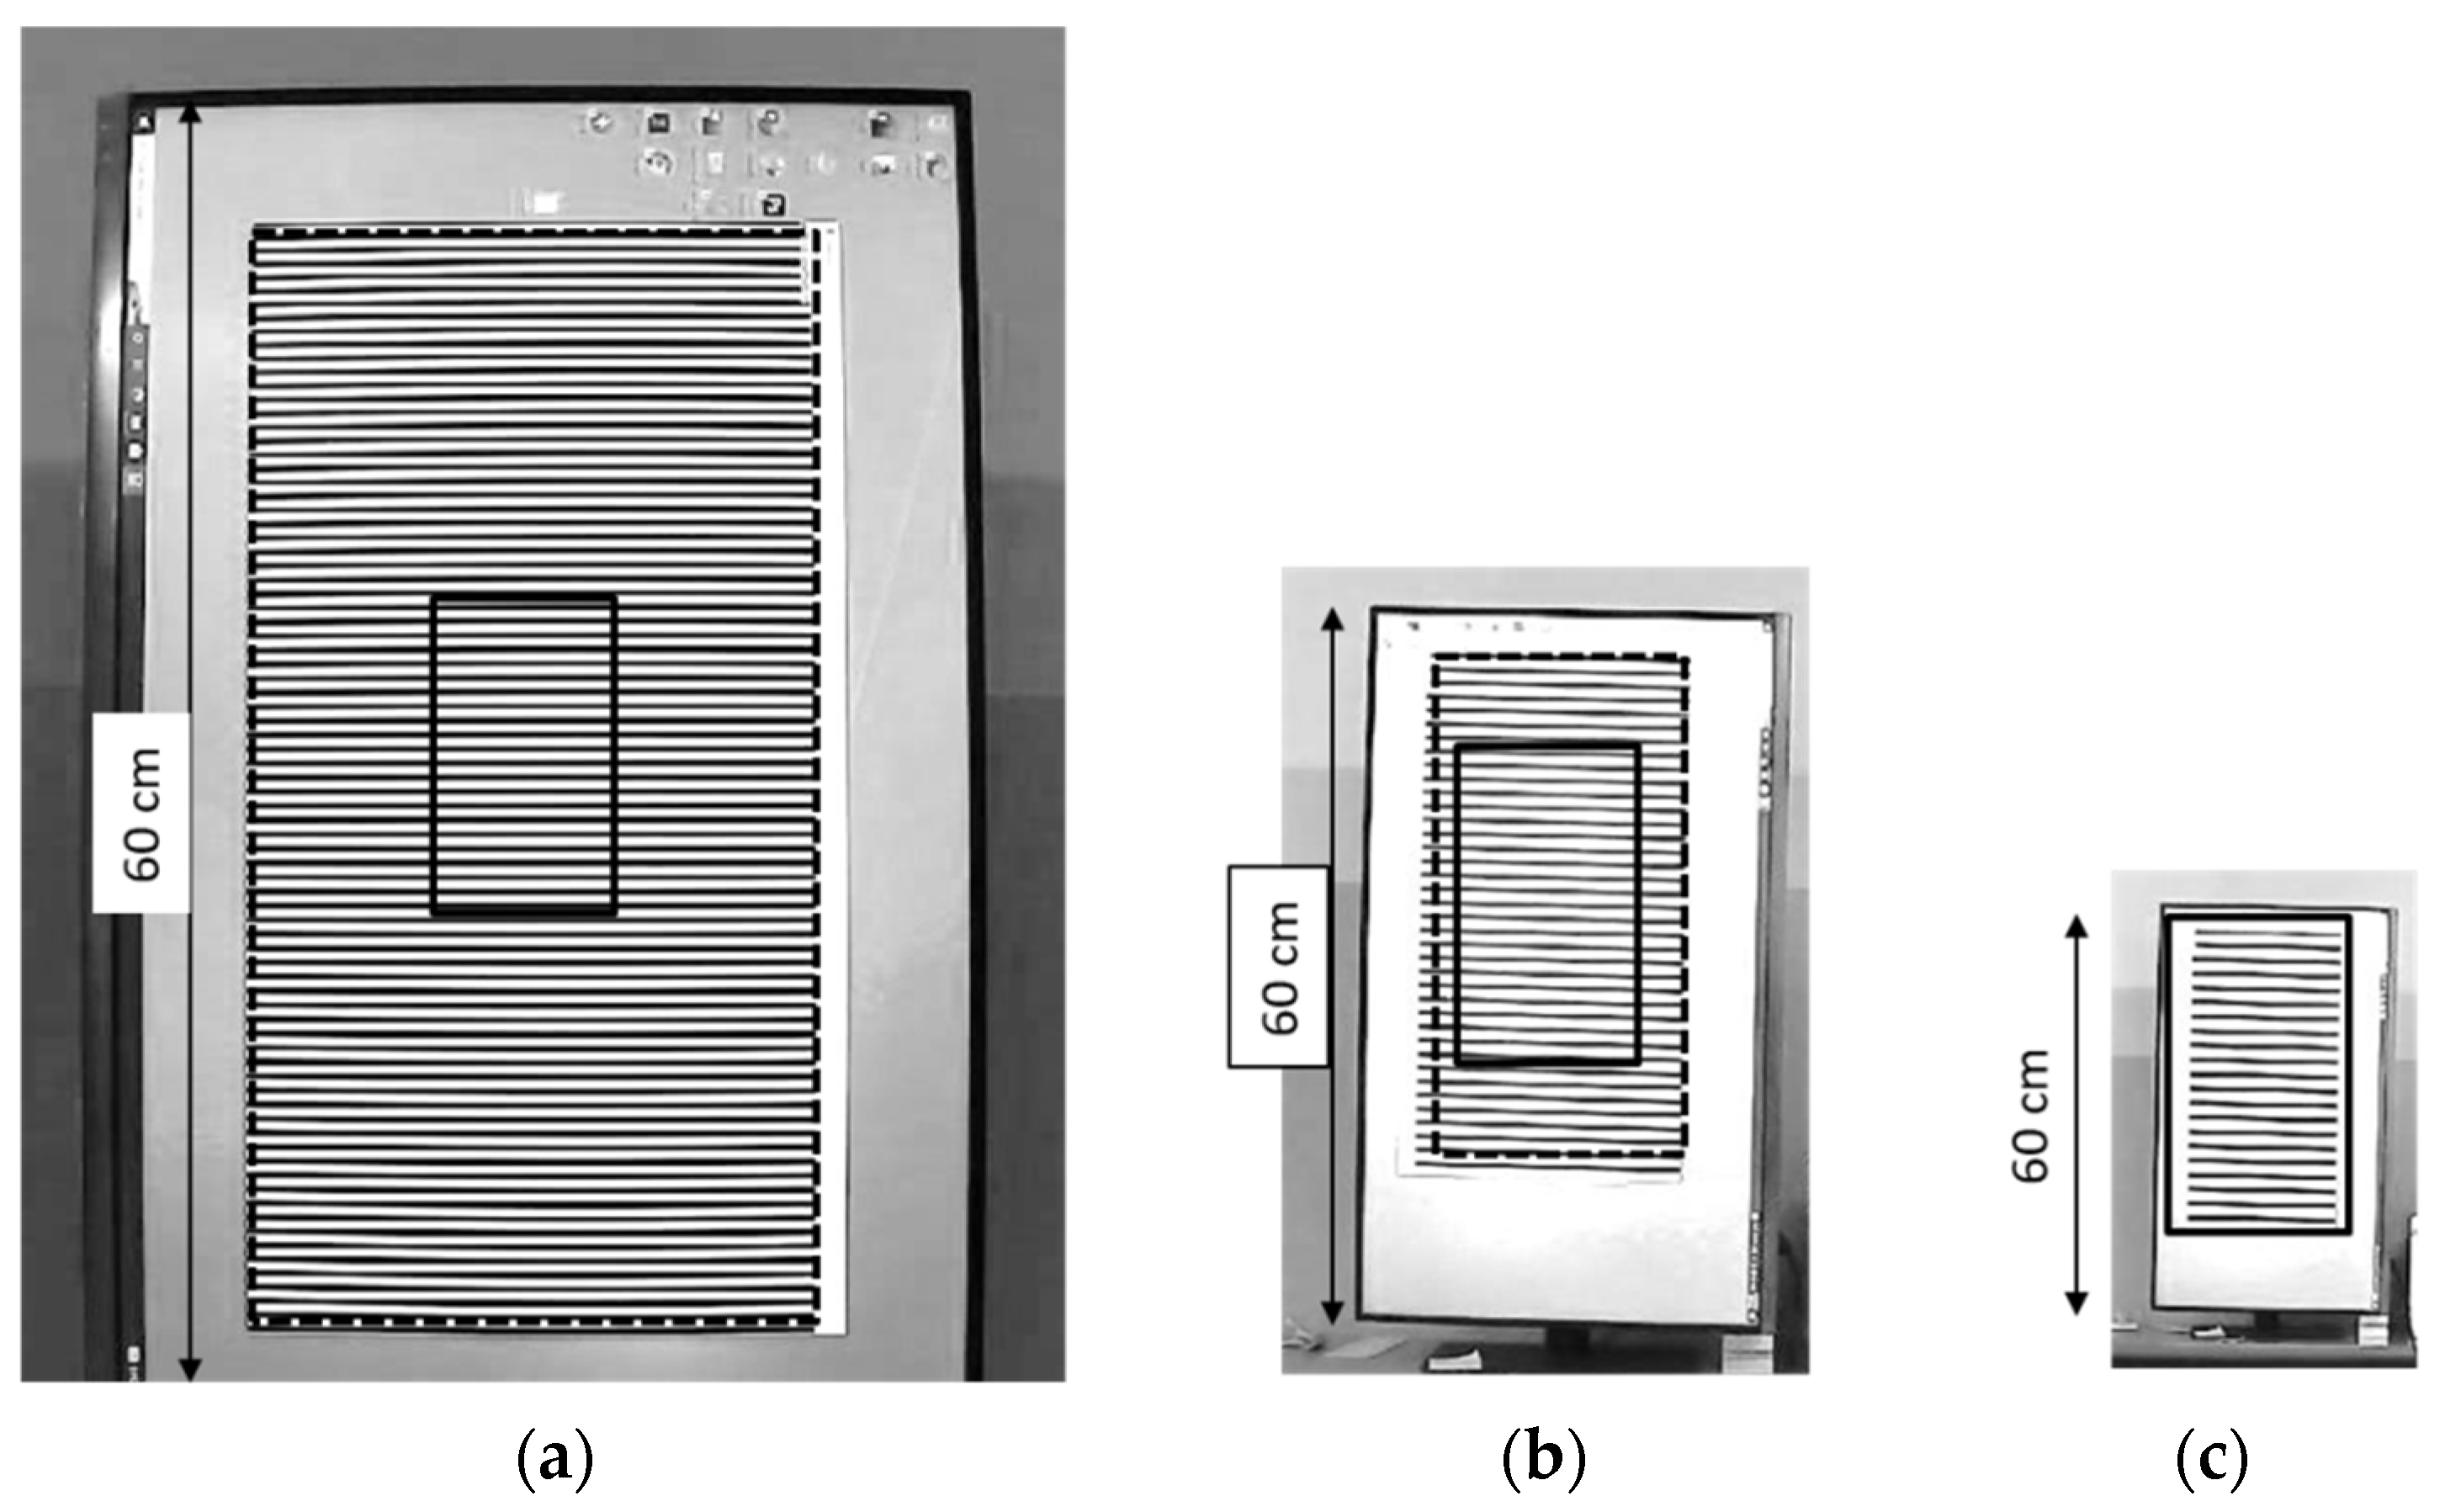
To experimentally evaluate the sensitivity of measurements using a grid, we displayed a static (motionless) grid on a computer monitor and observed it from different distances. The monitor size was 60 cm, and the displayed grid size was 51.5 cm, as shown by the dashed rectangles in
Figure 13. The pixel pitch of the monitor was 0.18159 mm. In experiments, the grid pitch varied from 6 mm to 26 mm, and the distance was from 1 m to 5 m. The experiment was repeated six times.
First, let us consider the direct measurement without zoom. The test was performed with a lens having a 30° angle of view (the zoom factor was approximately 1.4 as compared to a “normal” lens). The camera resolution was 1024 × 768 pixels. The measured area of the grid contained 20 lines (156 camera pixels high), as indicated by the solid rectangle in
Figure 13. Its physical height was 13.4 cm, 27.1 cm, and 51.5 cm at distances of 1.35 m, 2.8 m, and 5.05 m, respectively.
The maximum clear image distance was determined from the visual absence of grid distortion in the camera image: both edges of each line should be recognizable. In particular, the minimum grid pitch in the photograph was approximately seven pixels on the camera.
Thus, we had the same number of camera pixels per pitch for each grid at the maximum distance. For example, the pitch of the grid in
Figure 13c was 515/20 = 25.8 mm, and the size of one camera pixel projected onto the object was 3.7 mm. For the other grids shown in
Figure 13a,b, the pixel sizes were 0.96 mm and 2.0 mm, respectively. These values (0.96 mm, 2.0 mm, and 3.7 mm) represent the sensitivity threshold of direct measurements without zoom at distances of 1.35 m, 2.8 m, and 5.05 m. Equation (15) gives 0.86 mm, 1.7 mm, and 3.3 mm. (The relative difference with the measurements is 10–15%.)
Second, in direct measurements with an 8.5× zoom lens (the difference with a 1.4× zoom lens is about 6.0), the sensitivity thresholds at the same distances were 0.16 mm, 0.33 mm, and 0.6 mm. The values calculated by Equation (15) with different pixel numbers of 0.14 mm, 0.28 mm, and 0.55 mm. (The difference is 8–15%.) Please note that in this subsection, the threshold values highlighted (in italics) are less than a screen pixel.
Third, the magnification coefficient for the physical 20-line grid and the computer-generated 24-line grid is 5. The following sensitivity thresholds for moiré magnification without zoom are calculated for
Figure 13a–c using Equation (16):
0.17 mm, 0.4 mm, and 0.74 mm at the same distances.
Fourth, in the moiré measurements using a telephoto lens, the distances of the same sensitivity increased. In particular, at a zoom factor of 8.5×, we have the sensitivity thresholds of 0.028 mm, 0.057 mm, and 0.12 mm at the mentioned distances, or, equivalently, the just-mentioned sensitivities of 0.17 mm, 0.4 mm, and 0.74 mm at longer distances of about 8 m, 17 m, and 30 m.
Fifth, other conditions may also affect the sensitivity. For instance, in some cases, additional grid lines are available. For instance, the physical height of the grid in
Figure 13a,b is greater than 20 lines and can be increased to the physical size of the entire grid on the screen (51.5 cm), shown by the dashed rectangle, so that the number of grid lines involved in the measurements increases. The grid with increased number of lines can provide higher sensitivity thresholds of
0.055 mm for the 6.7 mm grid and 0.2 mm for the 14 mm grid, at distances of 1.35 m and 2.8 m without zoom (or 8 m and 17 m with 8.5× zoom). Note that the increased number of lines improves the sensitivity of the moiré measurements only and does not affect the sensitivity of the direct measurements.
Finally, according to Equation (15), the higher the camera resolution is (i.e., the larger number of pixels is in the grid image), the better the sensitivity is. For example, an improved camera resolution of 1440 × 1080 pixels changes the sensitivity threshold by a factor of 1.5, i.e., 0.037 mm and 0.13 mm in the last example (at distances of 1.35 m and 2.8 m without zoom).
3.3. Direct Observation of Sub-Pixel Movement
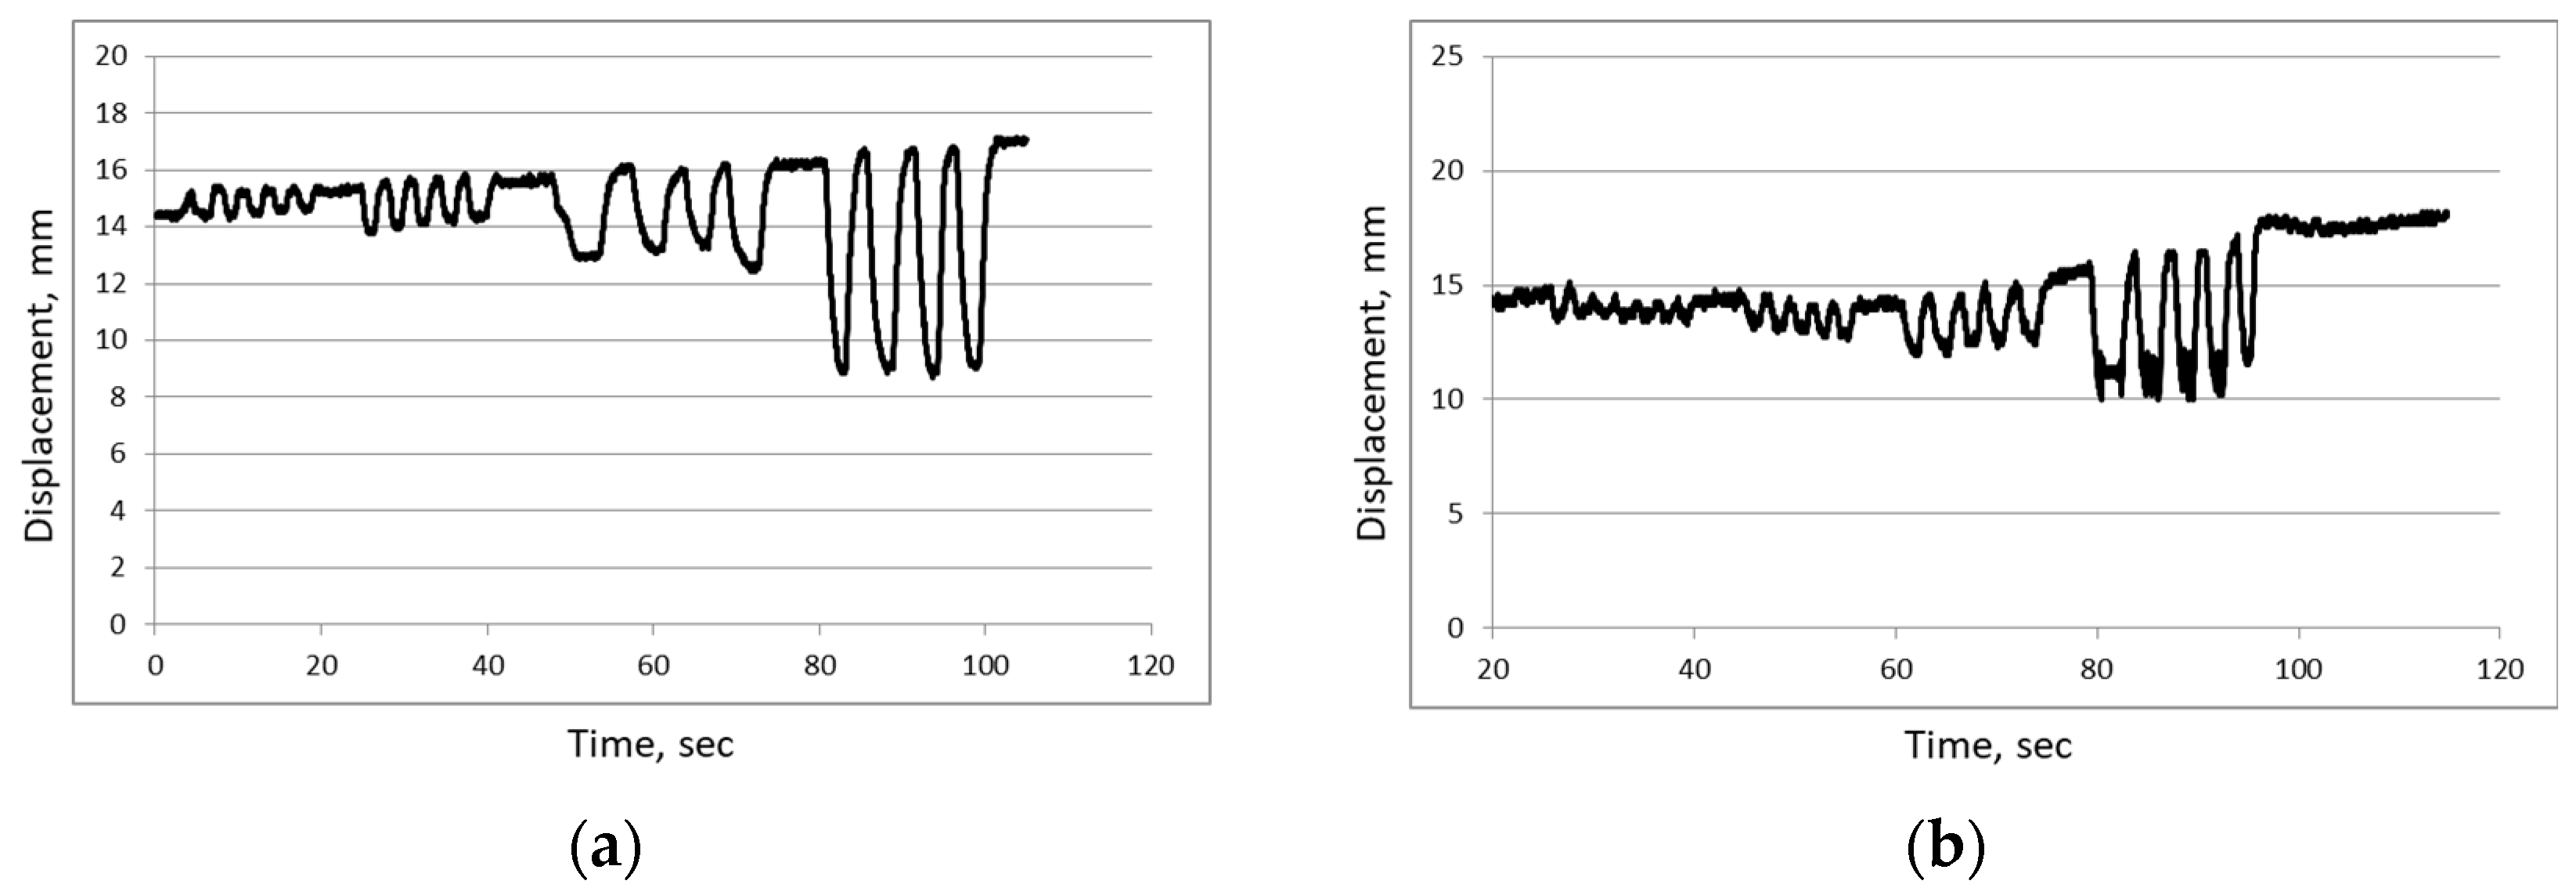
We conducted a laboratory experiment to confirm the sub-pixel sensitivity of the moiré measurements using a digital camera. The vibration of a grid with a sinusoidal profile and non-integer (fractional) vibration amplitudes was simulated on a computer monitor using the second test program. The image of the vertically vibrating grid was photographed and processed.
Experiments were conducted with the sinusoidal waveform and vibration amplitudes of 0.5, 1, and 2 screen pixels [
56]. The corresponding physical amplitudes were 0.14 mm, 0.28 mm, and 0.57 mm. Note that it was practically impossible to visually recognize a vibration of 0.5 pixels on the screen. Examples of measurements with non-integer/fractional amplitudes (with error less than 3%) are presented in
Figure 14.
In all measurements, the motion is recognizable as close to the sinusoidal. Namely, one can recognize several levels (steps) of motion (six steps in the first case). This means that the value of 0.5 pixels is not the lowest sensitivity threshold of the moiré measurements and can be improved to less than 0.1 pixels, presumably by a factor of 6 (which corresponds to the moiré magnification coefficient of this experiment). Note that the image of the screen pixel was smaller than the camera pixel. The experiment was repeated 14 times.
6. Discussion
As an additional option, noise can be added to the simulated oscillations. Other conditions (e.g., weather) can also be modeled by adding images of raindrops, snowflakes, etc., over the image of the ideal grid. Moreover, the simulated motion in principle allows previously recorded signals to be reproduced and re-measured under changed conditions (using different parameters, distances, cameras, etc.).
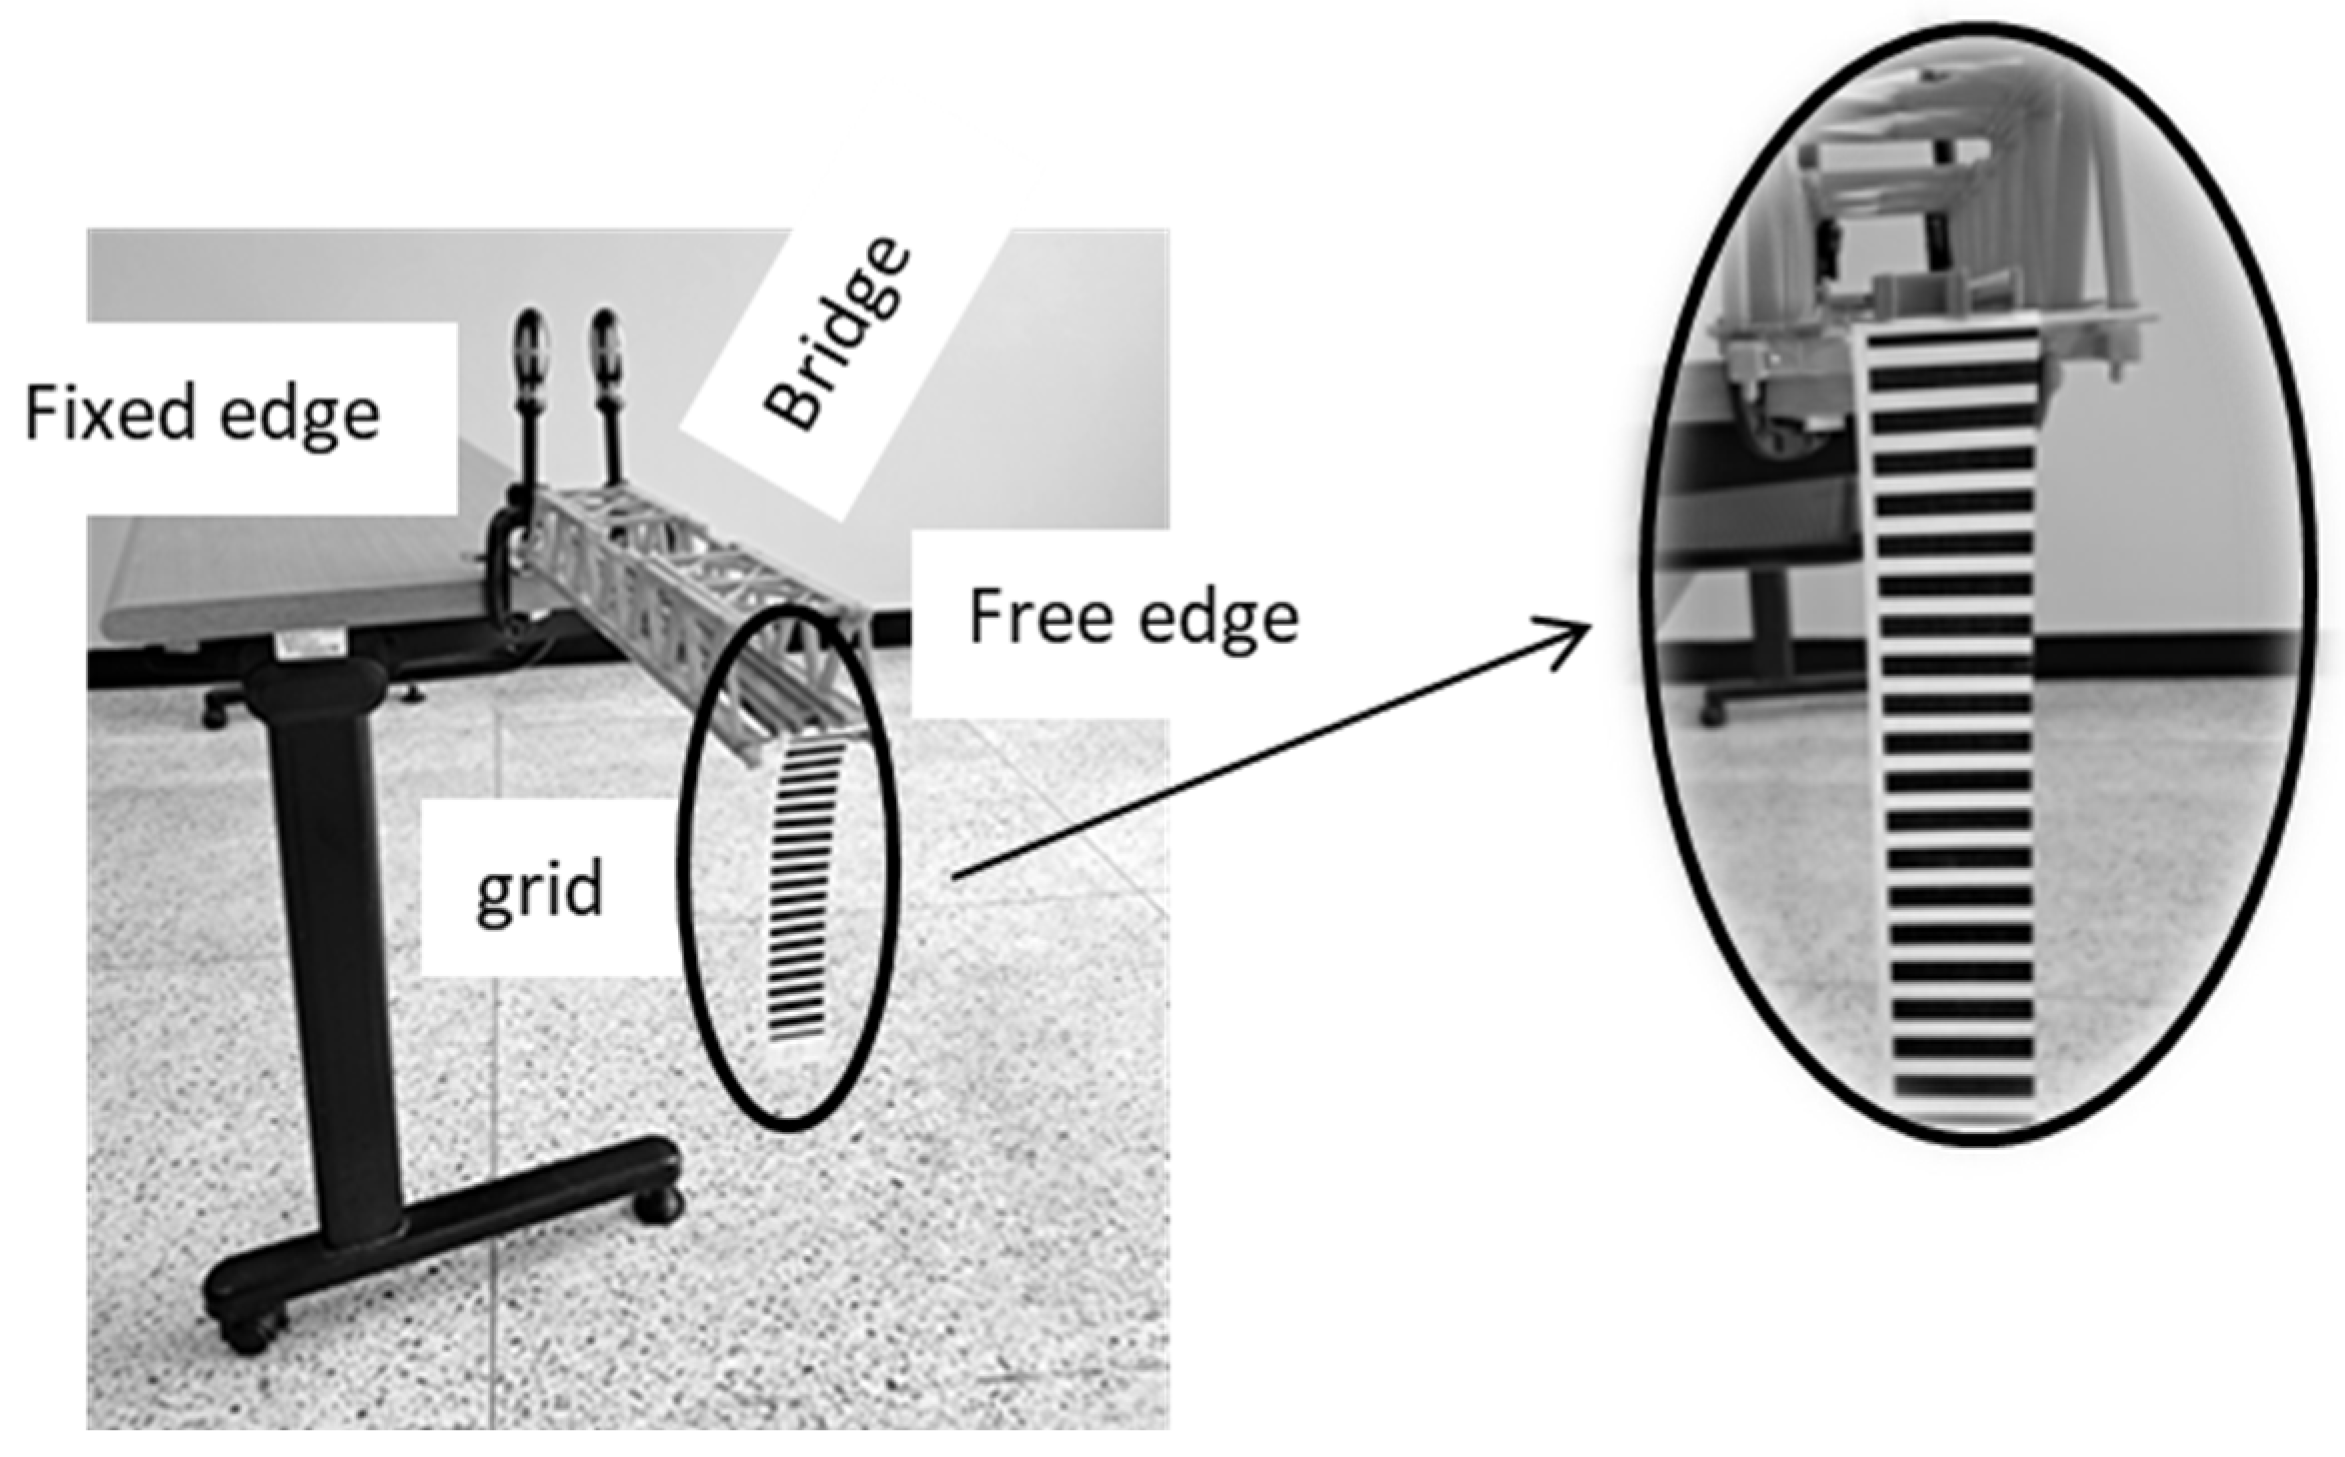
The severe damage to the plastic model bridge was primarily because of the greater weight at a longer distance from the support.
We do not consider the grid beyond the camera resolution; we only consider its displacement (sometimes almost unrecognizable). In experiments, the image of the screen pixel was smaller than the camera pixel.
The environmental factors practically encountered in the outdoor experiments were rain, mentioned in
Section 5.1 (second bridge), and fog, described in a later paper currently in preparation for submission. Neither factor had a noticeable effect on the measurement results. A temperature gradient, turbulence, and similar factors can deflect the light rays propagating in the atmosphere from the ideal position. At long distances, the influence of the inhomogeneous atmosphere can be noticeable, and these phenomena can reduce accuracy [
57,
58].
We measured the lateral displacements in the plane perpendicular to the camera axis; measurements of the longitudinal displacement were not made. We calculated the phase at the maximum intensity of the moiré pattern; however, higher accuracy can be achieved in another point, for example, where the function crosses zero.
Various graphical objects can be used for moiré measurements [
31], where we investigated the moiré effect in graphical objects arranged in parallel rows. Very similar results were obtained in various grids with a slight change in the regular processing algorithm. The similarity of results was demonstrated in five graphical objects arranged in rows, including approximate grids and text in different languages.
The noise inevitable in approximate grids was successfully eliminated based on the main property of the moiré effect—it is an integral effect (since it is expressed through the convolution integral [
1]) and, therefore, is robust to some random noise. By the same reason, random variations of brightness or color information in camera are not critical. Still, noise can seriously affect unfolding and be a cause of false jumps in the output. Therefore, a reliable unwrapping procedure insensitive to noise is critical. Noise negatively affects sensitivity, so the magnification works well at relatively high signal-to-noise ratios.
A real-time displacement measurement system based on machine vision [
59] includes a video camera (30 FPS, 30× zoom), real-time digital image processing, and manual target selection. The method presented in the current paper supports all these features (except for such a high zoom factor), plus higher moiré magnification. The target image contained four dots, while we use a linear grid.
One may also compare the presented method with [
60], where the displacement was caused by high-speed trains; digital images were recorded at a distance of 20 m with the frame rate was 10–20 FPS. A dotted grid was attached to the bridge using adhesive tape. The locations of the markers and cameras were connected by geometric relations, whereas, in the method presented in the current paper, these locations were arbitrary, and the frame rate was higher. This representative of CCD moiré methods requires a specific functional relationship between the period of the grid image on the image sensor and the CCD pixel pitch. Additionally, a 5 × 5 matrix cannot provide the magnification greater than 5; refer to Equation (7). We intentionally use more lines, as can be seen in
Figure 8,
Figure 20,
Figure 23 and
Figure 28, where the number of lines between 15 and 50 provides a higher magnification.
The grid can even be located inside the camera; some methods [
33,
35,
60,
61] use moiré sampling, i.e., the moiré effect between the oscillating grid and the CCD pixels. In these cases, the geometry fixes the ratio of the pixel pitch to the grid pitch, which remains constant over a given distance. In principle, one grid can be a mirror image of the original grid [
62]. Furthermore, instead of moiré patterns between oscillating and static grids, moiré patterns can also be observed without a reference grid, for example, between successive frames of a single moving grid [
63]; however, in this case, oscillations can only be measured in one direction.
Advantages of the presented method are sensitivity (increased by moiré) and flexibility (deferred and real-time operation). Technically, the method allows for higher-quality photographs of a moving grid, since it captures only one object (grid) at a time, rather than several objects at different distances. Another advantage is the maximum contrast of moiré patterns, since the computer-generated grid has the highest quality. In addition, the position and direction of the grids on the object can be arbitrary, even in simultaneous measurements. Potentially, more than two grids of different directions can be used.
The main limitations are clear air, no visual obstacles (even moving or disappearing ones), and a clearly visible grid, although little rain does not affect the results.
Theoretical results are as follows. The maximum number of grid lines determines the magnification; the sensitivity threshold can be less than a camera pixel; calibration is not required; the linear grid is less sensitive to angular displacement than the square one. Practical results are as follows. The amplitude of the motion simulation was less than one pixel; the sensitivity threshold was measured statically; the test was performed using an LVDT sensor and an accelerometer; pedestrians were detected while passing small bridges; the vibration of the vehicle was measured in two directions; cracks were detected in the parameter space.
Some additional verified applications (respiration rate, road bridge, asynchronous cameras, continuous wavelet transform) are mentioned in [
31]. Other potential applications of the moiré effect include the vibration of structural elements (buildings, bridges), earthquake detection, cryptography, and document security.
In future studies, we plan to automate the processing. To avoid a possible desynchronization of parts of the video frame caused by different shutter time in different parts of the frame, we plan to use ultra-fast cameras, as well as cameras with a global shutter.
