Article

Design Considerations for a Compressed Stiffened Plate with Skin–Stringer Debonding Based on the Evaluation of Adhesive Layer Stress Distribution

Department of Mechanical and Aerospace Engineering (DIMEAS), Politecnico di Torino, Corso Duca Degli Abruzzi 24, 10129 Torino, Italy
*
Author to whom correspondence should be addressed.
Appl. Mech. 2025, 6(1), 7; https://doi.org/10.3390/applmech6010007
Submission received: 29 November 2024 / Revised: 21 January 2025 / Accepted: 27 January 2025 / Published: 30 January 2025

Abstract

:
An extensive application of stiffened panels is considered standard for aerospace wing construction both for reducing the structural weight and fulfilling the regulatory requirements. The connection based on the adhesive layer between the skin and stringer introduces the possibility of debonding during operative conditions. The design procedure is strongly influenced by this anomaly, requiring the definition of a criterion for identifying the limit in debonding extension for safe operation. A procedure based on the investigation of the stress state in the adhesive layer is proposed in order to identify the typical behaviour of compressed plate, including damage situation, and a specific indication for design procedure is derived based on the debonding dimension. Critical and post-critical configuration were investigated both globally and locally to fix sensitive parameters. A conclusive guideline is discussed and presented. The analysis is applied to an isotropic plate in order to point out the main characteristics of the related design procedure. No conceptual changes are expected with the introduction of composite material that can influence the distribution of stress according to the chosen lay-up but not the basic design concept in the plate behaviour.

1. Introduction

Modern aerospace structural applications address the design efforts toward structural configurations that are basically made by the well-known “reinforced shell construction”, finding a compromise between weight reduction and strength within the considered airworthiness regulation. Stiffened panels are therefore very common in practical applications both in homogeneous isotropic materials and in composite/hybrid cases: they allow increasing structural performance, i.e., buckling characteristics for thin plates.
Extensive research activity has been devoted to the critical and post-critical behaviour of stiffened panels in the past, such as shortly reported in [1,2], identifying specific sensitive parameters for the local and global critical load level. General design parameters and procedures were also identified in [3], referring to spacing influence on the central deflection of stiffened plates and critical scenarios.
The presence of a typical skin–stringer interface indicates the possibility of damage generation both during assembling steps and during operative scenario typically with a “de-bonding” damage type for bonded configuration and with rivet-failure in the more traditional joining method. Such kind of damage strongly influences the local–global behaviour of stiffened plates with a direct effect on the design load level and failure condition. Specific damages related to delamination were considered by several researchers when composite materials were introduced into the stiffened configuration [4,5,6,7]. Delamination position and extension were considered in [4], pointing out that post-buckling disbound increment can be influenced by energy localization around the defect area. An influence on the propagation performance was also determined, leading to an anticipated failure. Furthermore, the presence of delamination next to the skin–stringer interface results in a more enhancing effect in panel strength reduction. Fatigue experimental results were analyzed by cyclic load application in the local post-critical regime, demonstrating a failure scenario close to typical debonding dimensions as in [2]. Moreover, fatigue behaviour in composite and metallic aerospace samples under cyclic loads were extensively studied in [2], providing valuable insights into the initiation and propagation of cracks, which may also influence the structural integrity of stiffened panels. Damage criticality on panel strength is also identified in [8] but no design criterion/approach was proposed.
Failure investigations of the bonded configuration were extensively developed in [9,10,11]. Failure mode based on toughness evaluation and progressive failure concepts referring to fracture mechanics were proposed and detailed with cohesive element introduction. Progressive failure and influence on the post-critical behaviour of compressed plates were presented in [12,13,14,15] with specific attention to the identification of the mode of failure and lateral induced deflection during compressive load introduction in stiffened plates. Specific effects on post-critical behaviour and failure were reported and addressed but no general design approach was formulated or suggested.
From the point of view of general design procedures, a preliminary investigation of the stress state in the adhesive interface of similar configuration wasen described in [16,17], but the initial definition of a simplified design approach in the identification of a damage dimension for debonded compressed plates as introduced in [18]. Characteristic parameters, both geometric and material dependent, were investigated and discussed. A typical damage dimension was identified for design purposes. It was demonstrated that the general procedure remains the same also with the introduction of hybrid material or composites, obviously changing the numerical values. A general trend was identified regarding stiffness performance and material selection. The presence of a local critical load within the deboned skin introduces a condition of low stiffness for the plate, leading to a decrease in its global strength. This addresses the research interest in the investigation of the stress level within the bonded interface, caused by global and local interactions with the damage size under applied loads.
The present research activity is focused on the definition of the stress state for a compressed isotropic stiffened panel with bonded skin–stringer interface. The stress state is parametrized referring to the debonding dimension in order to derive a specific correlation to the referred load level and pointed out a new definition of the design criterion for such kind of situation.
Stress distribution in adhesive interface was developed by numerical FE models described in Section 2. Several parameters and details are reported and discussed. Critical behaviours are reported in Section 3 with an extensive discussion about a post-critical regime and correlated stress distribution in the bonded interface. The reported results are discussed in Section 4, both related to shear stress and the peeling stress distribution, in order to identify the most dangerous load-induced situation. Some conclusions and suggestions for future work were collected in Section 5.

2. Development of FEM
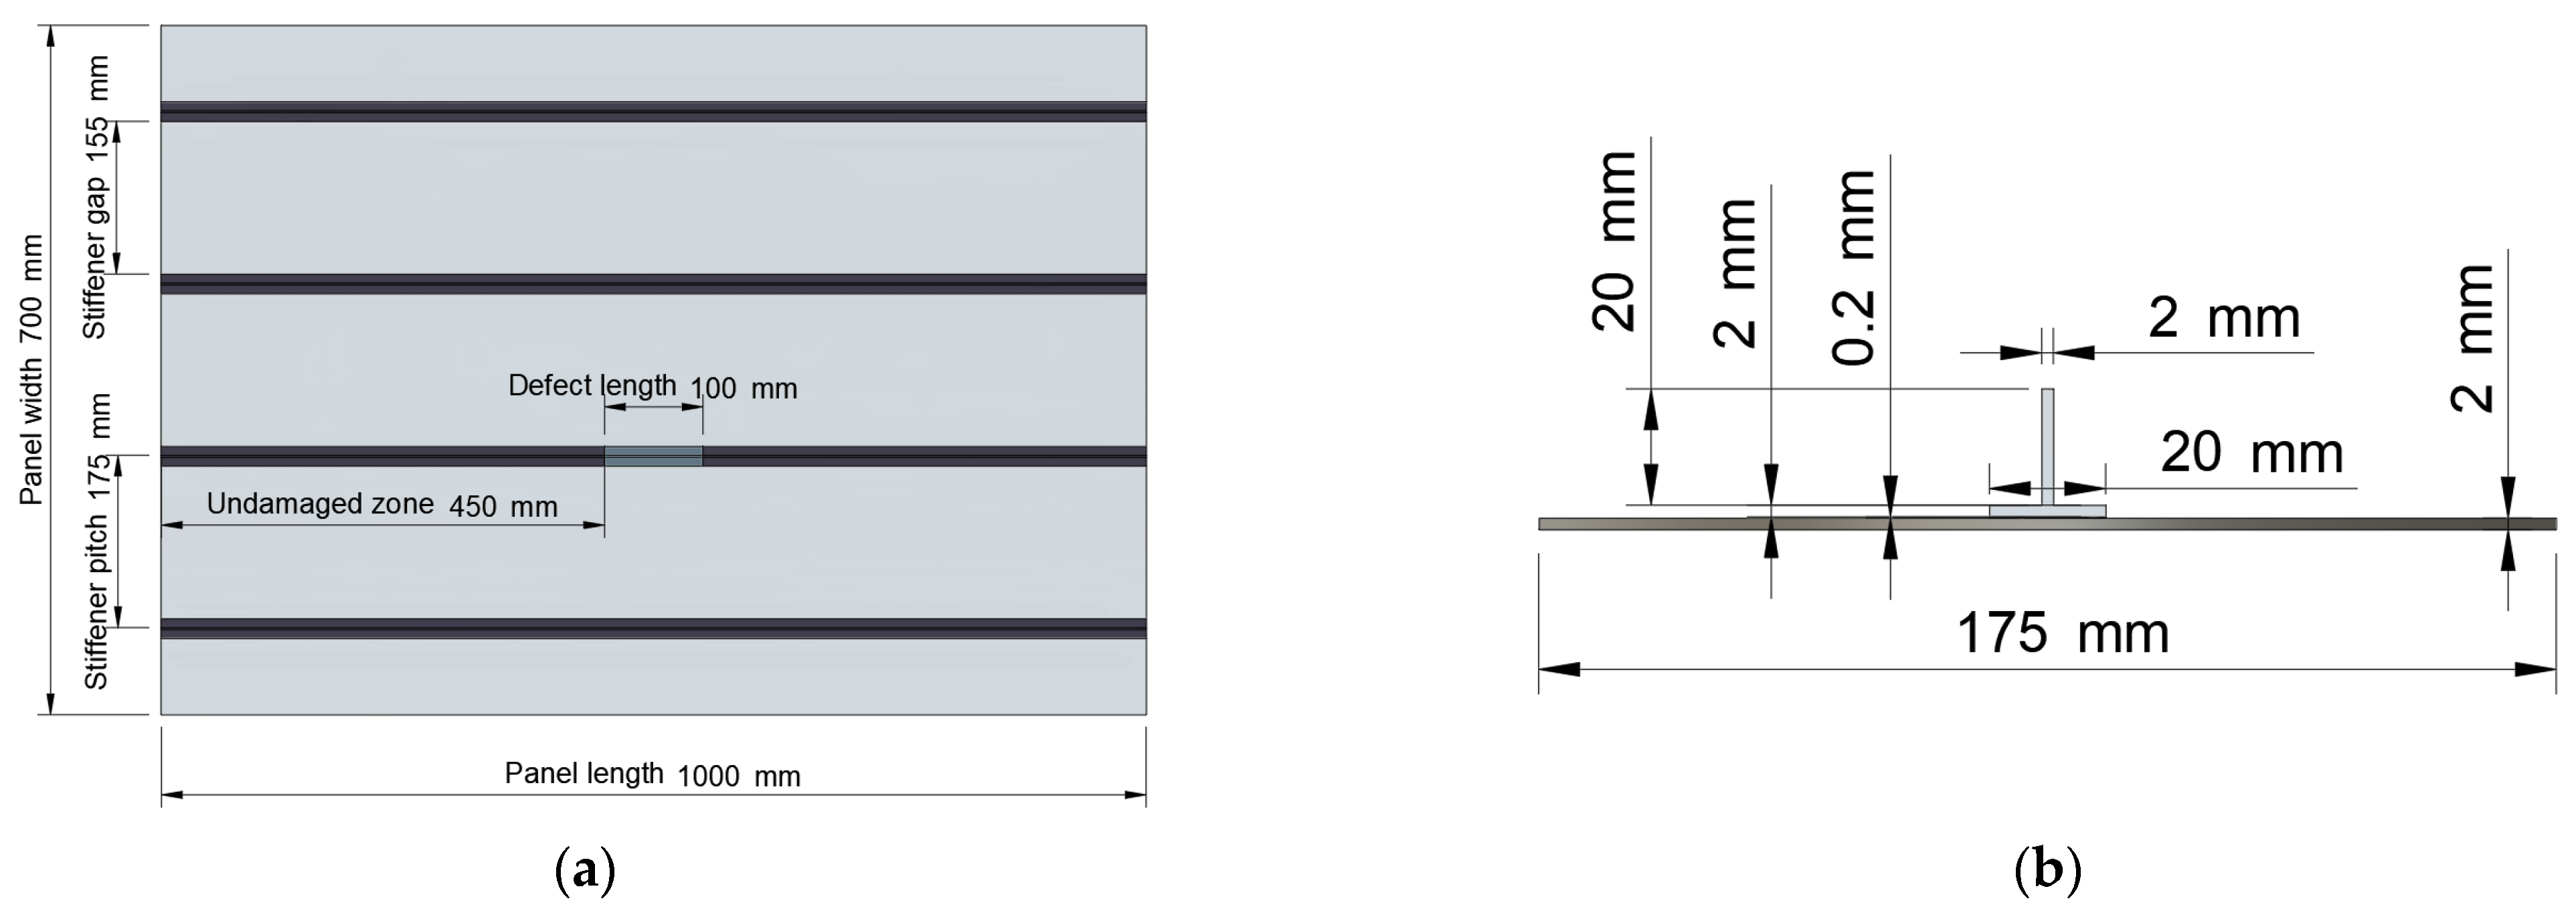
2.1. Model Geometry

The finite element model (FEM) was developed to represent a stiffened panel with T-section stiffeners adhesively bonded to the skin. The panel geometry is defined by a plate with dimensions of 1000 mm in length, 700 mm in width, and 2 mm in thickness. The skin is reinforced with four equally spaced stiffeners oriented along the length of the panel to increase the structural resistance to compressive loads. Each T-stiffener consists of a horizontal flange and a vertical web, both measuring 20 mm in width and 2 mm in thickness. The skin and stiffeners are bonded by a thin layer of adhesive, 0.2 mm thick, which ensures load transfer between the components.
A solid geometry of the structure, as shown in Figure 1, was created in MSC Patran 2023.1 [19], a software for pre- and post-processing of finite element structural analyses. The skin, adhesives, and stiffeners were modelled as solid bodies using the specified dimensions. The units of measurement used in FEM are those of the International System of Units (SI).

2.2. Material Properties

The materials used in the finite element model consist of an aluminum alloy for the plate and stiffeners, and an epoxy resin for the adhesive layer. The mechanical properties of these materials are presented in Table 1.
In MSC Patran, a linear elastic constitutive model was implemented for the aluminum alloy, while the adhesive behaviour was approximated using a bilinear model, incorporating both a linear elastic segment and an elastoplastic segment. The stress at yield and hardening slope values, listed in Table 1, were used to define the elastoplastic model of the adhesive.

2.3. Mesh

A solid mesh with Hex8 elements was created to model the geometry of the stiffened panel. In correspondence with the second stiffener, a debonding defect was introduced in the adhesive layer at the central region of the stiffener. This defect was modelled by removing the adhesive elements located in the damaged area. By using a parametric mesh, the model can be adapted to various defect sizes, ensuring an accurate representation for each damage configuration considered.
For example, considering a defect size of 100 mm, the resulting mesh configuration is shown in Figure 2a, including the boundary conditions applied to the structure.
As shown in Figure 2a, the mesh is regular in the areas far from the damage and becomes progressively finer near the stiffener with debonding and at the tip of the defect, in order to accurately capture the stress state at the defect tip.

2.3.1. Skin Mesh Size

The typical size of elements in the mesh of the plate is approximately 10 × 10 × 2 mm. In the transverse direction (y), near the stiffeners, a finer mesh is us
  • Mesh size of 10 × 2 × 2 mm for the intact stiffeners;
  • Mesh size of 10 × 1 × 2 mm for the stiffener with the debonding defect.
In the longitudinal direction (x), the grid becomes progressively finer toward the tip of the defect, following a symmetric pattern relative to the centre of the structure. The distribution of elements along the longitudinal direction is divided as follows:
  • Mesh size of 10 mm from the panel edge to 37 mm from the defect tip;
  • Four elements with a length of 5 mm;
  • Four elements with a length of 2 mm;
  • Six elements with a length of 1 mm;
  • Six elements with a length of 0.5 mm;
  • Mesh size of approximately 10 mm up to the centre of the structure.

2.3.2. Adhesive Layer Mesh Size

The adhesive grid follows the same pattern as the skin of the structure. The adhesive layer in the debonding region is modelled using two solid elements through its thickness, unlike the other layers, which are modelled with only one element.

2.3.3. Stiffener Mesh Size

The horizontal flange of the stiffeners features a mesh with dimensions like those of the adhesive, characterized by the use of a single solid element through the thickness.
The vertical flange, on the other hand, has a typical mesh size of approximately 10 × 2 × 5 mm, which becomes finer in the damaged area. Similarly, the web uses a single solid element through the thickness, except for the stiffener with debonding, where two solid elements are used for compatibility with the adhesive layer mesh.

2.3.4. Mesh Convergence

Mesh refinement was considered in the present investigation with respect to the previous simulations as in [16,17] in order to ensure the accuracy of the results. It was observed that using the actual finer mesh resulted in no significant improvements. The presented mesh selection was selected as a satisfactory compromise between accuracy and computational time effort. Compared to [17], the mesh at the apex of the defect is twice as refined in all three dimensions of the solid elements. Additionally, the extent of the refined zone at the defect apex is approximately three times larger.

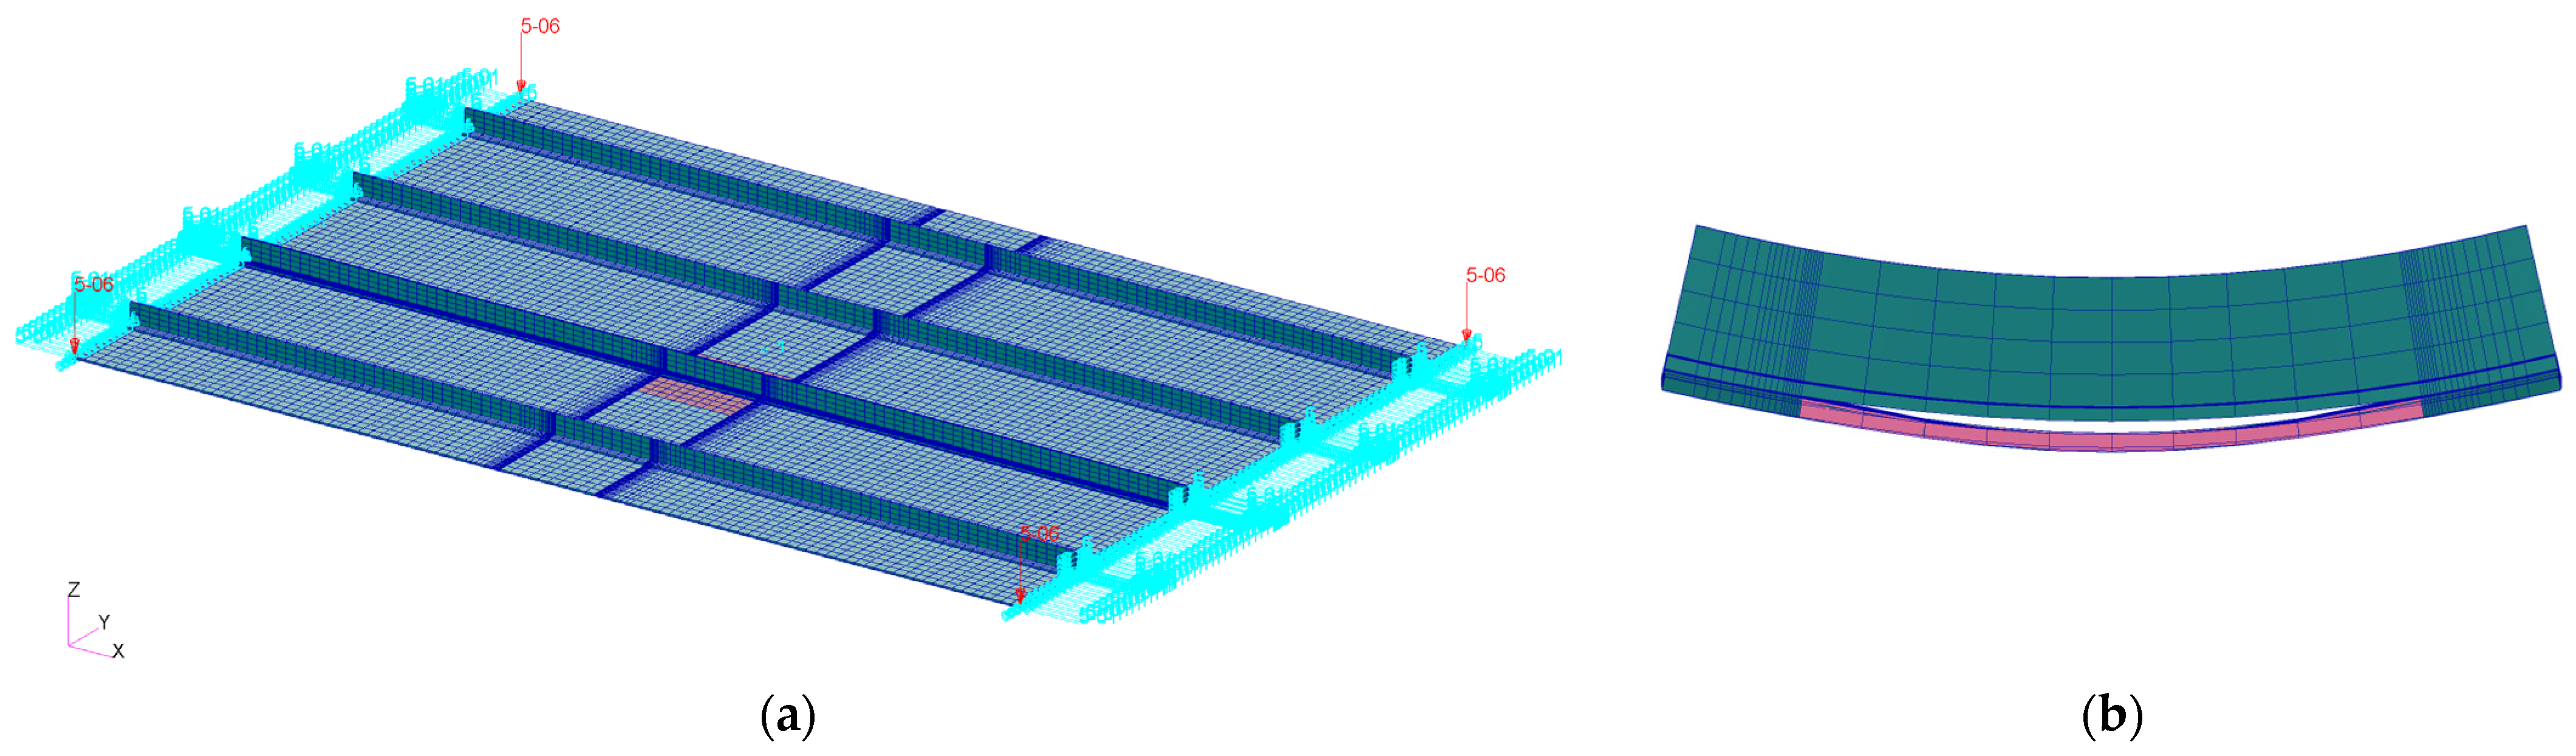
2.4. Boundary and Loading Conditions

It is assumed that the boundary conditions of the structure are edges clamped, and the sides are simply supported. The stiffened panel is subjected to uniaxial compression applied at the ends, simulated in FEM by imposing displacements on the nodes.

2.4.1. Boundary Conditions

The boundary conditions applied to the model are as follows:
  • The central node of the plate is constrained in the longitudinal direction to prevent unwanted translations along the main axis (x). While not entirely accurate for the damaged structure, this condition is necessary to ensure the analysis can be performed.
  • Two nodes of the plate, located at the central region of the end sections, are constrained in the lateral direction (y) to fix transverse rigid displacement.
  • The nodes along the four edges of the plate are constrained to prevent vertical displacement (z), simulating a simple lateral support.

2.4.2. Loading Conditions

The loading conditions applied are as follows:
  • A total displacement of 1 mm is imposed on the nodes at the end sections, evenly distributed as 0.5 mm at each end, to apply a uniform compressive load.
  • A perturbation of 5 Pa is applied (only for static nonlinear analyses) to the lower surface of the plate, oriented downward.
The boundary conditions described in this section are illustrated in Figure 2a.

2.5. FEM Analysis

Finite element method (FEM) analysis is a keystone in evaluating the structural integrity of stiffened panels, especially when assessing buckling phenomena and post-buckling behaviour. In this study, analyses were conducted using MSC Nastran 2023.1 [20], a robust and widely adopted FEA software for simulating mechanical behaviour under various conditions. Two primary analyses were performed, linear buckling analysis and nonlinear static analysis, both providing critical insights into the structural response while considering different defect sizes.

2.5.1. Linear Buckling Analysis

Linear buckling analysis is essential for predicting the critical load at which a structure becomes unstable due to buckling. This type of analysis was conducted using Solution 105 (Sol 105) of MSC Nastran, which solves an eigenvalue problem to determine the critical load factors. The buckling load factor (BLF), a dimensionless value, represents the ratio between the critical load and the applied load, providing a clear measure of how close the structure is to instability. The theoretical foundations of the BLF are well documented in [21,22], which explains its role in determining structural stability, and in [23], where its application to complex geometries is discussed. This analysis also identifies characteristic buckling modes, which describe the deformation patterns the structure may adopt upon buckling. Such insights are particularly useful for distinguishing between global and local buckling phenomena, offering valuable information on structural stability.
Analytical approaches for predicting the critical buckling load of stiffened panels typically involve simplifying assumptions, such as idealized boundary conditions and isotropic material properties. For instance, ref. [24] presented an analytical solution for evaluating the elastic buckling behaviour of rectangular stiffened panels subjected to uniform uniaxial in-plane compression, accounting for different boundary condition configurations to improve the reliability of the results. Additionally, ESDU 80023 [25] provides a structured procedure for determining the critical buckling load of specially orthotropic stiffened panels. The methodology defines the buckling loads based on plate geometry and flexural stiffnesses under various edge conditions, including uniaxial or biaxial compression and shear. It also offers criteria to verify whether through-thickness shear stiffness is sufficient to control buckling, ensuring the accuracy of the analysis. This approach can be extended to isotropic panels by treating them as special cases of orthotropic materials, offering a unified framework that enhances the versatility of analytical methods and allows application across diverse material configurations and geometries.
Experimental investigations have extensively explored the buckling and post-buckling behaviour of stiffened panels, focusing on both composite and metallic configurations. Numerous studies [22,26,27,28,29,30] have examined deformation patterns, failure mechanisms, and the influence of defects on structural stability in stiffened panels. These experiments highlight the critical role of defects in buckling behaviour and provide essential data to validate numerical models and theoretical predictions, contributing to the calibration and improvement of finite element simulations.
Based on the theoretical concepts related to buckling theory, and particularly referring to the techniques described in [25], the numerical results presented in this study are comparable with the analytical results evaluated and described in [17].

2.5.2. Nonlinear Static Analysis

Nonlinear static analyses were performed with Solution 400 (Sol 400) [20], which is designed to capture the structural response in the presence of large deformations, material nonlinearities, or contact interactions. These analyses provide detailed insights into the behaviour of the structure when the critical load is exceeded, focusing on the stress distribution in the adhesive at the defect tip.
While linear buckling analysis is a simplified, linearized method that predicts only the critical load level and the corresponding buckling mode shape, nonlinear static analysis represents the exact solution of the equilibrium conditions for the structure. This allows for a comprehensive evaluation of the post-buckling response and the development of instability phenomena.
To achieve accurate results, the nonlinear static analyses were performed with load increments of 0.025 mm for a total of 40 steps. Incremental loading is necessary in nonlinear analyses to simulate the gradual response of the structure as the load increases. This increment size was chosen to ensure sufficiently small steps, allowing for the precise identification of the various instability phenomena occurring within the structure as the load level increases.

3. Results

This section presents the results of the linear buckling and nonlinear static analyses performed using the refined FEM detailed in Section 2. These analyses focus on the critical conditions as a function of the damage size and the stress state that develops in the adhesive at the tip of the defect beyond the critical load level.
While some graphs and figures may resemble those in [17], they are more accurate and highlight the improvements introduced by the refined model.

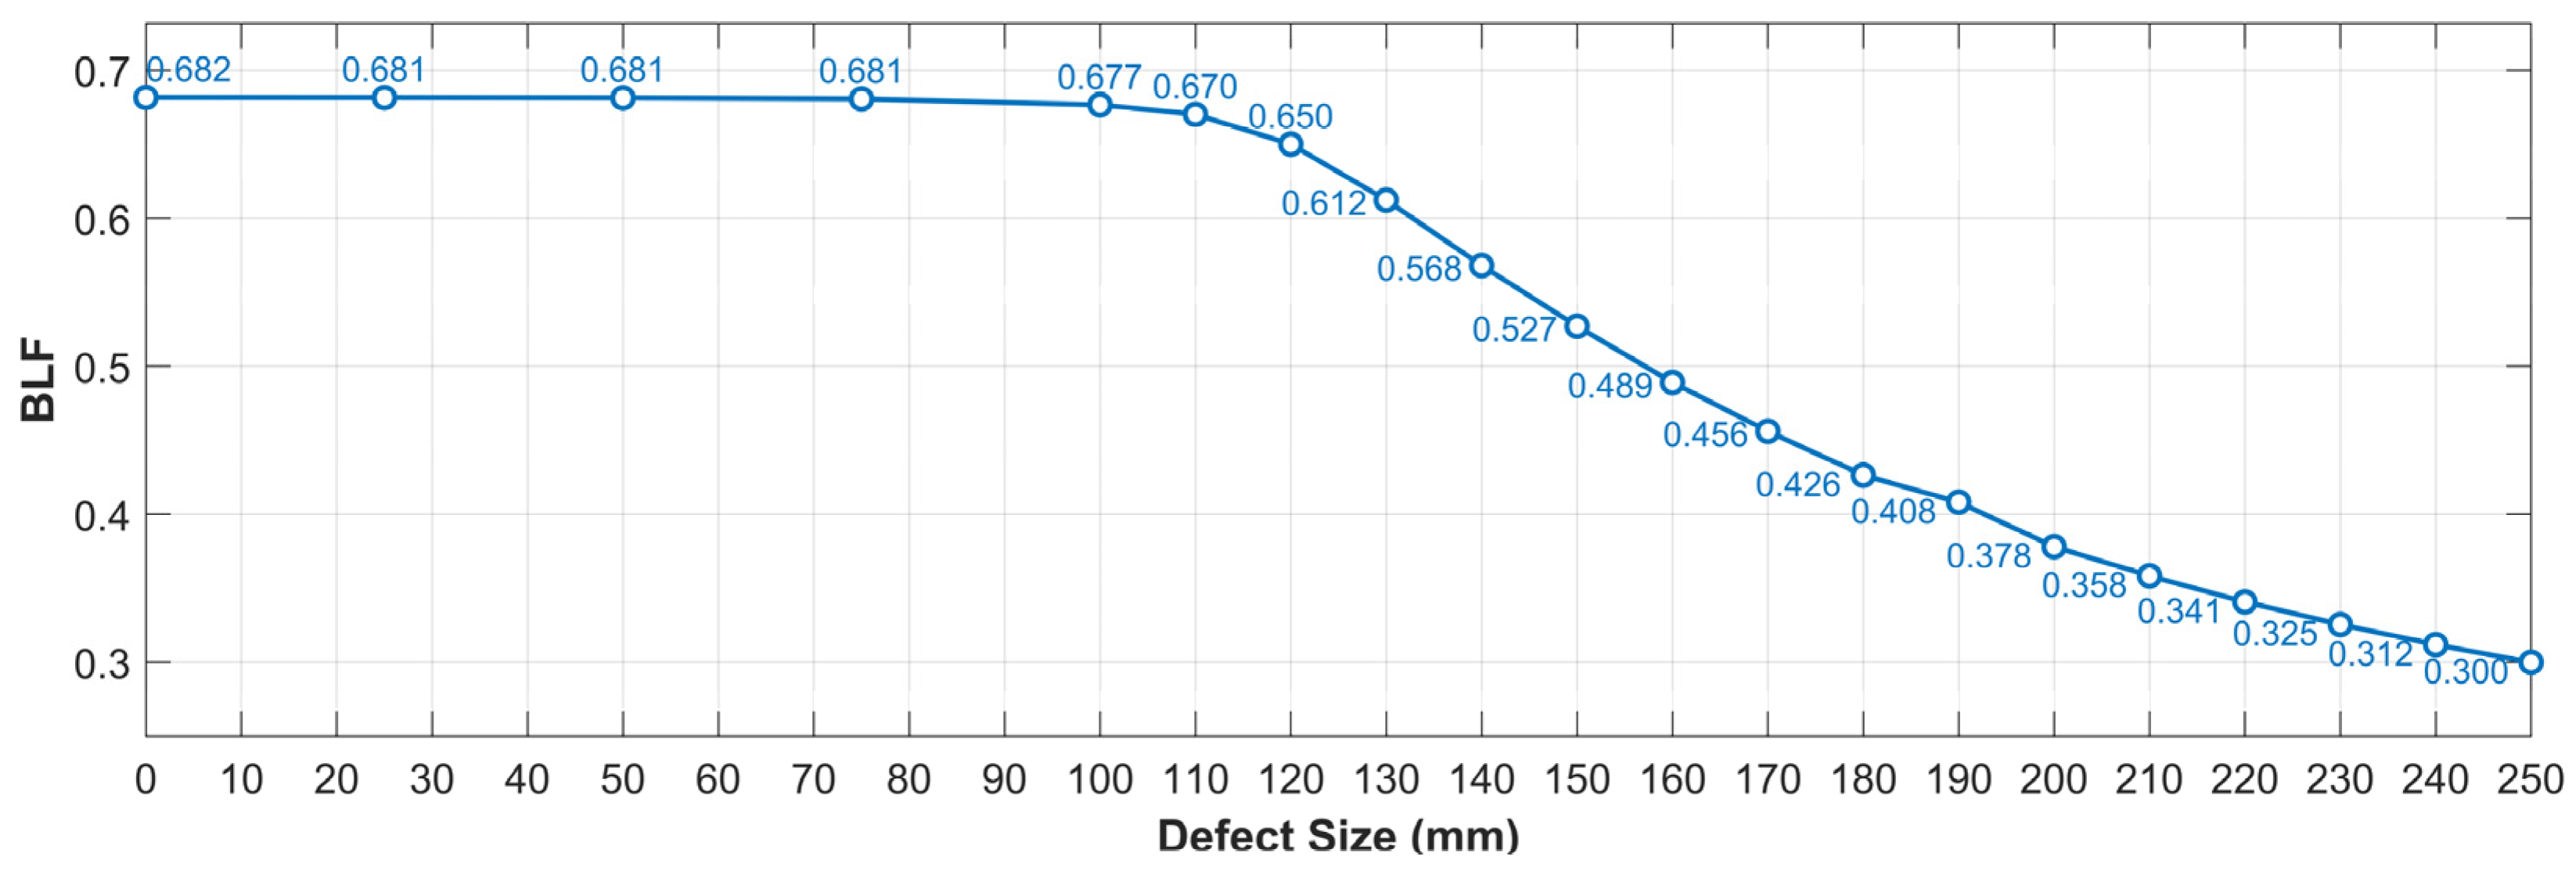
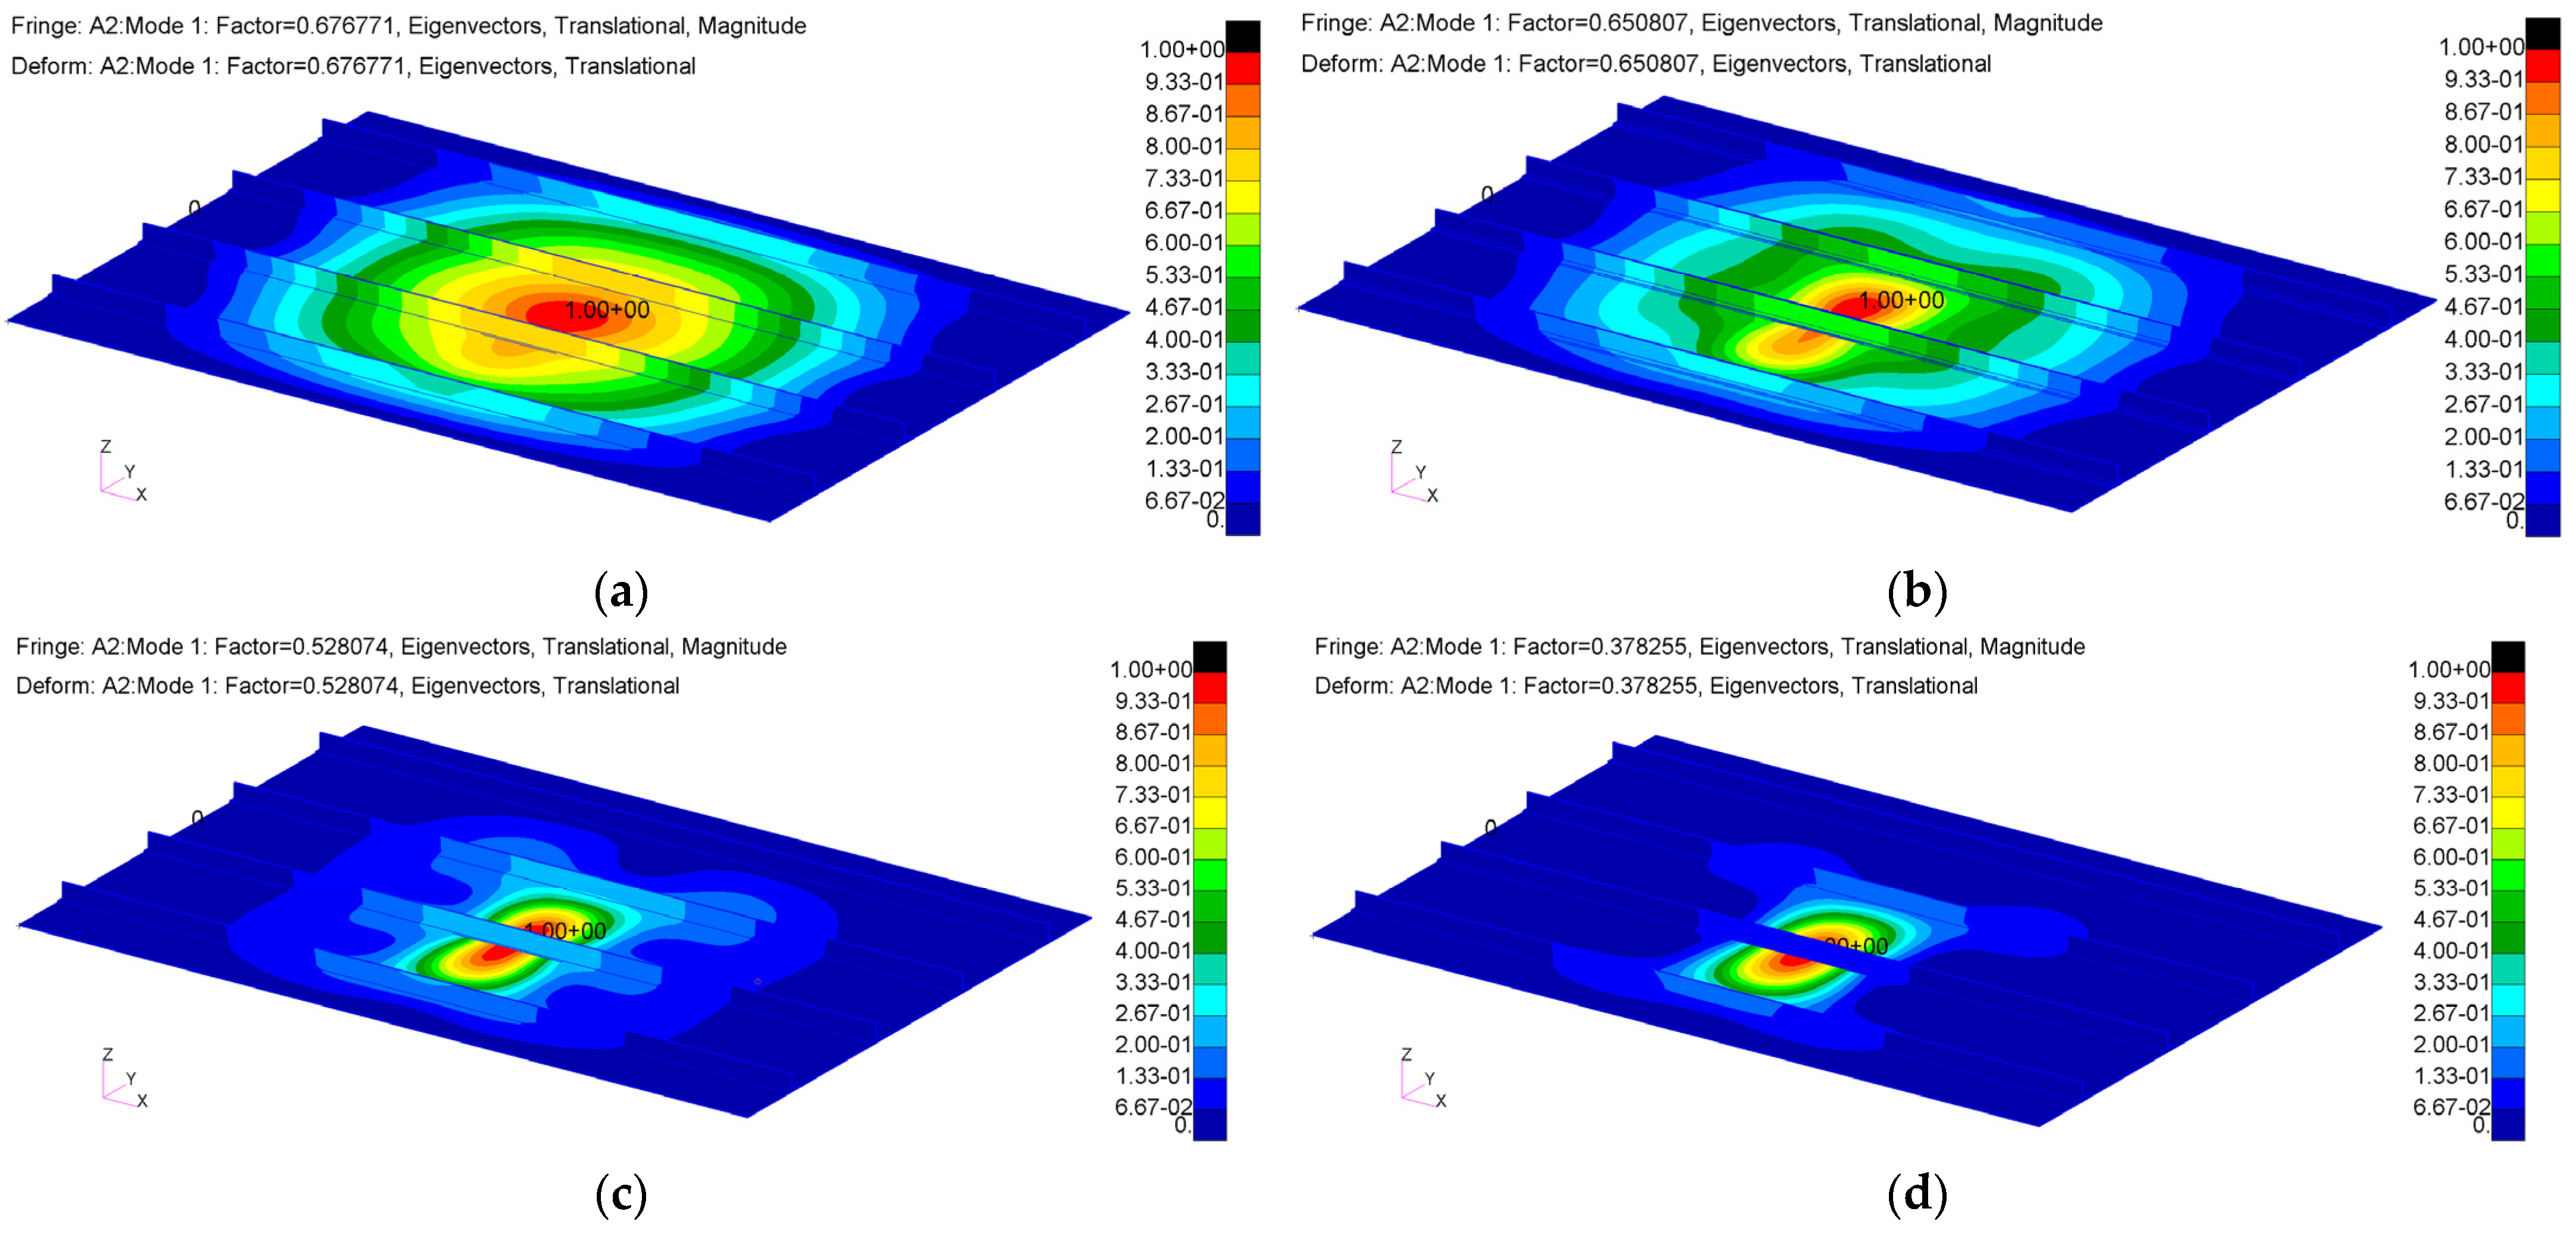
3.1. Critical Conditions

The linear buckling analyses conducted using MSC Nastran’s Sol 105 reveal a progressive decrease in the critical load of the structure as the damage size increases. Beyond a defect size of approximately 100 mm, this reduction becomes particularly significant, as shown in Figure 3.
In this analysis, the buckling load factor (BLF) also represents the critical displacement of the structure, as the total imposed displacement is unitary and equal to 1 mm.
In addition to the reduction in the critical load, a significant change in structural behaviour can be observed in Figure 4, which depicts the buckling shapes corresponding to the minimum eigenvalue for various defect sizes, normalized with respect to the maximum displacement.
For small defect sizes, as shown in Figure 4a, the first buckling mode primarily exhibits global instability, involving the entire structure. However, a slight local effect is evident near the debonding area, highlighted by the non-uniform colour pattern around the defect.
As the defect size increases, the local phenomenon becomes more prominent. Figure 4c,d demonstrates that the first buckling mode becomes increasingly localized, with the instability concentrated almost entirely around the defect region.
This transition from global to local instability is caused by the defect’s growing influence on the load distribution, which alters the load paths and concentrates stresses near the defect, leading to significant changes in the structural response.

3.2. Stress State at Tip of Defect

It is important to note that FEM does not account for fracture or defect propagation within the adhesive layer, phenomena that could occur when the local stress distribution reaches the material fracture toughness. Therefore, the graphs presented below represent the behaviour of the model, which may differ from the actual behaviour of the structure beyond a certain load level if fracture initiation and propagation were included into the analysis. Nevertheless, they remain significant for the scope of the article in order to arrive to a design criterion for damaged stiffened plates.

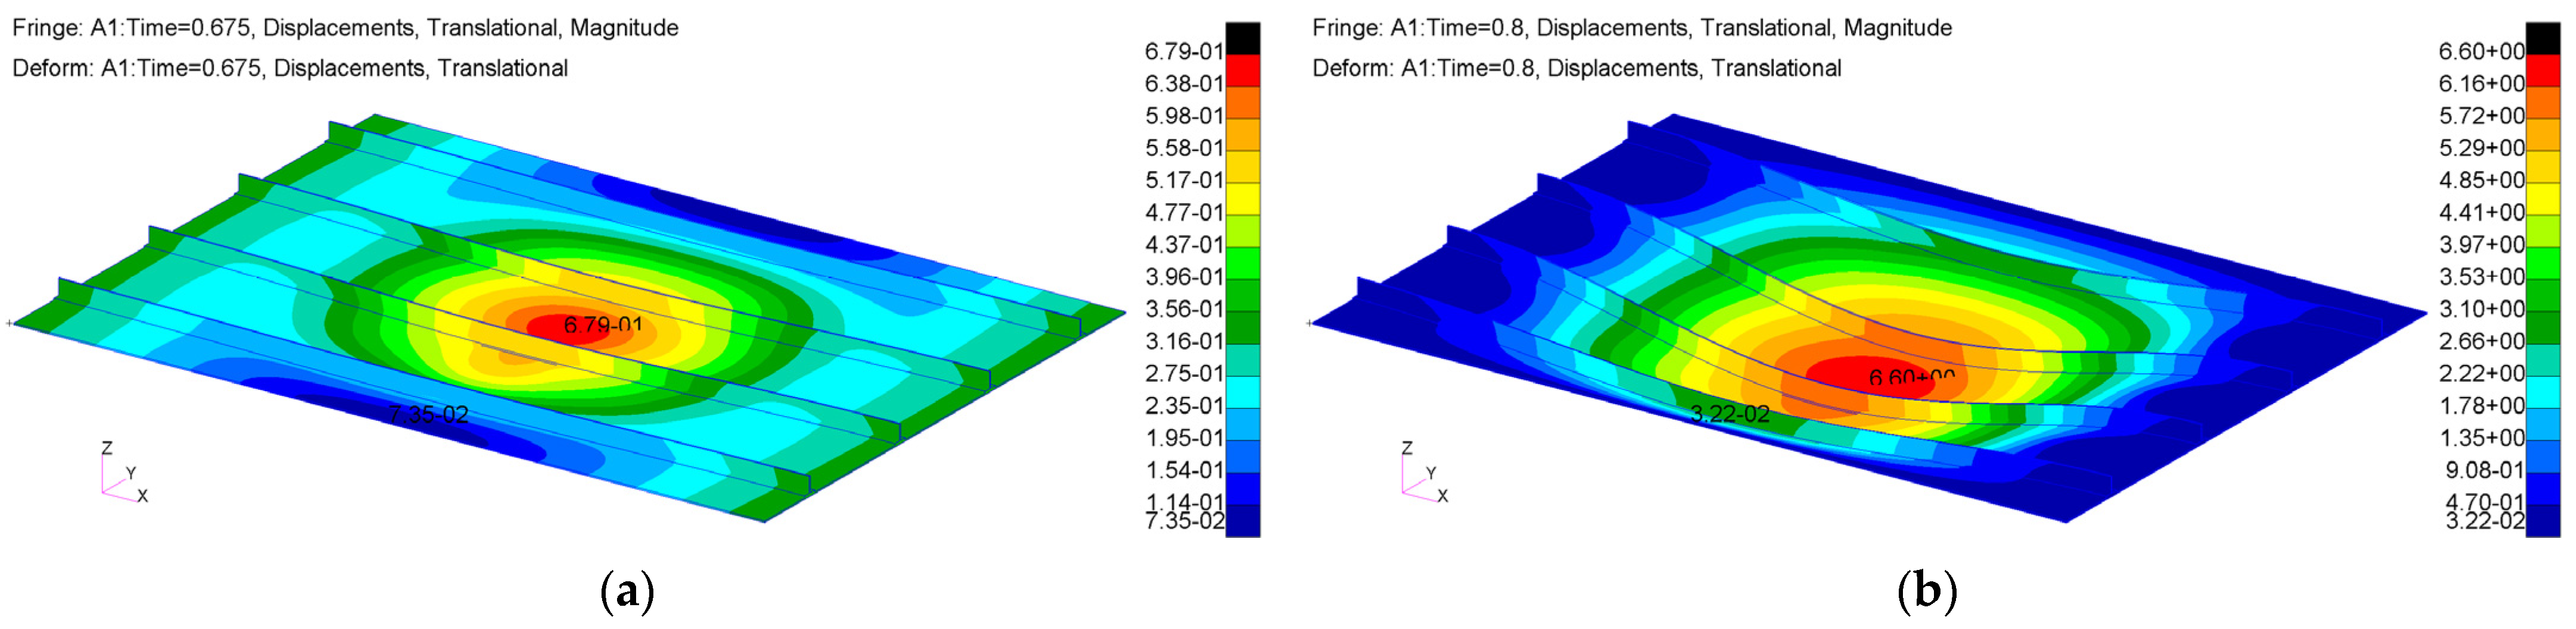
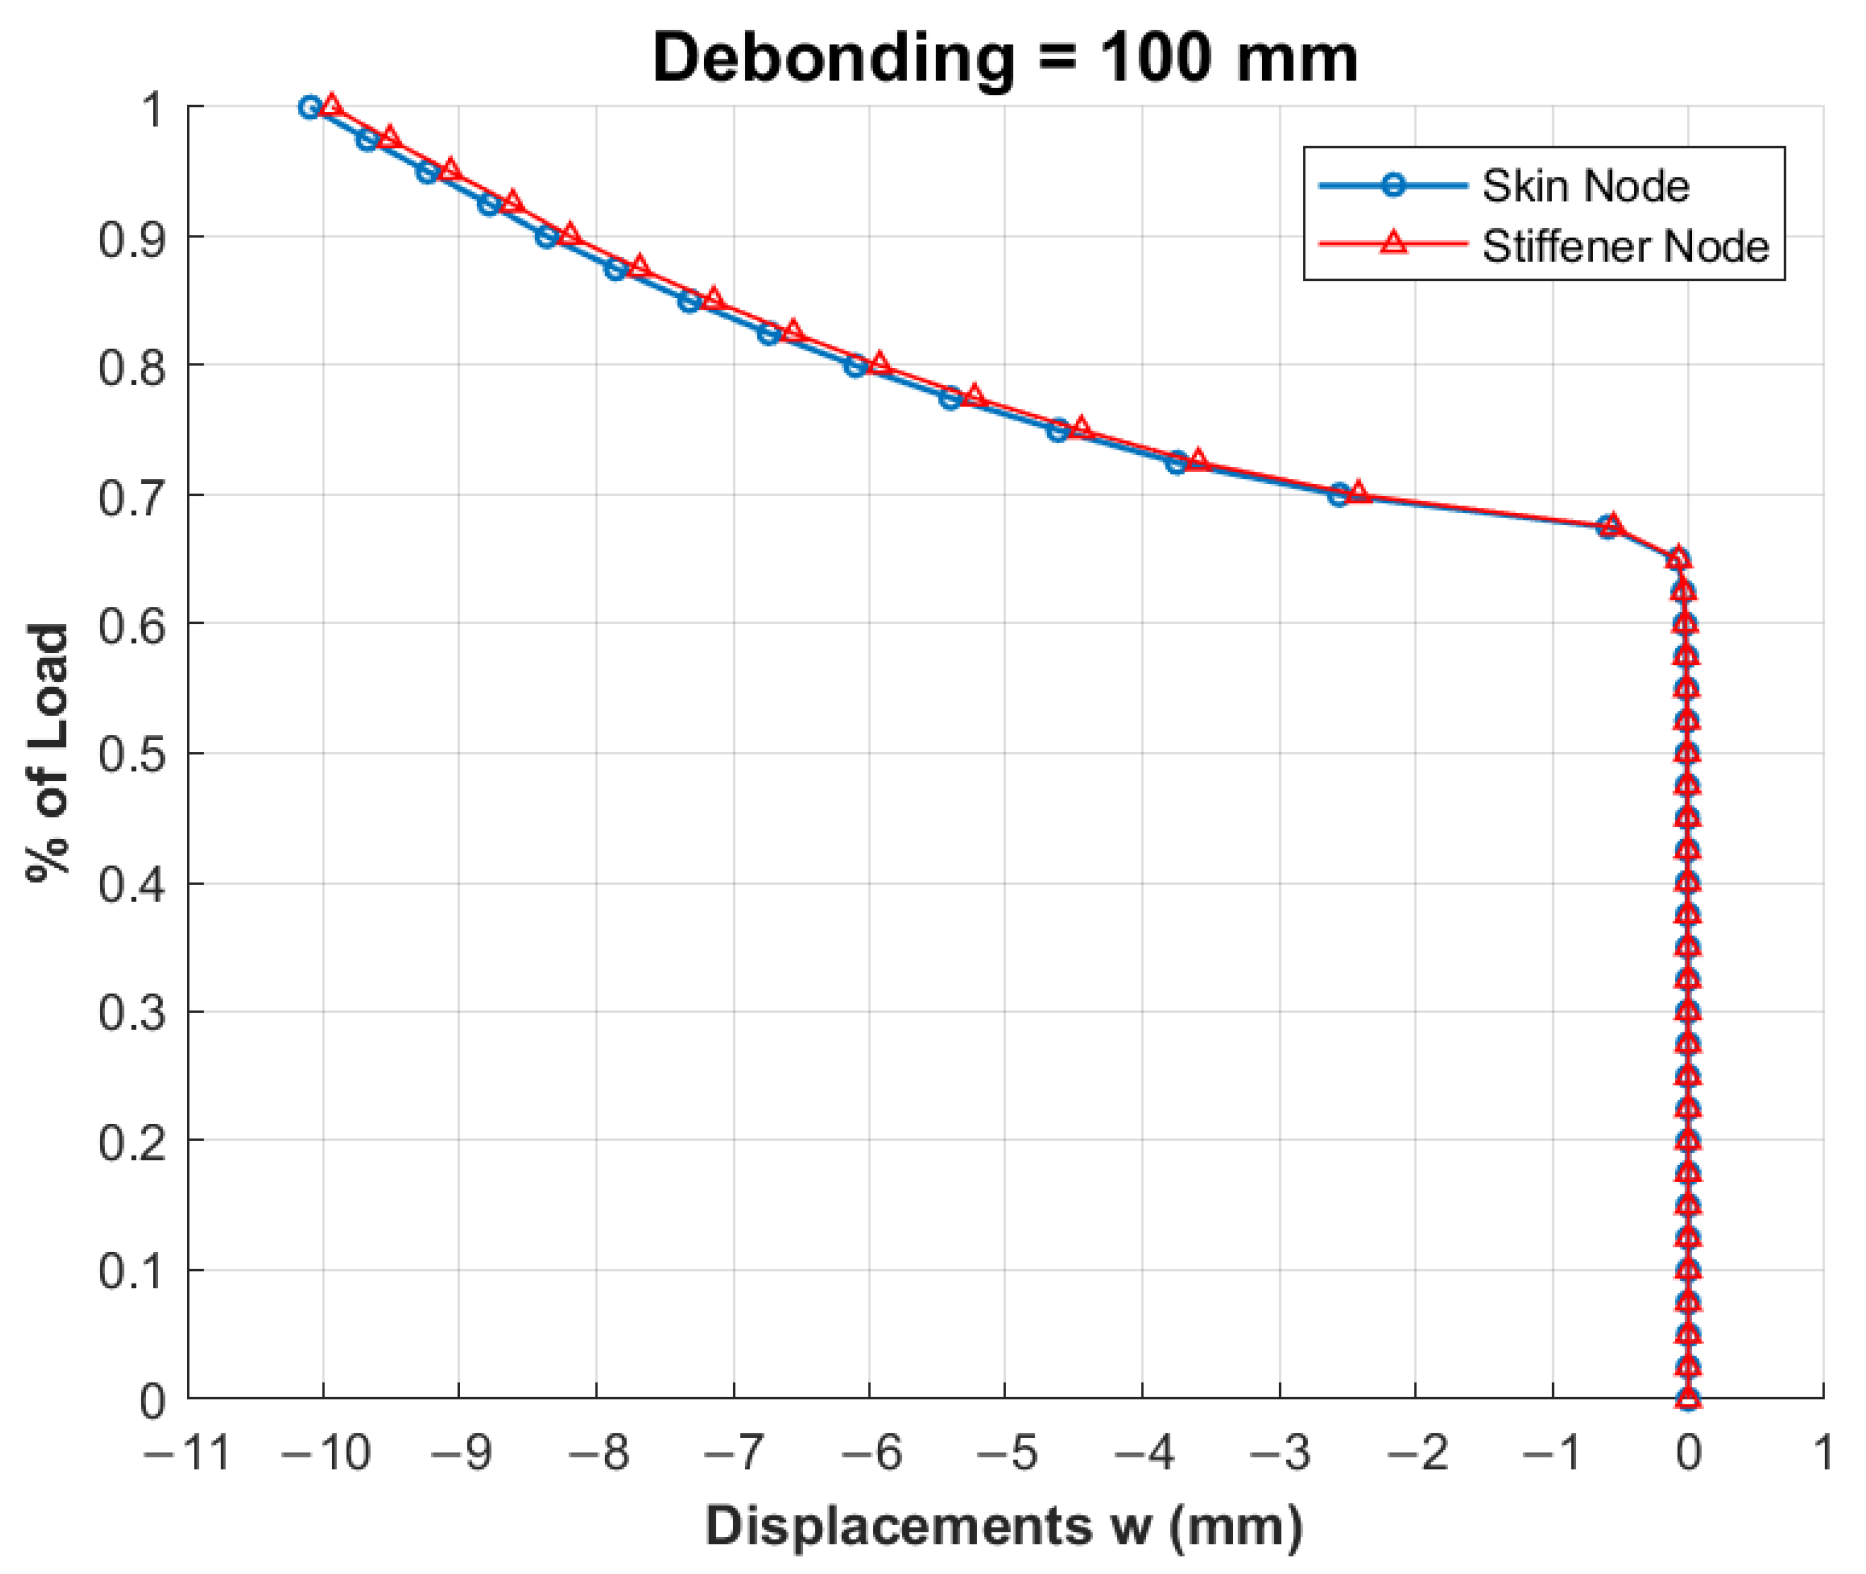
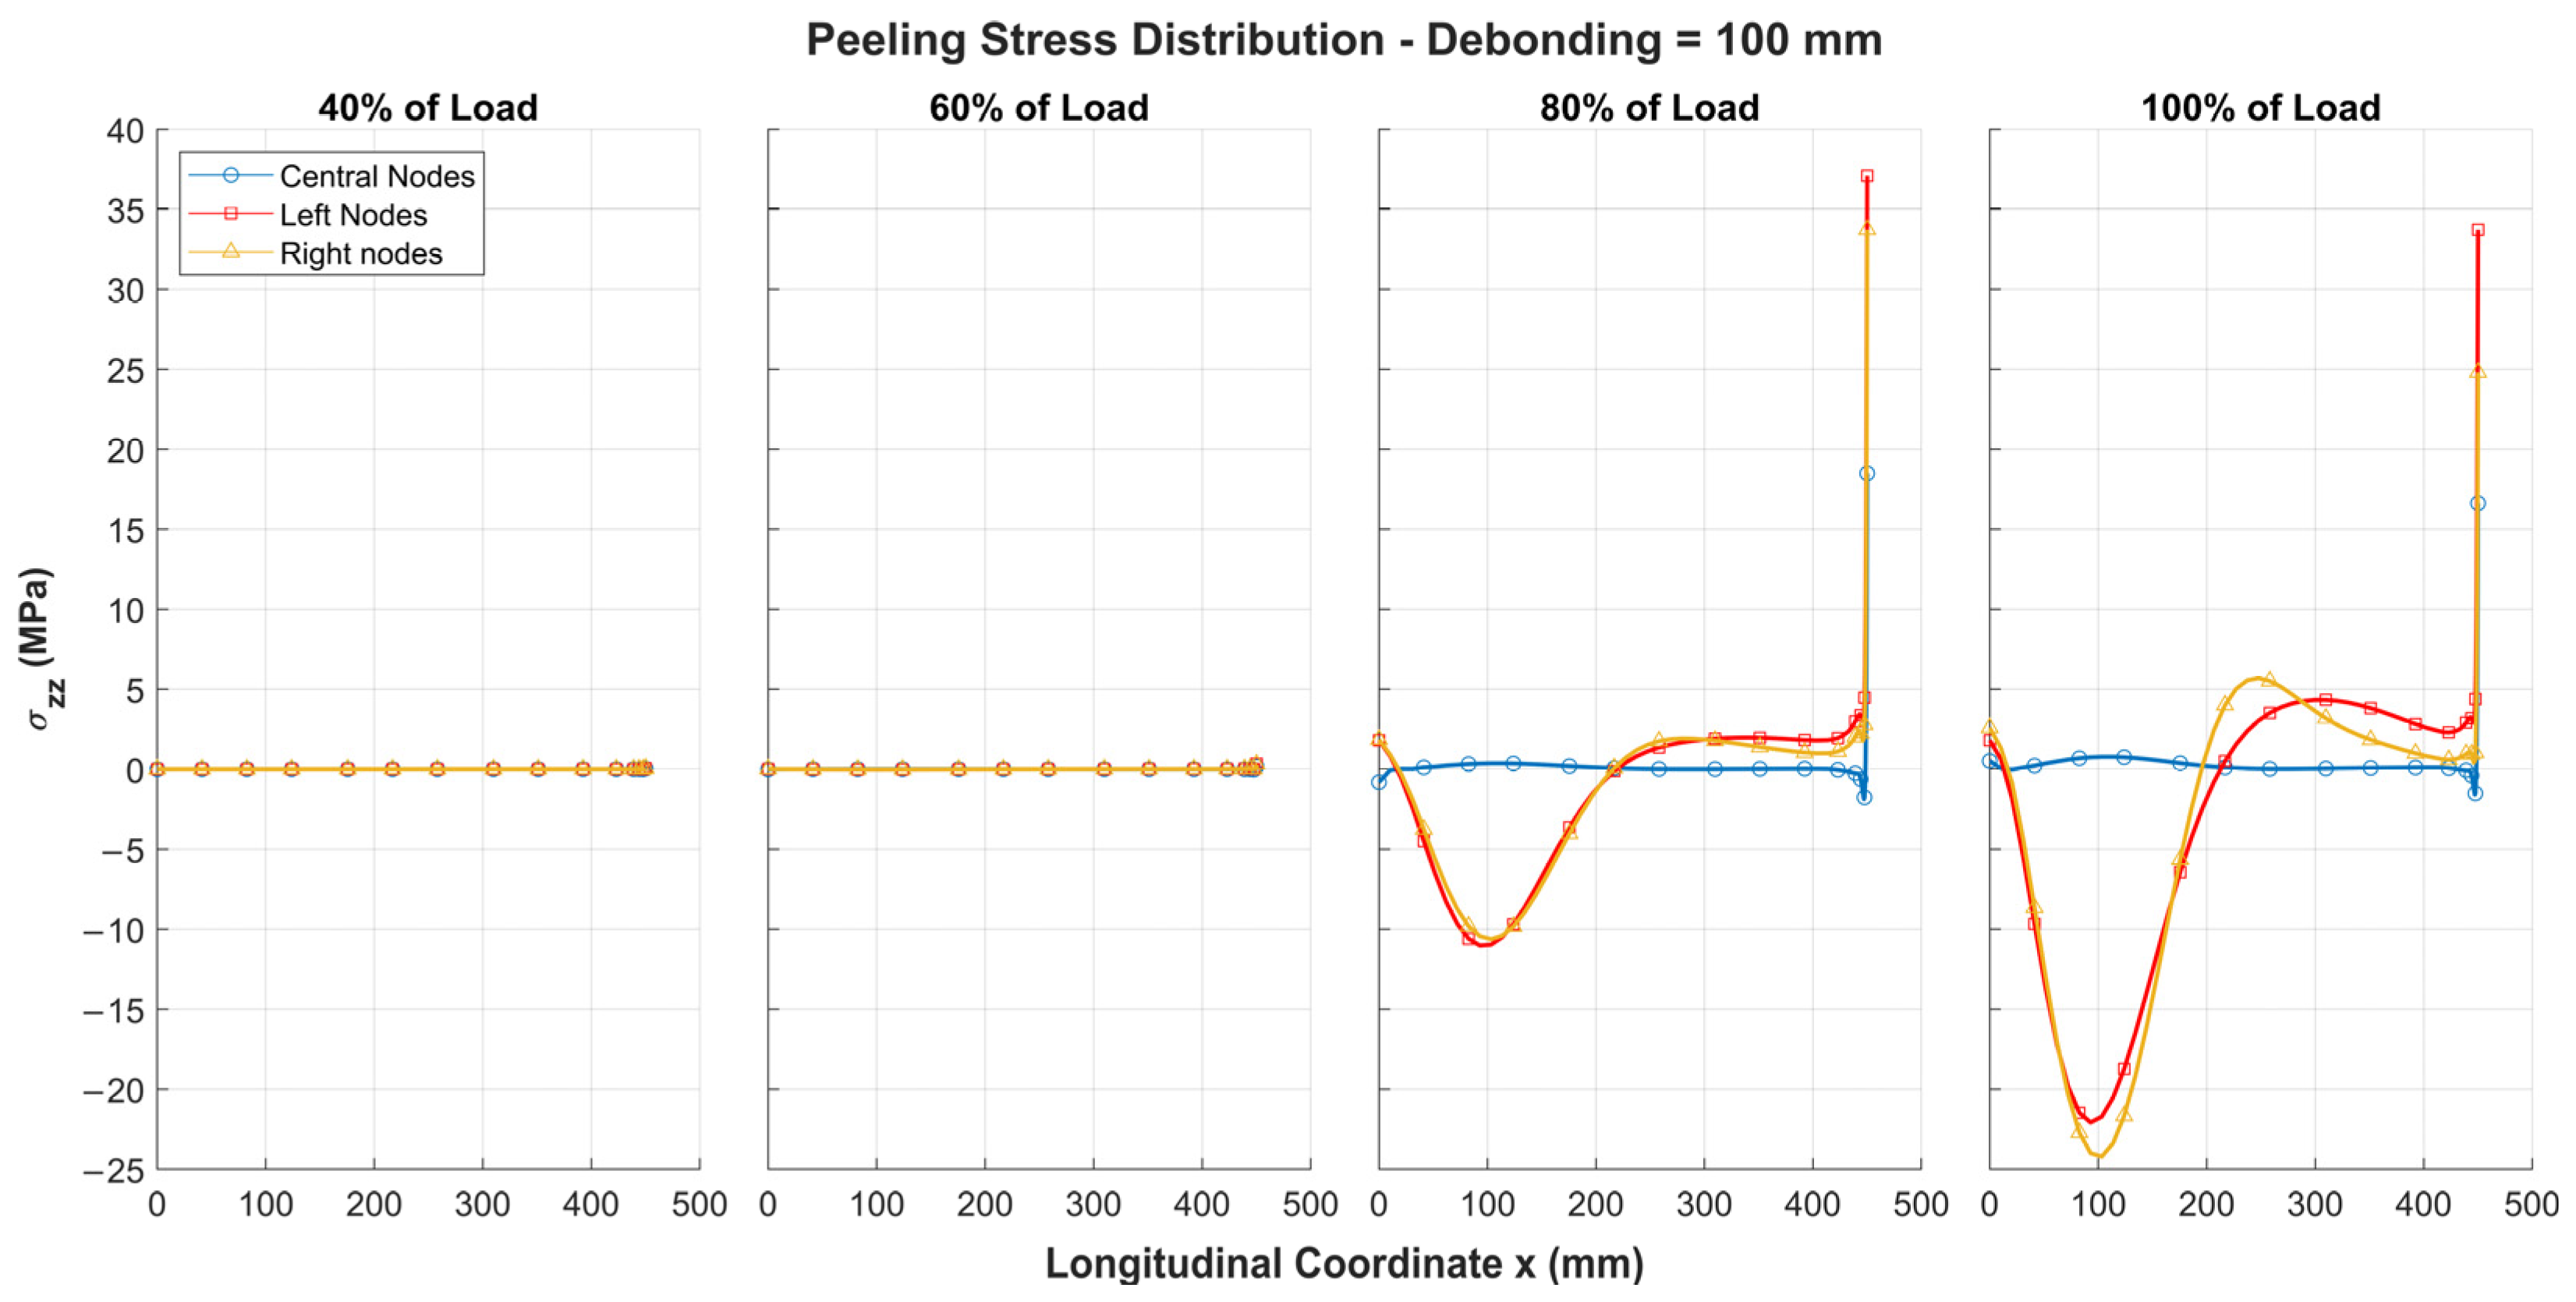
3.2.1. Configuration with 100 mm Debonding

Through a nonlinear static analysis performed with MSC Nastran’s Sol 400, the displacements and stresses in the adhesive were evaluated as the debonding size varied. For a configuration with a 100 mm defect, the analysis results, in terms of displacement, are shown in Figure 5.
At the critical load level, the structure exhibits global buckling, accompanied by very slight local effects in the damaged area. This behaviour is illustrated in the graph of Figure 6, which shows the out-of-plane displacement trend for two nodes, one on the skin and one on the stiffener, both located at the centre of the defect (100 mm), as the load level increases.
Figure 7 shows the peeling stresses along half of the adhesive layer for a 100 mm debonding, under load conditions of 40%, 60%, 80%, and 100% of the applied load. Since the stress distribution is symmetric about the structure’s centreline, only half of the distribution is displayed to simplify the representation.
The peeling stresses along the adhesive are evaluated at nodes located at the mid-thickness of the adhesive layer. Specifically, three types of nodes are analyzed.
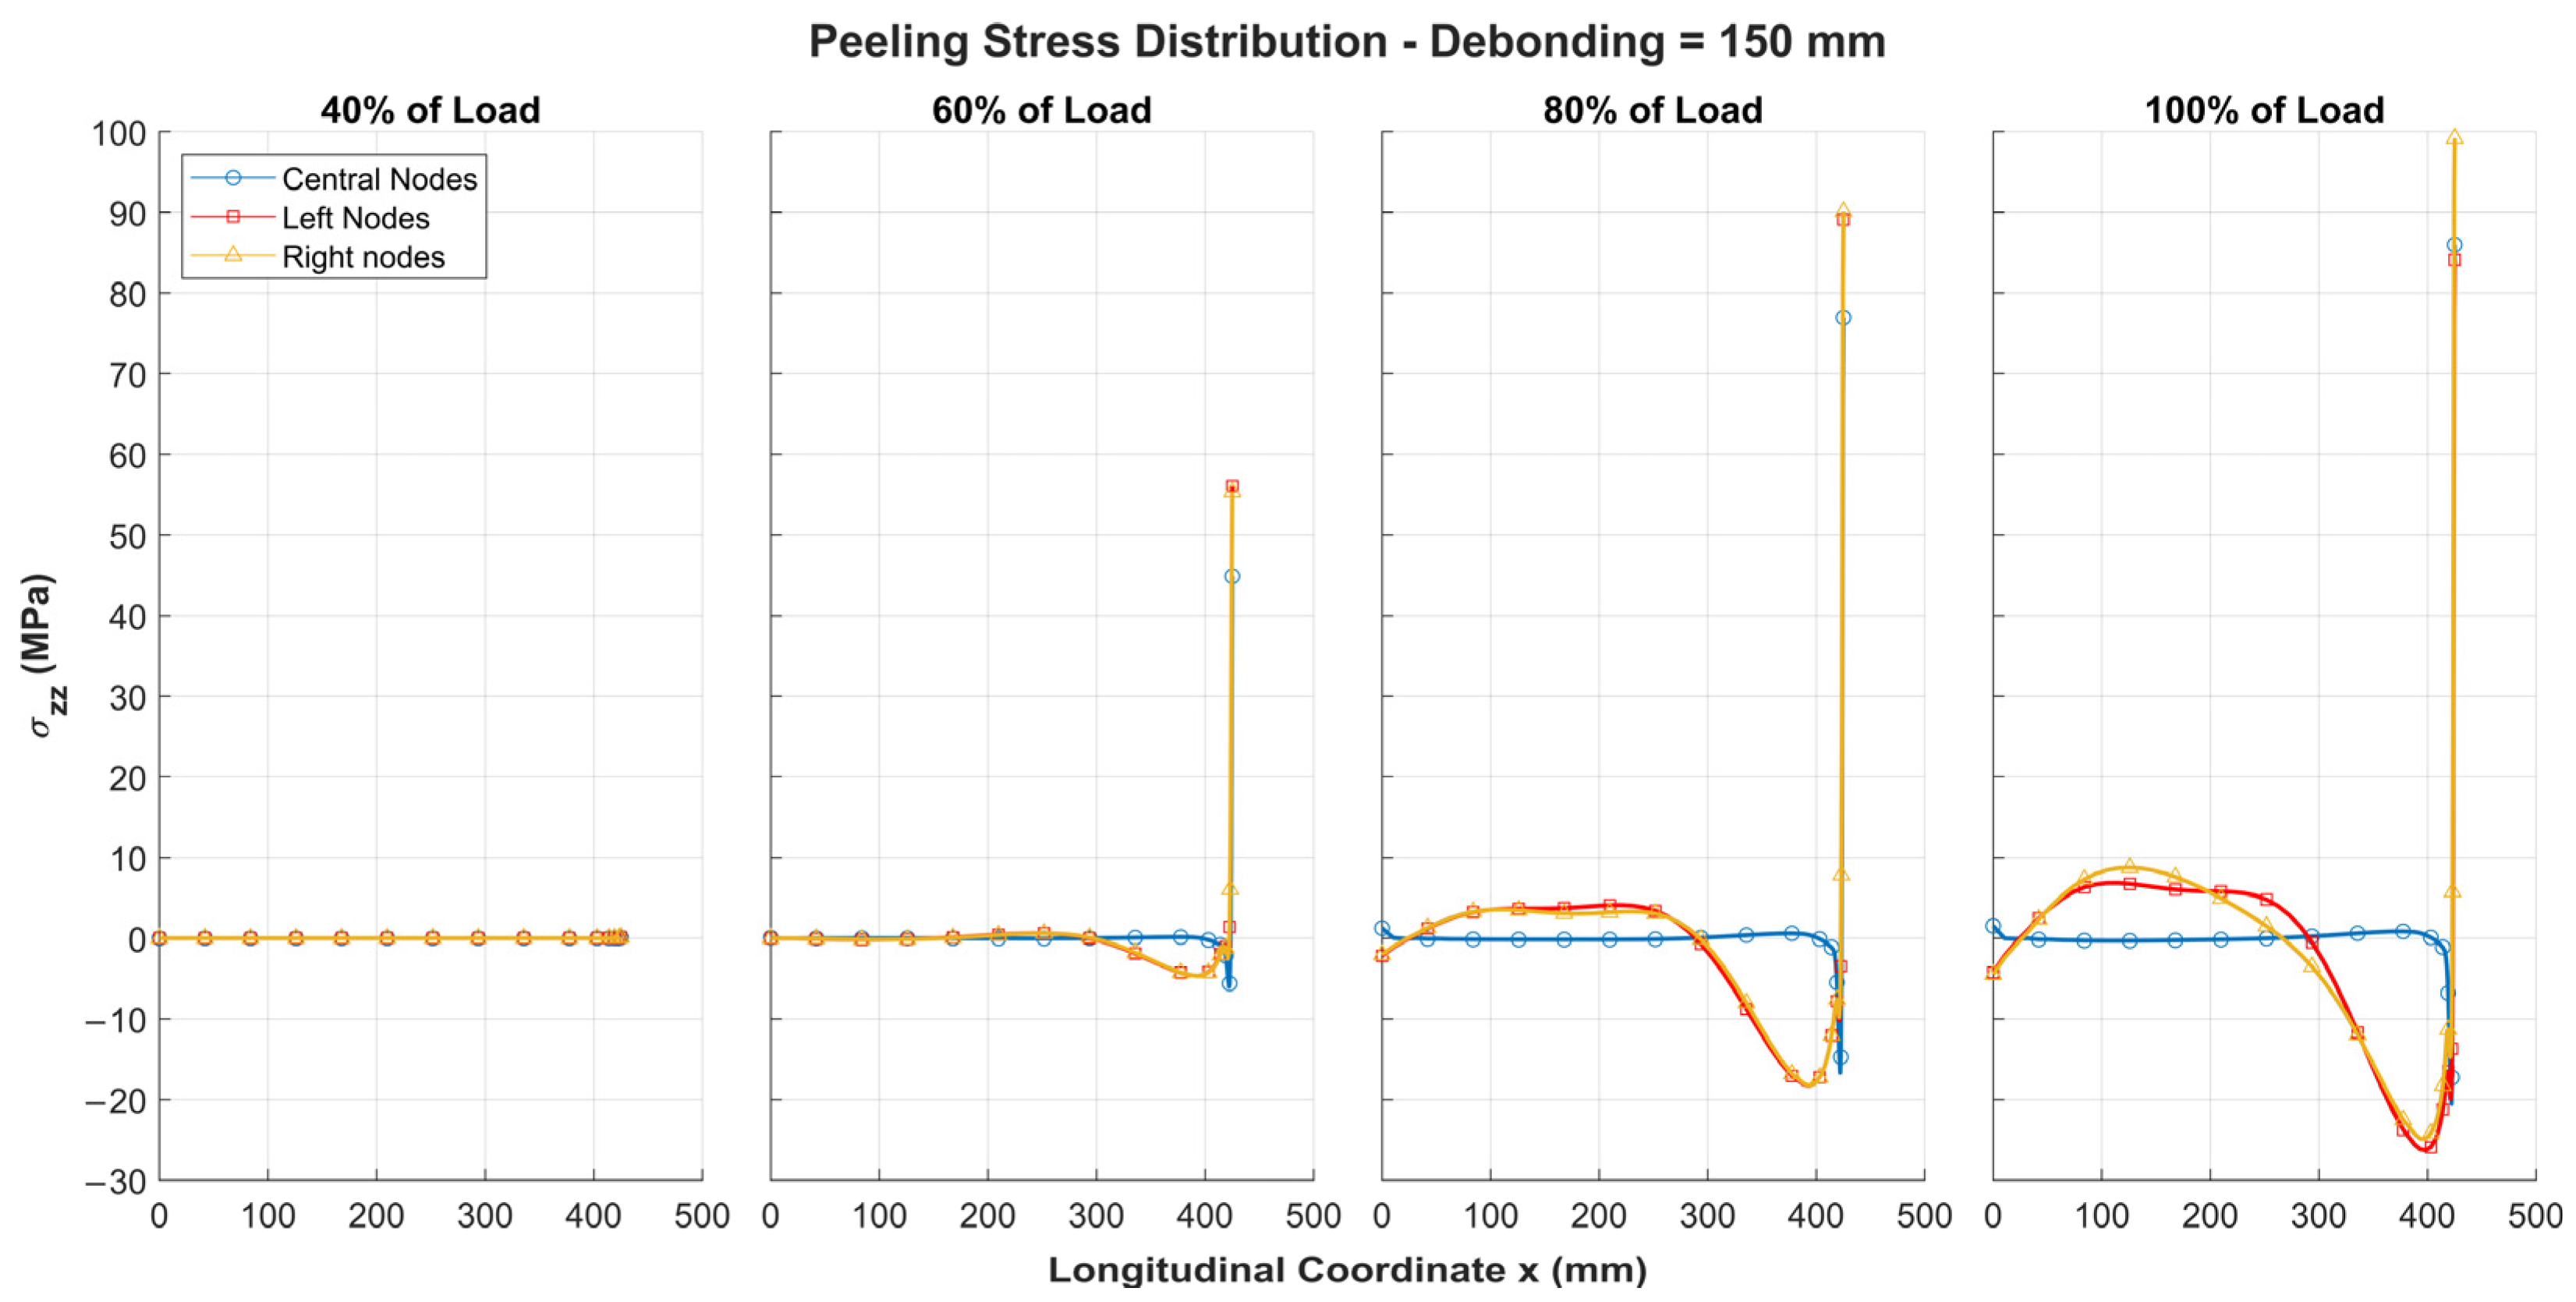
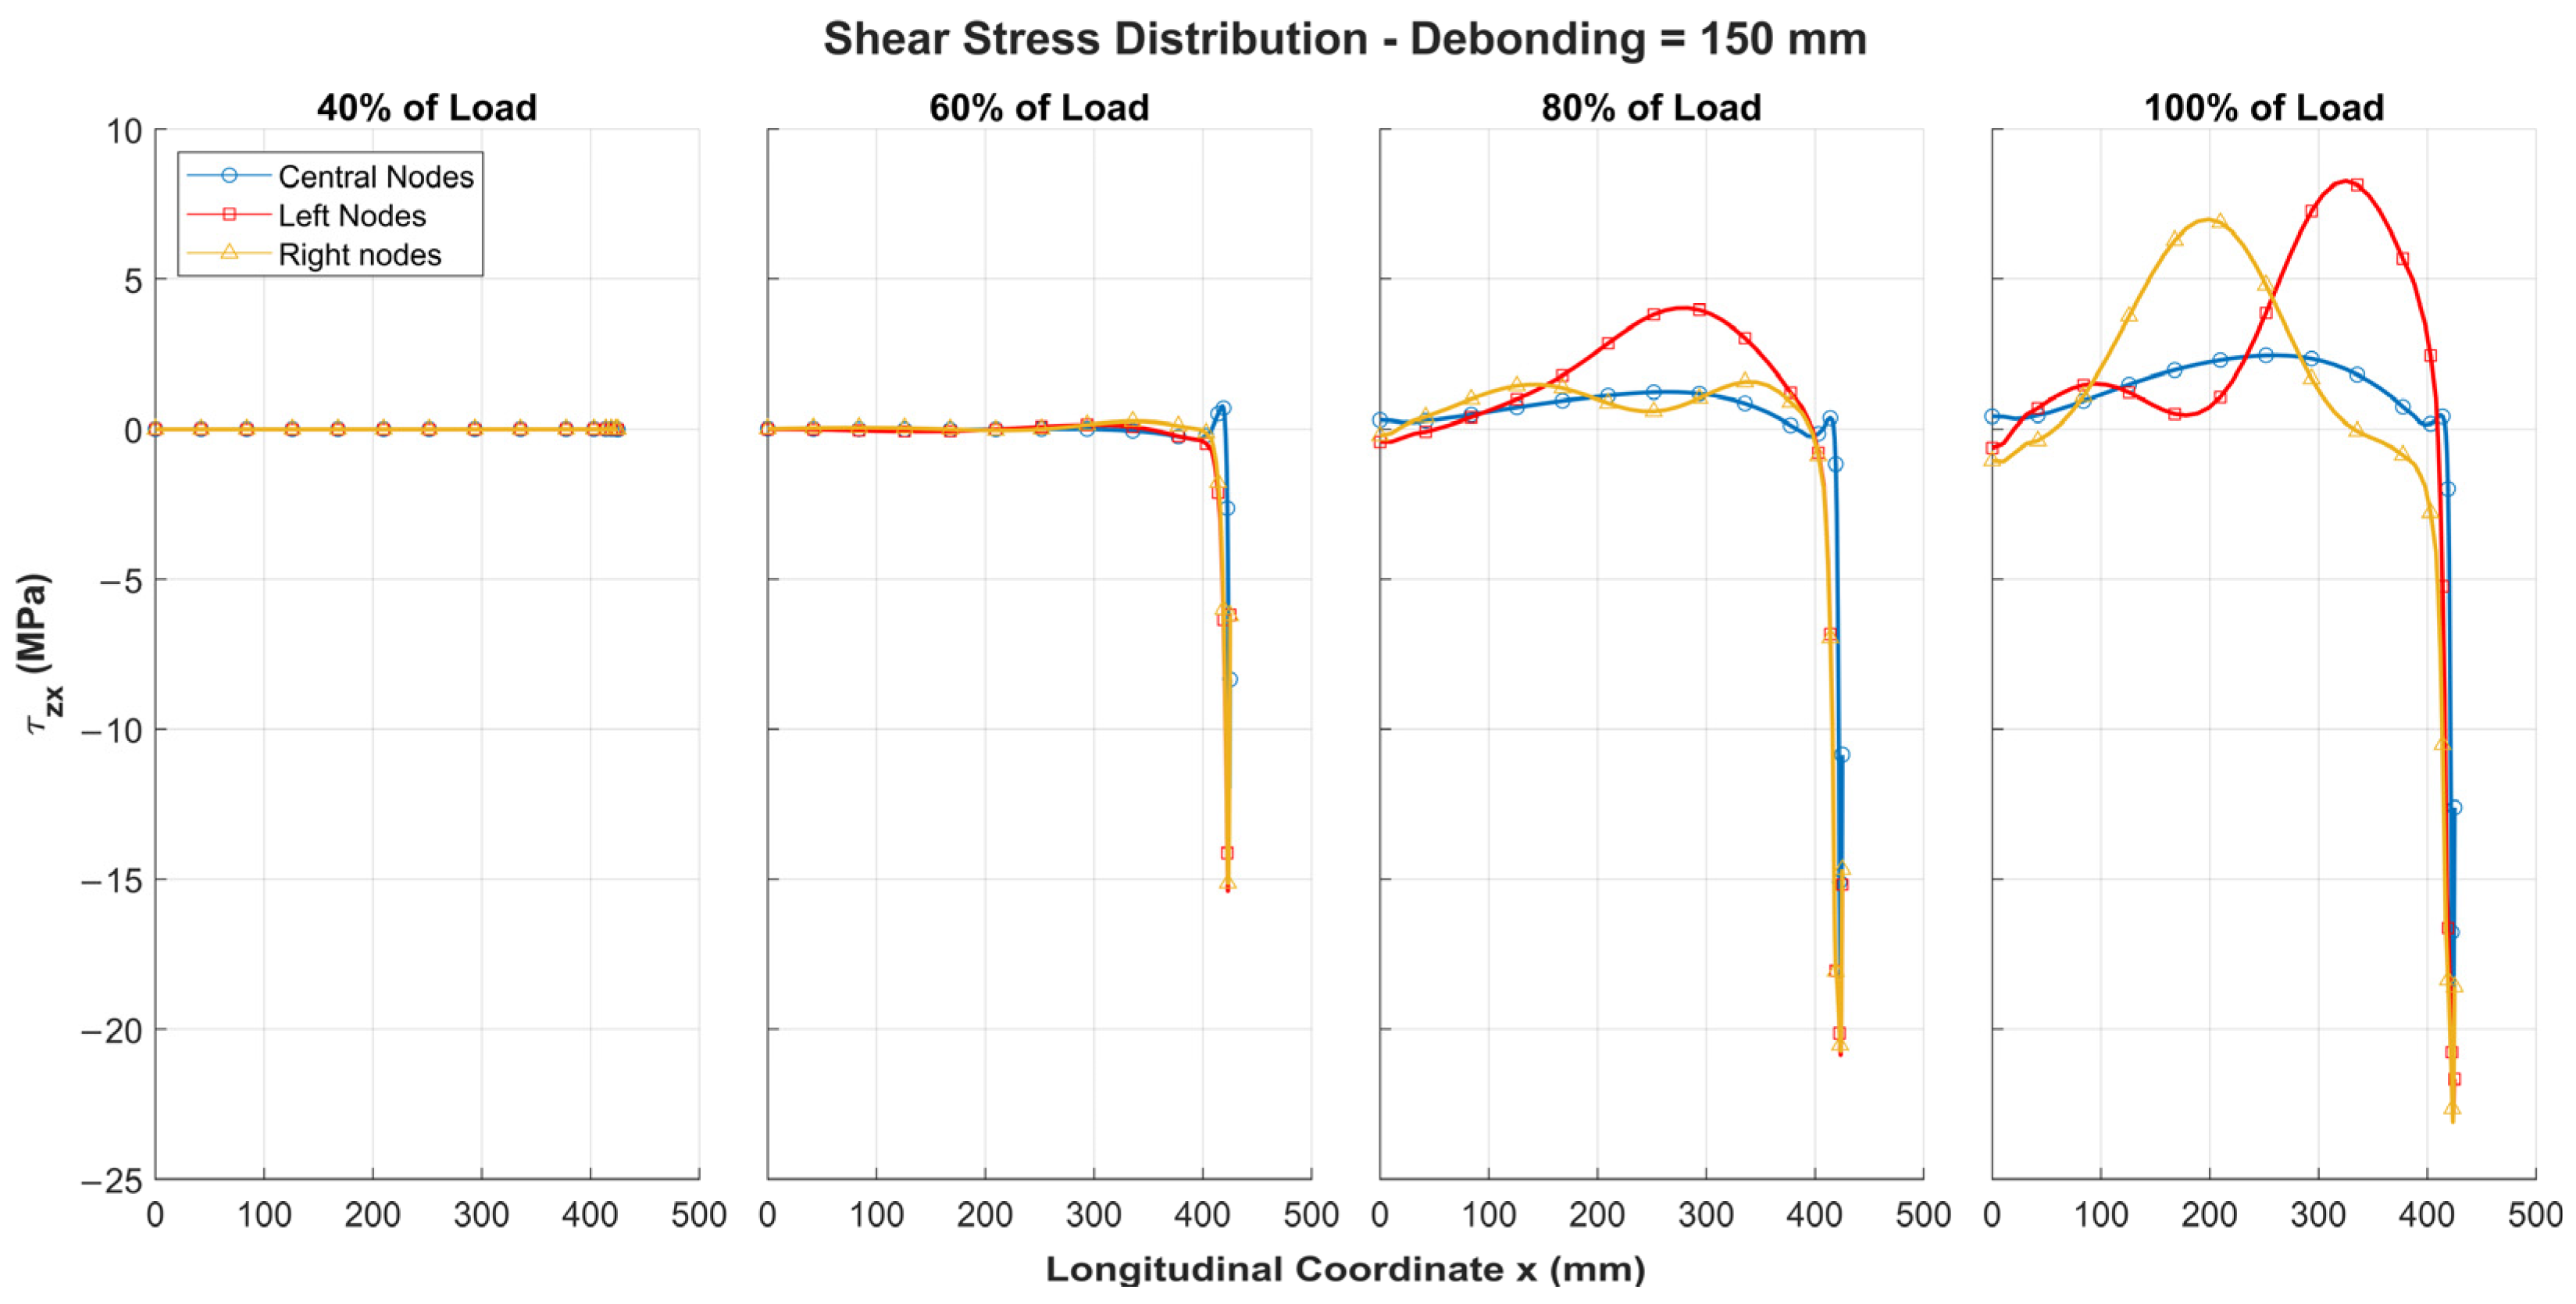
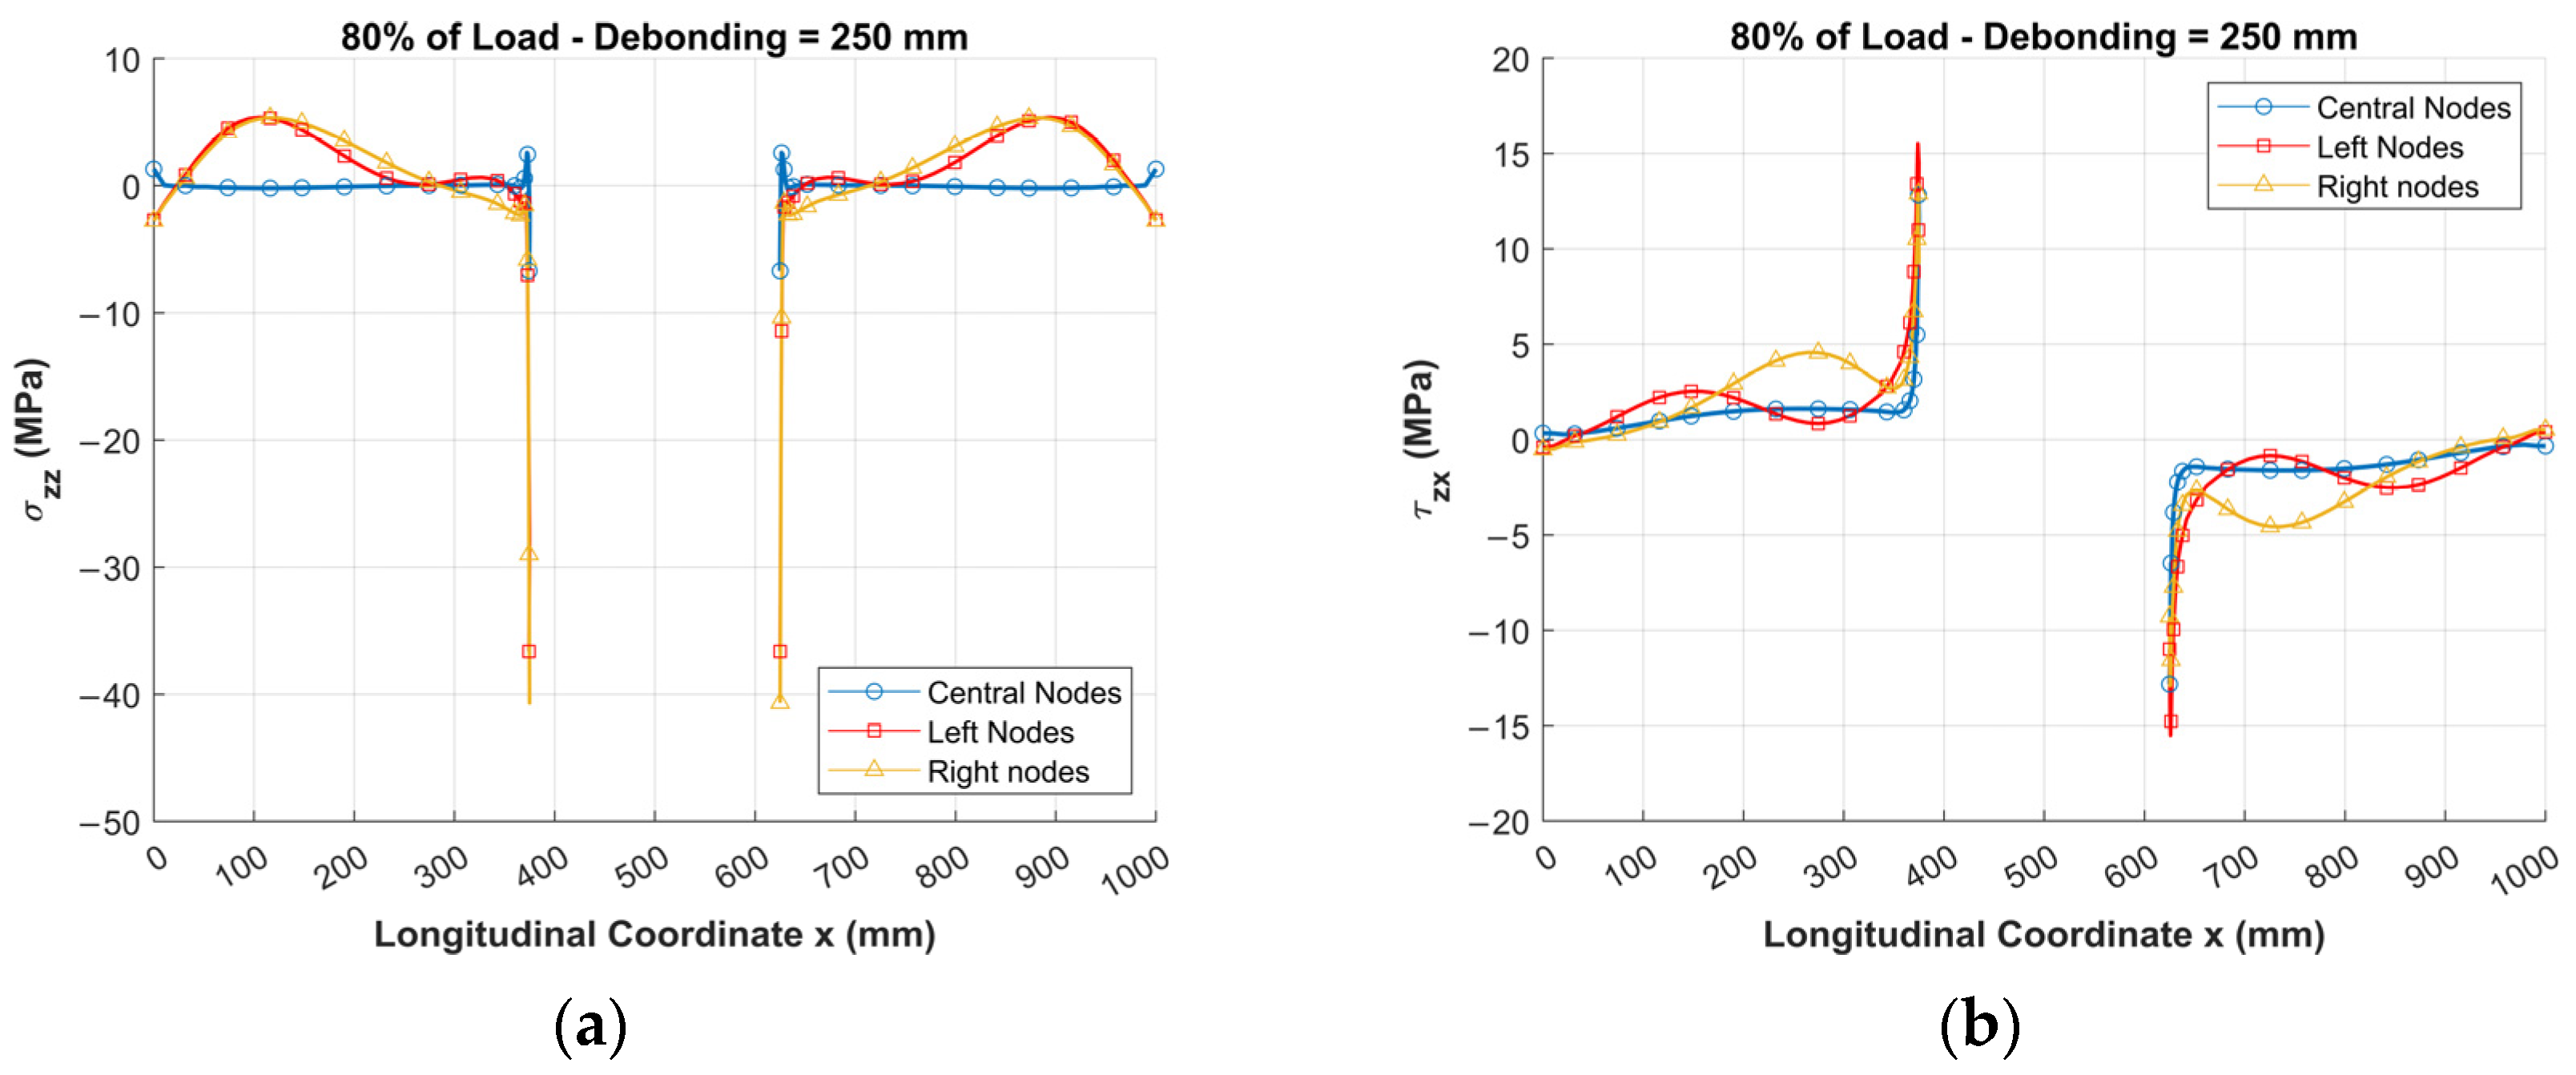
  • Central nodes: Positioned in the central area of the adhesive layer;
  • Left nodes: Oriented toward the centre of the structure;
  • Right nodes: Oriented toward the edge of the panel.
Following the buckling phenomenon, a rapid increase in peeling stresses is observed, reaching maximum values at the tip of the defect. Stresses at the left nodes are higher due to the buckling phenomenon, which induces significant displacements in the central area of the panel. Additionally, as the load level increases, maximum stresses also develop approximately 100 mm from the structure’s edges, resulting from the interaction between global bending and the imposed constraints.
The shear stress distribution, evaluated at the same nodes of the adhesive layer with the defect, is shown in Figure 8. The behaviour is similar to that observed for the peeling stresses, with a rapid increase in shear stresses once the critical load of the structure is exceeded.

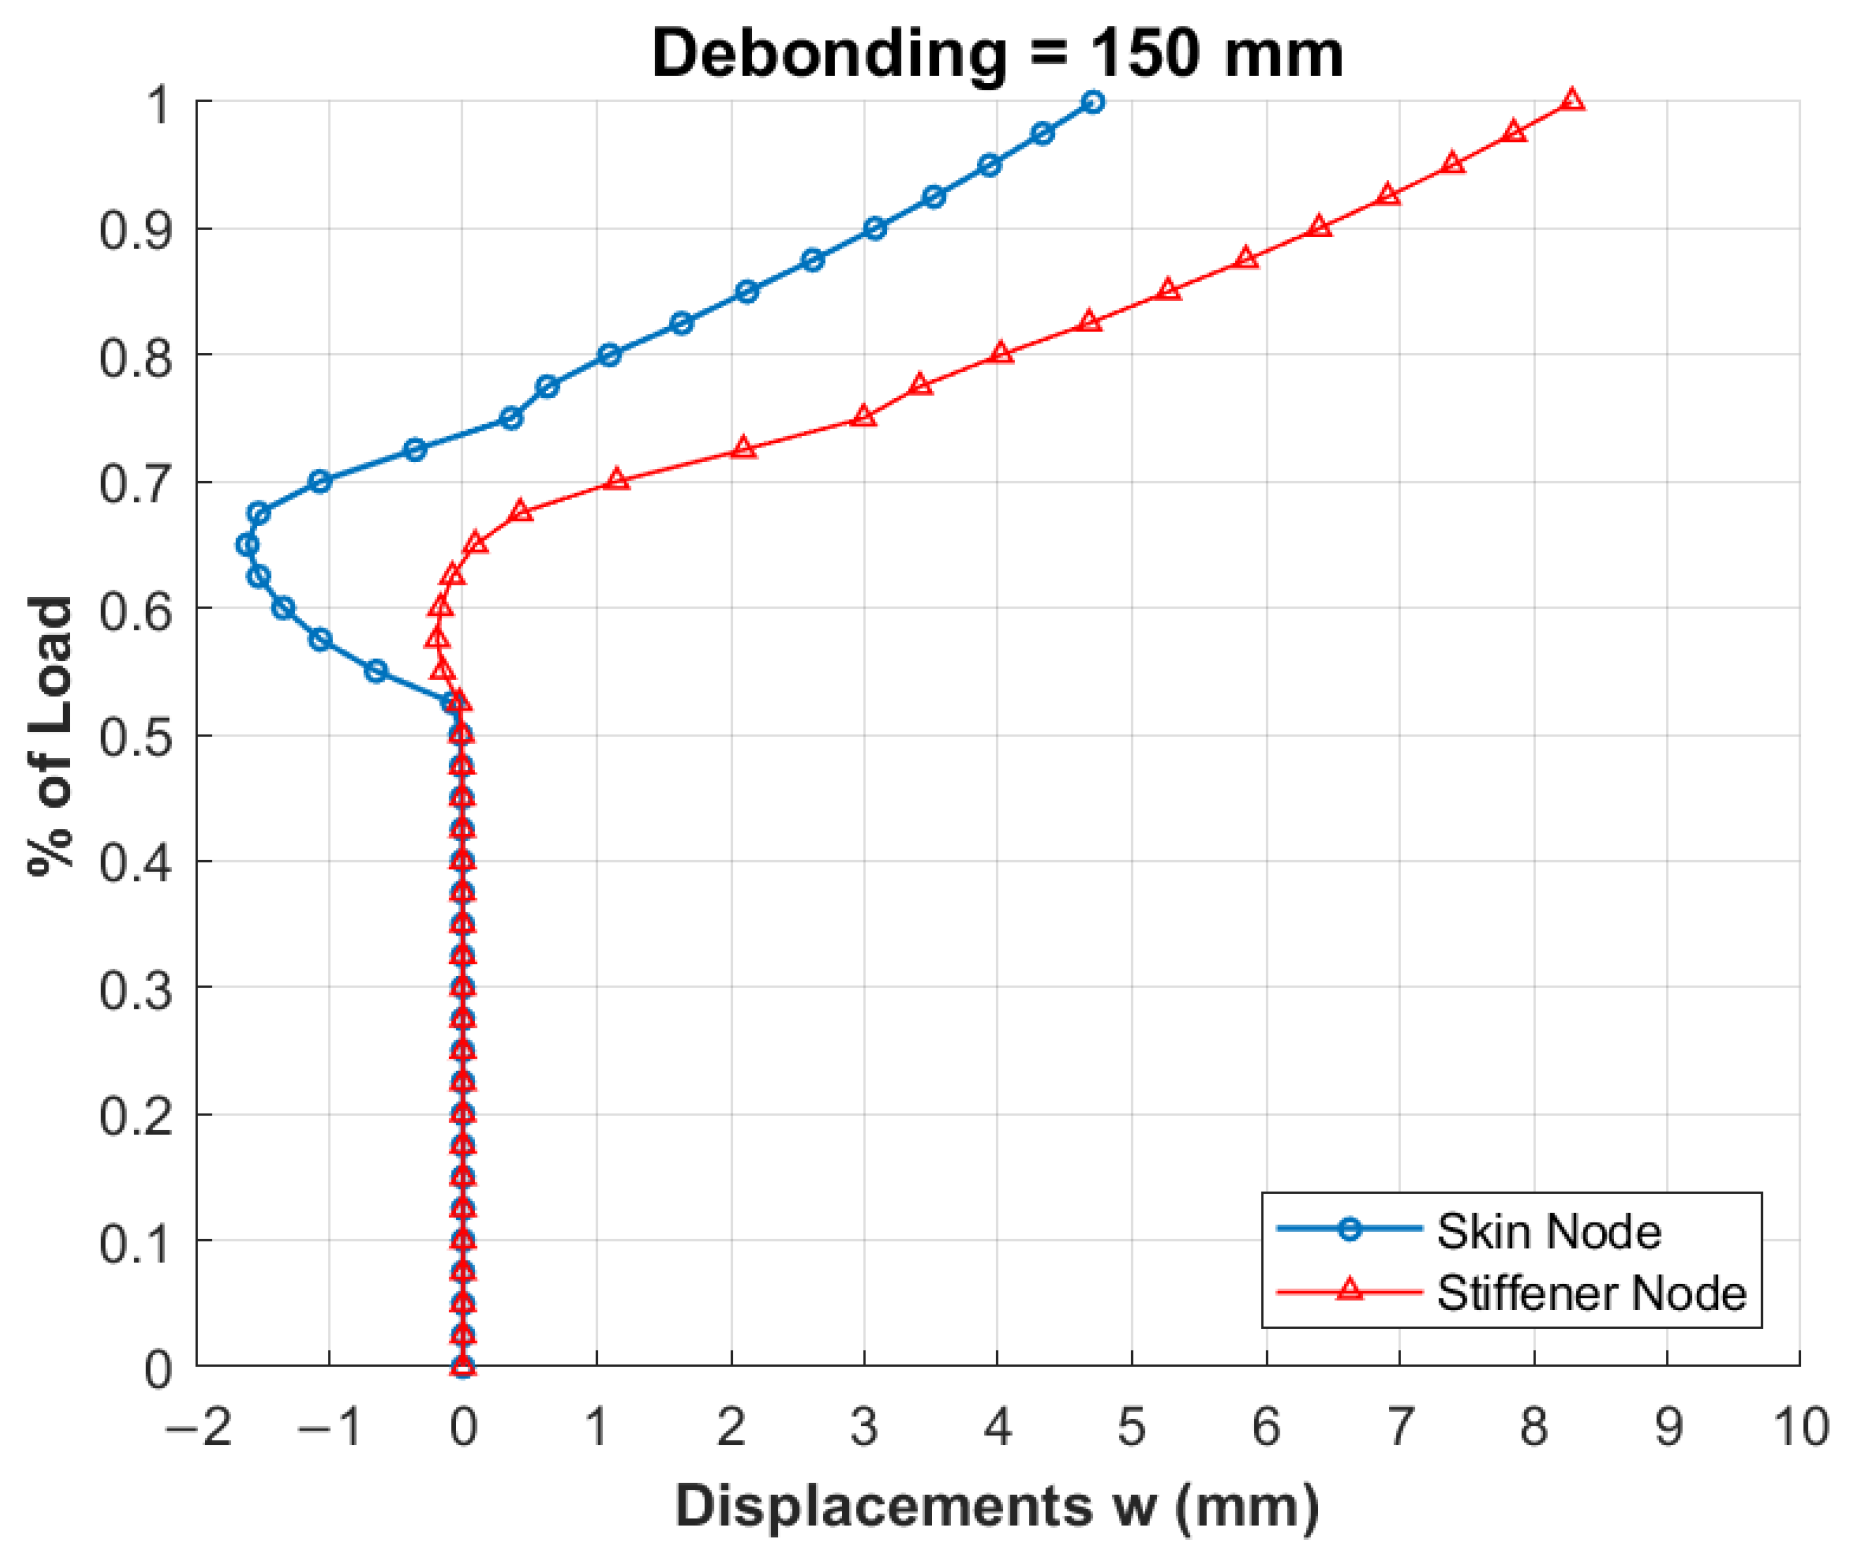
3.2.2. Configuration with 150 mm Debonding

Considering a 150 mm debonding defect, the structural behaviour observed in the static nonlinear analysis, shown in Figure 9, differs from the previous case.
For larger defect sizes, the structure initially exhibits a localized instability in the debonding area, resulting in a downward bending of the skin once the local critical load is exceeded. This localized behaviour creates an imbalance in the stiffener and the surrounding structure, leading to global upward bending as the load level increases. This highlights the significant influence of the local mode, which precedes the global instability and causes the two modes to bend in opposite directions.
This phenomenon is illustrated in Figure 10, which shows the out-of-plane displacement trend for two nodes, one on the skin and one on the stiffener, both located at the centre of the defect (150 mm), as the load level increases.
This defect size, similar to the spacing between the stiffeners, represents a critical dimension for the structure. In fact, the resulting structural behaviour leads to the development of extremely high stresses in the adhesive layer, particularly at the tip of the defect. The peeling stress distribution is shown in Figure 11.
In the configuration with a 150 mm defect, the peeling stresses are higher due to the reduced critical load of the structure. Moreover, as the applied load increases, the stresses progressively grow, reaching their maximum values at the tip of the defect. A similar trend is observed for the shear stresses, as shown in Figure 12.

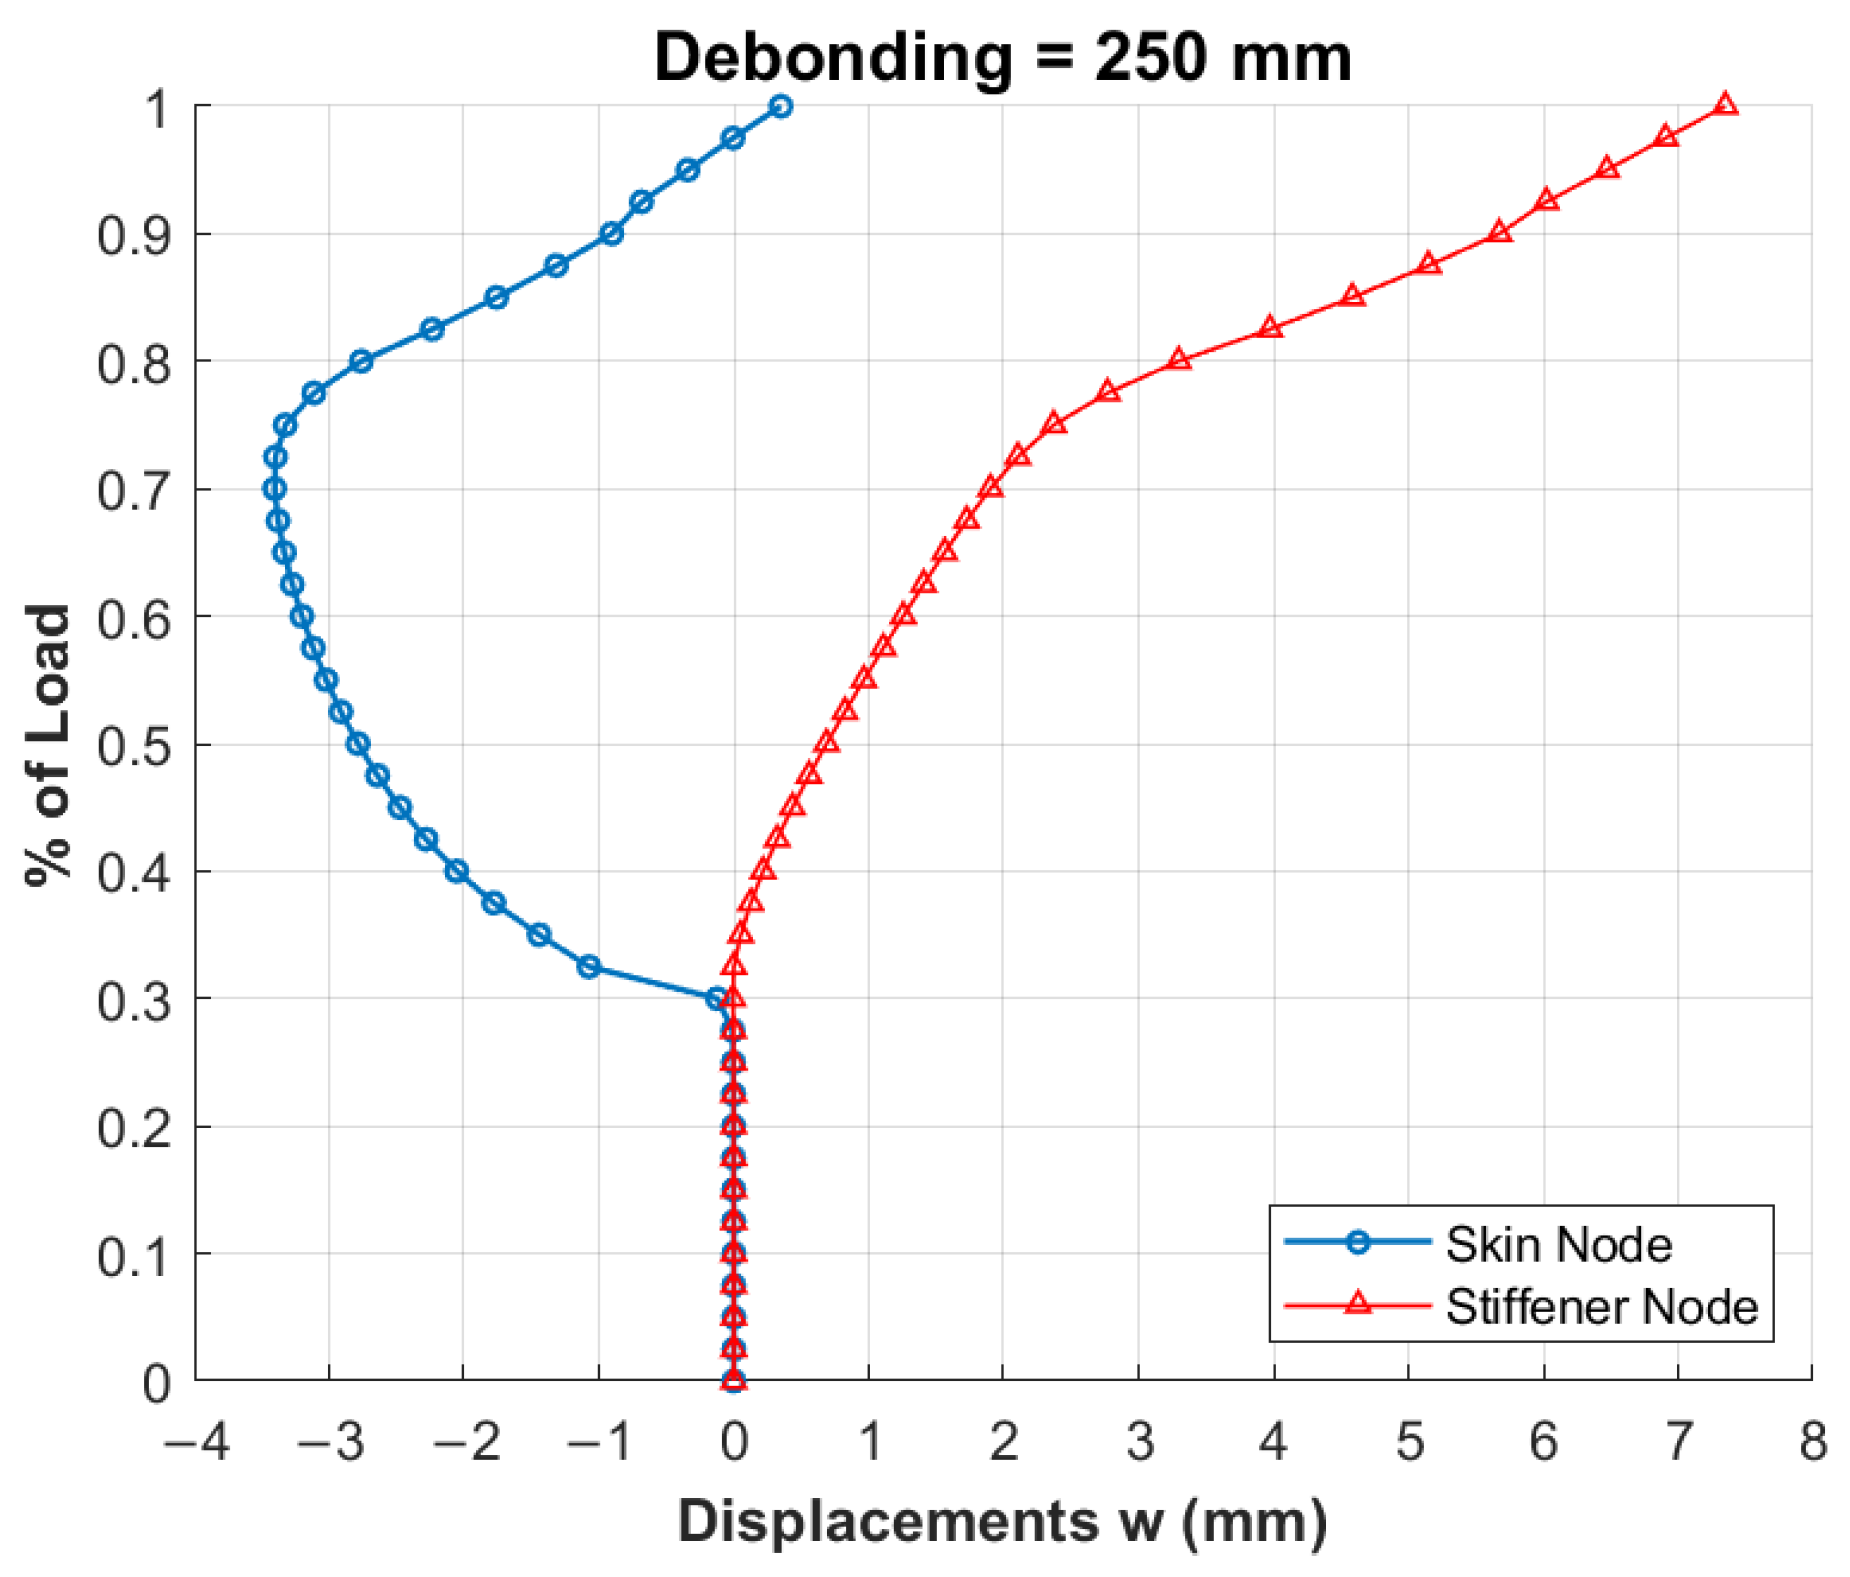
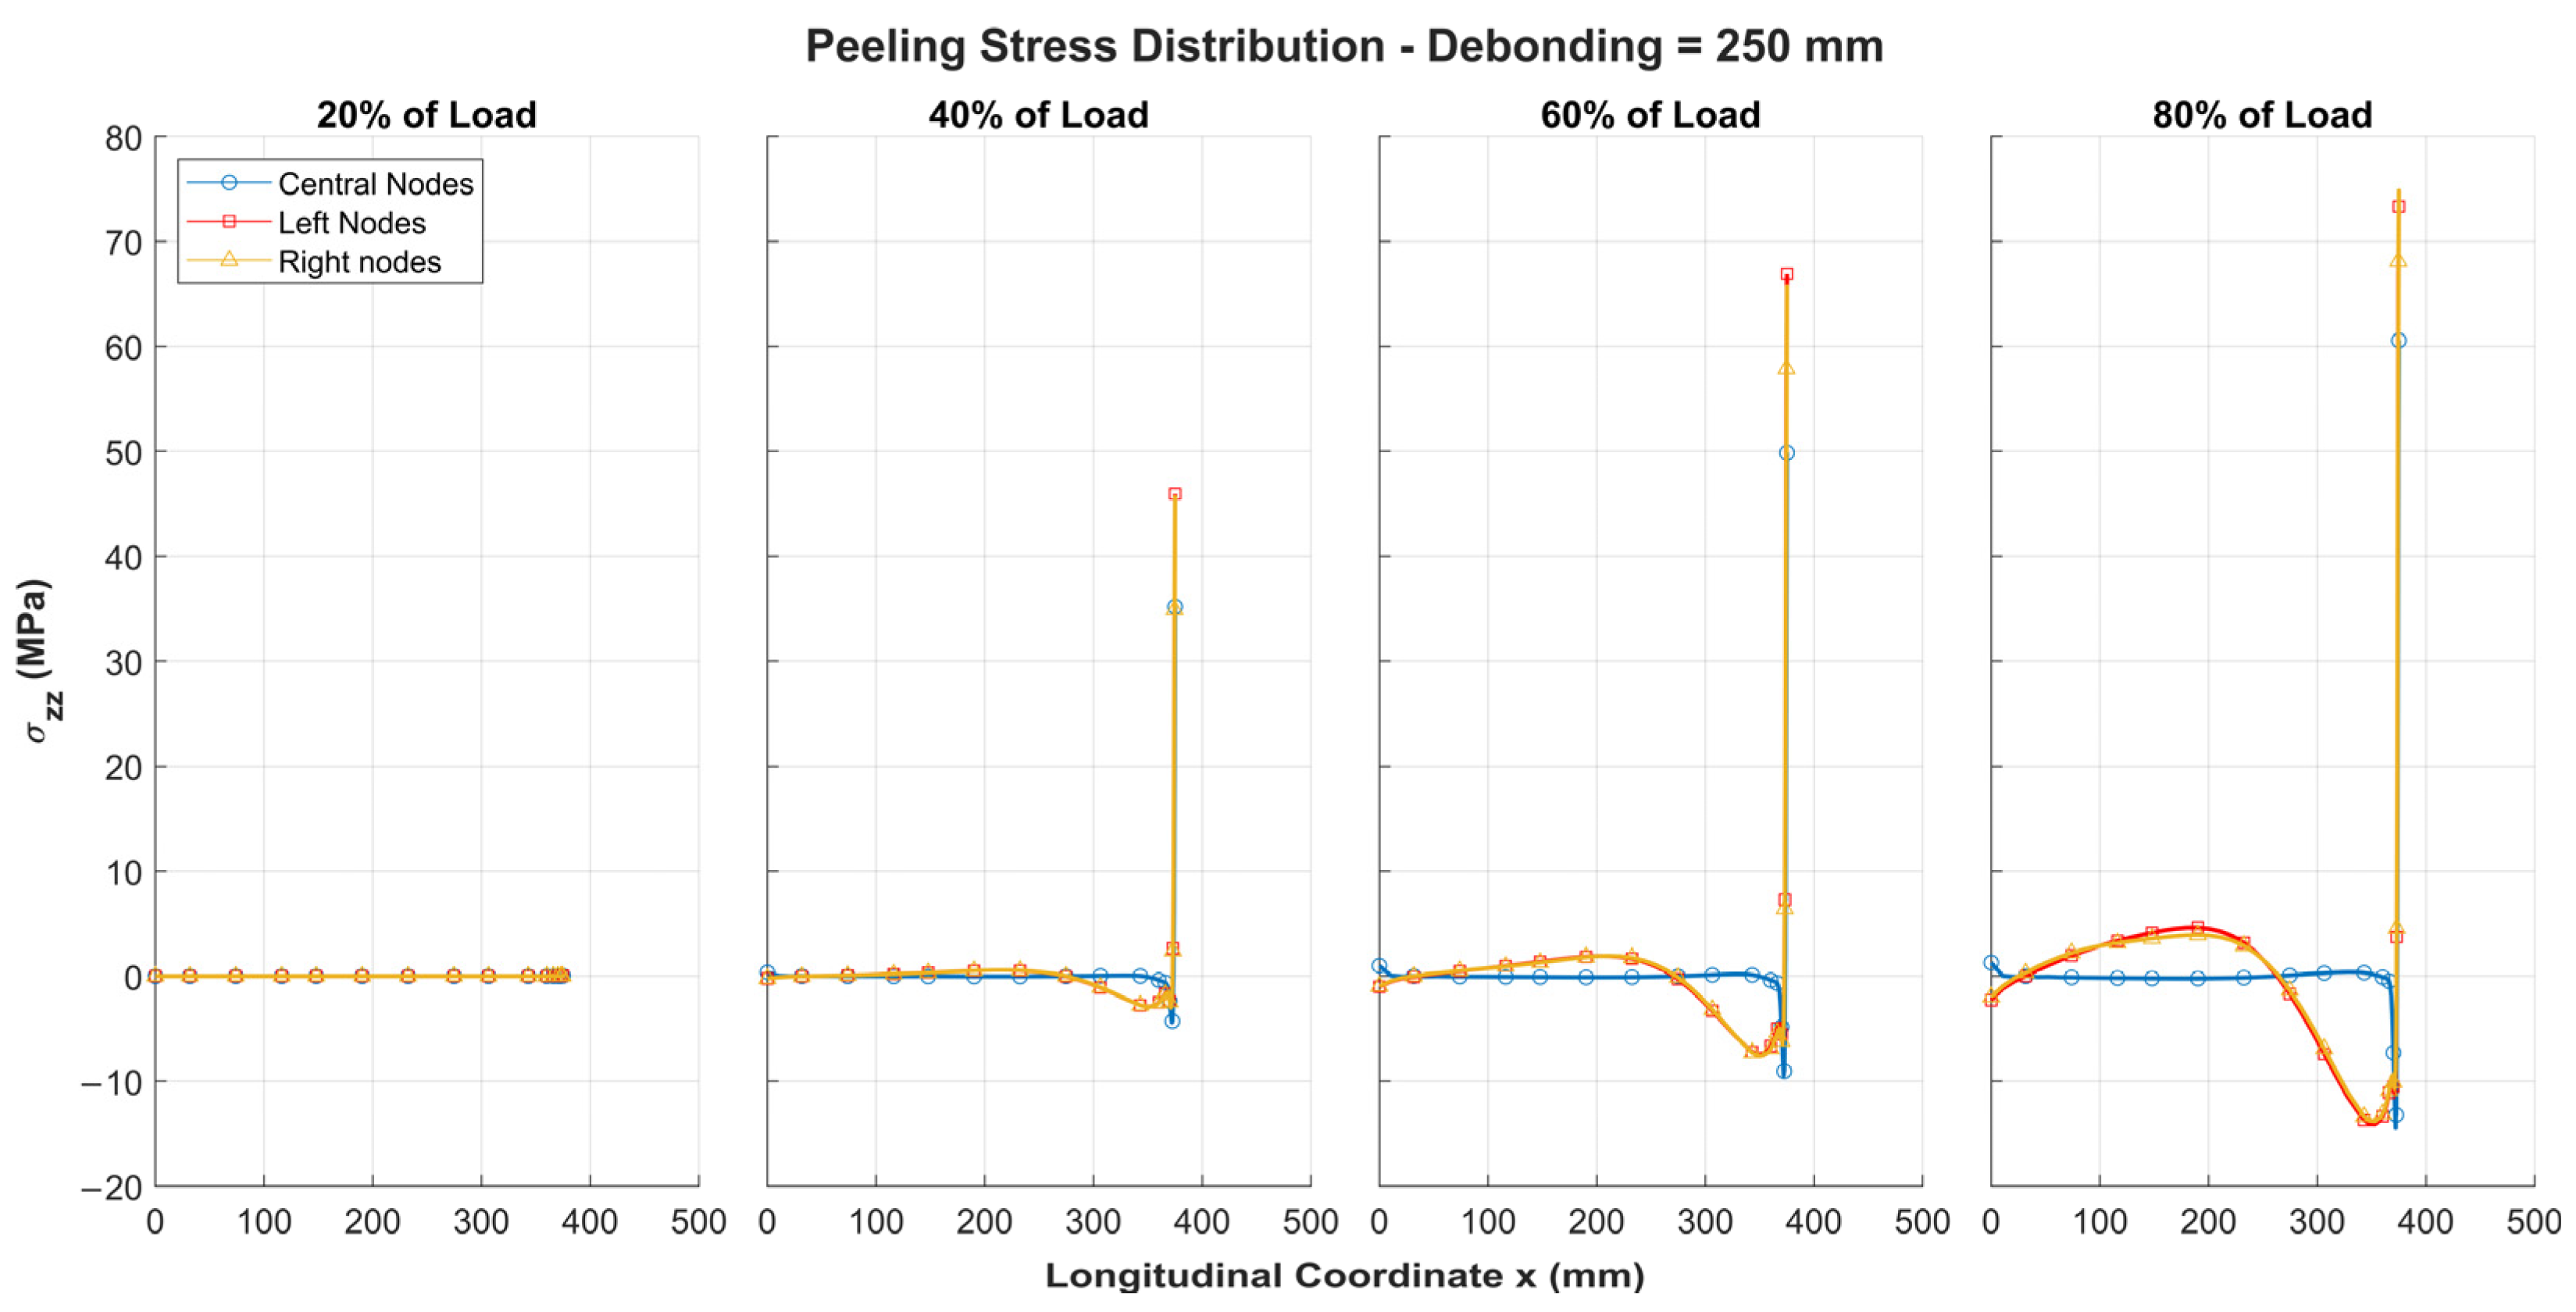
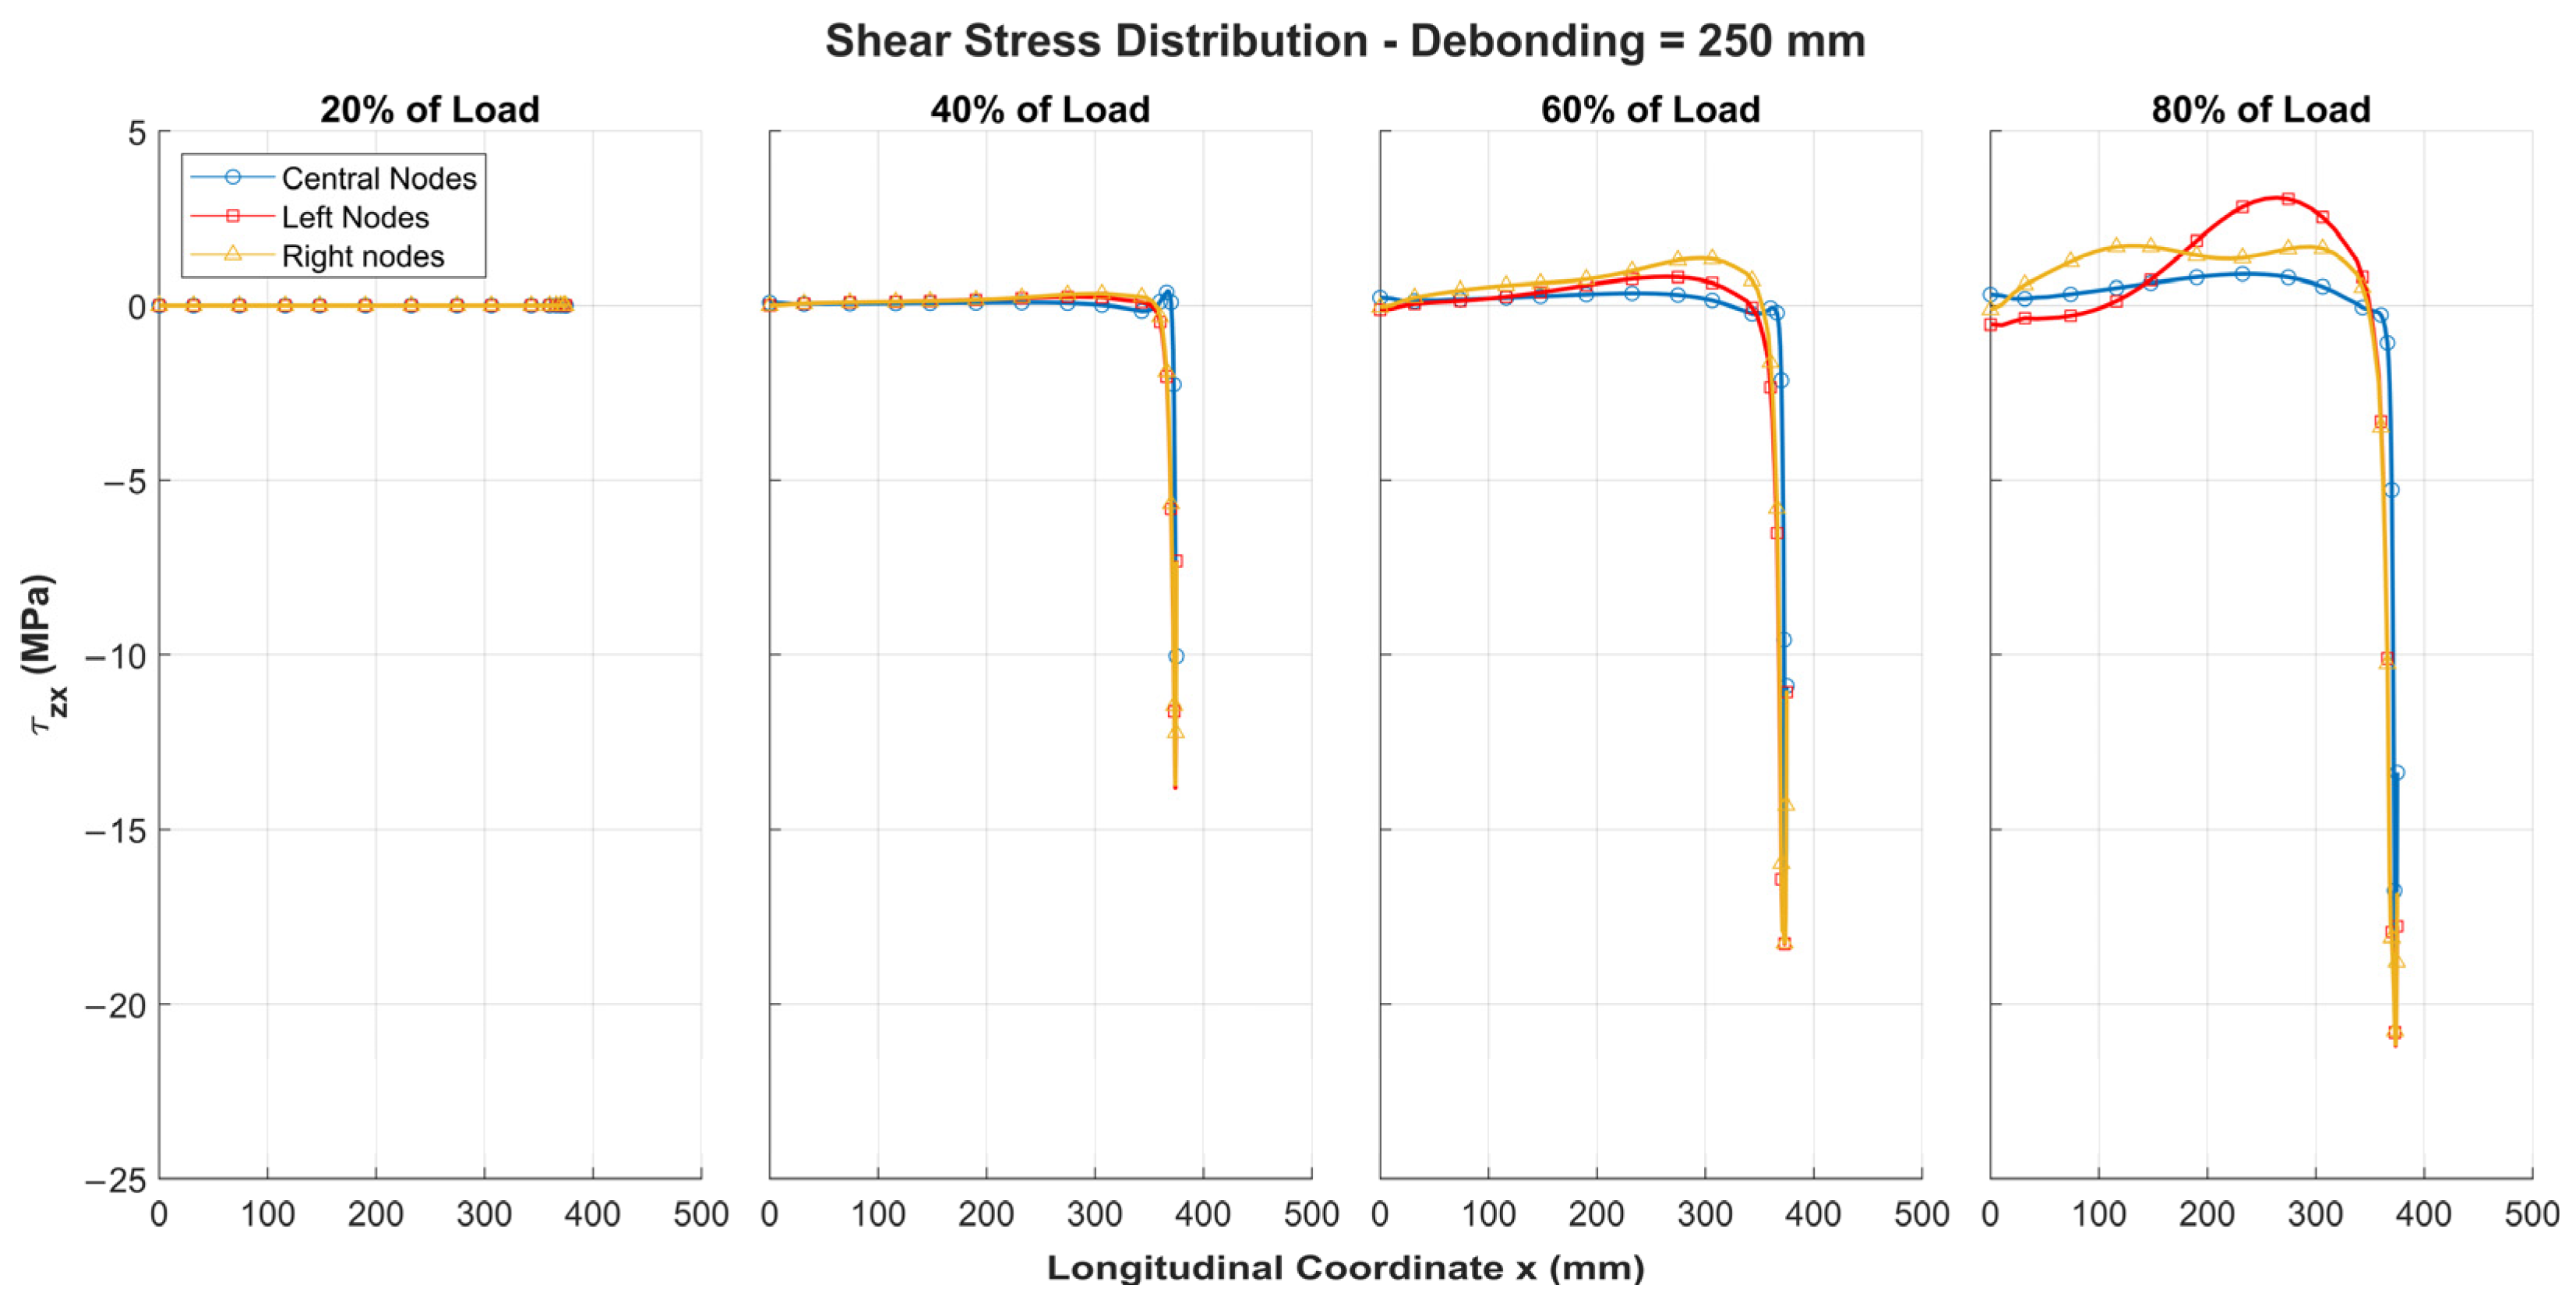
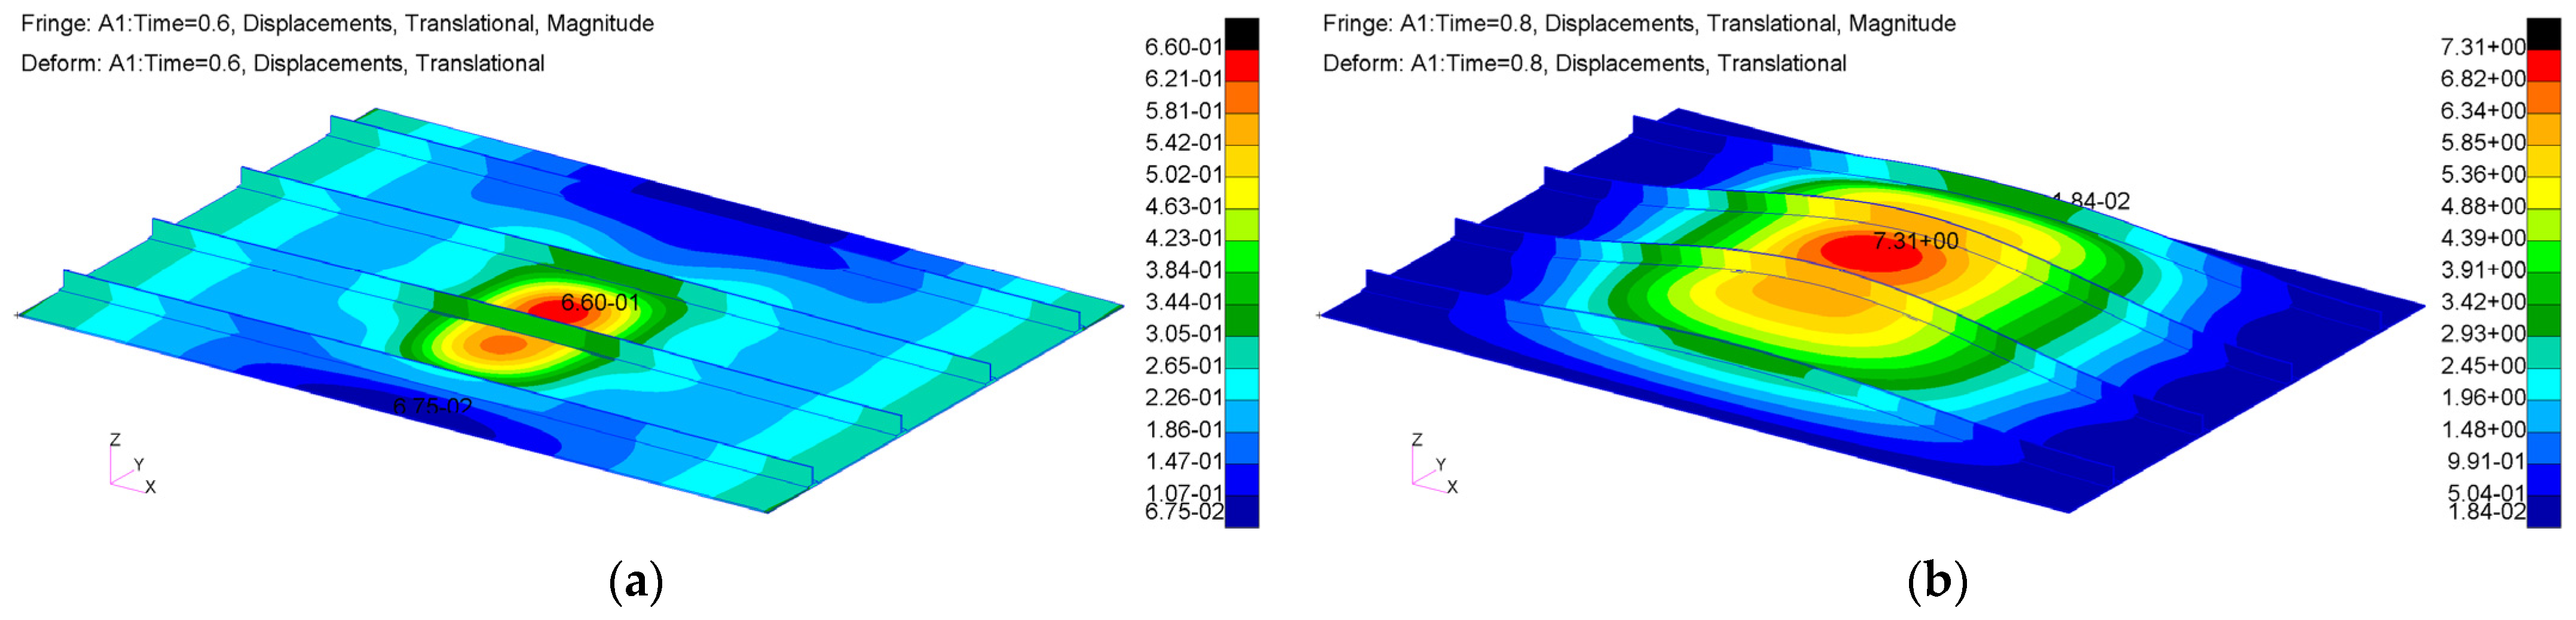
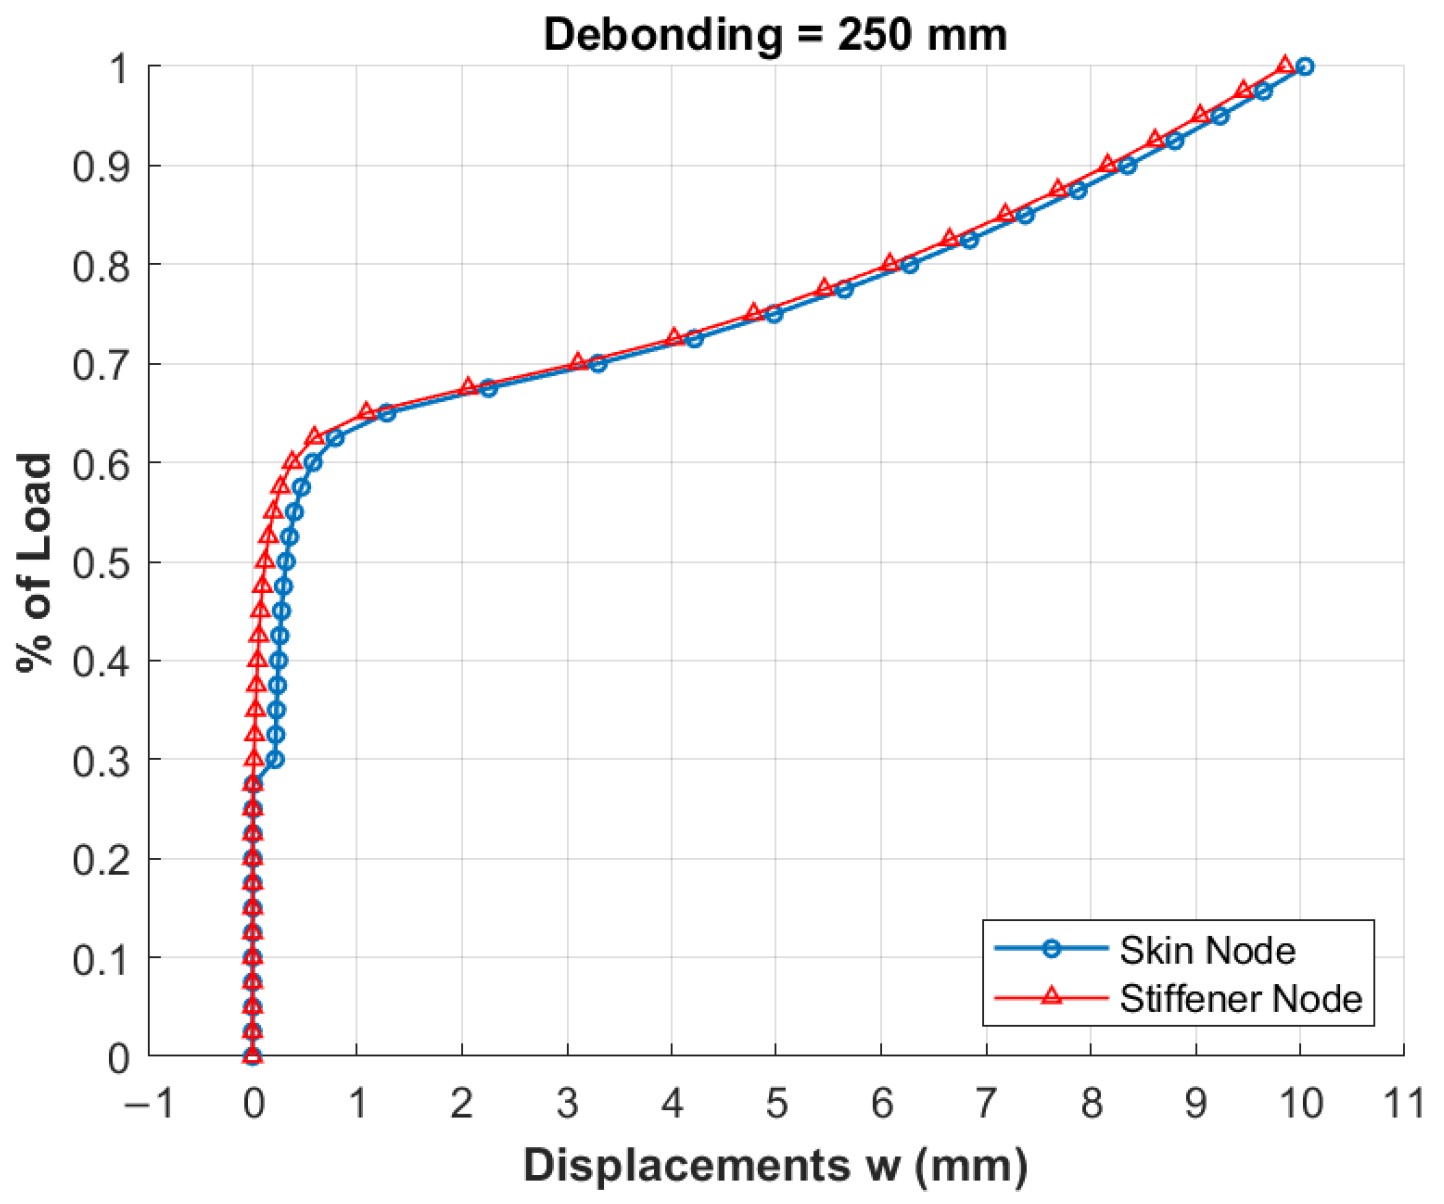
3.2.3. Configuration with 250 mm Debonding

Considering a 250 mm debonding defect, the structural behaviour observed in the static nonlinear analysis, shown in Figure 13, is quite similar to the previous case.
The critical load is significantly lower due to the larger defect size. As a result, high displacements are observed in both the skin and the stiffener even at low load levels. The graph in Figure 14 shows the out-of-plane displacement trend of the structure at the same nodes described previously, located at the centre of the defect (250 mm).
The displacements of the node on the skin become extremely high immediately after exceeding the local critical load, generating peeling and shear stresses that could potentially propagate the defect within the adhesive. The behaviour shown in Figure 14 may differ beyond a certain load level if fracture initiation and propagation were included into the analysis but remains significant for the scope of the article.
Figure 15 shows the peeling stress trend, which follows a pattern similar to previous cases but exhibits higher stresses even at low load levels due to the lower critical load associated with the larger defect size.
The shear stresses for the configuration with a 250 mm debonding defect are shown in Figure 16. Similarly to the previous cases, they increase as the applied load level rises, reaching their maximum at the tip of the defect.
Since the defect could propagate even at low load levels and FEM does not account for such phenomena, it is important to note that the graphs in Figure 15 and Figure 16 represent the stress state configuration under the assumed boundary conditions. These results are considered significant for defining a design criterion for a damaged plate, which is the primary objective of this research activity.

3.3. Stress State for Different Mechanical Properties of Adhesive

In the previously analyzed configuration with a 250 mm debonding, the adhesive was modelled with a bilinear behaviour. The elastoplastic segment had a slope equal to 10% of the elastic modulus, with a hardening slope of 275 MPa. This section evaluates how the stress state in the adhesive changes by reducing the slope of the plastic segment to 3%, corresponding to a hardening slope of 85 MPa.
As shown in Table 2, the values of peeling, shear, and Von Mises stresses, calculated at a central adhesive node at the defect tip for a 250 mm debonding, are only slightly lower despite the variation in the hardening slope. The reduction in peak stresses at the defect tip is approximately 10–13% for peeling and Von Mises stresses, while shear stresses exhibit a slightly more pronounced decrease. Furthermore, no significant changes are observed in the stress distribution along the adhesive layer. These results indicate that using adhesive properties with a flatter plastic segment slightly reduces the peak stresses at the defect tip, without altering the structural behaviour or the overall stress distribution.

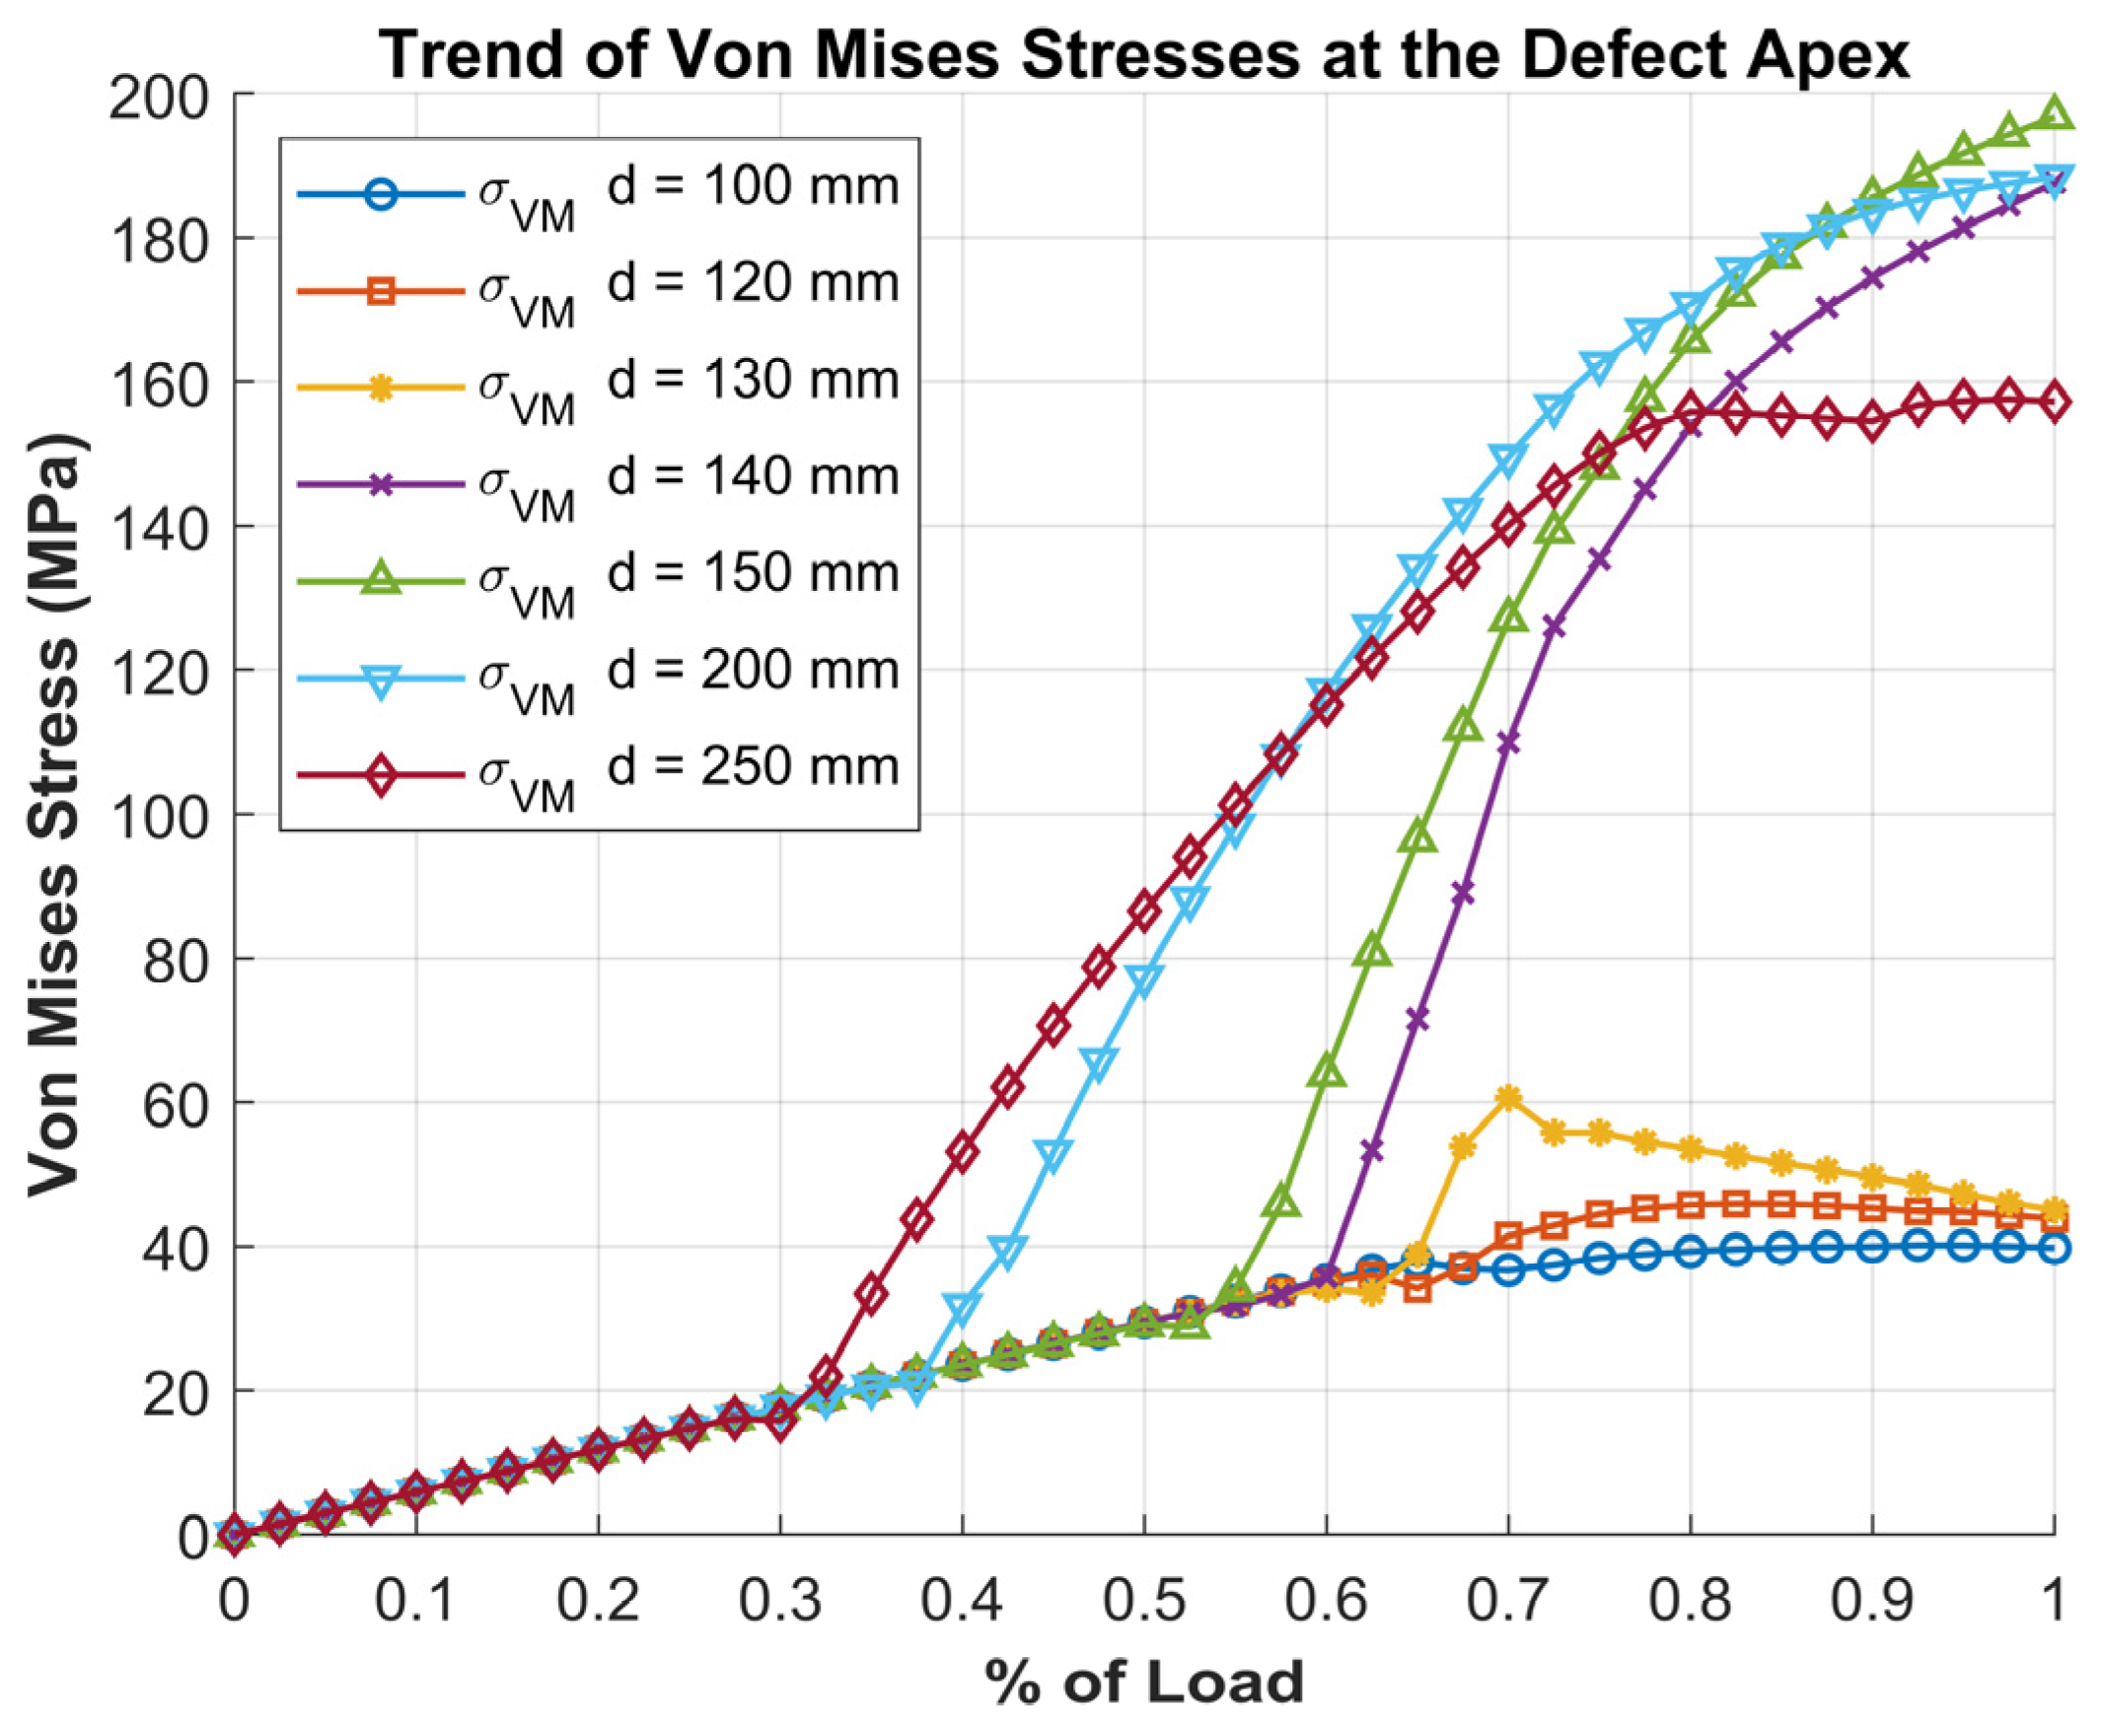
3.4. Von Mises Stress

To estimate, as a first approximation, the compression load level that could cause static failure of the structure in the different damage configurations, the Von Mises stresses are analyzed in this section.
The Von Mises stresses ( σ V M ) developing at the tip of the defect exhibit a trend for the various debonding sizes, as shown in Figure 17.
The graph refers to the nodes located at the tip of the defect and shows the maximum Von Mises stress values at each load step. For defects smaller than 130 mm, the stresses increase progressively with the load level but remain limited. In contrast, for defects larger than the critical size of approximately 140 mm, significantly higher stresses are observed, which grow rapidly and could potentially cause static failure in the adhesive layer.
The critical defect size appears to be closely correlated with the stiffener pitch, which is 175 mm for the analyzed structure. The results show that a debonding of similar dimensions, approximately 75–80% of the stiffener spacing, can trigger local instabilities, altering the structural behaviour and leading to a rapid increase in stresses at the defect tip. Therefore, in the design of stiffened panels, it is essential to consider that debonding of this magnitude could represent a critical condition for structural integrity.
In Figure 18, the data were reprocessed to highlight a critical design parameter, defined by the following equation:
C r i t i c a l   D e s i g n   P a r a m e t e r = σ f a i l u r e σ V o n   M i s e s 1 ,
which indicates the onset of static adhesive failure as the defect size increases, for various load levels. In this evaluation, an adhesive ultimate strength of 70 Mpa was assumed.
From the graph, it is evident that when the parameter becomes negative, static failure occurs. At low loads, even large defects do not lead to failure. By contrast, as the load increases, failure occurs at progressively smaller defect sizes. Specifically, between 50% and 100% load, failure is observed for debonding values ranging from 130 mm to 200 mm, which are comparable to the distance between the stiffeners.
The critical design parameter graph presented earlier (Figure 18), and the BLF trend (Figure 3) appear to exhibit a similar pattern, indicating a potential correlation between the two. Moreover, once the critical defect size is exceeded, the design parameter remains nearly constant, suggesting equivalent stress concentration levels for larger defect lengths. Therefore, investigating the first significant configuration is sufficient, as larger defect sizes do not further affect the results.

3.5. Influence of Direction of Perturbation Application

In previous cases, the perturbation was applied opposite to the z-axis. Applying it upward in the 250 mm debonding case leads to a different structural behaviour, as shown in Figure 19. Removing the adhesive in the damaged area to simulate debonding in FEM allows slight local upward bending of the plate, which would not occur if the adhesive were present. To ensure accurate analysis, contact between the skin and the stiffener’s horizontal flange in this region prevents overlap between components.
The structure is less critical, exhibiting a local upward bending in the debonding area, which is constrained by the stiffener. Only upon reaching the global critical load does the whole structure bend upward, as shown in Figure 20.
In Figure 21a, the peeling stress in the adhesive at the defect tip reaches negative values, indicating compression, which significantly reduces the risk of adhesive failure even under a high applied load. Similarly, in Figure 21b, the shear stresses are lower compared to the case where the perturbation is applied downward, as previously shown.
Applying the perturbation in the upward direction results in an overall less critical structural response. Local instability and stress concentrations in the adhesive layer play a less significant role compared to the downward perturbation case.

4. Discussion

Considering the presented results and the stiffened plate behaviour, some main comments can be summarized.
(a)
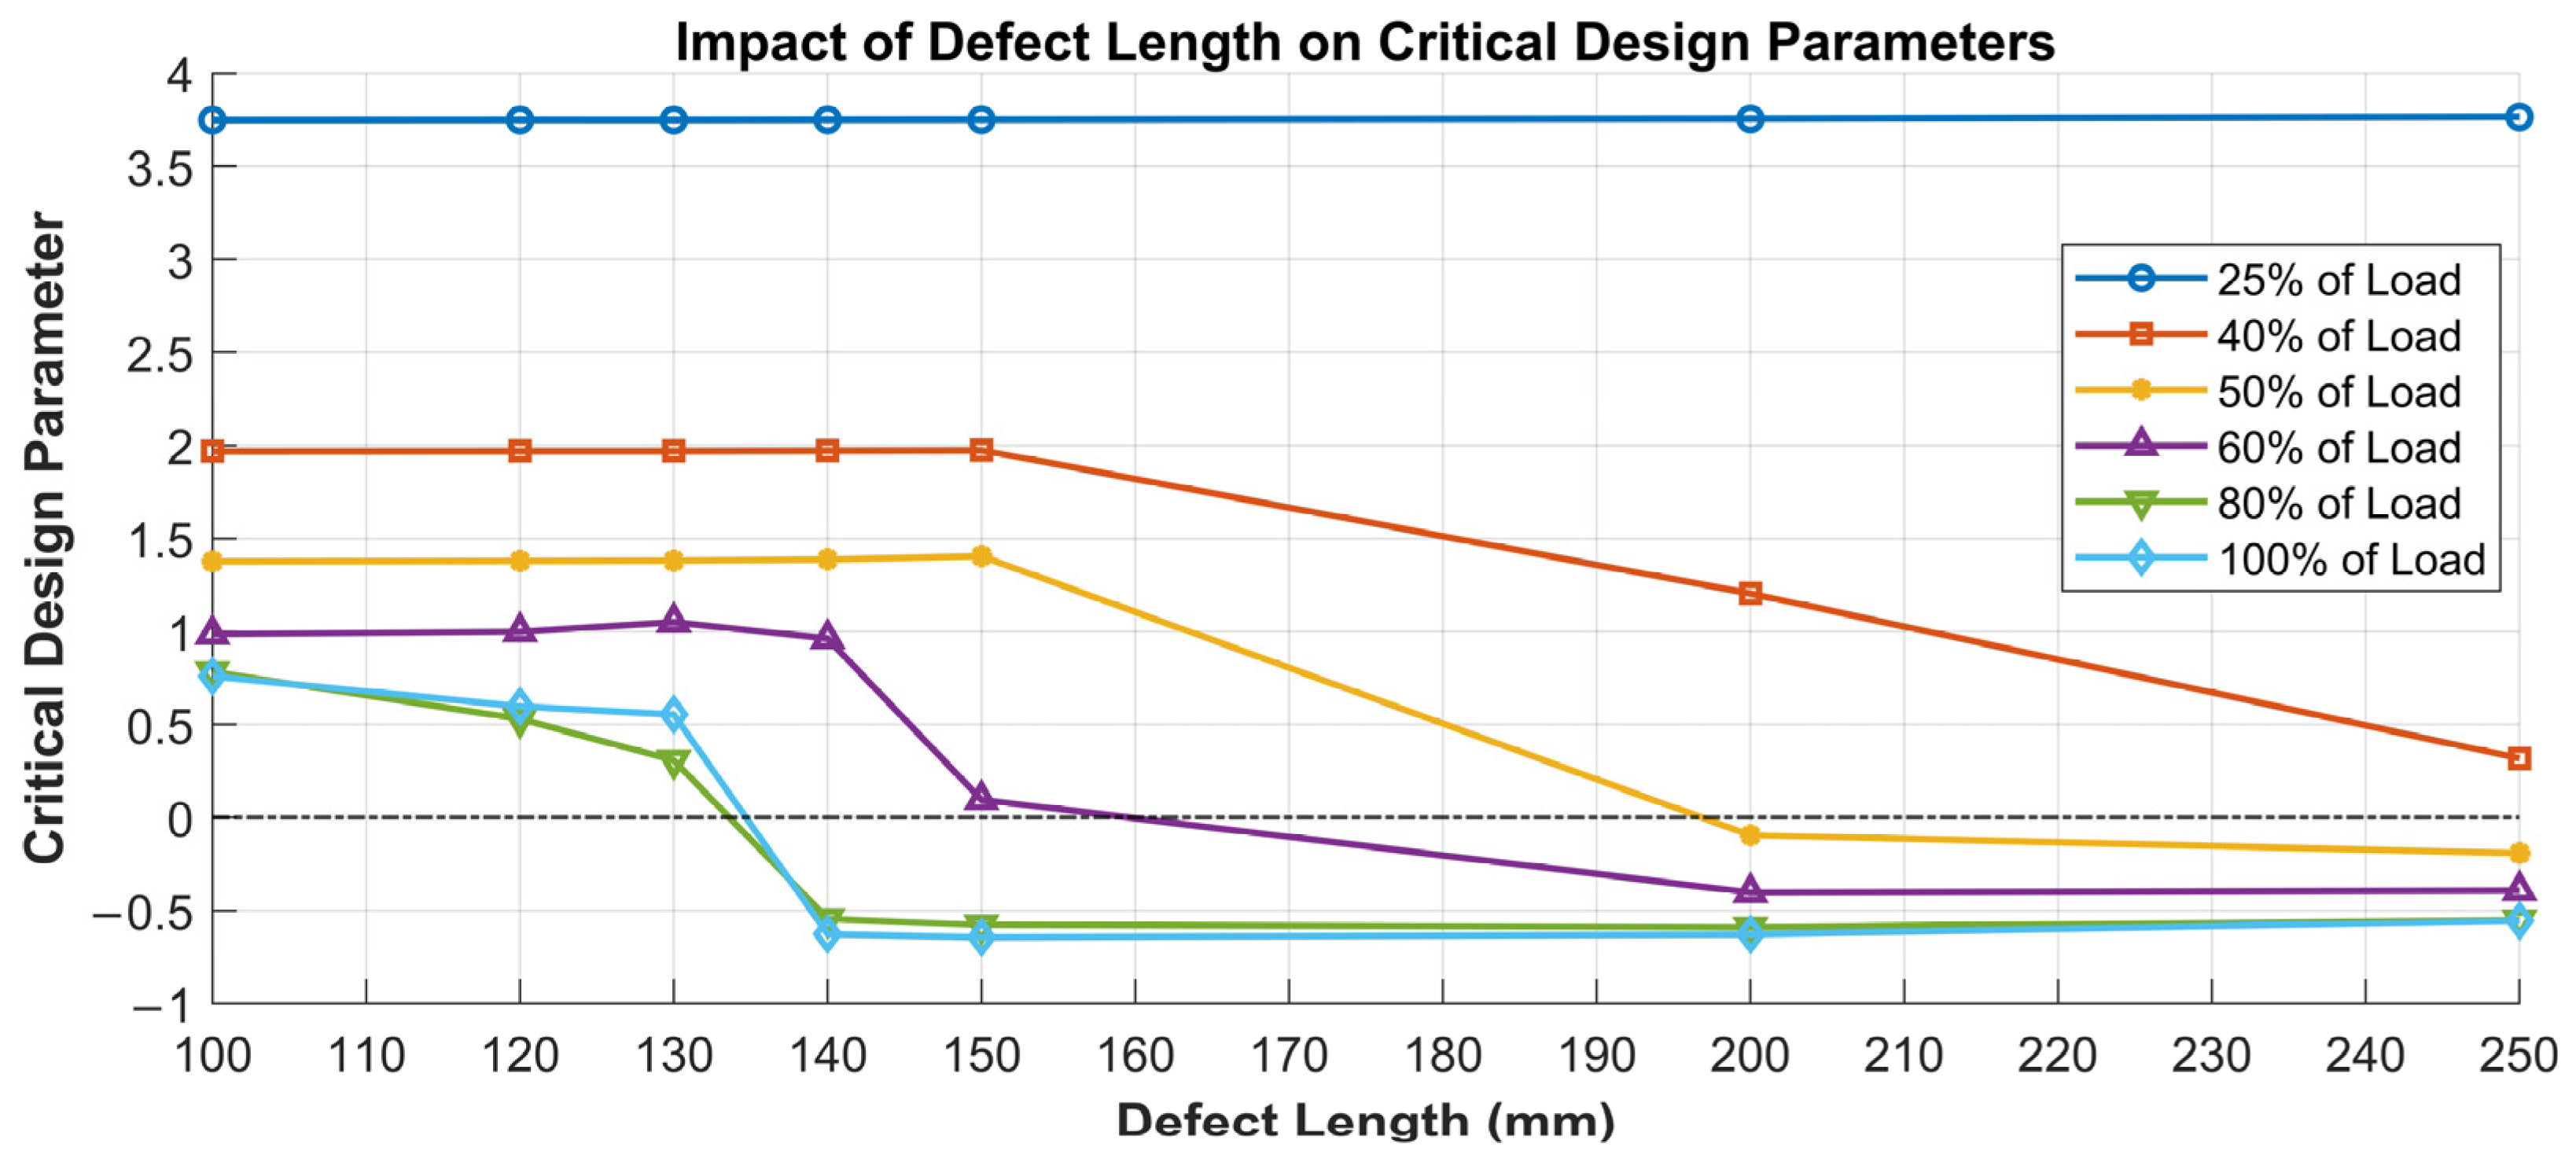
The defect length significantly influences both global and local buckling modes, which may interact at specific damage dimensions once the defect extends beyond certain thresholds.
(b)
Under predominantly global buckling, shear and peel stresses remain relatively low. However, if local buckling occurs, these stresses increase significantly due to greater localized deflection in the damaged area.
(c)
In the post-buckling regime, maximum stress values can rise considerably, increasing the likelihood of brittle adhesive fracture just beyond the critical load. A specific debonding length emerges in this context, representing a critical point where local buckling drives a dangerous stress increase in the adhesive interface. Moreover, these maximum stress values are directly proportional to the debonding length, as the local buckling load decreases with larger defect dimensions.
(d)
The same trend is observed across various adhesive properties, indicating a robust and general behaviour. However, the direction of the perturbation can affect the buckling shapes and stress distribution, potentially reducing or even preventing the onset of critical structural conditions.
(e)
The stress peaks can be directly connected to the load imbalance between the post-buckled, damaged region and the rest of the structure, highlighting the importance of identifying a critical configuration during preliminary design.
A general trend can be identified in order to give an answer to a typical design question: what is a damage debonding dimension that can be assumed dangerous for the structural integrity of stiffened plates when studied at the preliminary design stage?
Because of the presented investigation and remaining at the stress distribution level inside the adhesive interface, the critical debonding dimension has to be identified in correspondence to the local buckling loading condition evaluating the differential with respect to the applied one. Debonding dimensions lower than this have negligible effects on the stress distribution in the interface due to the driven global buckling mode loading condition. Higher debonding dimensions introduce peak stress not consistent to the expected structural integrity.
A simple and not previously identified approach is demonstrated to be valid for the preliminary design stage where it is not possible to perform a detailed investigation on the structure based on the advanced failure initiation and propagation methods. Future research directions may be addressed toward a confirmation of this idea by including such methods inside the FE evaluation.

5. Conclusions

A typical stiffened flat plate is investigated with respect to critical behaviour under compressive conditions. The skin–stringer bonded interface is investigated with respect to its stress distribution related to different critical and post-critical loading states. General trends were identified in order to arrive at a specific design indication at the preliminary level. The stress distribution in the interface is directly related to the load differential between the critical local state of the debonded area and the remaining structure. A direct influence of the damage length was determined, with the definition of a critical design parameter enabling the identification of a critical dimension prior to conducting further investigations using more detailed analysis methods, such as fracture initiation and propagation schemes.
The possibility to have evidence of such a conclusion is valuable for any preliminary design state. Saving time and research resources can be possible by neglecting detailed analyses of unnecessary configurations. A significant improvement in preliminary design outcomes can be achieved by selecting the right configuration.

Author Contributions

Conceptualization, G.F. and G.P.; methodology, G.F.; software, G.P.; validation, formal analysis, investigation, and resources, G.F. and G.P.; data curation, G.P.; writing—original draft preparation, G.P.; writing—review and editing, G.F.; visualization, G.P. All authors have read and agreed to the published version of the manuscript.

Funding

This research received no external funding.

Institutional Review Board Statement

Not applicable.

Informed Consent Statement

Not Applicable.

Data Availability Statement

The original contributions presented in this study are included in the article. Further inquiries can be directed to the corresponding author.

Conflicts of Interest

The authors declare no conflicts of interest.

References

  1. Bisagni, C.; Frulla, G.; Giavotto, V.; Romeo, G.; Fanteria, D.; Lanciotti, A. Research Activities on Buckling of Composite Structures in Italy. In Proceedings of the 50th AIAA/ASME/ASCE/AHS/ASC Structures, Structural Dynamics, and Materials Conference (AIAA 2009-2349), Palm Springs, CA, USA, 17 April–7 May 2009. [Google Scholar] [CrossRef]
  2. Frulla, G. Static/Fatigue Structural Behaviour of Damaged Stiffened Composite Plates for UAS Applications. SAE 2013 AeroTech Congress & Exibition, 2013. [Google Scholar] [CrossRef]
  3. Junior, M.C.B.P.; Pinto, V.T.; Rocha, L.A.O.; Dos Santos, E.D.; Isoldi, L.A. Analysis through constructal design of the influence of spacing between stiffeners in the deflection of plates. Rev. Mundi Eng. Tecnol. Gestão. 2020, 5, 275-01–275-21. [Google Scholar] [CrossRef]
  4. Wang, X.; Xie, F. Tensile strength and failure behavior of T-stiffened panels with embedded delamination: Experimental investigation. Iran. Polym. J. 2021, 30, 897–905. [Google Scholar] [CrossRef]
  5. Frulla, G. Structural behavior of Damaged Anisotropic Stiffened Panels under compressive loads. In Proceedings of the 25th ICAS Congress, Hamburg, Germany, 3–8 September 2006; Springer: Berlin/Heidelberg, Germany; ISBN 0953399176.
  6. Torres, M.; Franco-Urquiza, E.A.; Hernández-Moreno, H.; González-Villa, M.A. Mechanical Behavior of a Fuselage Stiffened Carbon-Epoxy Panel under Debonding Load. J. Aeronaut. Aerosp. Eng. 2018, 7, 1000280. [Google Scholar] [CrossRef]
  7. Armanios, E.A. Delamination analysis for laminated composites. I: Fundamentals. J. Aerosp. Eng. 1991, 4, 194–215. [Google Scholar] [CrossRef]
  8. Yap, J.W.; Scott, M.L.; Thomson, R.S.; Hachenberg, D. The analysis of skin-to-stiffener debonding in composite aerospace structures. Compos. Struct. 2002, 57, 425–435. [Google Scholar] [CrossRef]
  9. Yap, J.W.; Thomson, R.S.; Scott, M.L.; Hachenberg, D. Influence of post-buckling behaviour of composite stiffened panels on the damage criticality. Compos. Struct. 2004, 66, 197–206. [Google Scholar] [CrossRef]
  10. Ye, Y.; Zhu, W.; Jiang, J.; Xu, Q.; Ke, Y. Computational modelling of postbuckling behavior of composite T-stiffened panels with different bonding methods. Compos. Part B. 2019, 166, 247–256. [Google Scholar] [CrossRef]
  11. Coudor, P.; Van der Veen, S.; Beakou, A. Global-Local Analysis of Bonded Skin-to-Stiffener Joints in Post-Buckled Panels. In Proceedings of the 25th ICAS Congress, Hamburg, Germany, 3–8 September 2006; Springer: Berlin/Heidelberg, Germany; ISBN 0953399176.
  12. Greenhalgh, E.; Meeks, C.; Clarke, A.; Thatcher, J. The effect of defects on the performance of post-buckled CFRP stringer-stiffened panels. Compos. Part A. 2003, 34, 623–633. [Google Scholar] [CrossRef]
  13. Anyfantis, K.N.; Tsouvalis, N.G. Post Buckling Progressive Failure Analysis of Composite Laminated Stiffened Panels. Appl. Compos. Mater. 2012, 19, 219–236. [Google Scholar] [CrossRef]
  14. Zarouchas, D.S.; Alderliesten, R.C. The effect of disbonds on stability aspects of adhesively bonded aluminum panels during compression loading. Thin-Walled Struct. 2015, 96, 372–382. [Google Scholar] [CrossRef]
  15. Ji, R.; Zhao, L.; Wang, K.; Liu, F.; Gong, Y.; Zhang, J. Effects of debonding defects on the postbuckling and failure behaviors of composite stiffened panel under uniaxial compression. Compos. Struct. 2021, 256, 113–121. [Google Scholar] [CrossRef]
  16. Ausili, F. Critical Load of A Stiffened Panel by FEM: Effect of the Presence of a Debonding and Analysis of the Tensional Status at the Apex of the Defect. Master’s Thesis, Politecnico di Torino, Turin, Italy, 5 April 2022. [Google Scholar]
  17. Parente, G. Critical Conditions and Stress State of a Stiffened Panel with Defect. Master’s Thesis, Politecnico di Torino, Turin, Italy, 29 October 2024. [Google Scholar]
  18. Frulla, G. Simplified procedure for damage-oriented evaluation of a stiffened panel with skin-stringer de-bonding in pre-liminary design stage. Aeronaut. Aerosp. Open Access J. (AAOAJ) 2021, 5, 95–101. [Google Scholar] [CrossRef]
  19. Hexagon, A.B. MSC Patran 2023.1 User’s Guide; Hexagon AB: Irvine, CA, USA, 2023. [Google Scholar]
  20. Hexagon, A.B. MSC Nastran 2023.1. Quick Reference Guide; Hexagon AB: Irvine, CA, USA, 2023. [Google Scholar]
  21. Timoshenko, S.P.; Gere, J.M. Theory of Elastic Stability; McGraw-Hill: New York, NY, USA, 1961; ISBN 978-0-486-47207-2. [Google Scholar]
  22. Singer, J.; Arbocz, J.; Weller, T. Buckling Experiments: Experimental Methods in Buckling of Thin-Walled Structures: Basic Concepts, Columns, Beams and Plates; John Wiley & Sons: Hoboken, NJ, USA, 2000; ISBN 978-0471956617. [Google Scholar]
  23. Bazant, Z.P.; Cedolin, L. Stability of Structures: Elastic, Inelastic, Fracture, and Damage Theories; World Scientific: Singapore, 2010; ISBN 978-9814317023. [Google Scholar]
  24. Ibeabuchi, V.T.; Ibearugbulem, M.O.; Njoku, K.O.; Ihemegbulem, E.O.; Okorie, P.O. A Contribution to Analytical Solutions for Buckling Analysis of Axially Compressed Rectangular Stiffened Panels. Rev. Compos. Matér. Av. 2021, 31, 301–306. [Google Scholar] [CrossRef]
  25. ESDU 80023; Buckling of Rectangular Specially Orthotropic Plates. Engineering Sciences Data Unit: London, UK, 2000; ISBN 978-0-85679-306-6.
  26. Zou, D.; Bisagni, C. Skin-Stiffener Separation in T-Stiffened Composite Specimens in Postbuckling Condition. J. Aerosp. Eng. 2018, 31, 04018027. [Google Scholar] [CrossRef]
  27. Orifici, A.C.; Lauterbach, S.; Abramovich, H.; Thomson, R.S.; Wagner, W.; Balzani, C. Analysis of damage sensitivity and collapse in postbuckling fibre-reinforced multi-stiffener panels. In Proceedings of the 2nd International Conference on Buckling and Postbuckling Behaviour of Composite Laminated Shell Structures, Braunschweig, Germany, 3–5 September 2008. [Google Scholar]
  28. Degenhardt, R.; Rolfes, R.; Zimmermann, R.; Rohwer, K. COCOMAT—Improved material exploitation of composite airframe structures by accurate simulation of postbuckling and collapse. Compos. Struct. 2006, 73, 175–178. [Google Scholar] [CrossRef]
  29. Van Rijn, J.C.F.N.; Wiggenraad, J.F.M. A Seven-Point Bending Test to Determine the Strength of the Skin-Stiffener Interface in Composite Aircraft Panels; Technical Publication NLR-TP-2000-044; National Aerospace Laboratory NLR: Amsterdam, The Netherlands, 2000. [Google Scholar]
  30. Bonanni, R.; Abrate, S. The behavior of damage-tolerant hat-stiffened composite panels loaded in uniaxial compression. Compos. Part A Appl. Sci. Manuf. 2001, 32, 1255–1262. [Google Scholar] [CrossRef]
Figure 1. Geometry of model: (a) top view of structure with dimensions; (b) front view of repetitive element with detailed dimensions.
Applmech 06 00007 g001
Figure 2. Mesh of stiffened panel with defect: (a) structure with boundary conditions and refined mesh around 100 mm debonding defect, highlighted in red; (b) close-up of debonding zone under compression, showing separation between skin and stiffener.
Applmech 06 00007 g002
Figure 3. BLF trend as function of defect size, with labels indicating BLF values for each defect dimension.
Applmech 06 00007 g003
Figure 4. Visualization of first buckling mode obtained from Sol 105 analysis: (a) configuration with 100 mm debonding; (b) configuration with 120 mm debonding; (c) configuration with 150 mm debonding; (d) configuration with 200 mm debonding.
Applmech 06 00007 g004
Figure 5. Displacements from nonlinear static analysis (Sol 400) for stiffened panel with 100 mm debonding: (a) imposed displacement of 0.675 mm; (b) imposed displacement of 0.8 mm.
Applmech 06 00007 g005
Figure 6. Trend of out-of-plane displacements as function of load level for 100 mm debonding.
Applmech 06 00007 g006
Figure 7. Peeling stresses σ x x along half of adhesive layer for 100 mm debonding under different load levels, symmetric about structure’s centreline.
Applmech 06 00007 g007
Figure 8. Shear stresses τ z x along half of adhesive layer for 100 mm debonding under different load levels, symmetric about structure’s centreline.
Applmech 06 00007 g008
Figure 9. Displacements from nonlinear static analysis (Sol 400) for stiffened panel with 150 mm debonding: (a) imposed displacement of 0.55 mm; (b) Imposed displacement of 0.675 mm; (c) imposed displacement of 0.8 mm; (d) imposed displacement of 1 mm.
Applmech 06 00007 g009
Figure 10. Trend of out-of-plane displacements as function of load level for 150 mm debonding.
Applmech 06 00007 g010
Figure 11. Peeling stresses σ x x along half of adhesive layer for 150 mm debonding under different load levels, symmetric about structure’s centreline.
Applmech 06 00007 g011
Figure 12. Shear stresses τ z x along half of adhesive layer for 150 mm debonding under different load levels, symmetric about structure’s centreline.
Applmech 06 00007 g012
Figure 13. Displacements from nonlinear static analysis (Sol 400) for stiffened panel with 250 mm debonding: (a) imposed displacement of 0.3 mm; (b) imposed displacement of 0.6 mm; (c) imposed displacement of 0.8 mm; (d) imposed displacement of 1 mm.
Applmech 06 00007 g013
Figure 14. Trend of out-of-plane displacements as function of load level for 250 mm debonding.
Applmech 06 00007 g014
Figure 15. Peeling stresses σ x x along half of adhesive layer for 250 mm debonding under different load levels, symmetric about structure’s centreline.
Applmech 06 00007 g015
Figure 16. Shear stresses τ z x along half of adhesive layer for 250 mm debonding under different load levels, symmetric about structure’s centreline.
Applmech 06 00007 g016
Figure 17. Trend of Von Mises stresses at defect tip as function of load level for various debonding sizes.
Applmech 06 00007 g017
Figure 18. Variation in critical design parameter with defect length for different load levels. The dashed line marks the zero value, below which the critical design parameter becomes negative, indicating the onset of static adhesive failure.
Applmech 06 00007 g018
Figure 19. Displacements from nonlinear analysis for stiffened panel with 250 mm debonding and upward perturbation: (a) 0.6 mm imposed displacement; (b) 0.8 mm imposed displacement.
Applmech 06 00007 g019
Figure 20. Trend of out-of-plane displacements as function of load level for 250 mm debonding with upward perturbation, measured at skin and stiffener node at centre of defect.
Applmech 06 00007 g020
Figure 21. Stress distributions along adhesive layer for 250 mm debonding with upward perturbation: (a) σ z z stresses at 80% of applied load, highlighting normal stress concentrations at defect edges; (b) τ z x stresses at 80% of applied load, showing shear stress peaks in same critical zones.
Applmech 06 00007 g021
Table 1. Mechanical properties of materials used in FEM panel model.
ComponentMaterialE (MPa)Poisson’s RatioDensity (kg/m3)Stress at Yield (MPa)Hardening Slope (MPa)
Plate/StiffenersAl Alloy73,0000.332700--
AdhesiveEpoxy Resin27500.35114030275
Table 2. Peeling, shear, and Von Mises stresses calculated at central adhesive node at defect tip for 250 mm debonding configuration, under two hardening slope conditions (275 MPa and 85 MPa) and different load levels.
Type of Stress% of LoadHS 1 = 275 MPa (MPa)HS 1 = 85 MPa (MPa)
σ z z 60%49.8647.19
80%60.5654.75
τ z x 60%−10.89−8.67
80%−13.37−9.18
Von Mises stress60%38.1234.17
80%43.7036.33
1 HS indicates hardening slope adopted for adhesive layers in FEM.
Disclaimer/Publisher’s Note: The statements, opinions and data contained in all publications are solely those of the individual author(s) and contributor(s) and not of MDPI and/or the editor(s). MDPI and/or the editor(s) disclaim responsibility for any injury to people or property resulting from any ideas, methods, instructions or products referred to in the content.

