Article

Analysis of the Surface Quality Characteristics in Hard Turning Under a Minimal Cutting Fluid Environment

1
Department of Mechanical Engineering, Dwarkadas J. Sanghvi Engineering College, Mumbai 400056, Maharashtra, India
2
Symbiosis Institute of Technology, Symbiosis International (Deemed) University, Pune 412115, Maharashtra, India
*
Authors to whom correspondence should be addressed.
Appl. Mech. 2025, 6(1), 5; https://doi.org/10.3390/applmech6010005
Submission received: 26 November 2024 / Revised: 5 January 2025 / Accepted: 9 January 2025 / Published: 17 January 2025

Abstract

:
This paper analyzes the surface quality characteristics, such as arithmetic average roughness (Ra), maximum peak-to-valley height (Rt), and average peak-to-valley height (Rz), in hard turning of AISI 52100 steel using a (TiN/TiCN/Al2O3) coated carbide insert under a minimal cutting fluid environment (MCFA). MCFA, a sustainable high-velocity pulsed jet technique, reduces harmful effects on human health and the environment while improving machining performance. Taguchi’s L27 orthogonal array was used to conduct the experiments. The findings showed that surface roughness increases with feed rate, identified as the most influential parameter, while the depth of cut shows a negligible effect. The main effects plot of signal-to-noise (S/N) ratios for the combined response of Ra, Rt, and Rz revealed the optimal cutting conditions: cutting speed of 140 m/min, feed rate of 0.05 mm/rev, and depth of cut of 0.3 mm. Feed rate ranked highest in influence, followed by cutting speed and depth of cut. The lower values of surface roughness parameters were observed in the ranges of Ra ≈ 0.248–0.309 µm, Rt ≈ 2.013–2.186 µm, and Rz ≈ 1.566 µm at a feed rate of 0.05–0.07 mm/rev. MCFA-assisted hard turning reduces surface roughness by 35–40% compared to dry hard turning and 10% to 24% when compared to the MQL technique. Moreover, this study emphasizes the significant environmental benefits of MCFA, as it incorporates minimal eco-friendly cutting fluids that minimize ecological impact while enhancing surface finish.

1. Introduction

Machining processes are fundamental to the manufacturing sector, facilitating the production of high-precision components with superior dimensional accuracy and surface quality [1]. In this context, hard turning is a highly economical and efficient alternative to grinding for machining hardened steel. The research conducted by Samantaraya and Lakade, 2020 [2], highlights the increasing demand for components exhibiting superior surface integrity, hence necessitating the optimization of hard-turning processes to improve surface quality. Anand et al., 2019 [3], highlighted that traditional hard turning often employs flood coolant to address issues like heat generation, tool wear, and surface integrity. However, the use of flood coolant raises significant economic and environmental concerns, including high coolant consumption, disposal costs, and health hazards. As a result, there is a growing focus on sustainable machining practices, particularly techniques involving minimal cutting fluid application (MCFA). MCFA uses small, precisely controlled pulses of the cutting fluid directed at the cutting zone, thereby reducing waste while maintaining or improving machining performance and mitigating environmental impacts.
A product’s surface finish is a key indicator of its quality and precision during the manufacturing process. Singh and Rao, 2007 [4], observed that the feed rate, followed by the nose radius and cutting speed, has the greatest impact on surface finish when turning AISI 52100 (60 HRC) steel with mixed ceramic inserts. Similarly, Zhang et al., 2007 [5], investigated the surface integrity characteristics when turning hardened steel of 62–63 HRC using CBN cutting tool inserts and produced the finest surface integrity. The feed rate was discovered to be the most influential surface roughness parameter. Asiltürk and Akkuş, 2011 [6], conducted hard-turning experiments on AISI 4140 steel with coated carbide inserts. The feed rate and the interactions between feed rate and cutting speed were found to have a significant effect on surface roughness (Ra and Rz). Aouici et al., 2012 [7], used ANOVA with RSM to evaluate the effect of process parameters on surface roughness measurements (Ra and Rt) in the hard turning process for AISI H11 steel. The results showed that the feed rate significantly influenced surface roughness, whereas the cutting speed and depth of cut were comparatively less significant. Shihab et al., 2014 [8], observed that the lower depth of cut, coupled with a higher cutting speed, reduced surface integrity during dry hard turning of AISI 52100 steel using a central composite design based on response surface methodology (RSM). Sankar et al., 2017 [9], examined how cutting parameters affected surface roughness during hard turning of bearing steel using PCBN cutting tool inserts. The most important parameters influencing surface roughness were determined to be cutting speed, tool nose radius, and the interaction of the cutting speed and feed rate. Wainstein et al., 2018 [10], studied the development of wear-resistant coatings using tribe-oxides, which enhance wear behavior. The research uses physical vapor deposition (PVD) to fabricate hard-wearing coatings on tool surfaces for high-speed cutting, focusing on single and multi-layered composite coatings with nanoscale structures. Allu et al., 2019 [11], studied the influence of cutting speed, feed rate, depth of cut, insert type, and tool nose radius on surface roughness during dry hard turning of AISI 52100 steel using an analysis of variance. According to the findings, the most critical parameter is the type of insert (45.68%), followed by the feed rate (17.98%) and the tool nose radius (34.11%). Ahmed et al., 2020 [12], examined the effects of workpiece hardness and cutting parameters on surface roughness. According to the analysis, surface roughness increases with feed rate and decreases with workpiece hardness.
The frictional forces of two sliding surfaces can be lowered by rapidly changing the width of the lubricant-filled gap. Varadrajan et al., 2002 [13], used the same principle to develop the MCFA technique, wherein a high-velocity, narrow-pulsing jet of cutting fluid is used to change the width of the lubricant-filled gap between the tool rake face and the chip, leading to a lower cutting temperature. Vikram Kumar and Ramamoorthy, 2007 [14], carried out extensive research on the hard turning of AISI 4340 (35 HRC) steel with TiCN- and ZrN-coated carbide tools under wet and MCFA environments. The cutting tools performed better with lower usage of a high-velocity pulsed jet cutting fluid than either dry turning or conventional wet turning. However, the performance was evaluated with respect to cutting force and surface finish. The same findings were reported in a study that sought to determine the performance of TiCN- and TiAlN-coated tools while turning hardened AISI 4340 steel within the same conditions. According to studies, the performance during machining with an applied fluid level is very dependent on the exit pressure from the nozzle and the volume of the used cutting fluid [15]. Thepsonthi et al., 2009 [16], reported that minimal cutting fluid application in pulsed-jet form offers a superior surface finish, less tool wear, and a lower cutting temperature compared to flood and dry cutting, making it suitable for high-speed end milling of hardened steel. Moreover, the pulsed-jet application significantly reduces cutting fluid consumption at a rate of 2 mL/min, preventing the generation of harmful oil mist, reducing negative effects on the environment, improving machining performances, and reducing total production costs. Sapian et al., 2010 [17], indicated that minimal CF’s integrated pulse jet application performed better than dry cutting and flood application in terms of surface finish and tool wear. Robinson Gnanadurai and Varadarajan, 2012 [18], reported that the MCFA technique is preferable to dry machining hardened alloy steel. Tool wear, tool-chip contact length, cutting force, temperature, and surface roughness were significantly reduced during the hard turning of AISI 4340 alloy steel by the addition of an auxiliary high-velocity pulsing jet on the backside of the chip. Paul and Varadarajan, 2013 [19], observed that turning hardened alloy steel with semi-solid lubricants in an MCFA environment significantly reduced tool wear, surface roughness, cutting force, and cutting temperature. Paul et al., 2016 [20], indicated that MCFA is a great substitute for both dry and wet turning since it significantly decreases tool vibration and increases the cutting performance. Parameters were optimized at a fluid application of 8 mL/min, pulse frequency of 500 pulses/min, and injector pressure of 100 bar. Raj et al., 2015 [21], showed that the minimal application of soybean oil-based cutting fluid improves the cutting performance, leading to a better surface finish and lower cutting temperatures in the hard turning of AISI 4340 steel. Using the MCFA technique, this edible oil provides an alternative cutting fluid over mineral oil-based cutting fluids without storage and disposal issues. Raj et al., 2016 [22], compared the performance of MCFA with dry, wet, and MQL-assisted hard turning of OHNS steel with respect to tool wear. Tool wear was observed to be 0.08 µm, 0.05 µm, 0.34 µm, and 0.018 µm in dry, wet, MQL, and MCFA environments, respectively. The MCFA outperformed dry turning, wet turning, and hard turning with MQL on tool wear. This technology is more environmentally friendly and technologically superior to MQL-assisted hard turning. Raj et al., 2016 [23], discovered that MCFA reduced surface roughness by 35% and enhanced chip characteristics when compared to MQL-assisted hard turning of AISI H13 tool steel under the same cutting conditions. Benedicto et al., 2017 [24], reported that alternative techniques such as dry machining, minimal cutting fluid, solid lubricants, cryogenic, and gaseous cooling proved to be more efficient than traditional lubrication and cooling methods. However, there are still applications where cutting fluids cannot be removed. Gajrani and Sankar, 2020 [25], recognized the MCFA technique as an effective and cost-efficient substitute for traditional wet and dry machining methods for hardened alloy steels. An eco-friendly cutting fluid applied minimally with the MCFA technique was found to reduce the environmental impact and significantly improve machining performance compared to traditional flood cooling. Anand et al., 2019 [3], reported that MCFA-assisted hard turning of OHNS steel reduced the cutting force, cutting temperature, and surface roughness by 15.85%, 6.80%, and 23.52%, respectively, compared to MQL hard turning. Kumar et al., 2022 [26], observed that the application of eco-friendly nano-cutting fluid in machining gives desired level of surface finish. Mane et al., 2020 [27], examined the effect of cutting parameters on surface roughness during the hard turning of AISI 52100 steel (58 HRC) in the MCFA environment. The findings indicated that the feed rate has a considerable effect on surface roughness, followed by cutting speed. However, the depth of cut showed negligible influence on surface roughness (Ra). Further, the MCFA method proved helpful in improving the surface finish by hard-turning and supporting a greener environment on the shop floor. Minimum quantity lubrication (MQL) is a machining technique that uses a minimal amount of cutting fluid delivered directly to the cutting zone as a fine mist. MQL machining outperforms dry and conventional methods due to its ability to reduce cutting temperature, improve chip–tool interaction, maintain sharp edges, reduce cutting forces and flank wear, improve tool life and surface finish, and reduce manufacturing costs and environmental hazards [28,29,30,31]. Roy et al., 2020 [32], reported that the feed rate, depth of cut, and cutting speed are the principal parameters influencing the surface roughness. This investigation on pulsating MQL-assisted hard turning of AISI 4340 steel recorded a maximum surface roughness of 0.99 µm. Hamran et al., 2020 [33], found that advances in minimum quantity lubrication generally outperform conventional systems, resulting in improved surface finish, reduced tool wear, and lower cutting forces. Zaman and Dhar 2020 [34], used the desirability function approach to decide the optimum MQL conditions for turning Ti–6Al–4V alloys. The best optimum MQL conditions found include a nozzle diameter of 0.5 mm, a primary nozzle angle of 20°, an air pressure of 20 bar, and an oil flow rate of 50 mL/h, resulting in a composite desirability value of 0.8301. Chavan and Sargade, 2020 [35], illustrated that the maximum value of surface roughness Ra is 1.8 μm in dry hard turning, whereas the minimum value of 0.34 μm is obtained using MQL, which enhanced Ra values by 26% as compared to dry machining since friction and tool wear are minimized in MQL. Zhang et al., 2012 [36], indicated that while MQL is frequently utilized, its limited cooling capacity restricts its application. Elmunafi et al., 2015 [37], observed that MQL is an effective technique for machining hard stainless steel with coated carbide cutting tools. However, the cutting temperature imposed limitations on MQL machining since the effect of the oil mist is reduced at higher velocity due to evaporation. MQL’s drawbacks include inadequate cooling, limited lubrication at the tool–workpiece interface, accelerated tool wear, environmental and health concerns from misting, material compatibility issues, high initial costs, and reduced effectiveness in complex or high-speed machining operations.
Do et al., 2020 [38], found that a lower feed rate, lower depth of cut, and higher cutting speed are the optimum cutting parameters for minimizing the surface roughness during the milling of AISI H13 steel under silica-based NF-MQL cooling conditions. Gajrani et al., 2021 [39], exhibited enhanced surface roughness in hard machining utilizing micro-textured tools and little nano-green cutting fluid (NGCF), attributed to superior NGCF penetration at the chip–tool interface. Ibrahim et al., 2022 [40], reported increased heat dissipation under NF-MQL conditions through infrared thermography during the hard turning of AISI D2 steel, which was attributed to the higher heat transfer coefficient due to the inclusion of ZnO nanoparticles in the base fluid. Tuan et al., 2022 [41], noticed that MQCL outperformed MQL, with Al2O3 nanofluid resulting in a superior surface finish compared to MoS2 nanofluid. The investigation established that surface roughness is primarily affected by the feed rate, whereas fluid type, nanoparticle concentration, and cutting speed displayed a relatively lesser influence. According to Sarikaya et al., 2021 [42], the progress in MQL will provide a clear direction for applying hybrid cooling techniques aimed at increasing heat transfer, lubrication, and sustainability.
Mallick et al., 2023 [43], observed that the application of the dual-nozzle MQL led to a notable decrease in friction between the contact surfaces in the cutting zone, which, in turn, enhanced the surface quality (Ra) values, which ranged from 0.448 to 1.265 µm during the hard turning of AISI D2 steel. Padhan et al., 2021 [44], observed that, during the hard turning of AISI 52100 steel, a higher cutting speed reduced the cutting force and surface roughness, whereas an increased feed rate raised the cutting force, surface roughness, and temperature. The MQL technique was found to enhance environmental benefits, promote cleaner production, and contribute to sustainability. Kawade et al., 2022 [45], reported that eco-friendly methods, such as minimum quantity lubrication (MQL), nanofluids combined with MQL, and cold air-assisted MQL, demonstrate greater economic and operational efficiency compared to cryogenic cooling. Bio-based coolants, such as vegetable oils, provide advantages in terms of biodegradability and performance.
Li et al., 2024 [46], indicated that MQL is acknowledged as a sustainable and practical cutting technique. Nonetheless, perspectives on its machining performance differ significantly. Some studies have indicated that the MQL can deliver impressive processing performance. However, opinions suggest that the MQL has several limitations, particularly when it comes to difficult-to-cut materials in engineering applications. Çetindağ et al., 2024 [47], reported that the hybrid lubricating–cooling conditions enhance surface quality and increase compressive residual stresses on the machined surface during hard turning. Korkmaz et al., 2024 [48], indicated that excessive heat generation during machining adversely affects surface integrity and tool performance, making the absence of coolant undesirable. MQL is relevant for the application of cutting fluid lubricants in specific contexts. Dry machining without cutting fluids is impractical due to its negative consequences, necessitating further research into the shift to a sustainable, green economy. Pimenov et al., 2024 [49], highlighted the potential for technological advancements in manufacturing processes for difficult-to-machine materials through advanced lubricating and cooling techniques, enhancing quality and precision, reducing environmental impact, and potentially leading to cost savings through extended tool life and reduced wear. Ali et al., 2024 [50], suggested developing bio-based, eco-friendly lubricants for minimal cutting fluid application and investigating green manufacturing practices to improve cooling/lubrication processes.
The literature underscores the significance of feed rate and cutting speed as dominant parameters influencing surface roughness during the hard turning of hardened steels. Many researchers considered Ra to assess surface quality, though Ra alone cannot fully characterize surface integrity, particularly fatigue resistance and crack propagation. Important characteristics like Rt and Rz that are more sensitive to stress concentrations and functional performance are often overlooked, thereby underlining the need for a more comprehensive evaluation of surface integrity with respect to surface quality characteristics. MCFA is a promising alternative to MQL due to its precise fluid delivery to the cutting zone, enabling better cooling, lubrication, and heat dissipation. MCFA addresses key limitations of MQL, such as the poor penetration of the mist at the tool–chip and tool–workpiece interface, inadequate heat dissipation, and chip evacuation while mitigating mist-related safety concerns. MCFA can enhance surface integrity, tool life, and machining performance, aligning with sustainable manufacturing principles by reducing fluid usage and environmental impacts. Recent studies on MCFA are limited, and this indicates a significant research gap and an opportunity to explore its potential further. Investigating its performance across different materials, machining operations, and cutting fluid types, including nanofluids, could yield valuable insights into its advantages. This highlights MCFA’s untapped potential and positions it as a critical area of interest in machining science. The following objectives are defined to address this research gap:
  • To investigate the effects of cutting parameters (feed rate, cutting speed, depth of cut) on surface roughness parameters under the MCFA environment with eco-friendly cutting fluid during hard turning;
  • To optimize cutting parameter settings to achieve superior surface quality while minimizing environmental impacts;
  • To compare the effectiveness of the MCFA technique with a dry and MQL environment in hard turning processes.

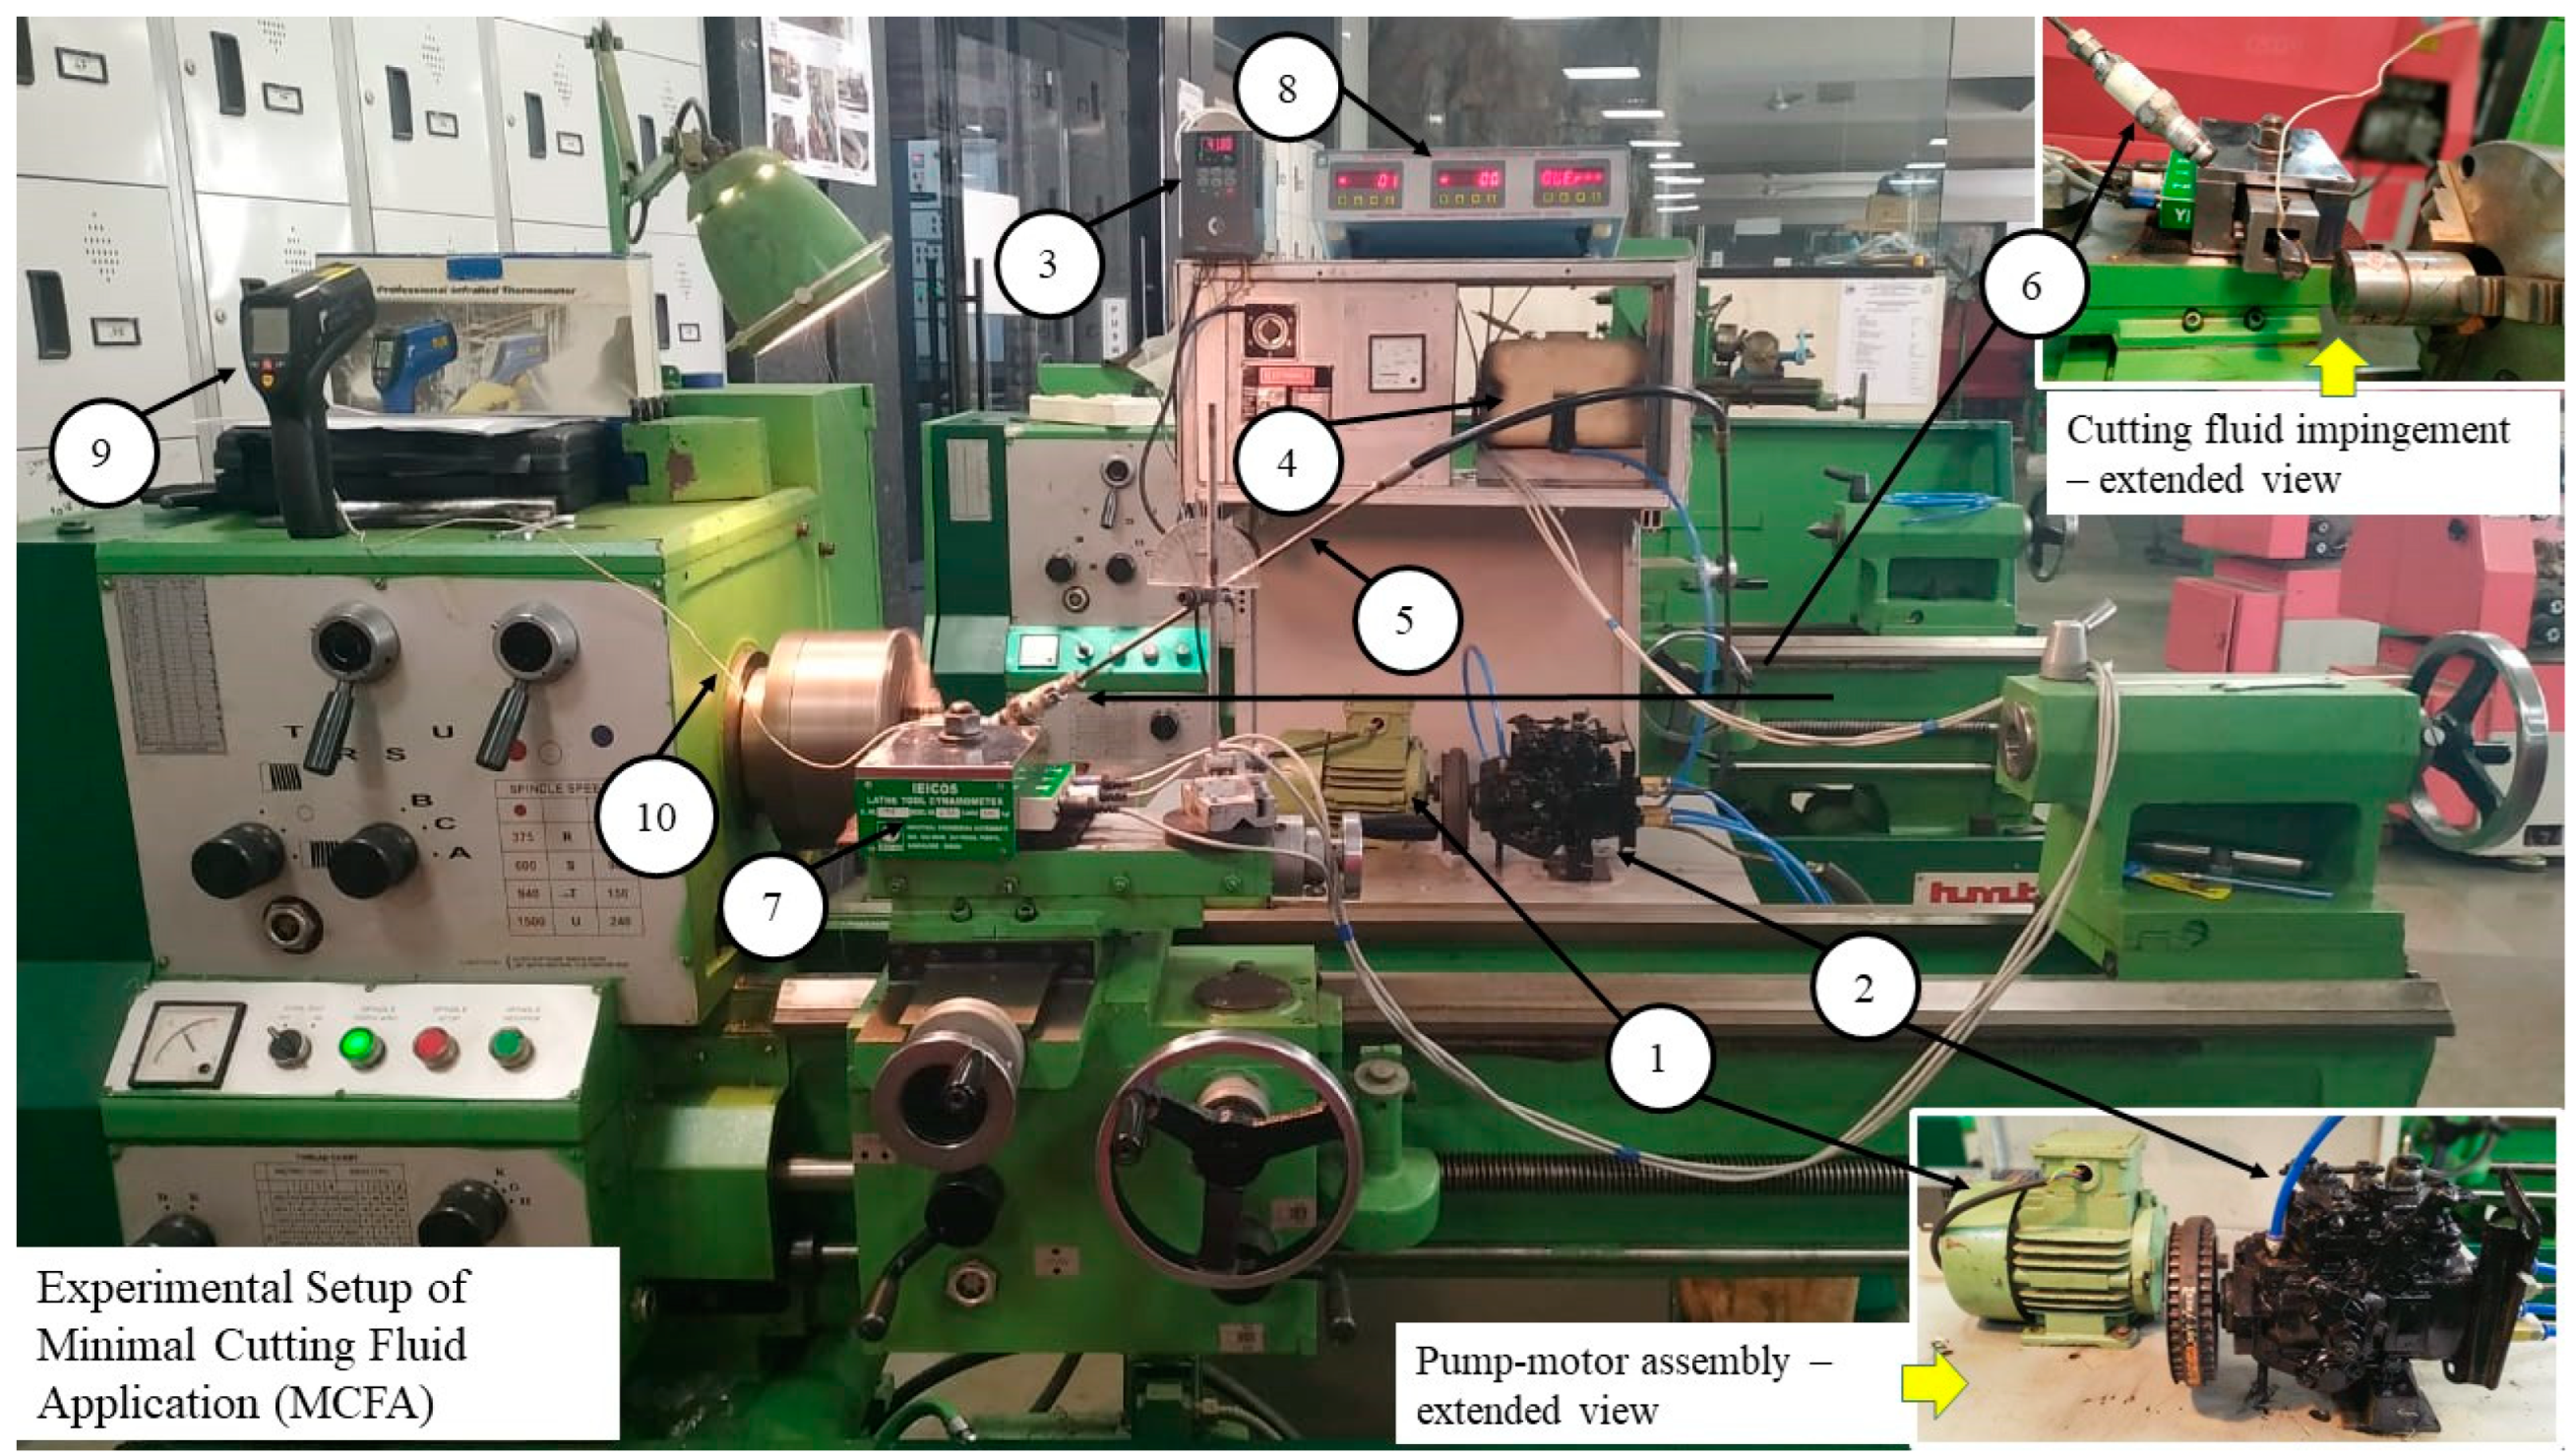
2. Materials and Methods

2.1. Workpiece Material

This study utilized AISI 52100 hardened alloy steel with a hardness rating of 58 HRC. This material is extensively used in the automotive sector for high-wear applications, such as bearings, spindles, and forming rolls, due to its superior wear resistance and capacity for high-quality surface finishes.

2.2. Cutting Tool and Inserts

The cutting tool inserts were selected based on previous research findings and manufacturers’ standards. The selected inserts were of grade HK150 MTCVD multilayer-coated carbide (TiN/TiCN/Al2O3). A PCLNR 2020 K12 tool holder was used with insert type CNMG120408, which is known for its strength and resistance to wear [27]. Experiments were carried out using an HMT NH-18 lathe machine that is equipped with an MCFA system. This method enabled the precise application of a small quantity of the cutting fluid to the cutting zone, thereby facilitating improved cooling and lubrication while minimizing impacts on the surrounding environment.

2.3. Cutting Fluid and Application Parameters

This investigation used SUN Cut ECO-33, a semi-synthetic and environmentally friendly cutting fluid, as the cutting medium owing to its superior lubricating and cooling characteristics. The parameters for the cutting fluid were established at a pressure of 100 bar, a flow rate of 12 mL/min, a pulse frequency of 300 pulses per min, and a nozzle stand-off distance of 20 mm [51].

2.4. Experimental Design

The experimental design utilized Taguchi’s L27 Orthogonal Array, allowing for a streamlined investigation into various parameters, including cutting speed, feed rate, depth of cut, and fluid application. This method reduced the necessary number of experiments while providing an in-depth analysis of the multiple factors influencing surface quality. The statistical analysis was performed using Minitab software (version 21.1.0), which produced main effects plots, interaction plots, and signal-to-noise (S/N) ratios to identify the optimal cutting conditions. ANOVA was used to identify the significant parameters influencing surface roughness by examining the parameters’ individual and interaction effects. In addition, the Origin 2020 (version 9.7) software was used to generate the contour plots representing the clear interactions amongst the cutting settings.

2.5. Surface Roughness Measurement

The Talysurf4 surface roughness measurement device was used to measure the surface roughness of the components after machining. Three important parameters that are key measurements for surface finish quality in precision applications were focused on, including Ra, Rt, and Rz.
Figure 1 presents the experimental setup for minimal cutting fluid application (MCFA) specifically designed to examine its effects on high-precision machining processes, where control over temperature, reduction in cutting forces, and improvement in surface quality are critical. This setup incorporates an AC motor, fluid pump, variable frequency drive (VFD), high-pressure fluid lines, nozzle, dynamometer, infrared thermometer, and thermocouples, allowing for a thorough investigation of eco-friendly cutting fluids applied in minimal quantities to enhance machining performance while reducing environmental impact and fluid consumption. Table 1 outlines the experimental design using Taguchi’s L27 orthogonal array and presents experimental data on the influence of cutting parameters—cutting speed (v), feed rate (f), and depth of cut (d)—on surface roughness characteristics (Ra, Rt, Rz) during machining of hardened steel. The table also illustrates how variations in the cutting parameters directly affect the S/N ratio, offering insights into the optimal conditions for improving surface integrity.

3. Result and Discussion

3.1. ANOVA for Surface Quality Characteristics

The ANOVA analysis provided insights into factors affecting surface roughness characteristics. Table 2 presents the ANOVA results for average surface roughness (Ra), revealing statistical significance with an F-value of 55.08 and a p-value of 0.000, confirming a substantial influence of the independent variables on surface roughness. Cutting speed (v) and feed rate (f) emerged as primary contributors, accounting for 14.14% and 55.49% of total variance, respectively. Feed rate exerted the most substantial effect, as indicated by a high F-value of 284.47 and p-value of 0.000. Depth of cut (d) also demonstrated statistical significance, contributing 2.91% with an F-value of 14.92 and a p-value of 0.001. Significant interaction effects were observed between cutting speed and feed rate (vf), contributing 15.50% with an F-value of 79.49, and between feed rate and depth of cut (fd), contributing 1.82% with an F-value of 9.33. In contrast, the quadratic terms for cutting speed (v × v) and feed rate (f × f) showed no significant impact, highlighting the greater relevance of their linear effects.
Table 3 presents the ANOVA analysis for maximum peak-to-valley height (Rt). The overall result indicated significant statistical relevance, with an F-value of 15.85 and a p-value of 0.000, confirming that the independent variables substantially affect peak-to-valley height. Feed rate (f) emerged as the most influential factor, contributing 56.63% to the variance, as evidenced by its high F-value of 90.43 and a p-value of 0.000. Cutting speed (v) also exhibited significance, contributing 4.98% with an F-value of 7.96 (p-value of 0.012). Depth of cut (d) contributed 2.68%, with an F-value of 4.29 (p-value of 0.054), nearing significance. Quadratic terms for cutting speed (v × v) and feed rate (f × f) were significant, with F-values of 4.81 (p-value of 0.042) and 11.76 (p-value of 0.003), respectively. The interaction between cutting speed and feed rate (v × f) contributed 4.74% with an F-value of 7.57 (p-value of 0.014). Similarly, the interaction between feed rate and depth of cut (f × d) was also significant, with an F-value of 6.15 (p-value of 0.024). The error term accounted for 10.65% of the total variance.
Table 4 exhibits the results of the ANOVA analysis for average peak-to-valley height (Rz). The analysis indicated a statistically significant model with an F-value of 22.40 and a p-value of 0.000, confirming that the independent variables significantly affect Rz. Among the factors, feed rate (f) emerged as the most influential, contributing 47.80% to the variance, with an F-value of 104.49 and a p-value of 0.000. Cutting speed (v) also exhibited significant effects, contributing 18.22%, with an F-value of 39.82 and a p-value of 0.000. Depth of cut (d) contributed 2.83%, with an F-value of 6.19 and a p-value of 0.024. The quadratic term for depth of cut (d × d) was statistically significant, with an F-value of 6.35 and a p-value of 0.022. In contrast, the quadratic terms for cutting speed (v × v) and feed rate (f × f) were insignificant. Interaction effects between cutting speed and feed rate (v × f) contributed 11.40% with an F-value of 24.92 and a p-value of 0.000. At the same time, the interaction between cutting speed and depth of cut (v × d) was also significant, with an F-value of 10.03 and a p-value of 0.006.

3.2. Effect of Cutting Parameters on the Surface Quality Characteristics

The main effect plot indicated a significant increase in surface quality characteristics, specifically Ra, Rt, and Rz, with elevated feed rates. Higher feed rates lead to an increase in thrust force, which induces vibrations and generates excess heat. This effect enhances the plastic deformation of the workpiece, resulting in higher values for Ra, Rt, and Rz. The smaller-the-better approach computed the combined signal-to-noise (S/N) ratio. Based on this computed combined S/N ratio, the response table for cutting speed, feed rate, and depth of cut was determined by averaging the combined S/N ratio for each level of the input parameters. Table 5 presents the combined signal-to-noise (S/N) ratios for the surface roughness parameters, including cutting speed (v), feed rate (f), and depth of cut (d). Each level indicates the effect of varying settings on the S/N ratios, with negative values reflecting the response measurements. The “Delta” values show the range of S/N ratios for each parameter, highlighting the feed rate (Delta = 3.080) as the most influential factor, followed by cutting speed (Delta = 1.248) and depth of cut (Delta = 1.083). The ranking indicates that feed rate ranked first regarding its effect on surface roughness, while cutting speed ranked next, followed by depth of cut. These findings emphasize optimizing feed rate to improve surface quality in machining processes. Table 5 elaborates on the combined S/N ratios for the surface roughness parameters Ra, Rt, and Rz.
Additionally, the response table enabled the construction of a main effects plot for the S/N ratio. The maximum value of each parameter in the S/N plot identified the optimal settings for minimizing Ra, Rt, and Rz, which included a cutting speed of 140 m/min, a feed rate of 0.05 mm/rev, and a depth of cut of 0.3 mm, as shown in Figure 2.
The influence of cutting parameters and their interaction effects were analyzed by using contour plots. Figure 3 shows the interaction effect of cutting speed and feed rate on surface roughness parameters (Ra, Rt, and Rz). The surface roughness parameters exhibited a strong increasing trend with an increase in the feed rate while cutting speed demonstrated a relatively lesser influence on surface roughness. However, combining a medium feed rate and higher cutting speed significantly reduced the surface roughness parameters. Figure 3a represents the contour plot of surface roughness (Ra) as a function of cutting speed (v) and feed rate (f). The plot revealed a clear relationship: lower surface roughness values occurred at higher cutting speeds and lower feed rates. Specifically, as the cutting speed increased from 80 m/min to 140 m/min, and the feed rate was reduced from 0.15 mm/rev to 0.05 mm/rev, the surface roughness (Ra) improved significantly. At a cutting speed of 140 m/min and a 0.05 mm/rev feed rate, the Ra reached as low as 0.188 µm, indicating an excellent surface finish. In contrast, at a lower cutting speed of 80 m/min and a higher feed rate of 0.15 mm/rev, the surface roughness increased to 0.672 µm, indicating a much rougher surface.
The contour plot in Figure 3b illustrates the effect of cutting speed (v) and feed rate (f) on the maximum peak-to-valley height (Rt). The Rt values ranged from approximately 1.84 µm to 3.23 µm. At higher cutting speeds (around 140 m/min) combined with lower feed rates (0.05 mm/rev), Rt values were minimal, measuring 1.840 µm, indicating a smoother surface finish. However, as the feed rate increased to 0.15 mm/rev, particularly at lower cutting speeds (around 80 m/min), Rt values rose significantly, reaching up to 3.225 µm, reflecting a rougher surface. Figure 3c systematically illustrates the relationship between the average peak-to-valley height (Rz), cutting speed (v), and feed rate (f). The surface roughness (Rz) varied between approximately 1.145 µm and 2.830 µm across the given parameter ranges. The surface roughness remained minimal at lower feed rates, around 0.05 mm/rev, mainly when the cutting speed was approximately 140 m/min, where Rz was around 1.145 µm. As the feed rate increased to 0.15 mm/rev, the surface roughness progressively worsened, reaching Rz values of about 2.830 µm, especially when the cutting speed was at 80 m/min. This suggests that increasing feed rates combined with lower cutting speeds contributed to a rougher surface finish.
Figure 4a systematically illustrates the relationship between surface roughness (Ra), cutting depth (d), and feed rate (f). The plot indicated that surface roughness (Ra) varied between approximately 0.18 µm and 0.67 µm within the examined range. The surface roughness remained minimal at lower feed rates, around 0.05 mm/rev, particularly when the cutting depth was around 0.15 mm, resulting in an observed Ra value of approximately 0.18 µm. However, as the feed rate increased to 0.15 mm/rev, the surface roughness significantly increased, reaching Ra values close to 0.55 µm, especially when the cutting depth was about 0.45 mm. This suggests that higher feed rates and cutting depths collectively led to increased surface roughness. Figure 4b depicts the contour plot of Rt as a function of cut and feed rate depth, highlighting the evident influence of these machining parameters on surface roughness. At lower depths of cut, 0.1–0.30 mm, and feed rates of 0.05–0.07 mm/rev, Rt values were minimal, ranging between 1.84 and 2.01 µm, indicating superior surface quality. Conversely, as the depth of cut increased to 0.5 mm and the feed rate to 0.15 mm/rev, the Rt values rose significantly to 2.88 µm, reflecting a deterioration in surface finish. This correlation underscores the critical role of parameter optimization in minimizing surface irregularities during machining processes.
Figure 4c shows the contour plot of Rz for depth of cut versus feed rate. At lower depths of cut 0.1 mm and feed rates 0.05 mm/rev, Rz values ranged between 1.14 µm and 1.56 µm, indicating a finer surface finish. As both the cut and feed rate depth increased to 0.5 mm and 0.15 mm/rev, respectively, Rz exceeded 2.41 µm, signifying a notable increase in surface roughness. The surface roughness parameters increase with feed rate and are the most influential parameter, whereas the depth of cut did not show any significant effect. However, to reduce the tendency to chatter, a low depth of cut is to be maintained. The minimum values of Ra ≈ 0.188–0.309 µm, Rt ≈ 1.840–2.013 µm, and Rz ≈ 1.145–1566 µm were observed at a feed range of 0.05 to 0.07 mm/rev. These contour plots provided a more comprehensive understanding of the relationships between the machining parameters and their combined influence on surface roughness, allowing for better cutting process optimization to achieve the desired surface quality.

3.3. Comparative Study

A comparative study was conducted between dry, MQL, and MCFA-assisted hard turning under the same cutting conditions to evaluate the effectiveness of MCFA. The surface roughness results from dry, MQL, and MCFA-assisted hard turning were compared to assess the feasibility and benefits of MCFA in achieving a high-quality surface finish while minimizing environmental impact. Table 6 presents the Ra values at various cutting conditions under dry, MQL, and MCFA environments.
The findings demonstrated a notable improvement in surface finish by the application of MCFA techniques when machining AISI 52100 steels, with marked reductions in the range of 18% to 46% in surface roughness (Ra) compared to dry hard turning and 10% to 24% when compared to MQL method. These results confirmed the effectiveness of targeted pulsed jet minimal cutting fluid application in enhancing surface quality during hard turning.

4. Conclusions

The findings of experimentation on surface roughness parameters during hard turning of AISI 52100 (58 HRC) steel with coated carbide tools under the MCFA environment led to the key conclusions. ANOVA results revealed that the feed rate was the most significant factor, contributing 55.49% to Ra, 56.63% to Rt, and 47.80% to Rz. Cutting speed contributed 14.14% to Ra, 4.98% to Rt, and 18.22% to Rz, while the depth of cut (2.91%) and its quadratic term (5.26%) had a relatively minor effect on Ra. Additionally, the interaction between the cutting speed and feed rate (v × f) contributed 15.50% to Ra, with a less significant effect on Rt (7.37%) and Rz (11.40%). Other quadratic terms and cutting parameter interactions did not significantly influence Ra, Rt, or Rz.
From the main effects plot of S/N ratios for the combined responses of Ra, Rt, and Rz, the optimal cutting parameters were identified as a cutting speed of 140 m/min, a feed rate of 0.05 mm/rev, and a depth of cut of 0.3 mm. Feed rate was ranked as the most critical factor, followed by cutting speed and depth of cut, based on the combined S/N ratios for surface roughness. Surface roughness increased significantly with the feed rate, while the depth of cut had minimal impact, although it required control to prevent chatter. MCFA-assisted hard turning reduced surface roughness by 40% compared to dry hard turning and about 24% when compared to the MQL method, demonstrating its potential to enhance surface quality while promoting sustainable machining practices. These findings provide essential insights into surface characterization under various cutting conditions, enabling manufacturers to adopt eco-friendly machining methods without compromising product quality.

Author Contributions

Conceptualization, S.M.; methodology, S.M., R.B.P. and A.R.; software, S.M.; validation, S.M. and P.S.; formal analysis, S.M.; investigation, S.M.; resources, S.M., R.B.P., A.R., P.S. and R.S.; data curation, S.M.; writing—original draft preparation, S.M.; writing—review and editing, S.M., R.B.P., A.R., P.S. and R.S.; visualization, S.M. and R.B.P.; supervision, R.B.P., A.R., P.S. and R.S.; project administration, S.M., R.B.P., A.R., P.S. and R.S.; funding acquisition, S.M. All authors have read and agreed to the published version of the manuscript.

Funding

This research received no external funding.

Institutional Review Board Statement

Not applicable.

Informed Consent Statement

Not applicable.

Data Availability Statement

The data used in this paper cannot be shared due to privacy or ethical restriction. However, the researchers can contact corresponding authors for extended results.

Conflicts of Interest

The authors declare no conflict of interest.

Abbreviations

Acronyms
MQLMinimum Quantity Lubrication
CVDChemical Vapor Deposition (coating technique)
PVDPhysical Vapor Deposition (coating technique)
TiNTitanium Nitride
TiCNTitanium Carbonitride
Al2O3Aluminum Oxide
CBNCubic Boron Nitride
PCDPolycrystalline Diamond (cutting tool material)
PCBNPolycrystalline Cubic Boron Nitride
HRCHardness Rockwell C (scale for hardness)
S/NSignal-to-Noise Ratio
ANOVAAnalysis of Variance
RSMResponse Surface Methodology
NF-MQLNano Fluid Minimum Quantity Lubrication
NGCFNano Green Cutting Fluid
MQCLMinimum Quantity Cooling and Lubrication
MTCVDMedium-temperature chemical vapor deposition
DFDegree of Freedom
Seq SSSequential Sum of Squares
Adj MSAdjusted Mean Square
F-ValueF-Ratio (test statistic used to determine significance in ANOVA)
List of Symbols
vCutting Speed (m/min)
fFeed Rate (mm/rev)
dDepth of Cut (mm)
RaArithmetic Average Roughness
RtMaximum peak-to-valley height
RzAverage peak-to-valley height

References

  1. Abbas, A.T.; Anwar, S.; Hegab, H.; Benyahia, F.; Ali, H.; Elkaseer, A. Comparative evaluation of surface quality, tool wear, and specific cutting energy for wiper and conventional carbide inserts in hard turning of aisi 4340 alloy steel. Materials 2020, 13, 5233. [Google Scholar] [CrossRef] [PubMed]
  2. Samantaraya, D.; Lakade, S. Hard Turning Cutting Tool Materials used in Automotive and Bearing Manufacturing Applications—A review. IOP Conf. Ser. Mater. Sci. Eng. 2020, 814, 012005. [Google Scholar] [CrossRef]
  3. Anand, A.; Behera, A.K.; Das, S.R. An overview on economic machining of hardened steels by hard turning and its process variables. Manuf. Rev. 2019, 6, 4. [Google Scholar] [CrossRef]
  4. Singh, D.; Rao, P.V. A surface roughness prediction model for hard turning process. Int. J. Adv. Manuf. Technol. 2007, 32, 1115–1124. [Google Scholar] [CrossRef]
  5. Zhang, X.; Liu, C.R.; Yao, Z. Experimental study and evaluation methodology on hard surface integrity. Int. J. Adv. Manuf. Technol. 2007, 34, 141–148. [Google Scholar] [CrossRef]
  6. Asiltürk, I.; Akkuş, H. Determining the effect of cutting parameters on surface roughness in hard turning using the Taguchi method. Meas. J. Int. Meas. Confed. 2011, 44, 1697–1704. [Google Scholar] [CrossRef]
  7. Aouici, H.; Yallese, M.A.; Chaoui, K.; Mabrouki, T.; Rigal, J.F. Analysis of surface roughness and cutting force components in hard turning with CBN tool: Prediction model and cutting conditions optimization. Meas. J. Int. Meas. Confed. 2012, 45, 344–353. [Google Scholar] [CrossRef]
  8. Shihab, S.K.; Khan, Z.A.; Mohammad, A.; Siddiquee, A.N. Optimization of surface integrity in dry hard turning using RSM. Sadhana Acad. Proc. Eng. Sci. 2014, 39, 1035–1053. [Google Scholar] [CrossRef]
  9. Sankar, R.R.B.R.; Umamaheswarrao, P.; Sharief, S.N.; Suresh, T. Parametric Investigations on Surface Roughness of Hard Turned AISI 52100 Steel. Appl. Mech. Mater. 2017, 867, 171–176. [Google Scholar]
  10. Wainstein, D.; Kovalev, A. Tribooxidation as a way to improve thewear resistance of cutting tools. Coatings 2018, 8, 223. [Google Scholar] [CrossRef]
  11. Allu, V.P.; Raju, D.L.; Ramakrishna, S. Performance investigation of surface roughness in hard turning of AISI 52100 steel—RSM approach. Mater. Today Proc. 2019, 18, 261–269. [Google Scholar] [CrossRef]
  12. Elsadek, A.A.; Gaafer, A.M.; Mohamed, S.S. Surface Roughness Prediction in Hard-Turning With Ann and Rsm. Int. J. Egypt. Soc. Tribol. 2020, 17, 13–22. [Google Scholar]
  13. Varadarajan, A.S.; Philip, P.K.; Ramamoorthy, B. Investigations on hard turning with minimal cutting fluid application (HTMF) and its comparison with dry and wet turning. Int. J. Mach. Tools Manuf. 2002, 42, 193–200. [Google Scholar] [CrossRef]
  14. Kumar, C.R.V.; Ramamoorthy, B. Performance of coated tools during hard turning under minimum fluid application. J. Mater. Process. Technol. 2007, 185, 210–216. [Google Scholar] [CrossRef]
  15. Kumar, C.R.V.; Nair, P.K.; Ramamoorthy, B. Performance of TiCN and TiAlN tools in machining hardened steel under dry, wet and minimum fluid application. Int. J. Mach. Mach. Mater. 2008, 3, 133–142. [Google Scholar] [CrossRef]
  16. Thepsonthi, T.; Hamdi, M.; Mitsui, K. Investigation into minimal-cutting-fluid application in high-speed milling of hardened steel using carbide mills. Int. J. Mach. Tools Manuf. 2009, 49, 156–162. [Google Scholar] [CrossRef]
  17. Sapian, N.F.; Omar, B.; Hamdi, M.; Shukor, A. Integrated Mechanical Pulse Jet Coolant Delivery System Performance for Minimal Quantity Lubrication. Int. J. Integr. Eng. 2010, 2, 53–68. [Google Scholar]
  18. Gnanadurai, R.R.; Varadarajan, A.S. The effect of an auxiliary pulsing jet of cutting fluid on cutting performance during hard turning with minimal fluid application. Int. J. Mach. Mach. Mater. 2012, 12, 321–336. [Google Scholar] [CrossRef]
  19. Paul, P.S.; Varadarajan, A.S. Performance evaluation of hard turning of AISI 4340 steel with minimal fluid application in the presence of semi-solid lubricants. Proc. Inst. Mech. Eng. Part J J. Eng. Tribol. 2013, 227, 738–748. [Google Scholar] [CrossRef]
  20. Paul, P.S.; Varadarajan, A.S.; Gnanadurai, R.R. Study on the influence of fluid application parameters on tool vibration and cutting performance during turning of hardened steel. Eng. Sci. Technol. Int. J. 2016, 19, 241–253. [Google Scholar] [CrossRef]
  21. Raj, A.; Wins, K.L.D.; George, K.E.; Varadarajan, A.S. Experimental Investigation of Soyabean Oil Based Cutting Fluid during Turning of Hardened AISI 4340 Steel with Minimal Fluid Application. Appl. Mech. Mater. 2015, 813–814, 337–341. [Google Scholar] [CrossRef]
  22. Raj, A.; Wins, K.L.D.; Varadarajan, A.S. Evaluation of the performance during hard turning of OHNS steel with minimal cutting fluid application and its comparison with minimum quantity lubrication. IOP Conf. Ser. Mater. Sci. Eng. 2016, 149, 012021. [Google Scholar] [CrossRef]
  23. Raj, A.; Wins, K.L.D.; Varadarajan, A.S. Comparison of surface roughness and chip characteristics obtained under different modes of lubrication during hard turning of AISI H13 tool work steel. IOP Conf. Ser. Mater. Sci. Eng. 2016, 149, 012017. [Google Scholar] [CrossRef]
  24. Benedicto, E.; Carou, D.; Rubio, E.M. Technical, Economic and Environmental Review of the Lubrication/Cooling Systems Used in Machining Processes. Procedia Eng. 2017, 184, 99–116. [Google Scholar] [CrossRef]
  25. Gajrani, K.K.; Sankar, M.R. Role of Eco-friendly Cutting Fluids and Cooling Techniques in Machining. In Materials Forming, Machining and Post Processing; Springer: Cham, Switzerland, 2020. [Google Scholar] [CrossRef]
  26. Kumar, P.; Jain, A.K.; Chaurasiya, P.K.; Damodar, T.; Gopalan, A.; Dhanraj, J.A.; Solomon, J.M.; Sivakumar, A.; Velmurugan, K.; Rushman, J.F. Sustainable Machining Using Eco-Friendly Cutting Fluids: A Review. Adv. Mater. Sci. Eng. 2022, 1–16. [Google Scholar] [CrossRef]
  27. Mane, S.; Kumar, S. Analysis of surface roughness during turning of AISI 52100 hardened alloy steel using minimal cutting fluid application. Adv. Mater. Process. Technol. 2022, 8 (Suppl. S1), 138–149. [Google Scholar] [CrossRef]
  28. Dhar, N.R.; Ahmed, M.T.; Islam, S. An experimental investigation on effect of minimum quantity lubrication in machining AISI 1040 steel. Int. J. Mach. Tools Manuf. 2007, 47, 748–753. [Google Scholar] [CrossRef]
  29. Dhar, N.R.; Kamruzzaman, M.; Ahmed, M. Effect of minimum quantity lubrication (MQL) on tool wear and surface roughness in turning AISI-4340 steel. J. Mater. Process. Technol. 2006, 172, 299–304. [Google Scholar] [CrossRef]
  30. Hadad, M.; Sadeghi, B. Minimum quantity lubrication-MQL turning of AISI 4140 steel alloy. J. Clean. Prod. 2013, 54, 332–343. [Google Scholar] [CrossRef]
  31. Davim, J.P.; Sreejith, P.S.; Silva, J. Turning of brasses using minimum quantity of lubricant (MQL) and flooded lubricant conditions. Mater. Manuf. Process. 2007, 22, 45–50. [Google Scholar] [CrossRef]
  32. Roy, S.; Kumar, R.; Sahoo, A.K.; Panda, A. Cutting Tool Failure and Surface Finish Analysis in Pulsating MQL-Assisted Hard Turning. J. Fail. Anal. Prev. 2020, 20, 1274–1291. [Google Scholar] [CrossRef]
  33. Hamran, N.N.N.; Ghani, J.A.; Ramli, R.; Haron, C.H.C. A review on recent development of minimum quantity lubrication for sustainable machining. J. Clean. Prod. 2020, 268, 122165. [Google Scholar] [CrossRef]
  34. Zaman, P.B.; Dhar, N.R. Multi-objective Optimization of Double-Jet MQL System Parameters Meant for Enhancing the Turning Performance of Ti–6Al–4V Alloy. Arab. J. Sci. Eng. 2020, 45, 9505–9526. [Google Scholar] [CrossRef]
  35. Chavan, A.; Sargade, V. Surface integrity of AISI 52100 steel during hard turning in different near-dry environments. Adv. Mater. Sci. Eng. 2020, 2020, 4256308. [Google Scholar] [CrossRef]
  36. Zhang, S.; Li, J.F.; Wang, Y.W. Tool life and cutting forces in end milling Inconel 718 under dry and minimum quantity cooling lubrication cutting conditions. J. Clean. Prod. 2012, 32, 81–87. [Google Scholar] [CrossRef]
  37. Elmunafi, M.H.S.; Kurniawan, D.; Noordin, M.Y. Use of Castor Oil as Cutting Fluid in Machining of Hardened Stainless Steel with Minimum Quantity of Lubricant. Procedia CIRP 2015, 26, 408–411. [Google Scholar] [CrossRef]
  38. Do, T.V.; Nguyen, Q.M.; Pham, M.T. Optimization of Cutting Parameters for Improving Surface Roughness during Hard Milling of AISI H13 Steel. Key Eng. Mater. 2020, 831, 35–39. [Google Scholar] [CrossRef]
  39. Gajrani, K.K.; Suvin, P.S.; Kailas, S.V.; Rajurkar, K.P.; Sankar, M.R. Machining of hard materials using textured tool with minimum quantity nano-green cutting fluid. CIRP J. Manuf. Sci. Technol. 2021, 35, 410–421. [Google Scholar] [CrossRef]
  40. Ibrahim, A.M.M.; Omer, M.A.E.; Das, S.R.; Li, W.; Alsoufi, M.S.; Elsheikh, A. Evaluating the effect of minimum quantity lubrication during hard turning of AISI D3 steel using vegetable oil enriched with nano-additives. Alexandria Eng. J. 2022, 61, 10925–10938. [Google Scholar] [CrossRef]
  41. Tuan, N.M.; Duc, T.M.; Long, T.T.; Hoang, V.L.; Ngoc, T.B. Investigation of Machining Performance of MQL and MQCL Hard Turning Using Nano Cutting Fluids. Fluids 2022, 7, 143. [Google Scholar] [CrossRef]
  42. Sarikaya, M.; Gupta, M.K.; Tomaz, I.; Danish, M.; Mia, M.; Rubaiee, S.; Jamil, M.; Pimenov, D.Y.; Khanna, N. Cooling techniques to improve the machinability and sustainability of light-weight alloys: A state-of-the-art review. J. Manuf. Process. 2021, 61, 179–201. [Google Scholar] [CrossRef]
  43. Mallick, R.; Kumar, R.; Panda, A.; Sahoo, A.K. Hard Turning Performance Investigation of AISI D2 Steel under a Dual Nozzle MQL Environment. Lubricants 2023, 11, 16. [Google Scholar] [CrossRef]
  44. Padhan, S.; Das, A.; Santoshwar, A.; Dharmendrabhai, T.R.; Das, S.R. Sustainability Assessment and Machinability Investigation of Austenitic Stainless Steel in Finish Turning with Advanced Ultra-Hard SiAlON Ceramic Tool under Different Cutting Environments. Silicon 2021, 13, 119–147. [Google Scholar] [CrossRef]
  45. Kawade, P.; Bokade, S. Review of cooling techniques used in metal cutting processes. Adv. Mater. Process. Technol. 2022, 9, 1137–1182. [Google Scholar] [CrossRef]
  46. Li, D.; Zhang, T.; Zheng, T.; Zhao, N.; Li, Z. A comprehensive review of minimum quantity lubrication (MQL) machining technology and cutting performance. Int. J. Adv. Manuf. Technol. 2024, 133, 2681–2707. [Google Scholar] [CrossRef]
  47. Çetindağ, H.A.; Çiçek, A.; Uçak, N.; Aslantas, K. Performance of conventional and wiper CBN inserts under various cooling conditions in hard turning of AISI 52100 steel. Mater. Test. 2024, 66, 228–298. [Google Scholar] [CrossRef]
  48. Korkmaz, M.E.; Gupta, M.K.; Ross, N.S.; Sivalingam, V. Implementation of green cooling/lubrication strategies in metal cutting industries: A state of the art towards sustainable future and challenges. Sustain. Mater. Technol. 2023, 36, e00641. [Google Scholar] [CrossRef]
  49. Pimenov, D.Y.; da Silva, L.R.R.; Machado, A.R.; França, P.H.P.; Pintaude, G.; Unune, D.R.; Kuntoğlu, M.; Krolczyk, G.M. A comprehensive review of machinability of difficult-to-machine alloys with advanced lubricating and cooling techniques. Tribol. Int. 2024, 196, 109677. [Google Scholar] [CrossRef]
  50. Ali, S.H.; Yao, Y.; Wu, B.; Zhao, B.; Ding, W.; Jamil, M.; Khan, A.; Baig, A.; Liu, Q.; Xu, D. Recent developments in MQL machining of aeronautical materials: A comparative review. Chin. J. Aeronaut. 2024, 38, 102918. [Google Scholar] [CrossRef]
  51. Mane, S.; Kumar, S. Optimization of Cutting and Cutting Fluid Application Parameters in Turning of AISI 52100 Hardened Alloy Steel Under Minimal Cutting Fluid Application. In Proceedings of the ICIMA 2020: International Conference on Intelligent Manufacturing and Automation, Mumbai, India, 27–28 March 2020. [Google Scholar] [CrossRef]
Figure 1. Experimental setup of minimal cutting fluid application (Mane et al., 2020) [27]. (1) AC Motor, (2) Fluid Pump, (3) Variable Frequency Device, (4) Cutting Fluid Tank, (5) Cutting Fluid High-Pressure Line, (6) Nozzle, (7) Dynamometer, (8) Digital Display unit, (9) Infrared Thermometer, (10) Thermocouple Cable.
Applmech 06 00005 g001
Figure 2. Main effects plot for S/N ratios for the combined response of Ra, Rt, and Rz.
Applmech 06 00005 g002
Figure 3. Contour plot of (a) Ra, (b) Rt, and (c) Rz for cutting speed vs. feed rate.
Applmech 06 00005 g003
Figure 4. Contour plot of (a) Ra, (b) Rt, and (c) Rz for depth of cut vs. feed rate.
Applmech 06 00005 g004
Table 1. Experimental design and results for the surface roughness parameters.
S. Nov
(m/min)
f
(mm/rev)
d
(mm)
Surface Roughness (µm)
Ra (µm)Rt (µm)Rz (µm)S/N Ratio
1800.050.10.2891.8441.447−2.67422
2800.050.30.2261.9911.529−3.25857
3800.050.50.3142.2051.621−4.03021
41100.050.10.2432.0341.780−3.91469
51100.050.30.2091.8471.308−2.36029
61100.050.50.3192.2161.804−4.40218
71400.050.10.1891.8681.146−2.07586
81400.050.30.3032.0001.540−3.33340
91400.050.50.4042.4391.938−5.17098
10800.100.10.4692.7872.400−6.61097
11800.100.30.4062.5892.038−5.65108
12800.100.50.4782.8292.455−6.76989
131100.100.10.4152.6612.166−6.00054
141100.100.30.3892.9892.007−6.40597
151100.100.50.4462.9642.236−6.68507
161400.100.10.2872.4331.596−4.54856
171400.100.30.2521.9761.521−3.20944
181400.100.50.4292.8432.198−6.40080
19800.150.10.6713.2252.830−7.98415
20800.150.30.6133.0122.687−7.44759
21800.150.50.6702.7132.713−7.03854
221100.150.10.5583.0012.654−7.36691
231100.150.30.4592.8292.455−6.76418
241100.150.50.5433.0102.269−6.84444
251400.150.10.3962.5121.567−4.73363
261400.150.30.3342.4151.861−4.96335
271400.150.50.4062.6542.049−5.80048
Table 2. ANOVA table for average surface roughness (Ra).
SourceDFSeq SSContr.Adj MSF-Valuep-Value
Regression90.45040996.68%0.05004555.080.000
v10.06588414.14%0.06588472.510.000
f10.25848055.49%0.258480284.470.000
d10.0135582.91%0.01355814.920.001
v × v10.0005160.11%0.0005160.570.461
f × f10.0000000.00%0.0000000.000.996
d × d10.0244915.26%0.02449126.950.000
v × f10.07223015.50%0.07223079.490.000
v × d10.0067691.45%0.0067697.450.014
f × d10.0084801.82%0.0084809.330.007
Error170.0154473.32%0.000909
Total260.465855100.00%
Table 3. ANOVA table for maximum peak-to-valley height (Rt).
SourceDFSeq SSContr.Adj MSF-Valuep-Value
Regression94.206389.35%0.4673715.850.000
v10.23464.98%0.234617.960.012
f12.665756.63%2.6657490.430.000
d10.12632.68%0.126344.290.054
v × v10.14183.01%0.141784.810.042
f × f10.34677.37%0.3467211.760.003
d × d10.16033.40%0.160285.440.032
v × f10.22304.74%0.223047.570.014
v × d10.12652.69%0.126494.290.054
f × d10.18133.85%0.181306.150.024
Error170.501110.65%0.02948
Total264.7074100.00%
Table 4. ANOVA table for average peak-to-valley height (Rz).
SourceDFseq SSContr.Adj MSF-Valuep-Value
Regression95.2102892.22%0.5789222.400.000
v11.0291318.22%1.0291339.820.000
f12.7004947.80%2.70049104.490.000
d10.159992.83%0.159996.190.024
v × v10.091431.62%0.091433.540.077
f × f10.076761.36%0.076762.970.103
d × d10.164122.90%0.164126.350.022
v × f10.6440311.40%0.6440324.920.000
v × d10.259314.59%0.2593110.030.006
f × d10.085011.50%0.085013.290.087
Error170.439377.78%0.02585
Total265.64965100.00%
Table 5. Combined S/N ratios of surface roughness parameter.
Levelvfd
1−5.718−3.469−5.101
2−5.638−5.809−4.822
3−4.471−6.549−5.905
Delta1.2483.0801.083
Rank213
Table 6. Arithmetic average roughness (Ra) under dry, MQL, and MCFA environments.
Run. NoV
(m/min)
f
(mm/rev)
d
(mm)
The Average Value of (Ra) at Three Experimental Runs (µm)% Reduction of (Ra)
When Compared to Dry Environment
% Reduction of (Ra)
When Compared to MQL Environment
DryMQLMCFA
1800.050.10.5370.3810.28946.18224.147
41100.050.10.4010.3070.24339.40120.847
71400.050.10.3340.2460.18943.41323.171
11800.10.30.7010.5230.40642.08322.371
141100.10.30.5210.4610.38925.33615.618
171400.10.30.4460.3340.25243.49824.551
21800.150.50.8710.7720.67023.07713.212
241100.150.50.6670.6050.54318.59110.248
271400.150.50.5750.4920.40629.39117.480
Disclaimer/Publisher’s Note: The statements, opinions and data contained in all publications are solely those of the individual author(s) and contributor(s) and not of MDPI and/or the editor(s). MDPI and/or the editor(s) disclaim responsibility for any injury to people or property resulting from any ideas, methods, instructions or products referred to in the content.

