1. Introduction
In recent times, the aeronautical industry has led a relevant part of its research into the development of suitable technology for bonded joints because of the increased use of Carbon-Fiber-Reinforced Polymers (CFRPs). The advantage of using this type of joint concerns many aspects of an aircraft’s operational life: from its design, in which the reduction in the number of bolts leads to a decrease in the total weight and complexity of the structure, to its production, with a diminution of the assembly time, and the maintenance phase, in which the number of parts is lowered.
Currently, the rules for the certification of composite aircraft structures allow the use of bonded joints, provided that several conditions are met to ensure appropriate levels of safety. For instance, it is necessary to comply with CS 25.571 (the damage tolerance and fatigue evaluation of the structure) [
1]. Additional guidelines for the certification of non-metallic structures are contained in FAA-AC 20-107B and AMC 20-29 [
2,
3], which state that at least one of the following conditions needs to be met for bonding connections, whose faults may give rise to catastrophic consequences, such as the loss of an airplane (summarised version):
The maximum allowable disbonding shall not compromise the load-bearing capability of the structure with respect to the limit design values;
Each article produced shall undergo specific proof testing under the critical limit design load;
Repeatable and reliable NDI techniques will verify the strength of each joint.
While the second one is not viable for series production, the first one is typically implemented by adding rivets or screw/bolts at a prescribed distance, with a significant impact on the production costs and the ability to introduce bonded joints. Currently, the main NDI techniques used to control and detect bonded joint damages during the manufacturing phase, operative service, and/or repair phases are still not reliable in ensuring their safety as requested by aircraft regulations.
Let us consider kissing bond phenomena, where a bond established by adhesive may be weak or even absent due to a lack of curing of the adhesive and/or surface contamination. In this case, the two parts of the structure could result as connected by an NDI system, but there is no mechanical link between them. The possible occurrence of this phenomenon poses a serious problem for the use of this type of joint. In fact, aeronautical industries use mechanical systems (i.e., chicken rivets) to prevent any bond defects and/or the progression of the debonding zone, but this increases the weight of the entire structure and loses the advantage of using a bonded joint.
Besides traditional methods of investigation, such as visual inspection, tap tests, low-frequency bond tests, ultrasonic tests, thermography, and laser shearography methods [
4], recent research has been focusing on the development of novel monitoring techniques to make them reliable according to regulations. Attempts are being made to create representative kiss bond defects to perform repeatable and controllable tests [
5] or to establish standard parameters to understand the degradation of adhesively bonded joints [
6]. Some techniques use measurements of weak mechanical adhesion by means of a vibration damping method [
7], while others use Lamb waves [
8]. Much of the current research is also focusing on acoustic techniques, taking advantage of the nonlinear behaviour of the layer thickness of all the materials used to make a mechanical joint [
9,
10,
11].
The use of SHM systems as an NDI technique may pave the way for the implementation of new reliable and repeatable systems, assuming the function of a continuous observer of the structural state. Such systems have been proven to show interesting capabilities of adaptation to engage with different types of structures and different types of damage [
12,
13,
14]. Many types of SHM techniques are documented in the literature, differing in terms of the data processing strategy, the type of sensors, and the implemented algorithms [
15,
16,
17,
18,
19,
20,
21,
22].
Optical-fibre-based networks, in the form of distributed (DFOS, distributed fibre optic sensing) or concentrated (FBG, fibre Bragg grating) sensors, seem to have great potential with respect to the established aims due to their property of being multiplexed (i.e., hosting several sensors on a single cable), their possibility of being integrated within a structural system, and their minimal weight [
23,
24,
25].
These measuring systems have already found interesting applications in the aeronautical field. They can be used for monitoring the load acting on a structure and/or for the detection of any damage present. In most cases, they are applied during the ground test phase to verify the strength of the structure under test. For example, the main aircraft manufacturers report, from a long-term perspective, the massive use of fibre optic networks [
26,
27,
28], thus allowing real-time knowledge of the state of health of an aircraft, which can turn into a great economic advantage, especially if it is considered from the perspective of scheduled maintenance. However, some aircraft have already been set up with facility health monitoring systems through the installation of integrated FO networks that allow online measurements of the parameters under observation; see refs. [
29,
30,
31,
32].
Moreover, with the increase in the powers of on-board computer systems, it will also be possible to monitor, in real time, the operating life of an aircraft, improving its safety and cost efficiency.
The great interest in the development of these sensor networks, based on FBG or DFOS, lies in the development of systems for identifying local damage and/or crack growth, which may also be considered to be at a good level of technological maturity but do not have the necessary reliability to be used in place of current monitoring techniques yet, such as the NDI; see refs. [
33,
34]. Nevertheless, the acceptance of the use of these systems is still ongoing due to their monitoring capability, performance, maintainability, and lack of standardization and certification rules.
In the framework of the OPTICOMS project, within the EU Clean Sky 2 programme, CIRA is assessing an SHM methodology for the observation of the bonding lines between the skin panel and the spar caps of a typical wingbox section.
Apart from the general abovementioned objective, such activities are specifically concerned with the appraisal of the level of reliability and repeatability of the proposed system to further increase its performance, and an increment in expertise is correlated with the installation process of the DFOS networks in order to use the SHM system as an NDI tool.
2. SHM System and Algorithm
An optical fibre exploits the physical properties of light travelling along a fibre to detect changes in parameters such as temperature, strain, etc. The variation in the parameter under investigation is detected by an instrument called an interrogator, which transforms the acquired signal into usable data. Distributed fibre sensors use silica impurities as local mirrors, scattering back the incoming light to create thousands of continuous sensing points along the fibre. The data acquired can be elaborated on by means of a dedicated algorithm to determine the actual status of the structure.
The success of any SHM system depends essentially on two factors: the type of sensors implemented and the way the collected information is processed through a suitable algorithm. Regarding the first point, these sensors can be classified as dynamic and static sensors. The former may work on structural wave transmission through the structure, typically driven by independent sources, allowing us to identify the damage region as a sort of accumulation point of the waves’ deflection and reflection. The latter may, for instance, record static structural parameters, such as strain, under typical working conditions; significant deviations in the expected behaviour with respect to a normal one may be a relevant index for the determination of the presence of a fault. In both cases, the detection of the anomaly relies on an algorithm capable of discerning between the two structural states, the healthy and the damaged ones.
As it is, the algorithm also detects modulations in the strain results due to design values, such as the presence of local stiffening. In that case, the occurrence is known and may be used as a reference for the detection of damage onsets, even in those regions. In such a way, the algorithm is able to discern if the perceived anomaly is subsequent to the manufacturing process or actual damage.
Based on their experience gained from several projects, the CIRA has been developing an SHM system made of a DFOS network and a proprietary algorithm which allows the irregularity extension to be localized and quantified without the need for a structural reference state characterization, either in terms of a structural strain field or load actions, with specific attention being given to bonded joints involved in CFRP structures.
The proprietary algorithm is named LHEO, meaning “Local High-Edge Onset”. The basic principle is based on the automatic recognition of the physical effect that damage is able to provide within a strain map. The occurrence of a flaw, such as debonding or delamination, is almost always represented by a local jump or local signal scattering, changing the baseline strain signature [
35].
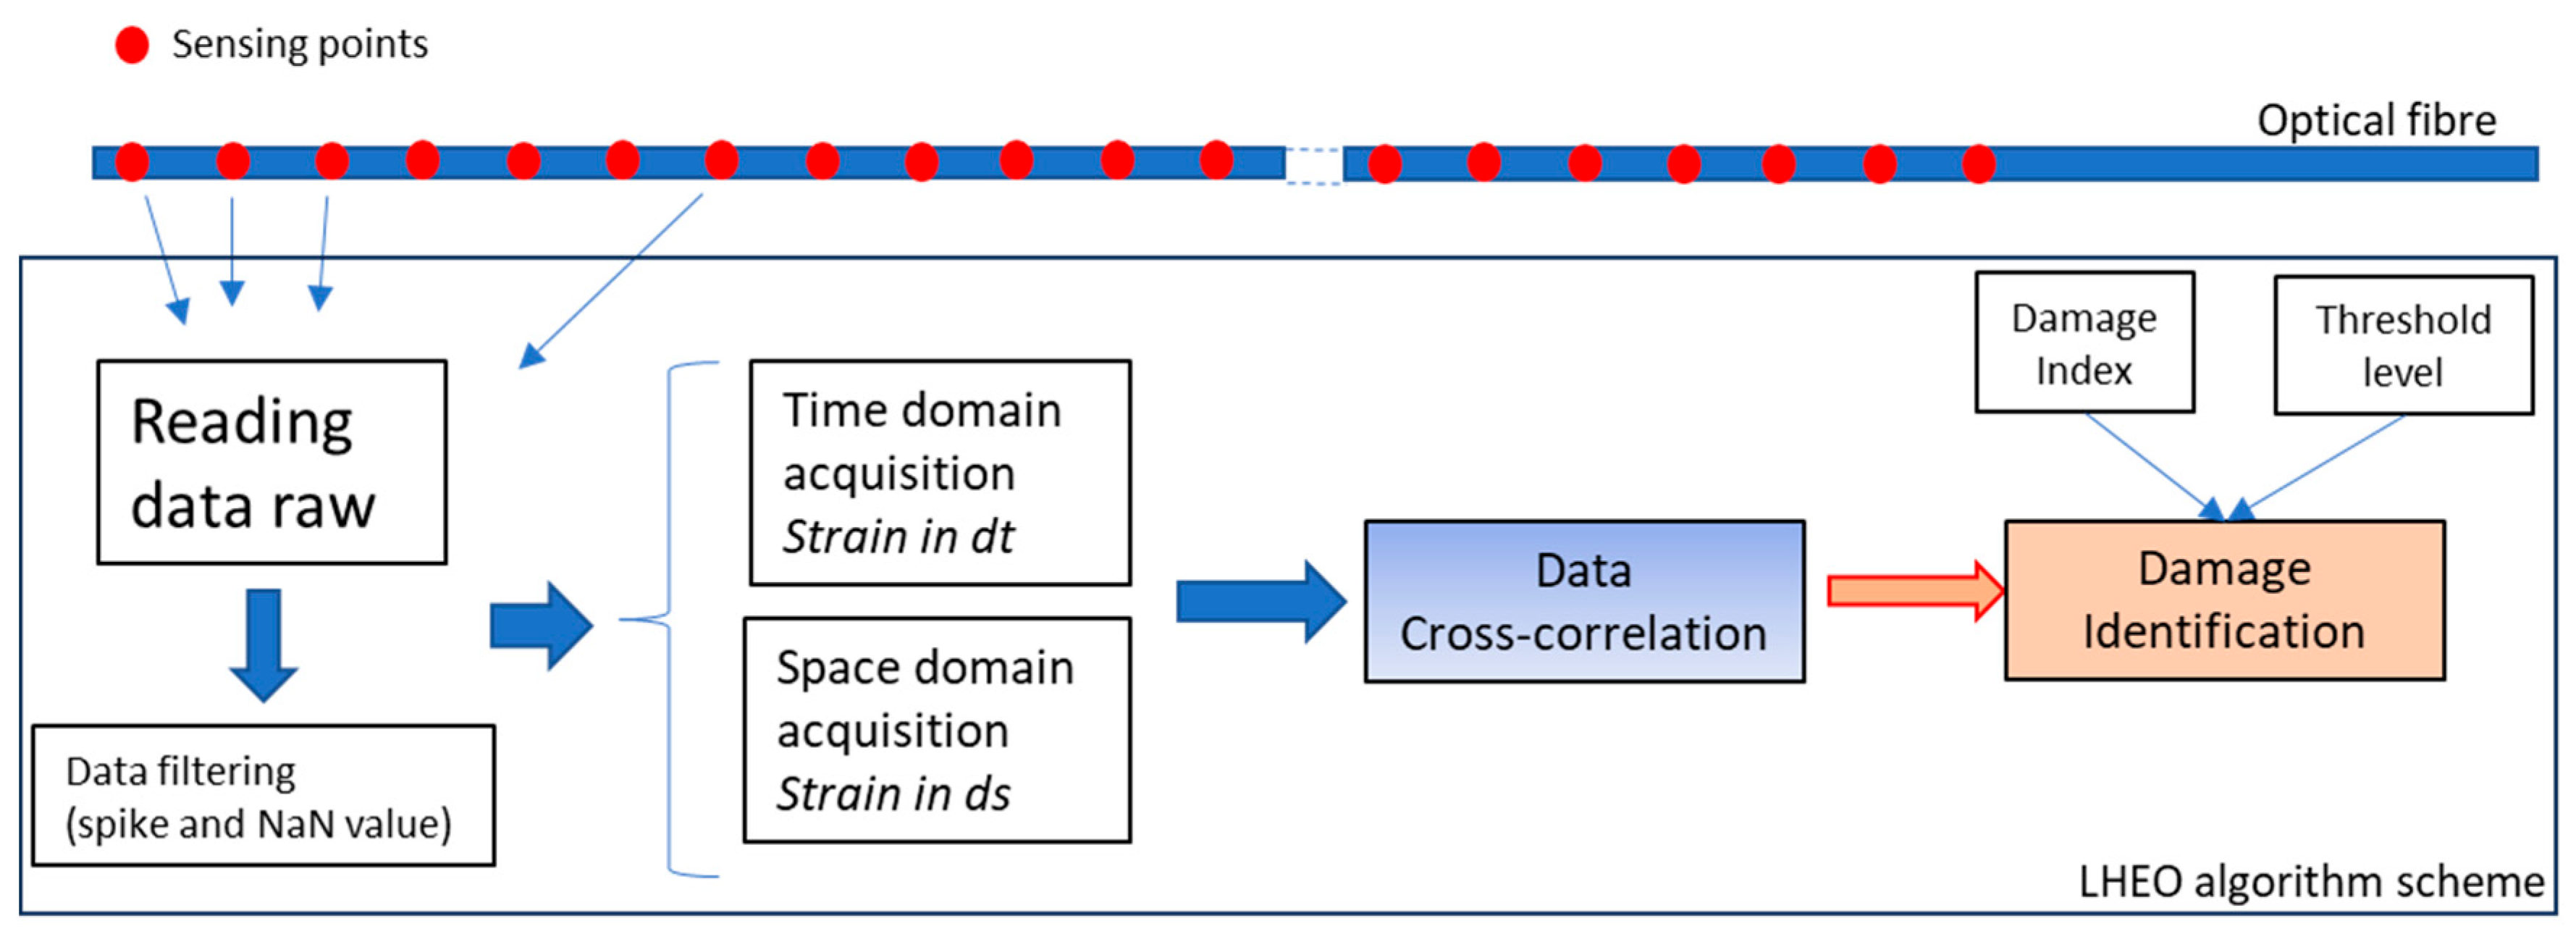
So, in the same way that image processing deals with edge detection by using a specific gradient operator, the edge onset can be detected within a 1D signal. The advantage of using DFOS is its capability of detecting the size and location of damage by means of a very dense sensor array. In detail, the working principle of LHEO stands on acquiring the static strain data of all the sensors along a fibre (space domain) at each instant in time (time domain) and then performing differential operations and a time–space cross-correlation among the data (
Figure 1).
After this first data elaboration, a damage index (DI) and threshold levels (TL) are identified, allowing us to cluster eligible sensors in the following way:
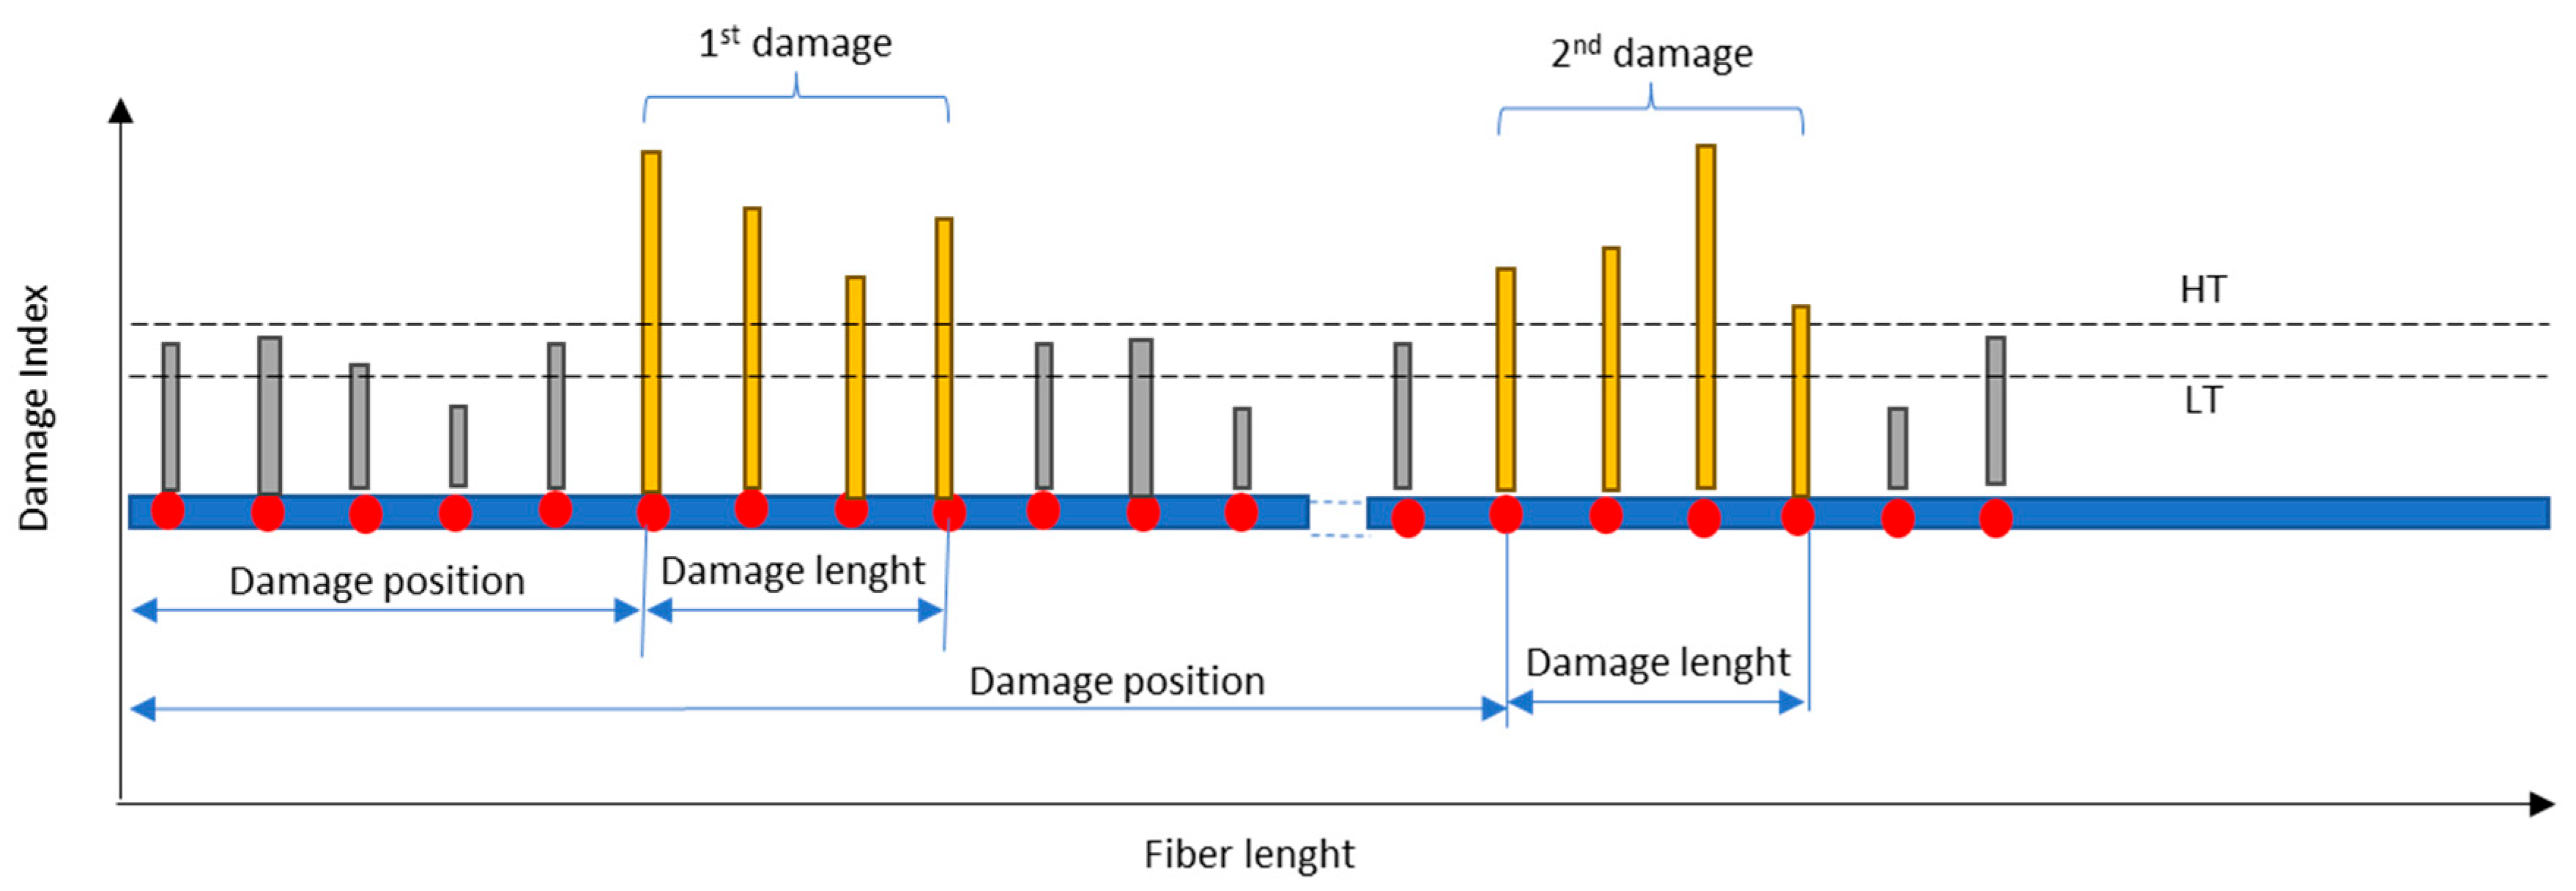
The damage index is directly associated with the cross-correlation variance with respect to autocorrelation; in the presence of an edge or a rapid variation in the adjacent sensor’s value because of the presence of a flaw, such a value is expected to be high; otherwise, it should be small;
The
threshold levels define the admissible intervals for the elaborated data outcome. In particular, the upper limit of the cross-correlation variance is used to set the highest threshold (HT) limit for the eligible sensors’ dataset, while the mean value of its range is used to set the lower threshold (LT) limit. Readouts below the LT are discarded; readouts between the LT and the HT are kept if a persistency in their appearance is verified; and readouts higher than the HT are considered eligible as indicators of the presence of a potential damage area. The size of the damage, and consequently its location, is determined by the cluster of adjacent sensors whose associated DI values exceed the DI limit (
Figure 2).
The development of the SHM system, whose results are presented for a selected application concerning full-scale aircraft subcomponents, is based on distributed or FBG sensors, depending on the final objective, see refs. [
36,
37]. Its main, original feature stands in its adopting a non-based model algorithm, which allows it to detect the presence of one or more damage areas without previous knowledge of the structural behaviour or the availability of a validated numerical model. As it is, the algorithm may exhibit also real-time features. In the studies mentioned above, the capability of the presented SHM system was assessed in detecting a damage area that was found to be 80 mm long, with a mean strain value of 100 microstrain (0.01%), which signified its good performance.
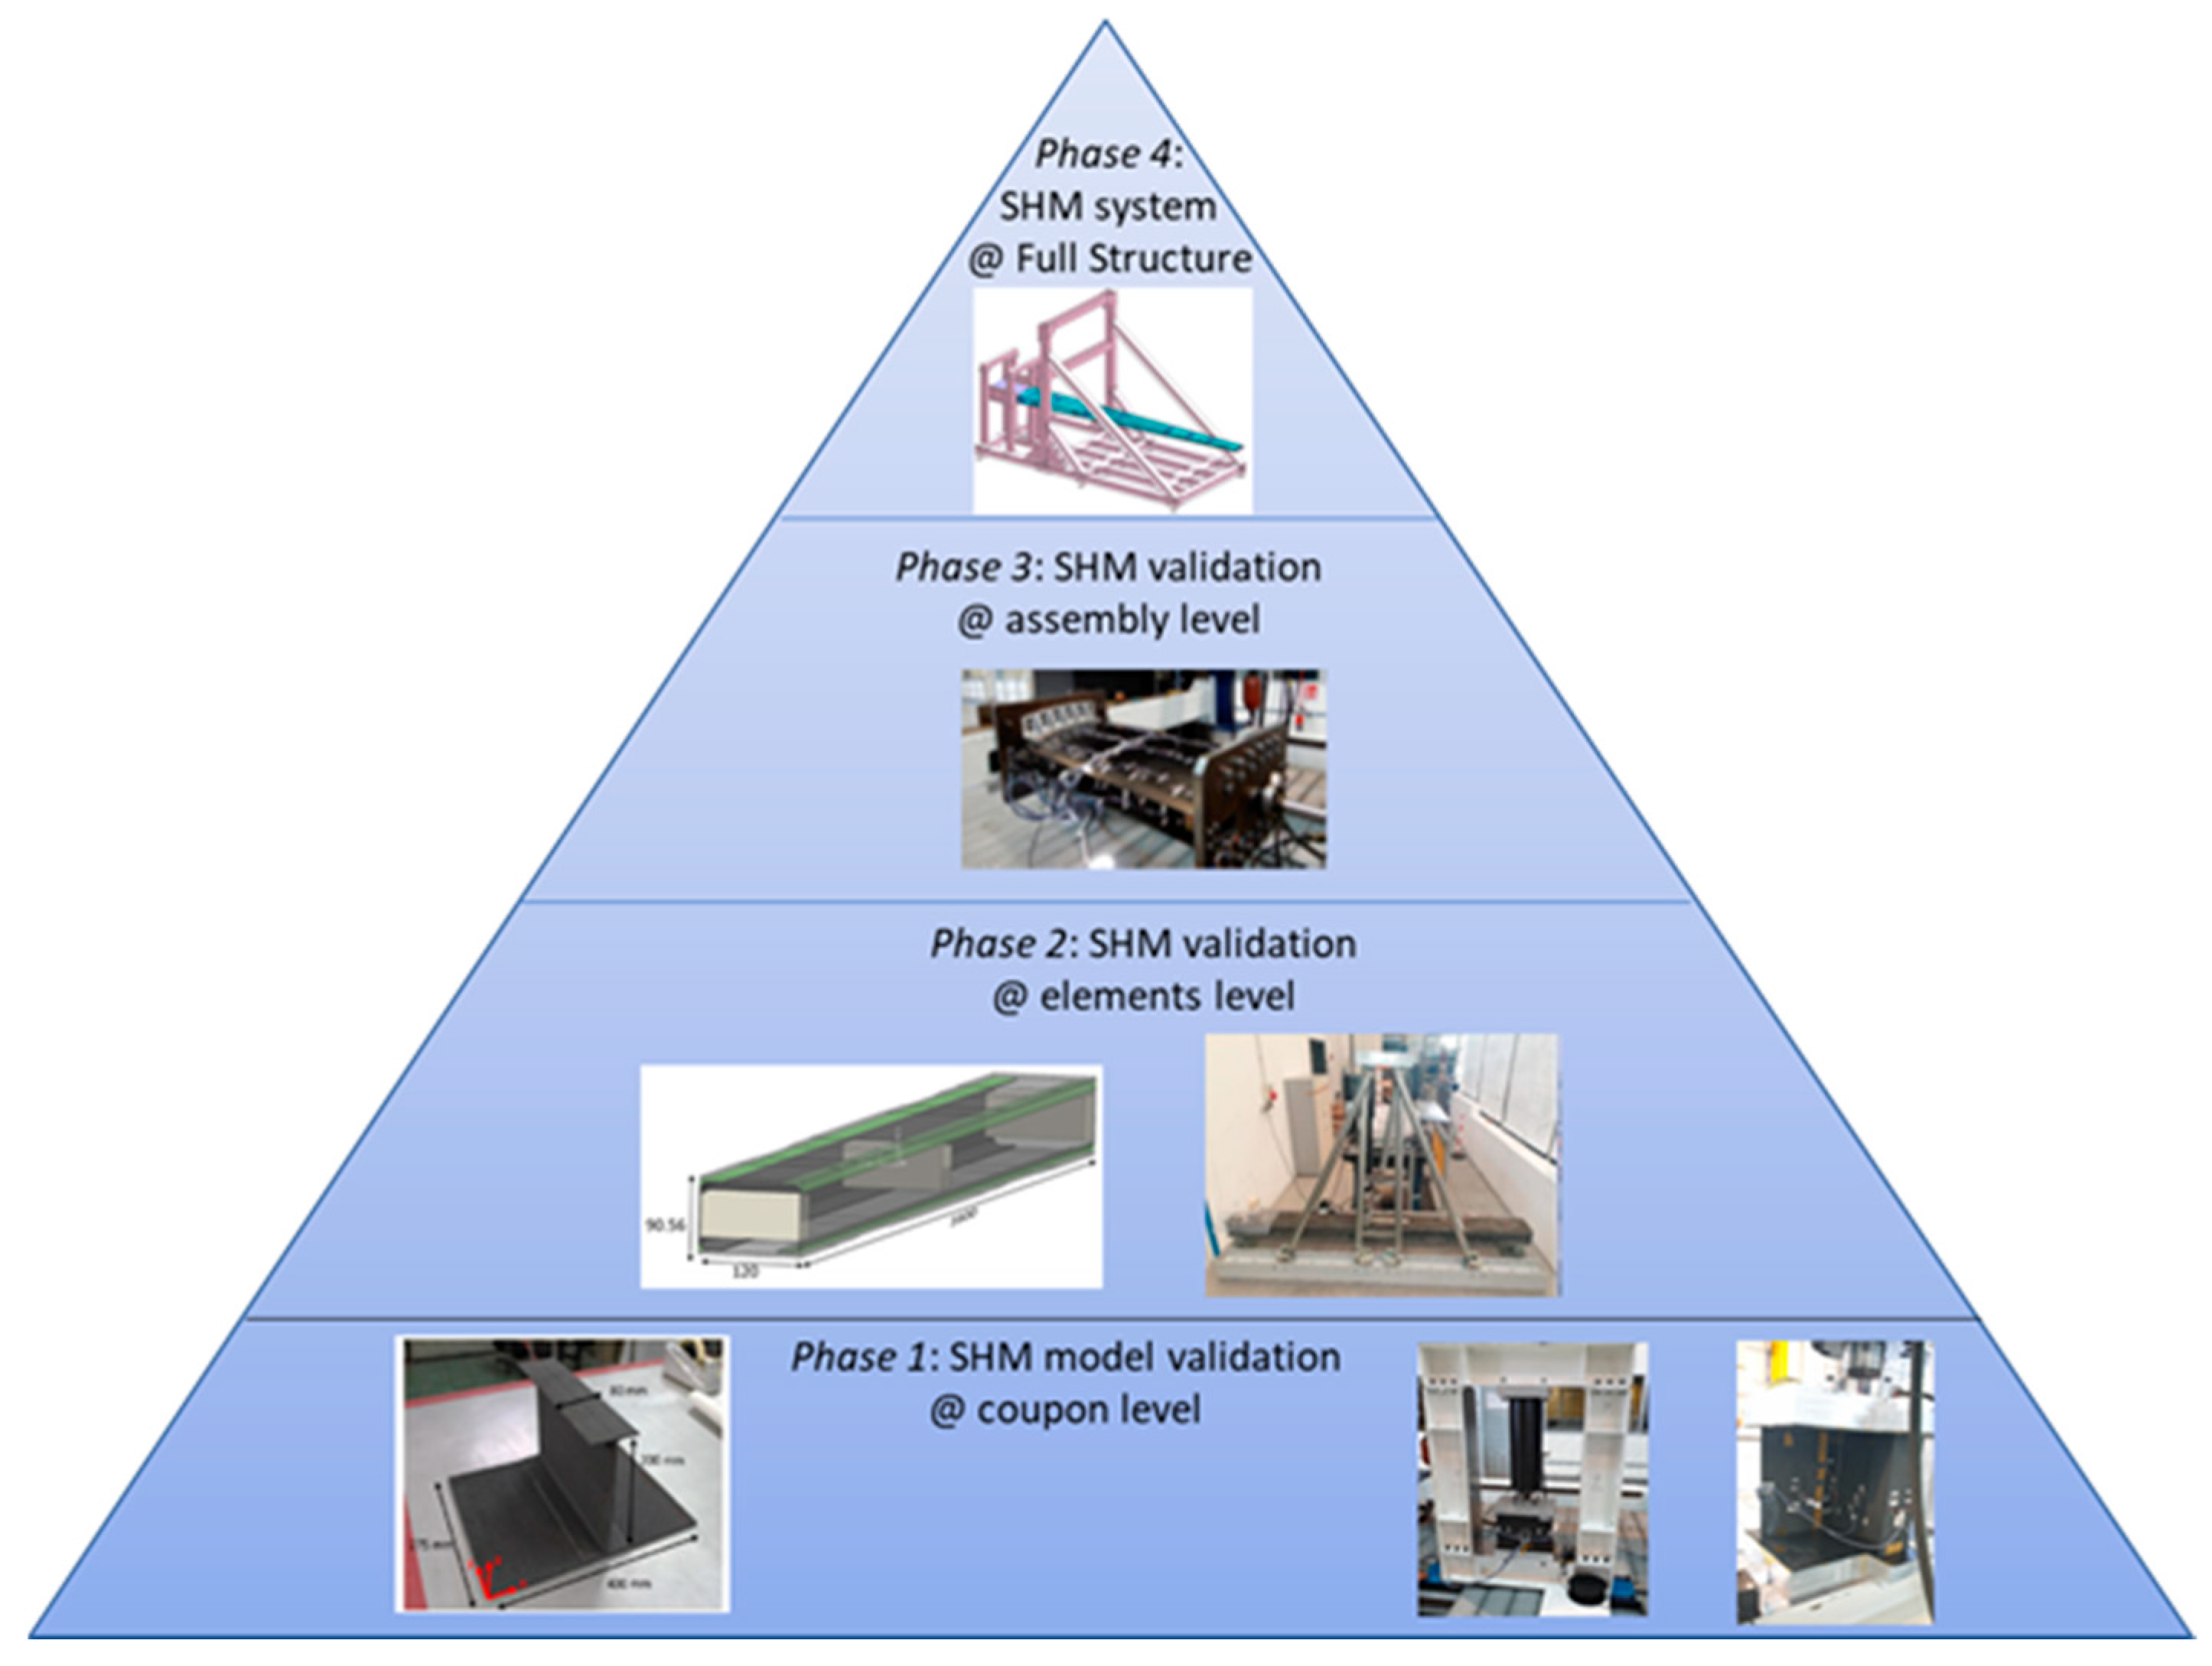
The development of the CIRA SHM system followed a typical engineering building block approach, consisting of applying that system to progressively more test articles, from coupons to subcomponents and complete structural systems.
In
Figure 3, the particularisation of that methodology within the OPTICOMS project is reported: the study started by performing some studies on a wing–spar section [
38], then moving to a composite multi-element wing–spar–beam section; see refs. [
39,
40], and finally continuing to a full-scale wingbox section, undergoing static compression and bending ground tests, which this paper refers to. These activities are currently ongoing, aiming for their final application to a complete full-scale wingbox (about 7 m long).
In principle, strain detection is not affected by the size of the test article, mainly because the physics of the optical fibre allow for one-dimensional detection, i.e., along a specific direction. However, a full-scale component brings a lot of complexities that cannot be fully present at the coupon, or even components and sub-components, level. For instance, the presence of local stiffening, a more complex strain field derived from Poisson’s effect, or a more elaborate architecture of the structural part (e.g., different thickness in different structural zones) that can introduce significantly different behaviours along the longitudinal length of the structure, and so on. Therefore, moving from elementary to sophisticated structures allows the various contributions to be isolated, one by one, to increase confidence in the system under development.
3. Full-Scale Wingbox Description and Fibre Optic Network
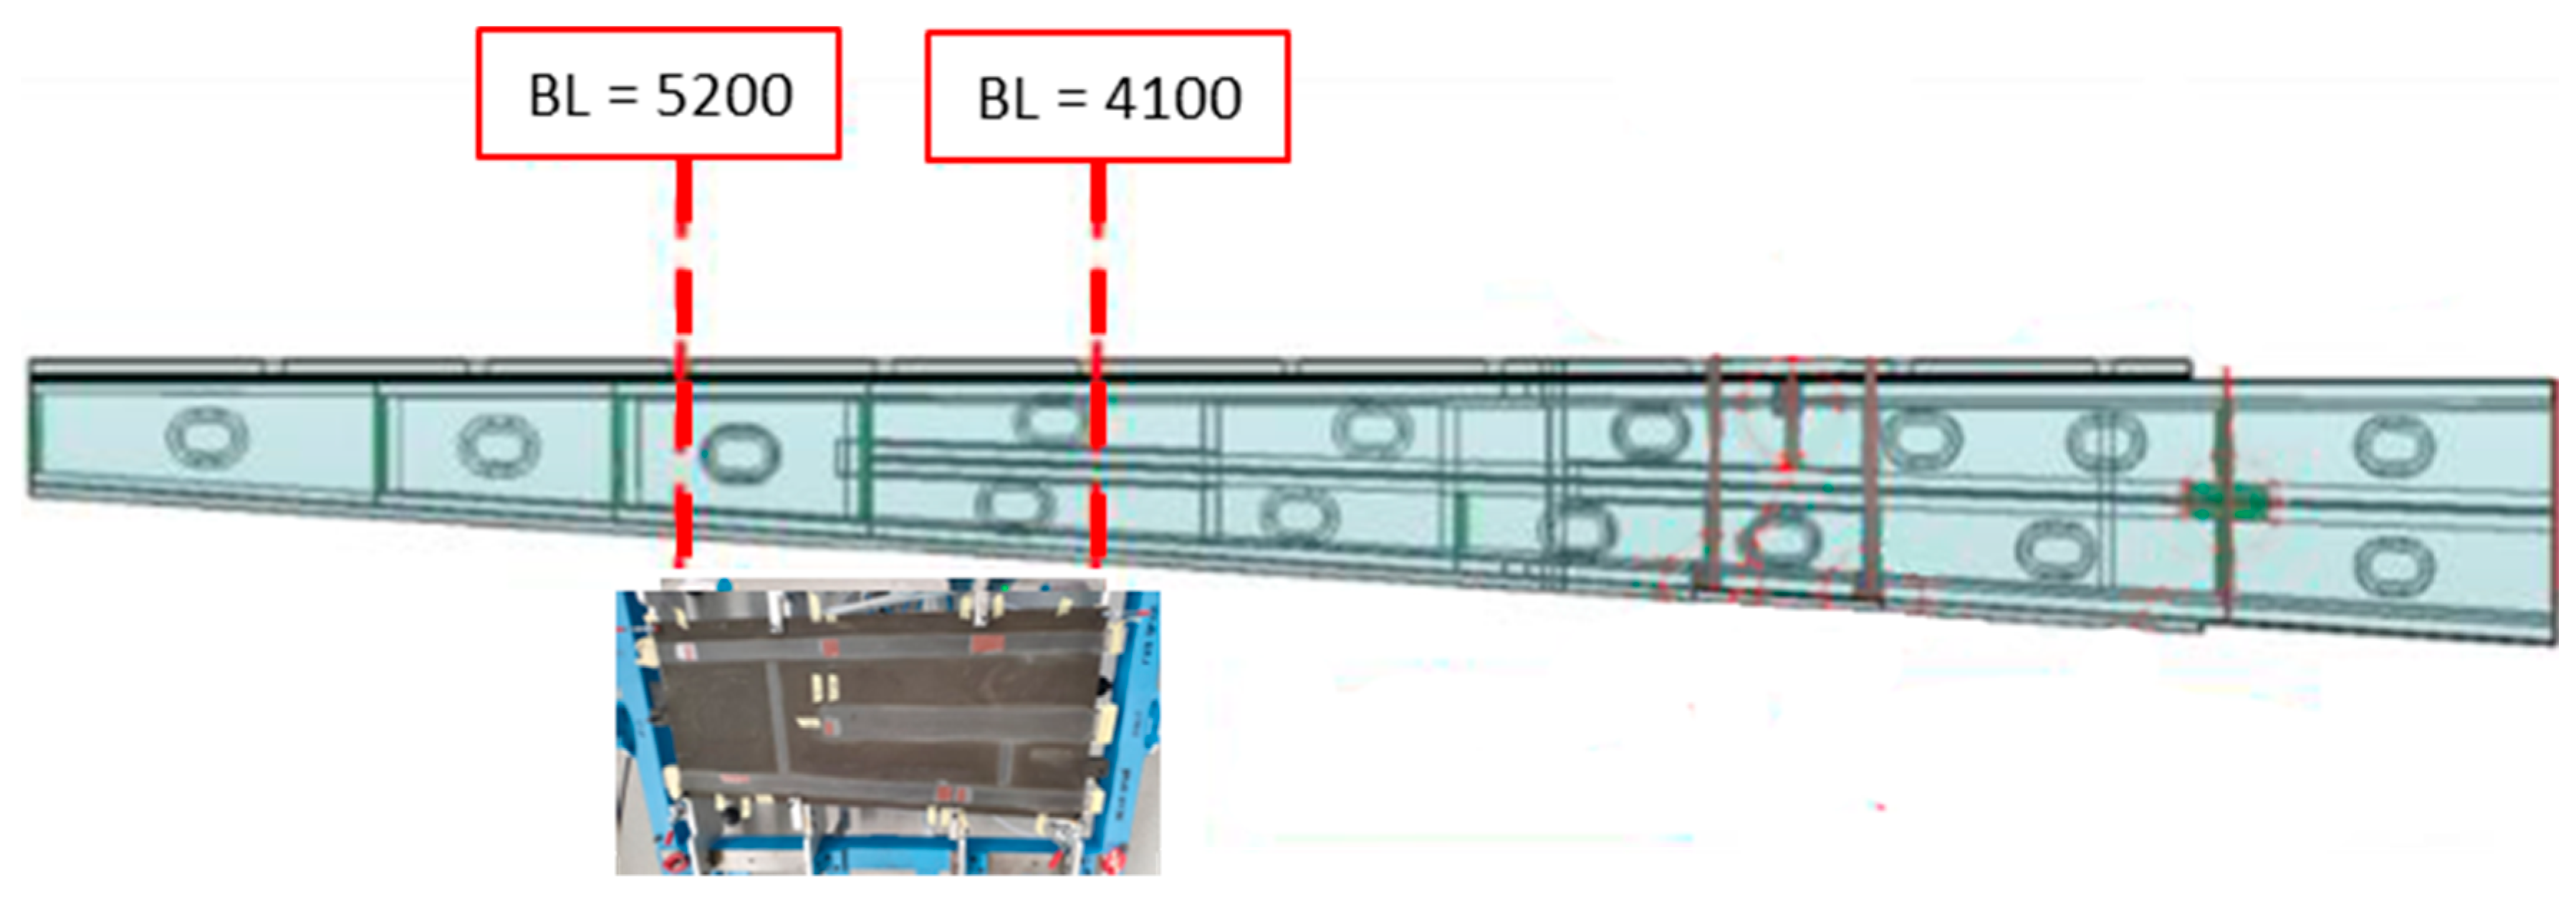
The test article used in this research is representative of a 1.2 m-long segment of the wing of the Piaggio P180 aircraft, as depicted in
Figure 4. The letters B and L refer to conventional indications for determining the positions of the wing section used in this investigation.
The test article consists of the CFRP wing skin, ribs, and spars. In detail, the spars, ribs, and upper skin panel are liquid-infused parts co-cured together. The lower panel is instead bonded by means of an adhesive paste to the corresponding caps of the three longitudinal spars (
Figure 5a). The middle spar stops at around half of the wingbox span (
Figure 5b). The root-ward and tip-ward chords are about 570 and 490 mm, respectively.
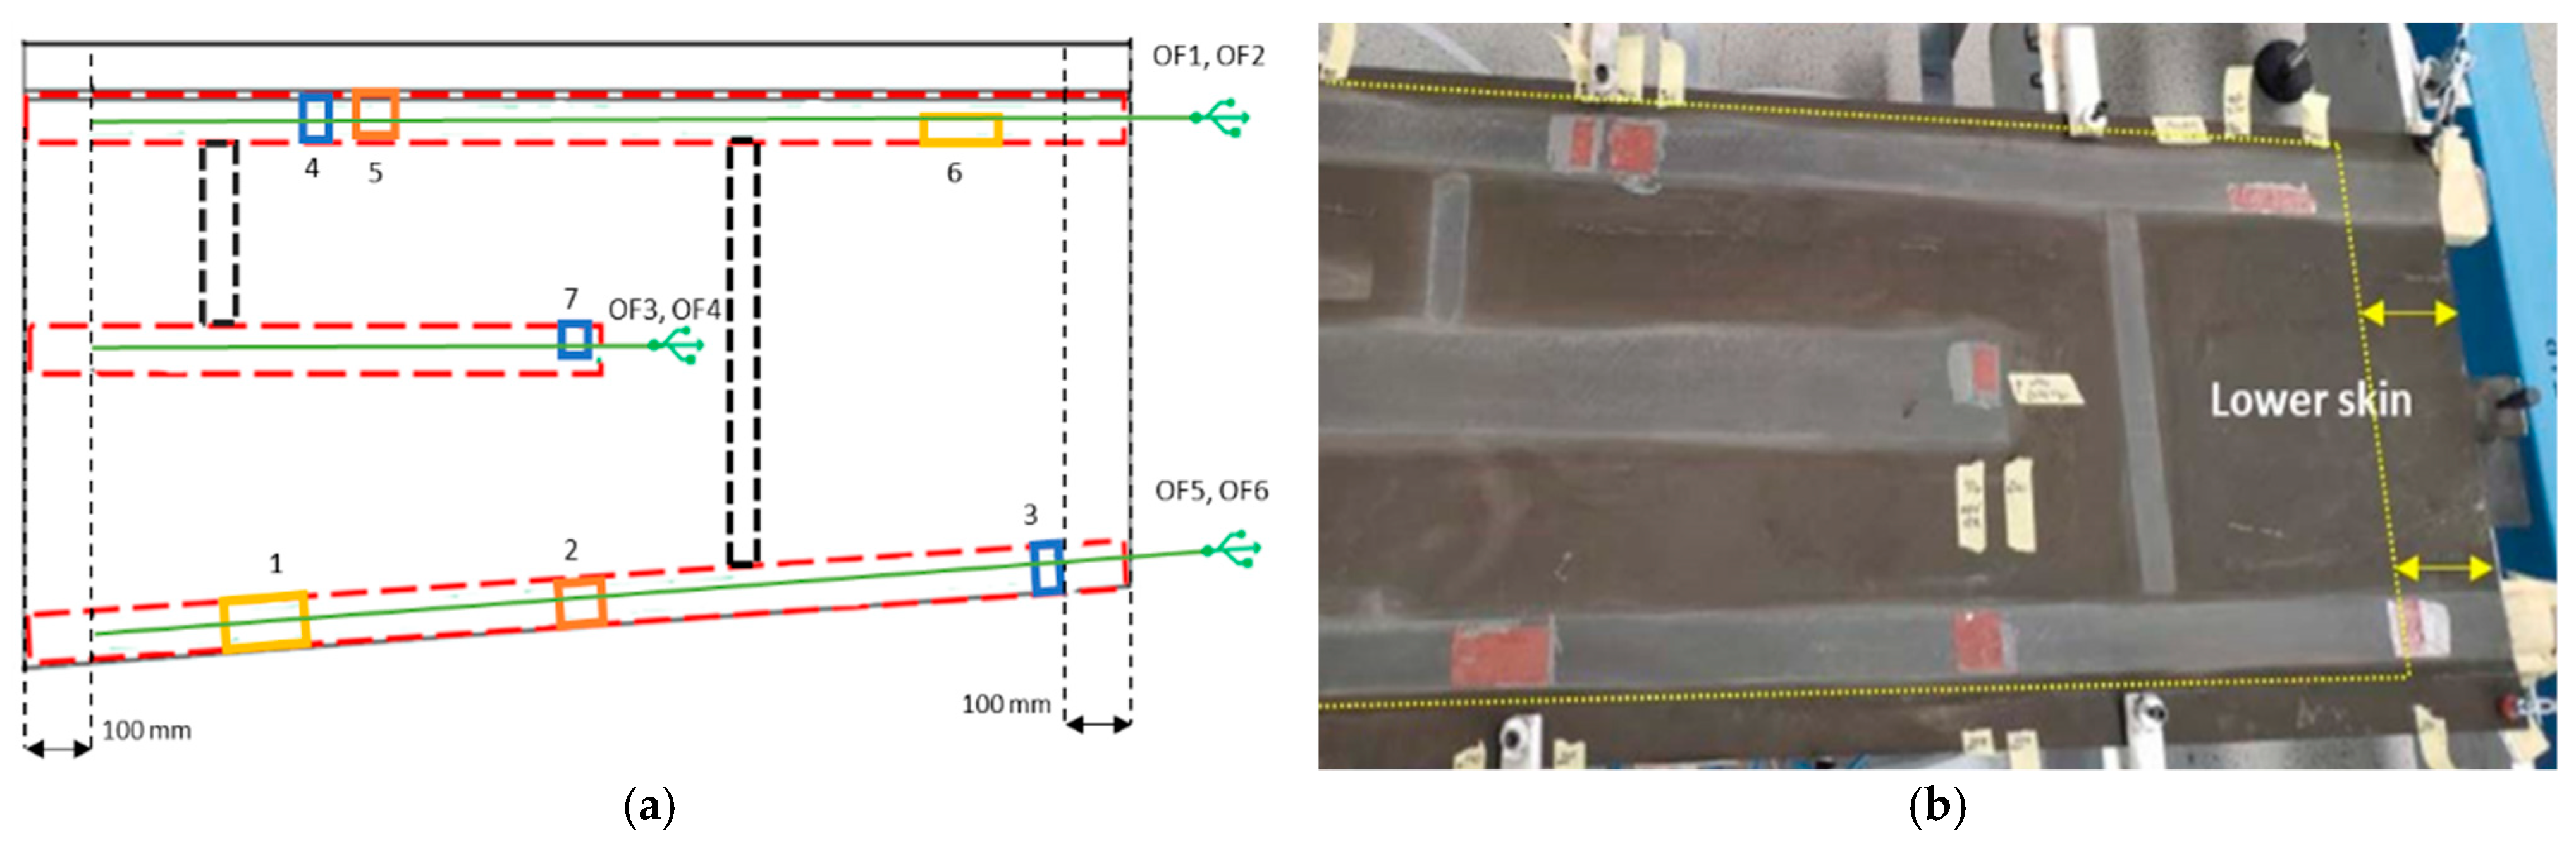
Seven different artificial debonding areas were deployed in correspondence with the interfaces between the spar caps and the lower skin panel by inserting Teflon patches during the bonding manufacturing process. Such patches stop the bonding agent from interacting with the structural parts and connect them mechanically. Two of the imposed defects extended for just half of the cap width, while the remaining five covered all that extension. Damage areas N4 and N5 were placed very close to each other at a nominal spanwise distance of about 20 mm to verify if the SHM system is able to detect them separately. The flaws’ dimensions are given in
Table 1. A schematic damage map (
Figure 6a) was defined to test the capabilities of the SHM system to detect an example of manufacturing faults, like a kissing bond (or dry contact), under selected typical qualification loading tests (compression and bending). It must be pointed out that the input dimension of the artificial damage was provided according to the minimum distance between mechanical features (i.e., chicken rivets) foreseen for this specific wing architecture.
A total of six DFOS were used, each about 1 m long, and installed on the test article, embedded within the bonding lines between the lower skin panel and the corresponding spar caps. For redundancy, in fact, two fibres were deployed for each region of interest to avoid possible data loss during the test process. In
Figure 6a, the green lines represent the optical fibres’ positions, while the red lines delimitate the bonding regions between the spar caps and the lower skin. On both sides, a 100 mm distance was implemented to allow for the easy entry and exit of the sensor lines without interfering with the boundary constraints. The installation of two heavy plates aimed at both transferring the load to the extremal sections uniformly and properly being mounted on the test rig. Such plates were drilled to allow the optical fibres to reach the SHM system electronics hardware (f.i., the optical interrogator and the associated PC) and the LHEO algorithm.
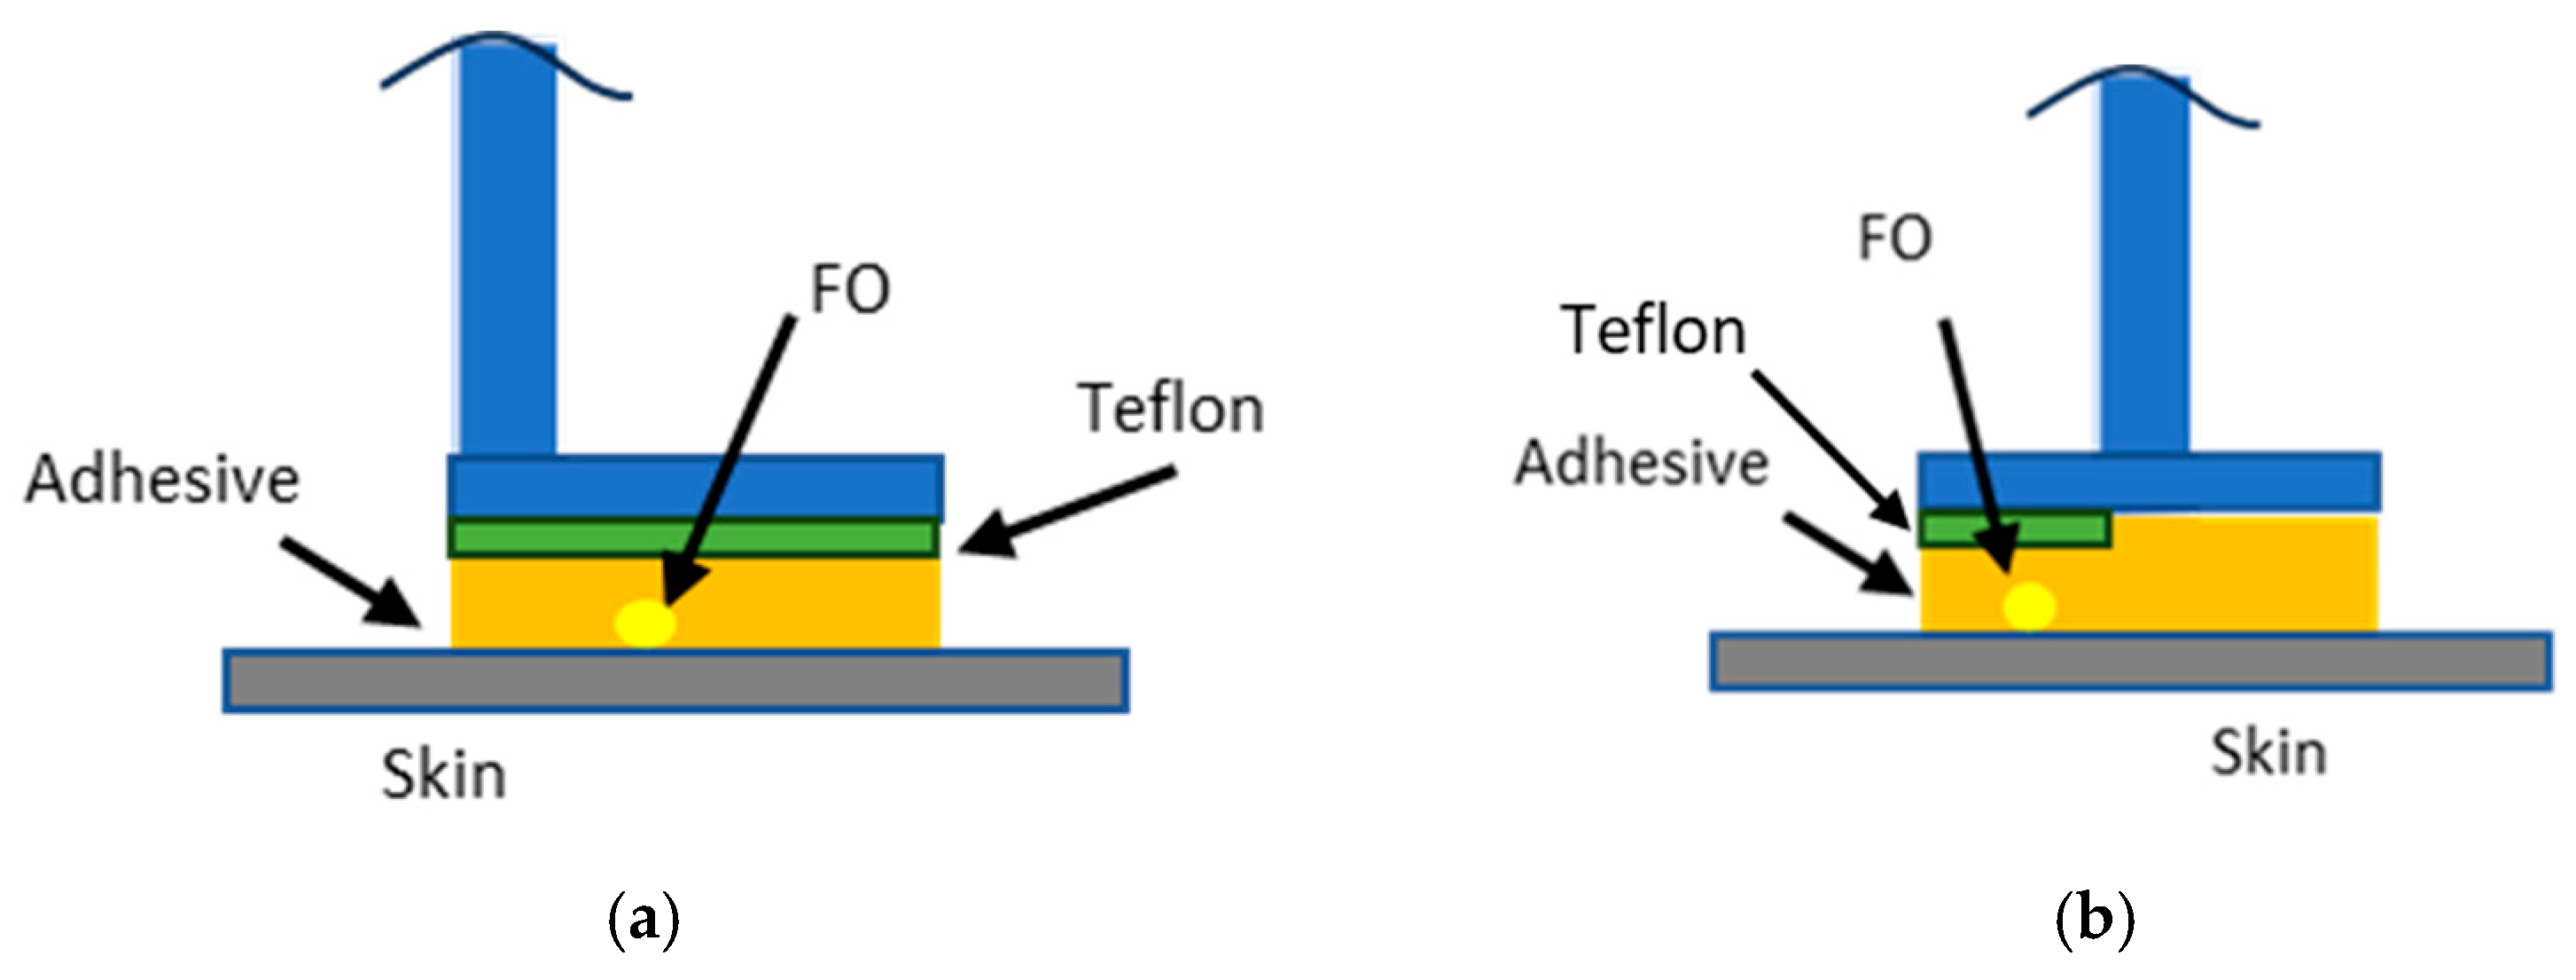
The optical fibres were installed between the lower skin and spar caps of the longerons, corresponding to the bonding line. During the manufacturing process of the test article, they were bonded to the lower skin by means of hair spray adhesive to stabilize them during the wingbox assembly. Then, the skin panel was bonded to the longerons by means of an adhesive paste. Since the thickness of the optical fibre is about tenths of a millimeter and the magnitude of that of the utilized adhesive paste is a few millimeters, it can be assumed that the fibre does not touch the Teflon patch. Therefore, it can be supposed that the strain measured by the sensors is only related to the deformation field of the skin, which is affected by the presence of the disbonded area. Schematic figures of the optical fibres’ installation are shown below (
Figure 7):
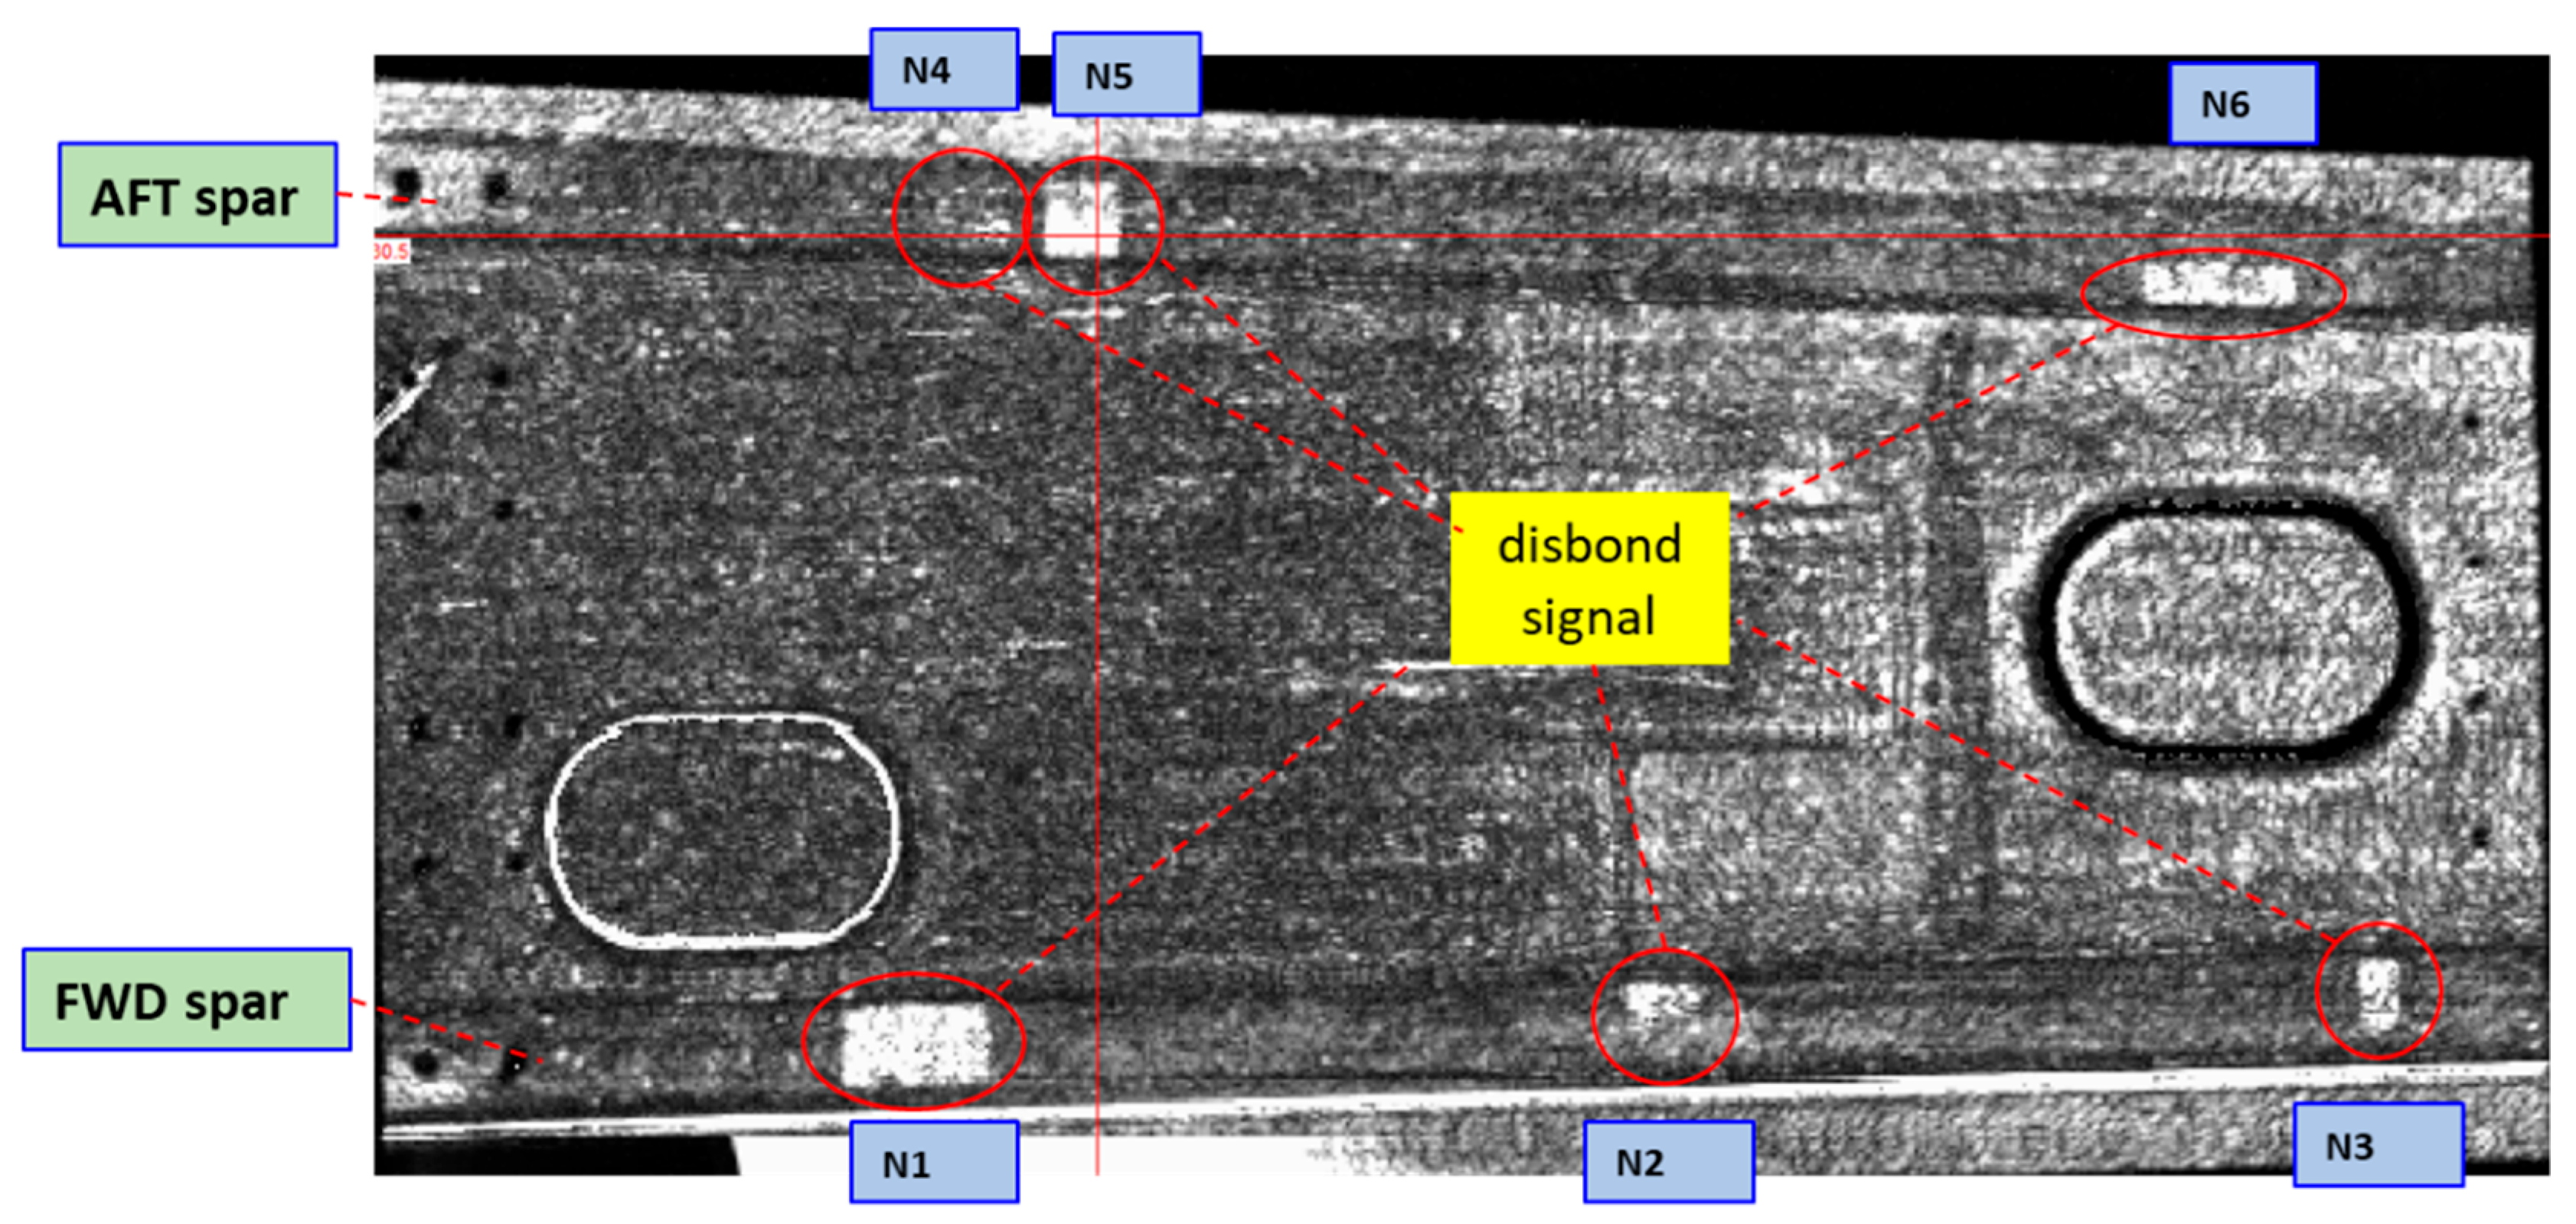
For the sake of completeness,
Figure 8 reports the C-scan of the test article after its assembly. It may be of certain relevance to note that the damage area, N7, on the middle spar, was undetected, while the damage areas N4 and N5 seemed partially covered by the adhesive agent. This is probably due to the squeezing of the adhesive paste itself during the assembly of the items. This shows how C-Scan may sometimes, and to a certain extent, fail to detect imperfections in composite structures. This is among the reasons why C-scan is not believed to be a reliable tool with respect to the regulations. In this context, the use of an SHM system could contribute to making its detection capability more reliable.
This highlighted that C-Scan, as a methodology for detecting imperfections or damage in a composite structure involving bonded joints, is often not reliable for detecting them and cannot be used as a reliable NDI tool according to regulations. In this context, the use of an SHM system could bypass the randomness of the type of investigation, thus making the measurement certain and reliable.
4. Ground Static Tests: Description and Results
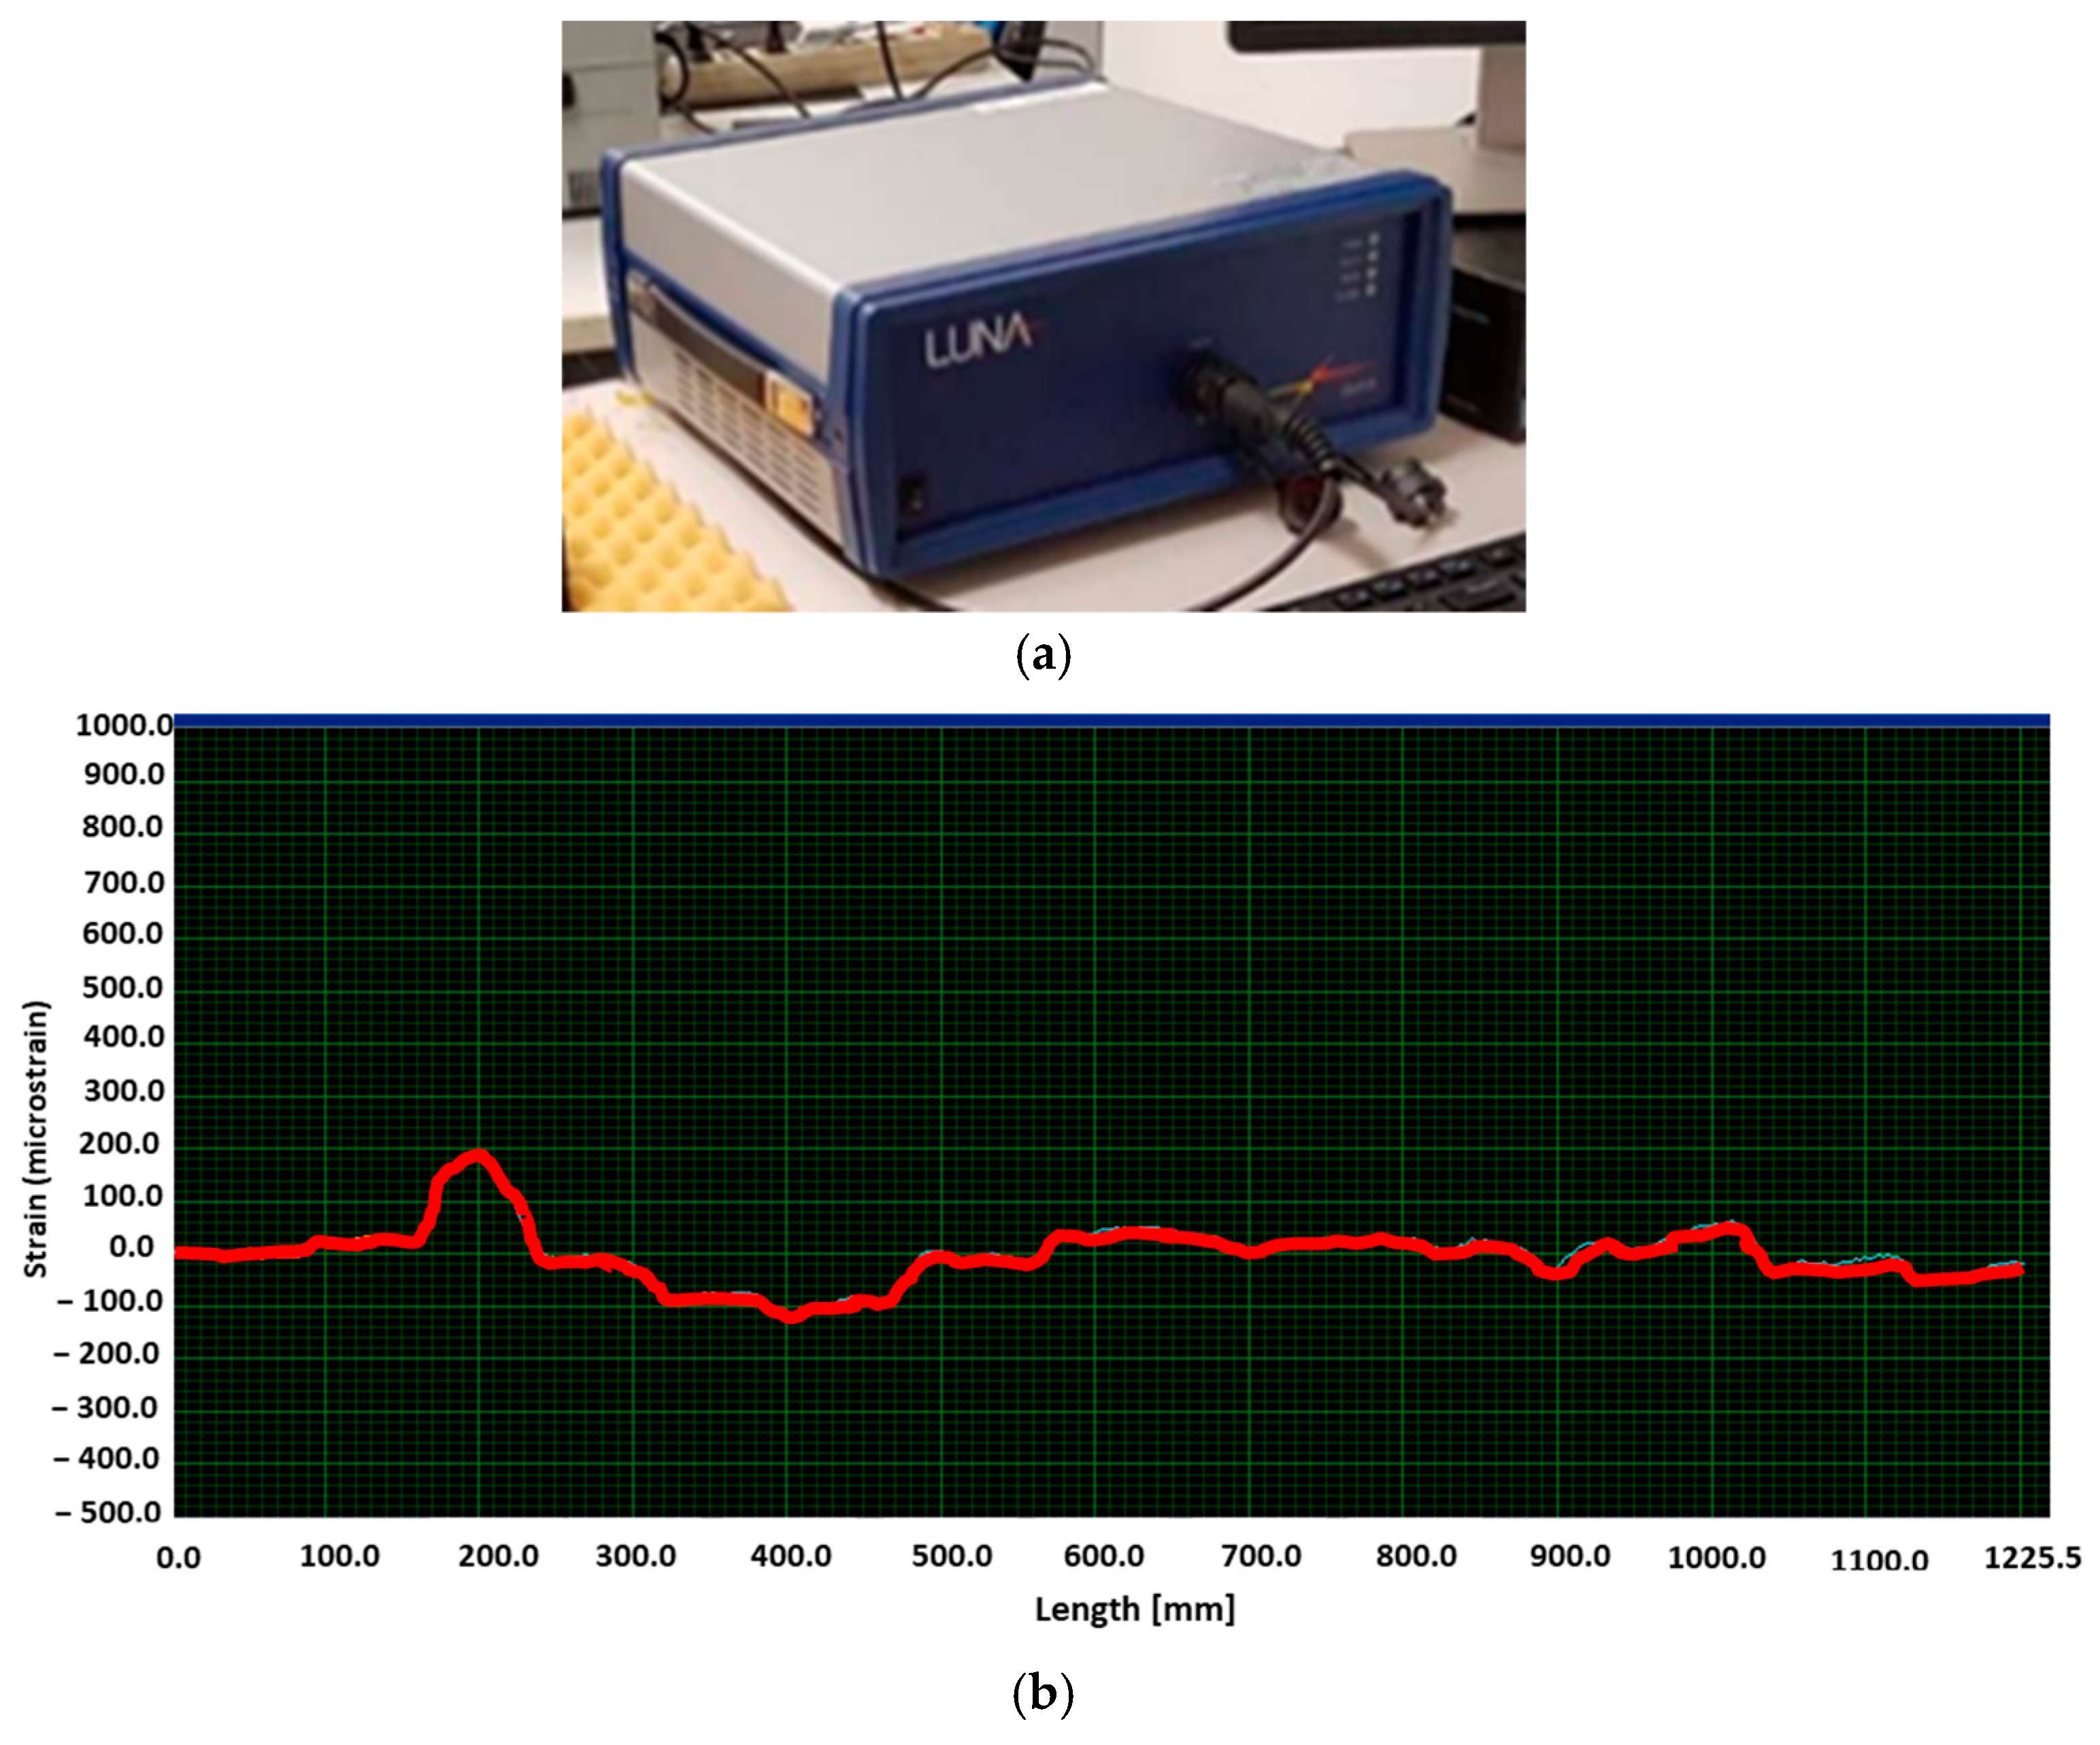
Optical fibre data were logged through the ODISI-B interrogator by LUNA, as shown in
Figure 9a. Such a model carries a single channel and is suitable for interrogating one fibre at a time. Therefore, multiple tests were performed to retrieve all the deployed sensors. The space discretization is 5 mm, that is, the gauge length of the distributed fibre, and the default sample rate is 50 Hz, but the results were quasi-static signals.
External strain gauge sensors were installed to provide information to evaluate the actual repeatability level of the measure. After curing, a functionality check was performed on all the optical fibres to verify their actual functionality, as shown in
Figure 9b.
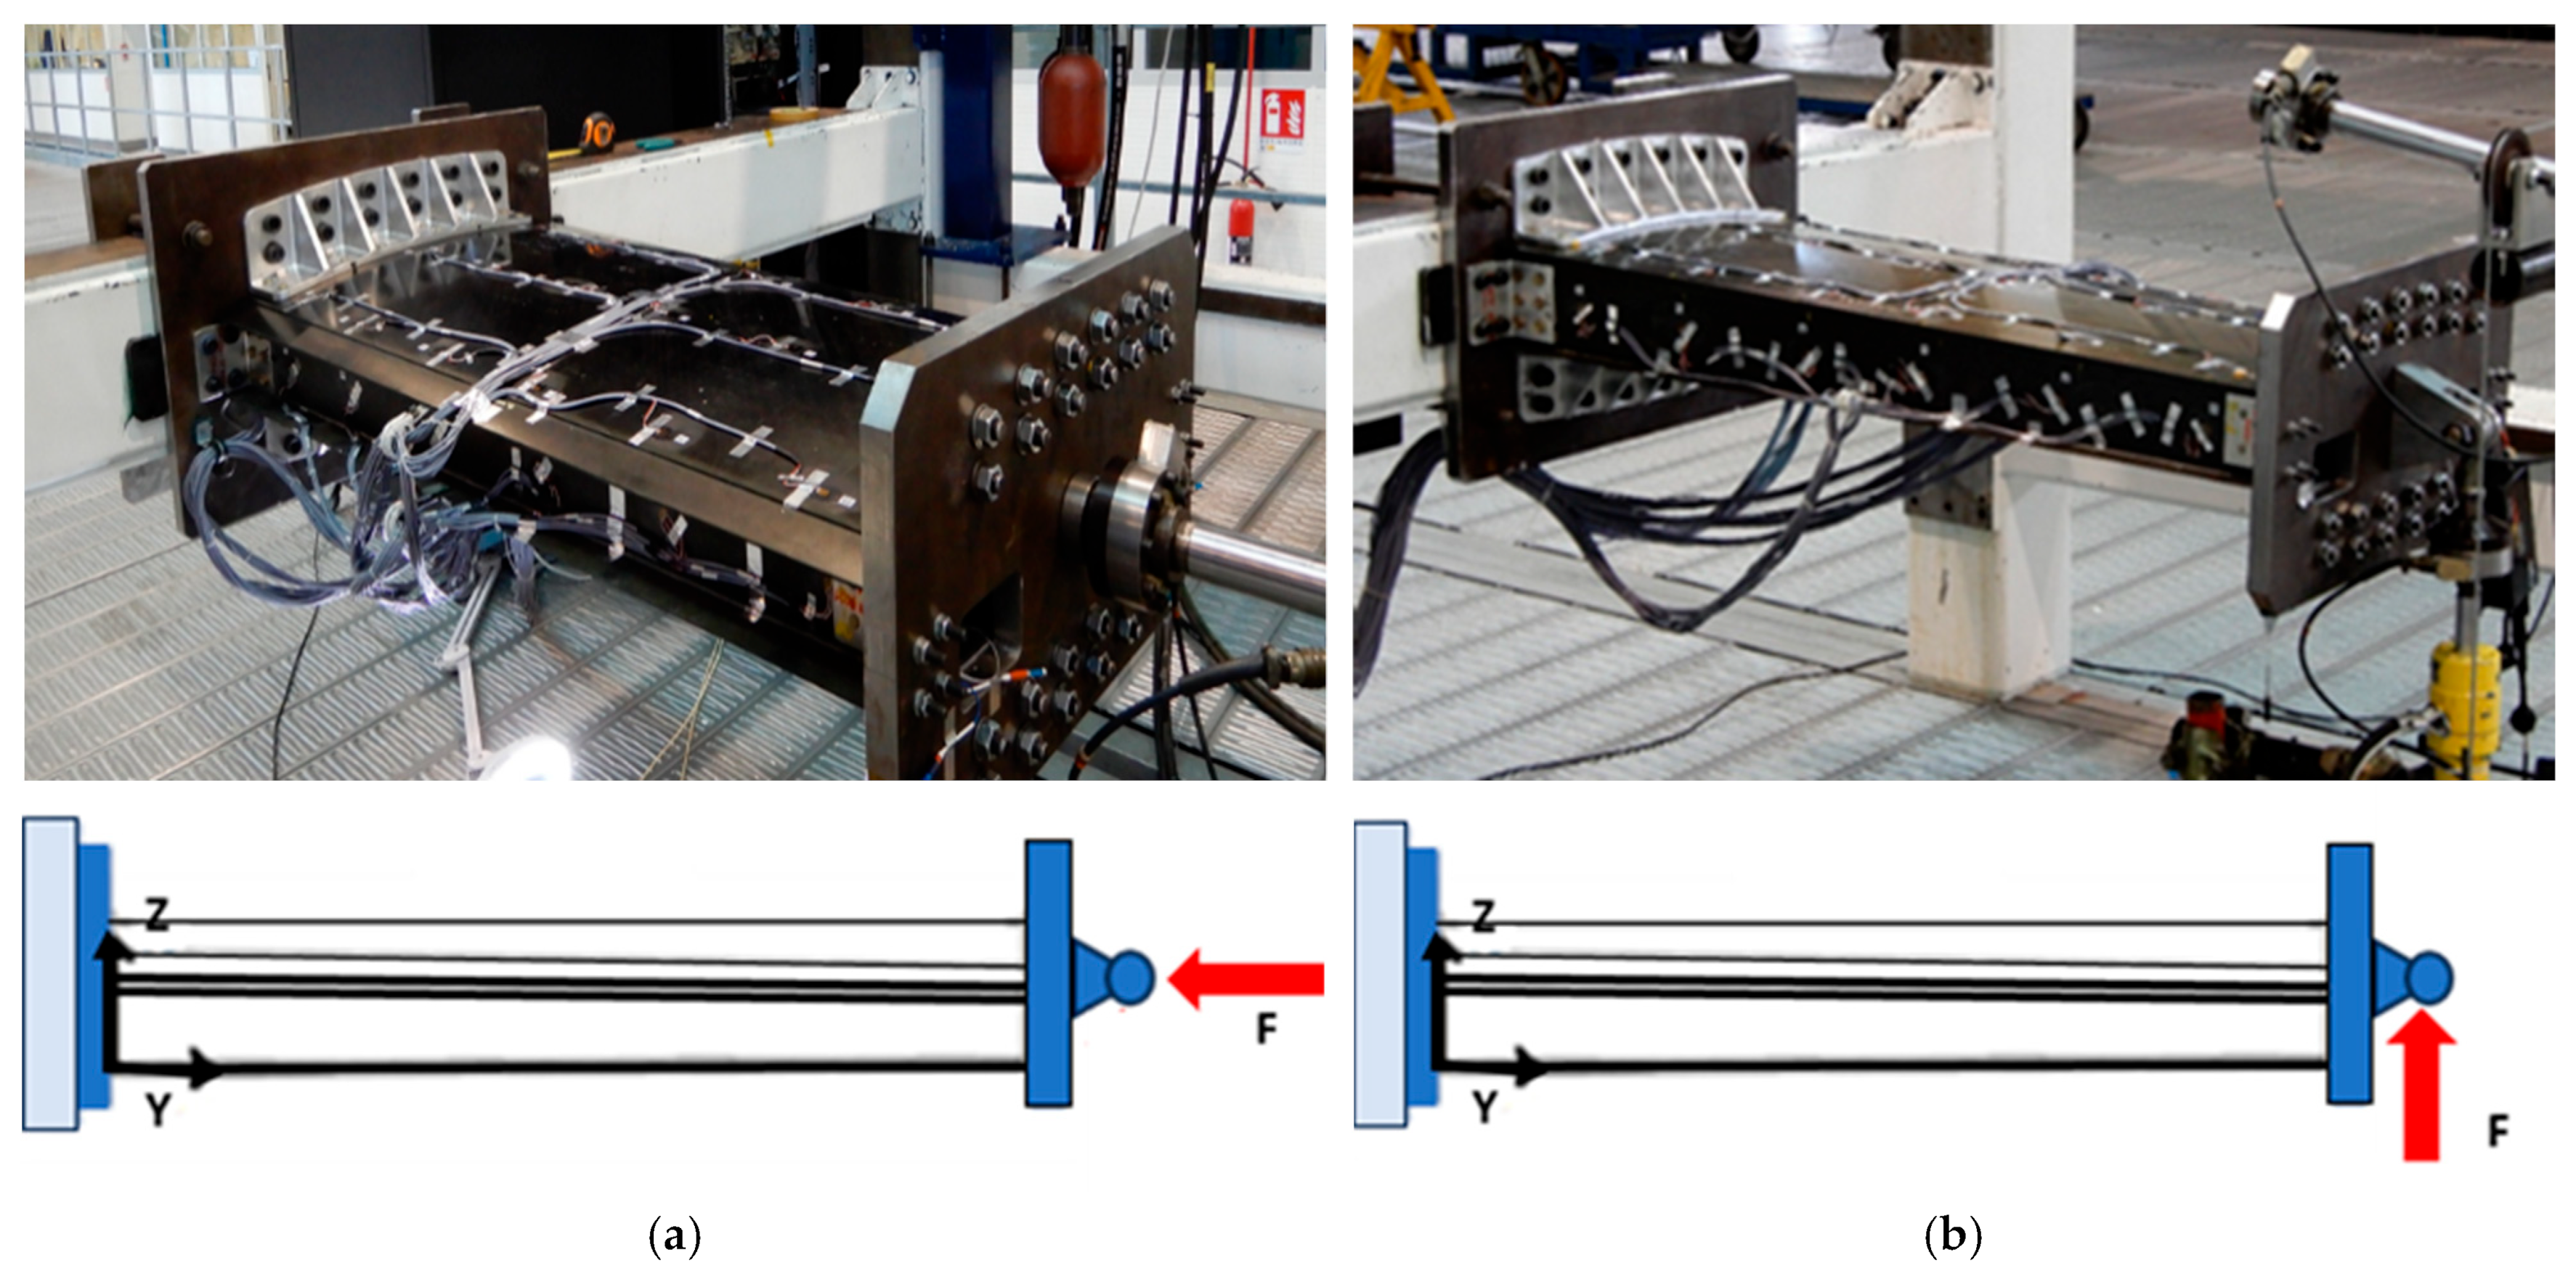
For the experiment, the wingbox section was installed on the test rig at the Piaggio lab and prepared to undergo both compression (
Figure 10a) and bending loading tests (
Figure 10b). In both cases, the maximum force applied was initially defined as 20 kN. That limit was reached only for the compression tests, while in bending (where much larger strains than in the previous case were expected), it was preferred to use a 20% safety margin, limiting the force to 16 kN.
Table 2 reports the test rig equipment used during the tests.
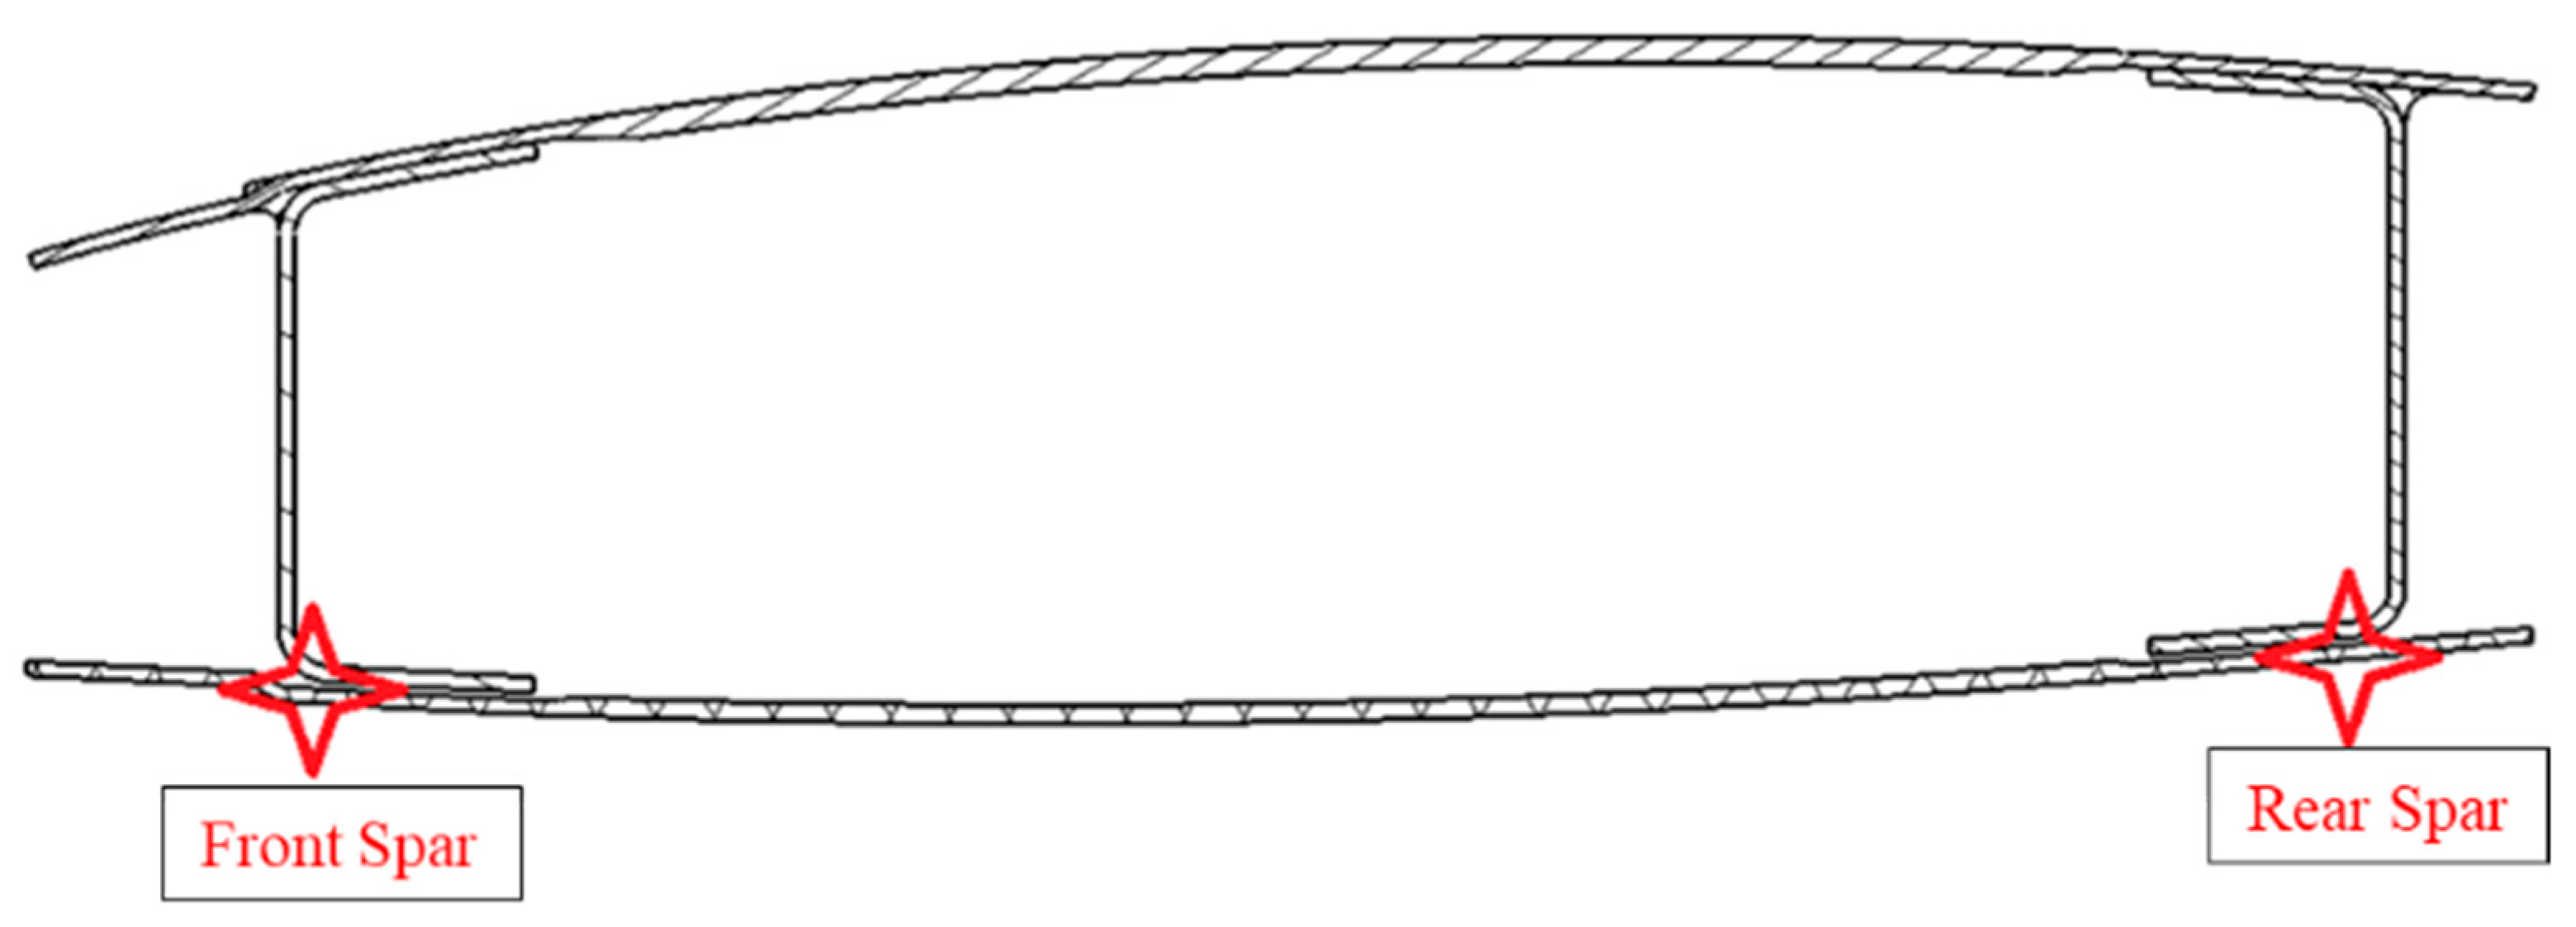
In the
Z-axis direction, the two linear displacement transducers were installed on the tips of the front and rear spars, respectively (
Figure 11), to prevent possible instability during the tests’ loading phases.
In the sections below, the results following the data elaborations by the SHM algorithm are reported for both the compression and bending loading tests.
4.1. Compression Tests: Strain Maps and SHM LHEO Algorithm Readouts
For the compression tests, the strain signal was partially faded by the background noise, so it was expected that the algorithm may provide a partial response, but it would still be relevant in terms of outcomes. In previous works, in fact, the implemented SHM system was shown to be sensitive to signals of the magnitude of hundreds of microstrains; see ref. [
25].
Figure 12a reports the progression of the deformation levels vs. load amplitude, spanwise, while
Figure 12b reports the time evolutions of the strains derived from a selected pair of sensors. The steps correspond to some plateau where the load stands still for a while. The measurements took place during the whole period of acquisition.
The strain starts from a nominal value of zero in its first segment, corresponding to the part of the fibre that is not connected to the wingbox plate surface, so that it is unloaded. Those magnitudes may be considered representative of structural strain noise. For the compression loads, the strain results are almost linear, as expected. A sort of modulation of its profile is present along the wingbox span that is associated with a reduction in the transversal section of the tapered test article but not associated with a uniform reduction in its stiffness since the components are not uniform (for instance, the middle spar extends for just half a span; or, non-recursive structural elements are also present; or even, the spar width does not reduce with the span; and so on).
As anticipated, the signal-to-noise ratio was very low since small strains were attained during this kind of test. After LHEO post-processing, the DIs were computed, and the presence of possible flaws was detected.
Along the left column of
Figure 13, the DI values are reported (straight bars, sometimes highlighted in yellow), while along the right column of the same figure, a visual representation of the sensor array along the spar (yellow line) and the activated sensors (red dots) is reported, possibly indicating the presence of irregularities. The results in terms of damage dimension prediction consider the information gathered by both sensor lines used for each spar, simply carrying out an operation to find the mean of the extracted data.
Table 3 summarizes the estimated flaws’ lengths predicted by the LHEO algorithm compared with the nominal ones. Damage presence is generally detected, with some minor, isolated false positives (
Figure 13b). The region of accumulation of the detection points seems to be a key indicator of the presence of damage. It is relevant to note that flaws N4 and N5 are indistinguishable because of their proximity, so a global measure was obtained, which was compared with the overall length of both discontinuity areas, including the 20 mm separation. Positive values indicate an overestimate of the anomaly, while minus sign refers to an underestimation. As reported in the bibliography, some previous studies by the same authors [
25,
26,
27] did in fact show that the effect of damage always goes beyond its actual size. In other words, the region where the strain differs with respect to an integral configuration extends over an area larger than its size. This concept is fairly intuitive and was preliminary quantified for specific configurations in the abovementioned manuscripts. Concerning
Figure 13, it should be noted that column b shows a simple pictorial representation of the actual fibre layout and is made only for visualization purposes. Due to the tapered view of the wingbox picture, the optical fibre track is seen to follow the spar direction only partially. The red marks over those yellow lines, reported in those same figures, relate to the predicted locations of the damage areas.
It must be noted that the inlet strain distribution generated by the compression load is not enough to produce a signal-to-noise ratio level that is able to clearly detect damage region N3. In fact, the SHM system’s logic works on the irregularities of the strain map, resulting in a damaged structural configuration. If the strain is not large enough to clearly overcome the noise-to-signal ratio, detection is difficult; on the other hand, detection itself, irrespective of the detection method used, is strictly related to the excitation level. Furthermore, in the case of region N3, a role is also played by its length, which is shorter than the others, so a minimum number of sensors were actually active.
4.2. Bending Test: Strain Maps and SHM LHEO Readouts
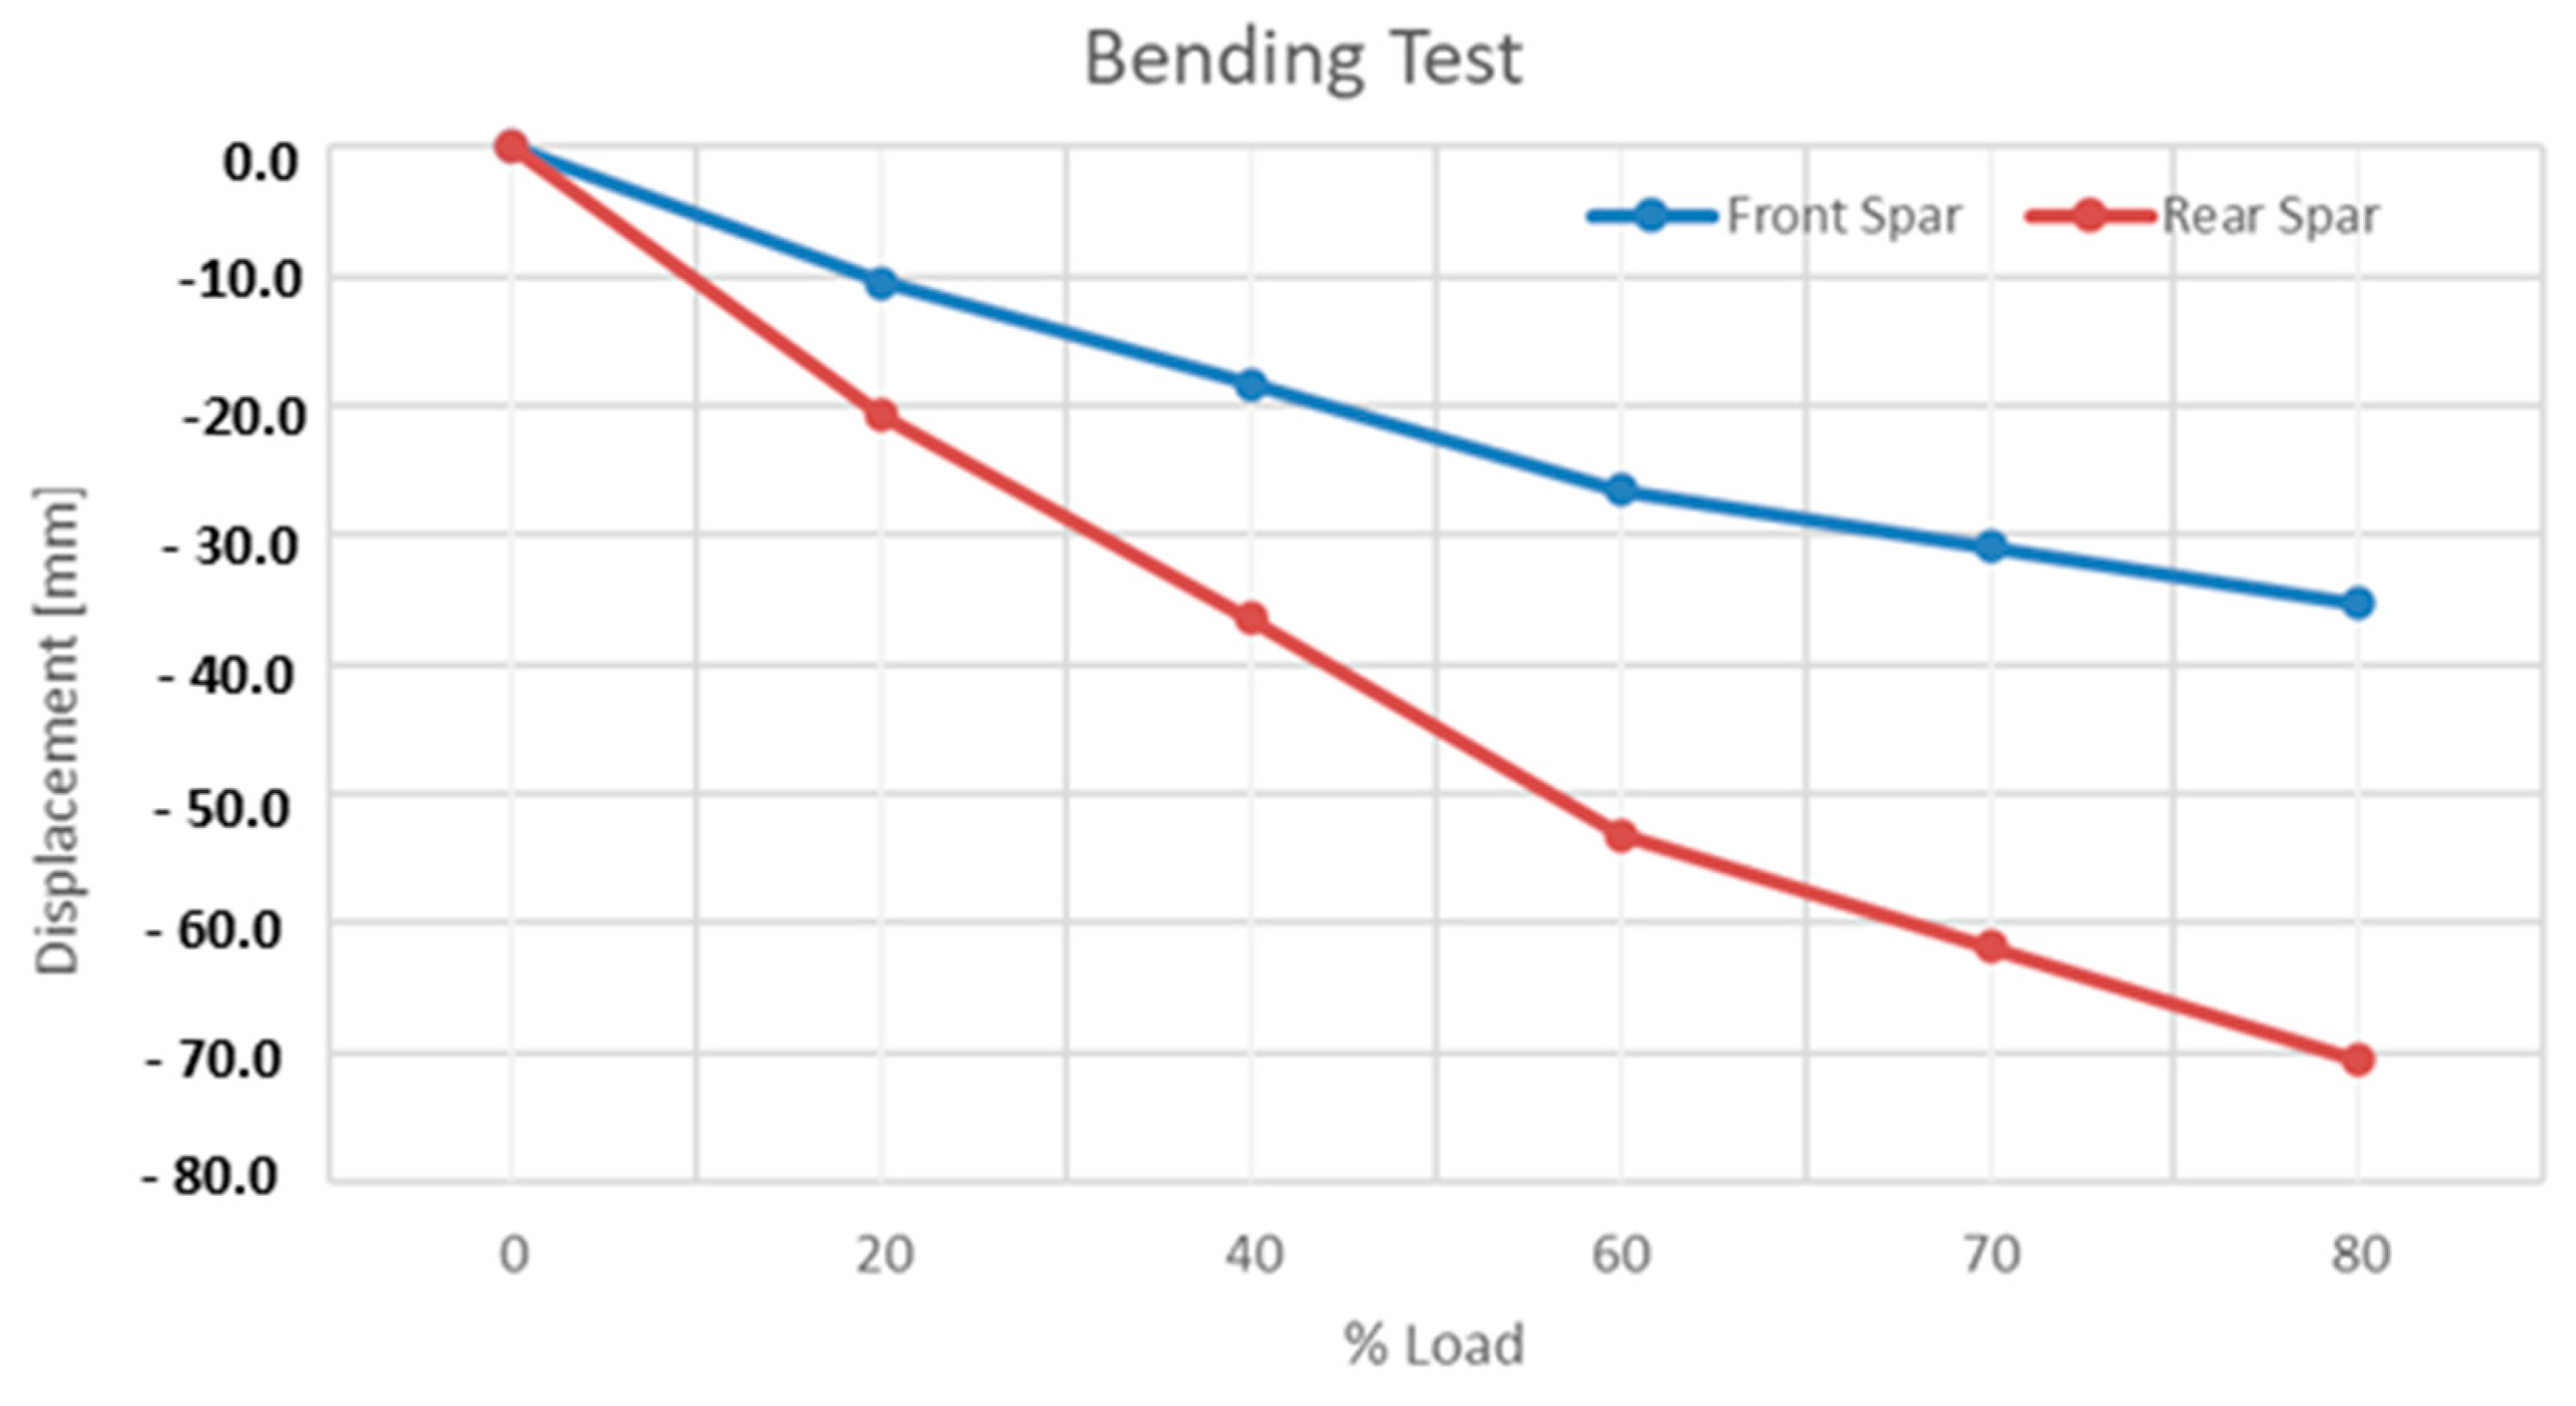
The results of the bending test are reported in this section. The
Figure 14 shows the linear relationship between the applied load and the displacements.
A similar process applied for the compression test was repeated for the bending one.
Figure 15 shows the deformation maps during the bending load process along the rear and middle spars, as examples, at five different values of the external force, namely 20%, 40%, 60%, and 80% of the limit load (20 kN). Again, the linearity of the structural response vs. the load values is evident, and the strain profile appears very clear, presenting some peculiar, local high-edge onset, which was then analysed by the SHM algorithm.
As in the previous case, the strain starts with a nominal value of zero in its first segment, where the fibre is not connected to the structure. Even for the bending loads, the strain results can be roughly approximated by a linear interpolation, as expected, and as in the previous case, a sort of modulation of its profile along the wingbox span is present. This is associated with the tapering of the test article, accompanied by a non-uniform reduction in its stiffness. In the case of bending, characterized by a higher value of strain, the effect of the point force applied along the line of the middle spar becomes more evident. In detail, the strain does appear to be significantly linear along that element, with significant deviations at the extremal part of the longitudinal abscissa where the strain moves from zero to a finite value, and vice versa, since the fibre has to go back to zero as it is disconnected from the structure. More significant deviations from a linear behaviour are instead visible in the same segment for many concurrent reasons. The first reason is the border effect, where the Poisson ratio is more evident, so the structure should assume a slightly concave aspect. The non-uniform stiffness reduction and the presence of different elements along the span also contribute to some discrepancies from pure behaviour. Finally, the fact that the strain does not come back to zero at the side fibres is due to the fact that the acquisition terminates as the sensor is still attached to the structure, specifically while it is detached at the central spar. The strain difference between the maximum strain recorded at the middle and the lateral spars is also remarkable. This is linked to the test configuration. The external load is placed at half of the wingbox chord, where the middle spar does not arrive. The deformation is then driven by the lateral spars and the skin on the middle spar. It is then expected that the lateral spar deformation slightly exceeds that along the middle spar, while their values are confined in the same range (namely, between 500 and 800 microstrains).
Figure 16,
Figure 17 and
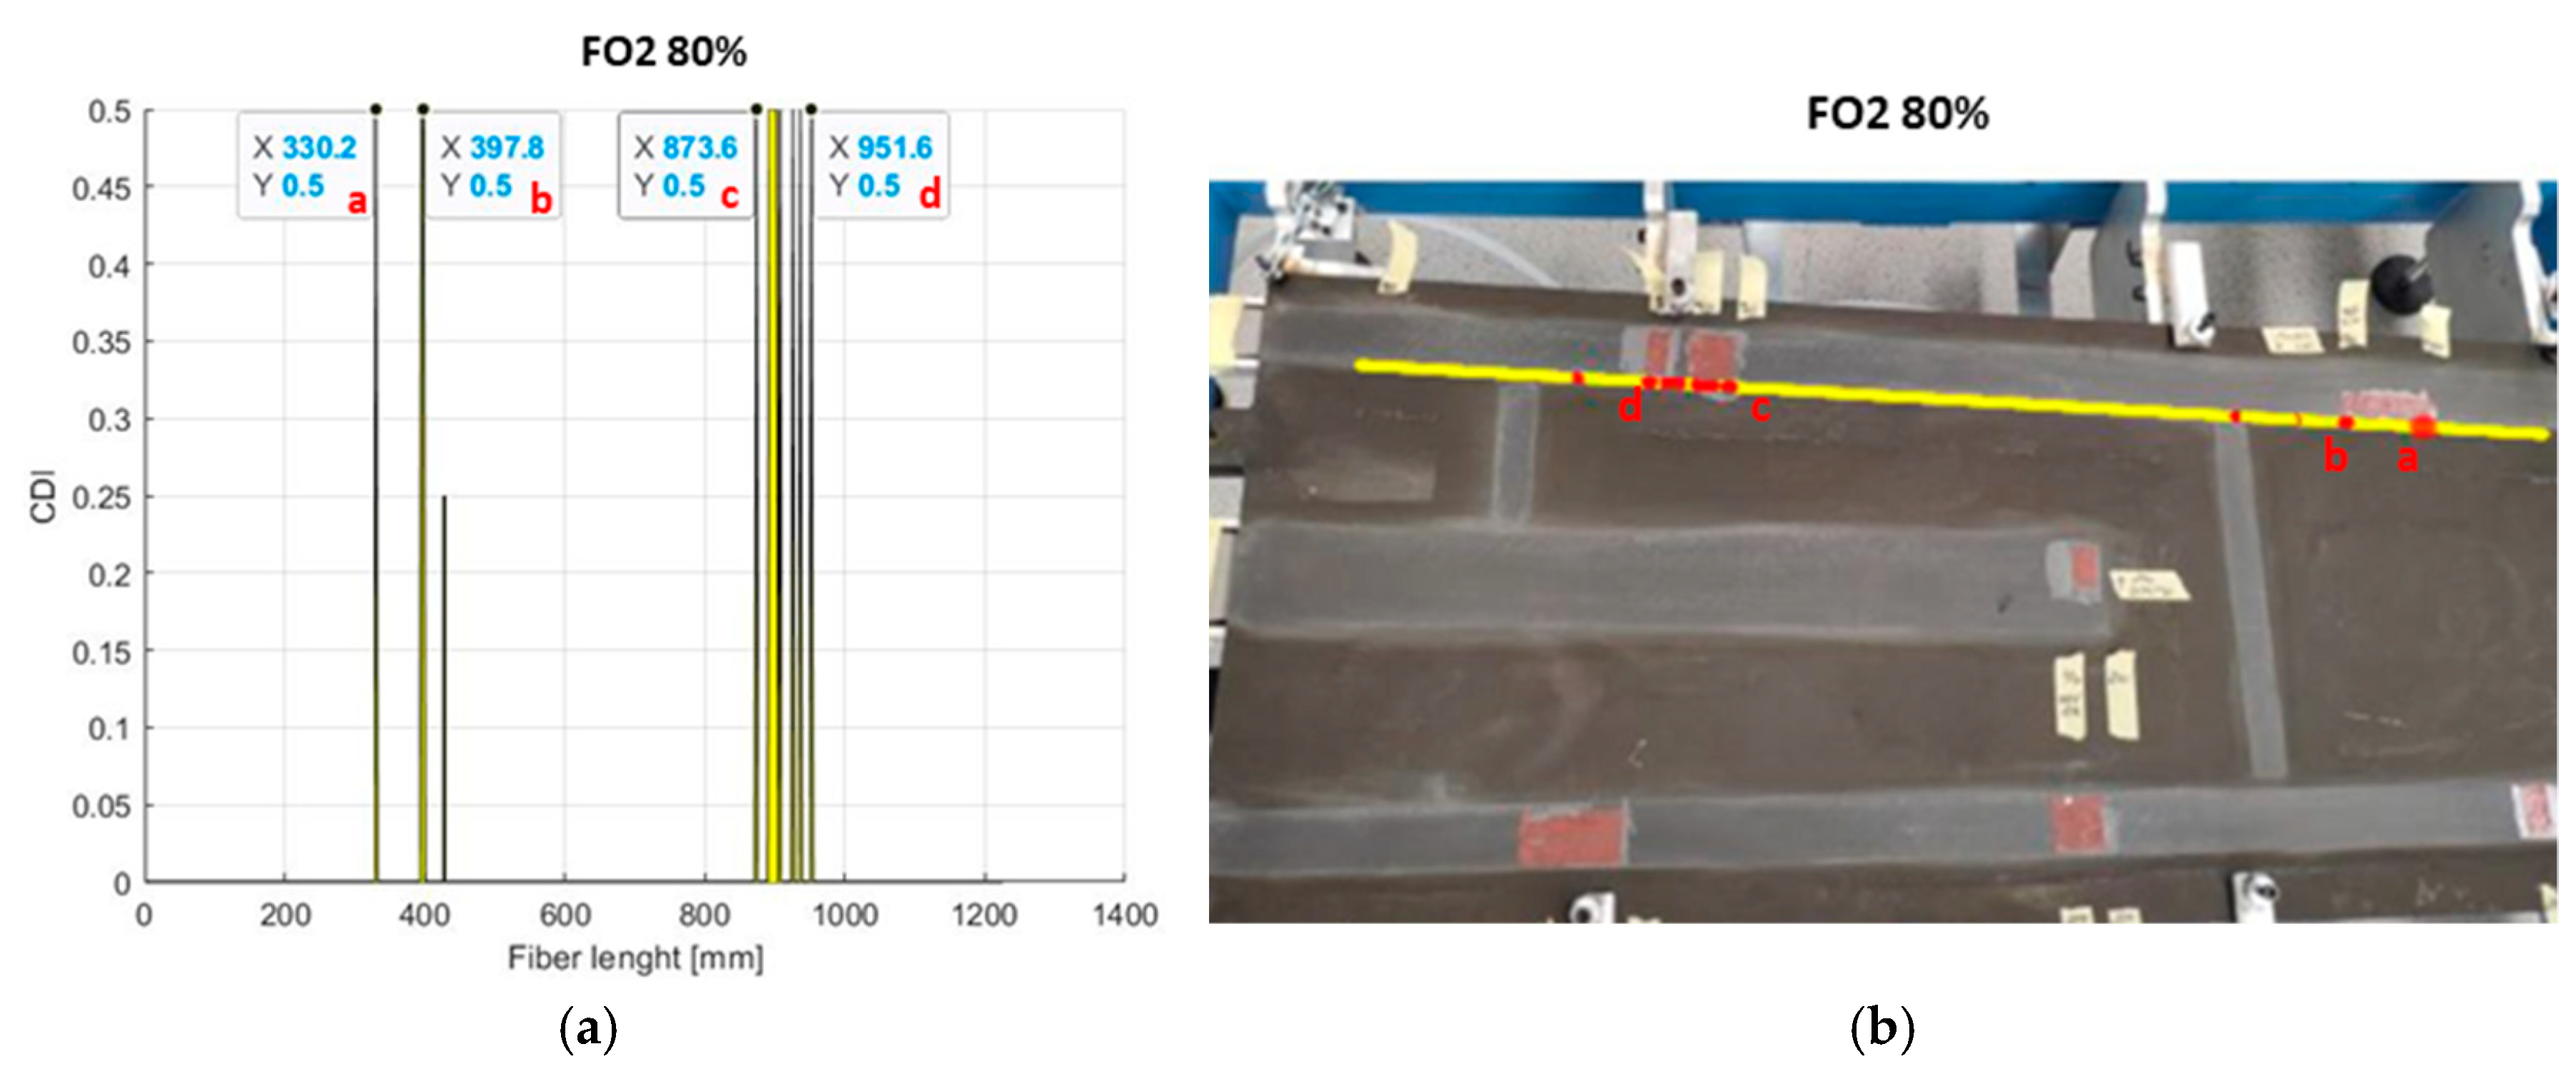
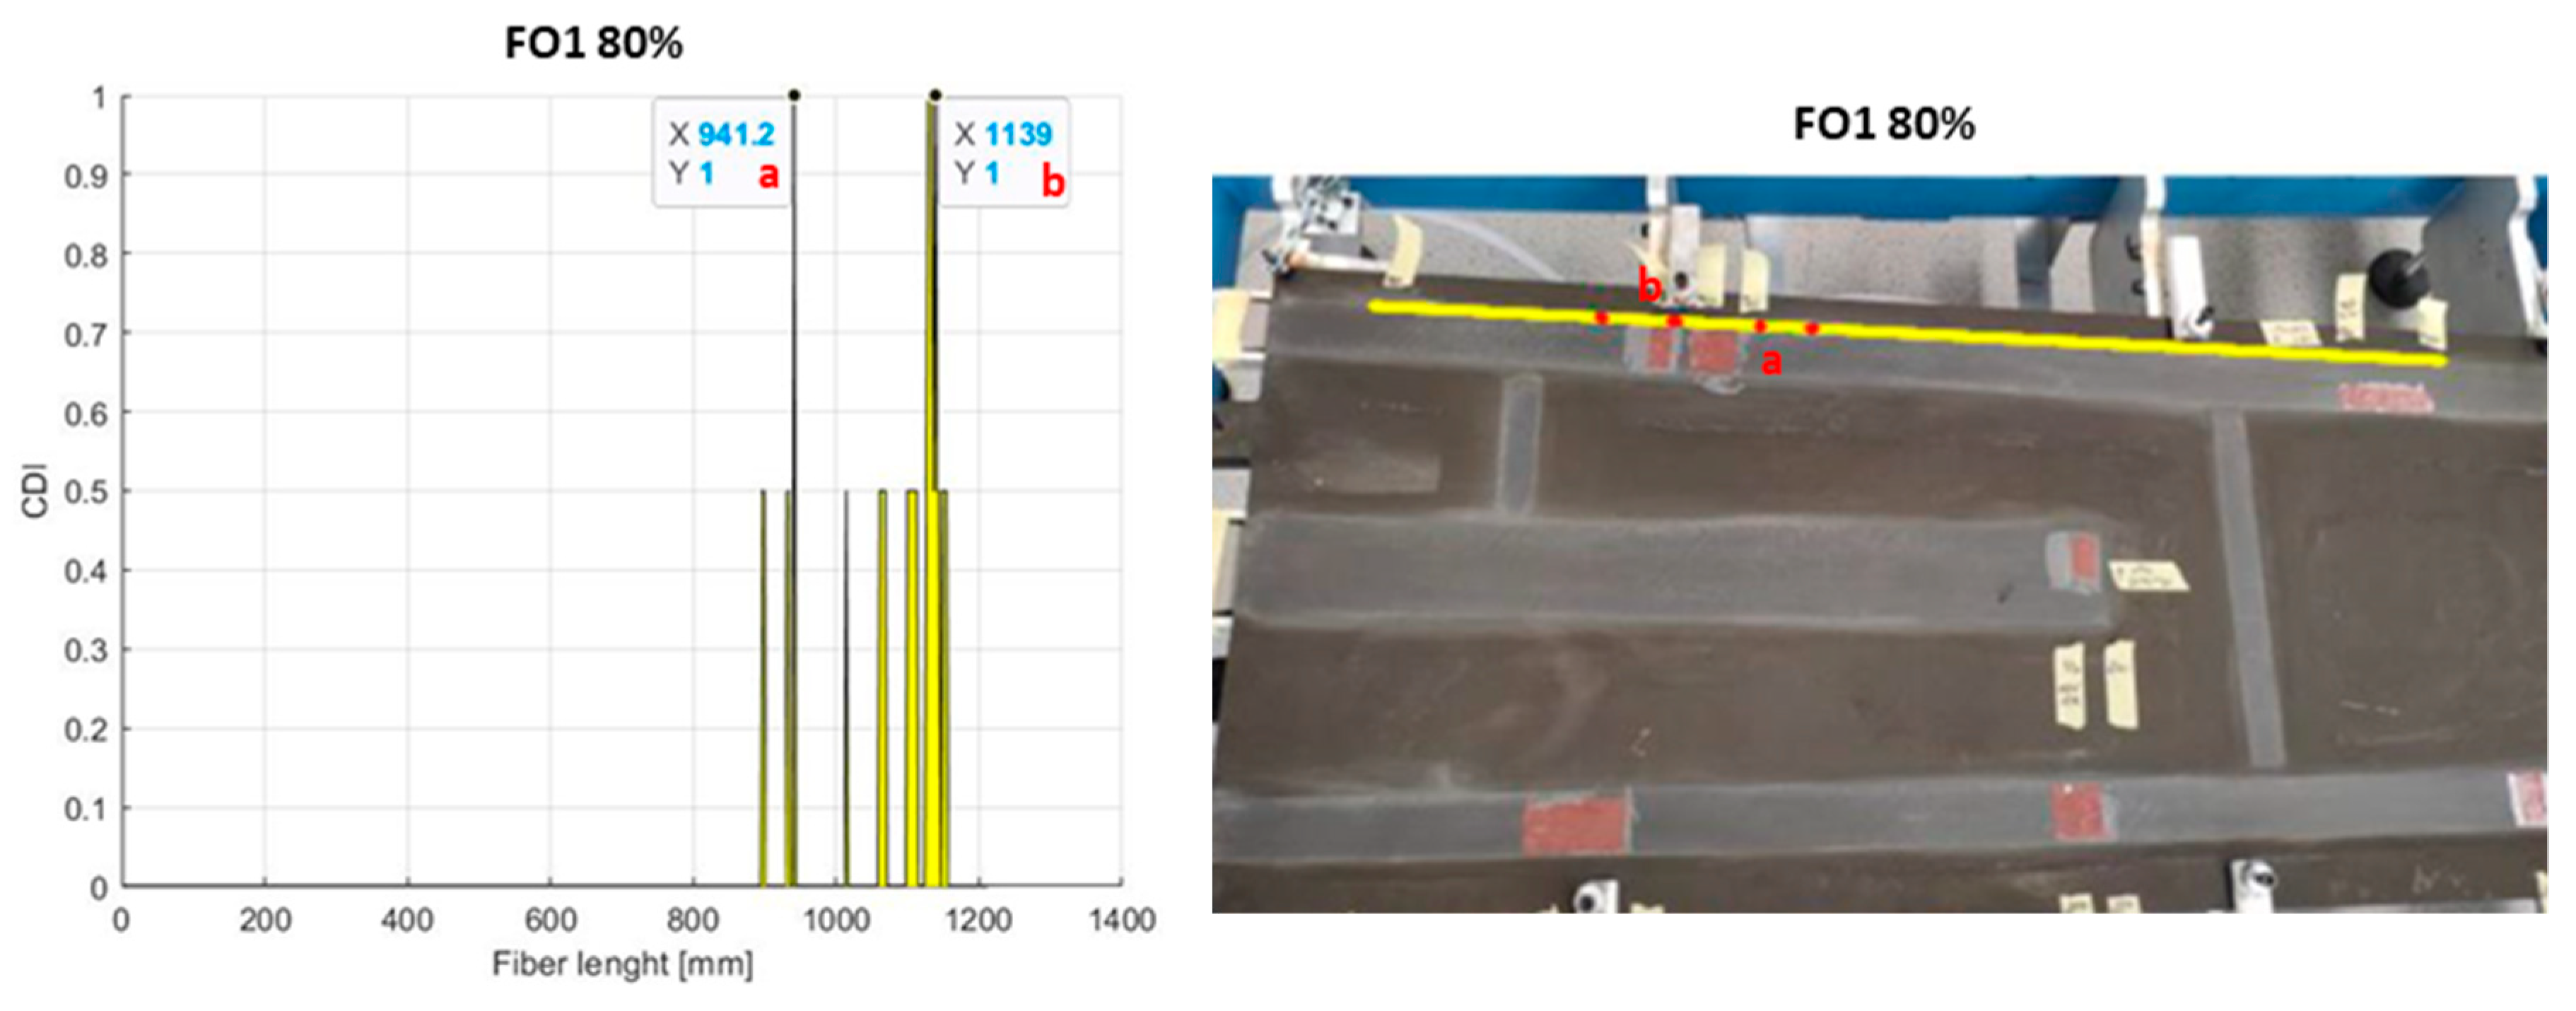
Figure 18 show the results of the SHM algorithm obtained by post-processing the strain maps produced by the action of the bending load at each spar, respectively. For each optical fibre, the left side of the mentioned pictures shows the damage index for the sensors (reported as red dots in the picture) that are eligible to detect the position of a damage area, while the right side is a visual representation of the same eligible sensors along the fibre (reported as a yellow line) and then along the referred spar. Such results refer to 80% of the limit load.
With reference to the rear spar, as shown in
Figure 16, the outcomes provided by FO2 seemed to allow for a better prediction of damage presence than what happens for FO1. The second fibre, in fact, showed good evidence of the presence of all the imposed irregularities along the structural region. Instead, FO1 seemed to be insensitive to the structural information. It detected the presence of flaw N6 and detected the flaws N4 and N5 only partially, which is poor when such a result was compared with what was provided by FO2. Because of their proximity, those anomalies were always detected as one in this investigation.
With reference to the middle spar, as shown in
Figure 17, it is necessary to remember that a single flaw was imposed along that structural element, limited in length and width. Both fibres were able to detect some anomalies in the strain signal associated with the presence of the imposed disbonding.
Several apparent false positives can be seen for both fibres; the word apparent is used to underline that the implemented LHEO algorithm is built in such a way that it detects the presence of anomalous behaviour in the strain function along the monitored line. Such peculiarities may occur, for instance, in the presence of local structural stiffening as the constraint (first batch of sensors, close to the wingbox section root) or a transversal stiffener at around a quarter of the span (maybe less), whose footprint is visible in the reported pictures, as shown in
Figure 17.
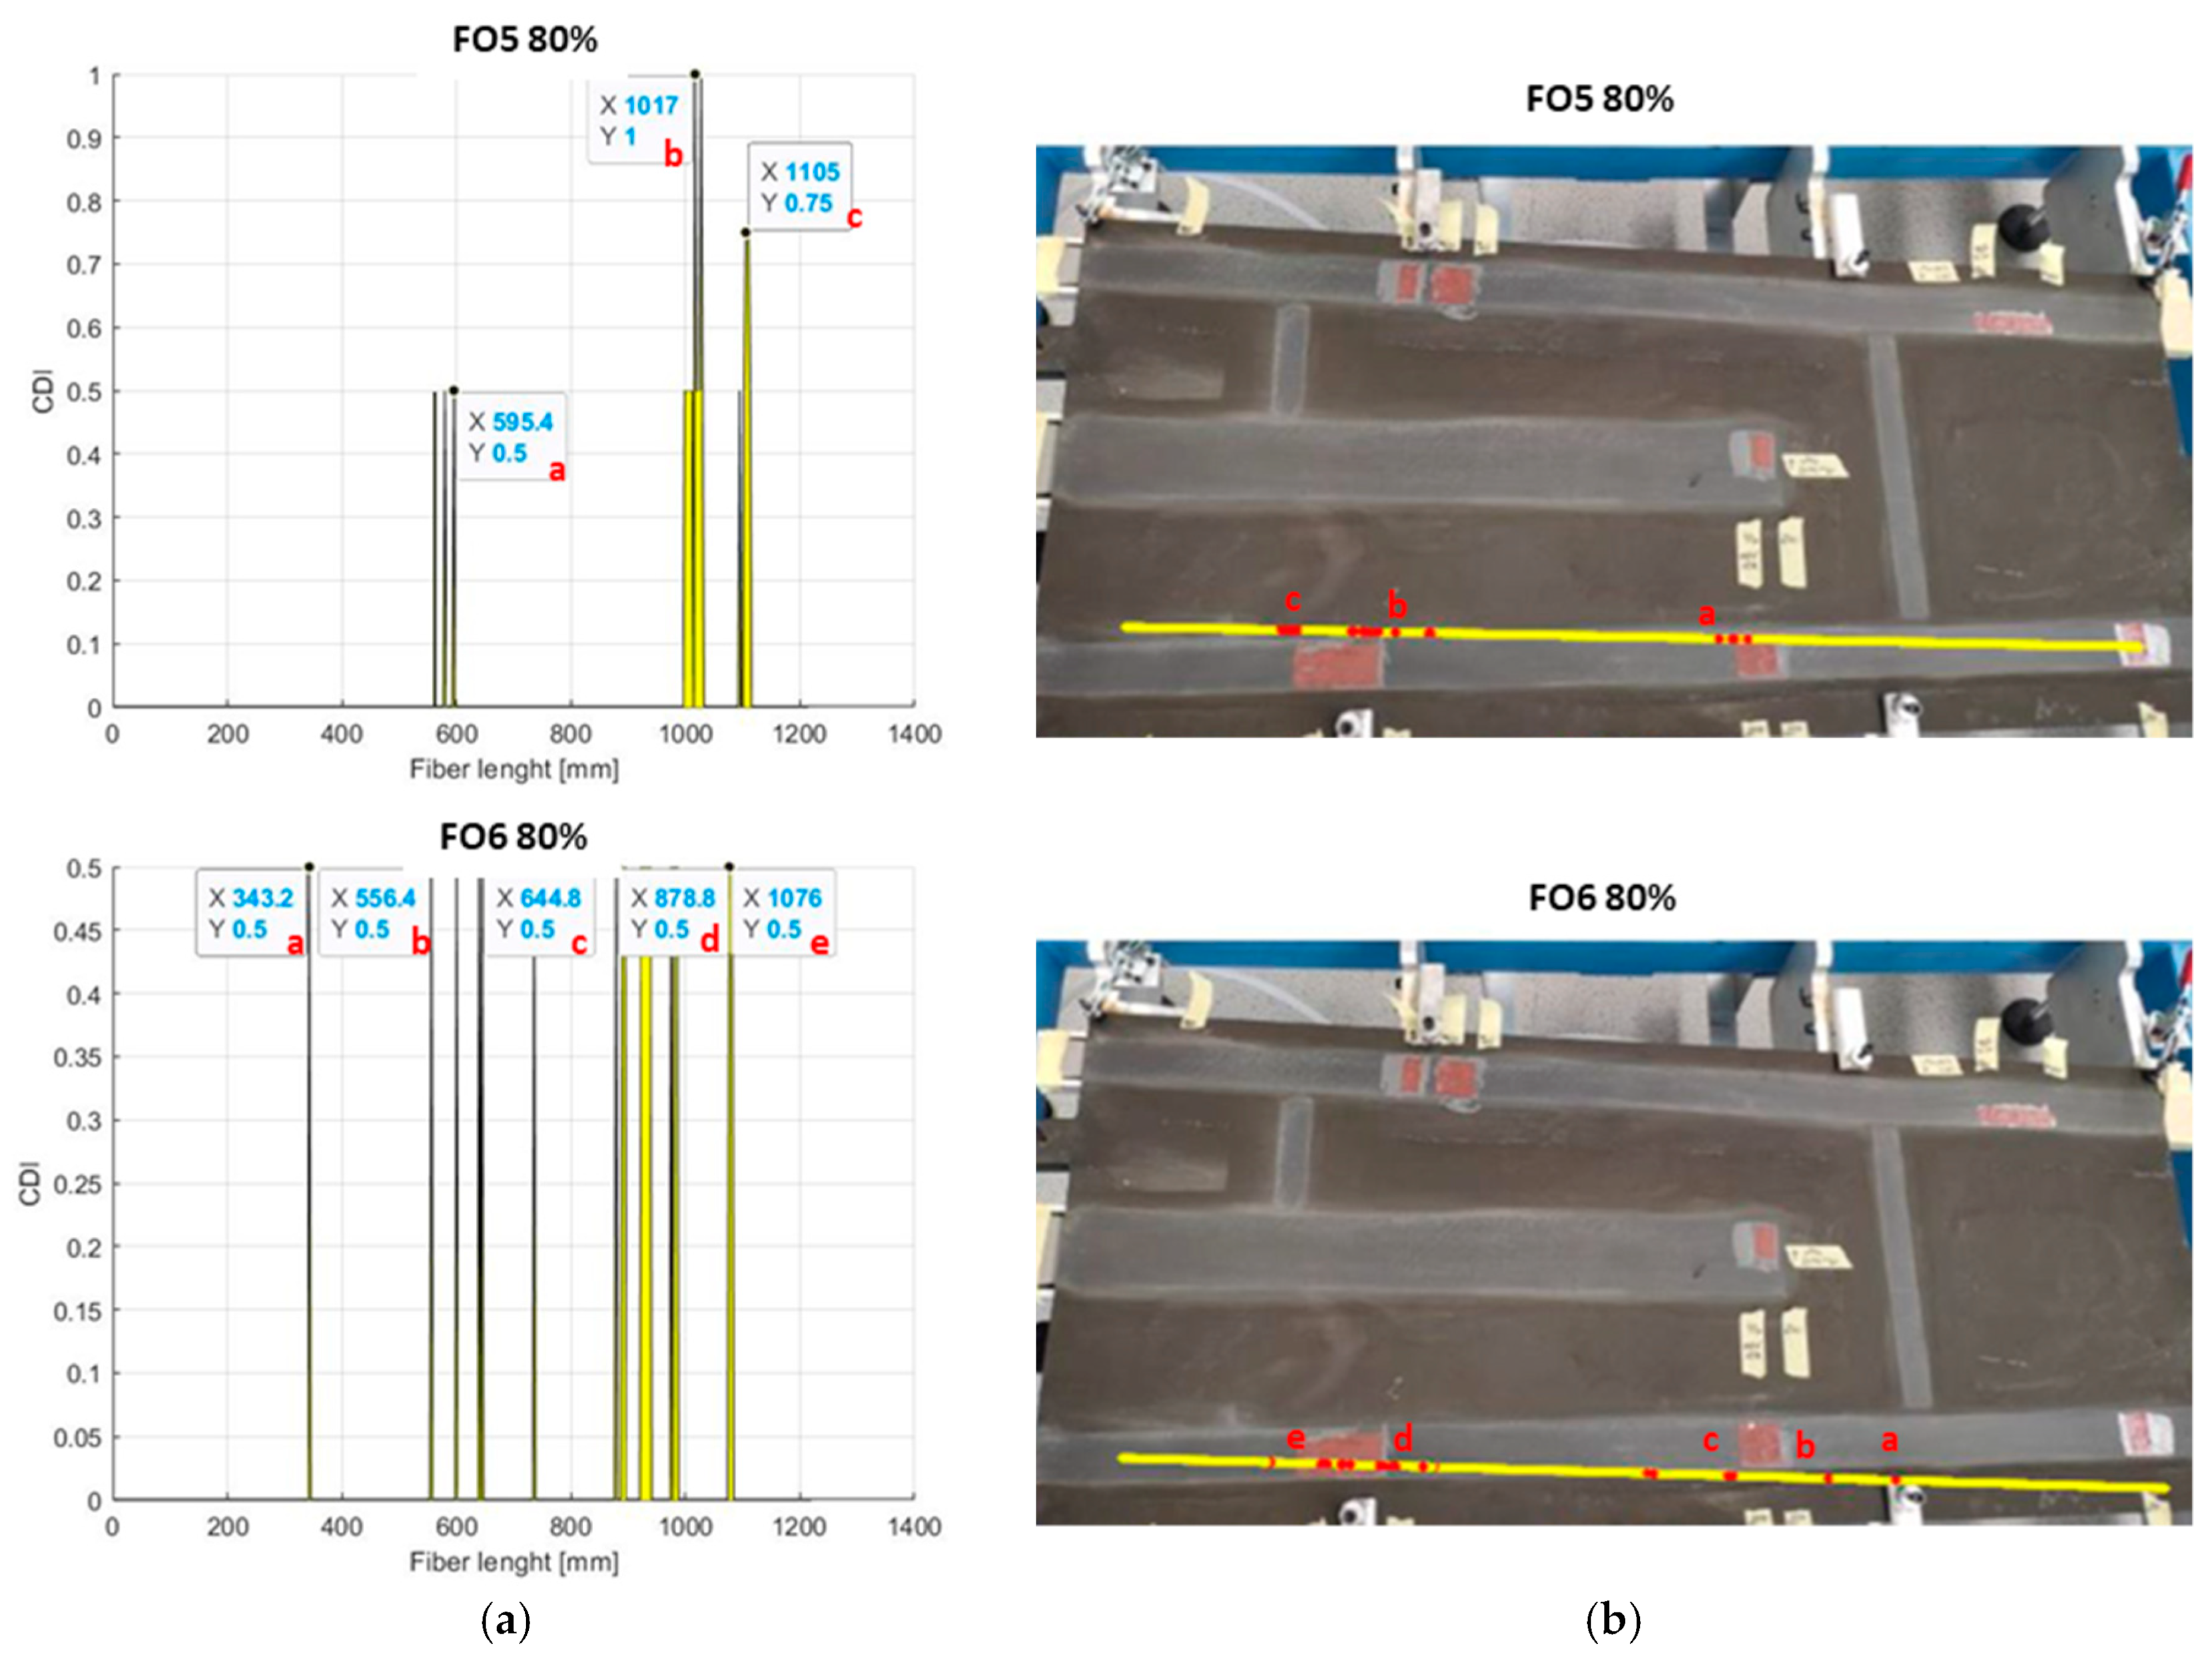
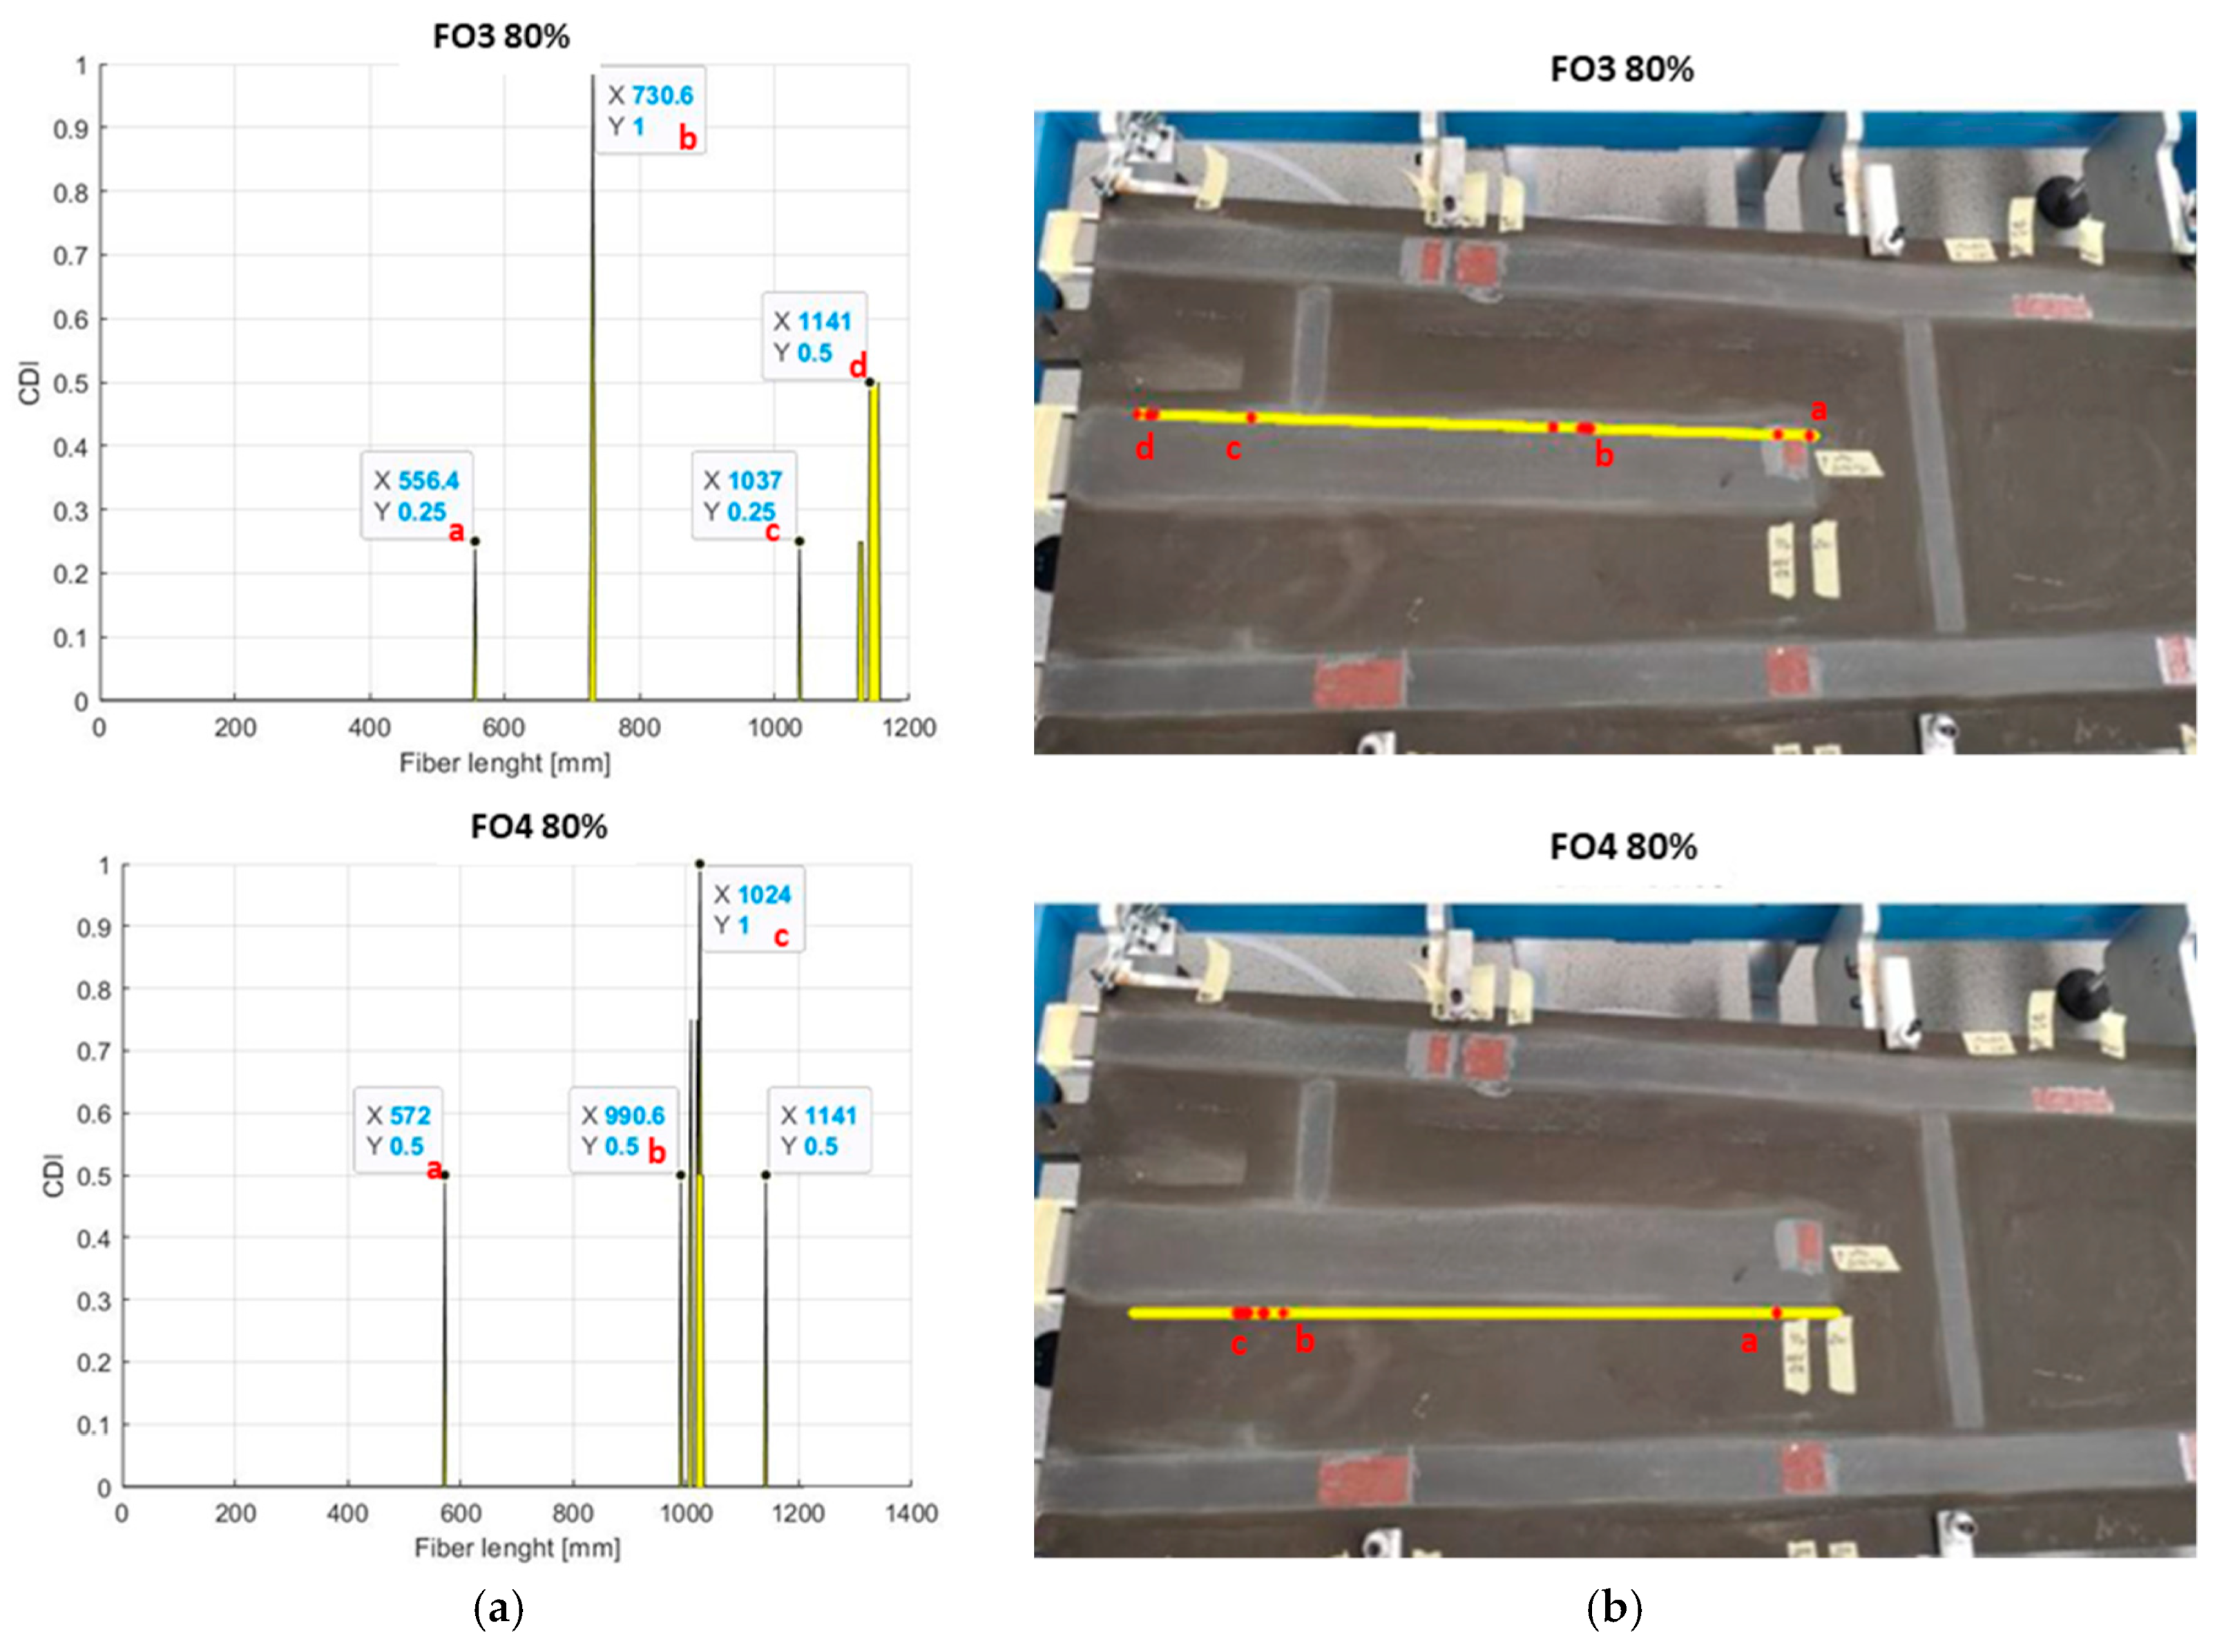
With reference to the forward spar, as shown in
Figure 18, a good appraisal of the damage areas N1 and N2 by both the fibres can be noted, while damage area N3 did not appear to be revealed by either of the fibres. With reference to this last point, it may be supposed to be an effect associated with the low values of the strain field at the free end, which makes the signal less distinguishable from the structural noise. In the same way, flaw N1 seemed to be equally appreciated by both fibres, with a significant number of points appearing around the target zone. It may be revealed, however, as the edges of the damage area were clearly indicated by the fifth fibre, while the sixth produced a more dispersed output. Such considerations are particularly important since the reference flaw was the largest of the series.
Concerning the imposed anomaly N2, a small suggestion of its presence can be observed in both cases, but with very different characteristics: for FO5, the alerted sensors (i.e., the ones exhibiting a high DI value) are clustered and displaced on a single edge, while for FO6, a peculiarly regular pattern does appear, with relatively sparse alert sensors spread on a region far wider than the fault area itself.
Overall, the two sensor arrays seemed to behave very similarly, with the exceptions described above.
For the bending excitation,
Table 4 below summarizes the lengths of the imposed flaws as estimated by the SHM algorithm implementation compared with the nominal ones.
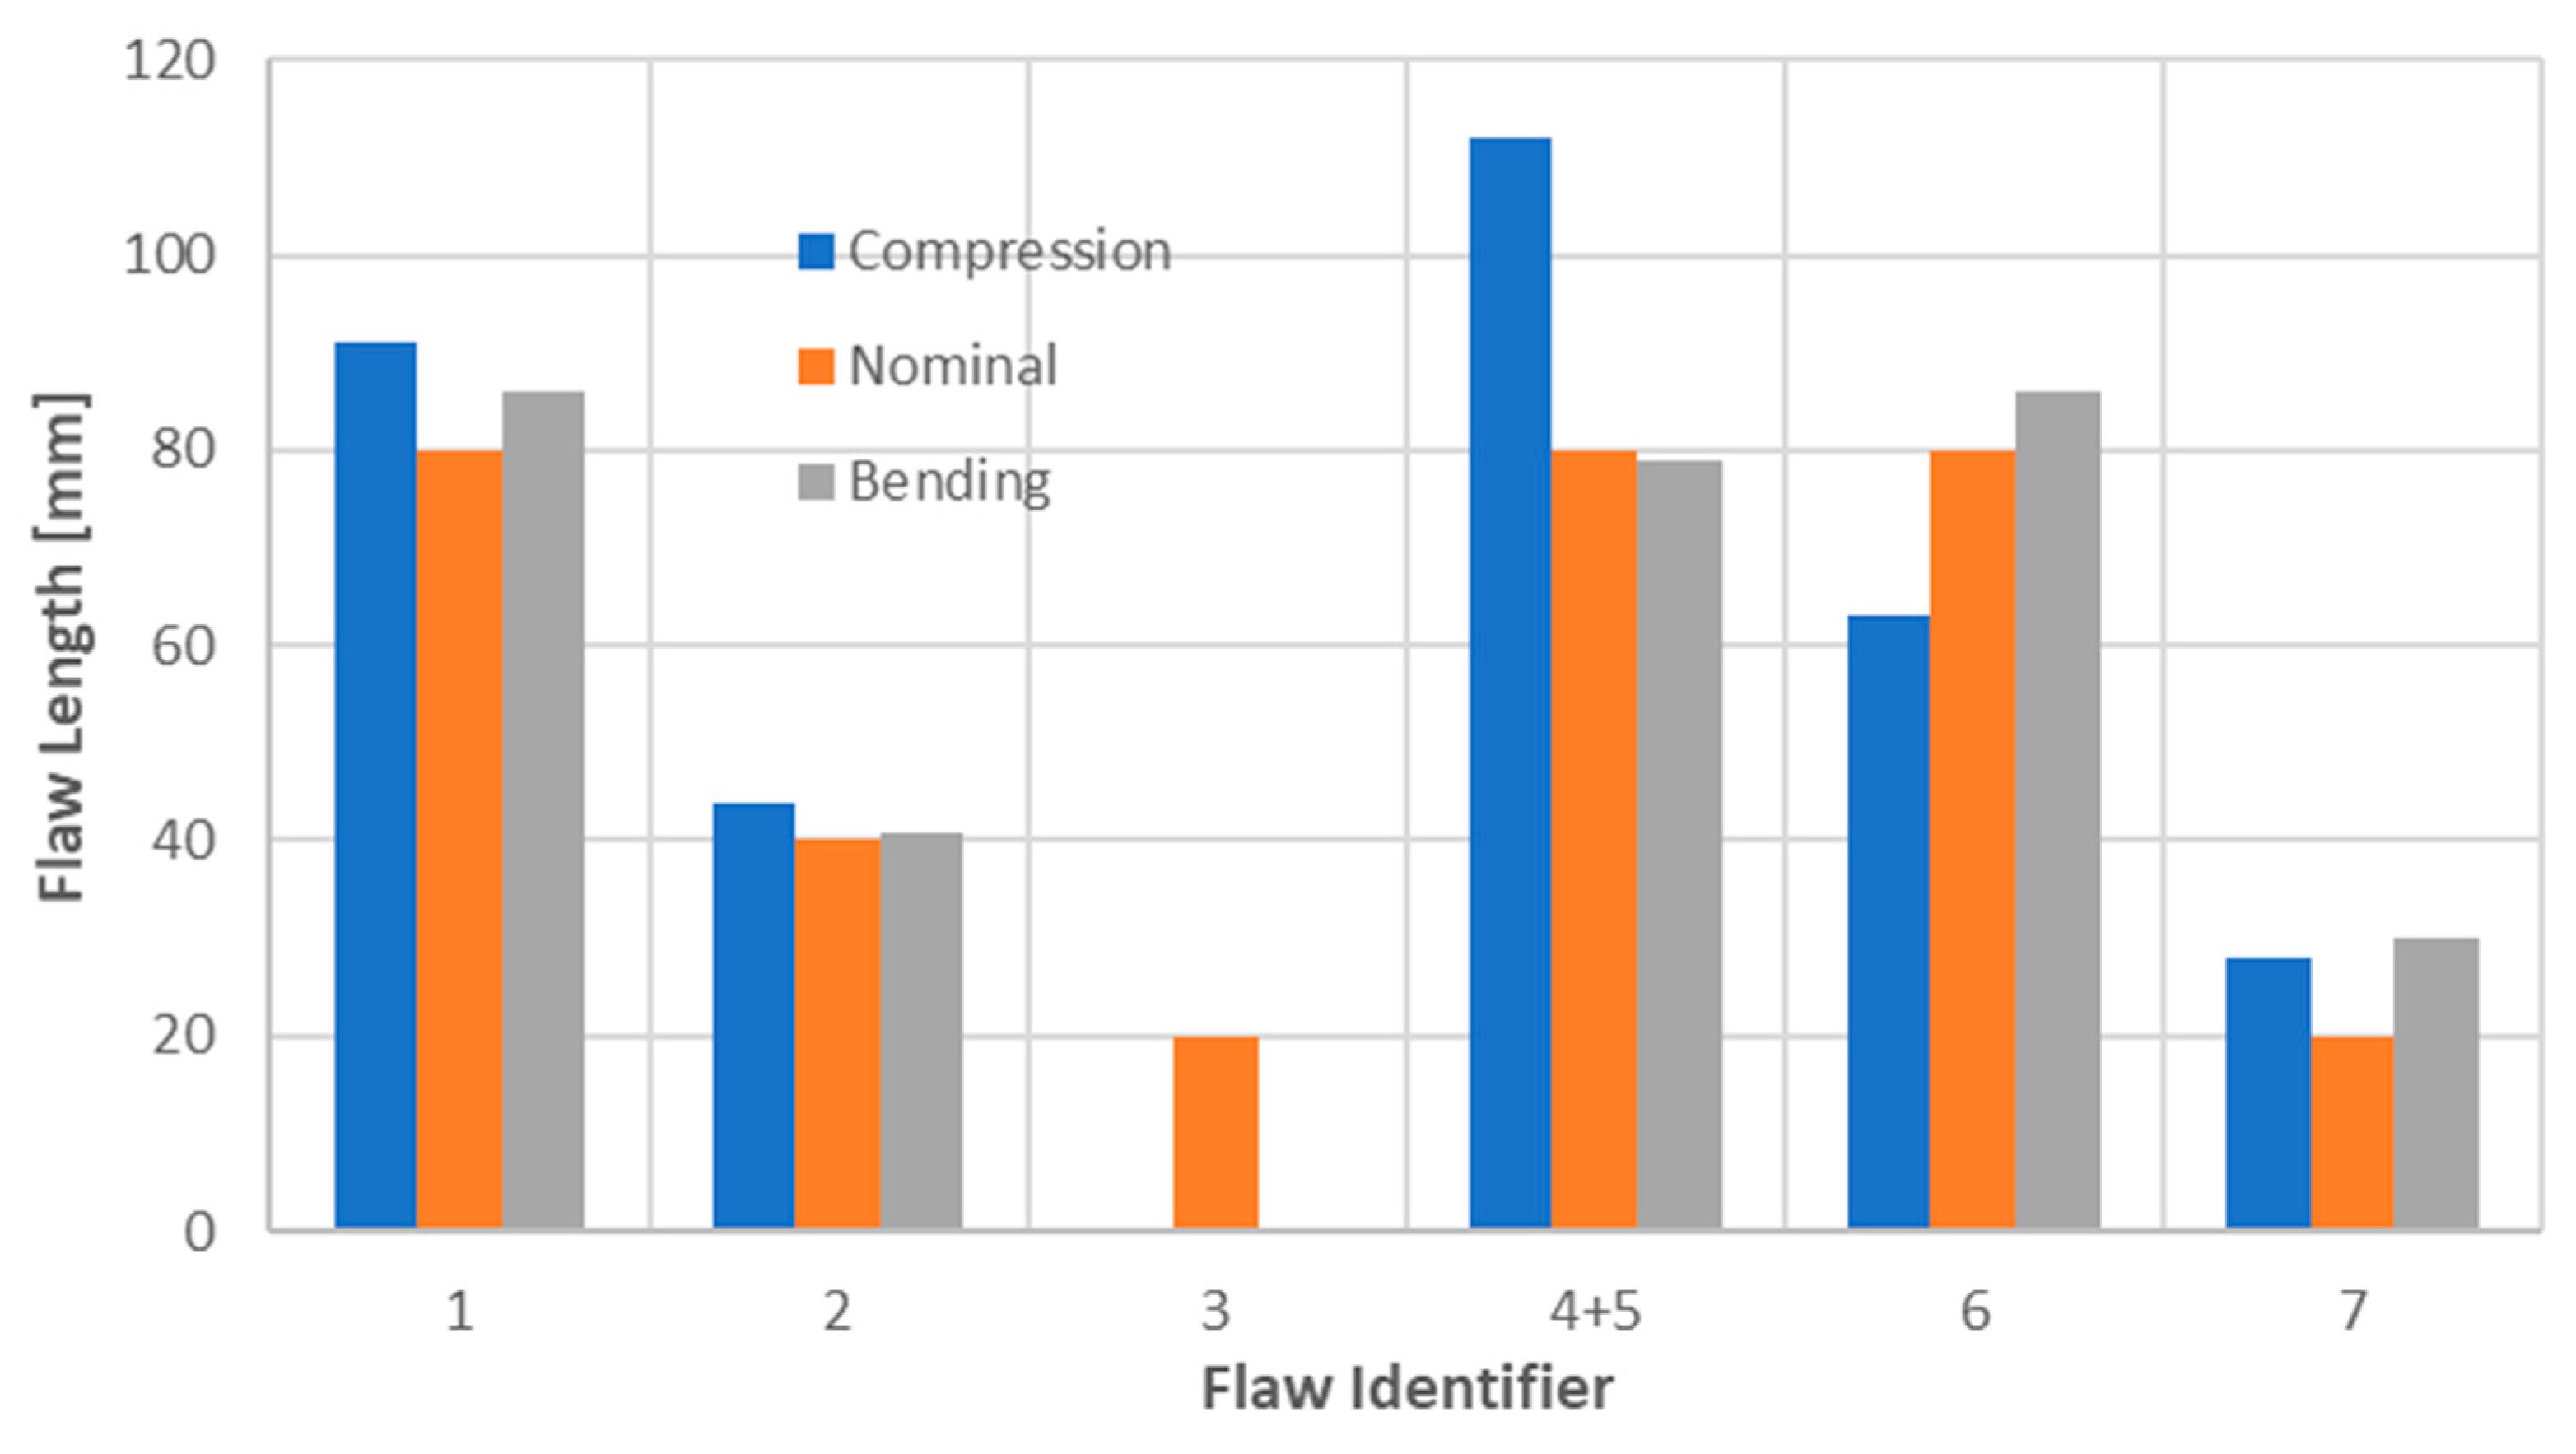
It seems convenient to summarise the estimation outcomes in a single graph, as reported below. In
Figure 19, the different predictions are compared with the nominal flaw length, i.e., as defined by design. It is just to consider that such a length could have been changed after the manufacturing process, as can be guessed by
Figure 8. The compression results are reported on the left bar of each flaw indicator, while the ones related to the bending tests are reported on the right bar. The nominal lengths are centred with respect to the other bars. It can be noted that no element is plotted in correspondence with flaw N3 since it is the sole case for which the data retrieved from both the compression and the bending tests do not allow any prediction to be expressed (damage undetected).
4.3. Test Results Summary
In this paragraph, a short summary of the main results, achieved during the tests and the consequent data elaboration, is given. For the compression tests, the following outcomes may be highlighted:
Structural noise, in this case intended as irregular strain information that cannot be associated with a particular cause, affects the measurements significantly; in fact, the maximum level detected in this circumstance does not ever exceed a hundred microstrains, which can be considered an important threshold for the operation of the SHM system;
Such a threshold should not be confused with the actual limit of operation of the presented SHM system, which was shown to be around 20 microstrains in previous investigations; in other words, it can be defined as a non-observability zone around 20 microstrains, an intermediate zone between 20 and 100 microstrains, and a full observability zone over that last number. These statements need further confirmation;
Nonetheless, the debonding areas were generally detected with a satisfactory approximation, except for flaw N3, maybe due to the excessive limitation of the strain values in that area; a further exception may be made for flaws N4 and N5, whose closeness leads to attaining the minimal value of observation of the SHM system already described above. The implemented detection process ends up seeing the two flaws as a single one.
For the bending tests, due to the larger effects caused by the application of this kind of load, for the same amount of external force, some confirmation of the considerations above and some further ones may be obtained:
First of all, the capability of the system has been generally confirmed, with the exception of flaw N3 (maybe linked to the small amount of strain levels therein), while flaws N4 and N5 appeared again as a single discontinuity;
The higher values attained by the deformations allow for a clearer identification of the flaws (for instance, in terms of the damage indexes or the larger characterization of damage with respect to the integral areas, as strain variations were considered);
The presence of isolated singularities, for instance, particularly evident in the case of the middle spar, not directly associated with any imposed flaws, can be interpreted as simple false positives or as indications of other anomalies in the structure. In turn, such irregularities could be associated with the presence of existing local stiffening (for instance, due to the presence of local structural parts) or the existence of non-predicted damage. While the second possibility is easily verifiable through a comparison with the actual design of the referenced structure, the first and third hypotheses deserve more attention;
It is relevant to consider how this latter evidence was not present in the analysis of the compression tests’ outcomes. It could be argued that the lower strain levels, in that case, may operate as a pre-filter for types of damage whose effects are smaller than those caused by debonding. Again, this point deserves more attention.
For both types of tests, some more points can be identified:
The mean errors in the damage extension predictions may be estimated to be around 20% (compression tests) to 10% (bending tests), confirming that larger strain magnitudes increase the implemented SHM system’s capabilities.
With the minor exception of flaw N3, the SHM system always showed its capability to detect the presence of anomalies; it is convenient to repeat that the exception occurring at the mentioned flaw may be linked to different factors, such as the extremely low values of deformations for the particular zone where it is deployed. The fact that both sets of data, originating from different load conditions, do not allow any prediction to be formulated for that specific anomaly should also be a matter of further analysis.
5. Conclusions
Developed within OPTICOMS, a Clean Sky 2 project, this paper reports the results that have been achieved by means of the application of an SHM system originally developed by CIRA for detecting debonding areas on a full-scale wingbox section.
Several debonding areas were imposed during the final test article’s assembly by deploying Teflon patches between targeted structural interfaces to stop them from interacting so that they could be effectively joined. This results in localized debonding regions between the spar caps running spanwise and the bottom panel. During the integration process, with specific reference to the adhesive distribution and cure, distributed optical fibres were embedded between the cited structural elements.
A proprietary SHM algorithm based on the distributed optical fibres, developed and maintained by CIRA, was used to verify its ability to detect the dimensions and locations of possible debonding regions on the selected test article undergoing the application of characteristic loads, specifically compression and bending ones, in a typical laboratory environment.
The following outcomes may be summarized:
The LHEO algorithm shows good damage detection capability in the presence of different structural solicitations and different spatial resolutions;
Errors in the damage extent estimation are confirmed to be around 10%, except for the damage area N7, which was undetected;
The proximity of damage areas N4 and N5 makes the algorithm tend to consider them as one damage, regardless of the value and type of load;
Since optical fibres are sensitive to strain energy (i.e., responsive to the square of the strain), the structural noise effects rapidly decrease as the deformation enlarges, so the sensitivity may be said to improve at higher input energies.
Finally, as the objective of the work was to evaluate the ability of the SHM system to detect discontinuities along the bonded joint lines of a full-scale wingbox, the LHEO algorithm provided a good correlation between the actual and estimated damage dimensions, even under different loading conditions.
Based on the results obtained in this work, it was possible to characterise an SHM system that allows for the detection of multiple damage areas since the characteristics of damage locally influence the deformation field of a structure and the ability of a sensor system to obtain point data. In other words, damages do not influence each other, as they create a local and limited perturbation around their position. Obviously, if two damages are close enough, the sensitivity of the sensors may not allow the algorithm to highlight them separately, and, therefore, they are processed as one damage. This work is the result of those carried out on structures of increasing complexity. The next step will be to apply such a system to a full-scale wingbox to determine the problems that may arise both in the installation of the sensor network on a large scale and in the use of the SHM system as well as an NDI tool and/or as a real-time damage detection tool.

 ,
, 


