Article

A Methodology for Stochastic Simulation of Head Impact on Windshields

by
Christopher Brokmann
1,
Christian Alter
2 and
Stefan Kolling
2,*
1
Horn & Bauer, Industriegebiet Treysa-Nord, 34613 Schwalmstadt, Germany
2
Institute of Mechanics and Materials, Technische Hochschule Mittelhessen, University of Applied Sciences, 35390 Giessen, Germany
*
Author to whom correspondence should be addressed.
Appl. Mech. 2023, 4(1), 179-190; https://doi.org/10.3390/applmech4010010
Submission received: 30 November 2022 / Revised: 25 January 2023 / Accepted: 27 January 2023 / Published: 3 February 2023
(This article belongs to the Special Issue Impact Mechanics of Materials and Structures)

Abstract

:
In accidents involving cars with pedestrians, the impact of the head on structural parts of the vehicle presents a significant risk of injury. If the head hits the windshield, the injury is highly influenced by glass fracture. In pedestrian protection tests, a head form impactor is shot on the windshield while the resultant acceleration at the centre of gravity of the head is measured. To assess the risk of fatal or serious injury, a head injury criterion (HIC) as an explicit function of the measured acceleration can be determined. The braking strength of glass, which has a major impact on the head acceleration, however, is not deterministic but depends on production-related microcracks on the glass surface as well as on the loading rate. The aim of the present paper is to show a pragmatic method for how to include the stochastic failure of glass in crash and impact simulations. The methodology includes a fracture mechanical model for the strain rate-dependent failure of glass, an experimental determination of the glass strength for the different areas of a windshield (surface, edge, and screen-printing area), a statistical evaluation of the experimental data, and a computation of an HIC probability distribution by stochastic simulation.

1. Introduction

In modern vehicle development, head impact test on windshields are common practice to reduce the risk of injury and protect pedestrians in the event of an accident. During these crash tests, a head form impactor is shot at different points on the windshield at up to 40 km/h while the acceleration a ( t ) acting on the head’s centre of gravity is measured. A biomechanically motivated head injury criterion has been defined by the Federal Motor Vehicle Safety Standards in FMVSS 208 [1]. This criterion, also known as the HIC value, can be determined from this empirical equation:
HIC = max { [ 1 t 2 t 1 t 1 t 2 a ( t ) d t ] 2.5 ( t 2 t 1 ) }
Hereby, t 1 and t 2 are time limits, which have to be chosen in such a way that the HIC value becomes a maximum. In the present application, the maximum time difference is limited to 15 ms, which is also known as HIC15. A HIC value of 1000 indicates that a serious head injury can be expected. Therefore, the goal of safety-oriented vehicle development is not to exceed this value in the head impact test. Numerical simulations, especially using the finite element method, play an important role in a modern vehicle development process. It is therefore essential to develop predictable and robust finite element models for such crash tests. Hereby, important aspects must be considered for head impacts on windshields. On the one hand, the structure of the windshield consisting of two layers of glass and a polymer interlayer made of polyvinyl butyral (PVB) must be reproduced exactly by the finite element mesh. The PVB interlayer has the task of holding the glass fragments together and binding splinters in the event of an accident. This also helps to protect the pedestrian from lacerations.
On the other hand, constitutive models for the rate-dependent materials PVB and glass must also be available.
As for the computational treatment of windshields, various models for laminated glass have been discussed in the literature over the past few decades. In [2,3], the extended finite element method (XFEM) was applied to model crack propagation in glass. Furthermore, peridynamics provide a promising approach to describe crack propagation in the glass in detail [4]. Another modelling technique using cohesive zone elements was applied in [5,6]. An alternative model using the discrete element method (DEM) can be found in [7]. In a recent publication, a phase field method coupled with the finite element method was able to describe crack propagation at fracture in more detail [8].
Due to limitations in computation and meshing time, the previously mentioned models are not used very often in an industrial environment where classical shell elements are preferred, and element erosion is used to approximate crack propagation in a simple but efficient way. However, fracture in such finite element simulations is inherently mesh dependent. This disadvantage was addressed by Pyttel et al. [9] and fixed by introducing a nonlocal method. An enhanced nonlocal model was proposed by Alter et al. [10]. This model was also used in the present paper and was implemented as user defined subroutines in the explicit finite element packages LS-DYNA (Ansys, release R7) and RADIOSS (Altair, release 2020.1). All the latter models, i.e., those of Pyttel et al. [9] and Alter et al. [10], are at least partially available in commercial software such as LS-DYNA and Radioss. This means that vehicle developers have already access to highly sophisticated models for simulating laminated glass. An important glass property which, however, is not yet considered in the numerical models is the stochastic fracture behaviour of glass based on experimentally determined probability functions. The breaking strength of glass is not a deterministic value but varies greatly for the different surfaces of the windshield. Consequently, glass strength distribution functions must also be available for every single region of the screen. This includes the glass edge, the imprinted areas, and the laminated glass surface, as well as the unprotected surfaces.
In the present paper, a methodology is presented to characterize the stochastic fracture behaviour of laminated glass with respect to numerical simulations from the quasi-static loading conditions in material characterization to crash and impact conditions in the relevant application. This allows us to predict the probability distribution of the HIC with respect to pedestrian protection for the first time. To keep the present paper self-explanatory, all necessary experimental (Section 2) and numerical (Section 3.1, Section 3.2 and Section 3.3) work that is necessary to carry out stochastic simulations has been presented again in a compact form. The scientific novelty of this work consists of the stochastic simulations in Section 3.5.

2. Experimental Findings

2.1. Head Impact Tests

In order to obtain an overview of the scatter of the HIC value in the event of a head impact, 10 brand-new windshields (Audi A3, Volkswagen Group, Wolfsburg, Germany) were tested using a free-flying head form impactor, 4.5 kg Euro NCAP (European New Car Assessment Programme) adult head. The impactor was shot at 10 m/s in the centre of the four-point supported windshield. During the tests, the transversal acceleration for the estimation of the HIC is measured and a high-speed camera is used. Figure 1 shows three of these tests in comparison. In test (a) the initial fracture starts between 0 and 1 ms, in test (b) between 2 and 3 ms and in test (b) even between 7 and 8 ms. Clearly, the earlier the glass breaks, the softer the reaction of the glass pane and the lower the risk of head injury. Thus, the HIC15 values vary between 418 and 566 (+35%) in 10 identical tests [11].
In another study [10], the windshields (Mercedes Class C, Mercedes-Benz Group, Stuttgart, Germany) were glued to a wooden frame to approximate the situation in a real car. HIC15 values of 295 to 575, which is a range of 95%, were measured in three head impact tests in the middle of the pane at a velocity of 10 m/s using the 4.8 kg adult head form impactor. This shows the high scattering of the HIC during impact tests on windshields caused by the stochastic fracture behaviour of glass.
The larger scatter of the HIC value for the second windshield type is less a result of a larger scatter of the surface condition of the windshield and more due to the changed test boundary conditions. Whereas in the case of the four-point bearing, the HIC is determined only in the acceleration regime of fracture initiation, as the windshield subsequently moves away from the impactor. In the second load case, a glued windshield, the entire post-fracture behaviour is in the relevant range for HIC estimation. Thus, in the second load case, it can happen that the range of the HIC is determined exclusively in the post-fracture regime, which is, however, influenced by the crack initiation and thus the fracture strength.

2.2. Stochastic Fracture of Glass

Due to the manufacturing process of windshields, microcracks occur on the different surfaces of the windshield and at the edges during handling, transport, silkscreen printing, and edge processing. In order to determine the different strengths that occur for these different areas, coaxial ring-on-ring tests were carried out for the outer surface, the silkscreen area, and the PVB side of both plies. This test setup can be seen in Figure 2 (left). The round samples were taken from the windshields using water jet cutting. Since the ring-on-ring test should only be used for flat plates, the specimens were taken out from the screen at positions with low curvature. See [12,13] for detailed information.
The laminated glass was separated by shearing off the PVB foil. This makes it possible to examine analytically the strengths on the surface and on the PVB side separately under controlled loading conditions. Moreover, four-point bending tests were also used to determine the strengths of the edges [11]. Figure 2 (right) shows the corresponding distribution functions for the different areas. It can be seen that there are enormous differences in strength within the windshield. The PVB-protected side of the glass pane (black line) has the highest strength, since the smallest microcracks are to be expected there. In contrast, the outer pane of the windshield (blue line) has a significantly lower strength. Due to the machining processes, the edges (green line) and the silkscreen-printed area (red line) have the lowest strengths.
The data was evaluated using the left truncated Weibull distribution:
P ( σ f ) = 1 exp [ ( τ η ) β ( σ f η ) β ] .
Hereby, the variable σ f is the failure stress, η is the scale parameter, β is the shape parameter and τ is the so-called truncation point below which no failure occurs. Using τ = 0 leads to the well-known two-parameter Weibull distribution. Since a single critical crack length in the glass is sufficient to destroy almost the entire load-bearing capacity of the windshield in the event of a head impact, the weakest link theory and thus the Weibull distribution is an appropriate approach. Details of these experimental investigations can be found in [11].
If the sample areas vary, the probabilities can be regularized according to the area ratio within the so-called Weibull shift.
σ f 2 = σ f 1 ( A 1 A 2 ) 1 β ,
The failure stress σ f 2 in a glass pane with the area A 2 can be directly computed from the failure stress σ f 1 of a glass pane with the area A 1 and the Weibull parameter β if the areas A 1 and A 2 are loaded by the same state of stress. This equation is used to regularize different element sizes in the current approach. Due to manufacturing processes, there is a certain distribution of microcracks within the windshield. When the windshield is loaded, these microcracks grow with a subcritical velocity until they reach a critical length, causing macroscopic fracture due to unstable crack growth. Consequently, failure occurs when the crack reaches a critical length. Thus, the distribution functions for failure stress in Figure 2 (right) are based on critical crack lengths. However, within the unloaded windshield microcracks do have a different initial length. From this it follows that the crack growth up to the point of fracture must be considered. This can be achieved using the laws of linear elastic fracture mechanics. For subcritical crack growth, the crack velocity can be expressed by using the stress intensity factor
K I = Y σ π a ,
for Mode I loading with the current crack length a and the geometry factor Y . In the case of fracture, the fracture toughness K I C = Y σ π a f is reached, where a f is the critical crack length. An empirical power law can be used to describe the subcritical crack growth as a function of the stress intensity by two crack growth parameters n and v 0 :
v = d a d t = v 0 ( K I K I C ) n .
From this fracture mechanics equation, the initial crack length a i can be computed reversely by integration. The crack growth parameters depend on environmental conditions and can be determined experimentally by dynamic fatigue tests; [14] and the references therein. Table 1 contains the crack growth parameters for different humidities at a temperature of 25 °C.

2.3. Rate Dependent Fracture Strength of Glass

As described in Section 2.2, cracks start to grow in a subcritical manner with a low velocity under an applied load until the fracture toughness is reached. The velocity of a certain crack depends, among other parameters, on the humidity and the stress intensity. Experimental data could be found in [15]. The behaviour of the subcritical crack growth velocity can be divided into four different regions. In the first region, named “0” in Figure 3 left, no crack propagation can be observed. After a certain value of the stress intensity, cracks start to propagate (region I), and the velocity shows a nearly linear behaviour in a double logarithmic representation. In region II, a kind of saturation is reached before the crack starts to propagate in an unstable manner and reaches a maximum velocity of about 1520 m/s in region III.
Often the entire range of the subcritical crack growth regime until reaching the fracture toughness is approximated by the region I which may be described by the empirical power law shown in Equation (5). Under the assumption of a constant stress rate, a combination of Equations (4) and (5) leads to an approximation of the fracture strength σ max ,   approx via
σ max , approx = ( 2 ( n + 1 ) K Ic n v 0 ( n 2 ) ( Y   π ) n a i n 2 2 ) 1 / ( 1 + n ) σ ˙ 1 / ( 1 + n ) .
Besides the crack growth parameters n and v 0 and the fracture toughness K Ic , the approximated fracture strength depends also on the stress rate σ ˙ and the size of an initial intended flaw a i . The behaviour is shown for different initial crack lengths in Figure 3 (right). As it can be seen, there is no lower or upper bound in the estimation of the fracture strength. As mentioned before, there should be a maximum fracture strength for a certain crack length due to the linear elastic fracture mechanics by reaching the fracture toughness and a lower limit where no crack growth takes place, which leads to a lower fracture strength value of
σ min = K th π a Y
and an upper strength value of
σ max = K Ic π a Y .
An extension of Equation (6) by the cut off conditions from the Equations (7) and (8)
σ 0 = min { σ max , max ( σ min , σ max , approx ) }
is shown in Figure 3 right (blue solid lines) and it is also used in the current approach. A more sophisticated model with a continuous transition between the rate dependent fracture strength and the lower and upper bound can be found in [16]. The different initial surface conditions on the different areas of the windshield are considered internally in the user subroutine whereby a stochastic distribution or a constant initial crack length per area can be chosen.

3. Numerical Treatment

3.1. A Nonlocal Material Model for Glass

Since glass is a nearly perfect linear elastic, the material is numerically described by Hooke’s law. Initial failure of glass is modelled via the extended Equation (6) by the cut off conditions Equations (7) and (8) using the stress criterion by Rankine. In case of failure, a damage approach in accordance with Pyttel et al. [9] is used for a linear stress reduction perpendicular to the failure introducing principal stress. Stress reduction is performed in dependency of the element size and the current time step size to capture the maximum crack growth velocity of glass, which is approximately 1520 m/s.
In a real-world application, a crack leads to a stress intensity at the crack tip. Due to rather large elements used in finite element application for the simulation of the head impact, the stress intensity is underestimated by the element erosion. To take care for the stress intensity in the finite element approach, a reduction of strength of elements in the direction of a propagating crack in the direct neighbourhood is used:
σ 0 , fin   { σ 0   without   neighbouring   crack σ 0 / f ( l e l )   with   neighbouring   crack
whereby the function for strength reduction f ( l e l ) depends on the element size l e l and the position of the in-plane integration point [10].

3.2. Material Modelling of the Interlayer

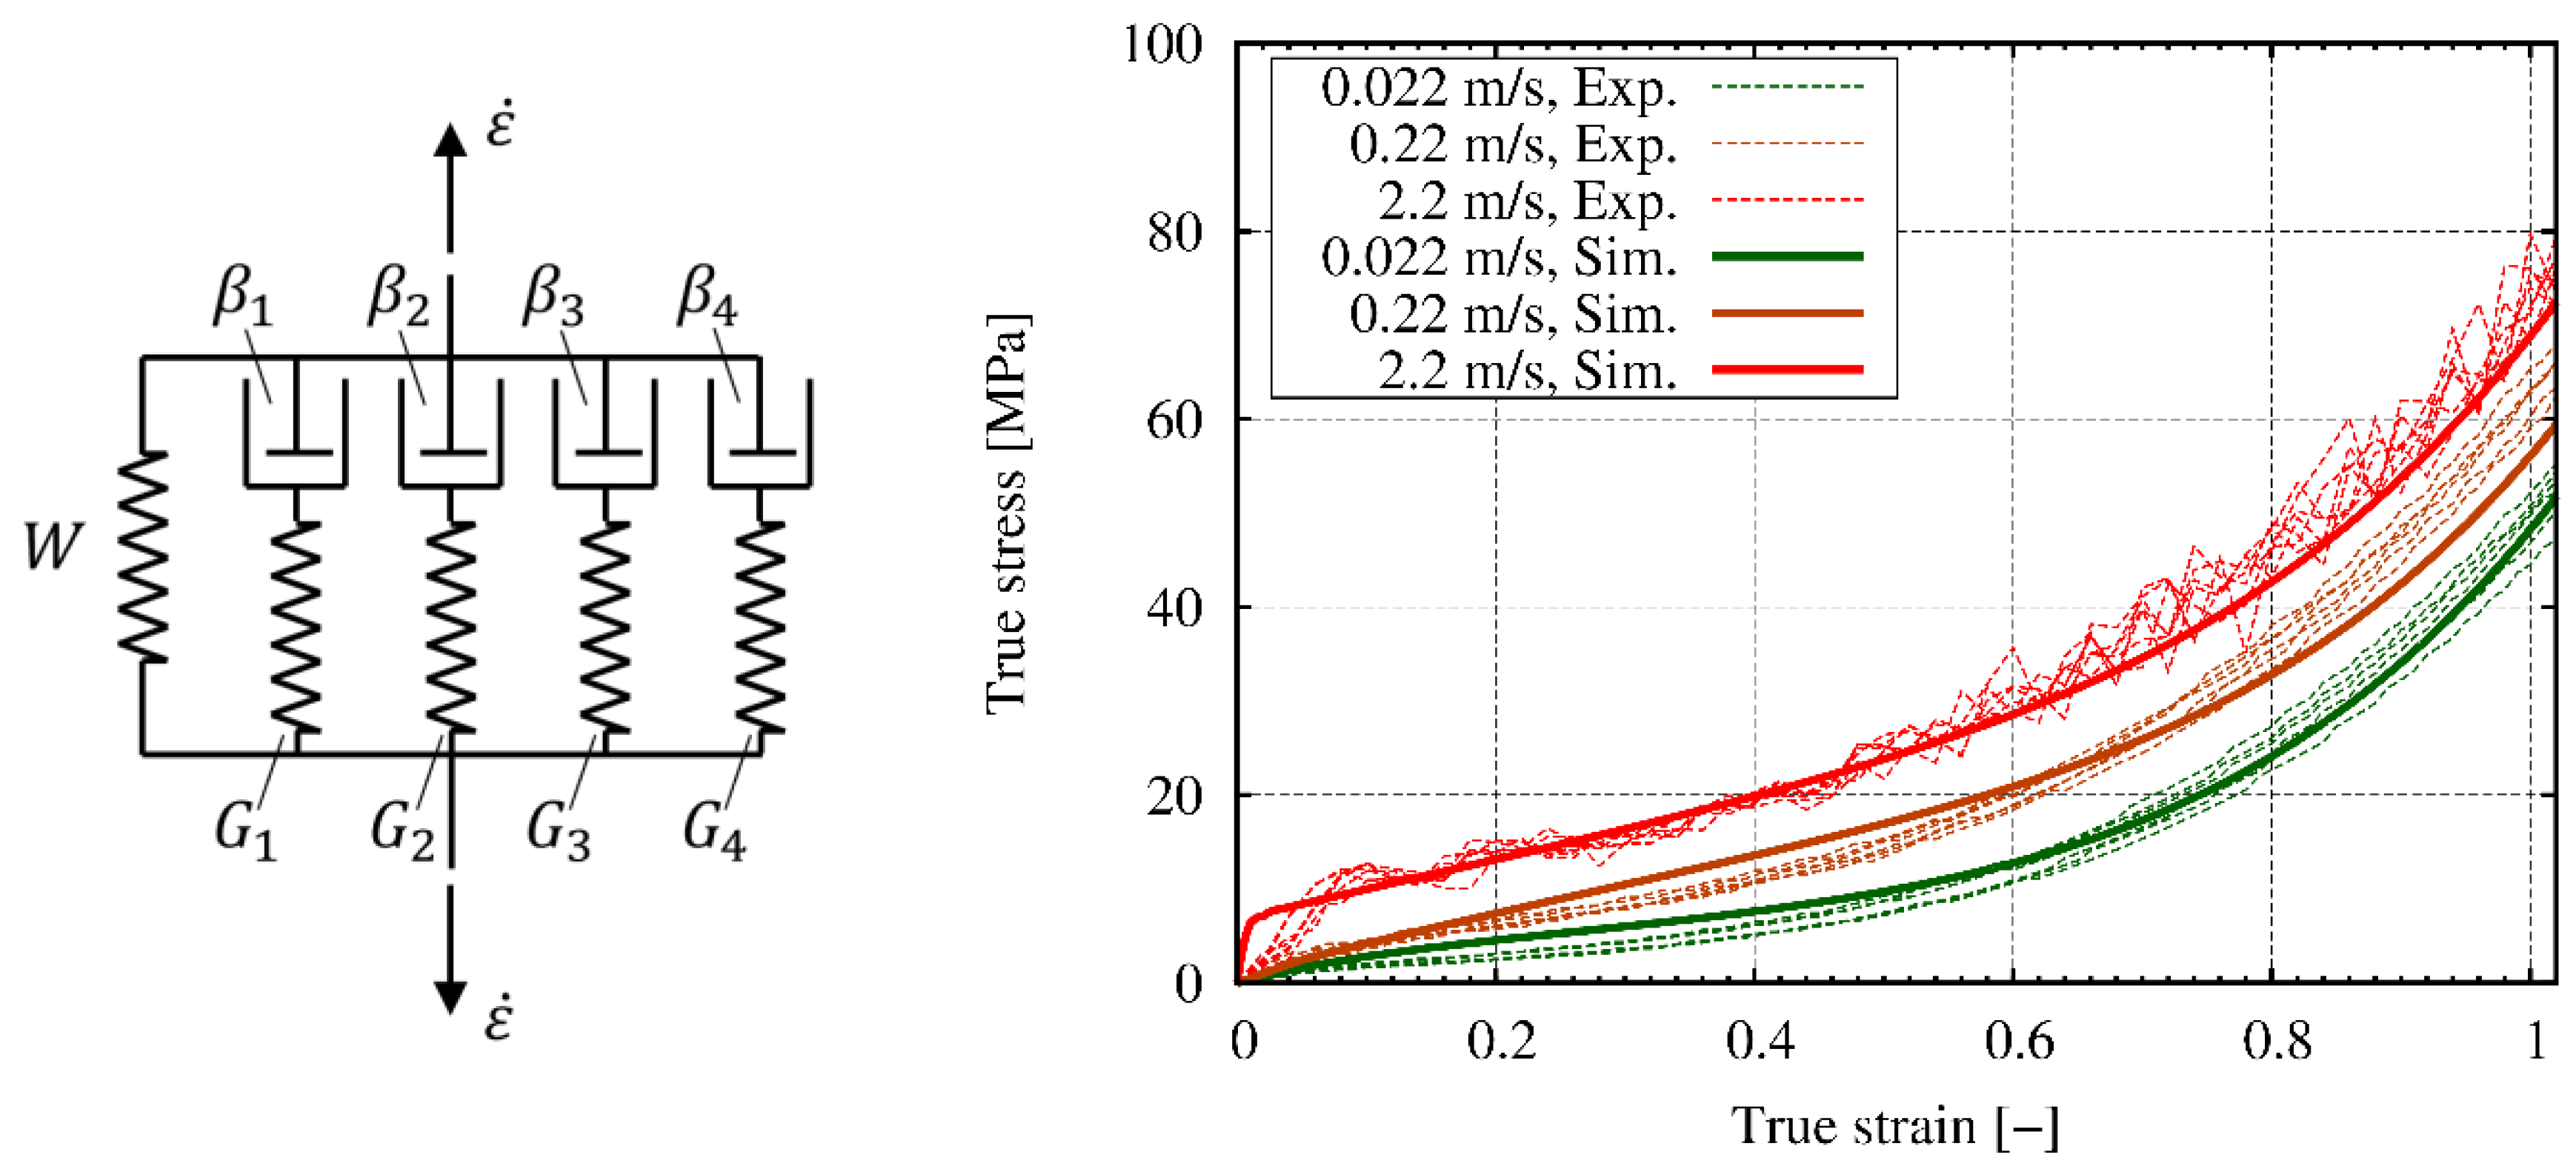
The polymer interlayer of the windshield consists of polyvinyl butyral (PVB) which can withstand large deformations and has a very strong strain rate dependency. For this reason, tensile tests were carried out at different speeds in order to identify the strain-rate dependency even at large deformations. For material modelling, a nearly incompressible hyperelastic model was combined with a viscoelastic model using a Prony series.
Figure 4 left shows the rheological model which consists of a hyperelastic spring and a series of four Maxwell elements. The deviatoric part of the hyperelastic model is given by the following strain energy function:
W DEV ( I C ,   II C ) = i , j = 0 n A i j ( I C 3 ) i ( II C 3 ) j ,
where A i j are the material constants and I C , II C are the first and second invariant of the right Cauchy–Green tensor. In a good approximation, incompressible behaviour is assumed for the volumetric part of the hyperplastic model. However, this must be verified for each interlayer type individually via material tests. All parameters of the material model were identified numerically using the optimization tool LS-OPT (Livermore Software Technology Corporation (LSTC), Version 5.2, Livermore, California, USA, 2016). As can be seen in Figure 4 right, the numerical results (solid lines) are in a good agreement with the experiments (dotted lines).

3.3. Assembling of the Finite Element Model

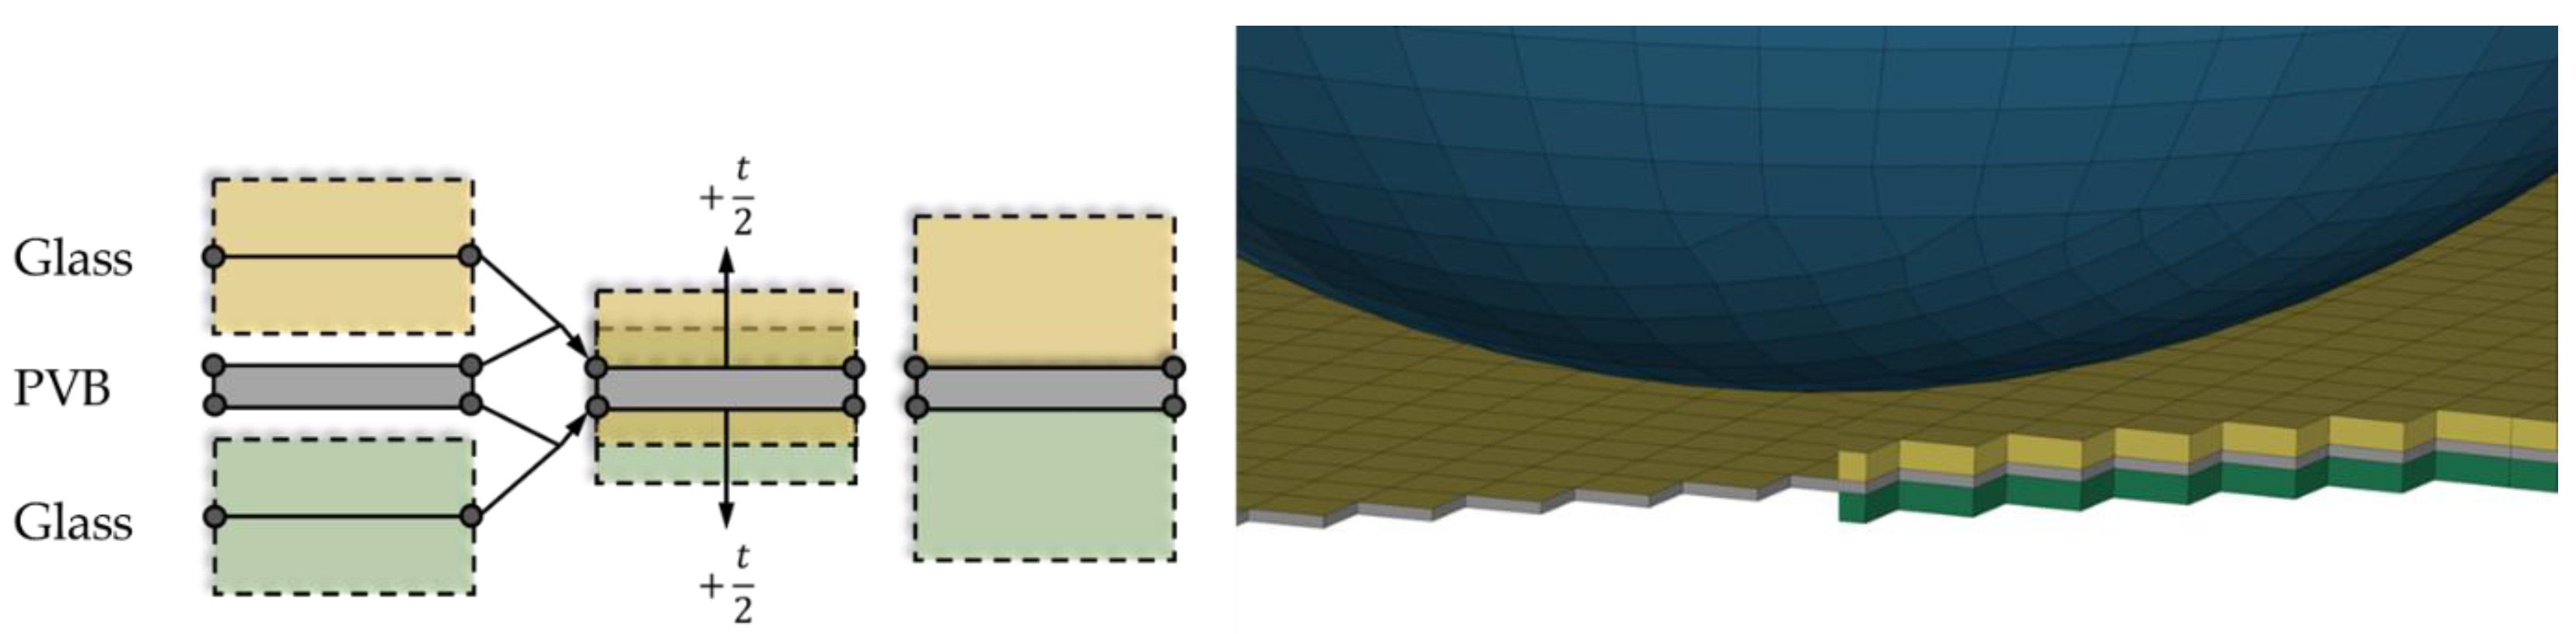
For discretization of the windshield, a regular shell-solid-shell mesh is used. Thereby, fully integrated shell elements for the glass plates combined with solid elements for the PVB interlayer are used. The PVB interlayer is very thin and represents a membrane. Therefore, even one solid element with one integration point is sufficient for the numerical representation of the interlayer in an industrial environment. To avoid instabilities as a result of hourglass modes using under integrated solid elements, a viscous hourglass control should be used. In the following scientific study, however, only fully integrated solid elements were used in order to avoid any effects from hourglass stabilization.
In order to obtain the physical composition and thus the correct flexural stiffness as well as stress prediction, the shell mid surfaces, as well as the contact thicknesses, are shifted to the outer sides by a half of the ply thicknesses. Shear coupling is realized by merging the nodes of the shells (grey) and the solid elements (yellow and green), see Figure 5. Delamination effects are not considered in the present model. A validated commercial model of the head form impactor (right hand side in Figure 5, blue) was used [17].

3.4. Head Impact Simulation

The basic validation of the discretization and the failure modelling were performed by head impact tests on Mercedes Class C windshield, with constant crack lengths for different areas and means, without a stochastic approach. The initial crack sizes were assumed to be a i = 1   μ m for both air surfaces, a i = 0.4   μ m for both laminated and thus protected surfaces and a i = 5   μ m for the edges of the windshield. Additionally, it was assumed that the PVB-interlayer protects the inner surface from water vapor, the main cause of subcritical crack growth effects, and thus the rate dependency of fracture strength is neglected for the surfaces concerned. 
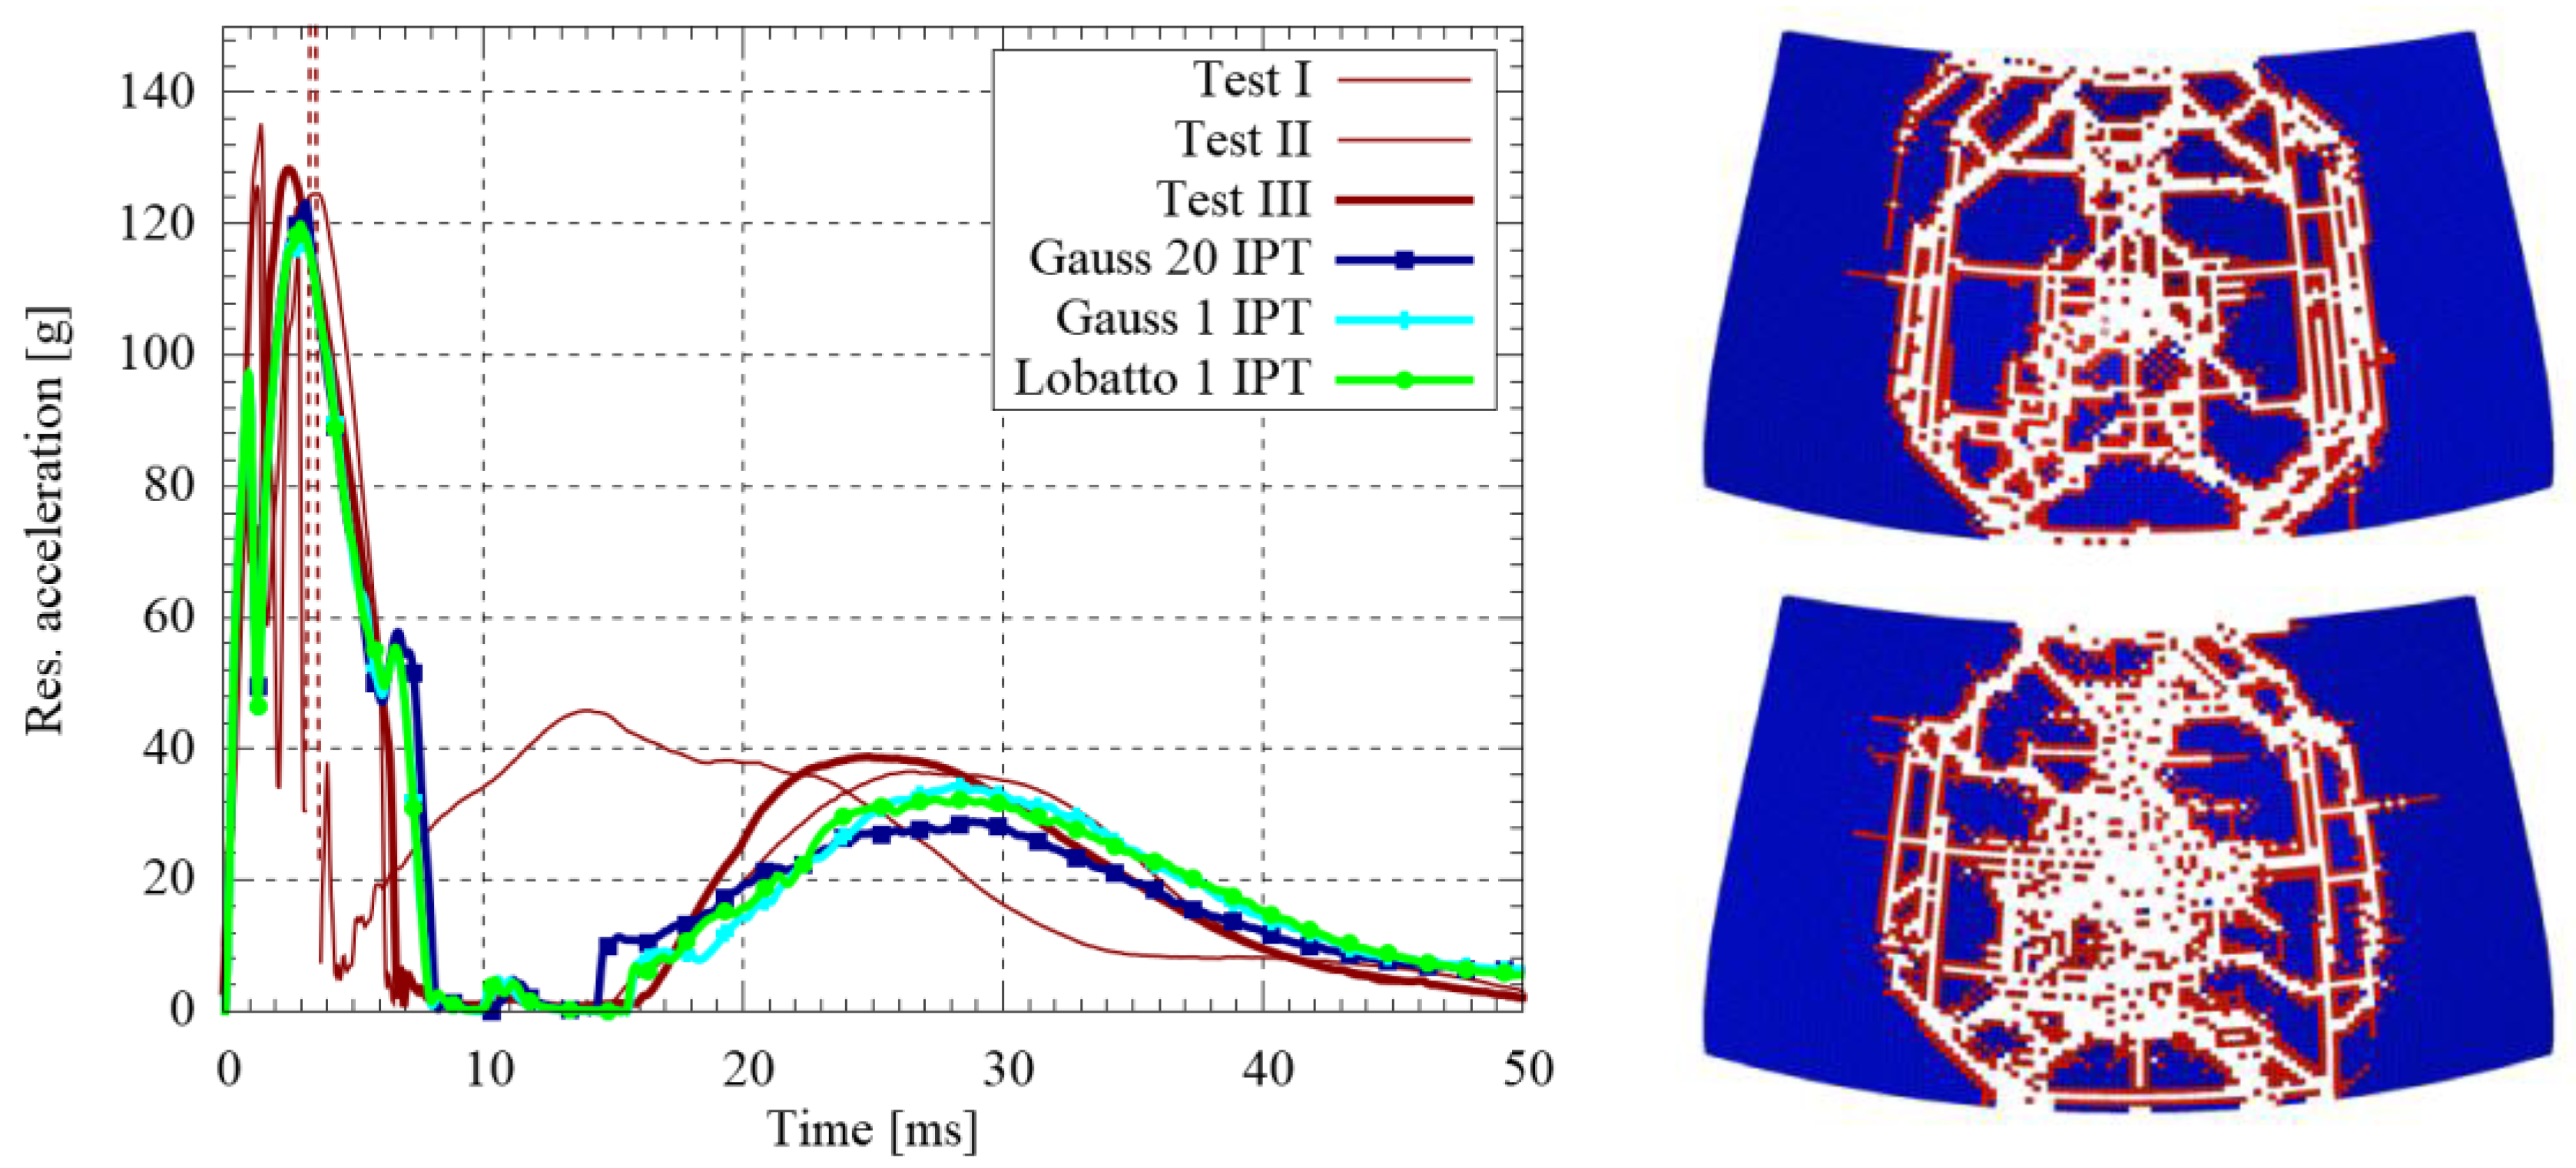
Figure 6 shows a comparison of the measured and the numerically predicted acceleration curves as well as the fracture pattern. It shows that the proposed approach is basically able to represent all different stages of fracture of the windshield. The left-hand side in Figure 6 shows the resultant acceleration of three tests under the same conditions (red lines). They also show the scatter of the experiments. This again shows the need for stochastic simulations. In comparison, the numerically predicted acceleration curves are shown. Hereby, 20 (dark blue) or 1 (light blue and green) failed integration points for element deletion are used together with different out-of-plane integration rules. Hereby, the outer integration point using Lobatto integration is located at the outer surface. The right-hand side shows the predicted fracture pattern for the outer glass pane (top) and the lower glass pane (bottom) by the use of the Lobatto integration rule with a single failed integration point required for element deletion. As can be seen, no significant influence of the number of failed integration points required for element deletion, as well as of the through-thickness integration rule, could be identified. A comparison of the simulated fracture patterns with real head impact tests on windshields can be found in [10].

3.5. Stochastic Simulation

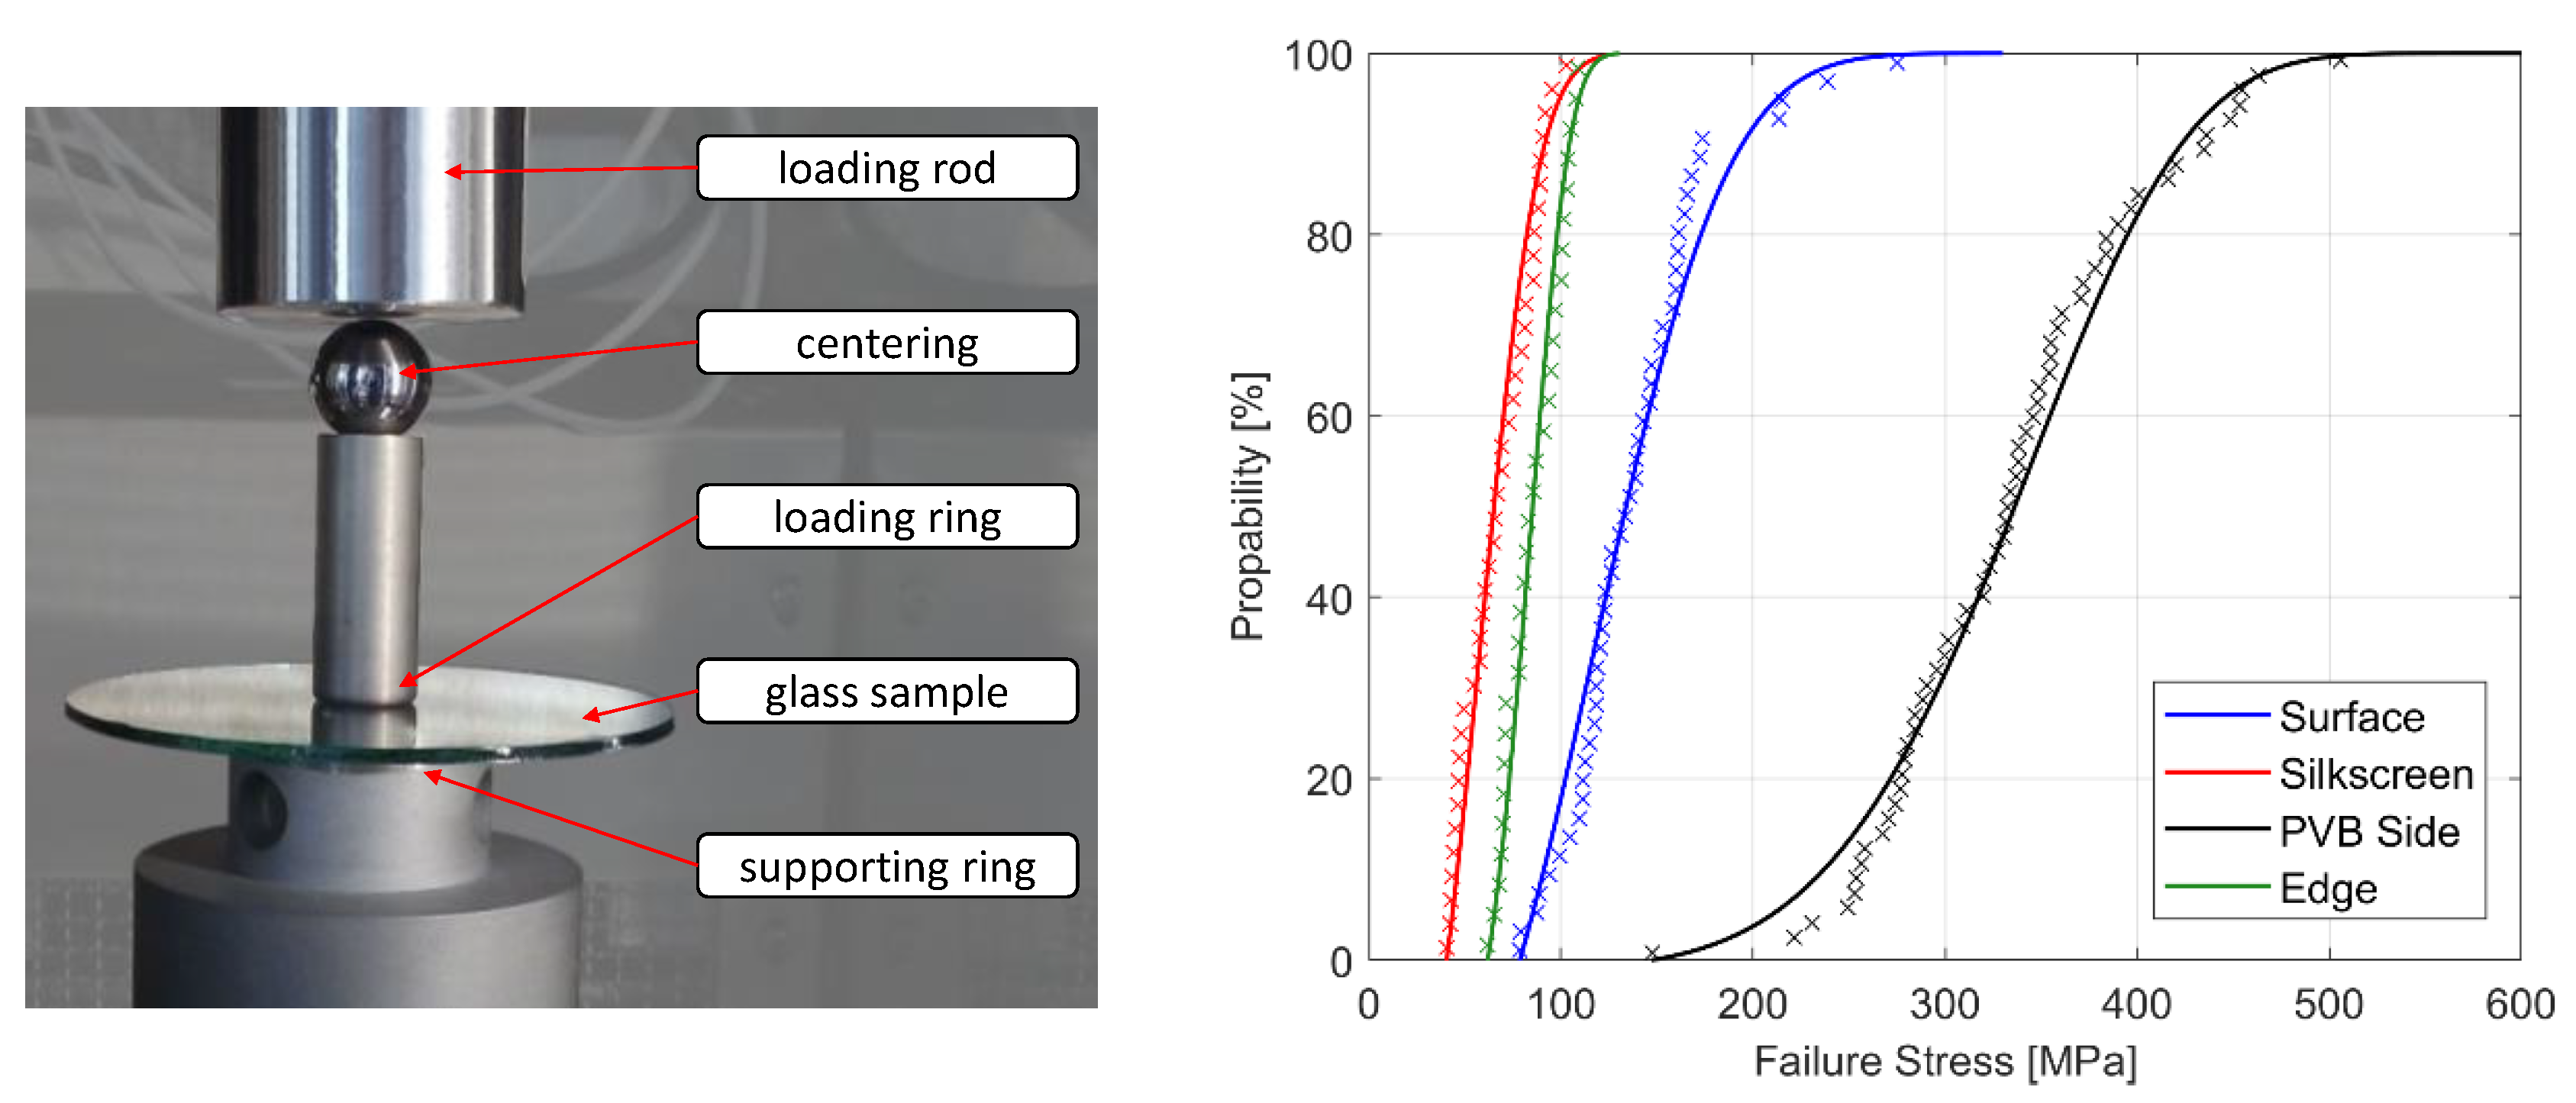
This section contains the current innovation of the present paper. In order to consider the stochastic fracture behaviour of glass in the simulation, the corresponding distribution functions in Figure 2 must be transferred to the material model for glass separately for edges, each side of the glass surfaces, and screen-printing area. However, these distribution functions are based on critical crack lengths. Therefore, the initial crack lengths a i is computed in a first step using Equation (5). These crack lengths are then randomly distributed across the windshield model for each Gauss point. Hereby, the different element sizes must be considered using Equation (3).
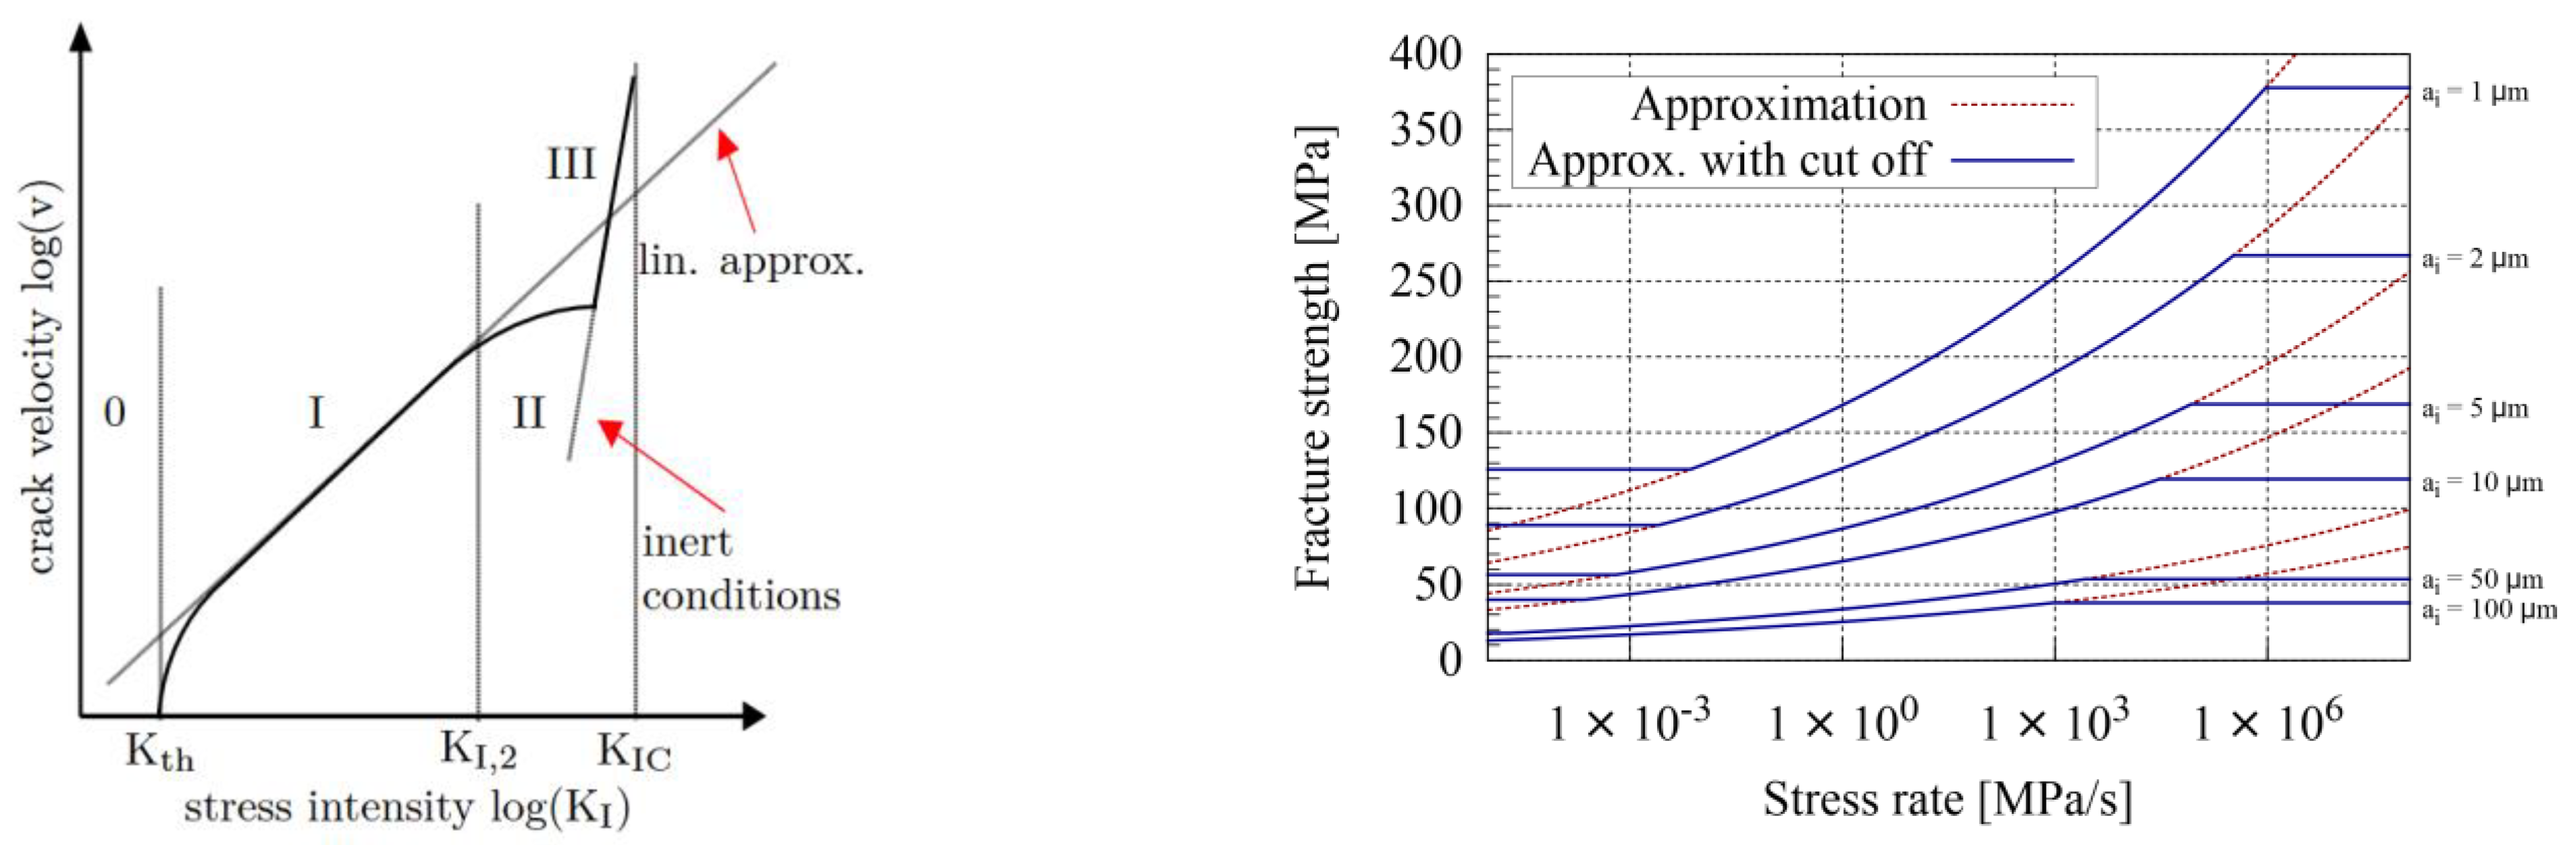
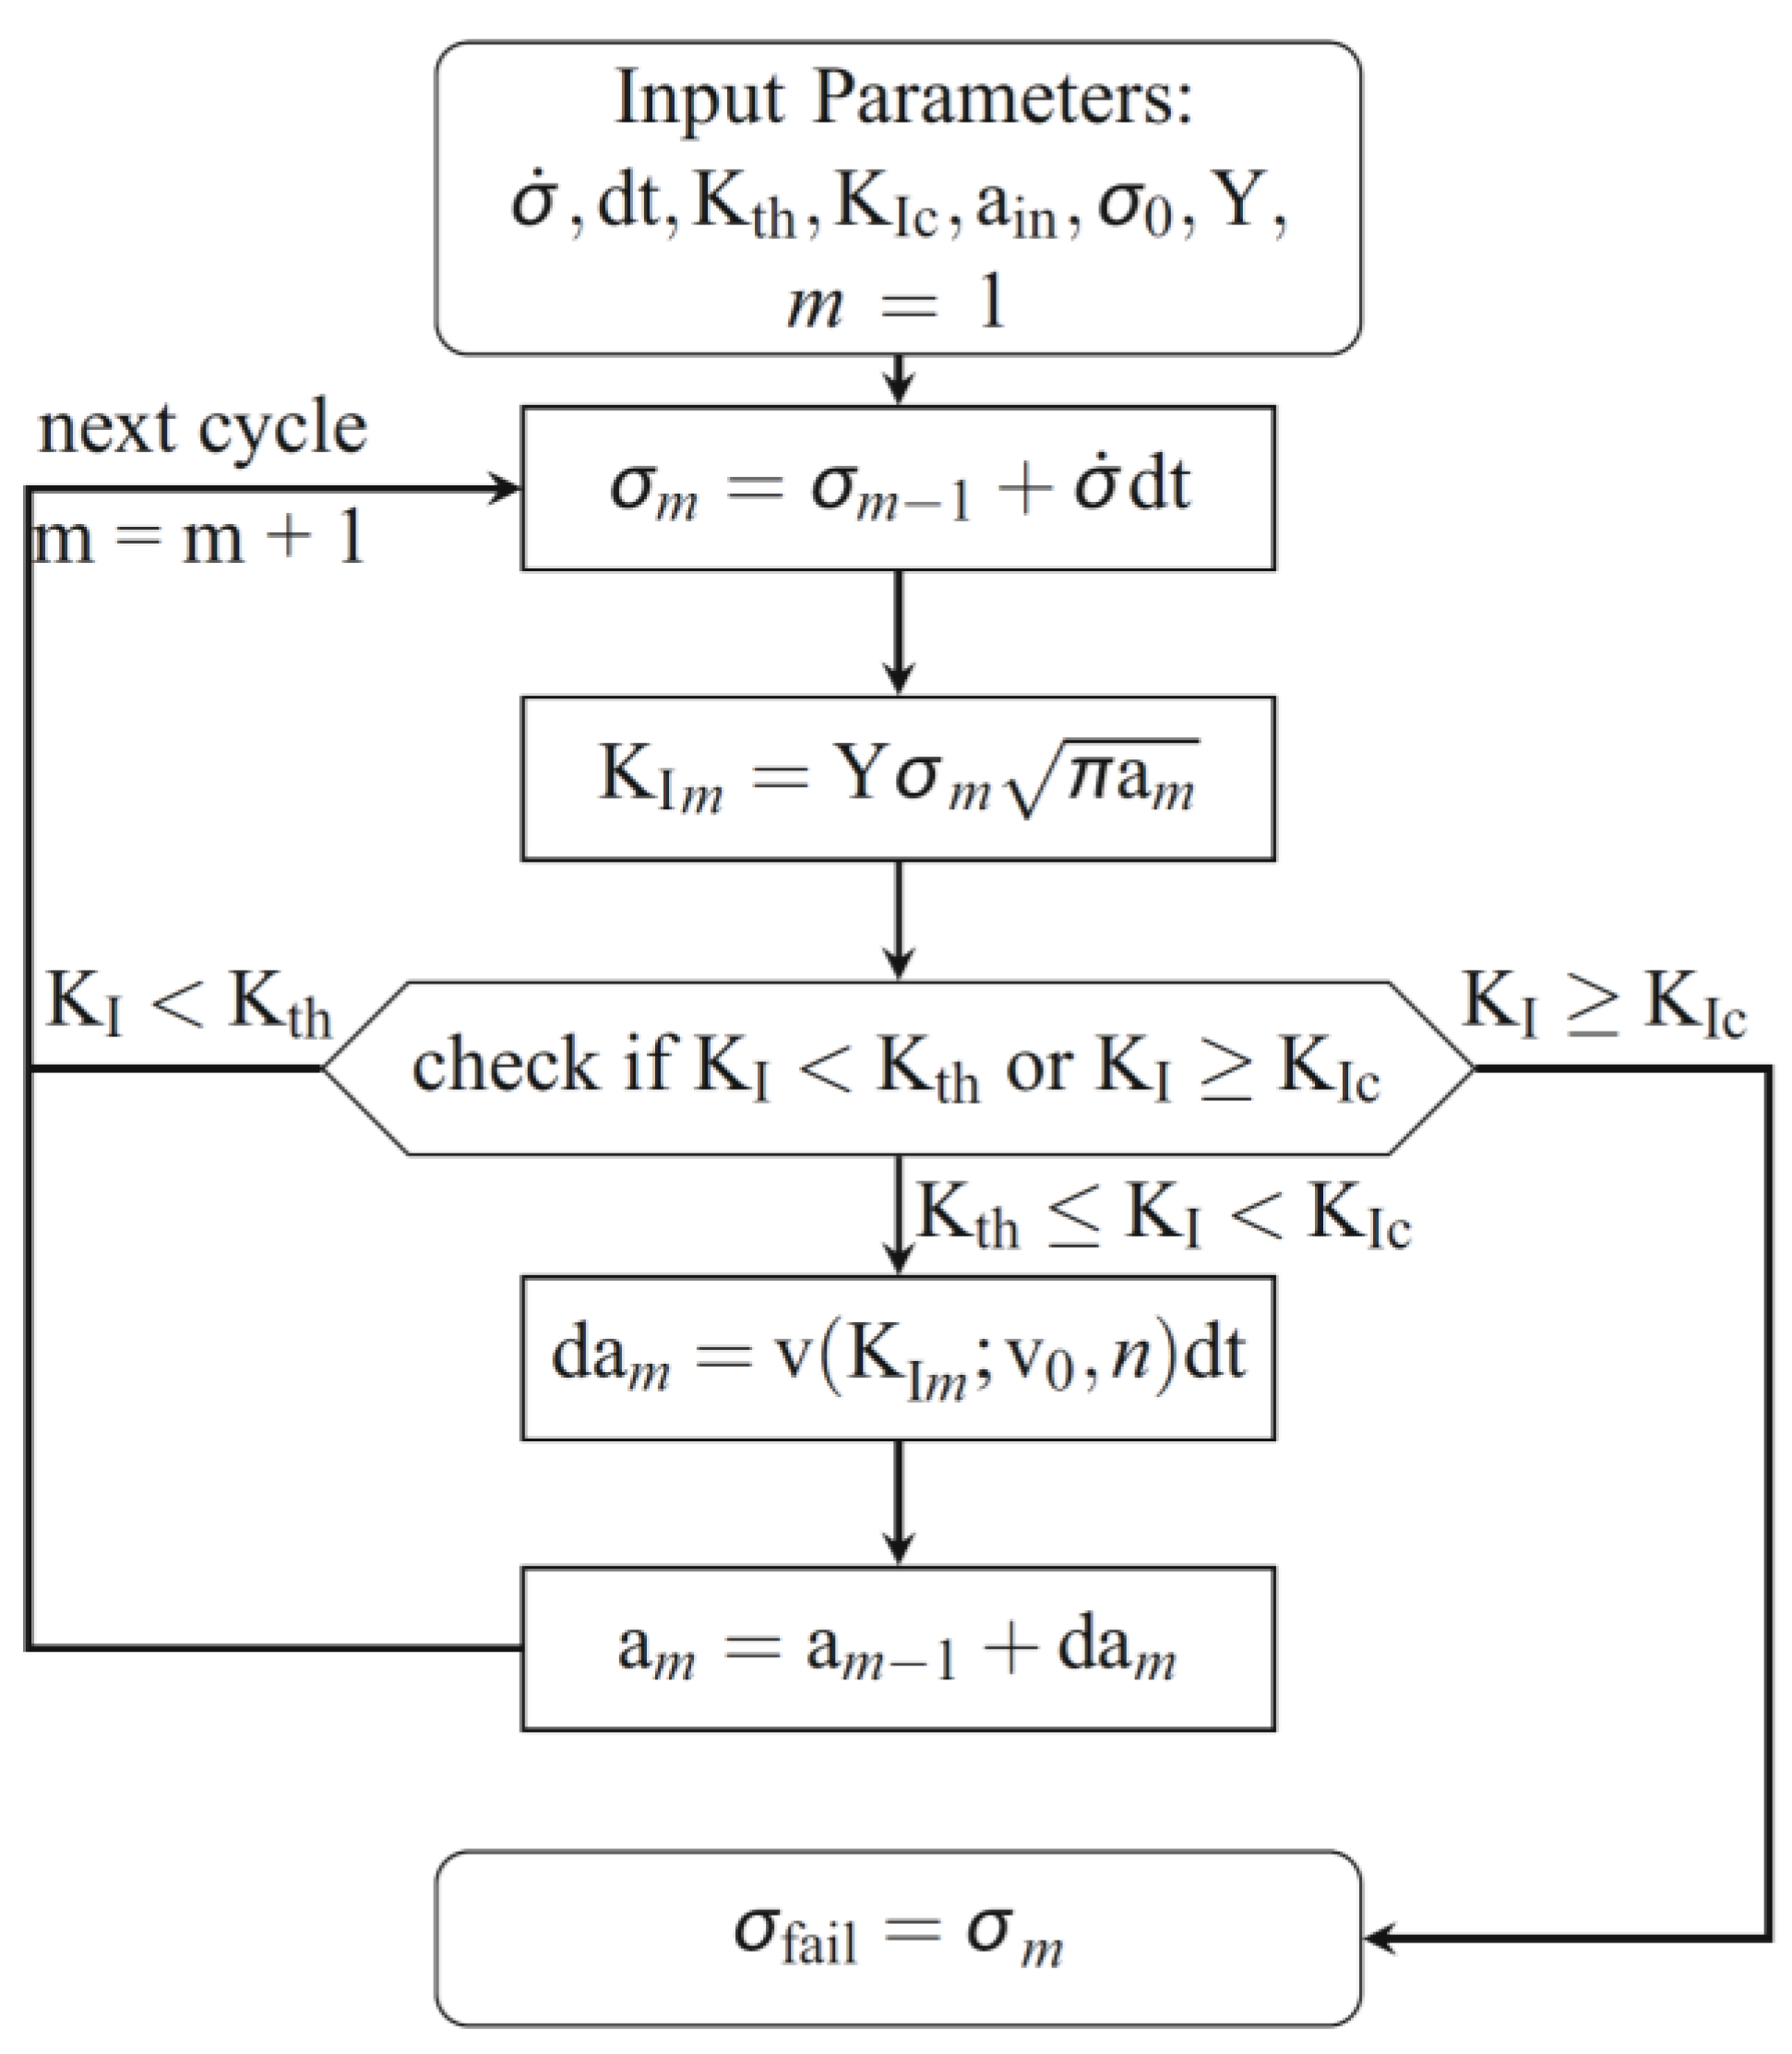
If the glass ply is loaded, the initial cracks grow subcritically when a threshold value of the stress intensity K I , t h is exceeded. Only when a critical crack size is reached will macroscopic fracture occur. This can be described by the critical stress intensity K I c . This subcritical crack growth can again be described by Equation (5) using the algorithm shown in Figure 7. If σ fail is reached, a macroscopic failure occurs. This is modelled with the present nonlocal model using the element erosion technique, i.e., the stiffness of the corresponding element is set to zero in the time it takes for the crack to propagate through the element.
For the following frequency distributions, in total, 250 head impact simulations, each with randomly distributed initial cracks, were carried out. Two different boundary conditions were examined: A four point supported windshield and an elastic support close-to-the-car where the windshield was glued to a wooden frame using windshield adhesive.
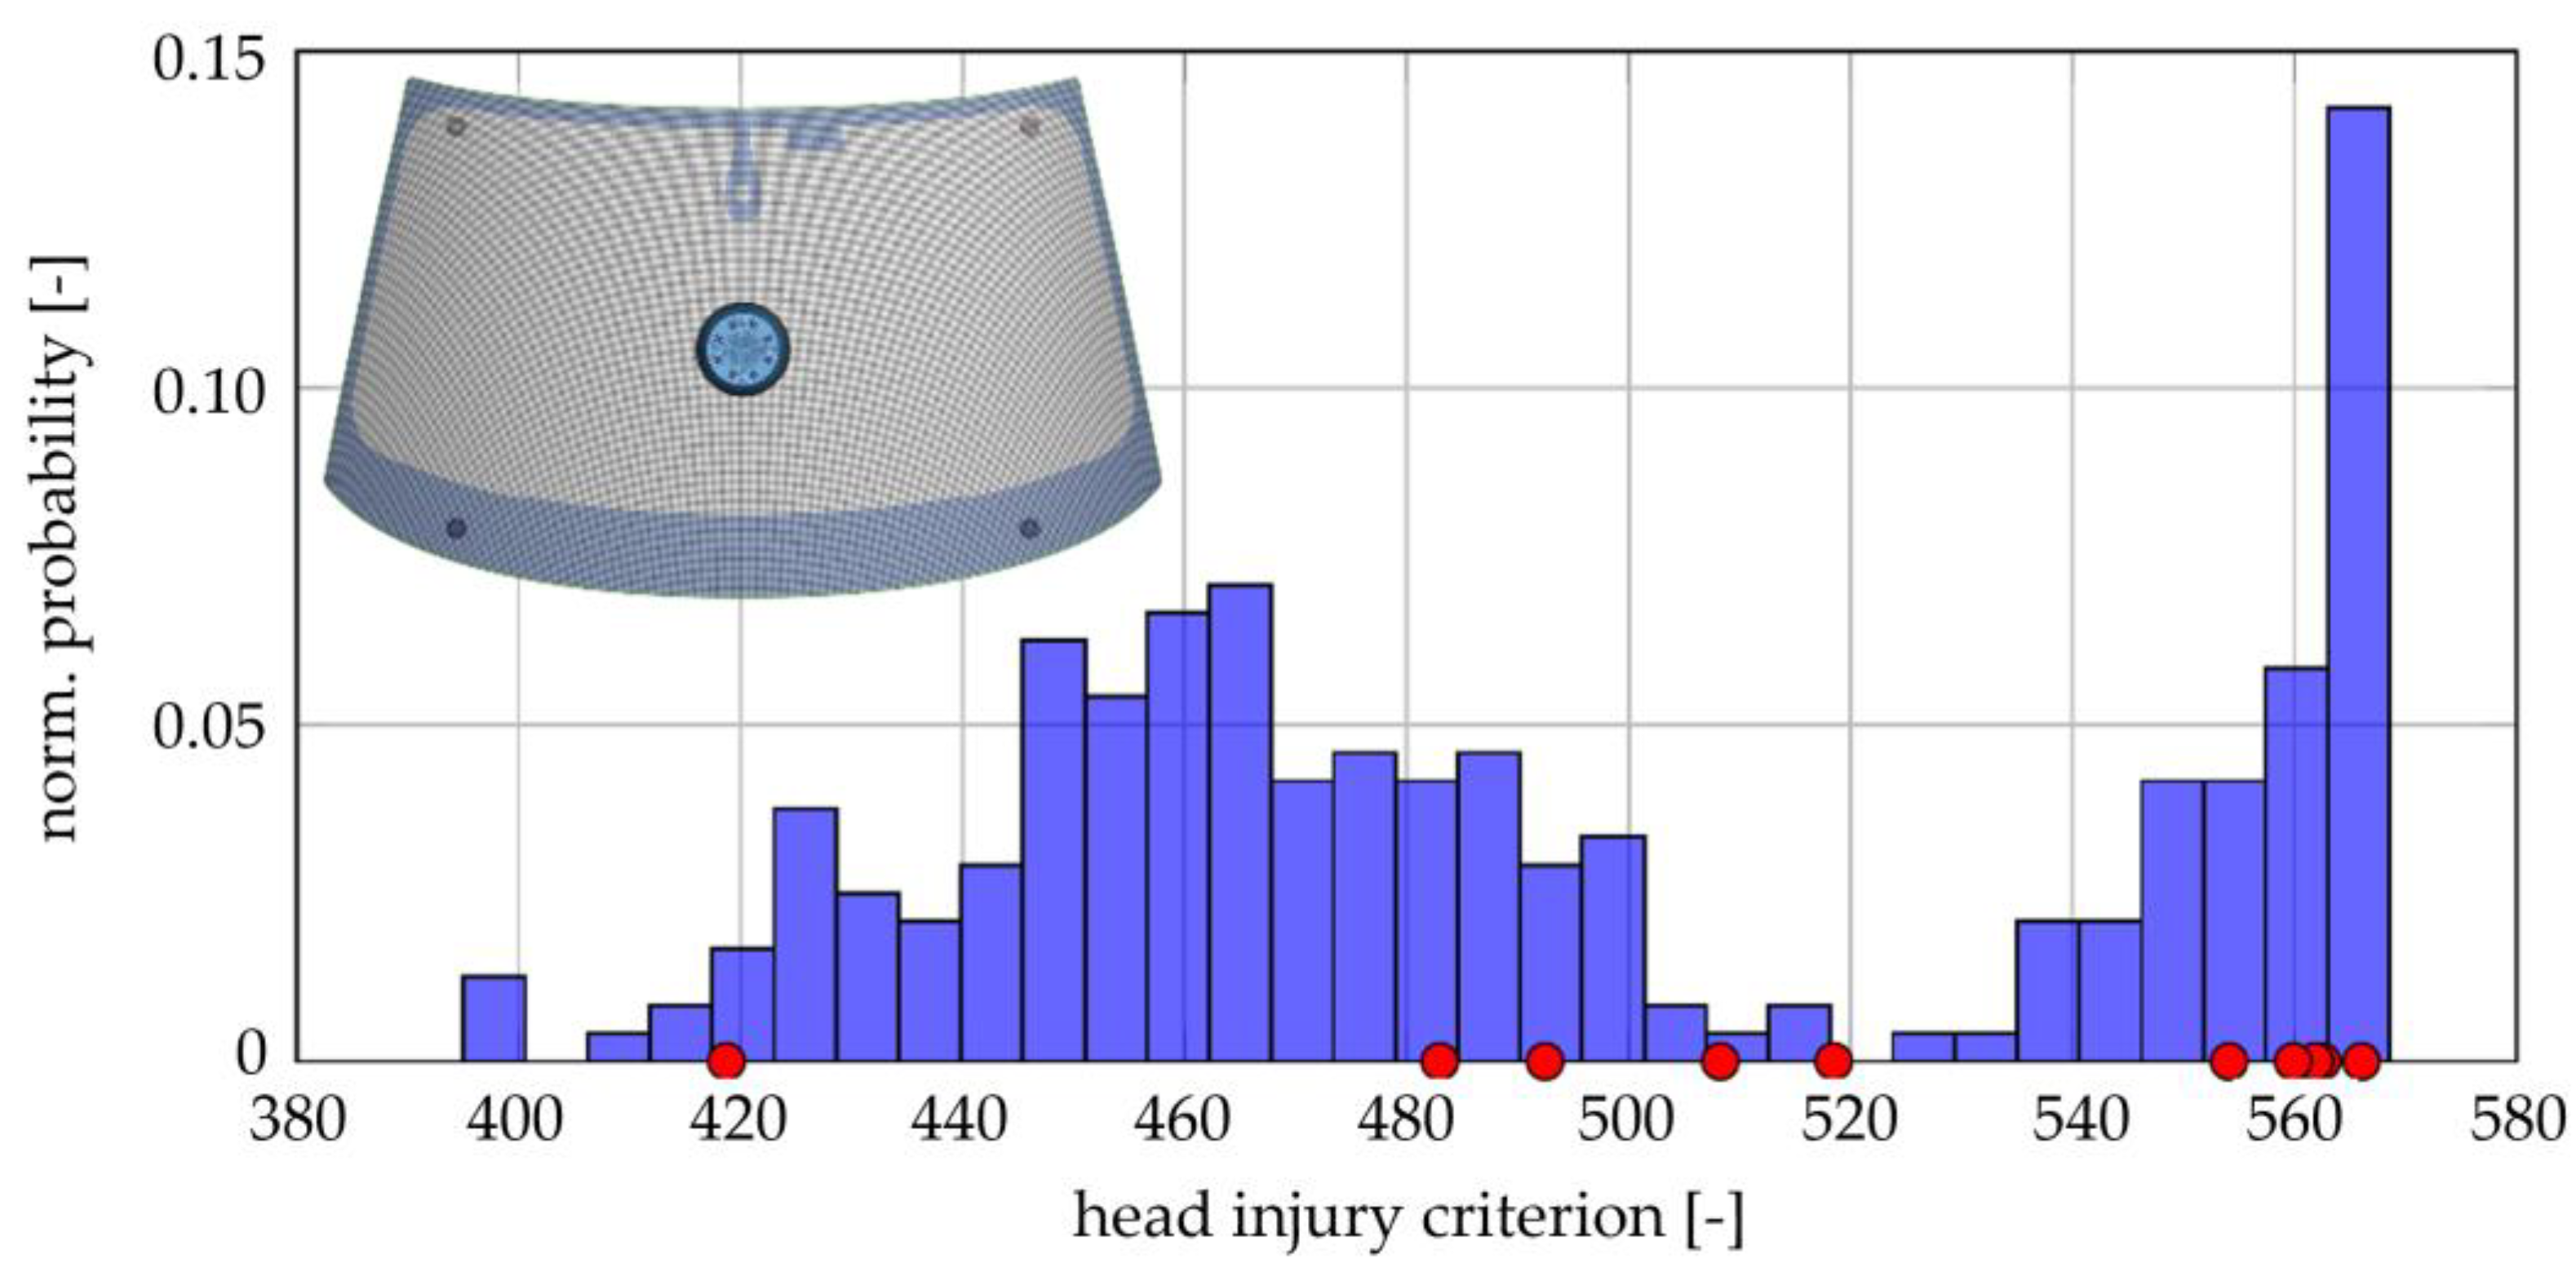
The experimental and numerical HIC values for the four-point supported windshield are shown in Figure 8. Ten experimentally determined values (red dots) and, in total, 250 values from stochastic simulations are depicted. Most HIC values for the chosen test setup are accumulating at the upper bound. A putative normal distribution of head injury values is calculated between approximately 400 and 520. Five of ten experimental values are within this range, while the other five values are at the upper bound. It can therefore be assumed that the stochastic fracture model can reproduce the real head impact tests realistically.
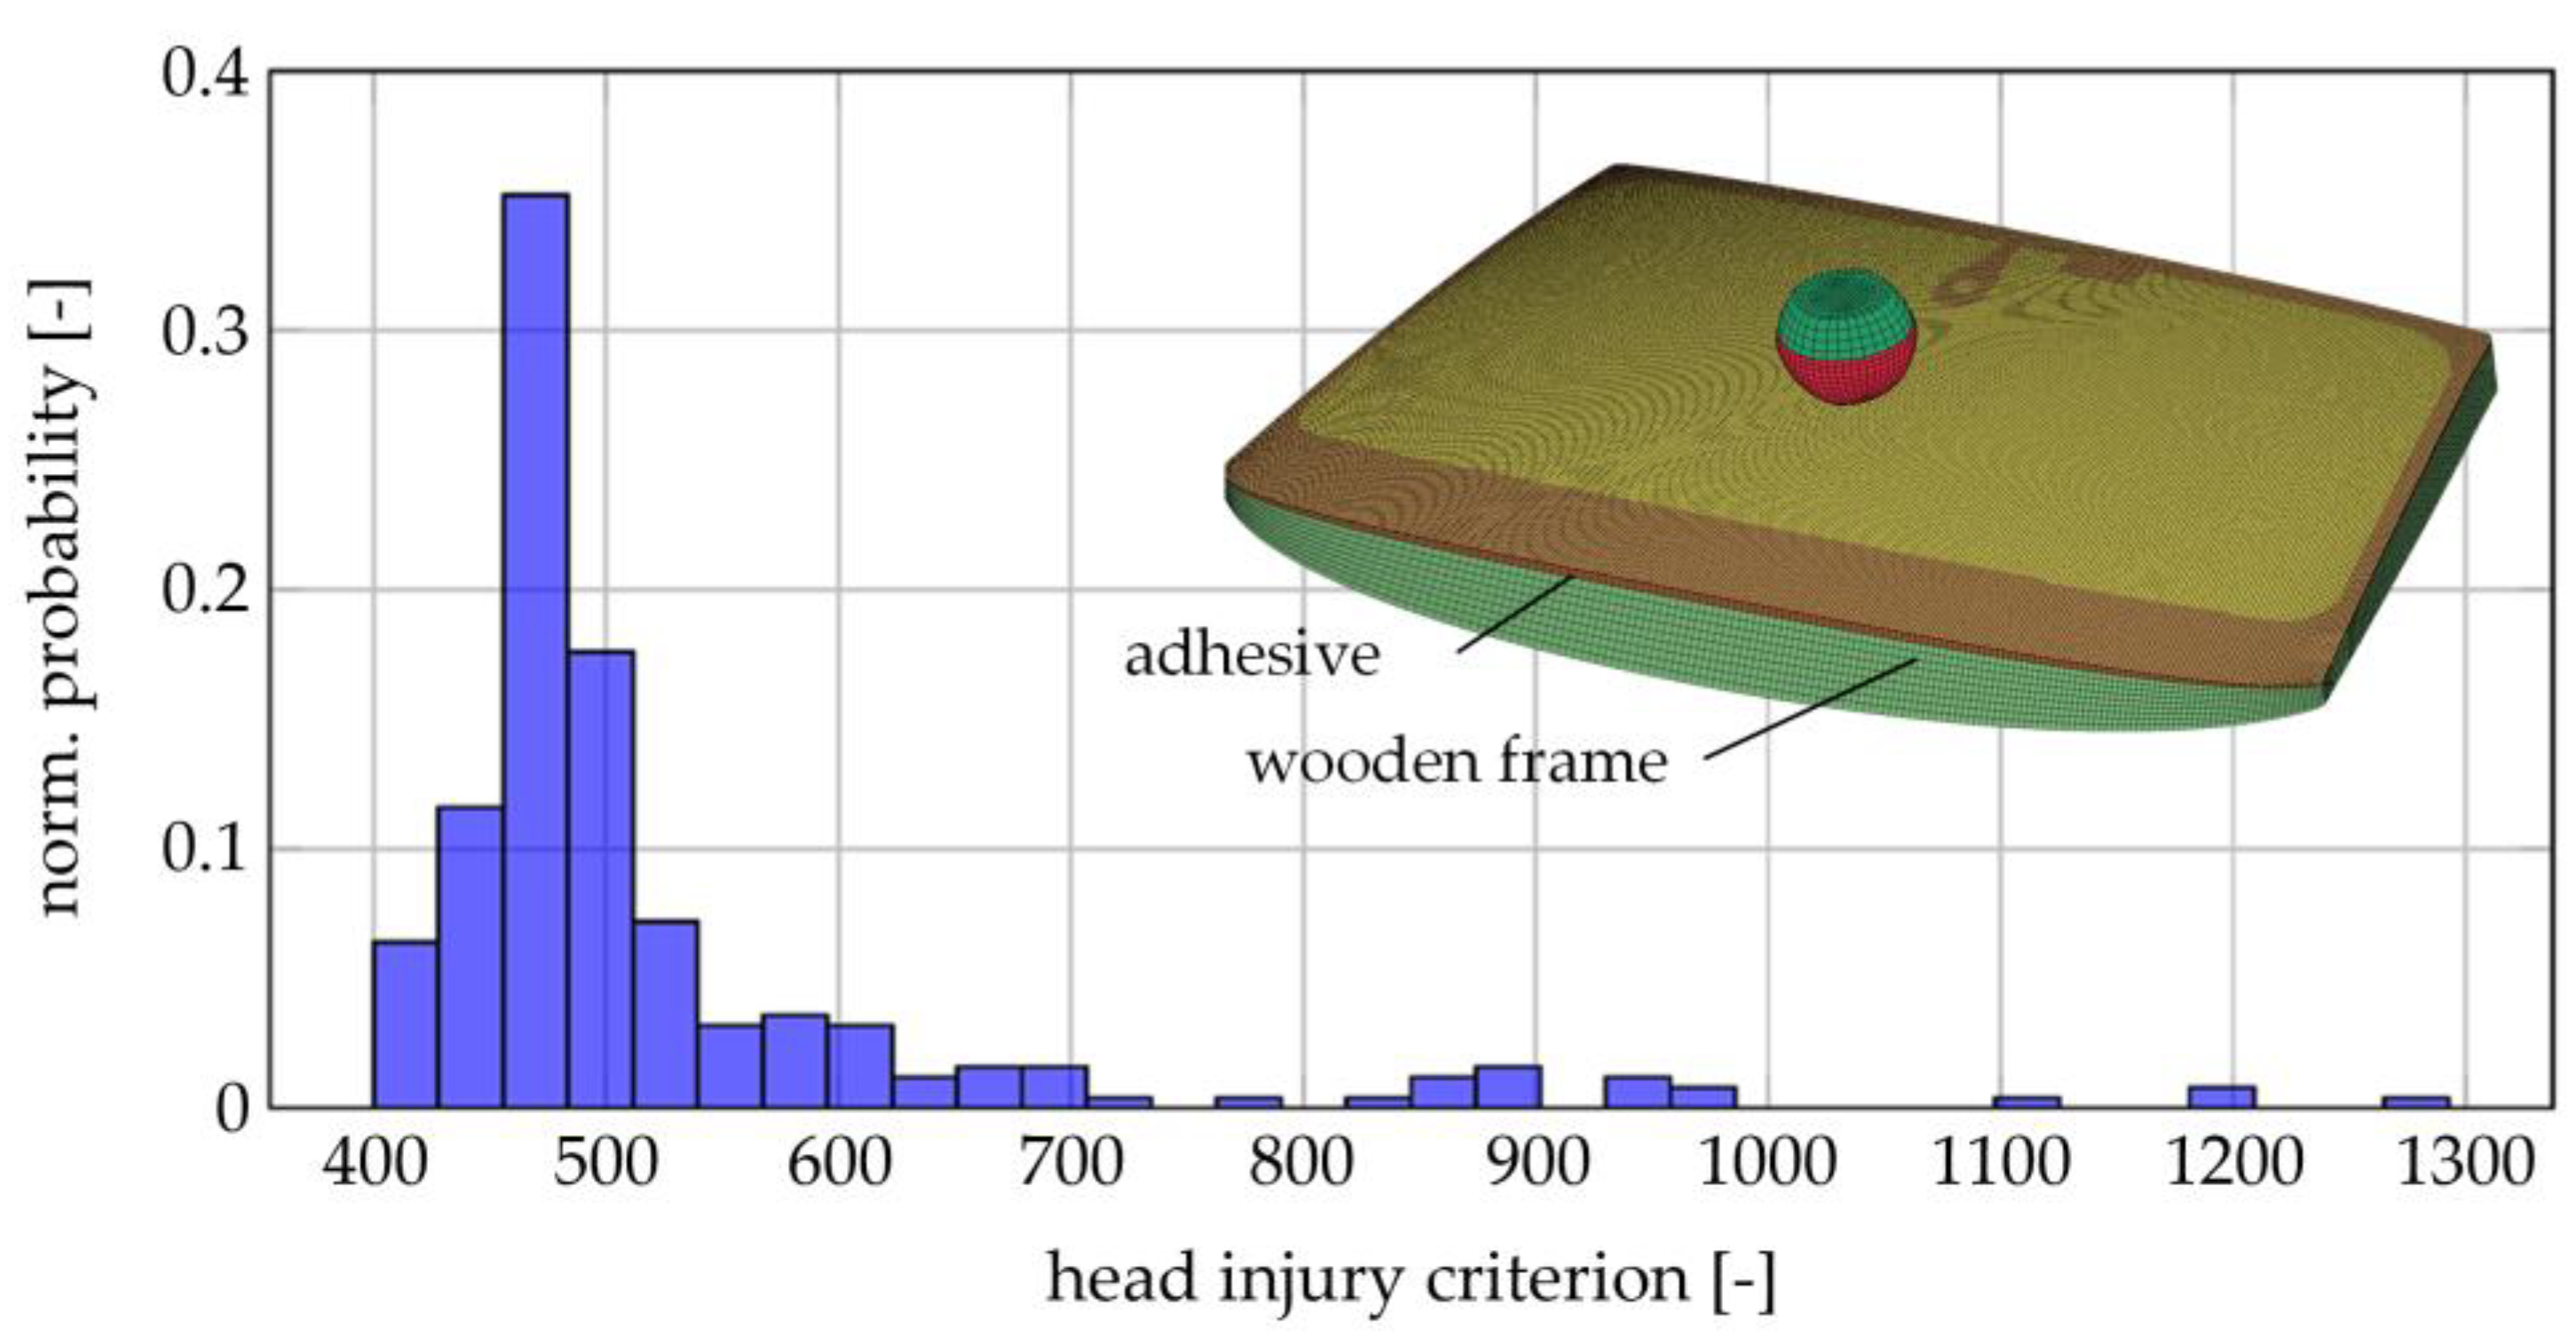
As a next application, a purely numerical study is shown where the windshield was glued to a wooden frame. Details of the finite element model can be found in [11]. Figure 9 shows the numerically predicted HIC values calculated by Equation (1). The values are scattered between 411 and 1292. Hereby, an accumulation around HIC = 480 can be observed. This means that most results in real head impact tests are to be expected in this range. However, 1.6 % of the calculated values are higher than 1000, where there is a serious risk of injury.
The calculated values are like the values from literature in respect of the statistical range. Unfortunately, no freely available database for the stochastic scatter of the pedestrian head impact could be found so far. This is complicated by the manufacturing-dependent, nonmaterial-specific strength of glass. As a result, each manufacturing line generates its own glass strength distribution and thus its own HIC distribution for a certain windshield.

4. Conclusions and Outlook

In the present paper, a methodology was proposed to consider the stochastic fracture behaviour of glass in the numerical simulation. This includes both the required experimental work and the numerical implementation for finite element simulation. To determine the glass strength distribution, all areas of the windshield must be examined separately. These are the glass surfaces, the edge, and the screen-printed area using ring-on ring tests and four-point bending tests.
With these distribution functions, the production-related initial cracks can be computed reversely, and subcritical crack growth can be considered using fracture mechanics. The presented stochastic simulation helps to reveal trends that would otherwise not be possible due to the limited number of real tests. However, the predictive ability of the simulation is heavily dependent on the precise modelling of the fracture behaviour of glass. Therefore, detailed work on the post fracture behaviour of laminated glass will be the subject of future investigations.

Author Contributions

Conceptualization; supervision; funding acquisition, S.K.; methodology, software and validation, C.A., C.B.; writing, original draft preparation, review and editing, S.K., C.A. and C.B. All authors have read and agreed to the published version of the manuscript.

Funding

The presented work is based on results of the research project named 18295N “Stochastisches Bruchverhalten von Glas”. This research was funded by the AiF within the programme for sponsorship by Industrial Collective Research (IGF) of the German Federal Ministry of Economic Affairs and Energy based on an enactment of the German Parliament. The research project was carried out in cooperation with The Research Association of Automotive Technology (FAT).

Institutional Review Board Statement

Not applicable.

Informed Consent Statement

Not applicable.

Data Availability Statement

Not applicable.

Acknowledgments

The authors would like to thank the working group AK27 “Simulation methods and virtual validation” as well as to the members of the project advisory board for fruitful discussions and support.

Conflicts of Interest

The authors declare no conflict of interest.

References

  1. Federal Motor Vehicle Safety Standard 208 (FMVSS 208), 49 CFR 571.208 S6.2.
  2. Xu, J.; Li, Y.; Chen, X.; Yan, Y.; Ge, D.; Zhu, M.; Liu, B. Characteristics of windscreen cracking upon low-speed impact: Numerical simulation based on the extended finite element method. Comput. Mater. Sci. 2010, 48, 582–588. [Google Scholar] [CrossRef]
  3. Xu, X.; Liu, B.; Li, Y. Investigation on Dynamic Propagation Characteristics of In-Plane Cracks in PVB Laminated Glass Plates. Adv. Mater. Sci. Eng. 2016, 1468390. [Google Scholar] [CrossRef]
  4. Naumenko, K.; Pander, M.; Würkner, M. Damage patterns in float glass plates: Experiments and peridynamics analysis. Theor. Appl. Fract. Mech. 2022, 118, 103264. [Google Scholar] [CrossRef]
  5. Chen, S.; Zang, M.; Wang, D.; Zheng, Z.; Zhao, C. Finite element modelling of impact damage in polyvinyl butyral laminated glass. Compos. Struct. 2016, 138, 1–11. [Google Scholar] [CrossRef]
  6. Lin, D.; Wang, D.; Chen, S.; Zang, M. Numerical simulations of impact fracture behavior of an automotive windscreen glazing: An intrinsic cohesive approach. Compos. Struct. 2017, 186, 79–93. [Google Scholar] [CrossRef]
  7. Xu, W.; Zang, M. Four-point combined DE/FE algorithm for brittle fracture analysis of laminated glass. Int. J. Solids Struct. 2014, 51, 1890–1900. [Google Scholar] [CrossRef]
  8. Shuyu, C.; Zeng, J.; Zhang, M.; Ji, J.; Li, L.; Tian, F. Fracture of soft materials with interfaces: Phase field modeling based on hybrid ES-FEM/FEM. Eng. Fract. Mech. 2022, 276 Pt B, 108892. [Google Scholar]
  9. Pyttel, T.; Liebertz, H.; Cai, J. Failure criterion for laminated glass under impact loading and its application in finite element simulation. Int. J. Impact Eng. 2011, 38, 252–263. [Google Scholar] [CrossRef]
  10. Alter, C.; Kolling, S.; Schneider, J. An enhanced non-local failure criterion for laminated glass under low velocity impact. Int. J. Impact Eng. 2017, 109, 342–353. [Google Scholar] [CrossRef]
  11. Brokmann, C. A Model for the Stochastic Fracture Behavior of Glass and Its Application to the Head Impact on Automotive Windscreens; Springer: Berlin/Heidelberg, Germany, 2022. [Google Scholar]
  12. Müller-Braun, S.; Brokmann, C.; Schneider, J.; Kolling, S. Strength of the individual glasses of curved, annealed and laminated glass used in automotive windscreens. Eng. Fail. Anal. 2021, 123, 105281. [Google Scholar] [CrossRef]
  13. Müller-Braun, S.; Schneider, J. Biaxially curved glass with large radii—Determination of strength using the coaxial double ring test. Glass Struct. Eng. 2017, 2, 121–131. [Google Scholar] [CrossRef] [Green Version]
  14. Brokmann, C.; Kolling, S.; Schneider, J. Subcritical crack growth parameters in glass as a function of environmental conditions. Glass Struct. Eng. 2021, 6, 89–101. [Google Scholar] [CrossRef]
  15. Wiederhorn, S.M. Influence of water vapor on crack propagation in soda-lime glass. J. Am. Ceram. Soc. 1967, 50, 407–414. [Google Scholar] [CrossRef]
  16. Overend, M.; Zammit, K. A computer algorithm for determining the tensile strength of float glass. Eng. Struct. 2012, 45, 68–77. [Google Scholar] [CrossRef]
  17. Frank, T.; Kurz, A.; Pitzer, M.; Söllner, M. Development and validation of numerical pedestrian impactor models. In Proceedings of the 4th European LS-DYNA Users Conference, Ulm, Germany, 22–23 May 2003; p. C-II-1–18. [Google Scholar]
Figure 1. Comparison of head impacts on three windshields (Audi A3), cf. [11].
Applmech 04 00010 g001
Figure 2. Test setup for the ring-on-ring tests (left) and distribution functions for the different areas (right), cf. [11].
Applmech 04 00010 g002
Figure 3. (Left) Different regions of subcritical crack growth velocity, cf. [11]. (Right) Fracture strength as a function of stress rate for different initial crack lengths, cf. [10].
Applmech 04 00010 g003
Figure 4. (Left) Rheological model. (Right) Validation of the model using highspeed tensile tests, cf. [10].
Applmech 04 00010 g004
Figure 5. (Left) Modelling technique for laminated safety glass using a coincident nodes approach, (right) Visualization of the shifted shell thicknesses together with a part of the head impactor model.
Applmech 04 00010 g005
Figure 6. (Left) Resultant acceleration of three different tests in comparison with the simulation. (Right) Predicted fracture pattern for the two glass panes of the windshield, cf. [10].
Applmech 04 00010 g006
Figure 7. Flow chart of the algorithm for subcritical crack growth to failure.
Applmech 04 00010 g007
Figure 8. HIC probability for head impact tests on four-point supported windshields, cf. [11].
Applmech 04 00010 g008
Figure 9. HIC probability for head impact simulations on windshields glued on a wooden frame. 250 HIC values from stochastic simulations are depicted, cf. [11].
Applmech 04 00010 g009
Table 1. Crack growth parameters as a function of humidity, cf. [11].
H [%rh], 25 °C3040506070
n [-]15.4315.1014.7512.9612.26
v 0 [mm/s]9.5410.2210.4713.9515.99
Disclaimer/Publisher’s Note: The statements, opinions and data contained in all publications are solely those of the individual author(s) and contributor(s) and not of MDPI and/or the editor(s). MDPI and/or the editor(s) disclaim responsibility for any injury to people or property resulting from any ideas, methods, instructions or products referred to in the content.

