1. Introduction
Locating bearing track roller guidance systems are used, for example, in monorail transport systems. Due to the essential requirements for the systems, no additional lubricant can be used for the guideways. From a contact mechanics point of view, this is therefore a problem that requires tangential surface stresses to be taken into account [
1]. The current state of research on the design of locating bearing track roller guidance systems [
2,
3] does not offer any satisfactory calculation options for this; thus, the author has already described the problem in an initial paper [
4] and then presented a proposal for a static model that takes friction into account [
5]. In the design phase, it is very important to support decisions with calculation models [
6]. However, only very advanced commercial software can currently be used for this purpose.
For contact mechanics calculation problems, the software
CONTACT, which uses Kalker’s theory [
7], is particularly suitable [
8]. Although such contact mechanics problems can also be solved using finite element methods (FEM), FEM approaches will not be considered further within the scope of this article because of their very high computing times.
The application of
CONTACT to the machine element of the fixed bearing track roller requires some effort. First of all, the 2D contour geometry of the bodies must be derived from the CAD (computer-aided design) models in order to use it as an input for the calculation. For each geometry change, new contour geometries have to be derived [
9]. Rapid changes to the geometry are therefore hardly applicable for the calculation, making it difficult to carry out parameter studies during the design phase.
With commercial software, the calculation process is often not visible and therefore not comprehensible. Therefore, a solution of the problem using contact mechanics modeling in combination with an open-source code is considered useful. In order to provide some plausibility to the calculated results, the gap between simple models and highly developed software must be closed by a scientifically developed, comprehensible model.
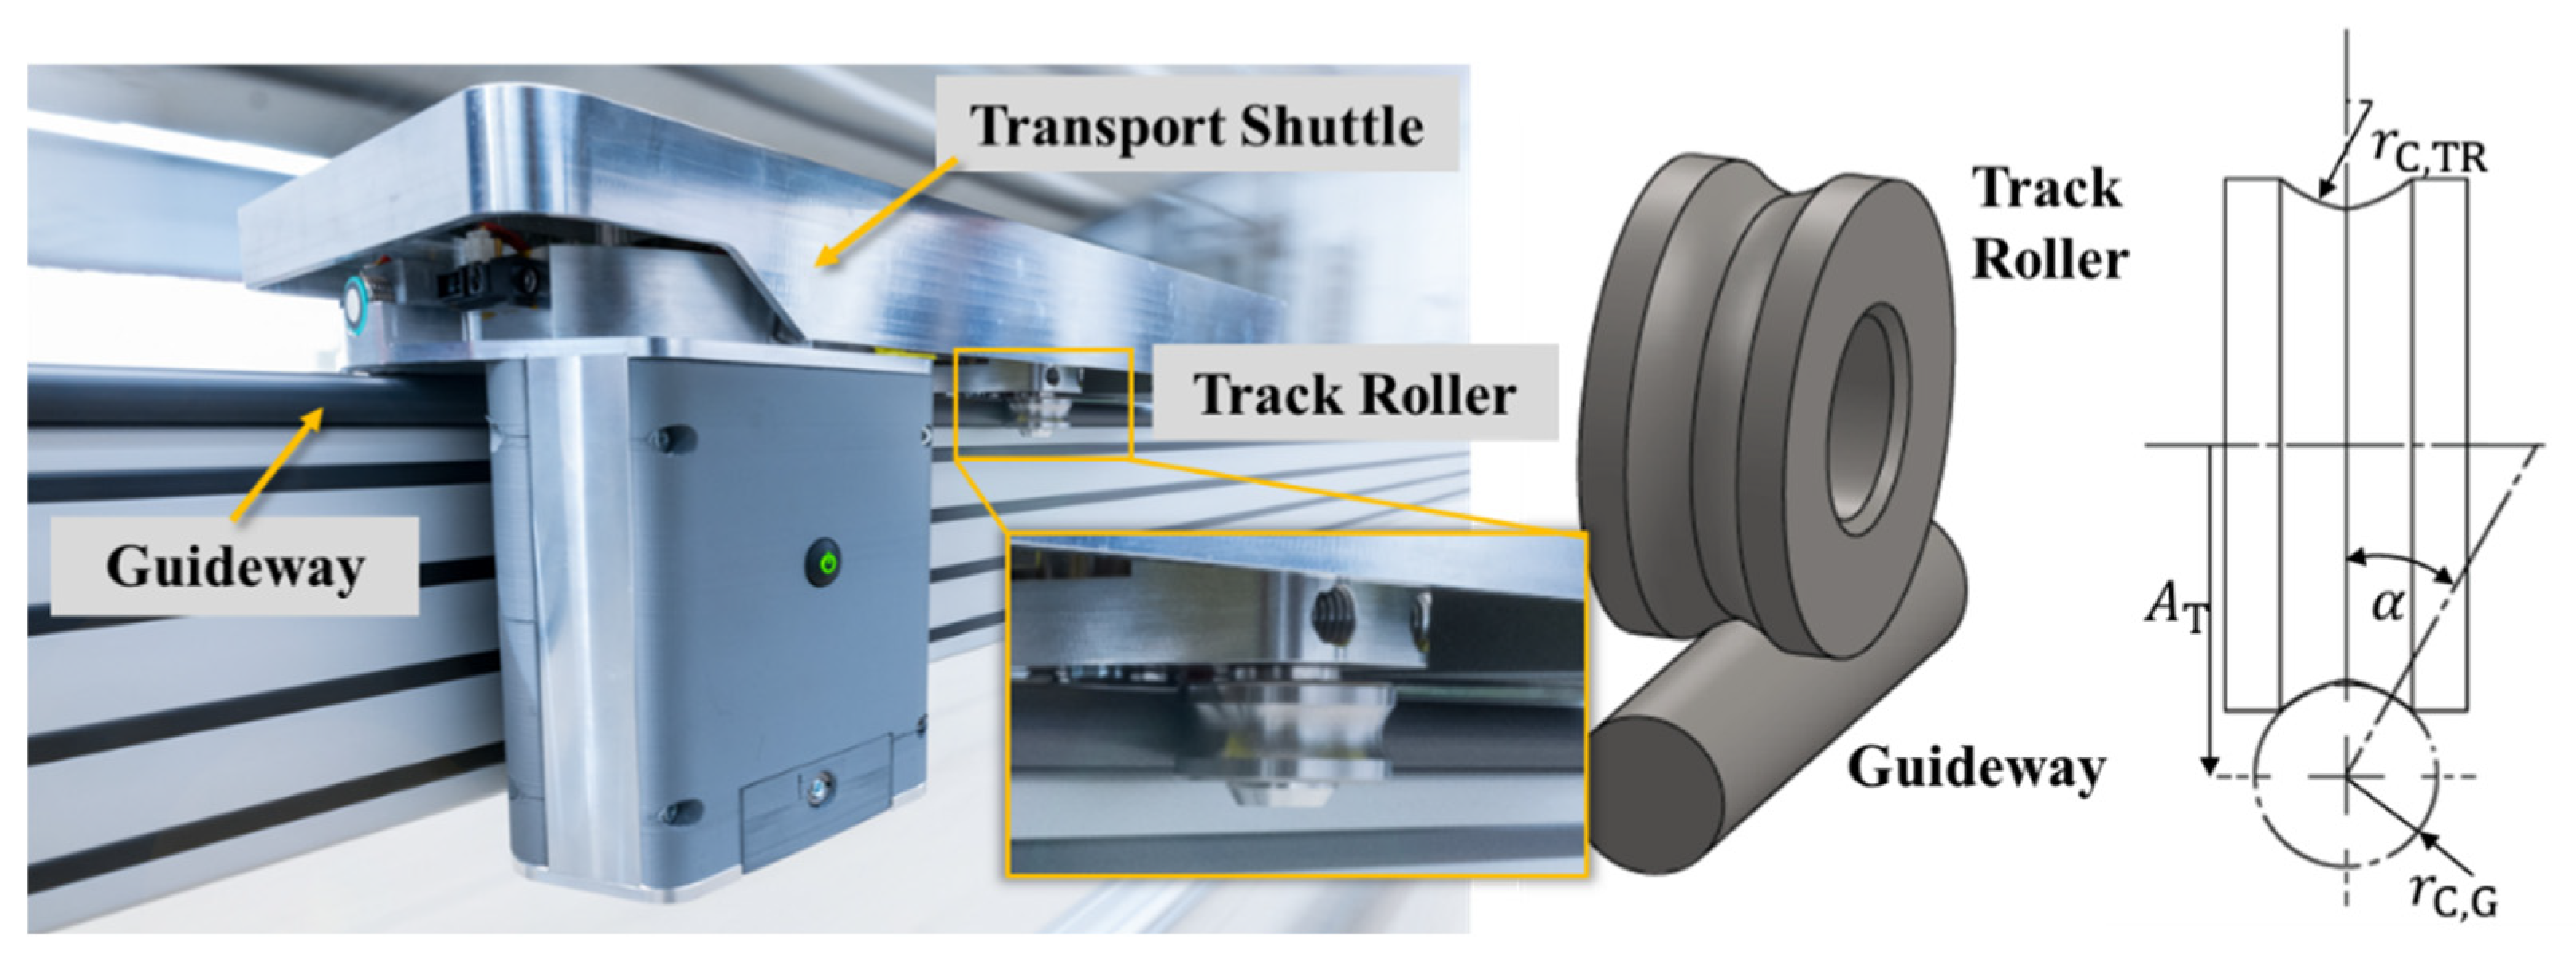
In this paper, a simulation model is presented that calculates the surface and material stresses of a continuously rolling track roller. The model is presented using the example of a selected locating bearing track roller guide (
Figure 1, right), whose most important geometrical quantities are shown in
Table 1. The model covers both free rolling and driven rolling and is valid for Hertzian contacts with a high proportion of spin.
The simulation model can be used to calculate both straight and curved sections of the guideway. The radius indicates the radius of the curvature of the guideway relative to the center of the contour. A distinction between the inner and outer wheel is necessary.
2. Materials and Methods
The calculation of the subsurface stresses is performed with the elastic half space theory. The contact area is calculated according to the Hertzian theory [
10,
11]. The Hertzian pressure describes the normal stress distribution at the contact of two bodies of constant radii of curvature. Such contact always results in an elliptical contact surface. In the track roller guidance system used here, constant radii of curvature are present in the contacts, which is why Hertzian theory can be applied. The contact kinematics are derived on the basis of roller and guideway geometry following the procedure of Birkhofer [
12].
Additionally, as a post processing step, the Wöhler curve, as described in DIN50100 [
13], is used to establish a relationship between stress and duration until damage is reached.
A material database script can be used to retrieve and edit material parameters and to add new materials.
2.1. Calculation of the Subsurface Stresses
For the calculation of the stresses below the surface, the model of the elastic half-space, as described by Johnson [
14] is chosen. In this paper the further modified formulation by Nikas [
15] is used.
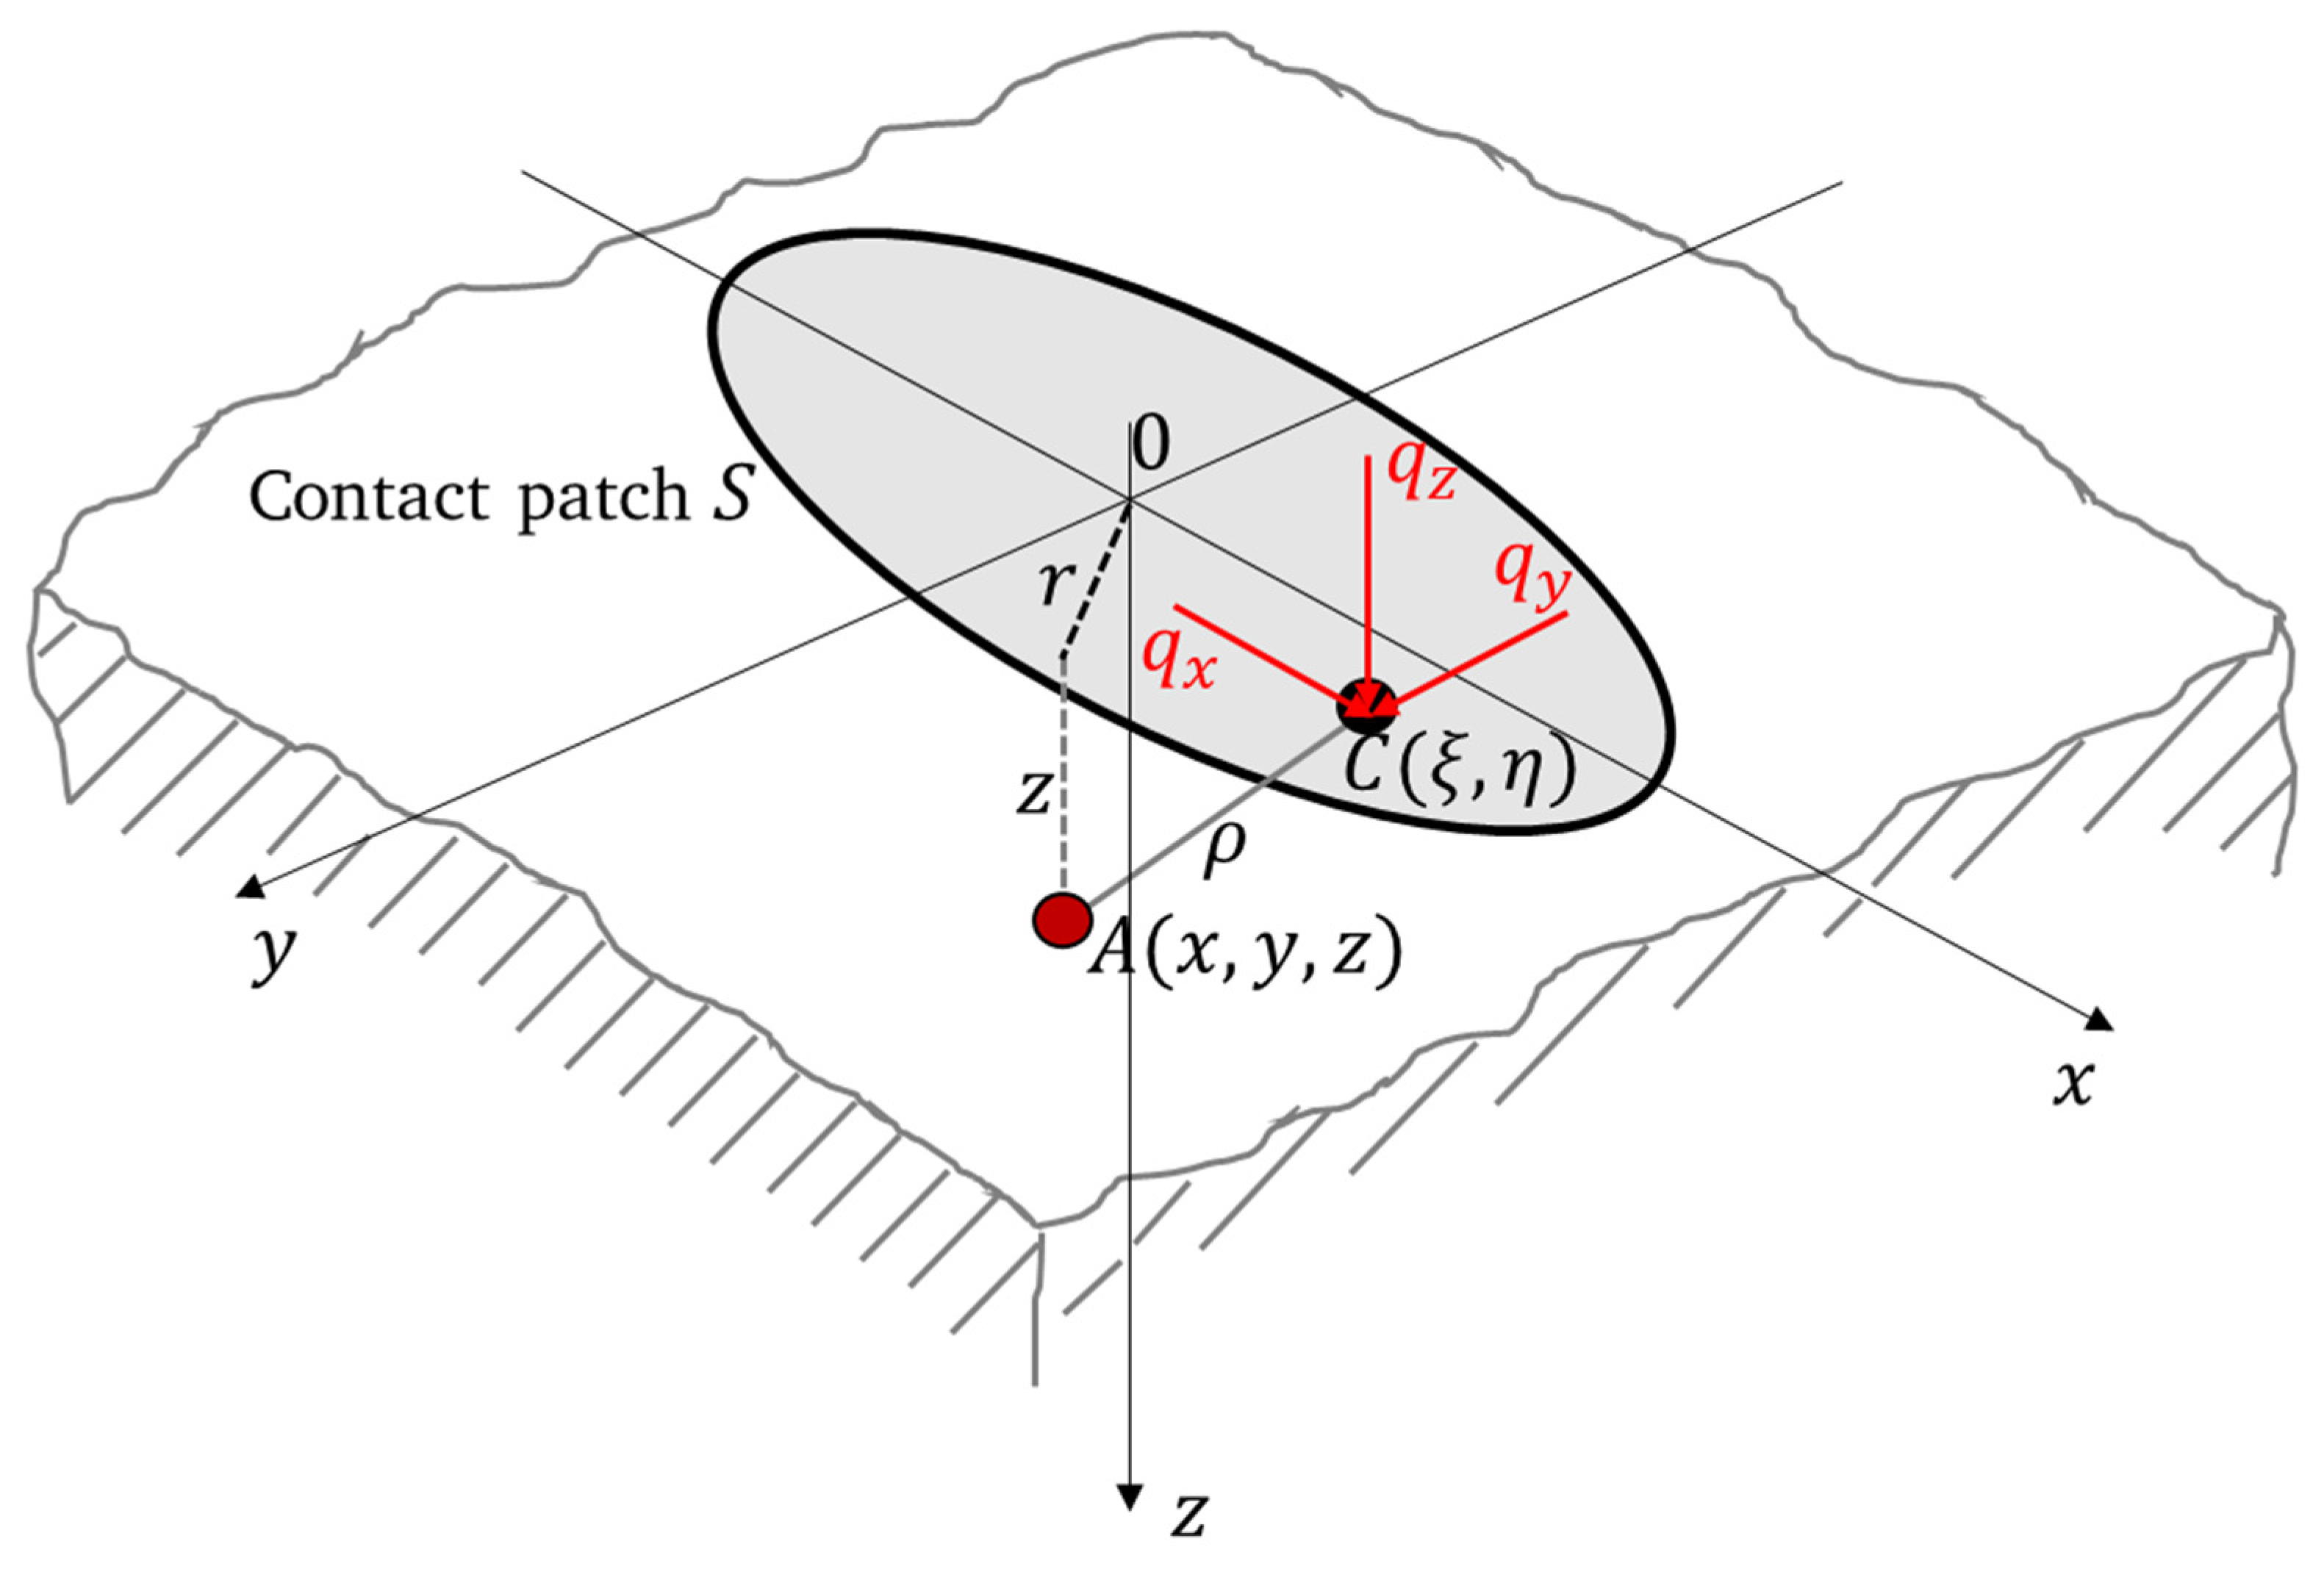
Figure 2 shows the relationship between surface boundary conditions and any point below the surface.
Here C is any point within the contact zone S at which the traction vector (
) acts. The goal is to obtain the stresses at any point A below the surface. According to [
15] the potential functions are formulated as follows
The vector
is formulated as follows
The calculation of the stresses is only given here as an example for the normal stresses
The displacements are also again listed for only one component. The other formulations can be taken from [
10] as well as from the source code
The equivalent stress is calculated according to Distortion Energy Hypothesis (DEH) since Broszeit [
16] was already able to show that this is more suitable than, for example, the Alternating Shear Stress Hypothesis when additional shear stresses occur at the surface. This approach was confirmed by Harris [
17].
The stresses underneath the surface will be calculated with the formulas as described. The necessary deviations of are calculated using the toolkit SymPy with the functions diff and simplify and afterwards only the results are included in the calculation script. The potential theory in the implemented form is applicable for arbitrary contact areas.
2.2. Description of the Boundary Conditions on the Contact Surface
The track roller is always in equilibrium of the applied forces and torques. In the model presented here, only stationary rolling is considered, which is why the inertia forces in the force and torque equilibria can be neglected.
2.2.1. Force and Torque Equilibria
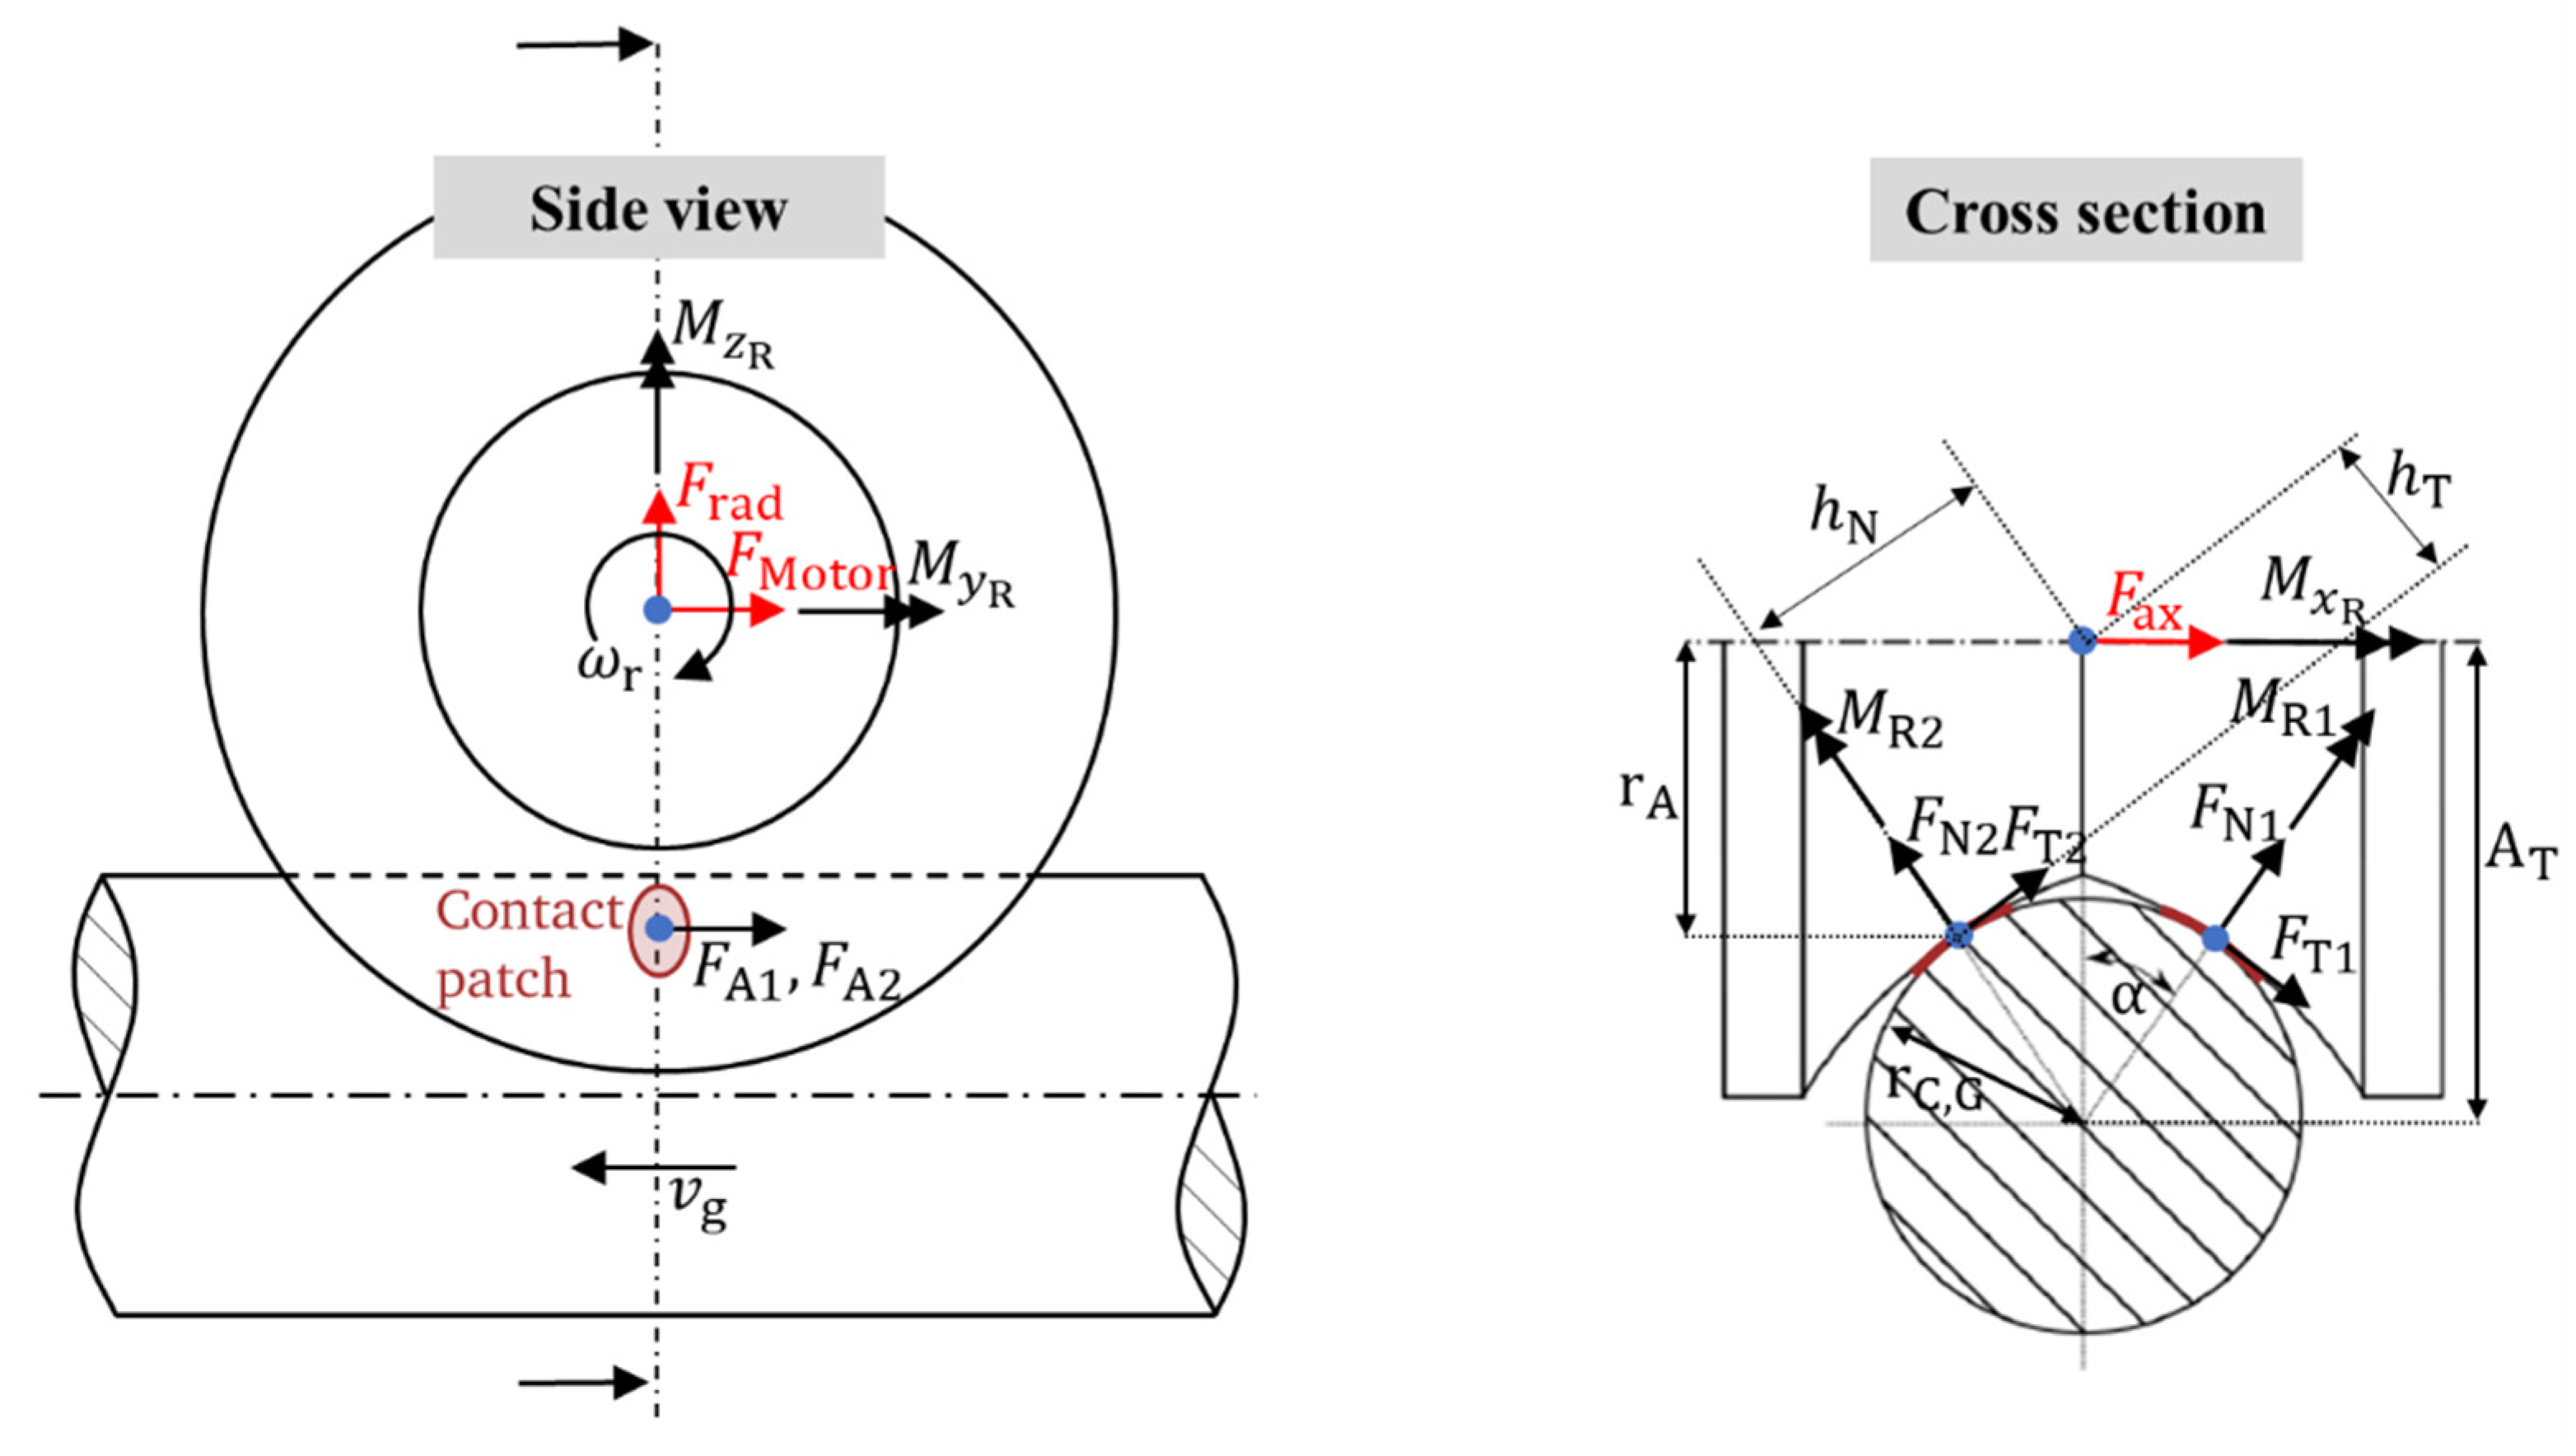
Figure 3 shows all forces and torques acting on the roller, always pointing in the direction of the positive coordinate axes. The coordinate systems are shown in
Figure 4. The aim of the calculation model presented here is to determine the stresses, forces and frictional torques acting in the two contacts for given forces on the roller axis.
The radial force , axial force and motor force are specified here. These external loads cause the tangential forces and perpendicular to the running direction and the driving forces and parallel to the running direction. In addition, the frictional torques and in the contact surfaces, the torque about the rolling axis and the tilting torques and are caused. Furthermore, the lever arms and are required to establish the torque equilibria.
First, the equilibria of forces are described
Subsequently, the description of the torque equilibria takes place
The following applies to the lever arms
2.2.2. Relative Motion of the Contact Area
To describe the relative velocity in the contact area, two assumptions must be made in advance:
Due to the high proportion of spin slip, no distinction is made between adhesive and sliding areas. Complete sliding in the entire contact area without micro-slip components is assumed.
In addition, it is assumed that the contact area occurs in the undeformed guide surface. The assumption is therefore made of an ideally hard guide and a relatively soft track roller.
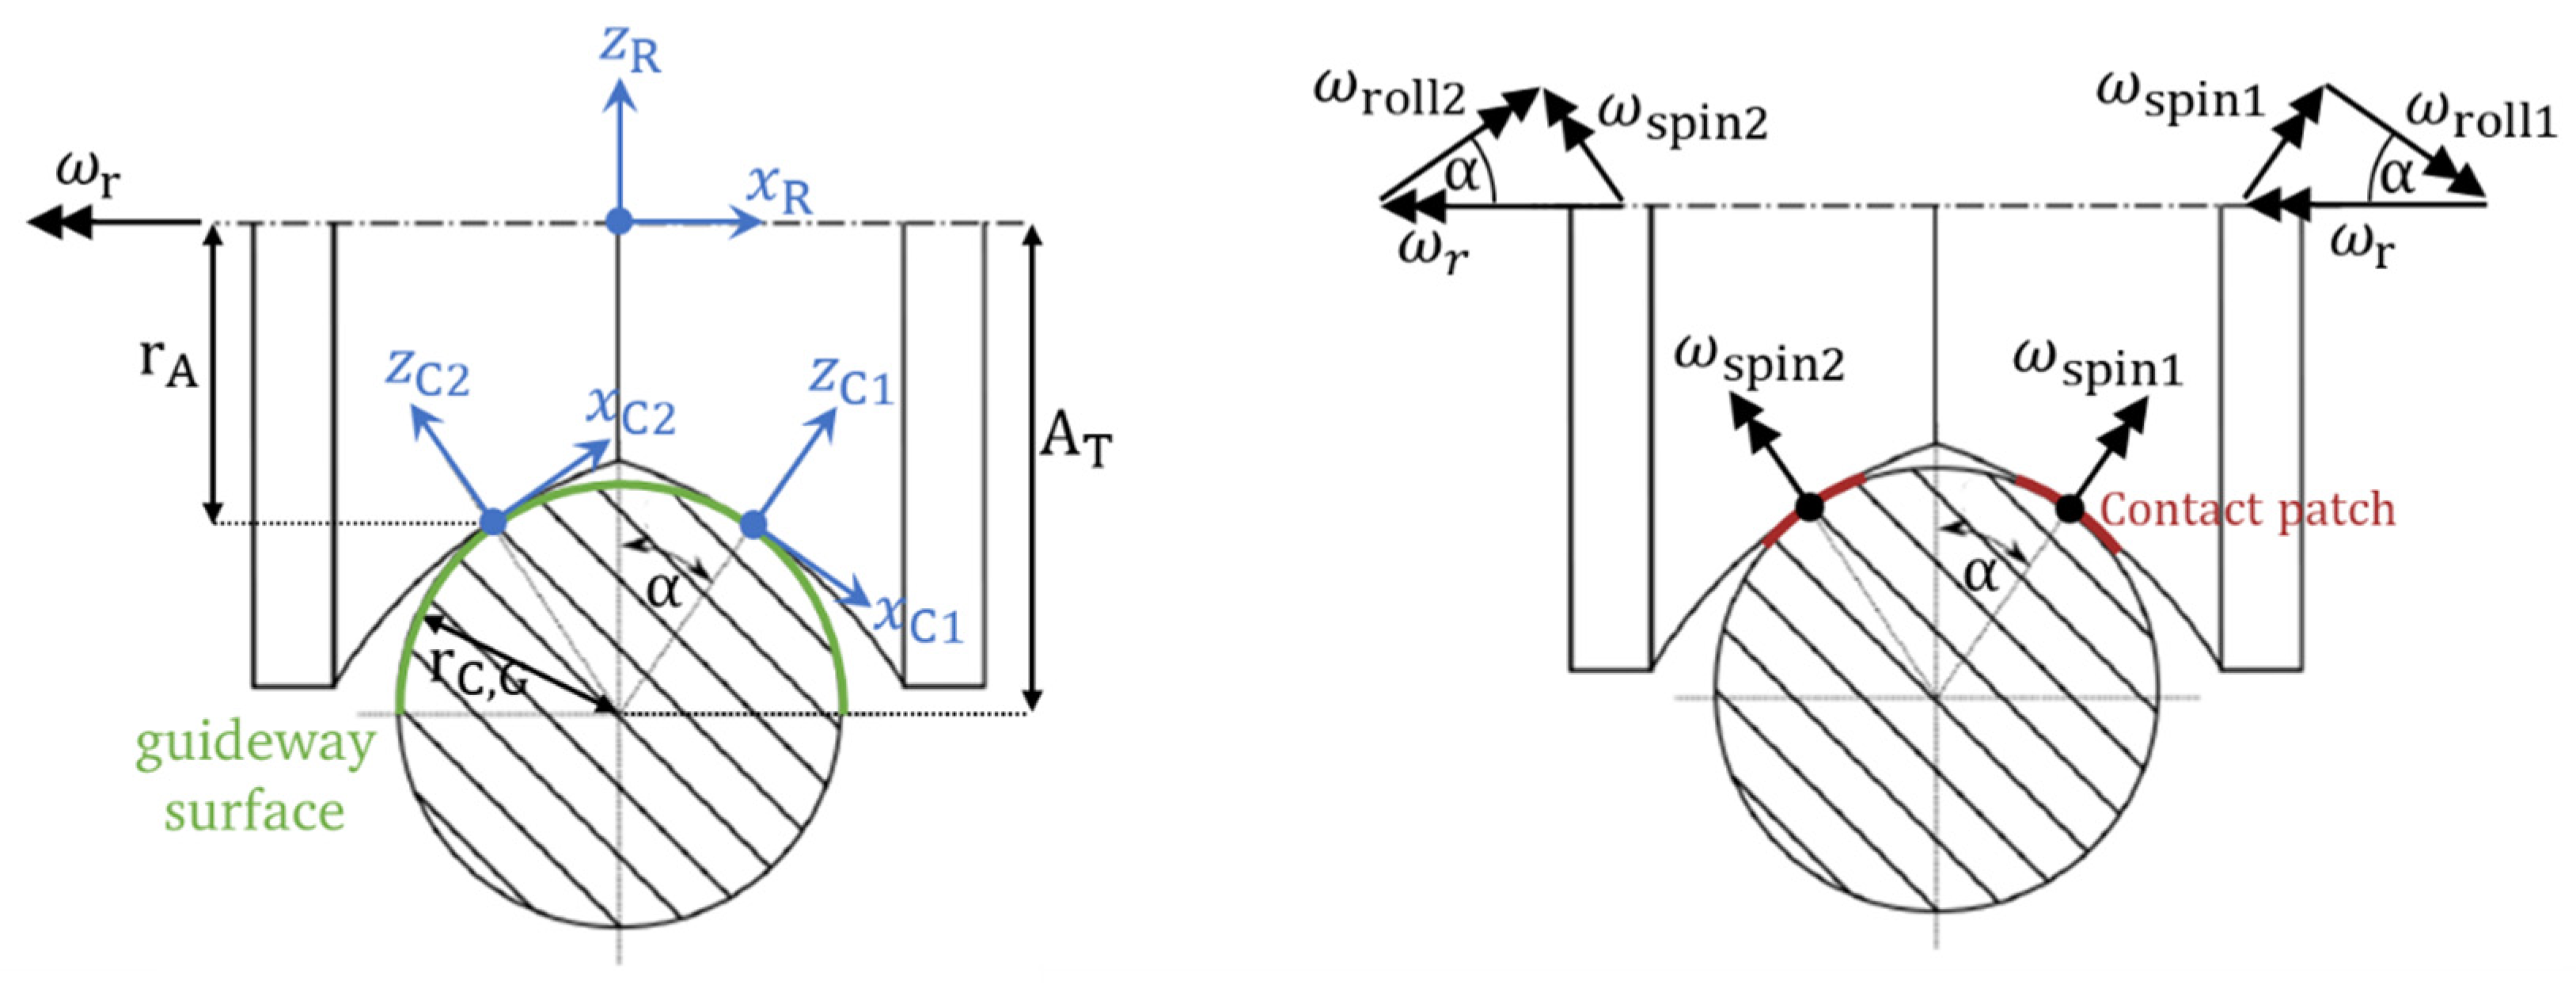
To describe the kinematics, and also for the later presentation of the results, the coordinate systems are first defined (
Figure 4, left). The R coordinate system (R-COS) is located on the central roller axis in the symmetry plane of the roller. The C coordinate systems (C-COS) are located in the center of each contact surface. The C1 coordinate system (C1-COS) is located in the positive
direction.
The relative velocities in contact are determined on the basis of the geometrically-induced drilling and rolling slip components. The decomposition of the angular velocities is shown in
Figure 4, right.
The angular velocity is first formulated as a vector in R-COS
The same applies to the radius
Thus, the velocity of the contact point in the R-COS can be described
The velocity of the contact point in the C-COS is obtained by rotation around the
axis
To be able to determine the relative velocity, the velocity of the guide in the C-COS must first be described
Thus the relative velocity can be calculated. Furthermore the R-coordinates are substituted by C coordinates
Comparisons with findings from the literature and comparative simulations have shown that further assumptions have to be made about the location of the spin center point in order to adjust the relative velocity distribution.
Since the contact surface is assumed to be an ideal plane, the relative velocities in the z-direction have no effect on the stresses induced by friction. For this reason, the relative velocity in z-direction is not considered further.
Assumption 1: Location of the Spin Center
As can be seen from the literature, the spin center point can be located inside or outside the contact, depending on the load case. It is therefore not coupled to the contact center point. According to Kalker’s PhD thesis [
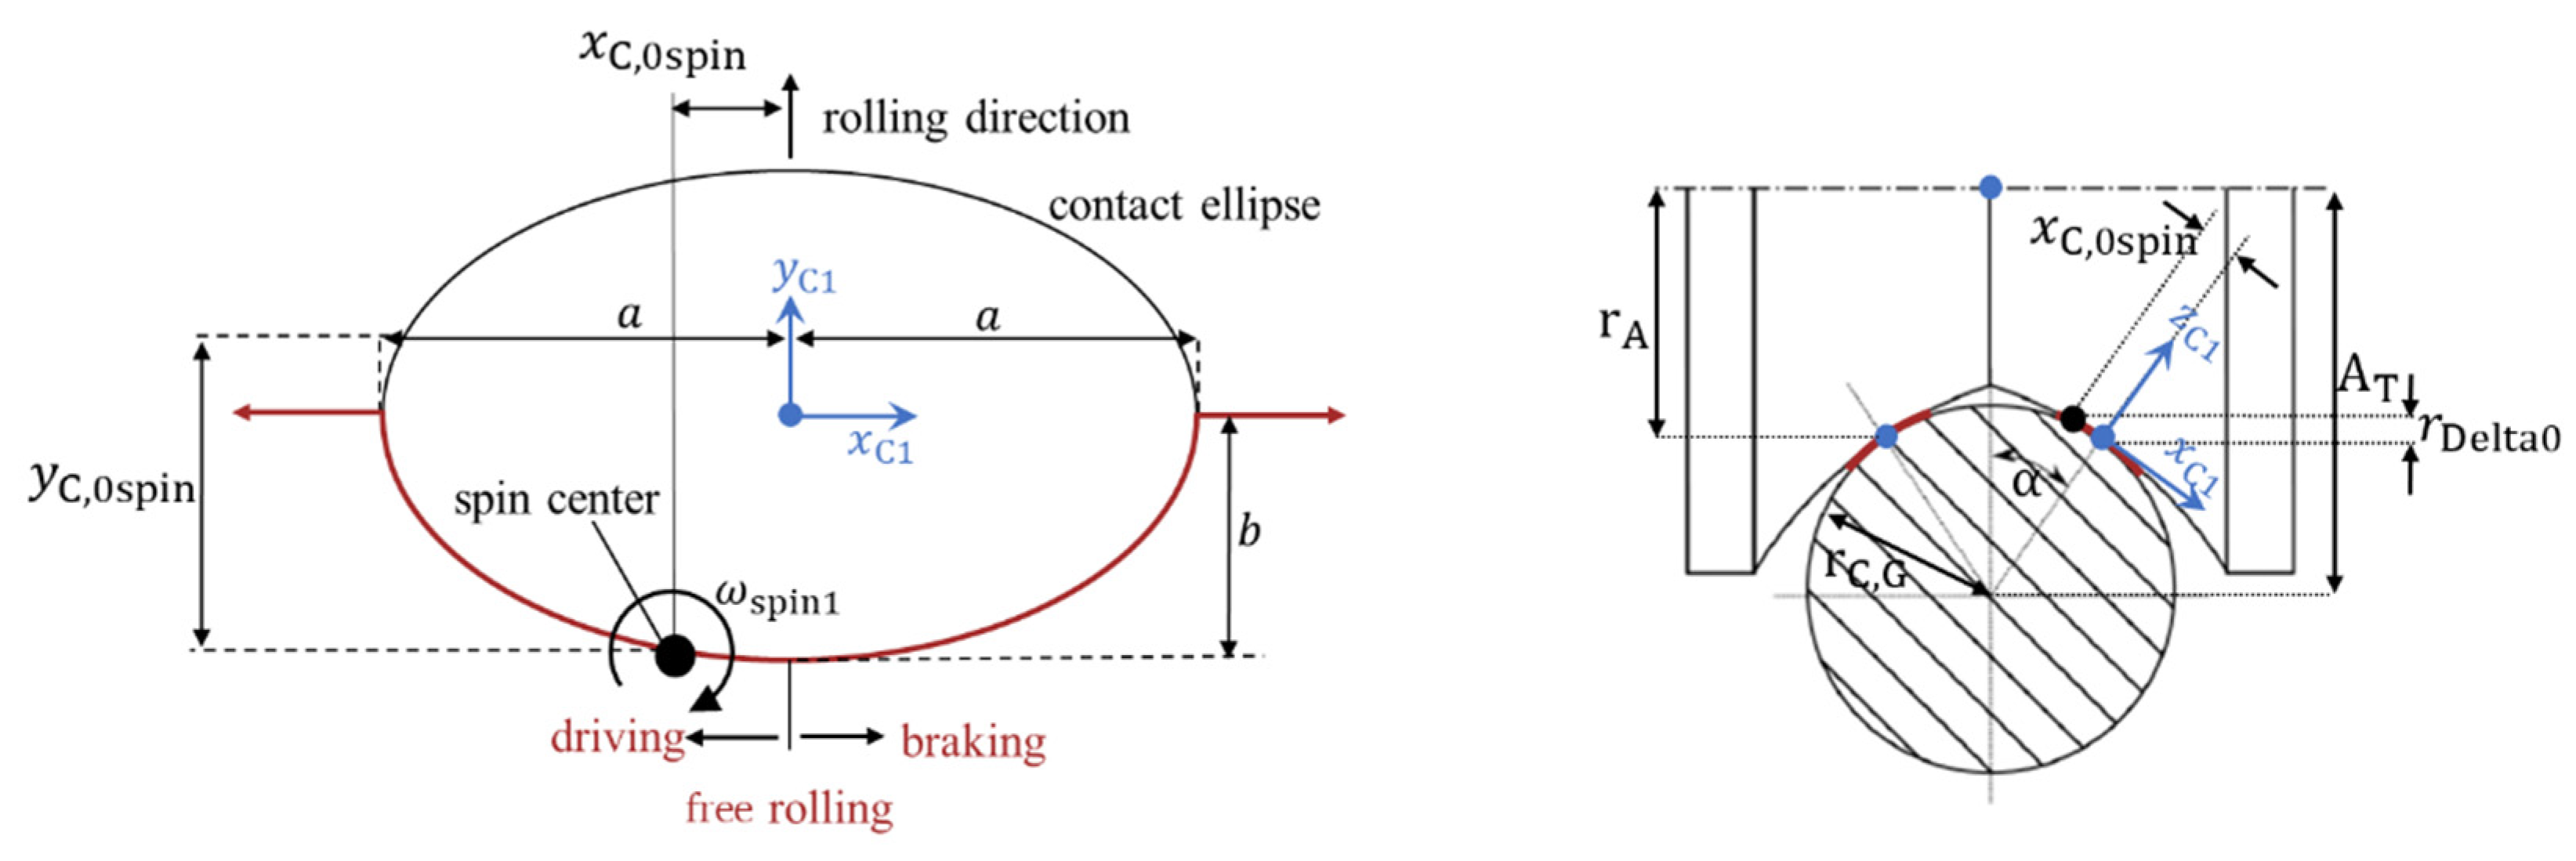
18], Lutz and Wernitz already made the assumption that the spin center is located on the contact edge. In the left part of
Figure 5 it is schematically shown how the spin center point shifts depending on the load situation in the contact area. The right part of
Figure 5 also shows the shifted spin center and the associated change in the theoretical rolling radius.
The displacement of the spin center can be formulated as follows
with
and
The assumption improves the distributions of the relative motion and the shear stresses, but the distributions do not yet match the observations from comparative simulations.
2.3. Stresses at the Contact Surface
The stress calculation is described below. The calculation of the pressure as described by Hertz [
10]
Condition for the calculation of the shear stresses with the assumption of total slip in the contact area, wherein
is the coefficient of friction
The coefficient of friction could also be replaced by more advanced models since it is often slip-velocity dependent
[
19]. However, this is currently not implemented. The program structure has to be slightly modified for this since the friction coefficient must then be determined iteratively.
Finally, for directional calculation of the surface tangential stresses, the relative velocity directions
and
are needed
This leads to the tangential stresses within the contact zone
With the help of the presented equations, the whole contact area can be described. These in turn form the input variables for the subsurface stress calculation.
Calculation Procedure
The actual calculation of the surface parameters is performed by an optimization process. The optimizer (Toolkit:
SciPy, scipy.optimize.brentq) iterates until the zeros of the quantity to be optimized are found. The drive torque is used for this purpose since it is uniquely specified. The difference between the calculated drive torque
and the specified drive torque
must be zero
The deviation of the actual rolling radius from the nominal rolling radius is used as input variable for the optimization function. is, thus, the variable to be iterated. The optimization iterations are stopped when the error falls below a limit value.
3. Results
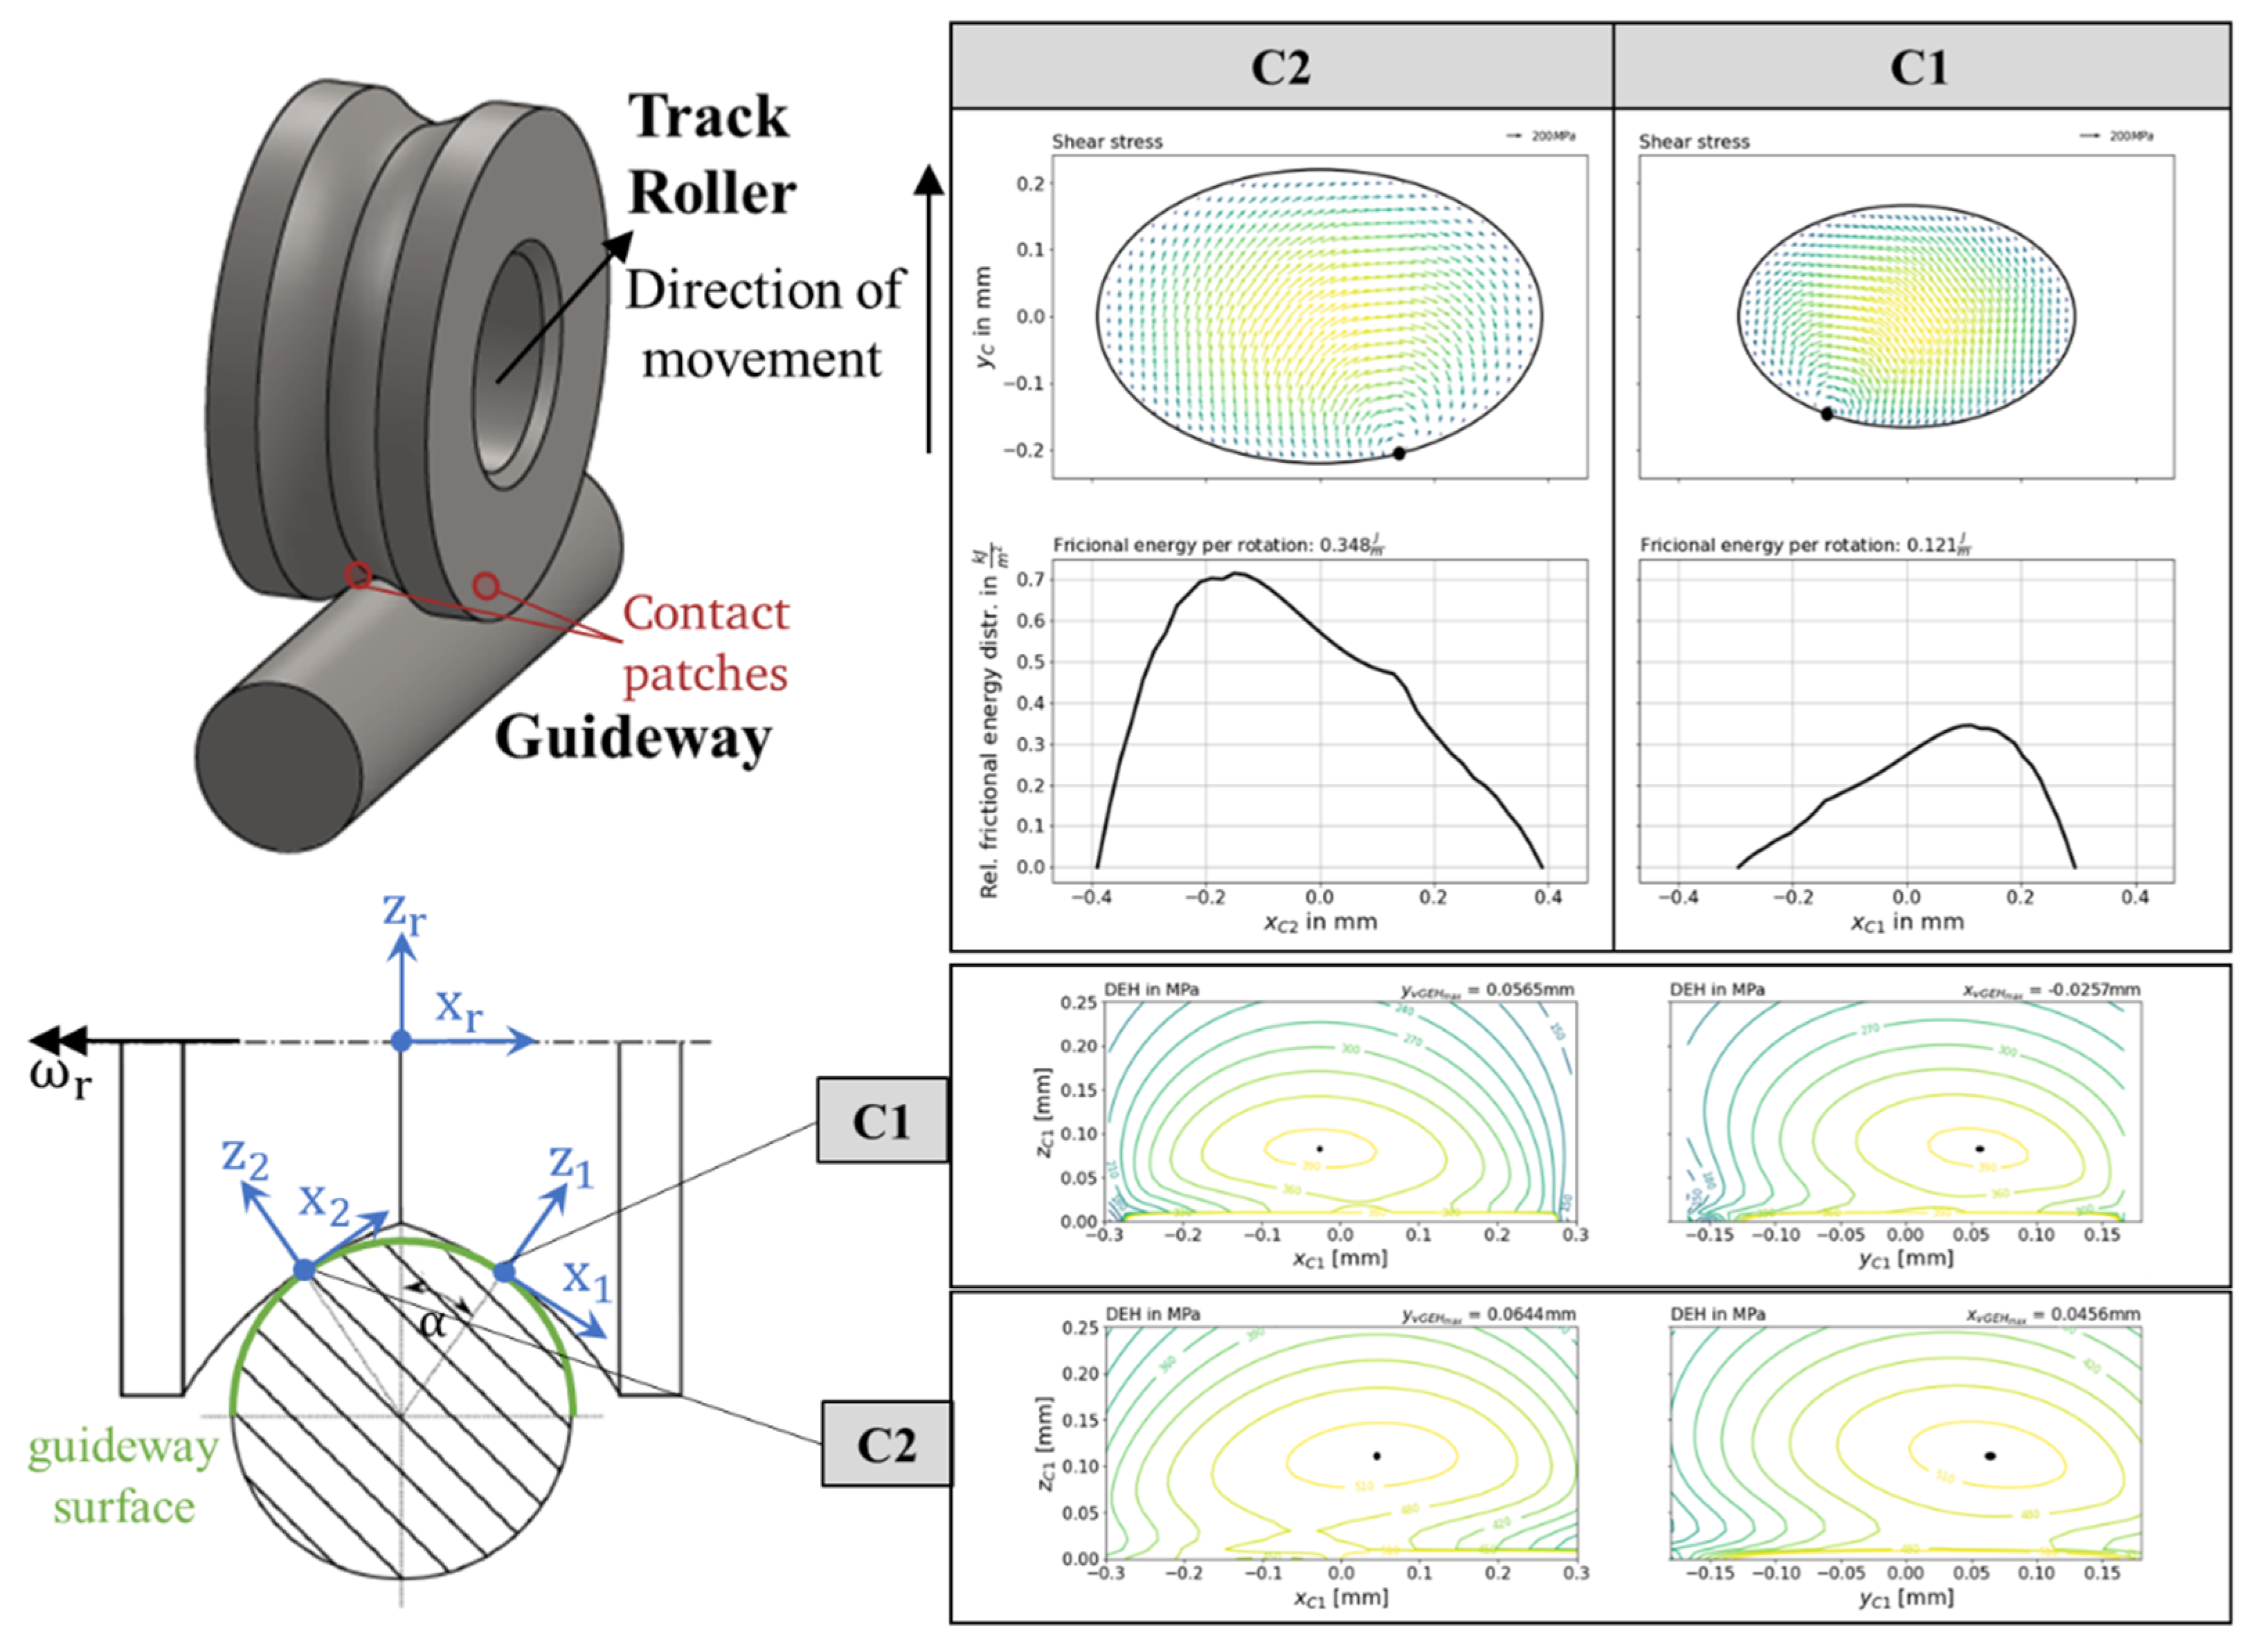
With the help of the presented calculation model, different results regarding the contact area and the material stress can be generated. An exemplary output is shown in
Figure 6. This can be seen as a guide to the interpretation of the output graphs when using the actual program. The first output is a multi-plot that contains the shear stress distributions of both contact patches and the relative frictional energy distribution. Furthermore, in the tangential stress distribution, the spin center is represented as a black point. In addition, the stress distributions below the surface are plotted in two section planes.
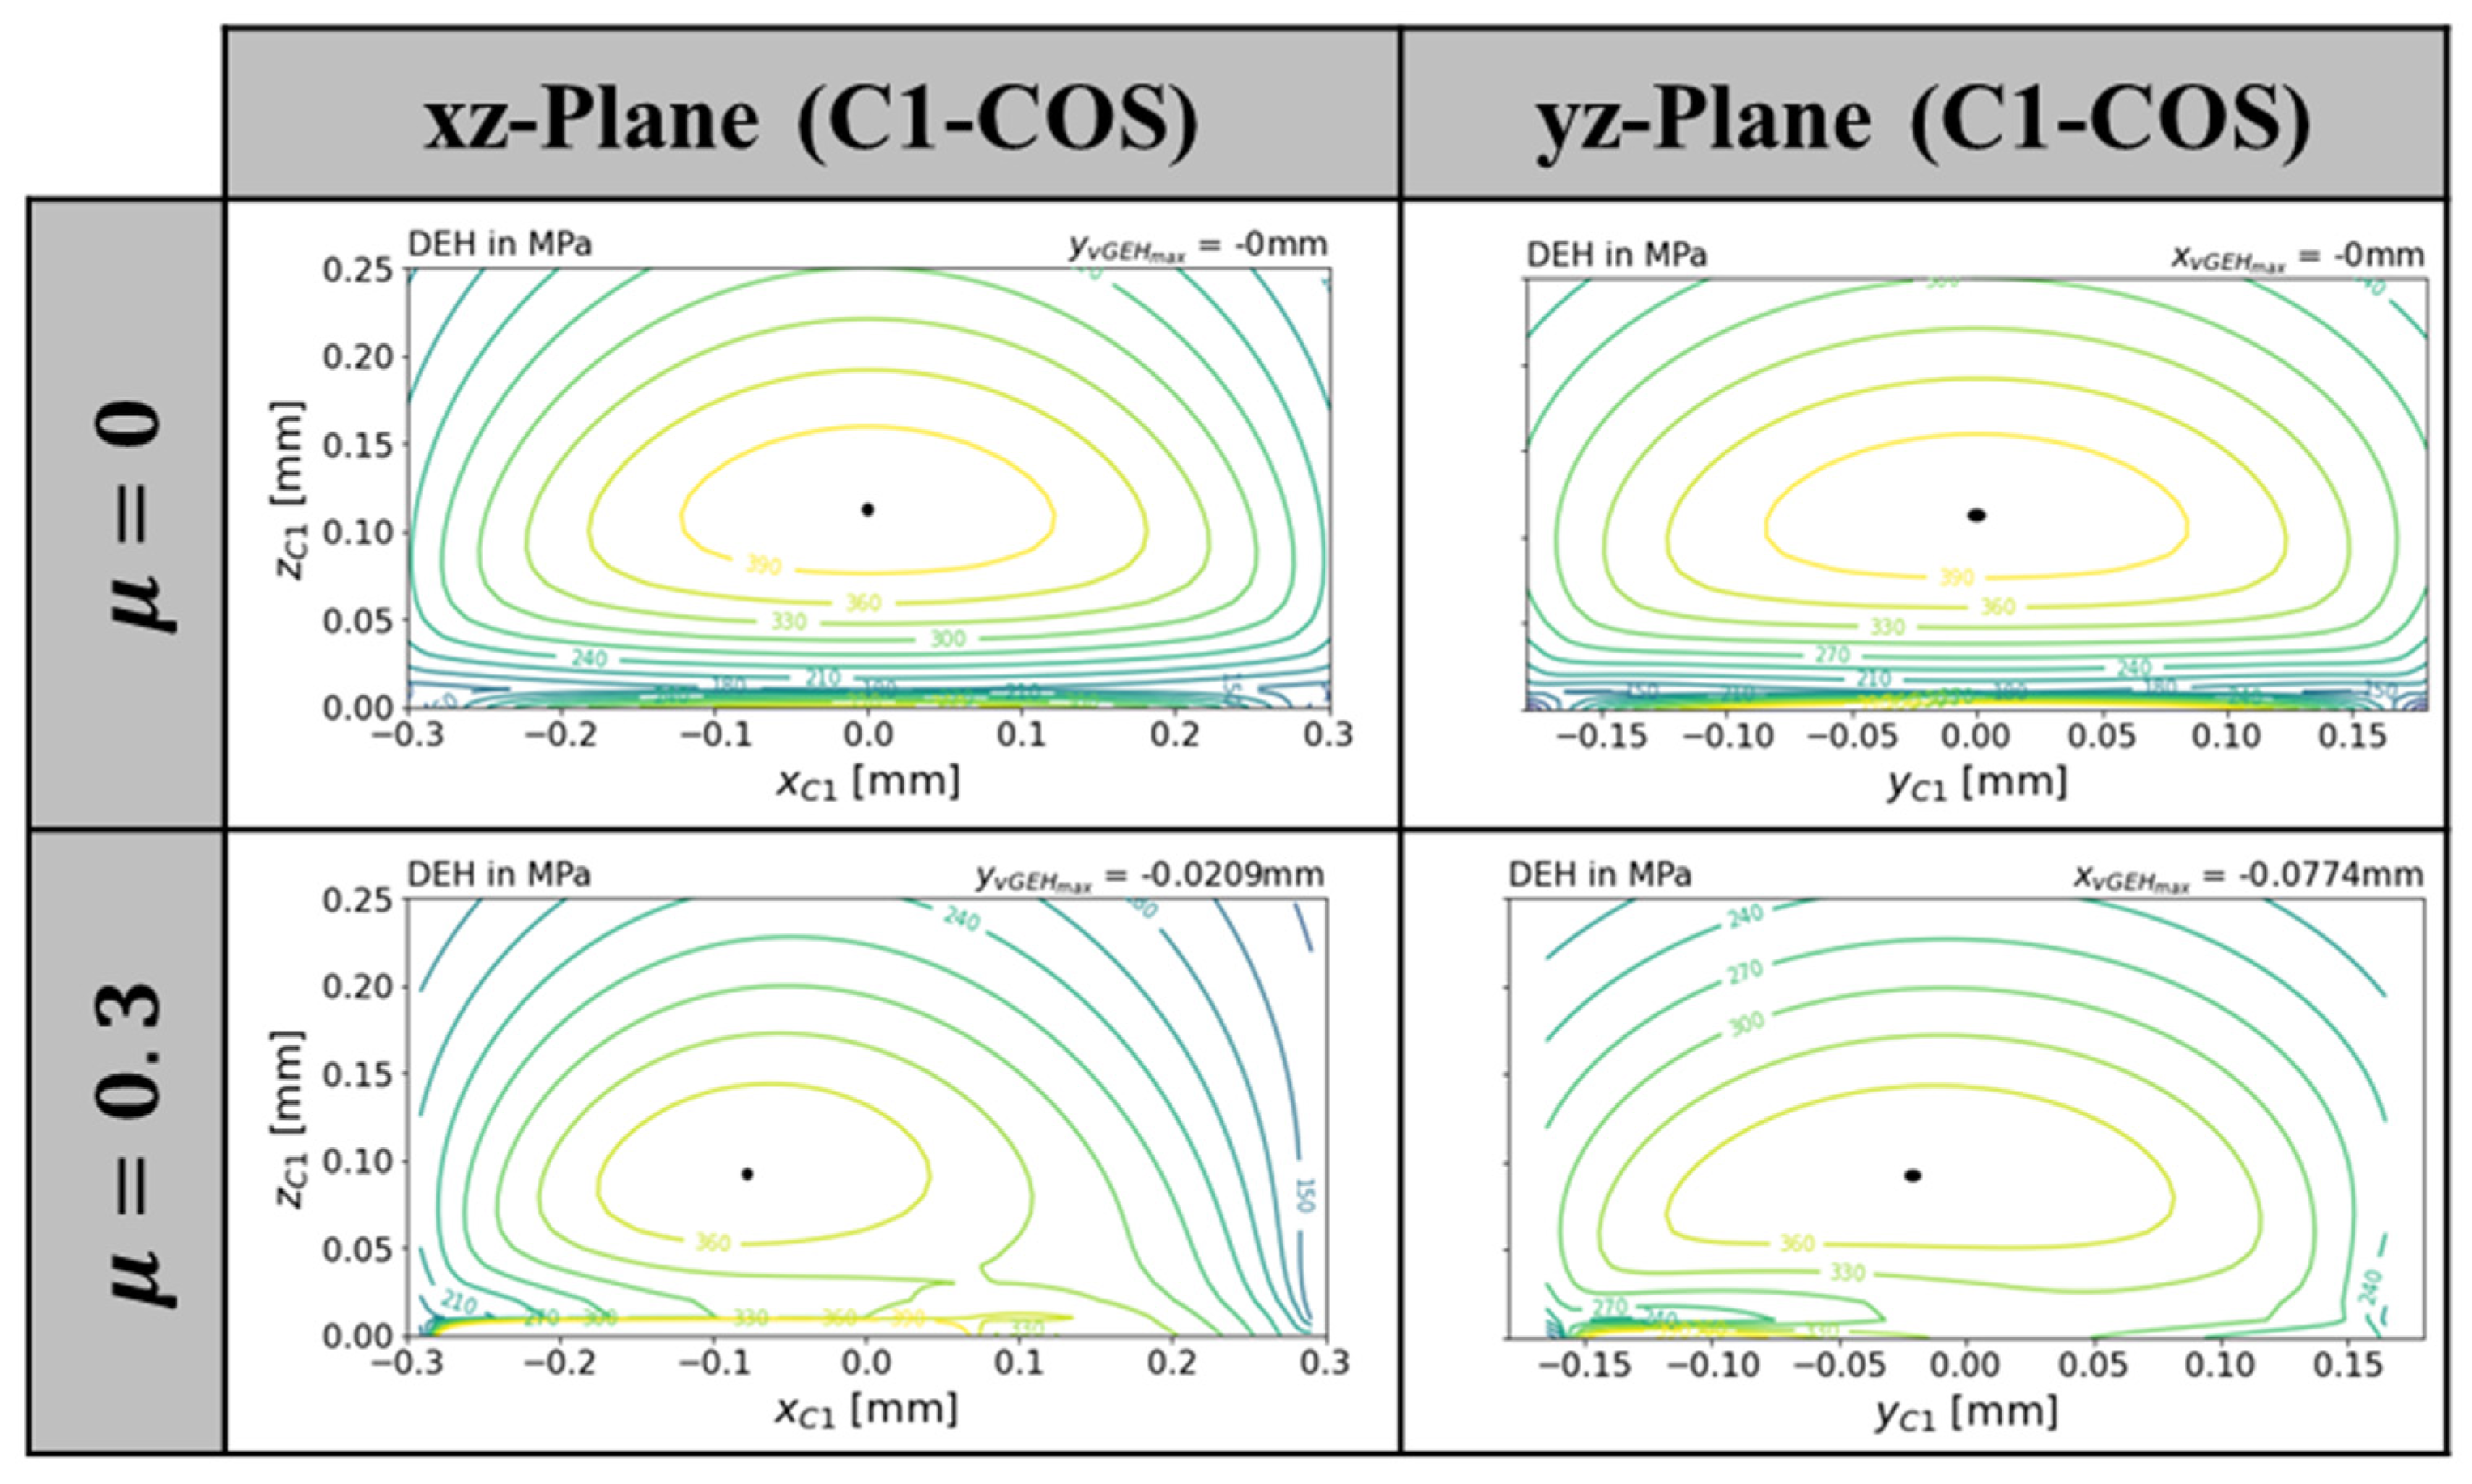
Figure 7 shows the equivalent stress distribution below the surface for a frictionless (
cannot be set to 0 due to the formulation of the equations in the current program version) condition. It can be seen that the stress maximum is below the surface, as expected. In
Figure 7 below, the same calculation has been carried out for increased friction. As already described by Hamilton and Goodman [
20] (only pure sliding in one direction), a shift in the stress field can be detected due to the increased friction. For very small z values (
), inaccuracies occur. Thus, it is recommended to consider the values near the surface only qualitatively.
Since the calculation is performed numerically, a suitable discretization must be set. Higher discretization leads to more accurate results and fewer jumps in the near-surface regions, but the computation time increases. However, the differences below the surface are small, so a lower discretization is sufficient for the regions far from the surface.
Table 2 lists the differences between a high and a low discretization. The equivalent stress value differs only marginally, while the calculation duration for the low discretization is significantly lower.
Here, is the discretization count on the surface, , and are the discretization counts for the subsurface stress calculation; is the calculation duration for the simulation and is the maximum equivalent stress value.
The results show that the contact surface stresses as well as the subsurface stresses can be calculated within an adequate time of approximately 2 min (Intel Core i5-6200U CPU 2.30 GHz). Additionally, the influence of increased friction can be shown.
4. Discussion
For the discussion of the results, the simulation results from the presented project are compared with an established software for the calculation of contact mechanical and tribological issues. CONTACT is used as the comparison software. The calculation is performed with the help of CONTACTs Module 1 [
9]. In contrast to the algorithm of the project presented within this article, where the two contact locations are predefined, CONTACT is able to find the contact patches automatically based on the contour geometry. The two calculations thus differ in this modelling aspect. The same case is calculated with both programs:
.
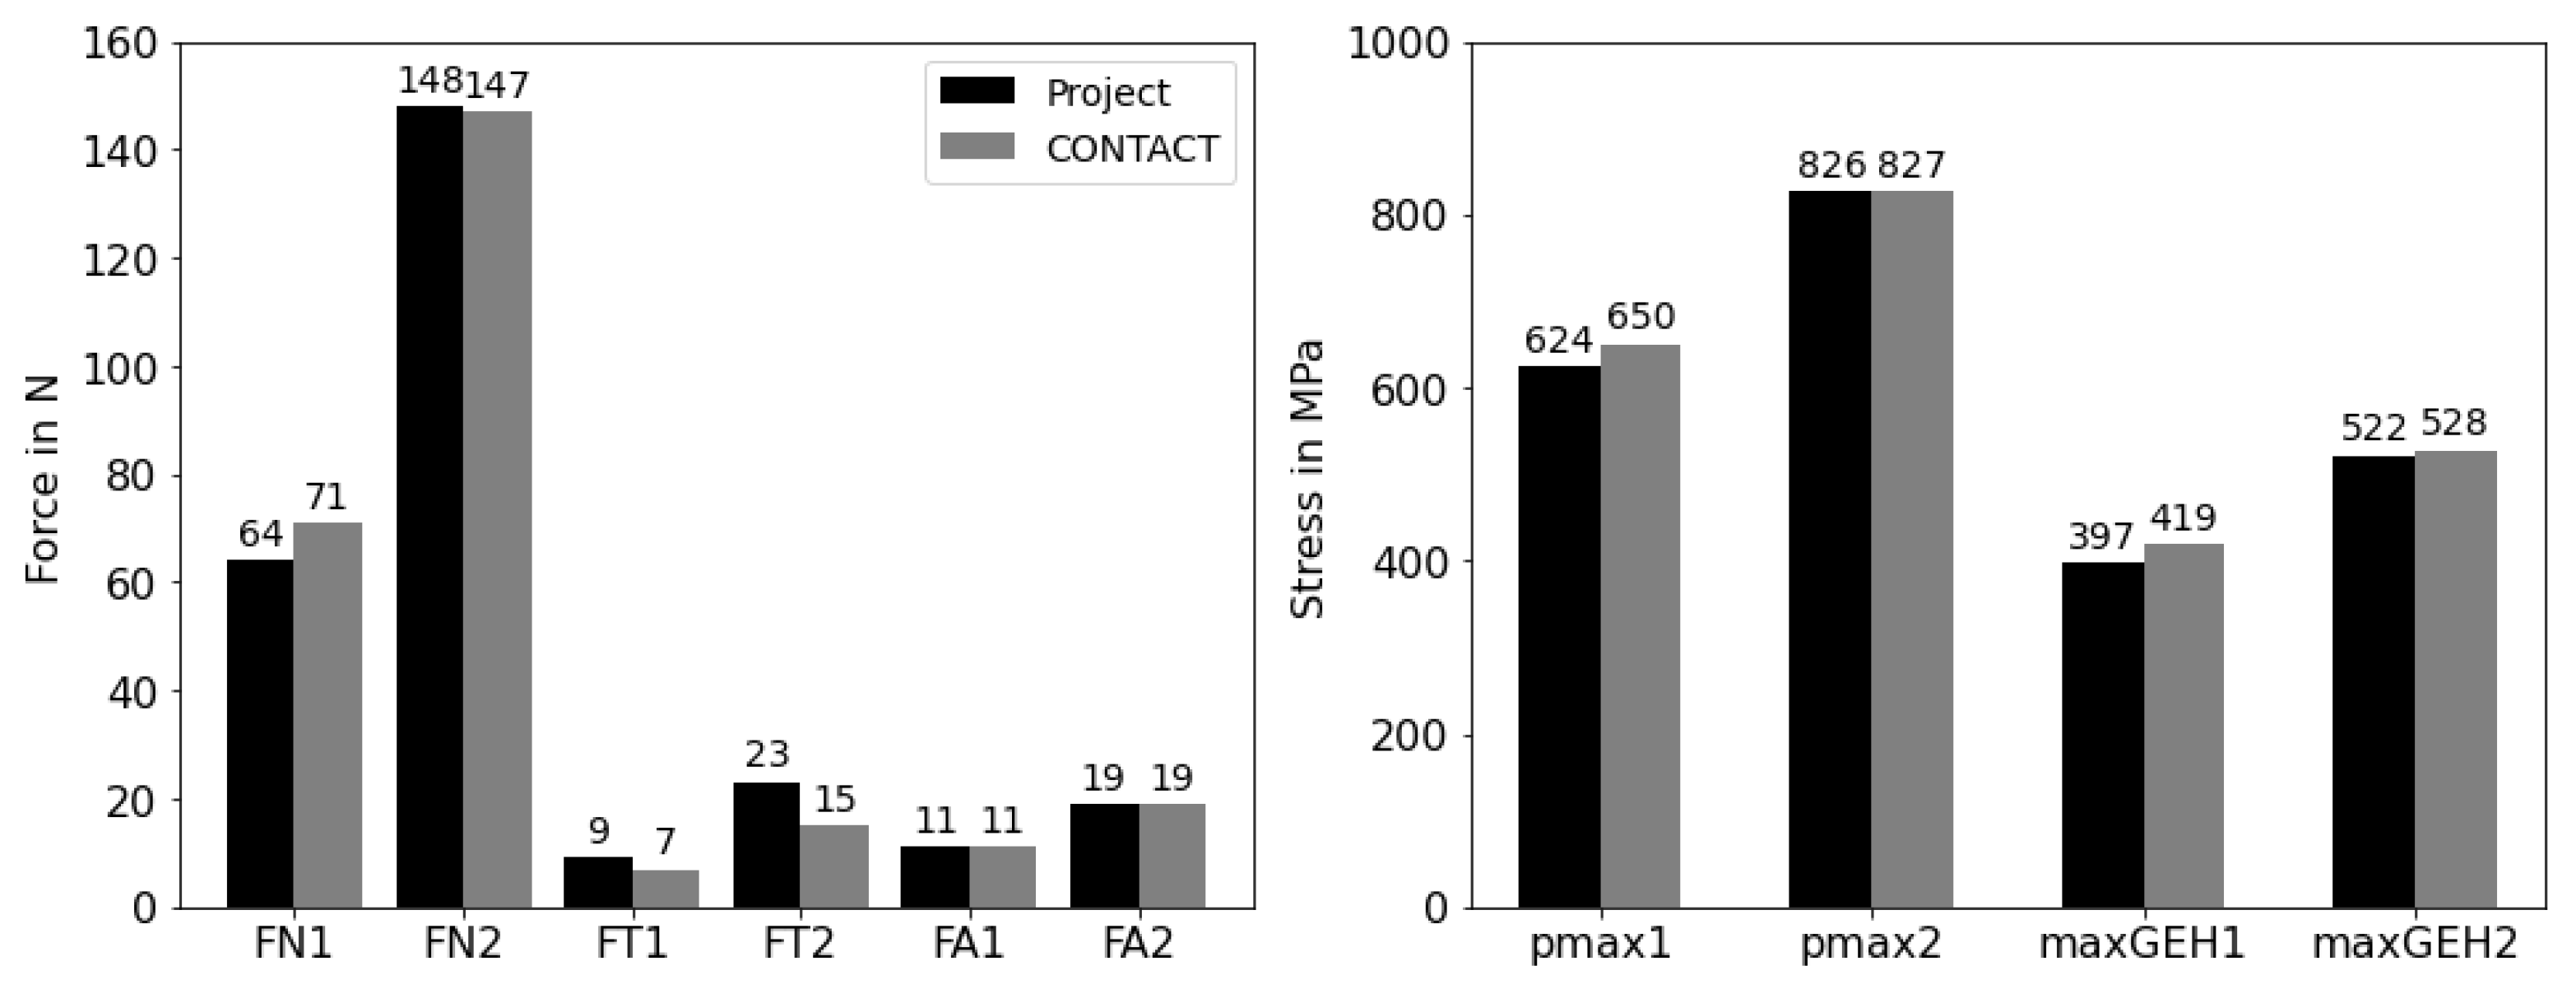
In particular, the comparison of the contact forces and maximum stresses shows that the results are very close to each other (
Figure 8). The largest deviation is shown by the force
. The reason for this difference can be seen in
Figure 9. The shear stresses have both positive and negative components. In the solution calculated with CONTACT, the negative shear stress components are larger, which is why the force is smaller in total.
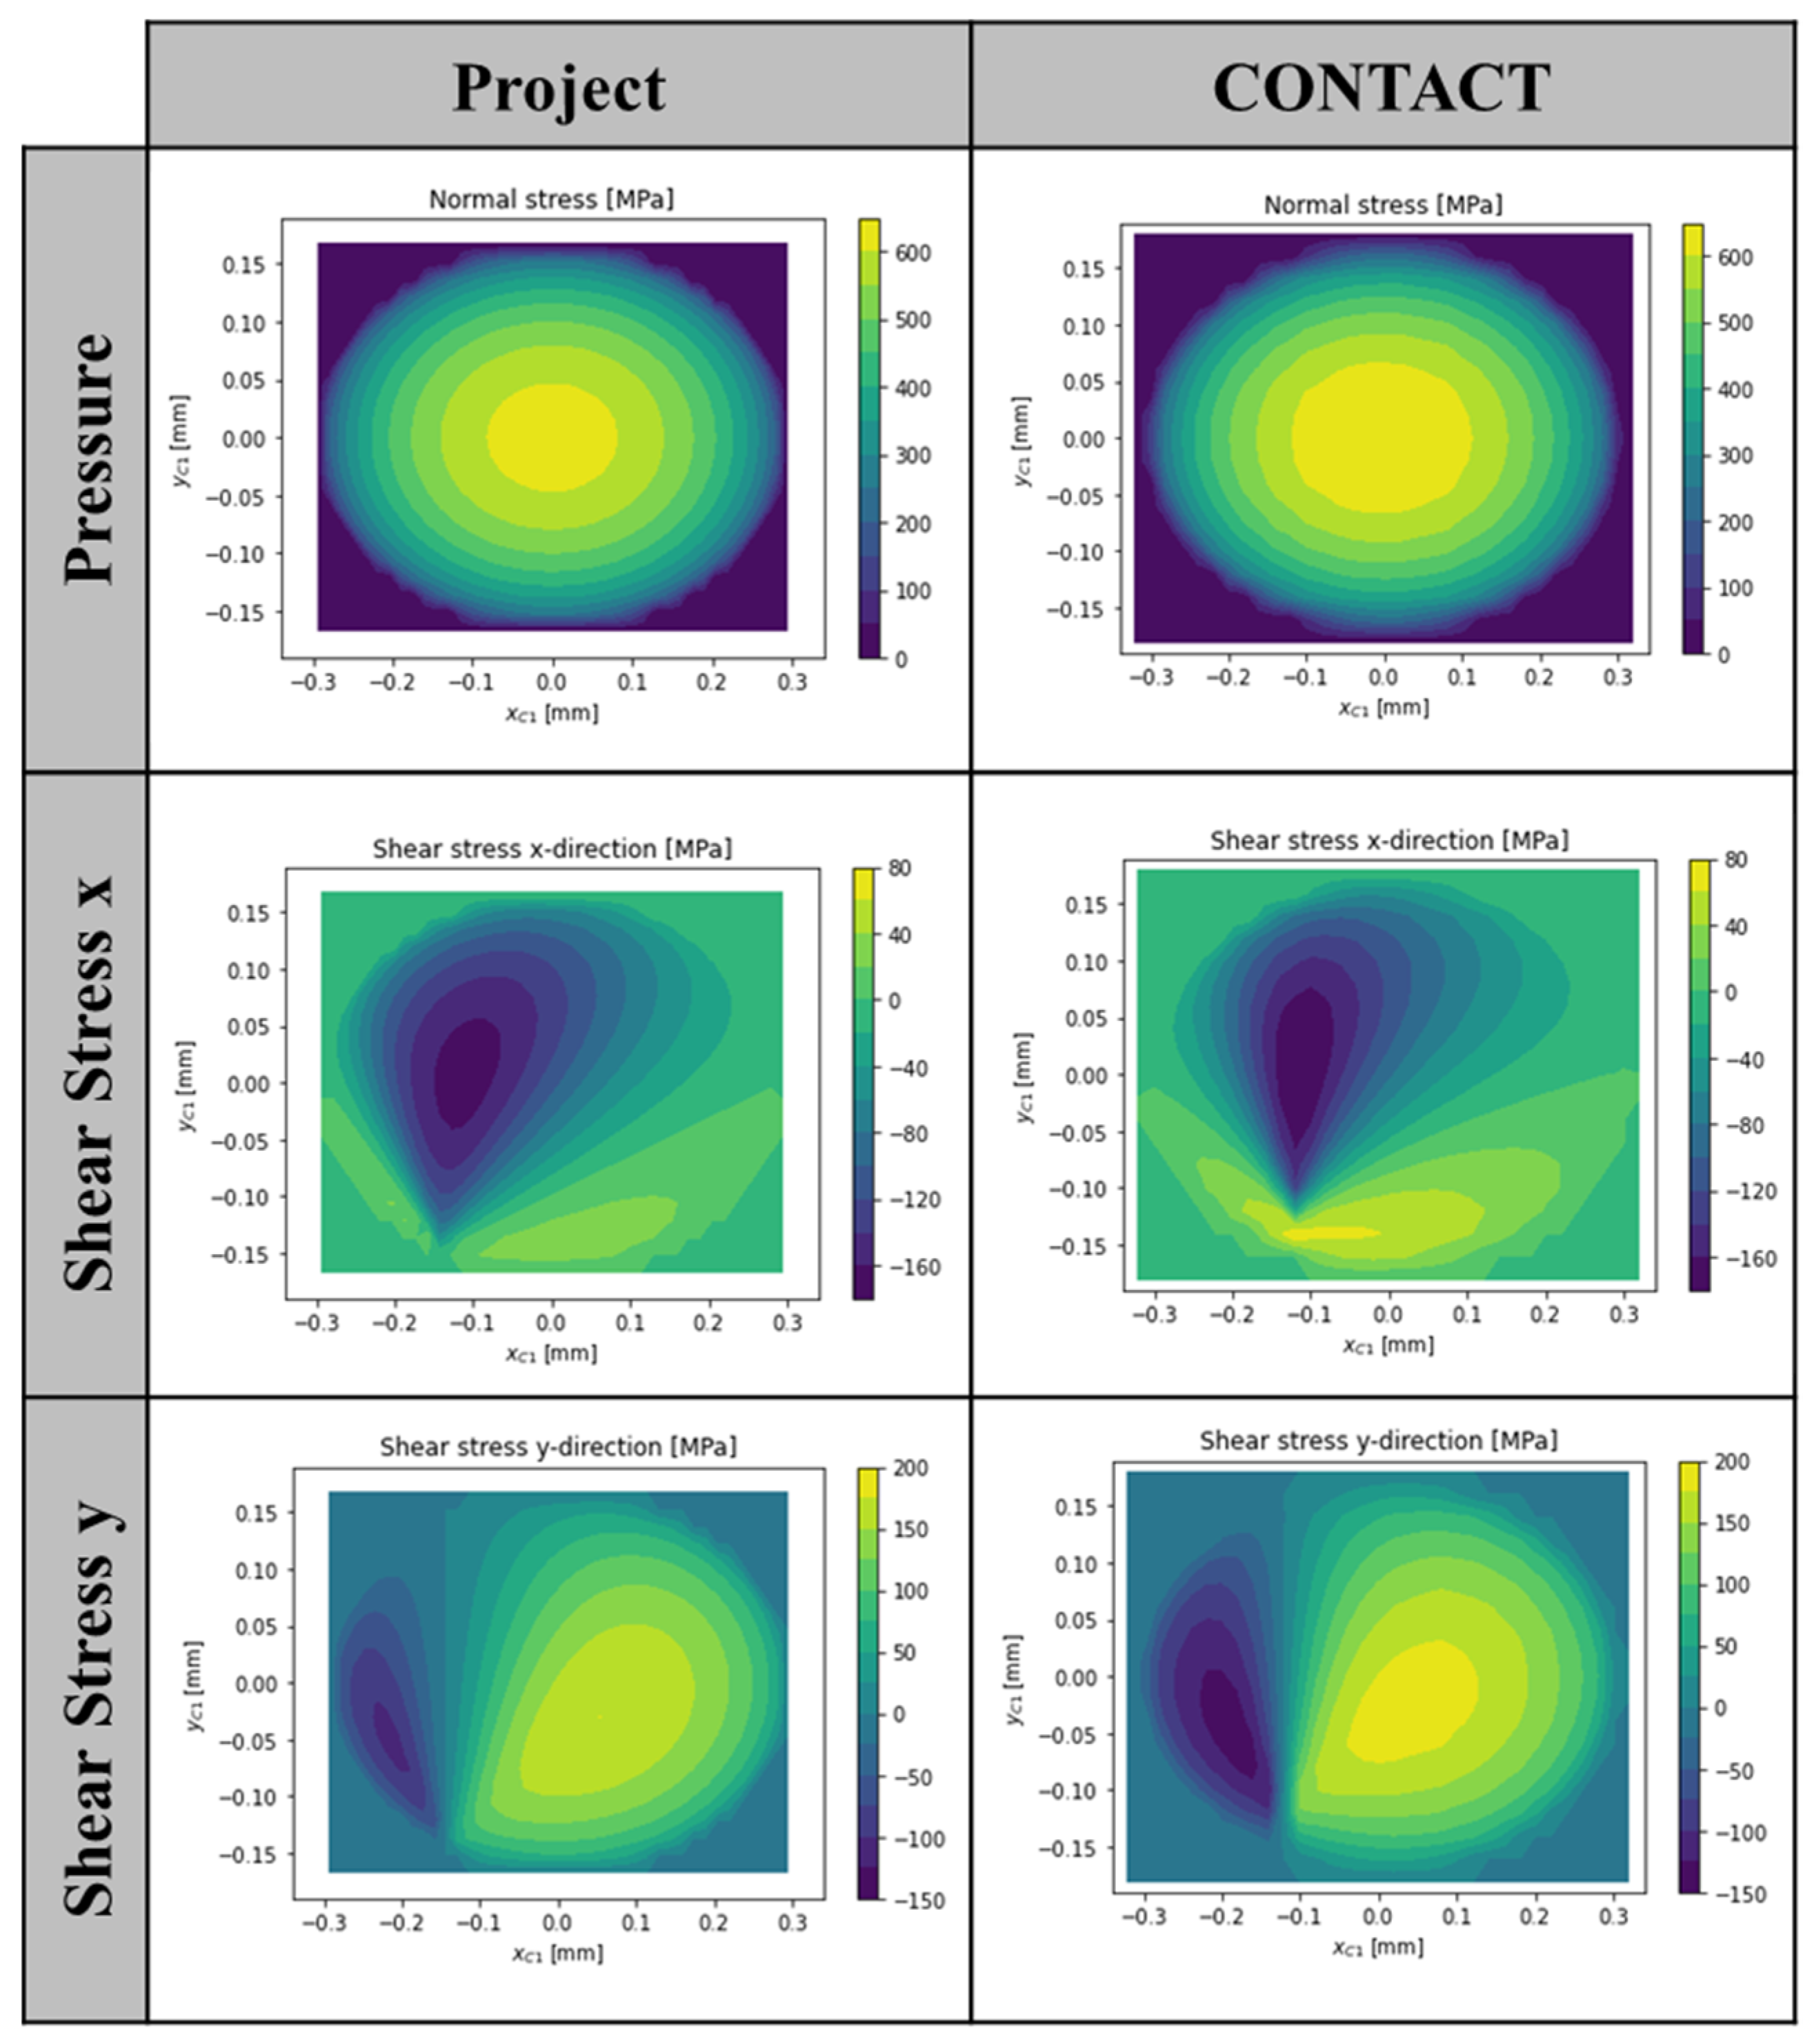
A comparison of the normal and tangential stresses is shown in
Figure 9. It can be seen that the basic distributions of the stresses are very similar. As already described, the largest difference is seen in the shear stress perpendicular to the rolling direction (x-direction). This can be explained by the position of the spin center.
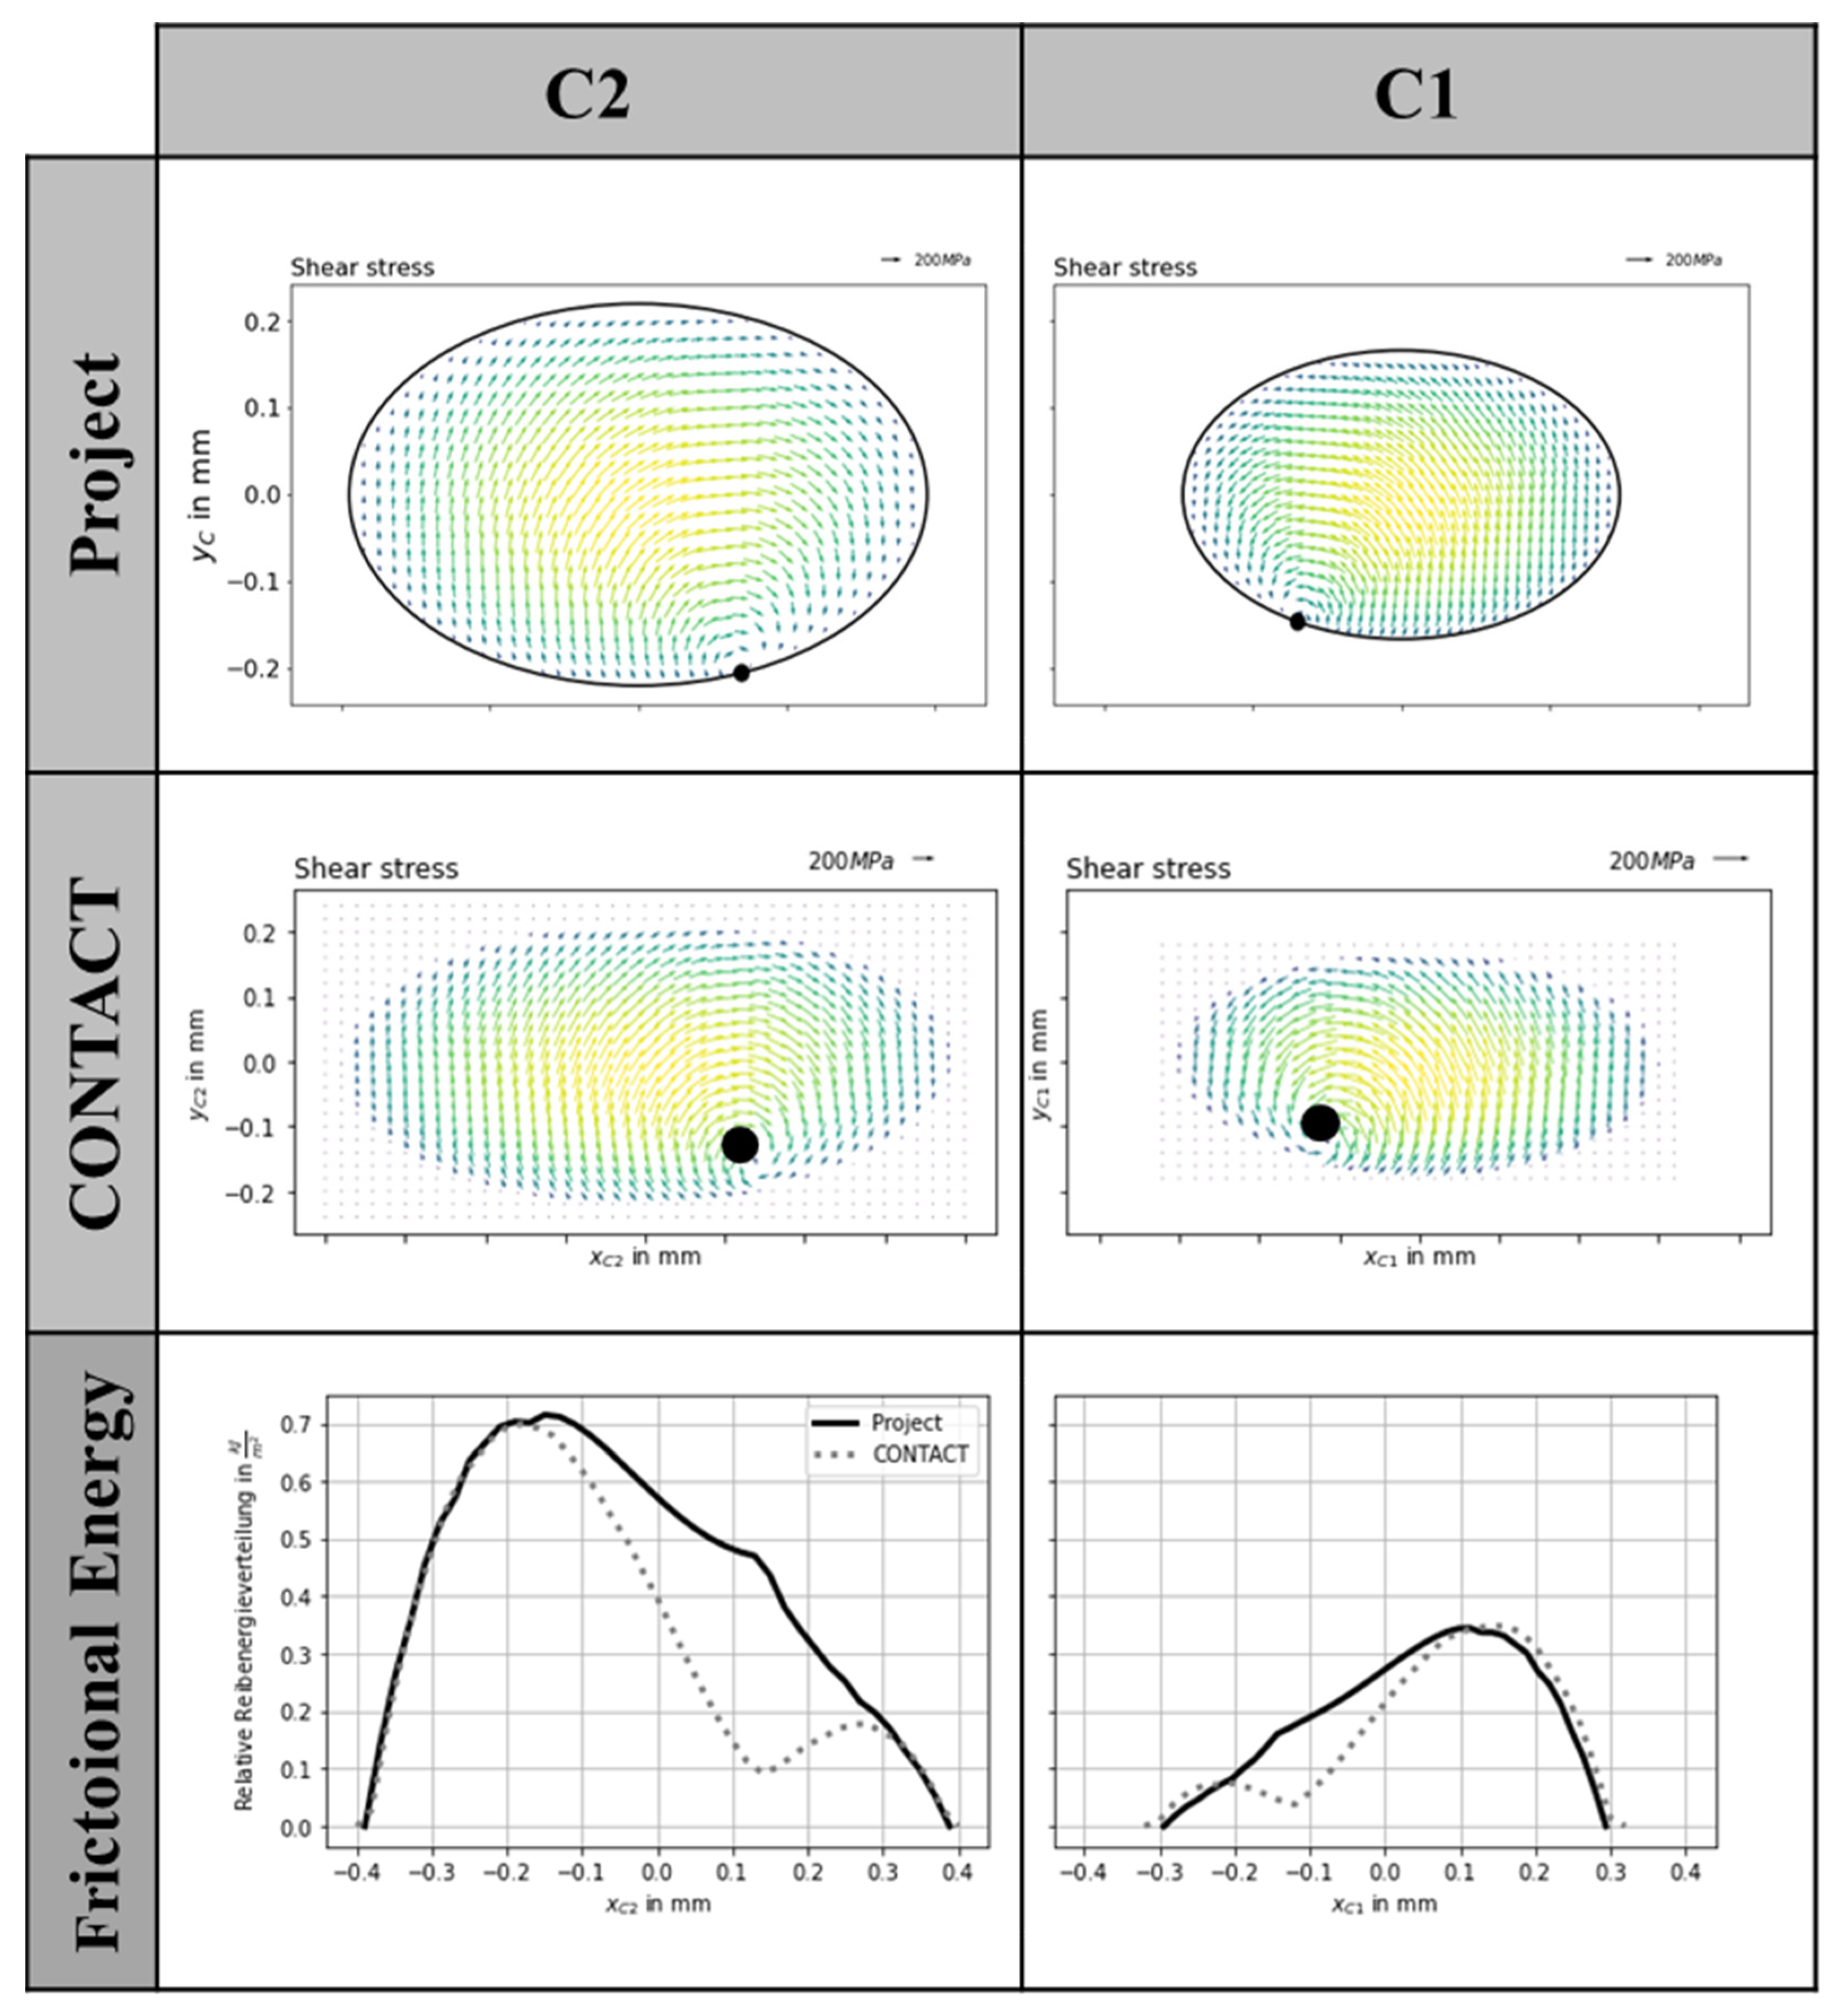
With the help of the directional representation of the shear stress distribution (top of
Figure 10), it can be clearly seen that the assumptions made are plausible. The position of the spin center can also be found in the CONTACT results; however, it is not located on the edge of the ellipse but is shifted further towards the interior of the contact surface. The main difference is mainly in the relative velocity distribution around the spin center. CONTACT calculates the velocities iteratively and can distinguish between sliding and adhesion areas. Around the spin center, there are only very low to no relative velocities. This difference significantly influences the distribution of the frictional energy.
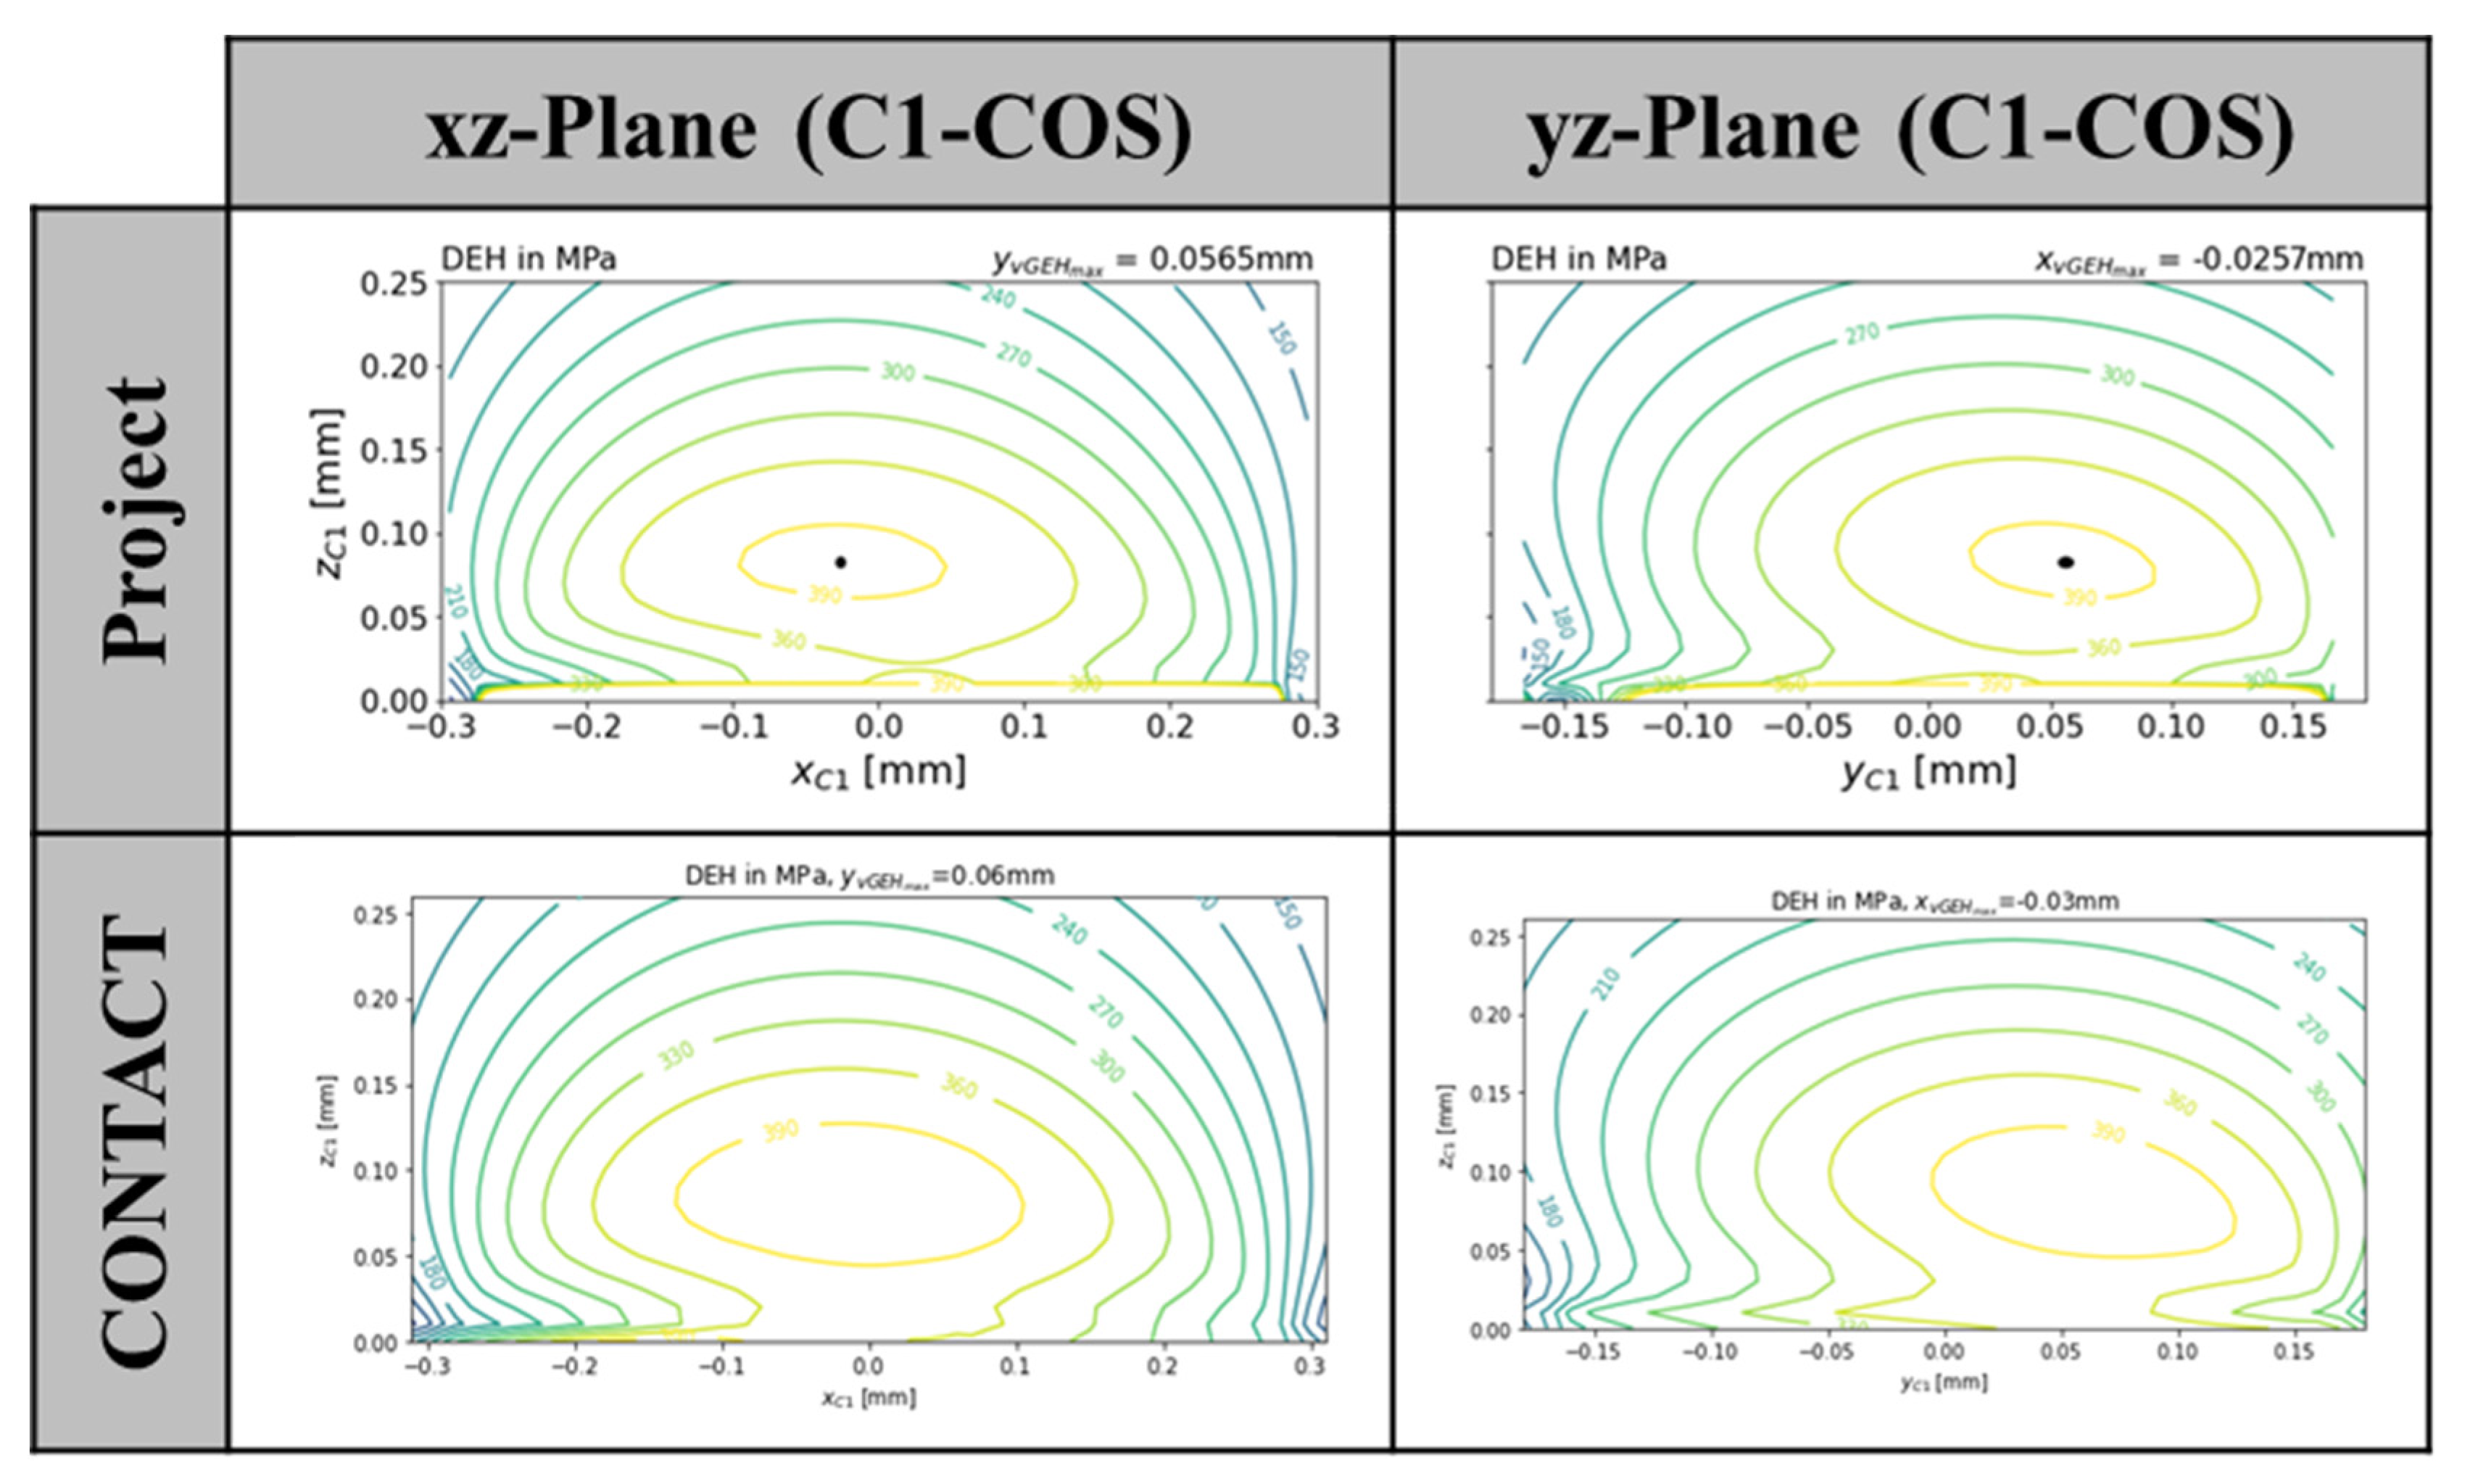
The comparison of the equivalent stresses is shown in
Figure 11. As with the stress distribution at the contact surface, there are only very slight differences here. In particular, the position and the height of the maxima are very close to each other. The weaknesses of the presented program are mainly in the areas close to the contact surface. Inaccuracies occur here.
5. Conclusions
The project presented takes up the existing state of research on the design of track roller guideways and extends it to include existing contact mechanics models so that more in-depth statements can be made on the stress state of the contact pairs, such as the influence of increased friction. The model can be used primarily for basic evaluation and the predetermination of locating bearing track roller guidance systems with two-point contacts. Through the combination of analytical description and open-source code, every step of the calculation, and thus also the results, can be reproduced. The presented calculation model therefore closes the gap in the state of research and can be used as a basis for the interpretation of more in-depth analyses with commercial software. Due to the disclosure of the entire source code, other interested parties can also use only parts of the code for their own projects and questions, such as the calculation of the subsurface stresses.
However, especially when describing the relative velocities in the contact zone, further assumptions are made to correct the simple analytical description. Despite this correction, there are still deviations in comparison to more advanced commercial software, especially in the case of the frictional energy. From the authors’ point of view, the calculation model is thus mainly suitable for surface stress calculation and determination of the equivalent stresses below the surface. To obtain more accurate results for the stress values for small z values, the calculation procedure must be further optimized.
The model can also be used to calculate material pairings with different materials. Here, the comparison with established commercial software showed that, although the shape deviates further from the ideal ellipse with increasing contact areas, there is still very high agreement in the stresses.
Due to the poor data situation in the current state of research, experimental investigations are being sought in order to further evaluate the model. For the development of a universal calculation model for track roller guidance systems, the extension to non-Hertzian contacts is necessary. From the authors’ point of view, this is associated with a high development and programming effort. However, due to the modular structure of the source code, it would be possible to replace the contact area calculation and the relative velocity calculation with more complex models, such as Kalker’s theory.
Author Contributions
Conceptualization, J.W. and C.B.; methodology, C.B. and J.W.; software, C.B., J.W. and A.K..; validation, J.W., C.B. and A.K.; formal analysis, C.B.; investigation, J.W. and C.B.; resources, J.W., C.B. and A.K.; data curation, J.W.; writing—original draft preparation, J.W.; writing—review and editing, J.W., C.B., A.K. and E.K.; visualization, J.W., C.B. and A.K.; supervision, E.K.; project administration, J.W.; funding acquisition, E.K. and J.W. All authors have read and agreed to the published version of the manuscript.
Funding
This research was funded by the Country of Hesse (Program: Distr@l), grant number 493 20_0039_A2. The authors would like to thank the Country of Hesse for funding this project.
Institutional Review Board Statement
Not applicable.
Informed Consent Statement
Not applicable.
Data Availability Statement
Not applicable.
Conflicts of Interest
The authors declare no conflict of interest.
References
- Popov, V.L. Kontaktmechanik und Reibung; Springer: Berlin/Heidelberg, Germany, 2015. [Google Scholar]
- Kunz, J. Zur kontaktmechanischen Auslegung von Kunststoff-Laufrollen. In Konstruktion; Springer: Berlin/Heidelberg, Germany, 2007; Volume 3, pp. 154–196. [Google Scholar]
- Nölke, H. Zur Beanspruchbarkeit bei Hertzschen Pressungen. Stahlbau 2009, 78, 47–55. [Google Scholar]
- Wenzel, J.; Neu, M.; Kirchner, E. Erweiterung der Auslegung von Festlager-Laufrollenführungen bei trockenem Kontakt. Tribol. Schmier. 2019, 66, 40–47. [Google Scholar]
- Wenzel, J.; Neu, M.; Kirchner, E. Auslegung und Zustandsüberwachung ungeschmierter, angetriebener Laufrollen. Tribol. Fachtag. 2020, 61, 24/1–24/10. [Google Scholar]
- Schork, S.; Kirchner, E. Defining requirements in prototyping: The holistic prototype and process development, DS 91. In Proceedings of the Nord Design, Linköping, Sweden, 21–24 May 2018. [Google Scholar]
- Kalker, J.J. Three-dimensional elastic bodies in rolling contact. J. Appl. Mech. 1993, 60, 255. [Google Scholar] [CrossRef]
- Knothe, K.; Stichel, S. Rail Vehicle Dynamics; Springer: Cham, Switzerland, 2017. [Google Scholar]
- Vollebregt, E.A.H. User Guide for CONTACT, Rolling and Sliding Contact with Friction; v20.2; Vtech CMCC: Rotterdam, The Netherlands, 2020; Available online: https://www.cmcc.nl/software/documentation/ (accessed on 1 June 2022).
- Hertz, H. Über die Berührung fester elastischer Körper. J. Reine Angew. Math. 1881, 92. Available online: https://home.uni-leipzig.de/pwm/web/download/Hertz1881.pdf (accessed on 1 June 2022).
- Hamrock, B.J.; Dowson, D. Ball Bearing Lubrication; John Wiley & Sons: Hoboken, NJ, USA, 1981. [Google Scholar]
- Birkhofer, H.; Kümmerle, K. Feststoffgeschmierte Wälzlager; Springer: Berlin/Heidelberg, Germany, 2012. [Google Scholar]
- DIN 50100. In Schwingfestigkeitsversuch—Durchführung und Auswertung von Zyklischen Versuchen mit Konstanter Lastamplitude für Metallische Werkstoffproben und Bauteile; Beuth Verlag: Berlin, Germany, 2016; Available online: https://www.beuth.de/de/norm/din-50100/263107018 (accessed on 1 June 2022).
- Johnson, K.L. Contact Mechanics; Cambridge University Press: Cambridge, UK, 1985. [Google Scholar]
- Nikas, G.K. Boussinesq–Cerruti functions and a simple technique for substantial acceleration of subsurface stress computations in elastic half-spaces. Proc. Inst. Mech. Eng. Part J J. Eng. Tribol. 2006, 220, 19–28. [Google Scholar] [CrossRef]
- Broszeit, E.; Preussler, T.; Wagner, M.; Zwirlein, O. Stress Hypotheses and Material Stresses in Hertzian Contacts. Mater. Werkst. 1986, 17, 238–246. [Google Scholar] [CrossRef]
- Harris, T.A.; Wei, K.Y. Lundberg-Palmgren Fatigue Theory: Consideration of Failure Stress and Stressed Volume. J. Tribol. 1999, 121, 85–89. [Google Scholar] [CrossRef]
- Kalker, J.J. On the Rolling Contact of Two Elastic Bodies in the Presence of Dry Friction. Ph.D. Thesis, TH Delft, Delft, The Netherlands, 1967. [Google Scholar]
- Vollebregt, E.A.H.; Schuttelaars, H.M. Quasi-static analysis of two-dimensional rolling contact with slip-velocity dependent friction. J. Sound Vib. 2012, 331, 2141–2155. [Google Scholar] [CrossRef]
- Hamilton, G.; Goodman, L. The stress field created by a circular sliding contact. J. Appl. Mech. 1966, 33, 371–376. [Google Scholar] [CrossRef]
Figure 1.
Use of a locating bearing track roller in a monorail transport system; Photo: HA Hessen Agentur GmbH—Jan Michael Hosan.
Figure 1.
Use of a locating bearing track roller in a monorail transport system; Photo: HA Hessen Agentur GmbH—Jan Michael Hosan.
Figure 2.
Principles of the subsurface stress calculation, in accordance with [
14].
Figure 2.
Principles of the subsurface stress calculation, in accordance with [
14].
Figure 3.
Forces, torques, lever arms.
Figure 3.
Forces, torques, lever arms.
Figure 4.
Coordinate systems and parameters (left), distribution of angular velocities (right).
Figure 4.
Coordinate systems and parameters (left), distribution of angular velocities (right).
Figure 5.
Movement of the spin center and characteristics of the contact surface in plain view (left), displacement of the spin center in the cross section (right).
Figure 5.
Movement of the spin center and characteristics of the contact surface in plain view (left), displacement of the spin center in the cross section (right).
Figure 6.
Overview of the output graphical results with additional explanations.
Figure 6.
Overview of the output graphical results with additional explanations.
Figure 7.
Equivalent stress distribution DEH for the material pair steel/steel, , , free rolling.
Figure 7.
Equivalent stress distribution DEH for the material pair steel/steel, , , free rolling.
Figure 8.
Comparison of force values (left) and stress values (right), Steel/steel, , , , driven rolling.
Figure 8.
Comparison of force values (left) and stress values (right), Steel/steel, , , , driven rolling.
Figure 9.
Normal and shear stresses in C coordinate direction; steel/steel, , , , driven rolling, C1.
Figure 9.
Normal and shear stresses in C coordinate direction; steel/steel, , , , driven rolling, C1.
Figure 10.
Resulting shear stresses and frictional energy; steel/steel, , , , .
Figure 10.
Resulting shear stresses and frictional energy; steel/steel, , , , .
Figure 11.
Equivalent stresses, steel/steel, , , , , C1.
Figure 11.
Equivalent stresses, steel/steel, , , , , C1.
Table 1.
Parameter and values of the selected example.
Table 1.
Parameter and values of the selected example.
| Parameter |
(mm) |
(mm) |
(mm) |
(mm) |
(°) | E
(Nmm) |
(-) |
(mm) |
(mm) | (N) |
|---|
Free
Rolling | Driven Rolling |
|---|
| Value | 21.75 | 7 | 220 | 6 | 30 | 210,000 | 0.33 | 200 | 30 | 0 | −30 |
Table 2.
Discretization, Duration and Accuracy.
Table 2.
Discretization, Duration and Accuracy.
| Parameter |
(-) |
(-) |
(-) |
(-) |
(min) |
(MPa) |
|---|
| High | 120 | 120 | | 31 | | |
| Low | 40 | 20 | | 12 | | |
| Publisher’s Note: MDPI stays neutral with regard to jurisdictional claims in published maps and institutional affiliations. |
© 2022 by the authors. Licensee MDPI, Basel, Switzerland. This article is an open access article distributed under the terms and conditions of the Creative Commons Attribution (CC BY) license (https://creativecommons.org/licenses/by/4.0/).
