Experimental and Numerical Studies of Stress Distribution in an Expanding Pin Joint System


Abstract
:1. Introduction
2. Analysis Methods
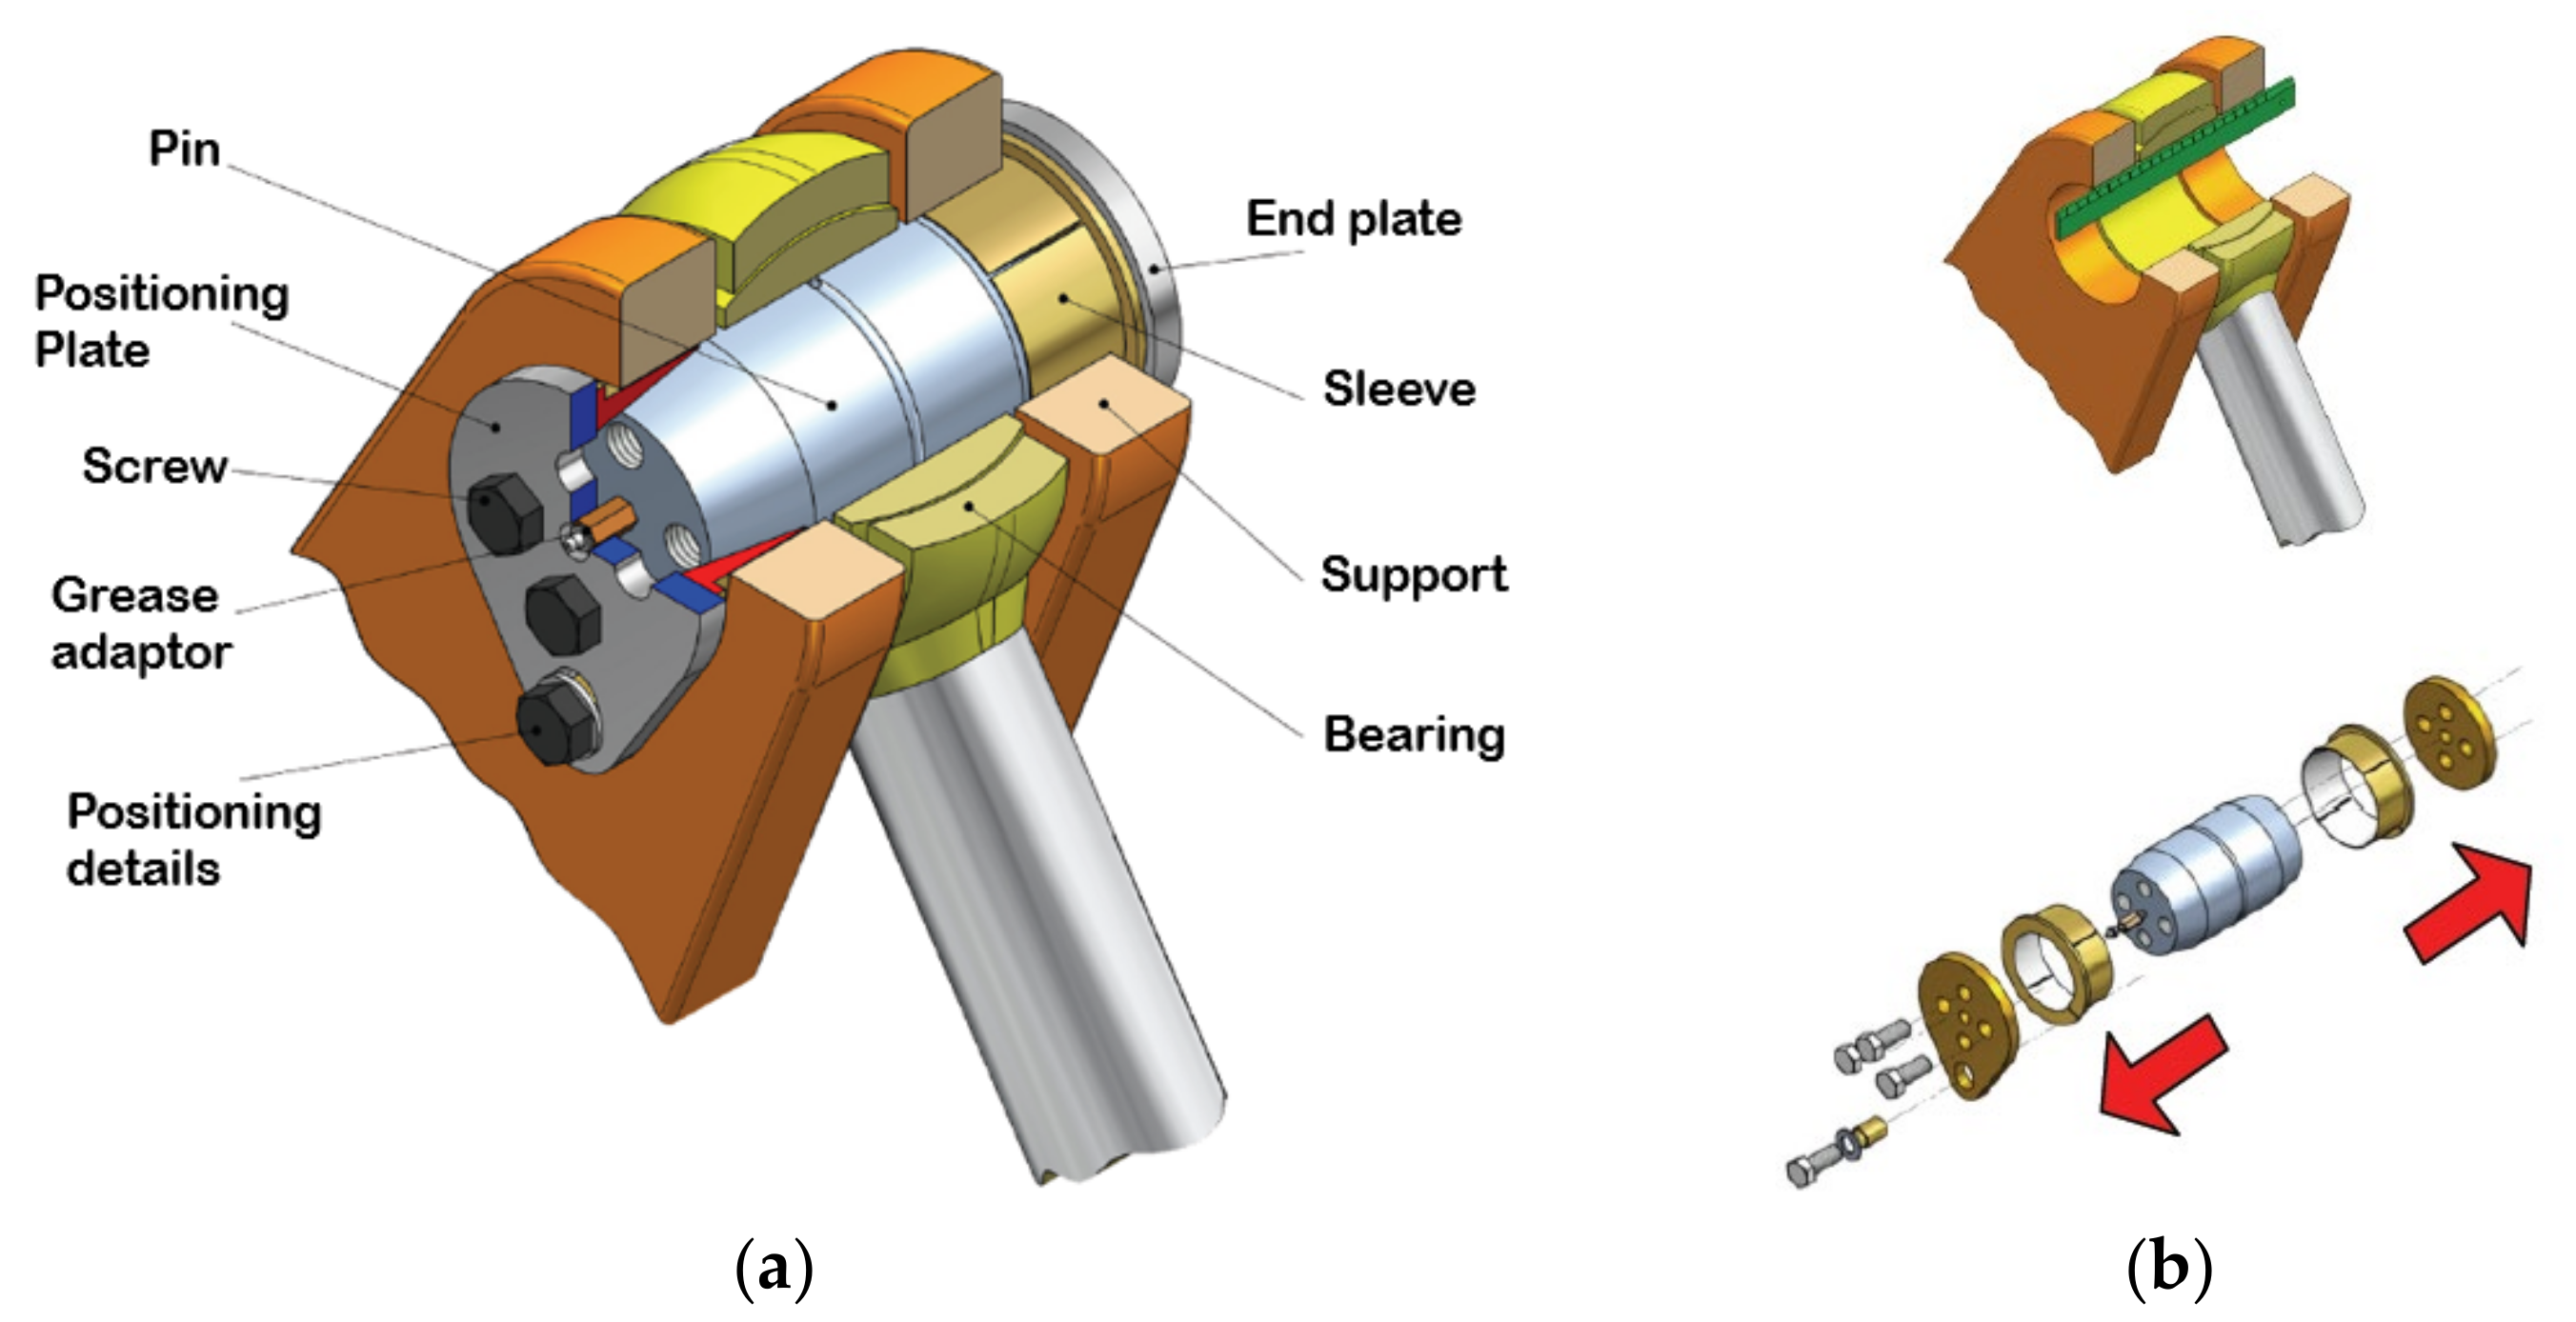
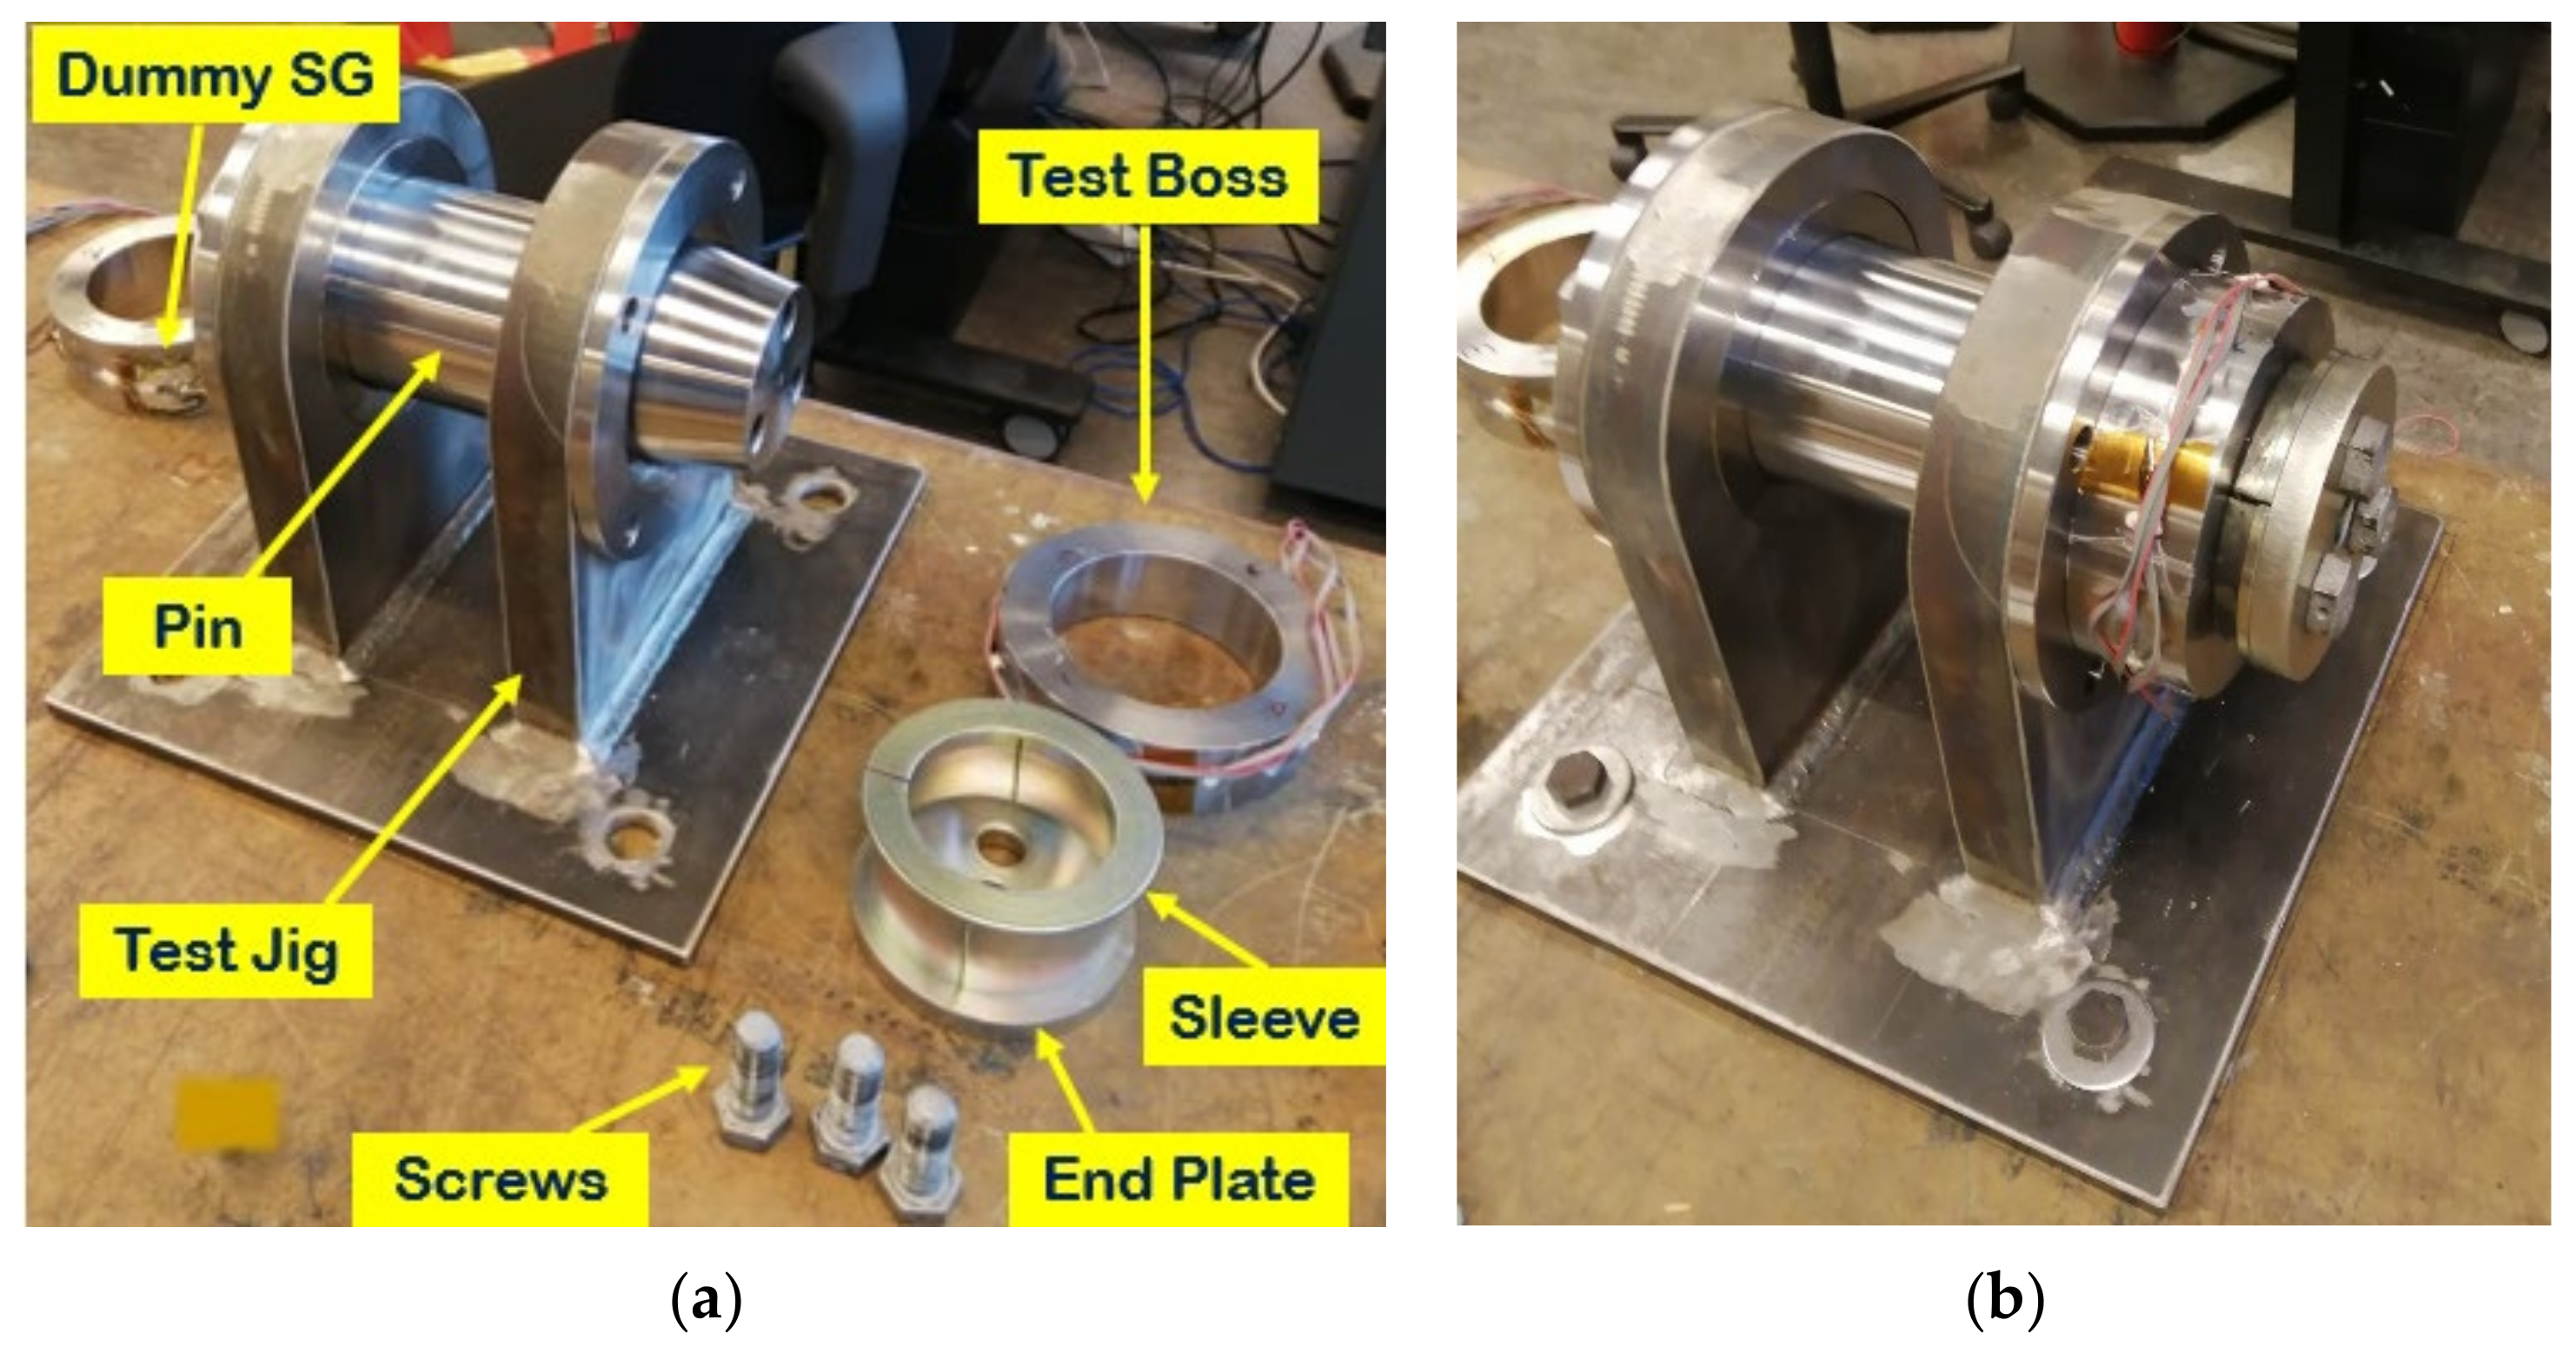
2.1. Experimental Setup
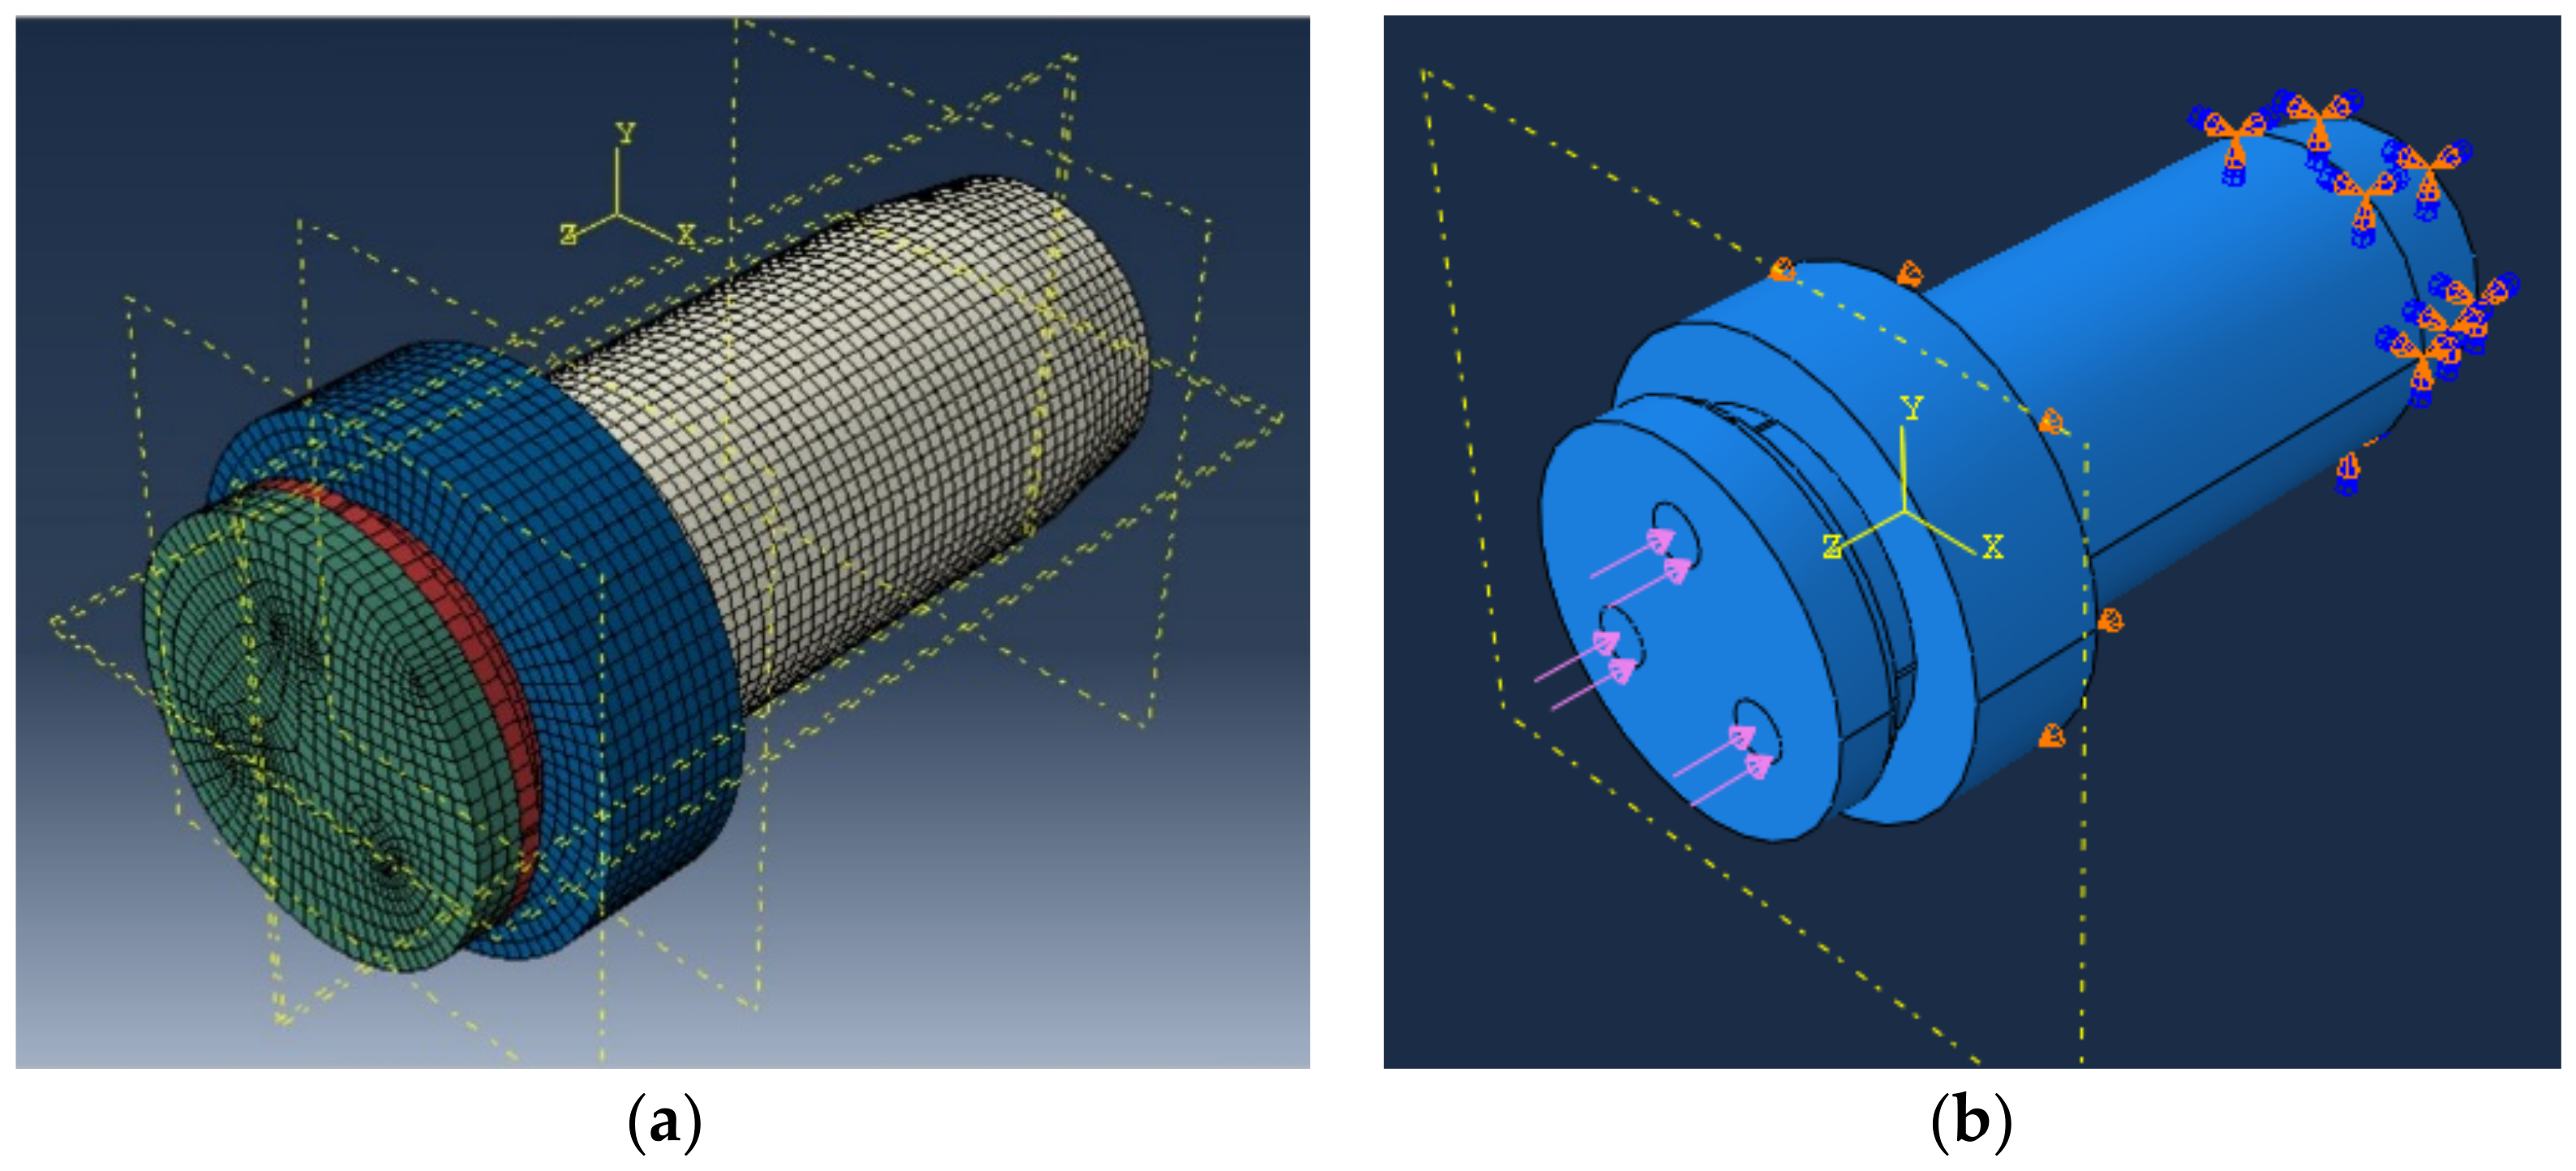
2.2. Finite Element Analysis in Abaqus/CAE
3. Results
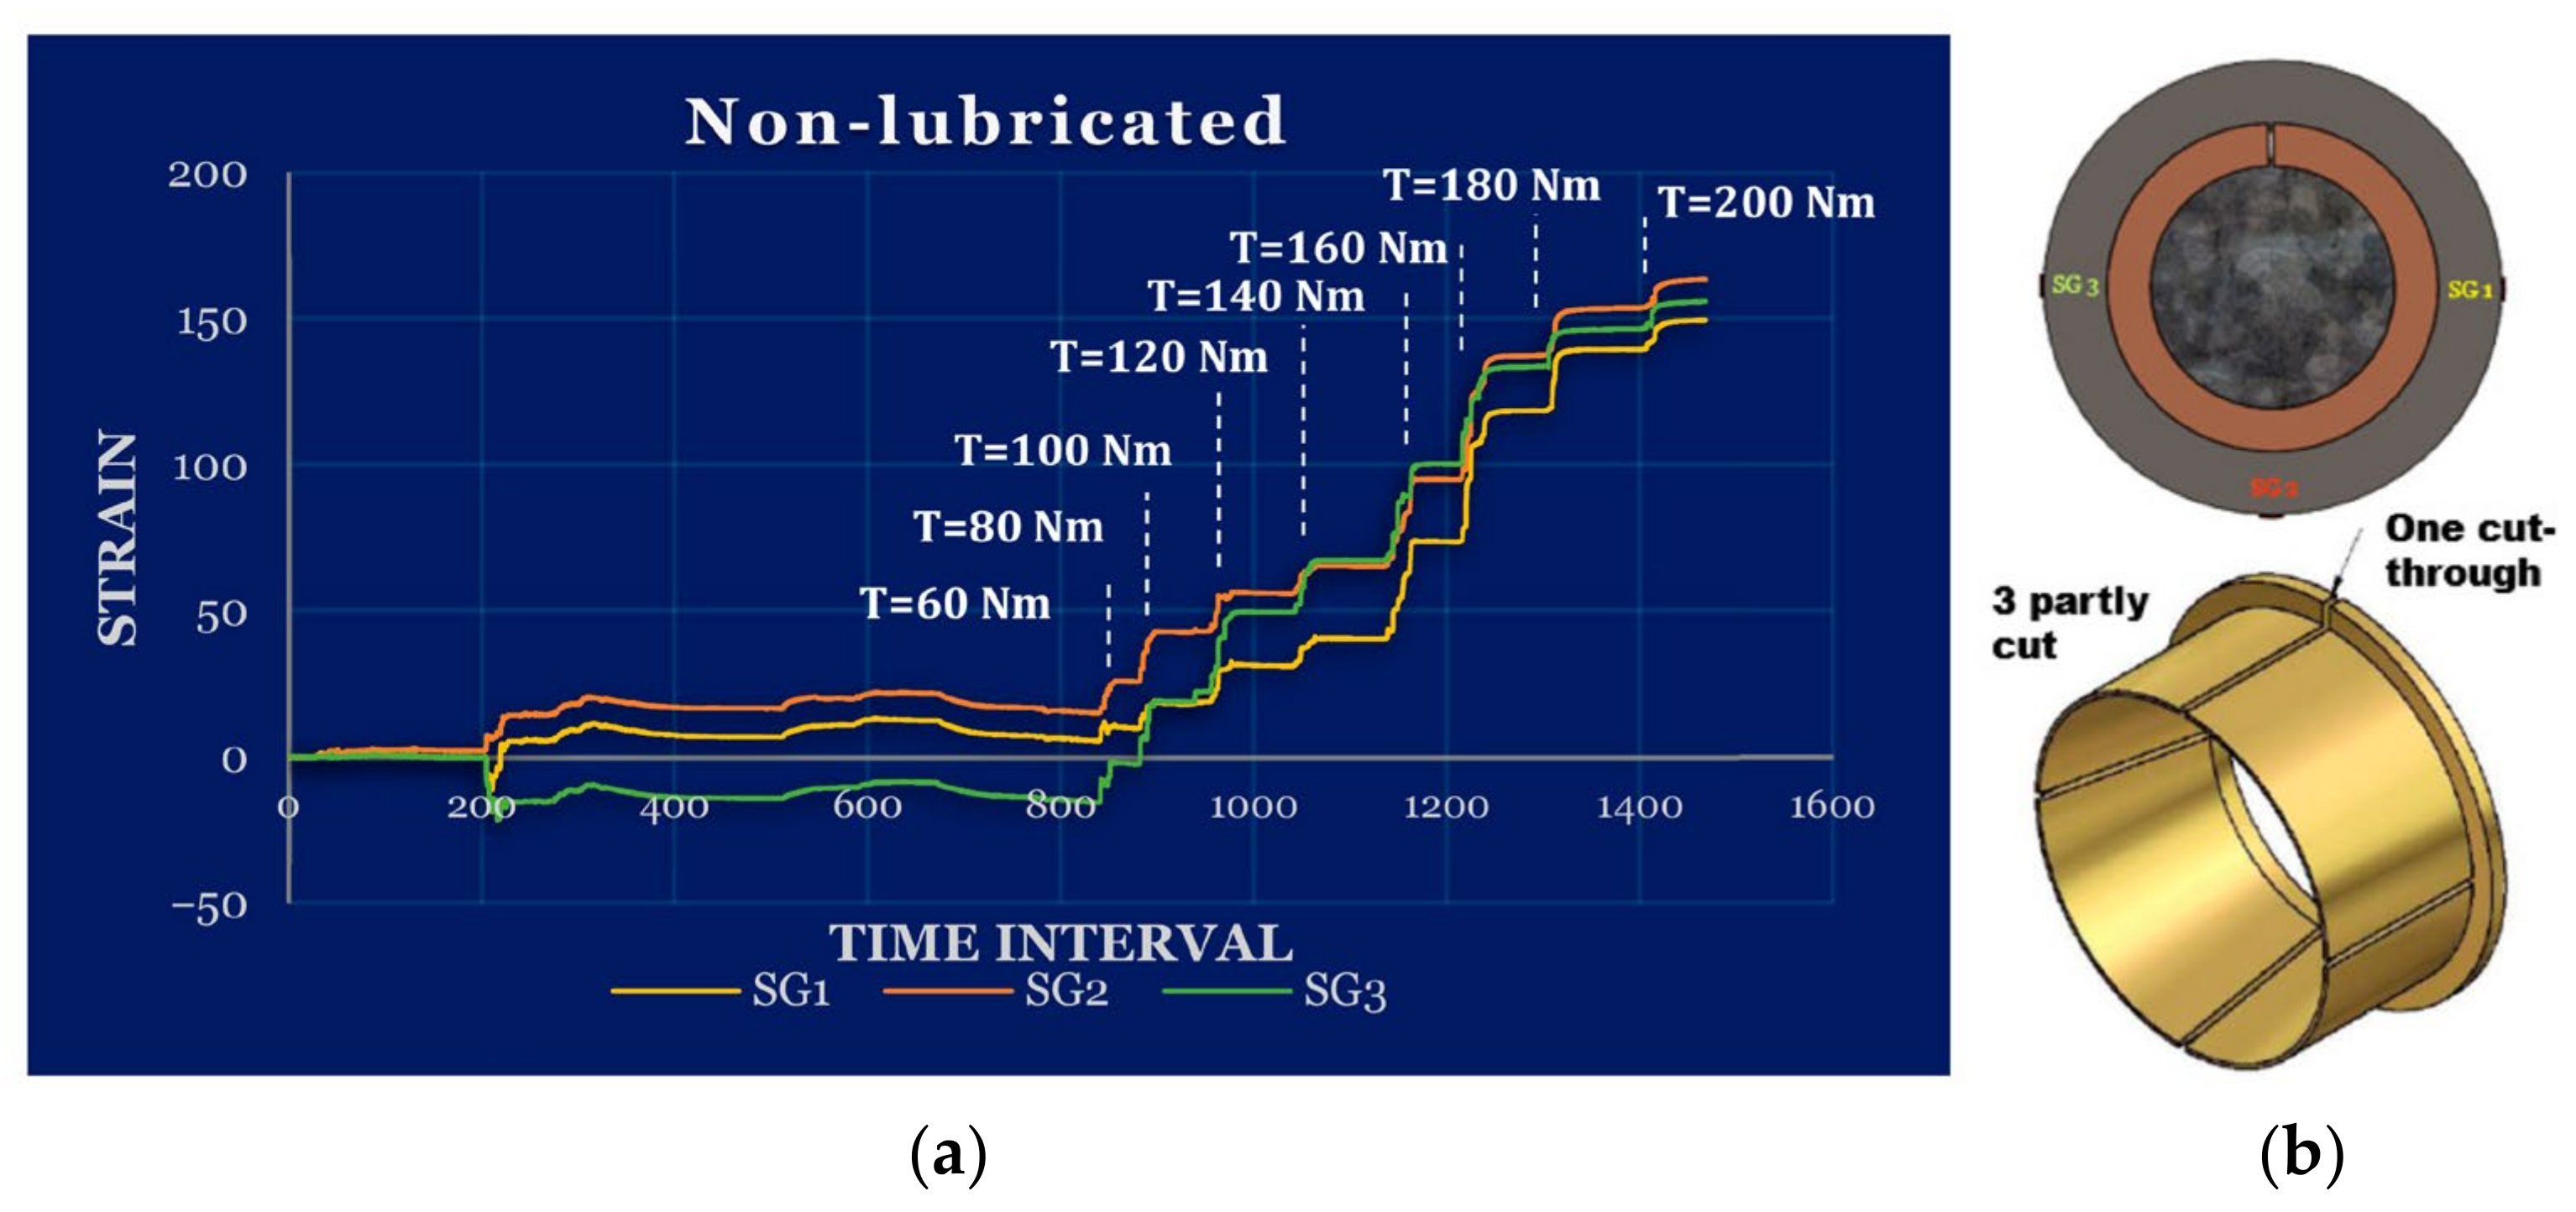
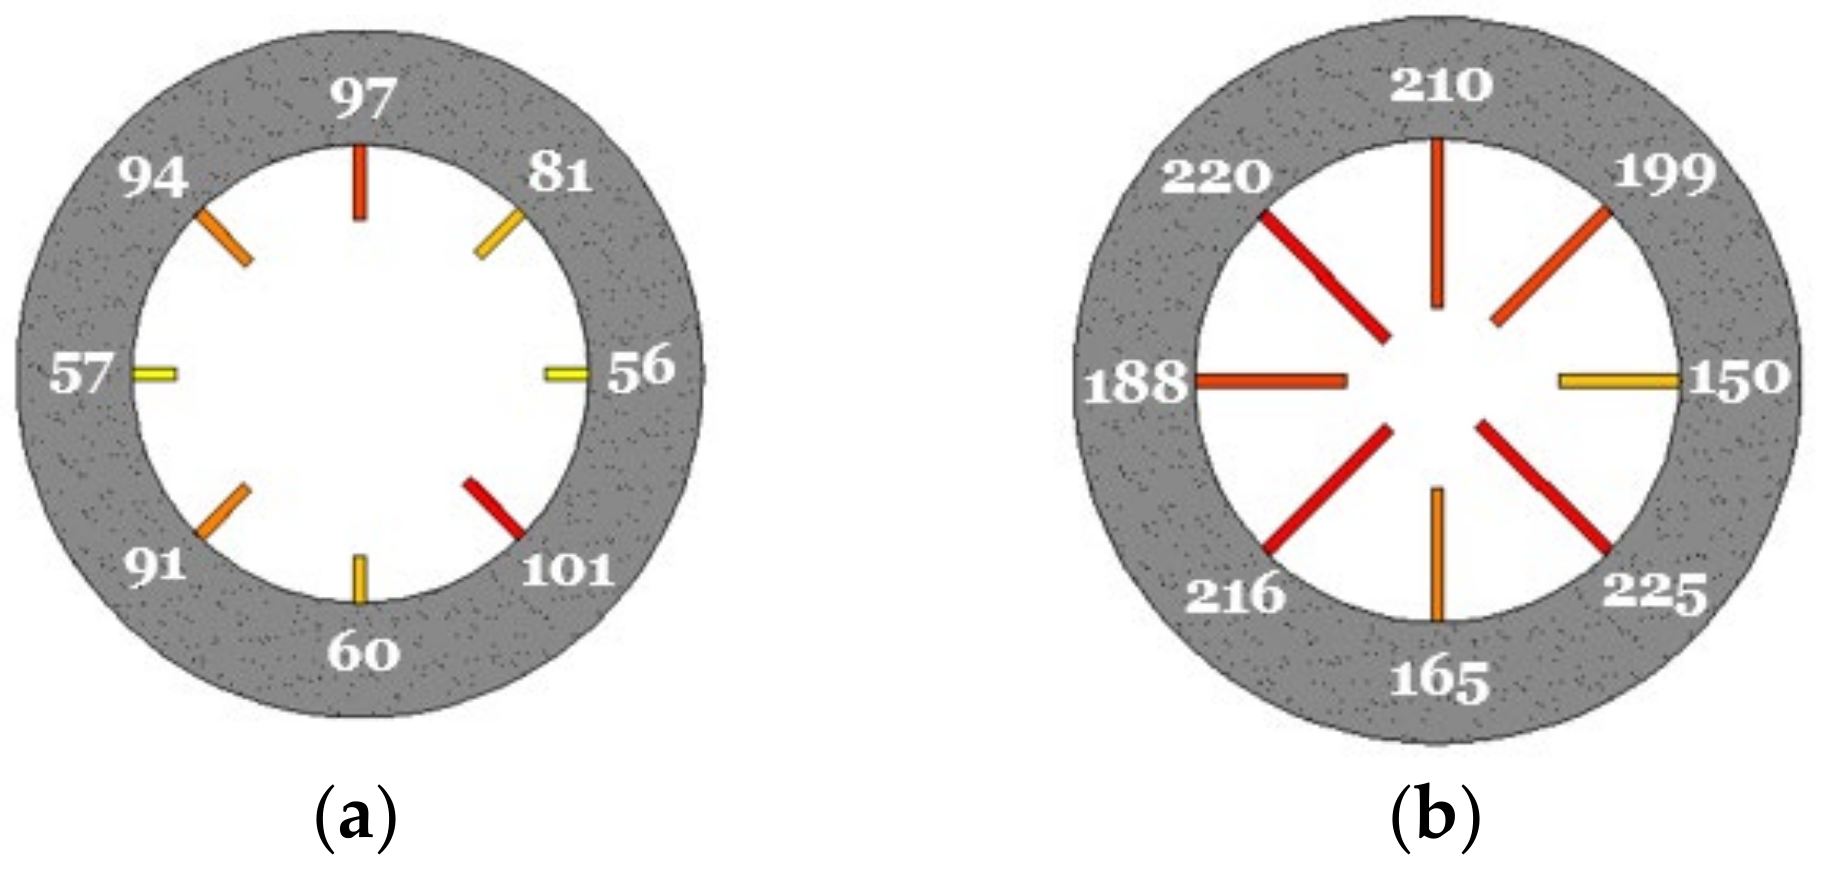
3.1. Non-Lubricated Partly Cut Sleeve
3.2. Lubricated Partly Cut Sleeve
3.3. Lubricated Completely Cut Sleeve
4. Comparison of the Results and Discussion
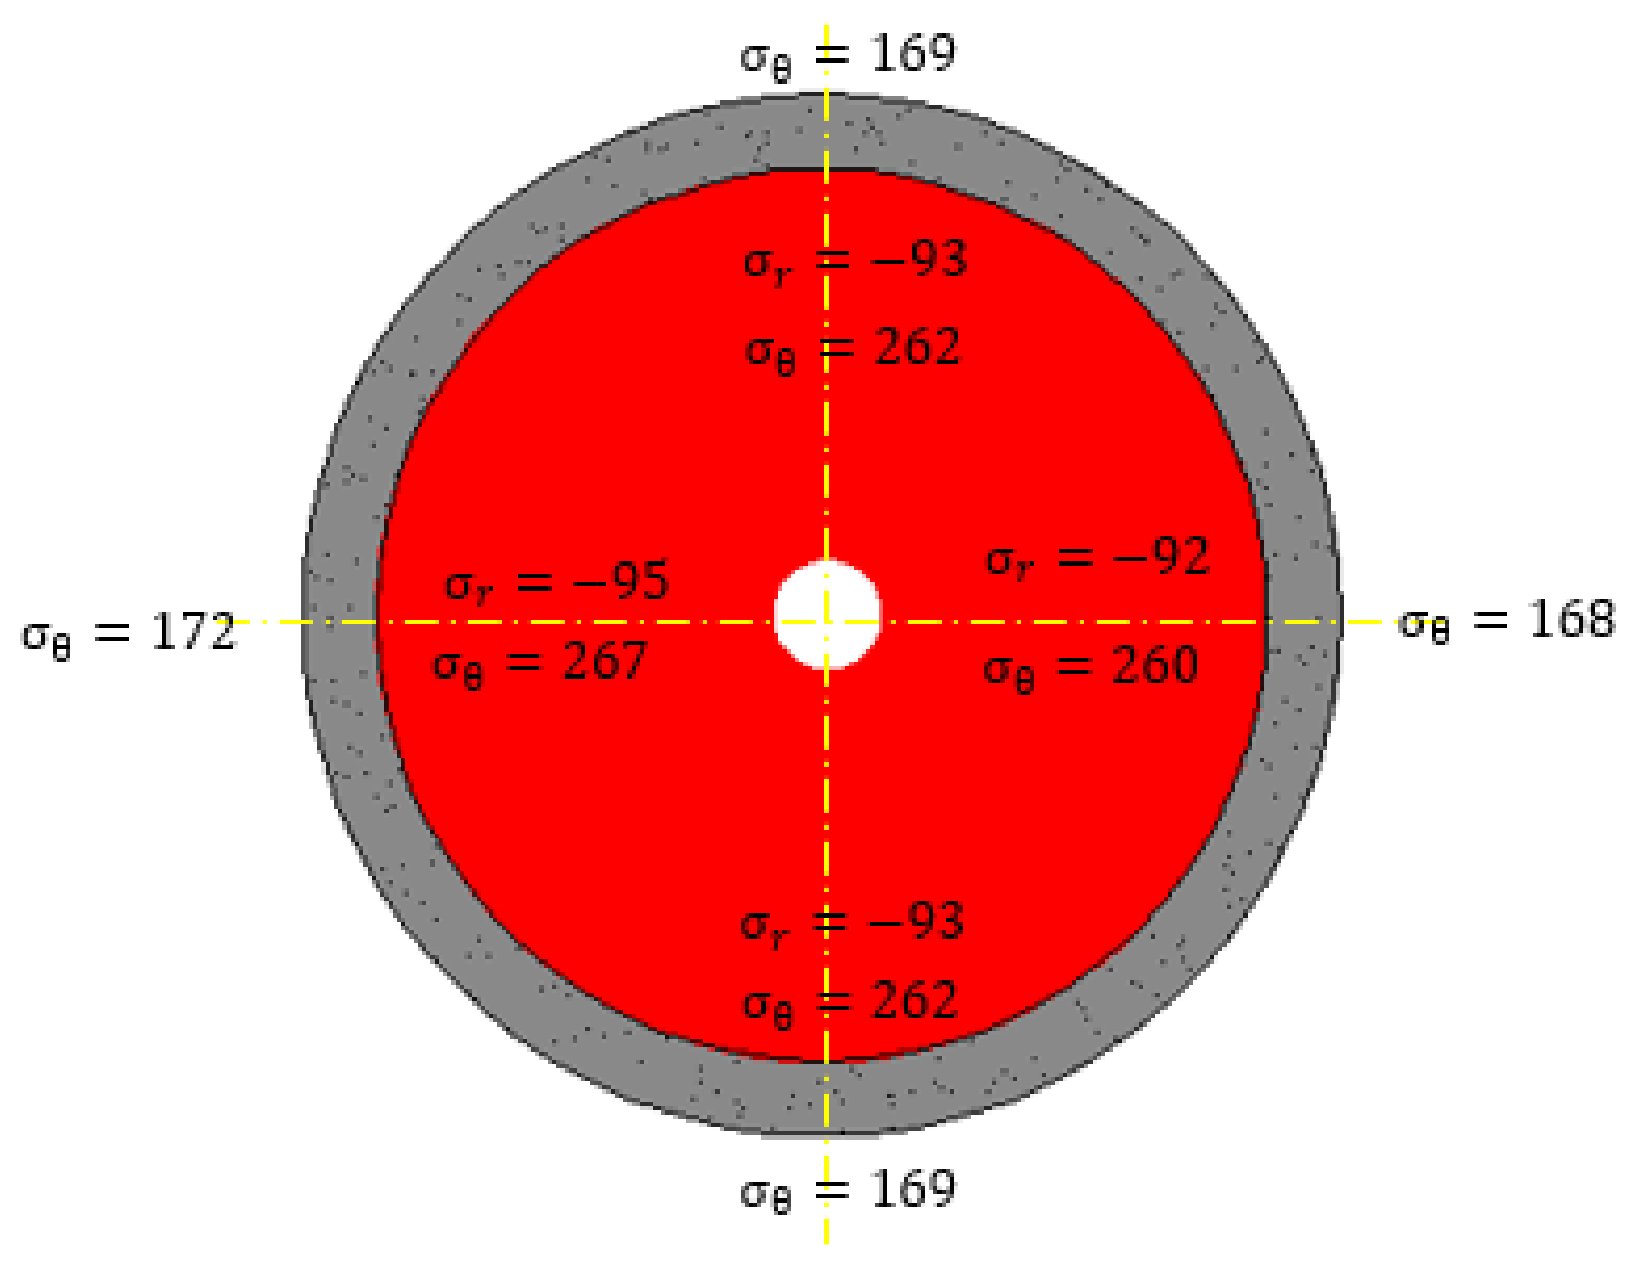
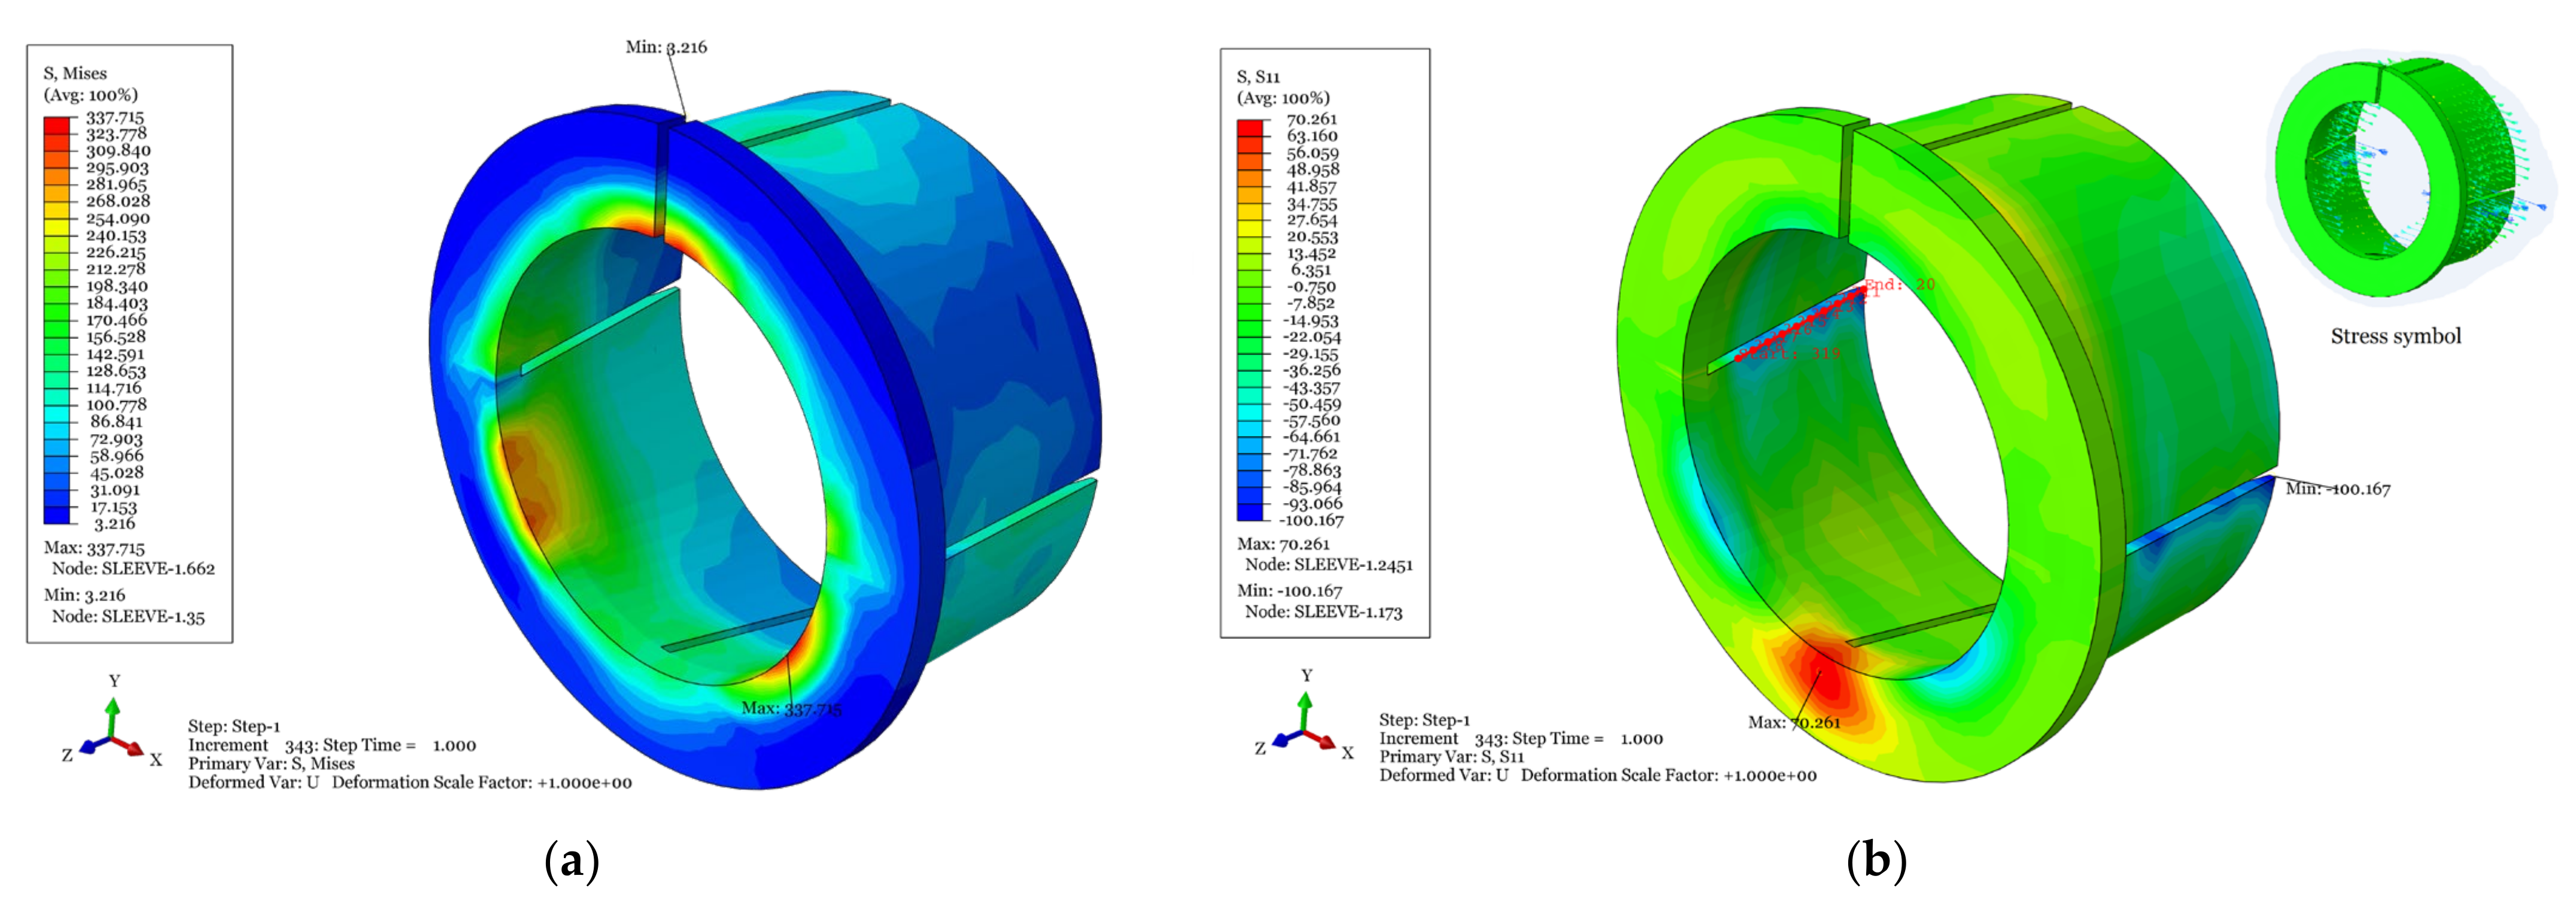
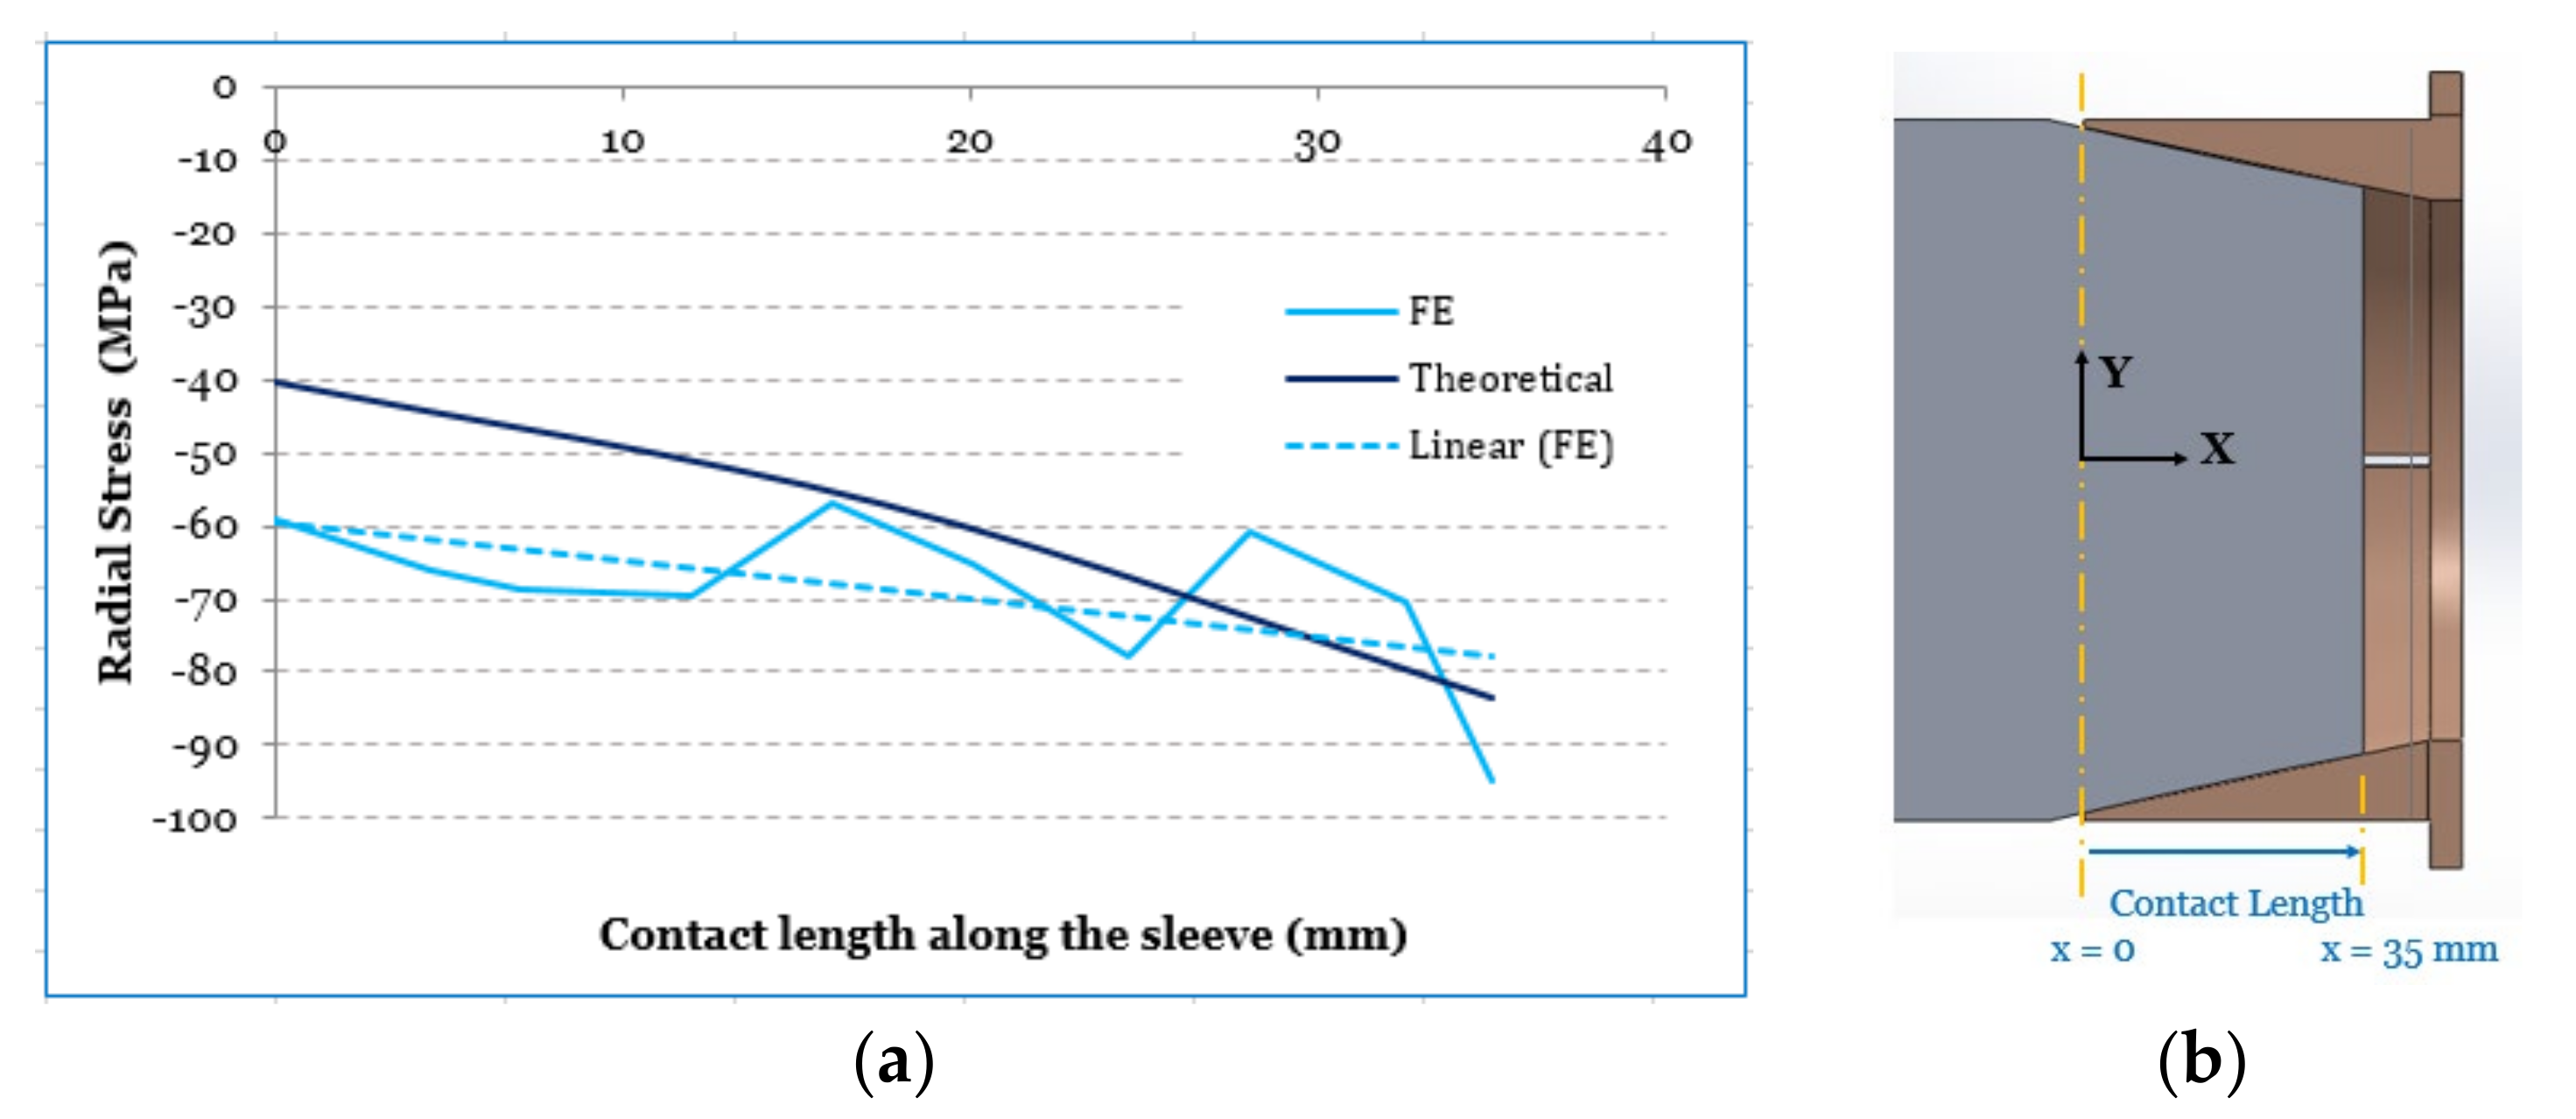
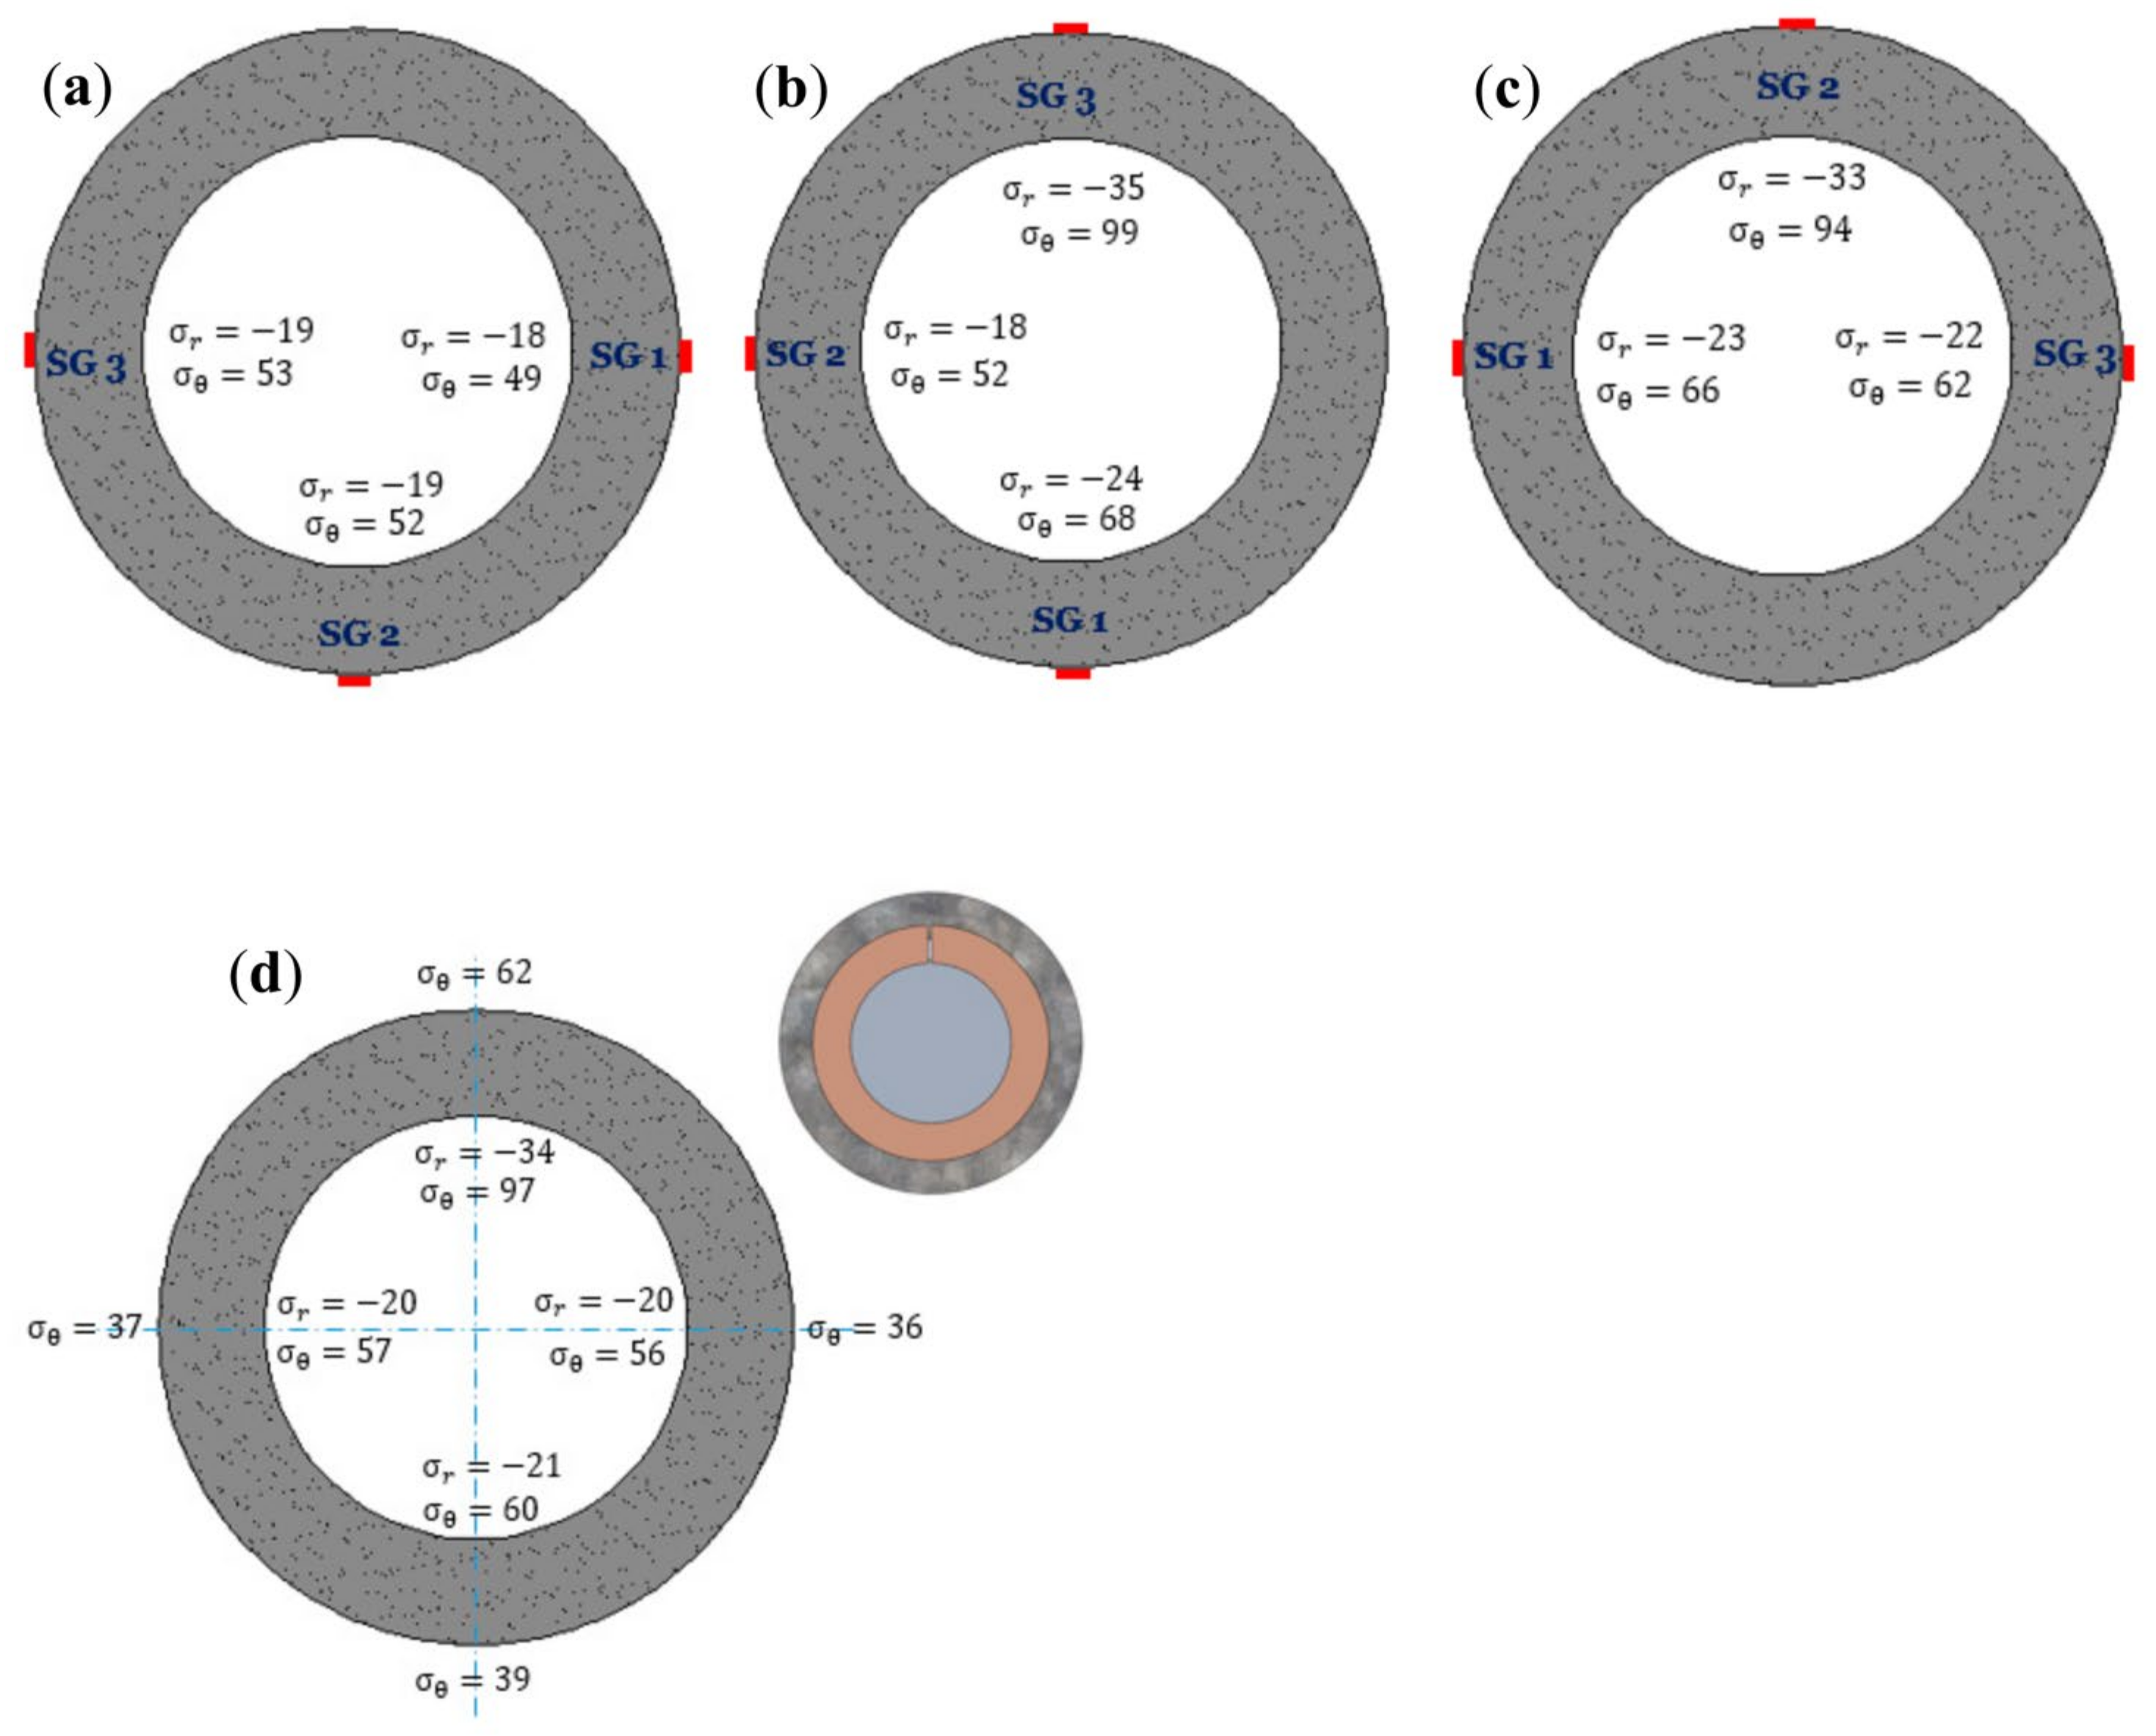
4.1. Partly Cut Sleeve
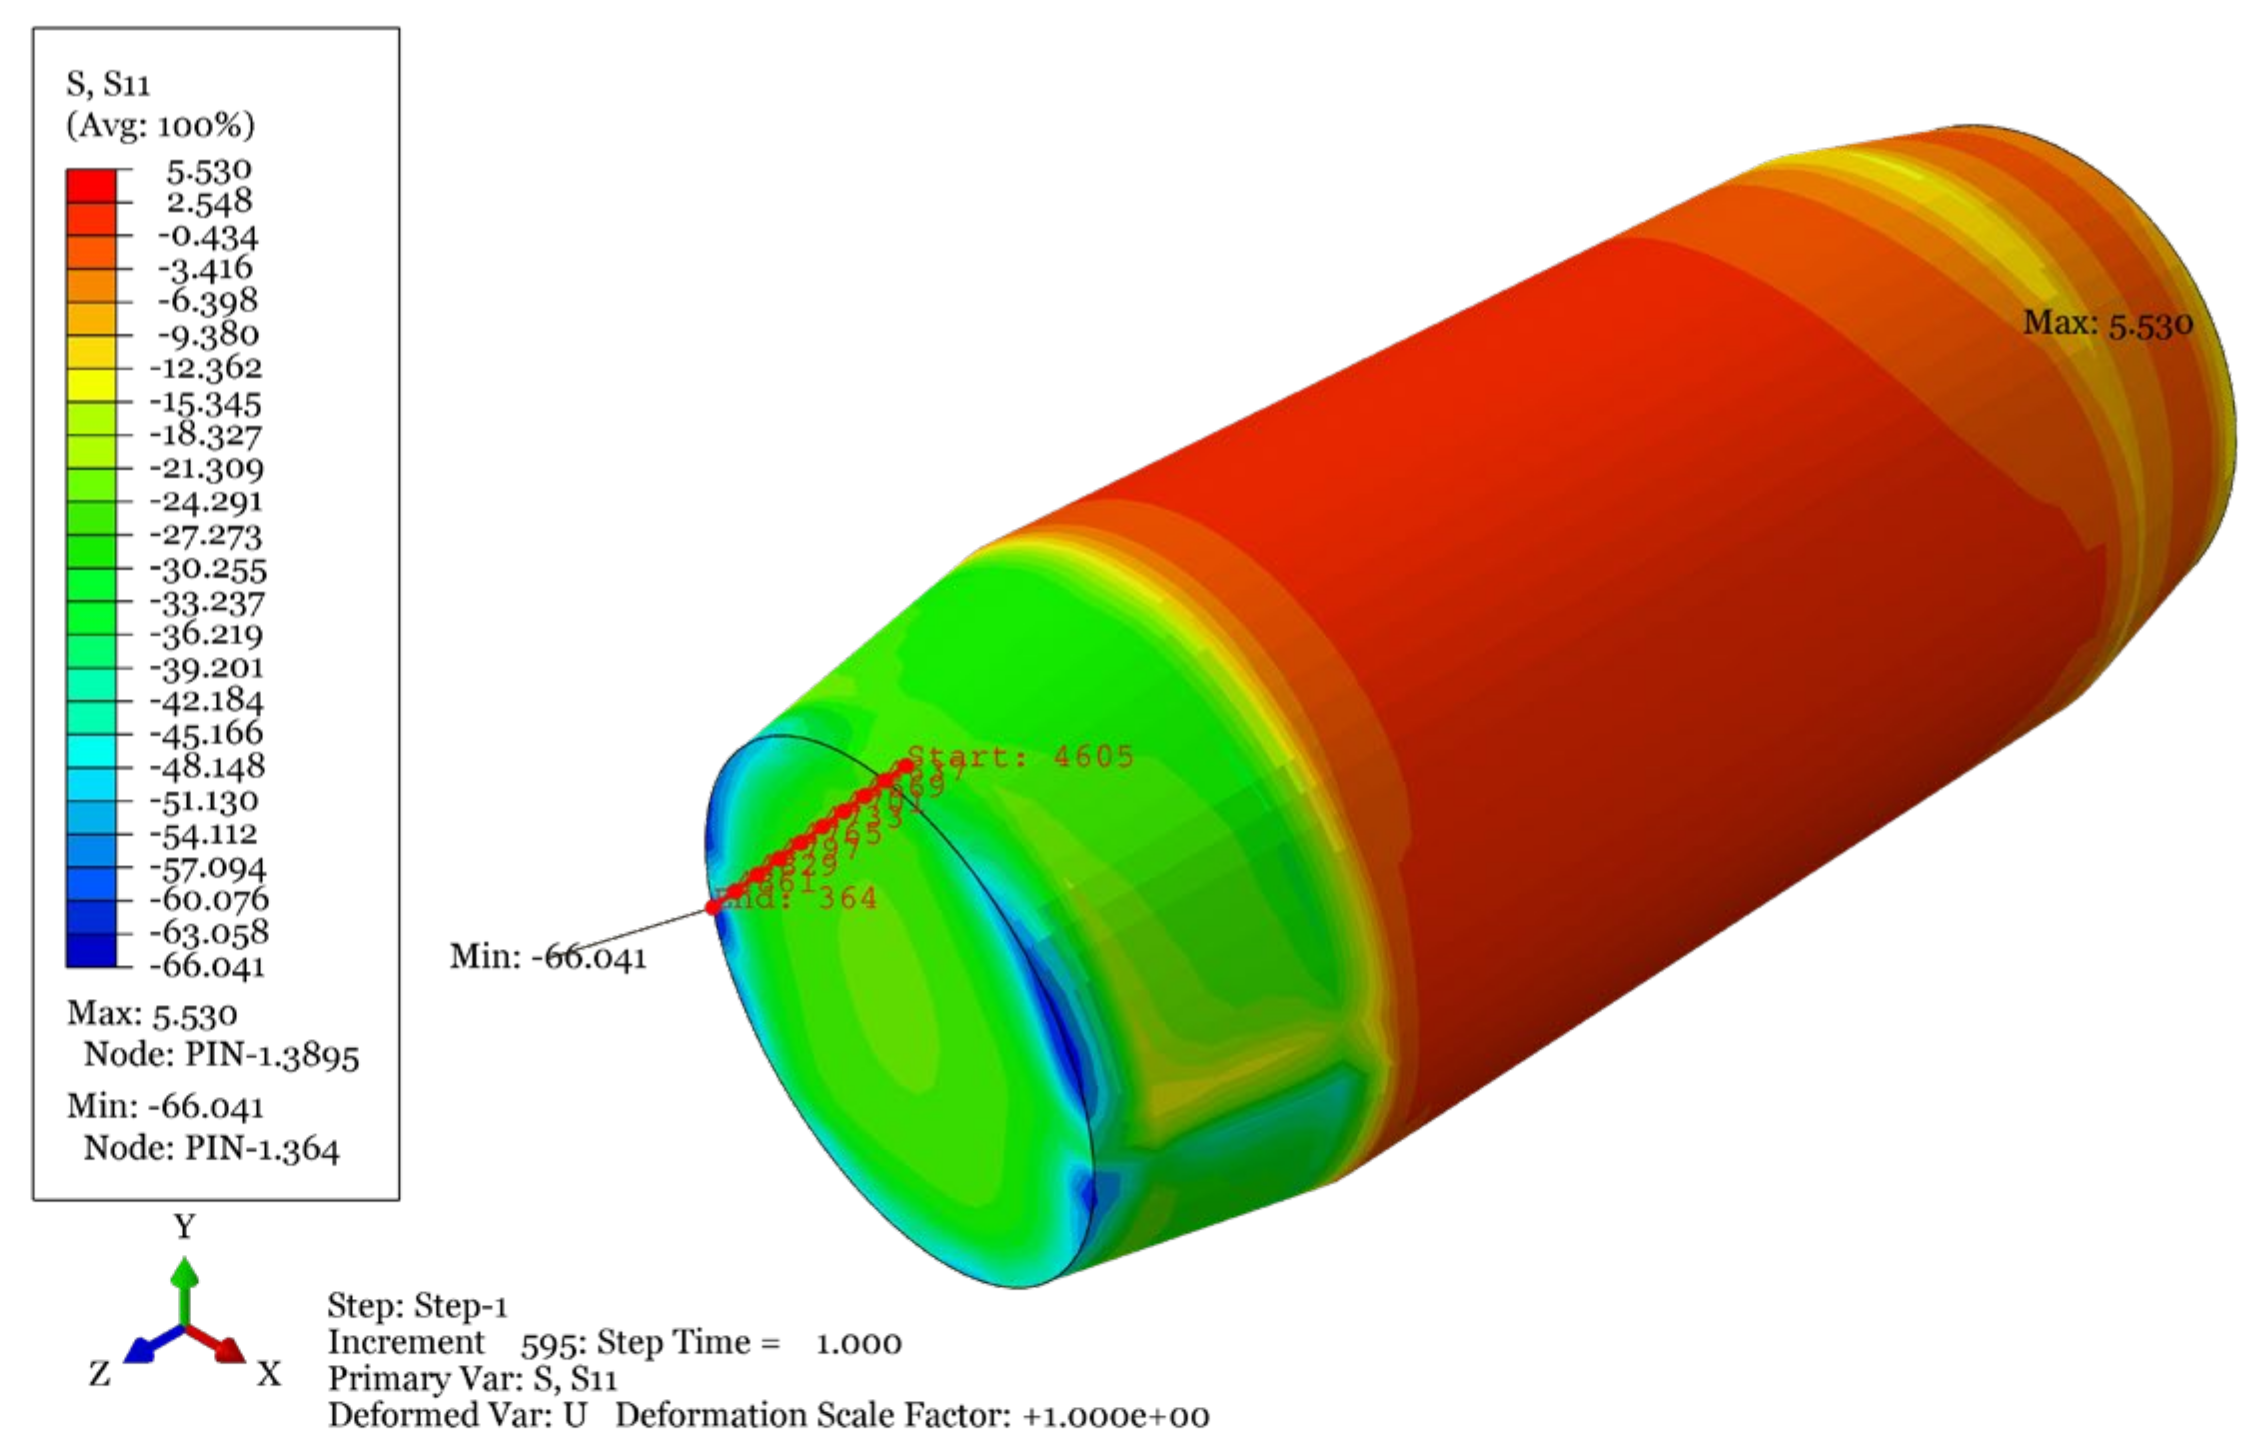
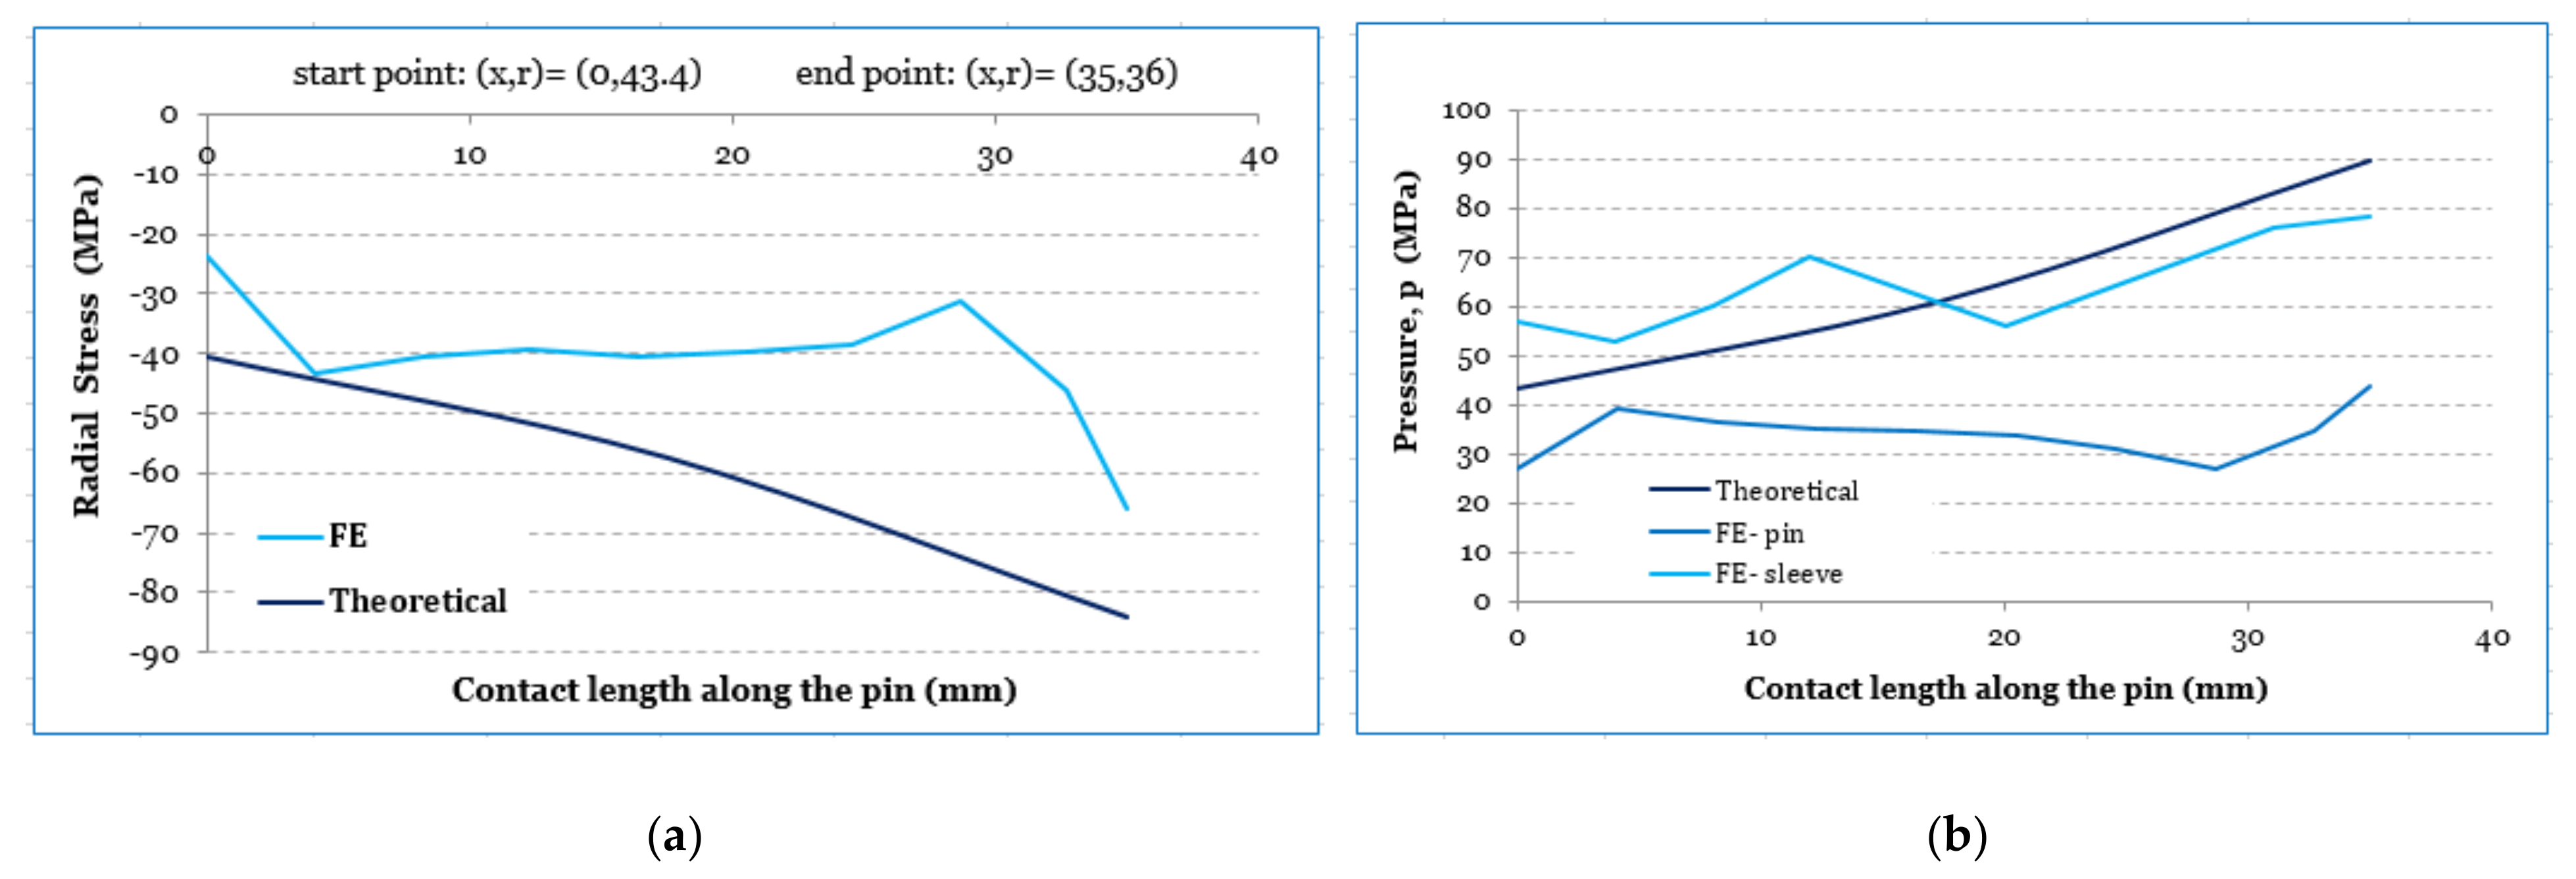
4.2. Pin
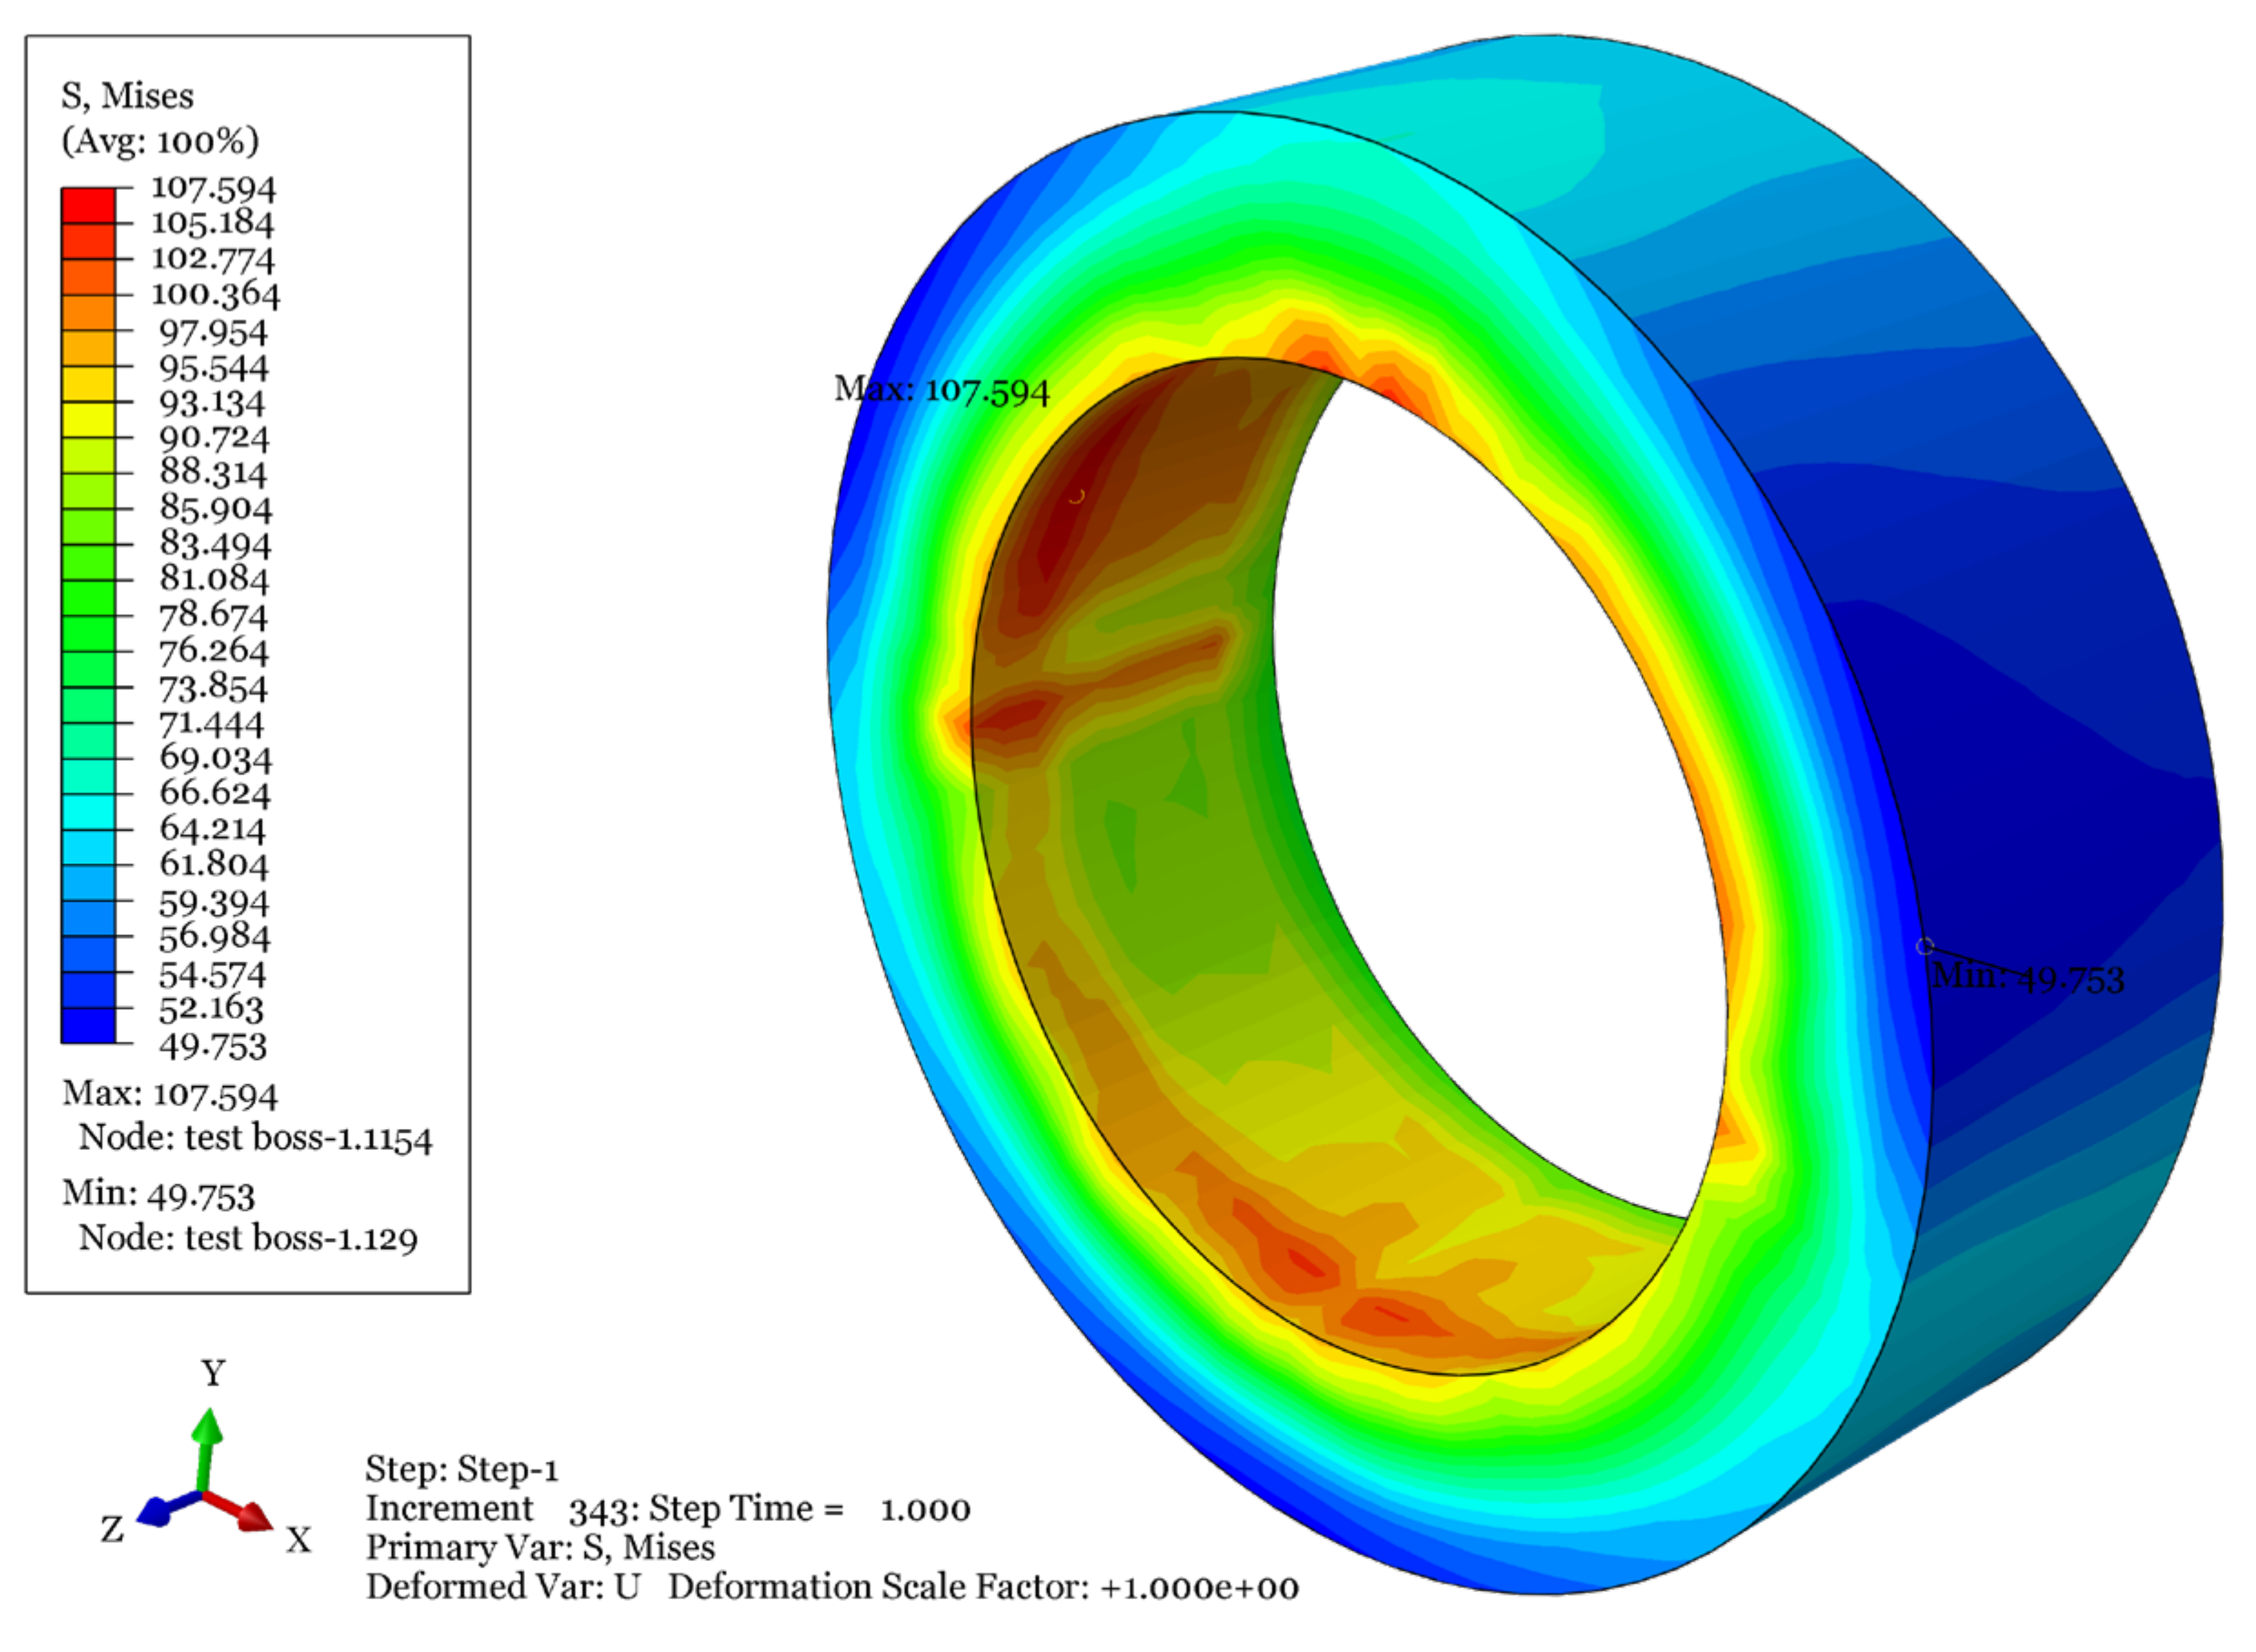
4.3. Test Boss
5. Conclusions
Author Contributions
Funding
Institutional Review Board Statement
Informed Consent Statement
Data Availability Statement
Conflicts of Interest
References
- Karlsen, Ø.; Lemu, H.G. Questionnaire-based survey of experiences with the use of expanding PIN systems in mechanical joints. J. Results Eng. 2021, 9, 100212. [Google Scholar] [CrossRef]
- Timoshenko, S.; Goodier, J. Theory of Elasticity; McGraw-Hill: New York, NY, USA, 1951. [Google Scholar]
- Eriksson, I. On the bearing strength of bolted graphite/epoxy laminates. J. Compos. Mater. 1990, 24, 1246–1269. [Google Scholar] [CrossRef]
- Wang, H.S.; Hung, C.L.; Chang, F.K. Bearing failure of bolted composite joints. Part I: Experimental characterization. J. Compos. Mater. 1996, 30, 1284–1313. [Google Scholar] [CrossRef]
- Hung, C.L.; Chang, F.K. Bearing failure of bolted composite joints. Part II: Model and verification. J. Compos. Mater. 1996, 30, 1359–1400. [Google Scholar] [CrossRef]
- Yavari, V.; Rajabi, I.; Daneshvar, F.; Kadivar, M.H. On the stress distribution around the hole in mechanically fastened joints. Mech. Res. Commun. 2009, 36, 373–380. [Google Scholar] [CrossRef]
- Bozkaya, D.; Müftü, S. Mechanics of the tapered interference fit in dental implants. J. Biomech. 2003, 36, 1649–1658. [Google Scholar] [CrossRef] [Green Version]
- Dongliang, Z.; Binwu, W.; Fei, L. The contact stress analysis about the conical expansion sleeve connection. In Proceedings of the Fifth International Conference on Measuring Technology and Mechatronics Automation, Hong Kong, China, 16–17 January 2013. [Google Scholar] [CrossRef]
- Yu, K.; Yang, X. Torque capacity and contact stress analysis of conical interference fit shrink disc of wind turbine. Multidiscip. Modeling Mater. Struct. 2018, 14, 189–199. [Google Scholar] [CrossRef]
- Siemiatkowski, Z.; Rucki, M.; Kudlacek, J. Internal Stresses Analysis in the Shrink-Fitted Joints of the Assembled Crankshafts. In Advances in Manufacturing. Lecture Notes in Mechanical Engineering; Hamrol, A., Ciszak, O., Legutko, S., Jurczyk, M., Eds.; Springer: Berlin/Heidelberg, Germany, 2018. [Google Scholar] [CrossRef]
- Croccolo, D.; Agostinis, M.D.; Vincenzi, N. Failure analysis of bolted joints: Effect of friction coefficients in torque–preloading relationship. Eng. Fail. Anal. 2011, 18, 364–373. [Google Scholar] [CrossRef]
- Nigrelli, V.; Pasta, S. Finite-element simulation of residual stress induced by split-sleeve cold-expansion process of holes. J. Mater. Processing Technol. 2008, 205, 290–296. [Google Scholar] [CrossRef] [Green Version]
- Ismonov, S.; Daniewicz, S.R.; Newman, J.C.; Hill, M.R.; Urban, M.R. Three dimensional finite element analysis of a split-sleeve cold expansion process. J. Eng. Mater. Technol. 2009, 131, 31007. [Google Scholar] [CrossRef]
- Berkani, I.; Karlsen, Ø.; Lemu, H.G. Experimental and numerical study of Bondura® 6.6 PIN joints. IOP Conf. Ser. Mater. Sci. Eng. 2017, 276, 012028. [Google Scholar] [CrossRef]
- Andrzejuk, A.; Skup, Z.; Zalewski, R. Analysis of a conical sleeve with pivot joint loading of axial force. J. Theor. Appl. Mech. 2014, 52, 345–358. [Google Scholar]
- Langeroodi, S.S. Experimental Study and Optimization of Expanding Pin Technology for Heavy Duty Machine Joint Application. Master’s Thesis, University of Stavanger, Stavanger, Norway, 2021. Available online: https://hdl.handle.net/11250/2786185 (accessed on 29 September 2021).
- Hannah, R.L.; Reed, S.E. Strain Gage Users’ Handbook; Chapman & Hall: London, UK, 1992. [Google Scholar]
- Hoffmann, K. Applying the Wheatstone Bridge Circuit; HBM: Darmstadt, Germany, 1974. [Google Scholar]
- Zou, Q.; Sun, T.S.; Nassar, S.A.; Barber, G.C.; Gumul, A.K. Effect of lubrication on friction and torque-tension relationship in threaded fasteners. In Proceedings of the International Joint Tribology Conference, San Antonio, TX, USA, 23–25 October 2006; pp. 591–602. [Google Scholar] [CrossRef]
- Abaqus 2016 User Manual. Getting Started with Abaqus/CAE, Dassault Systems. 2016. Available online: http://130.149.89.49:2080/v2016/pdf_books/GET_STARTED.pdf (accessed on 29 September 2021).
- Forni, D.; Chiaia, B.; Cadoni, E. Strain rate behaviour in tension of S355 steel: Base for progressive collapse analysis. Eng. Struct. 2016, 119, 164–173. [Google Scholar] [CrossRef]
- Lee, N.S.; Bathe, K.J. Effects of element distortions on the performance of isoparametric elements. Int. J. Numer. Methods Eng. 1993, 36, 3553–3576. [Google Scholar] [CrossRef] [Green Version]
- MITEducation, Eight-Node Brick Element with Reduced Integration (Blog). Available online: https://web.mit.edu/calculix_v2.7/CalculiX/ccx_2.7/doc/ccx/node27.html#int1 (accessed on 15 April 2021).
- Ventsel, E.; Krauthammer, T. Thin Plates and Shells: Theory, Analysis, Applications; Routledge: New York, NY, USA, 2001. [Google Scholar]
- Boresi, A.P.; Schmidt, R.J.; Sidebottom, O.M. Advanced Mechanics of Materials, 6th ed.; Wiley: New York, NY, USA, 1985. [Google Scholar]
- Hong, Y.; Wang, X.; Wang, Y.; Zhang, Z. Study on reducing the risk of stress corrosion cracking of austenitic stainless steel hydraulically expanded joints. J Eng. Fail. Anal. 2020, 113, 104560. [Google Scholar] [CrossRef]
- Al-Chalabi, M.; Huang, C. Stress distribution within circular cylinders in compression. Int. J. Rock Mech. Min. Sci. Geomech. Abstr. 1974, 11, 45–56. [Google Scholar] [CrossRef]
- INSTRON. Elastic Hysteresis. Available online: https://www.instron.us/en-us/our-company/library/glossary/e/elastic-hysteresis# (accessed on 12 March 2021).
- Hopkinson, B.; Williams, T.G. The Elastic Hysteresis of Steel. Proc. R. Soc. Lond. Ser. A Contain. Pap. A Math. Phys. Character 1912, 87, 502–511. [Google Scholar] [CrossRef] [Green Version]
- Budynas, R.G.; Nisbett, J.K.; Tangchaichit, K. Shigley’s Mechanical Engineering Design, 8th ed.; McGraw Hill: New York, NY, USA, 2005. [Google Scholar]


| Part | Yield Strength Re [MPa] | Ultimate Strength Rm [MPa] | Elongation, A5 [%] |
|---|---|---|---|
| End Plate | 404 | 547 | 25.6 |
| Pin | 962 | 1074 | 16.8 |
| Sleeve | 404 | 547 | 25.6 |
| Test Boss | 420 | 583 | 21.2 |
| Eng. Stress [MPa] | Eng. Strain [−] | True Stress [MPa] | True Strain [−] | True Plastic Strain [−] | |
|---|---|---|---|---|---|
| Yield stress point, Re | 404 | 0.0019 | 404.77 | 0.0019 | 0 |
| Ultimate stress point, Rm | 547 | 0.0853 | 593.66 | 0.0819 | 0.0800 |
| Position of Complete Cut-Trough | |||||
|---|---|---|---|---|---|
| π/2 | 5π/4 | 7π/4 | π/4 | ||
| Test Layout | Strain Gauge Nr. (Locations) |  |  |  |  |
| Unlubricated | No SG (0) | 56 | - | - | - |
| SG 3 (π/2) | 97 | 107 | 102 | 100 | |
| SG 2 (π) | 57 | 85 | 104 | 79 | |
| SG 1 (3π/2) | 60 | 88 | 76 | 93 | |
| Lubricated | No SG (0) | 150 | - | - | - |
| SG 3 (π/2) | 210 | 236 | 212 | 237 | |
| SG 2 (π) | 188 | 216 | 209 | 220 | |
| SG 1 (3π/2) | 165 | 203 | 181 | 230 | |
| Test Layout | Tresca Stress [MPa] | von Mises Stress [MPa] | Yield Strength of Test Boss [MPa] |
|---|---|---|---|
| Non-lubricated Partly Cut Sleeve | 137 | 126 | 420 |
| Lubricated Partly Cut Sleeve | 304 | 281 | 420 |
| Lubricated Completely Cut Sleeve | 362 | 325 | 420 |
| Inner Surface | Outer Surface | |||||
|---|---|---|---|---|---|---|
| Angular Position [rad] | Experimental [MPa] | FE [MPa] | Error [%] | Experimental [MPa] | FE [MPa] | Error [%] |
| 0 | 55.93 | 85.9 | 53.58 | 36.12 | 51.59 | 42.83 |
| π/2 | 96.82 | 75.77 | −21.74 | 62.37 | 50.97 | −18.28 |
| π | 57 | 84.85 | 48.86 | 36.75 | 49.44 | 34.53 |
| 3π/2 | 60.19 | 83.82 | 39.26 | 38.83 | 48 | 23.62 |
| Inner Surface | |||
|---|---|---|---|
| Angular Position [rad] | Experimental [MPa] | FE [MPa] | Error [%] |
| 0 | −19.86 | −19.07 | 4.14 |
| π/2 | −34.37 | −27.91 | 23.15 |
| π | −20.24 | −18.65 | 8.53 |
| 3π/2 | −21.37 | −15.84 | 34.91 |
Publisher’s Note: MDPI stays neutral with regard to jurisdictional claims in published maps and institutional affiliations. |
© 2021 by the authors. Licensee MDPI, Basel, Switzerland. This article is an open access article distributed under the terms and conditions of the Creative Commons Attribution (CC BY) license (https://creativecommons.org/licenses/by/4.0/).
Share and Cite
Salahshour, S.; Karlsen, Ø.; Lemu, H.G. Experimental and Numerical Studies of Stress Distribution in an Expanding Pin Joint System. Appl. Mech. 2022, 3, 46-63. https://doi.org/10.3390/applmech3010003
Salahshour S, Karlsen Ø, Lemu HG. Experimental and Numerical Studies of Stress Distribution in an Expanding Pin Joint System. Applied Mechanics. 2022; 3(1):46-63. https://doi.org/10.3390/applmech3010003
Chicago/Turabian StyleSalahshour, Soheil, Øyvind Karlsen, and Hirpa Gelgele Lemu. 2022. "Experimental and Numerical Studies of Stress Distribution in an Expanding Pin Joint System" Applied Mechanics 3, no. 1: 46-63. https://doi.org/10.3390/applmech3010003
APA StyleSalahshour, S., Karlsen, Ø., & Lemu, H. G. (2022). Experimental and Numerical Studies of Stress Distribution in an Expanding Pin Joint System. Applied Mechanics, 3(1), 46-63. https://doi.org/10.3390/applmech3010003