Experimental Characterization of Low-Speed Passive Discharge Losses of a Flywheel Energy Storage System


Abstract
:1. Introduction
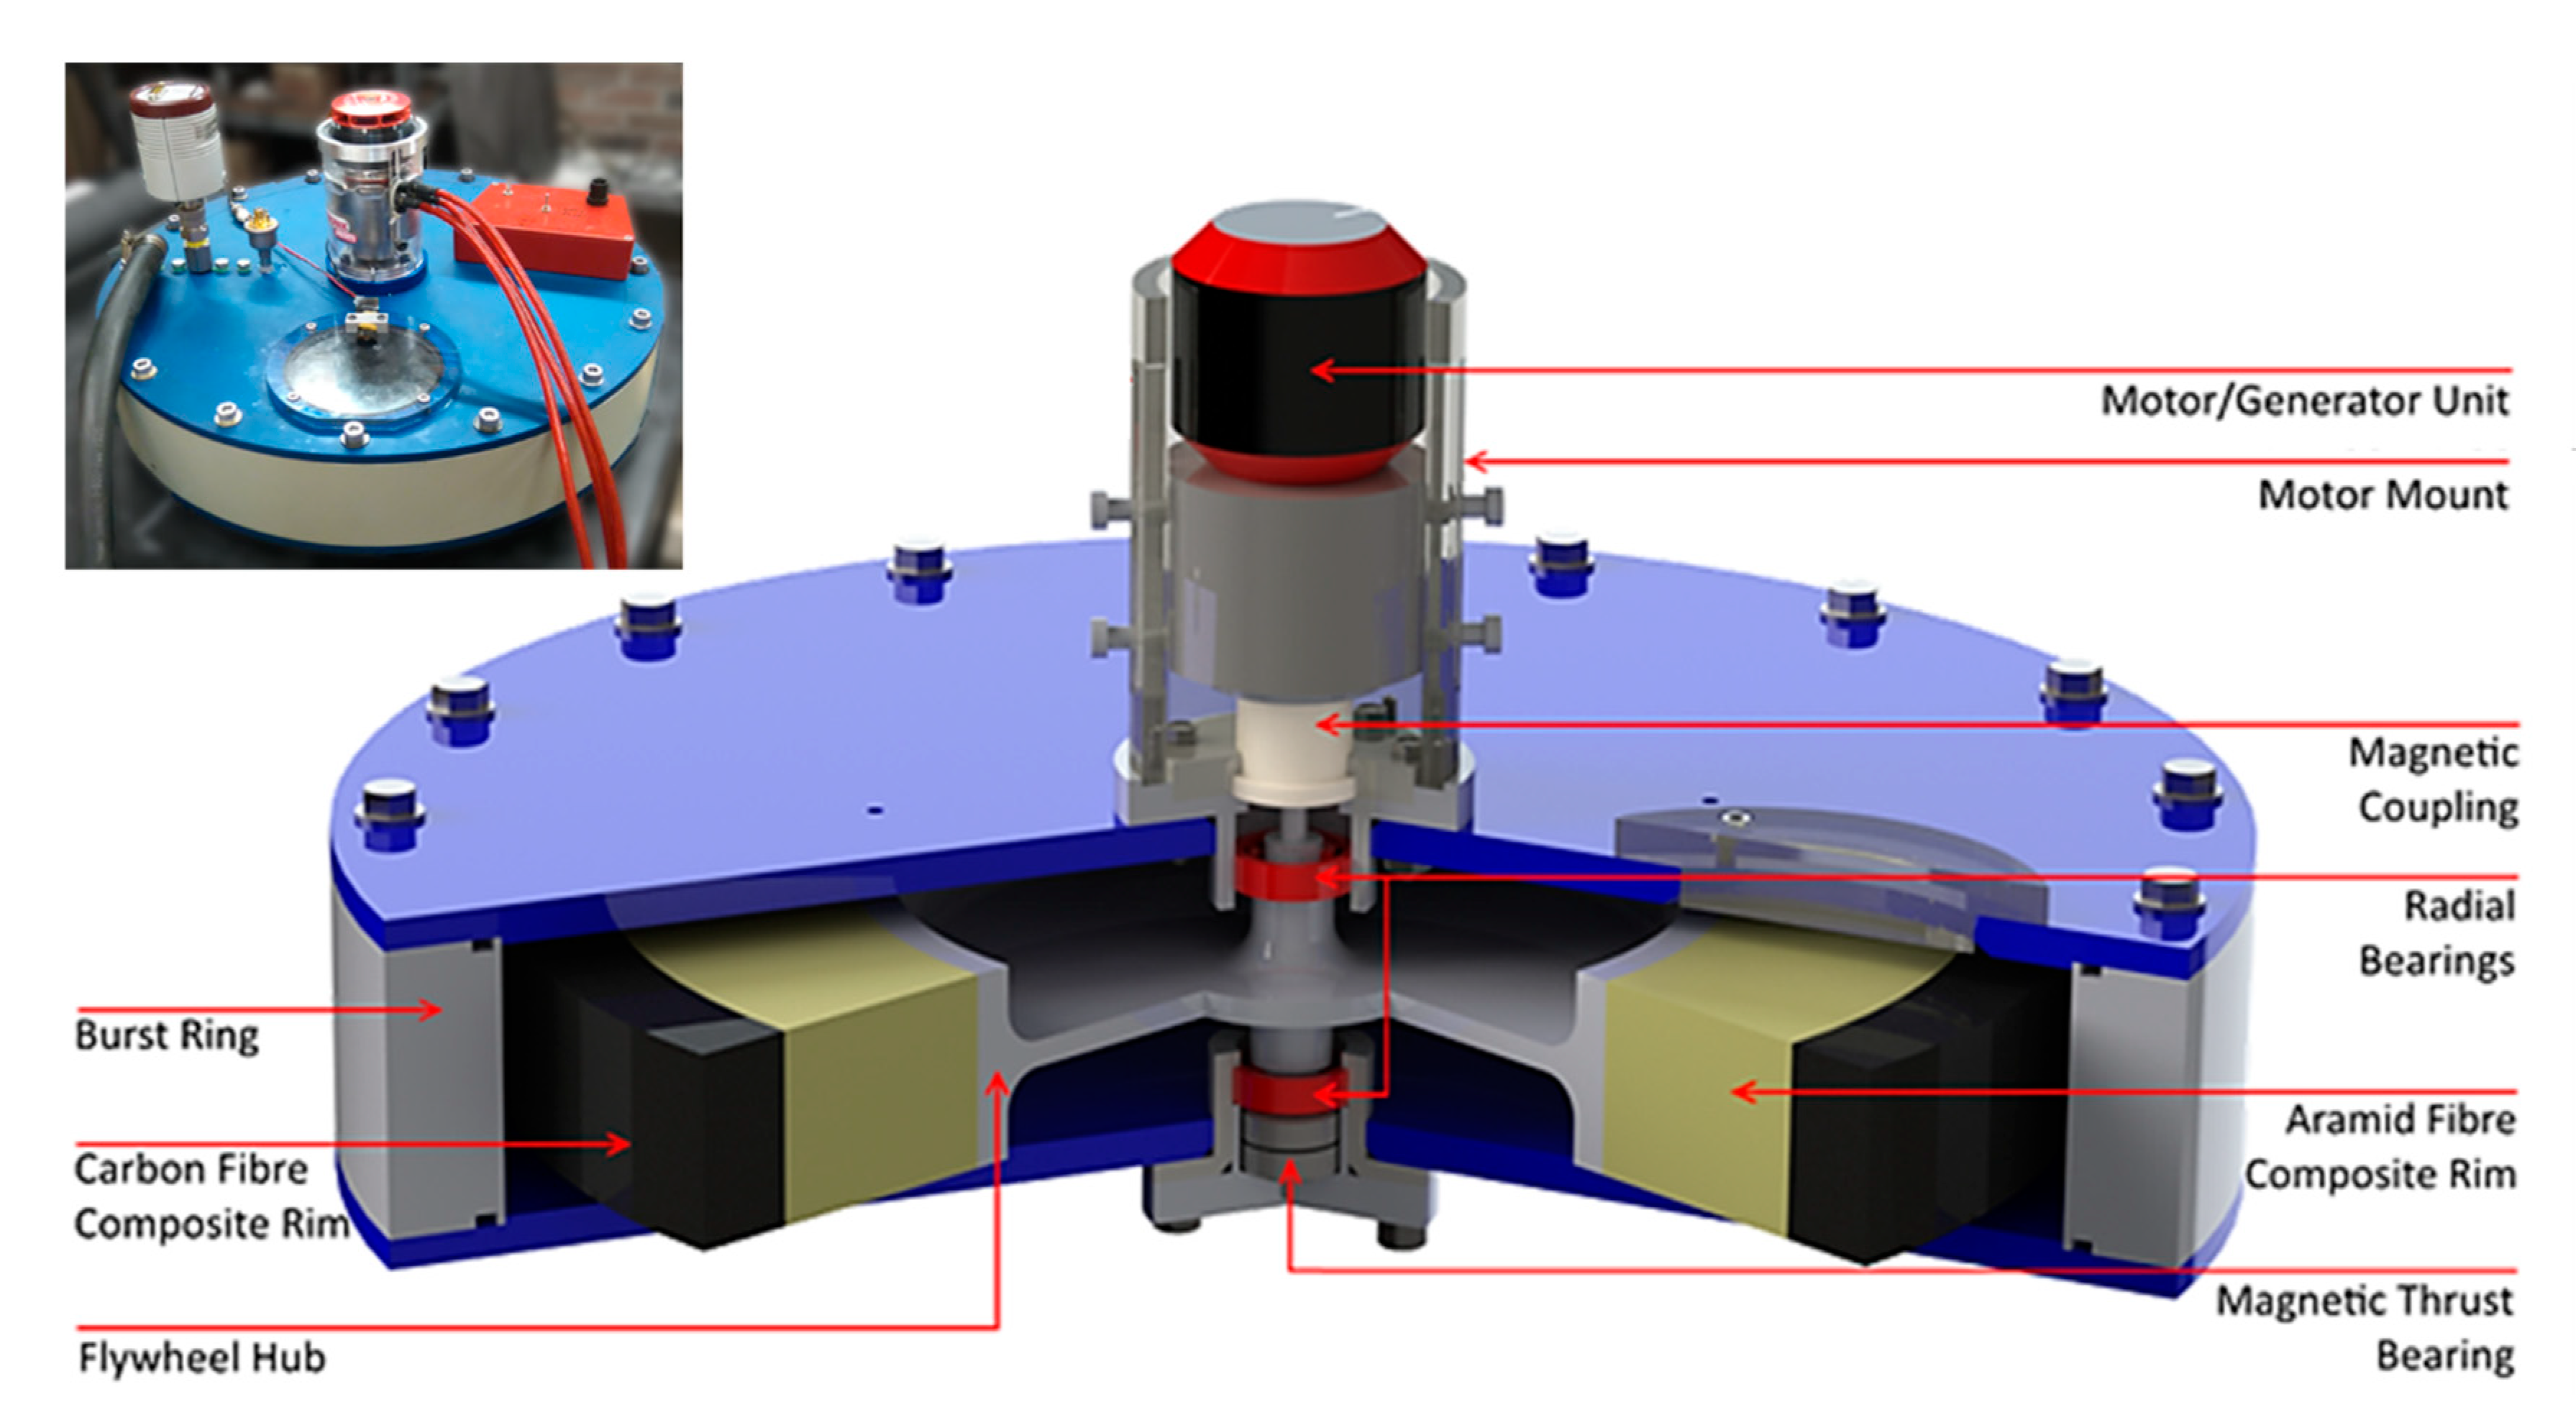
2. Experimental Setup
2.1. Housing
2.2. Rotor
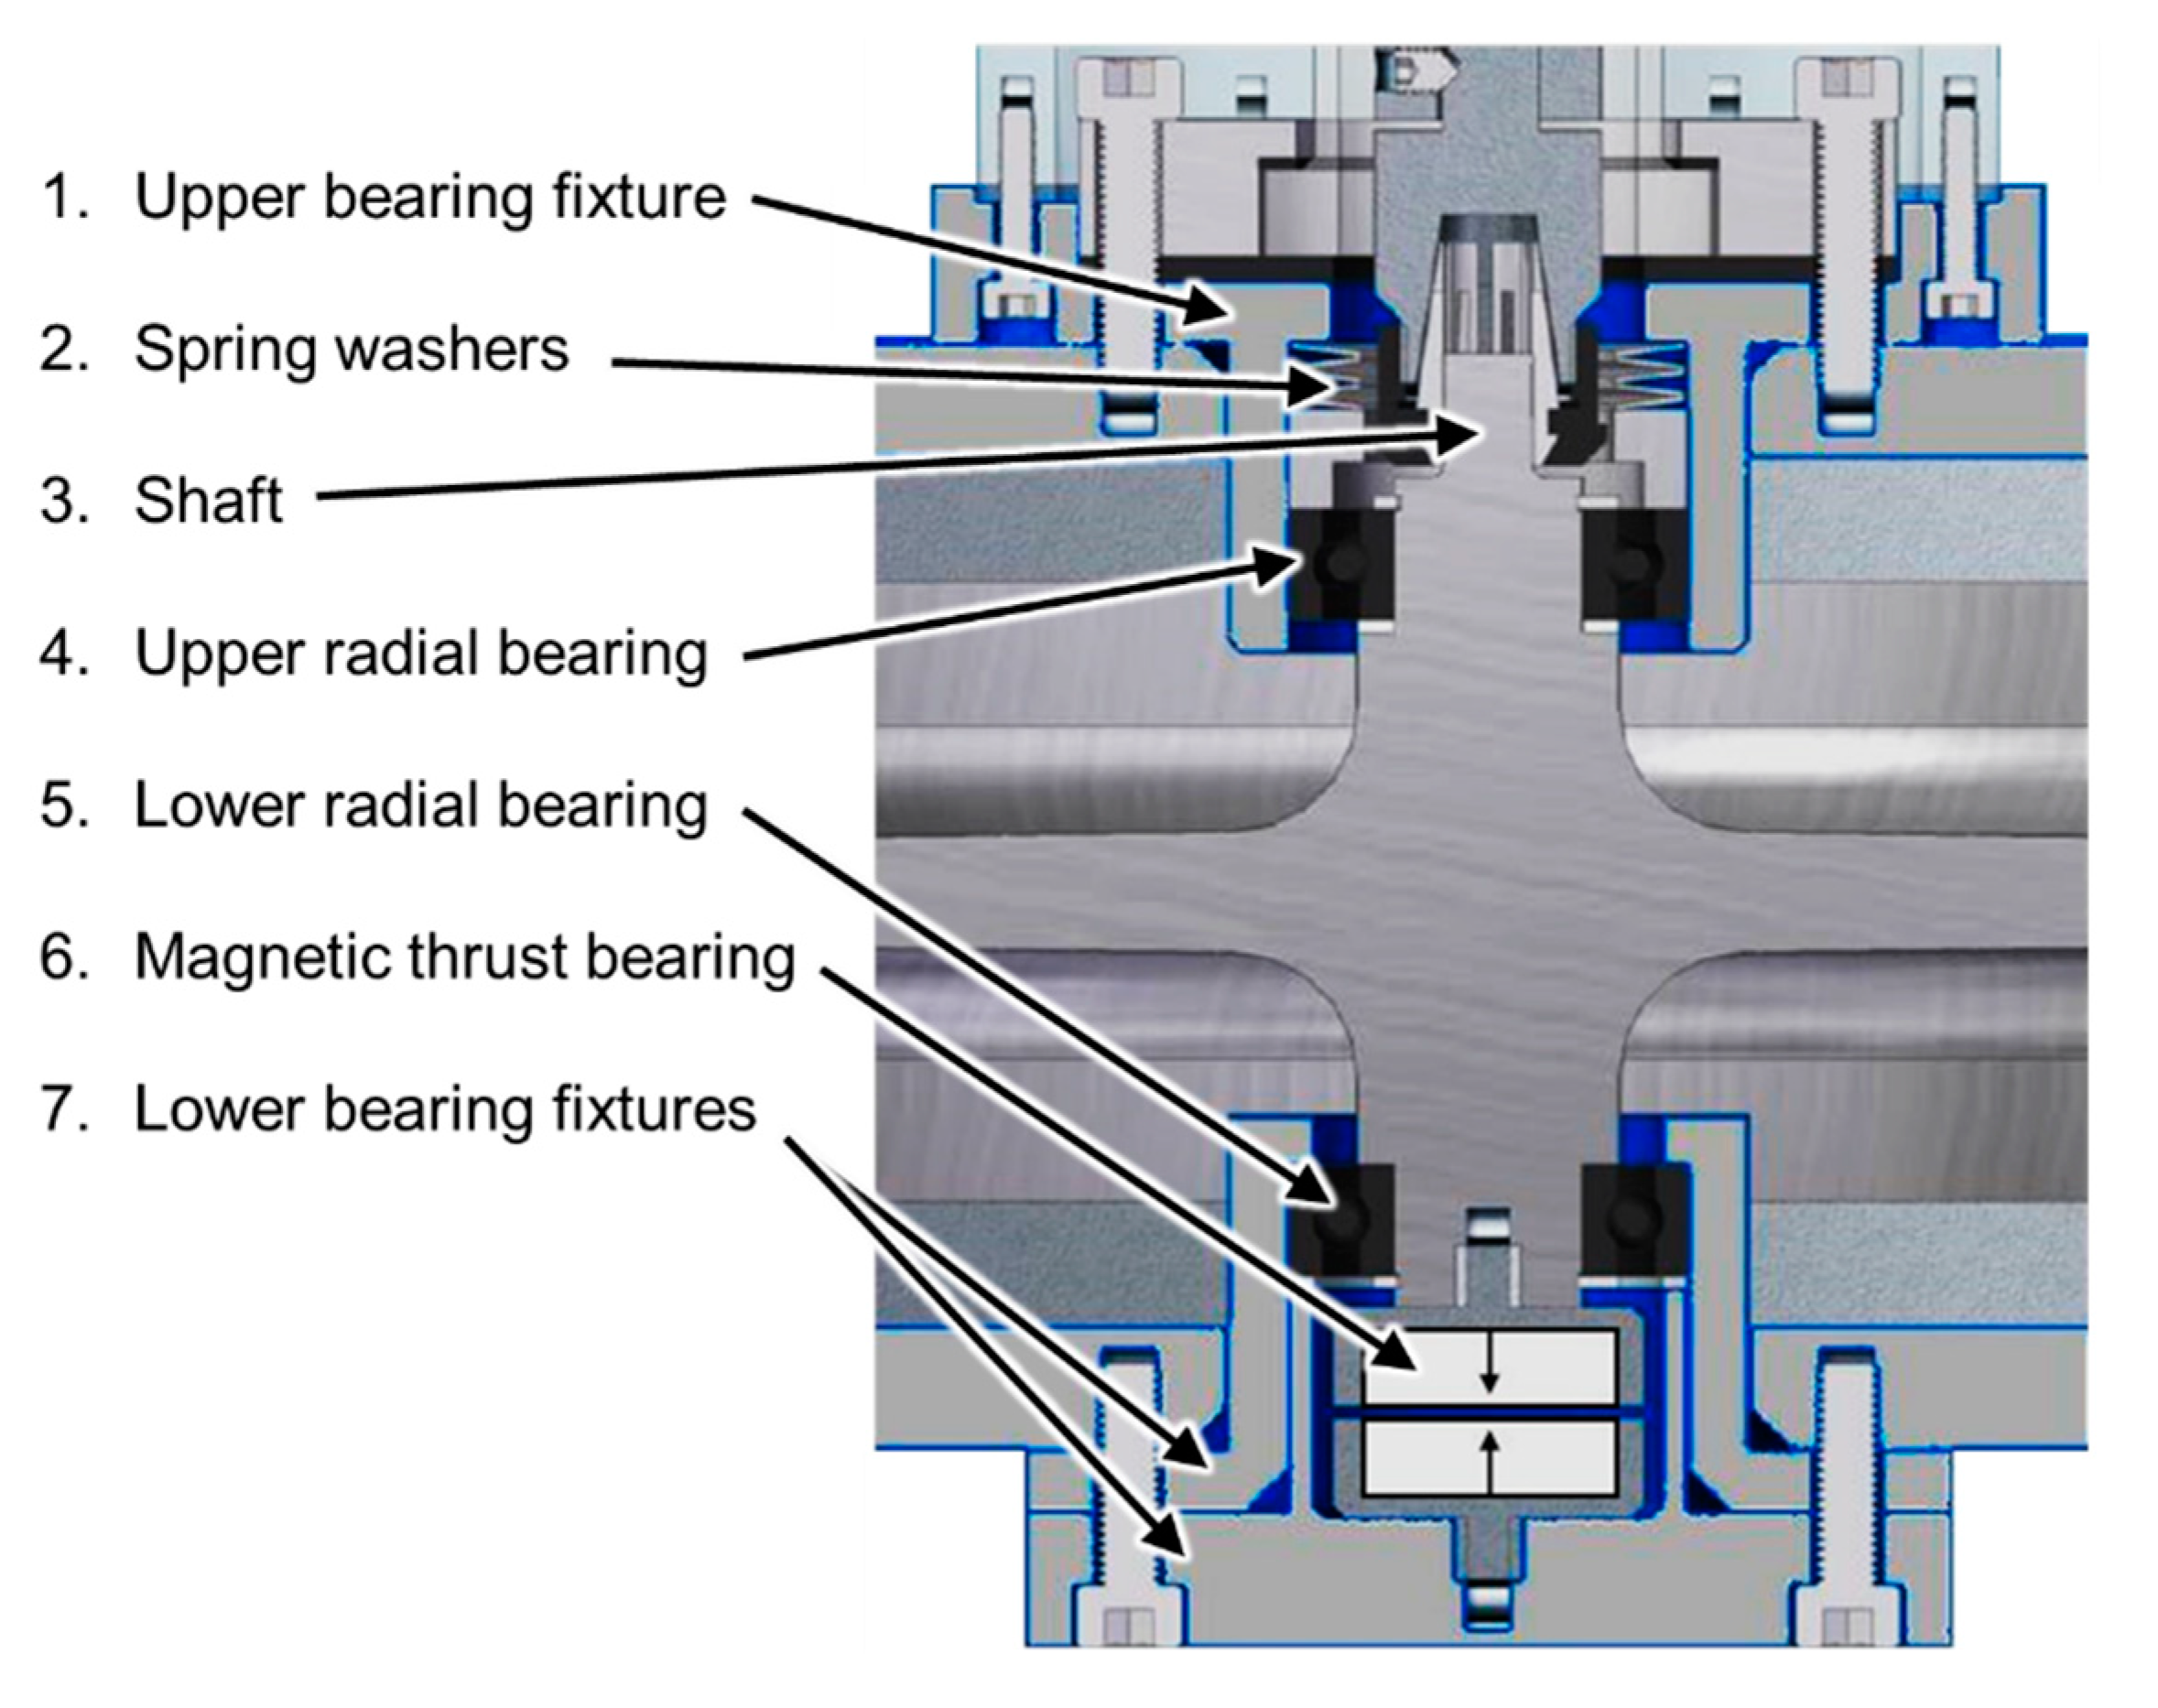
2.3. Bearings
2.4. Electrical Machine
2.5. Instrumentation and Ancillary Equipment
3. Experimental Methodology
4. Energy Storage and Discharge Models
4.1. Energy Storage and Loss
4.2. Bearing Friction Losses
4.3. Aerodynamic Drag Losses
4.4. Electrical Machine Losses
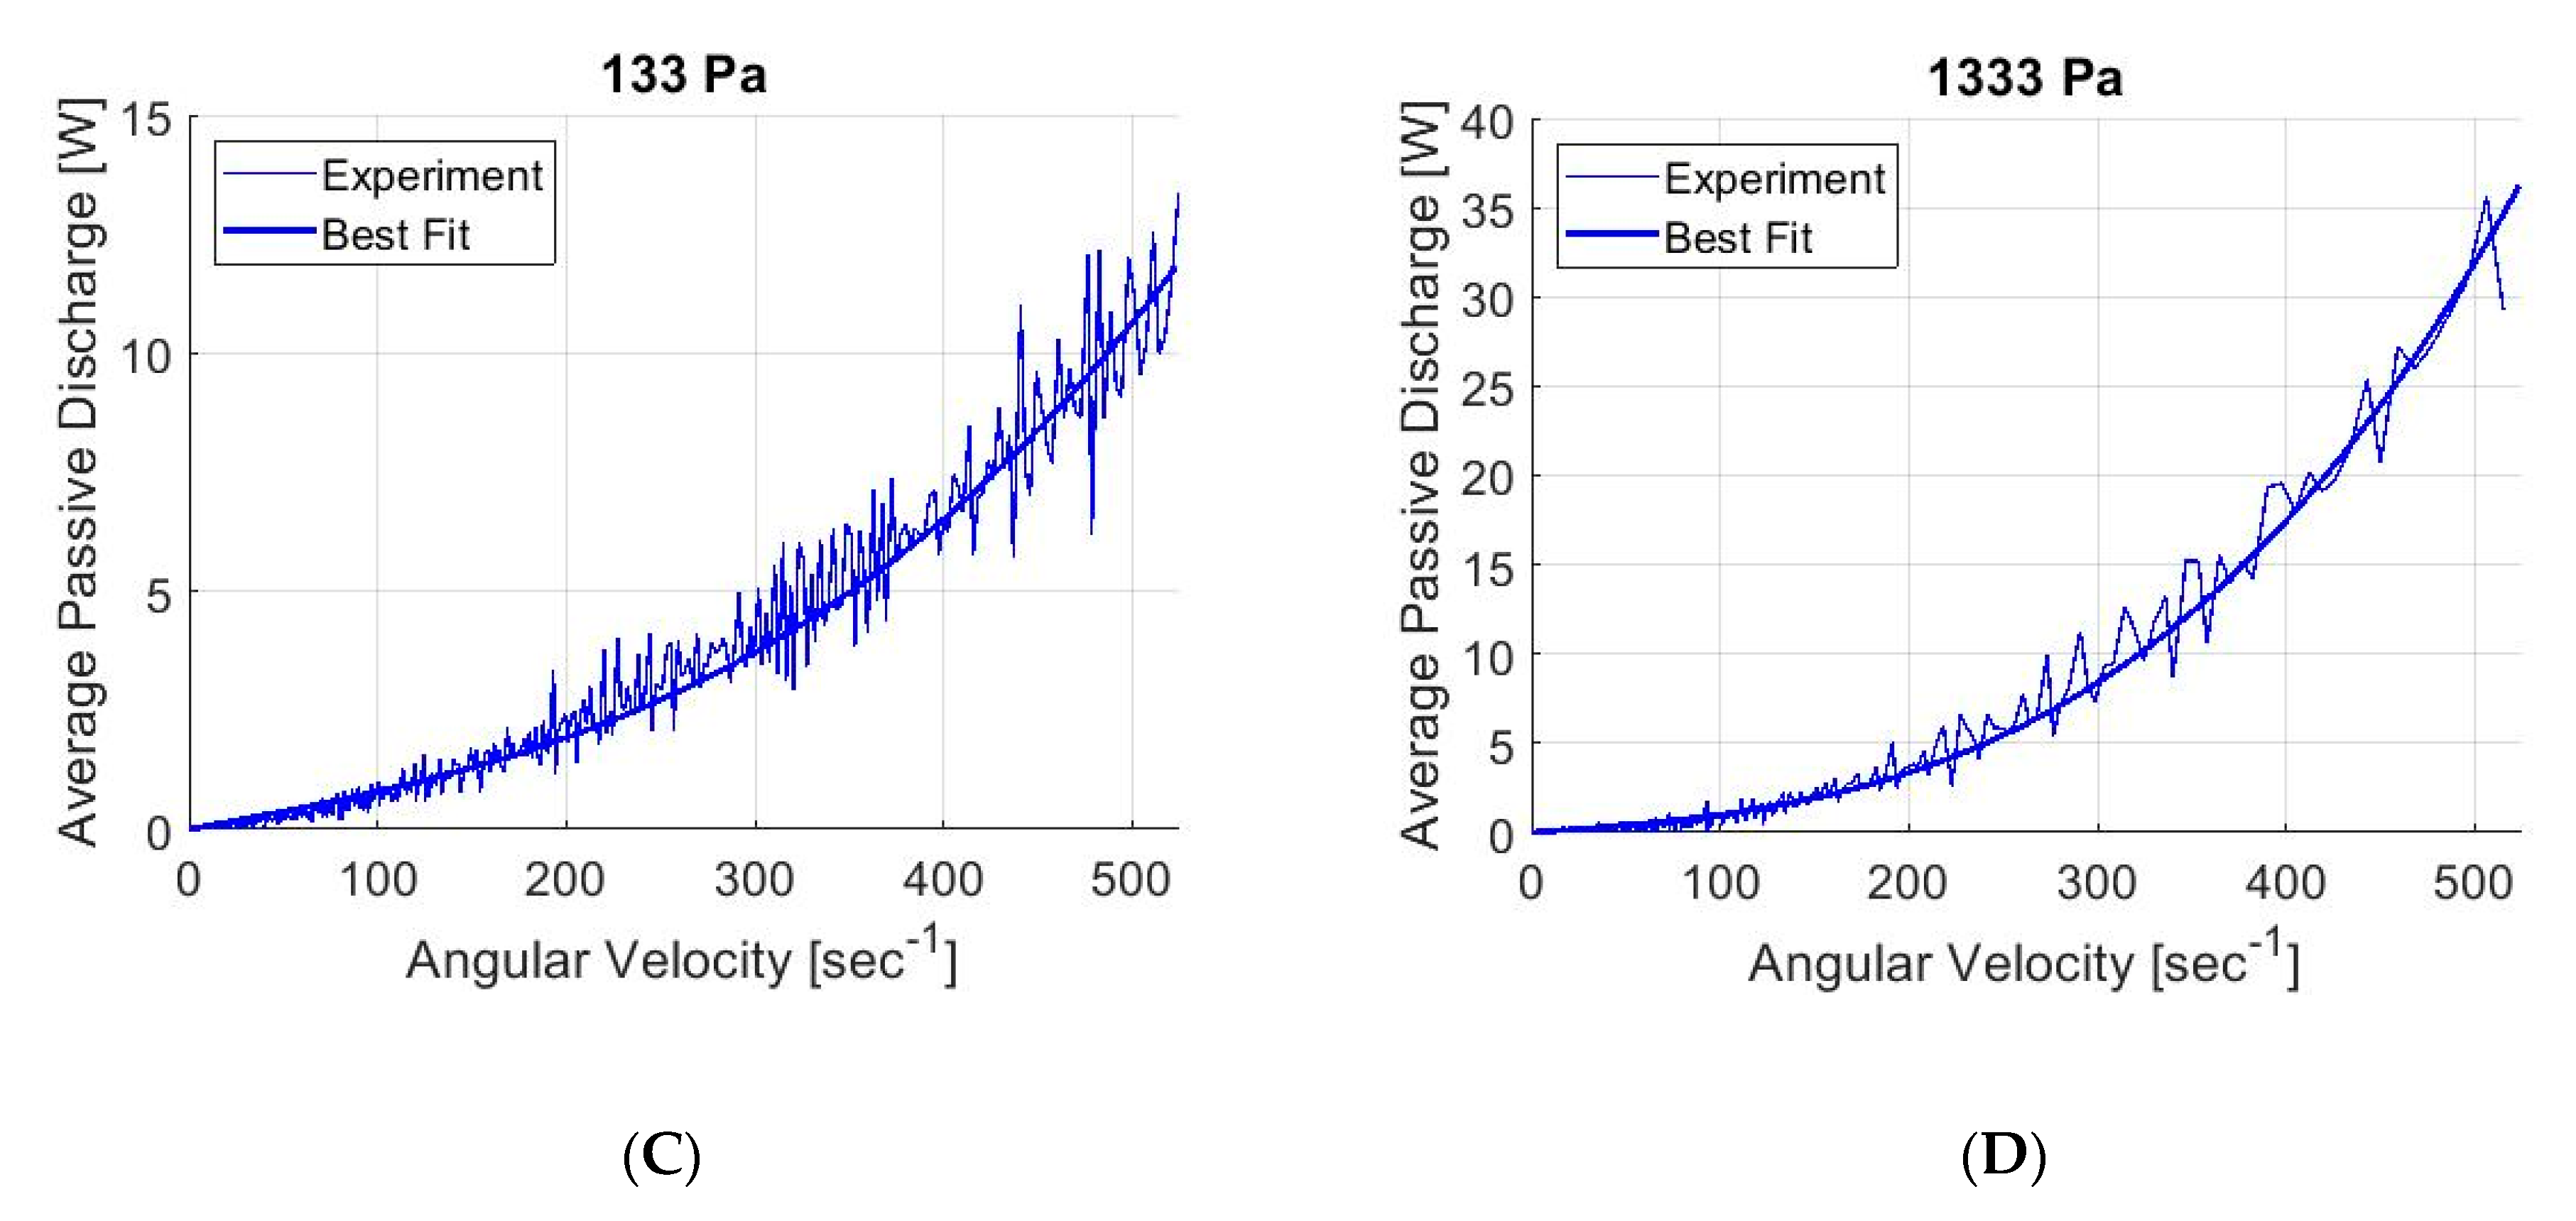
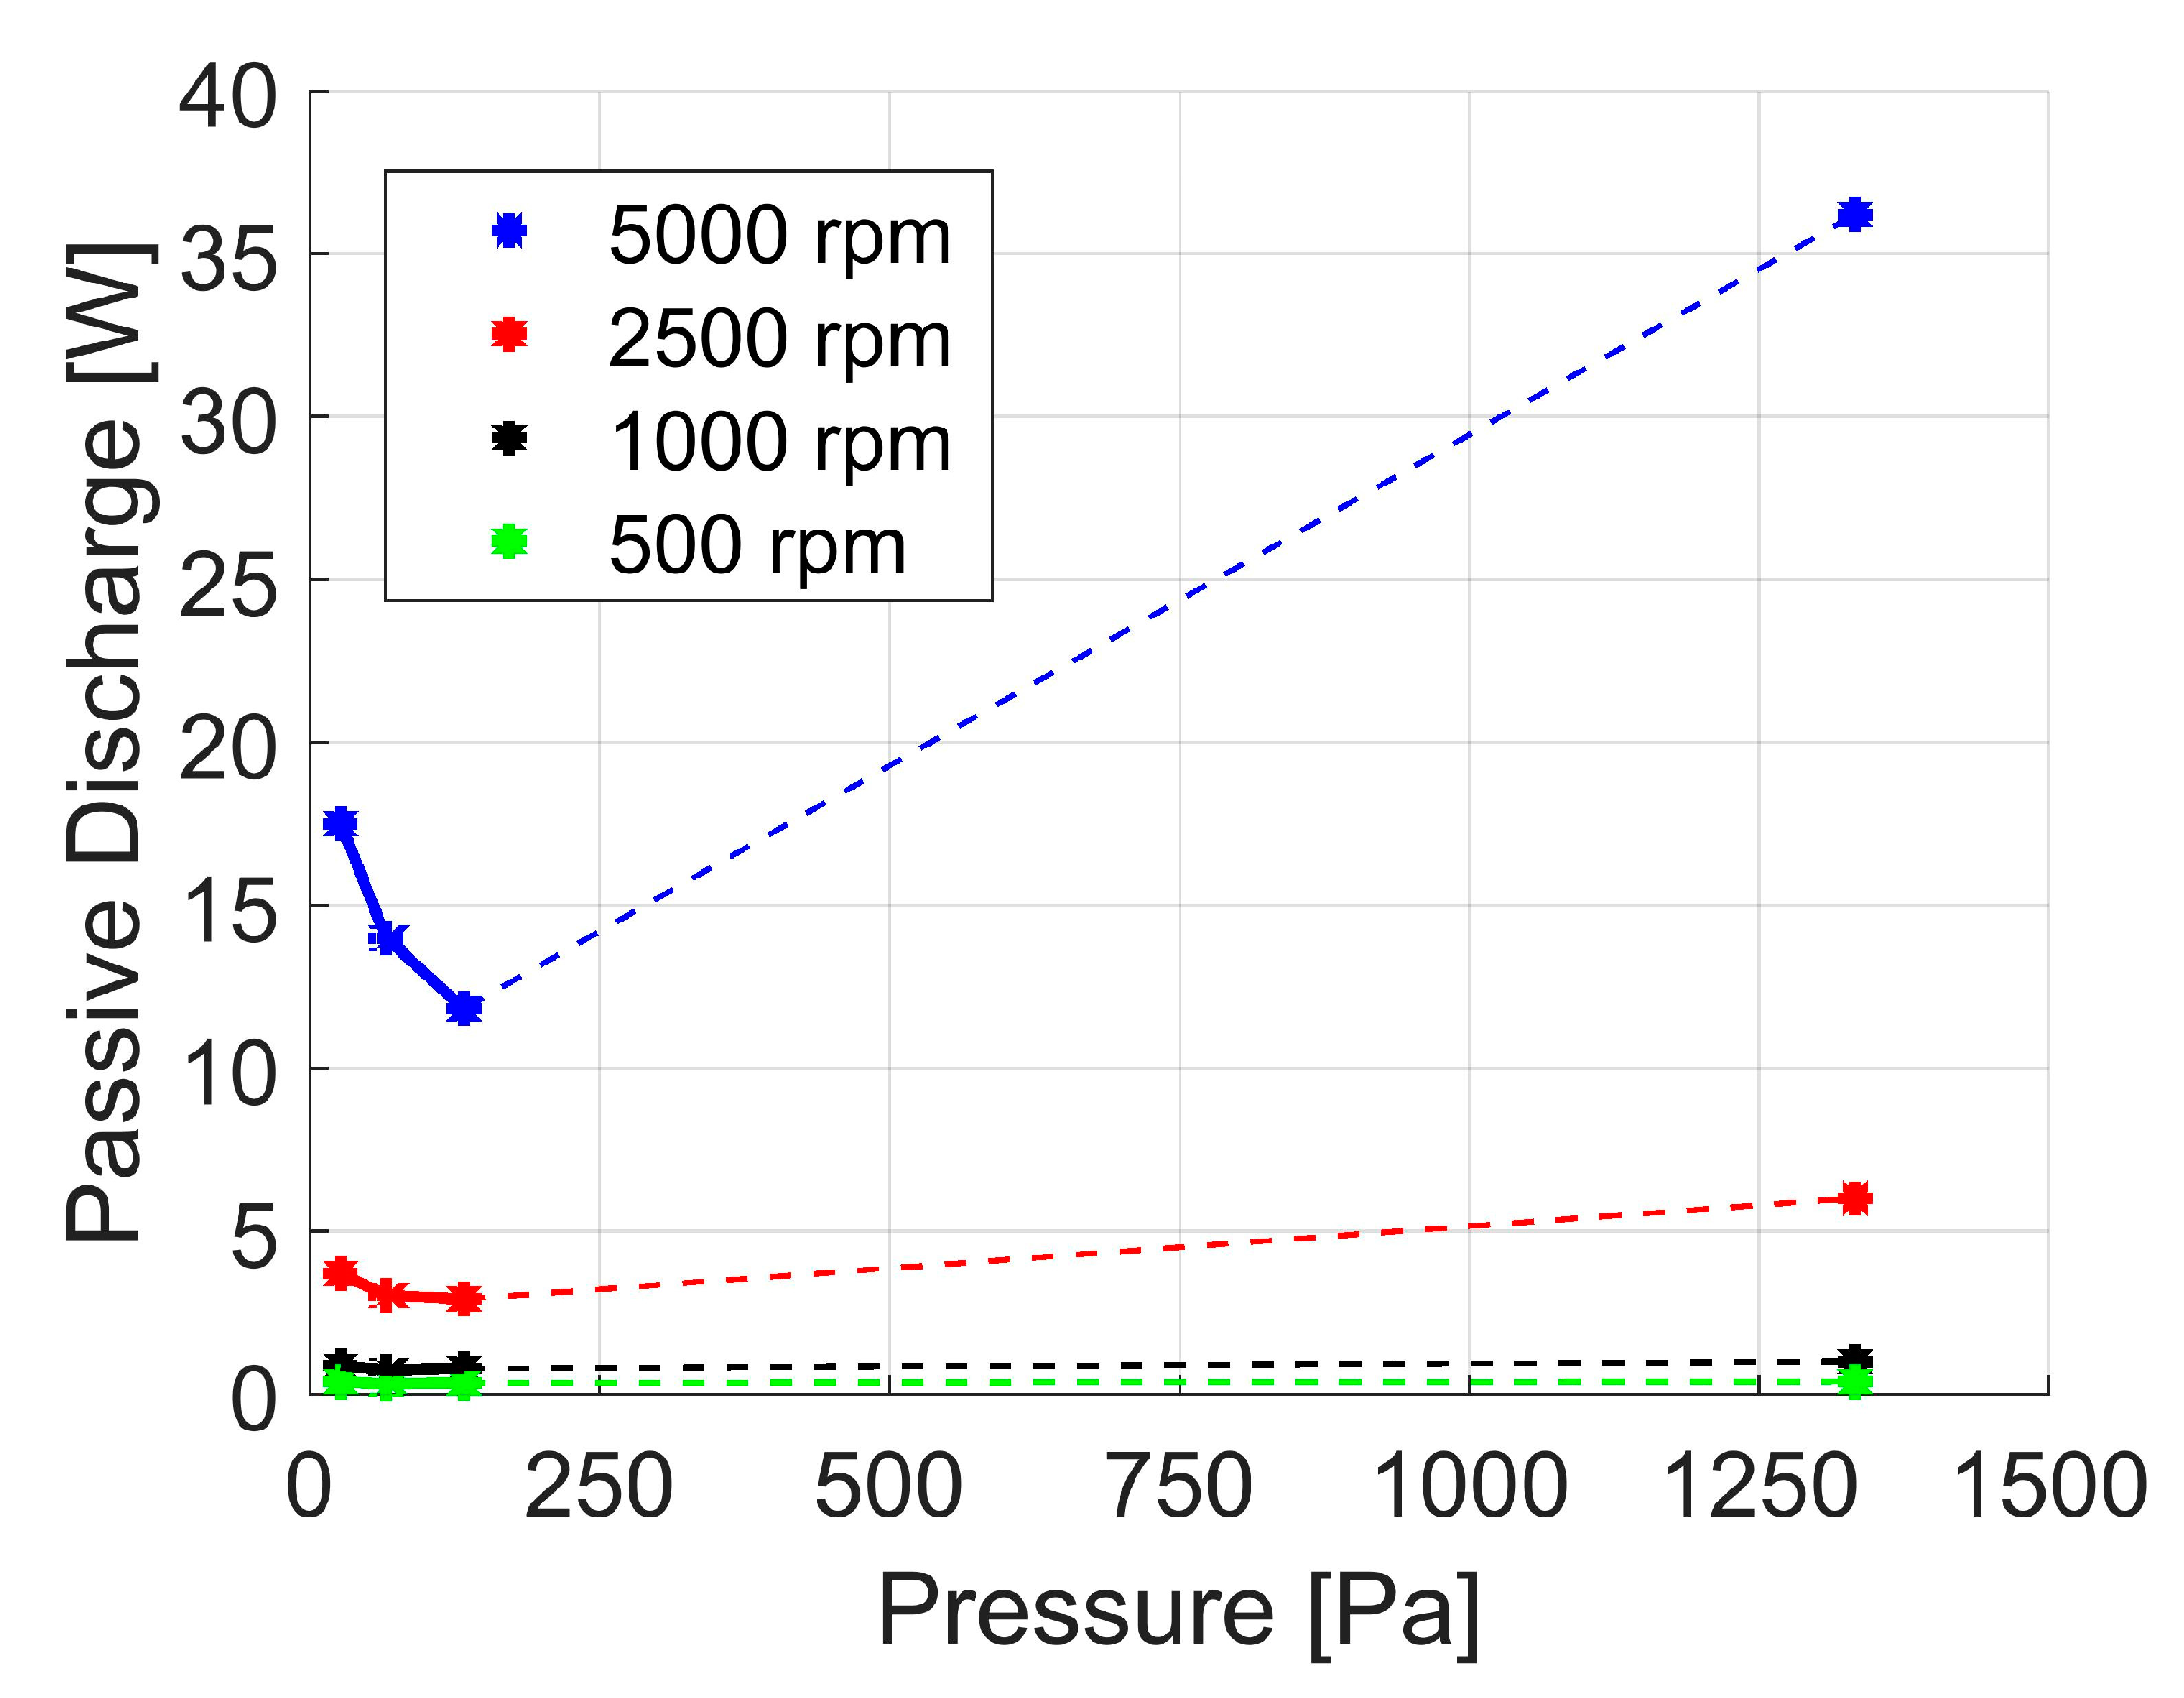
5. Results and Discussion
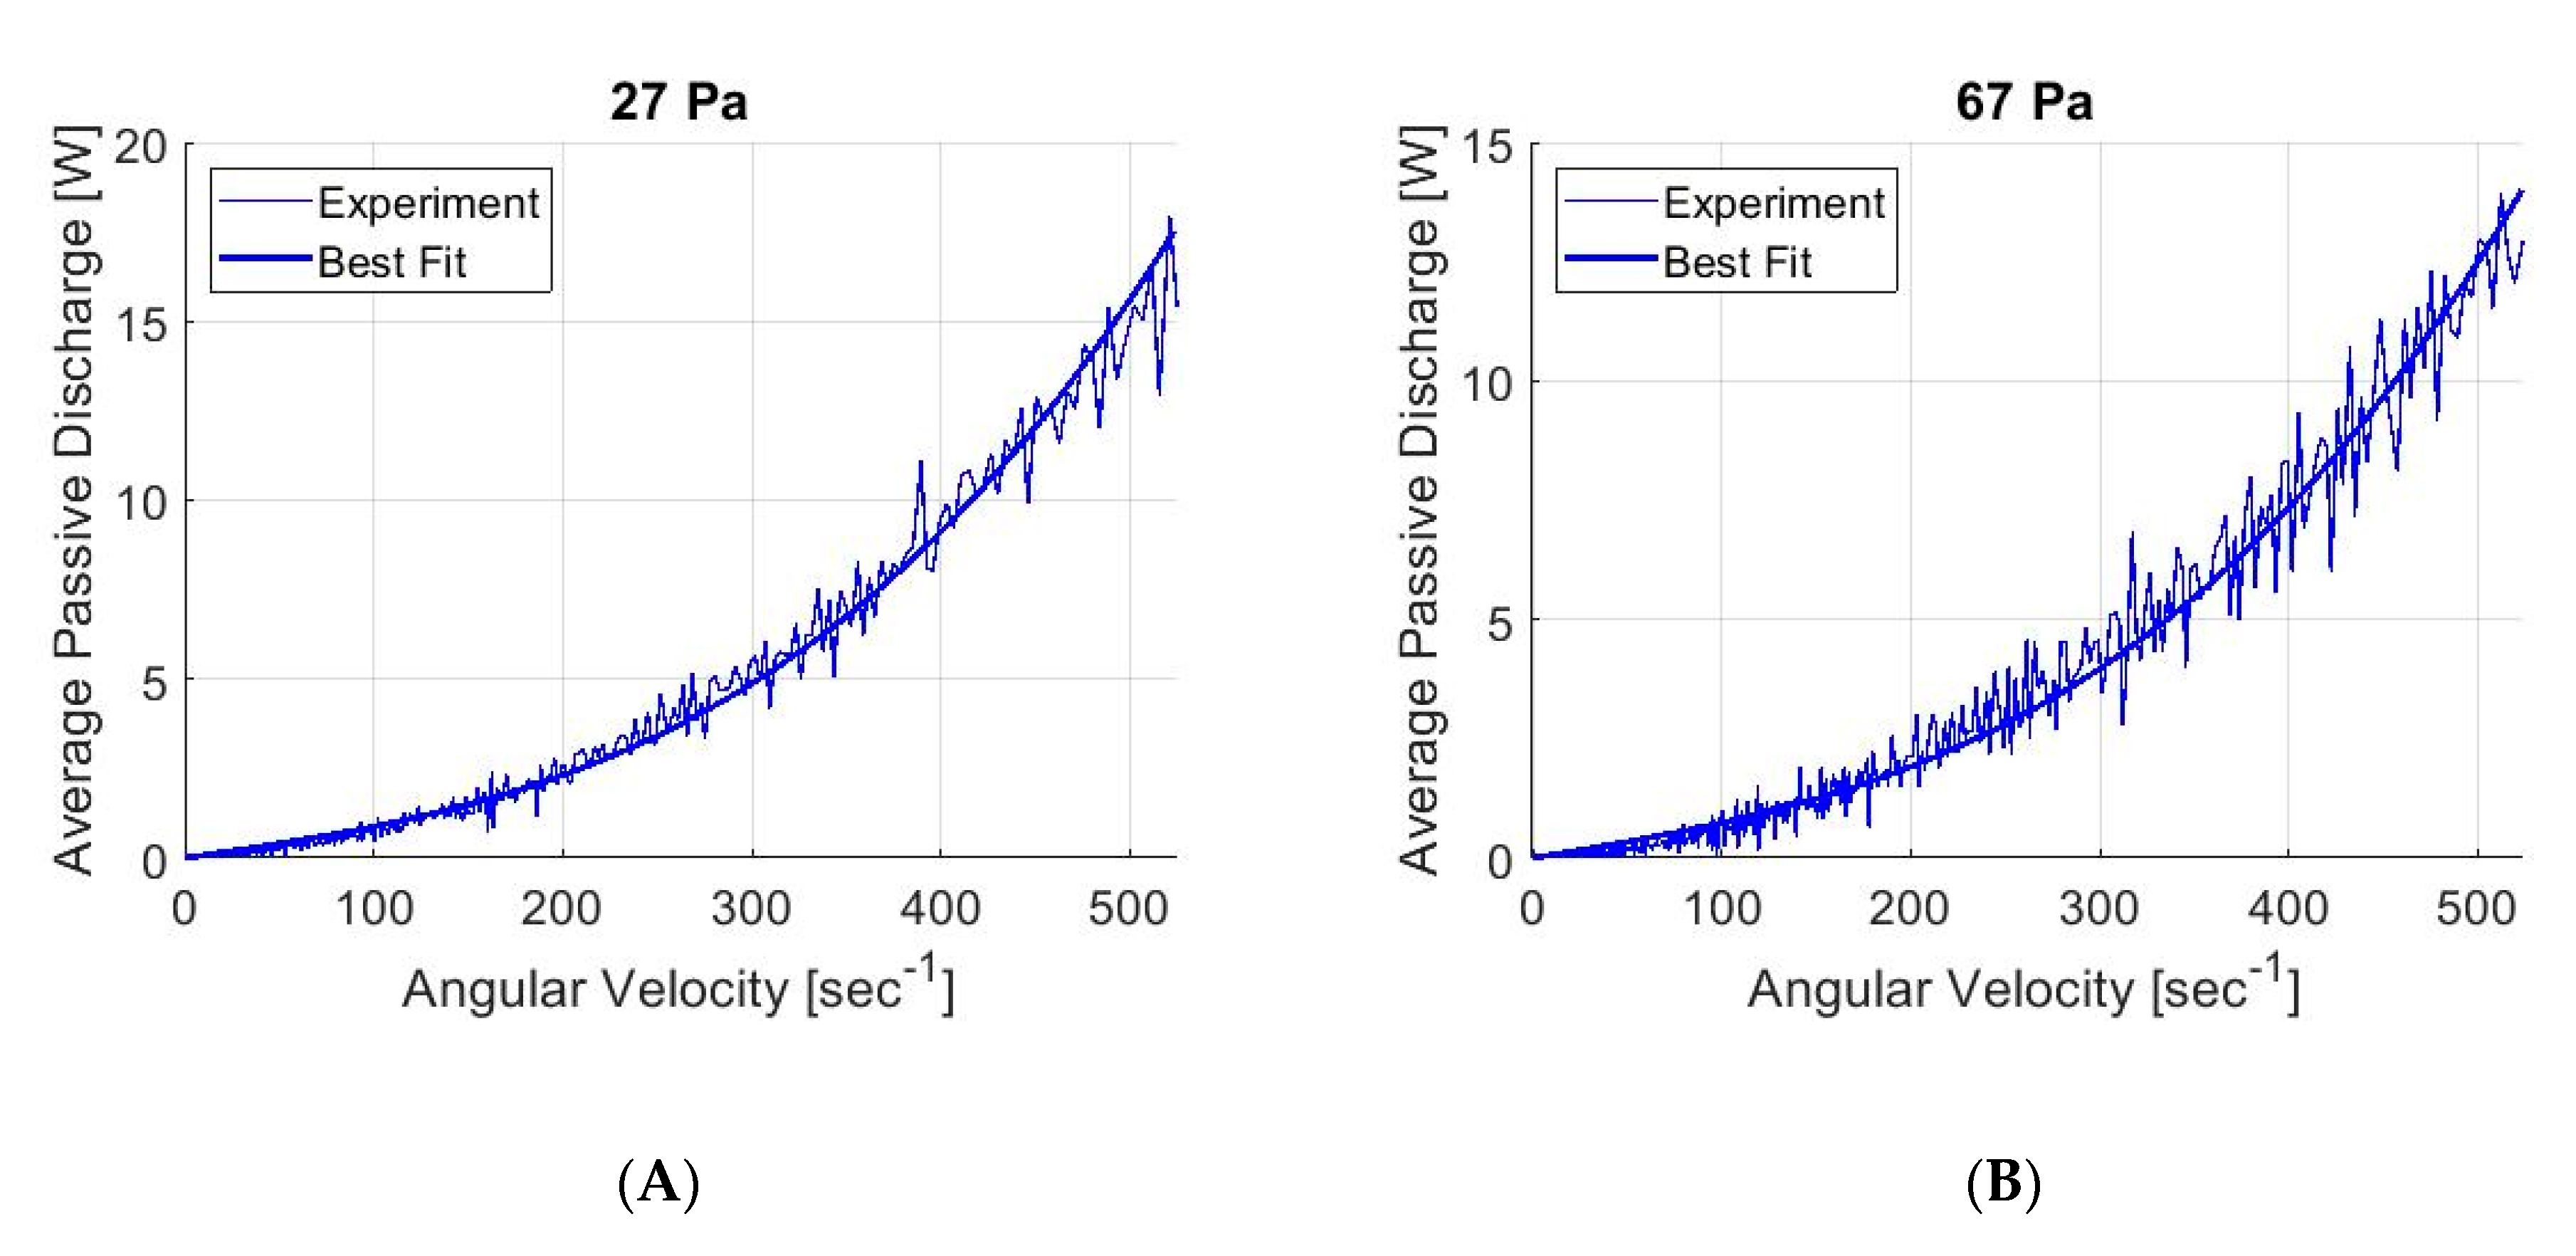
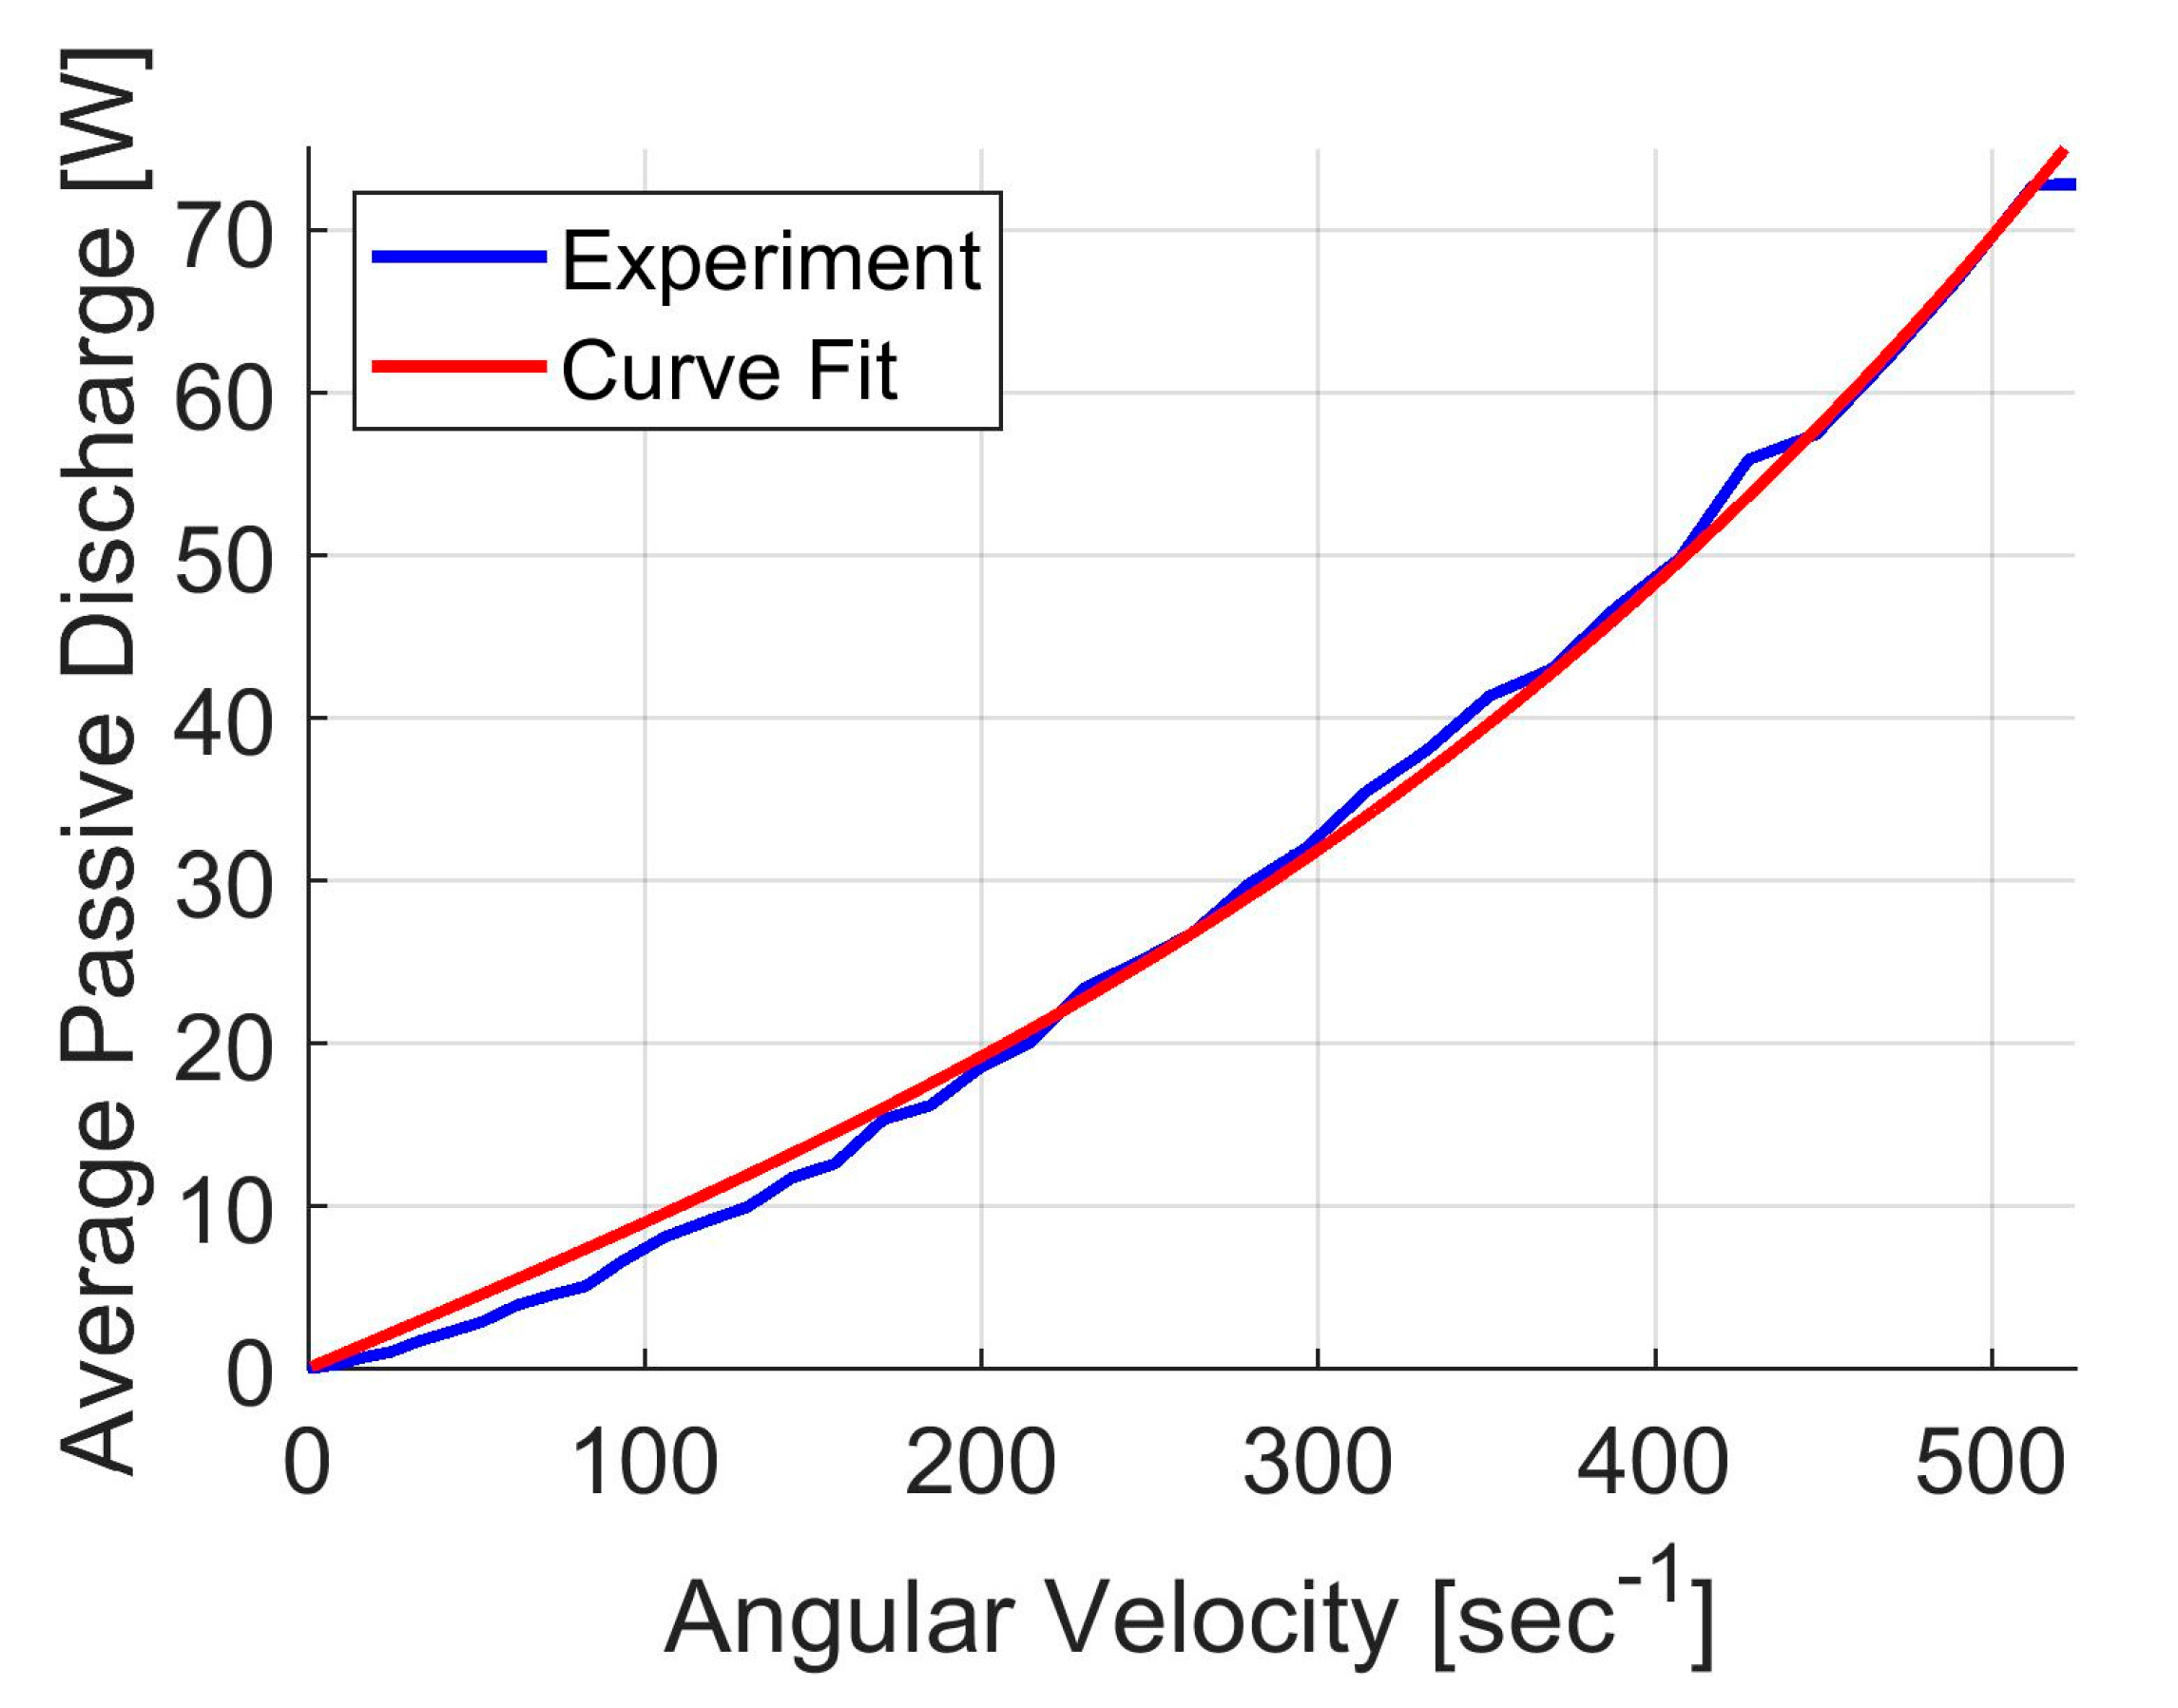
5.1. Baseline Losses
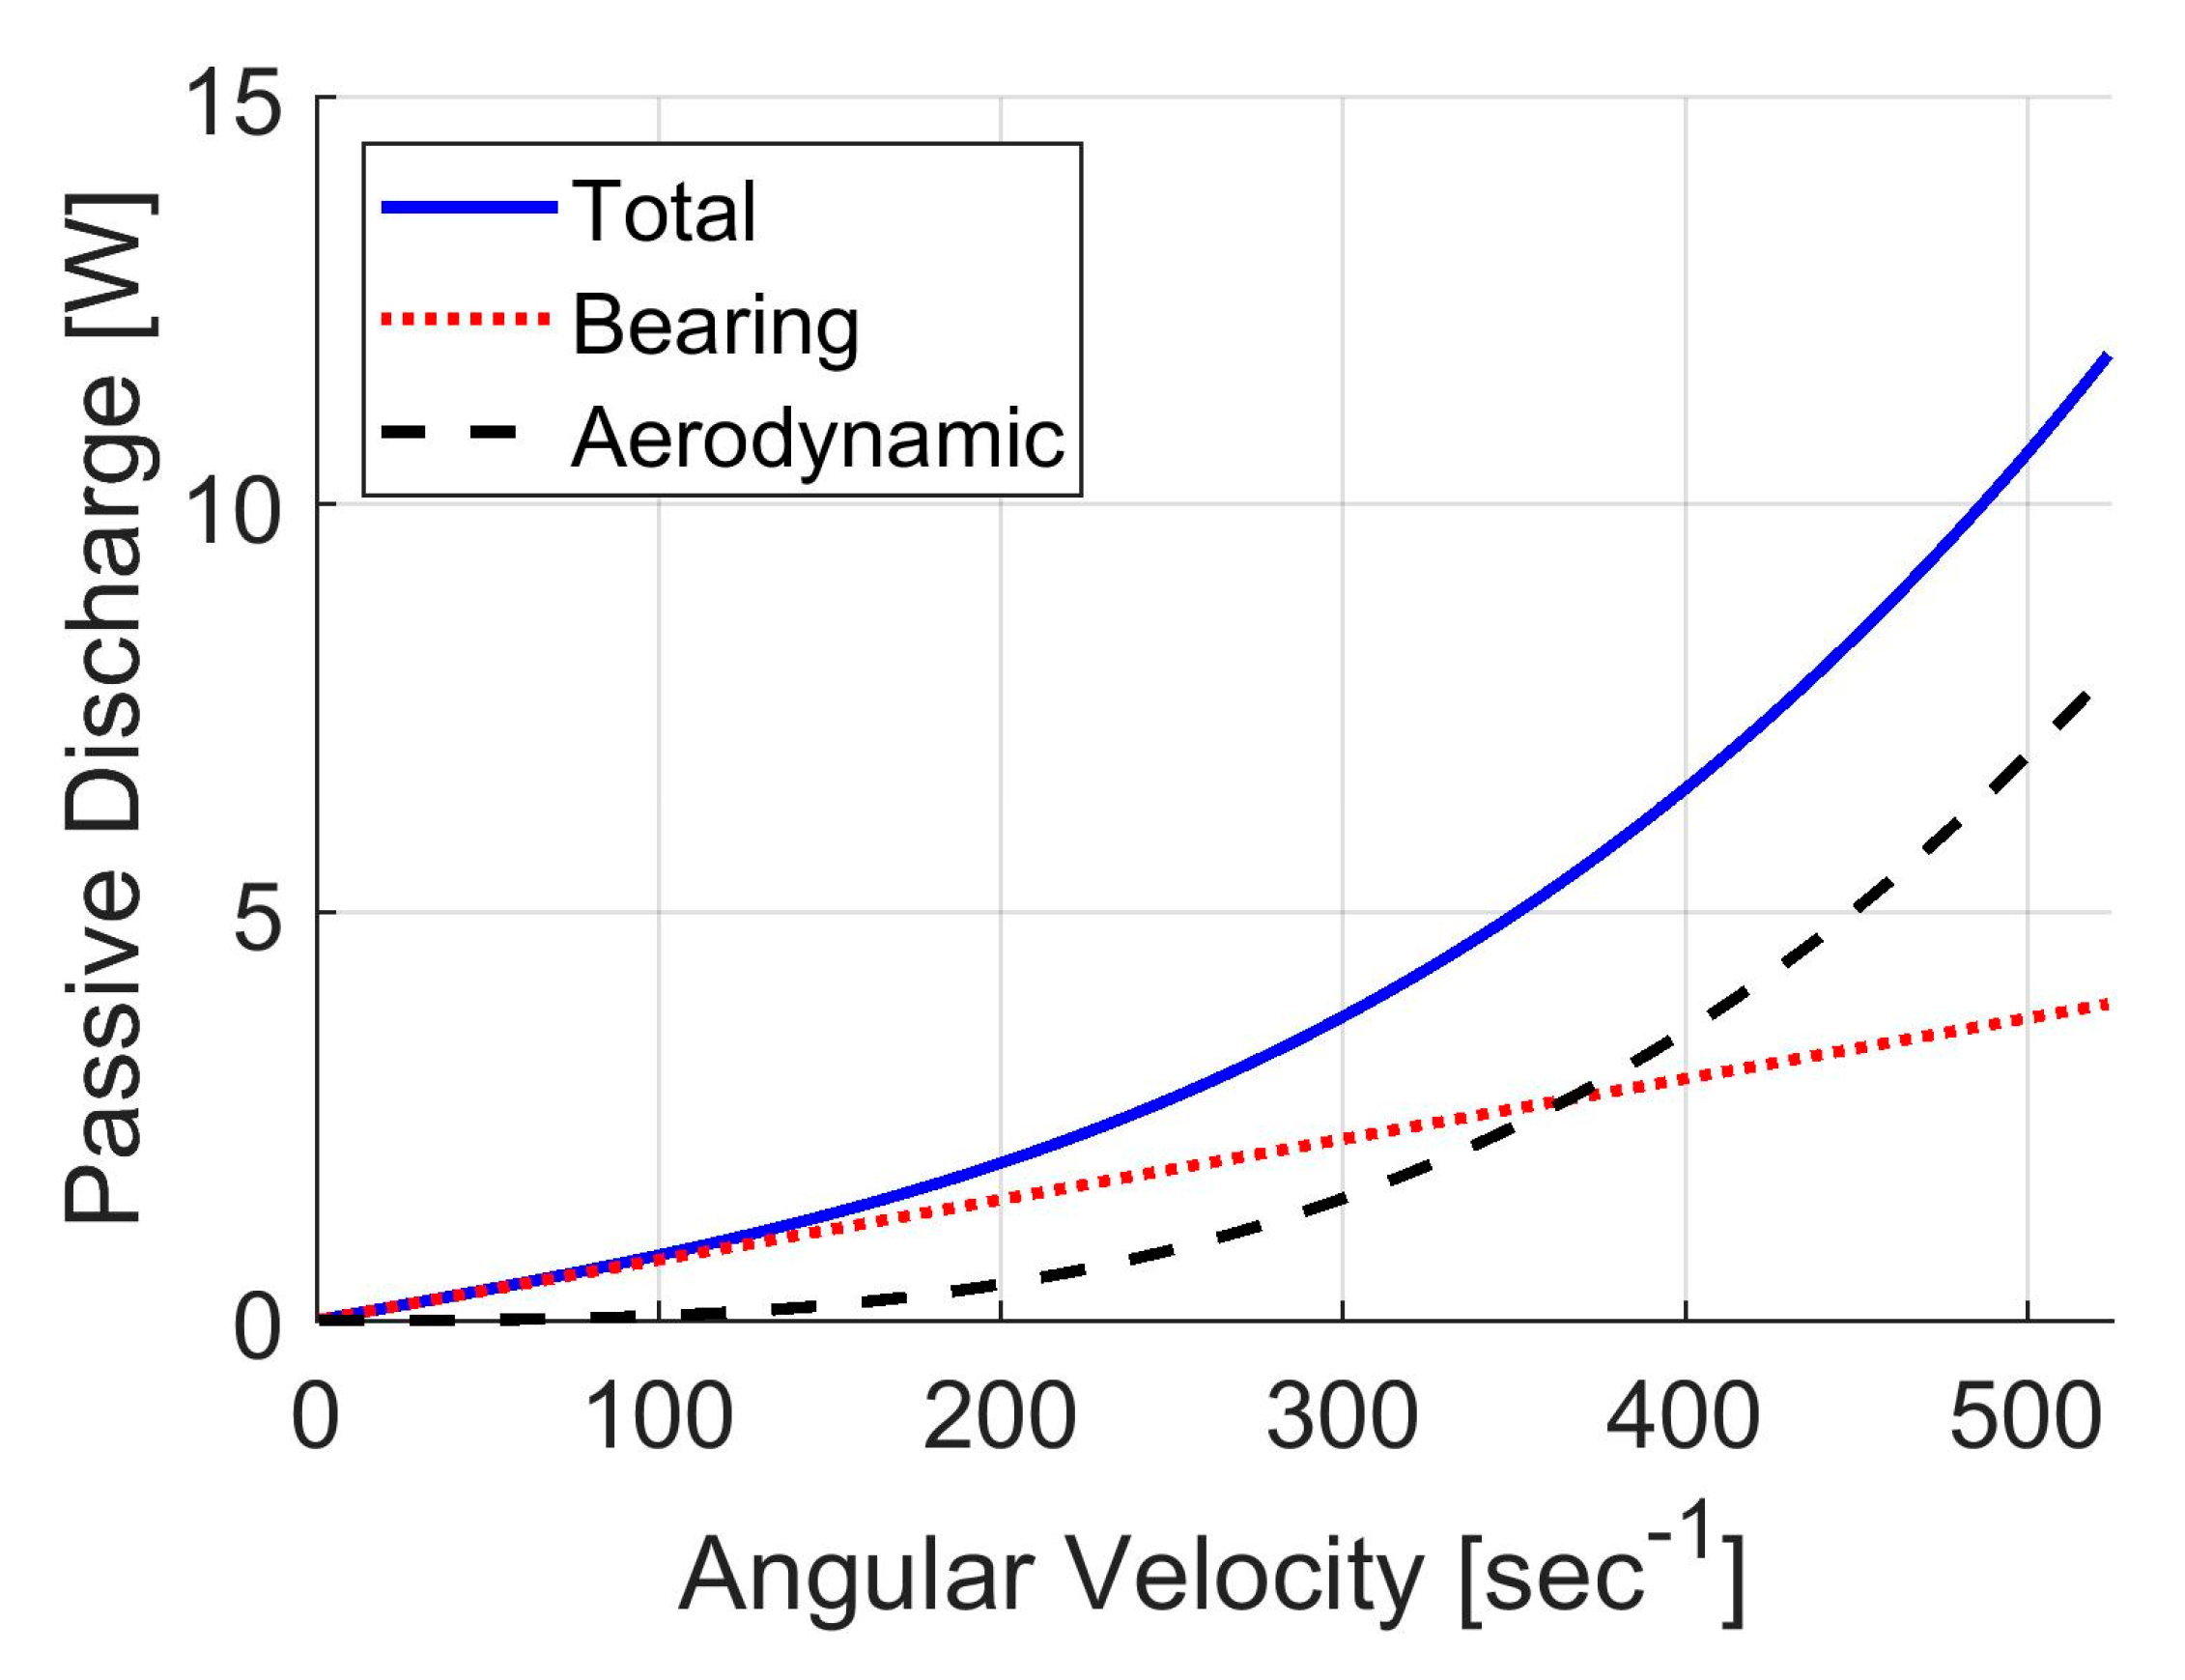
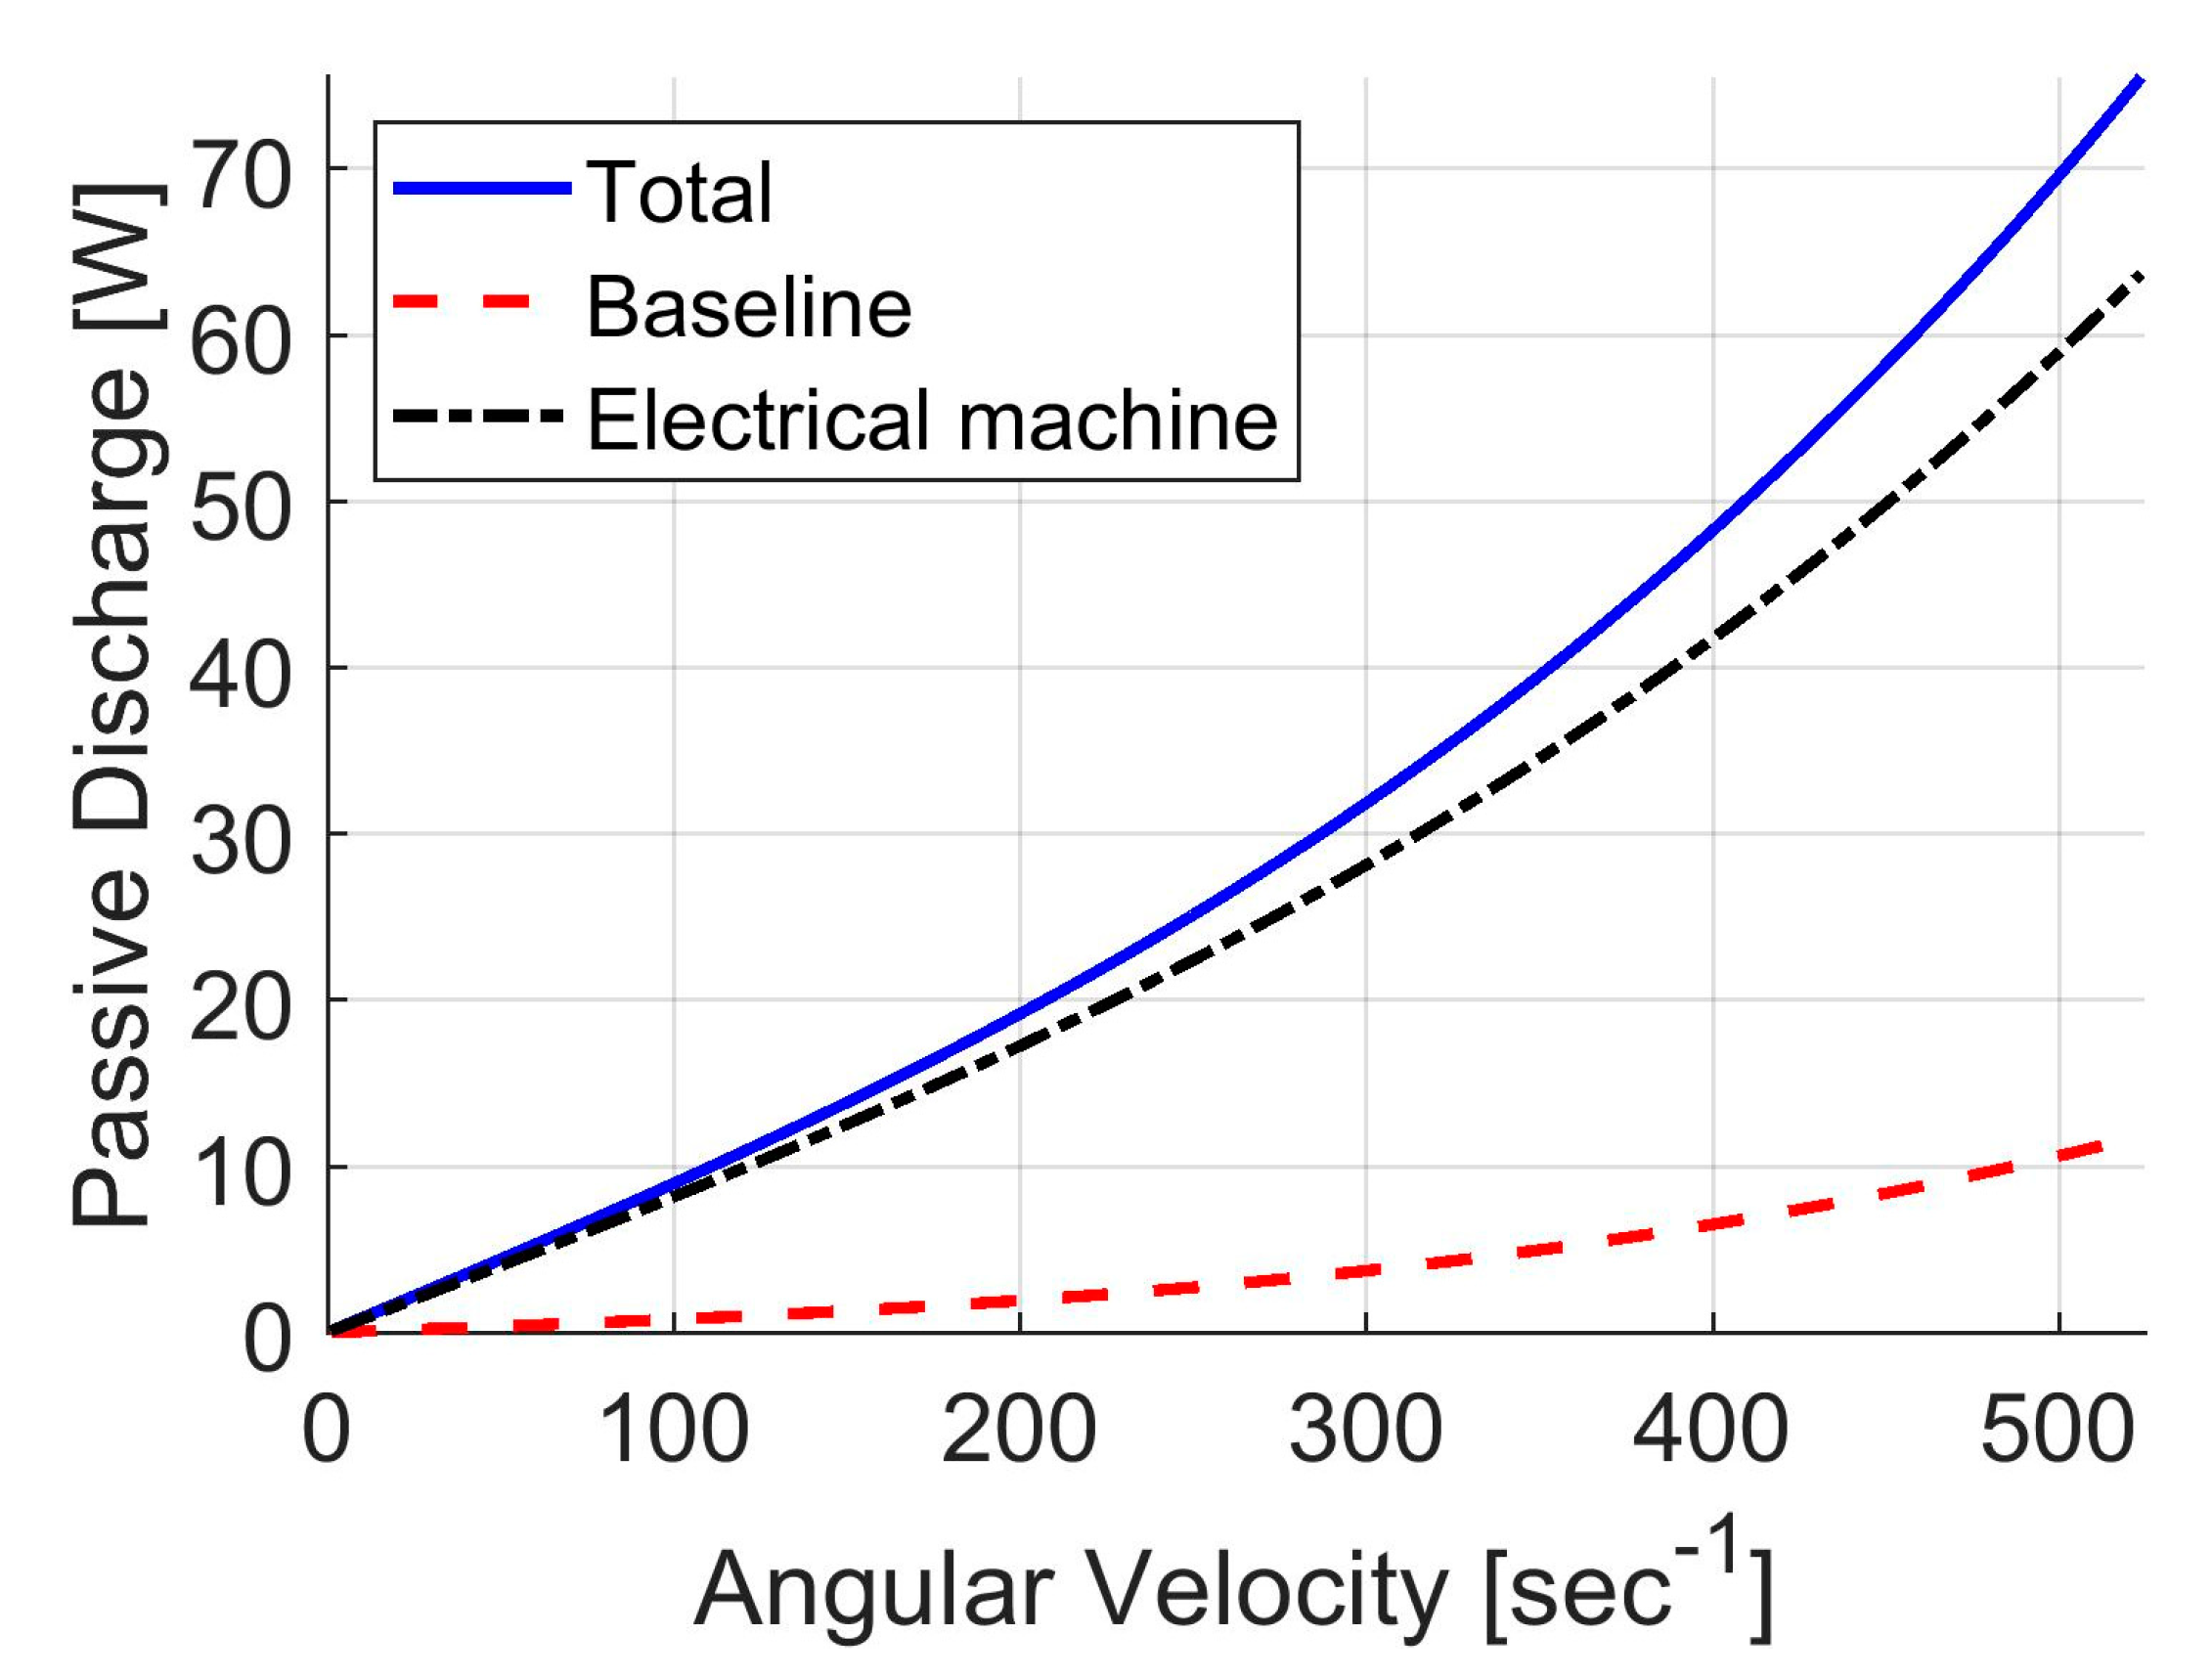
5.2. Discerning Sources of Passive Discharge
6. Conclusions
Author Contributions
Funding
Acknowledgments
Conflicts of Interest
References
- Dunn, B.; Kamath, H.; Tarascon, J.M. Electrical storage for the grid: A battery of choices. Science 2011, 334, 928–935. [Google Scholar] [CrossRef] [PubMed] [Green Version]
- Luo, X.; Wang, J.; Dooner, M.; Clark, J. Overview of current development in electrical energy storage technologies and application potential in power system operation. Appl. Energy 2015, 137, 511–536. [Google Scholar] [CrossRef] [Green Version]
- Hadjipaschalis, I.; Poullikkas, A.; Efthimiou, V. Overview of current and future energy storage technologies for electric power applications. Renew. Sistain. Energy Rev. 2009, 13, 1513–1522. [Google Scholar] [CrossRef]
- Mulcahy, T.; Hull, J.; Uherka, K.; Abbound, R.; Juna, J. Test results of 2-kWh flywheel using passive PM and HTS bearings. IEEE Trans. Appl. Supercond. 2001, 11, 1729–1739. [Google Scholar] [CrossRef]
- Schulz, A.; Sima, S.; Hinterdorfer, T.; Wassermann, J. Innovative Schwungradspeicher mit hoher Energieeffizienz und Zuverlässigkeit. Elektrotech. Informationstechnik 2015, 132, 481–490. [Google Scholar] [CrossRef]
- Coombs, T.A.; Campbell, A.M.; Cardwell, D.A. Development of an active superconducting magnetic bearing. IEEE Trans. Appl. Supercond. 1995, 5, 630–633. [Google Scholar] [CrossRef]
- Xia, Z.; Chen, Q.Y.; Ma, K.B.; McMichael, C.K.; Lamb, M.; Cooley, R.S.; Fowler, P.C.; Chu, W.K. Design of superconducting magnetic bearings with high levitating force for flywheel energy storage systems. IEEE Trans. Appl. Supercond. 1995, 5, 622–625. [Google Scholar] [CrossRef]
- Filatov, A.V.; Maslen, E.H. Passive magnetic bearing for flywheel energy storage systems. IEEE Trans. Magn. 2001, 37, 3913–3924. [Google Scholar] [CrossRef]
- Ertz, G. Development, Manufacturing and Testing of a Multi-Rim (Hybrid) Flywheel Rotor. Master’s Thesis, Leibniz University Hannover, Hannover, Germany, 2014. [Google Scholar]
- Ha, S.K.; Han, H.H.; Han, H.Y. Design and manufacture of a composite flywheel press-fit multi-rim rotor. J. Reinf. Plast. Comp. 2008, 27, 953–965. [Google Scholar] [CrossRef]
- Krack, M.; Secanell, M.; Mertiny, P. Cost optimization of hybrid composite flywheel rotors for energy storage. Struct. Multidiscip. Optim. 2010, 41, 779–795. [Google Scholar] [CrossRef]
- Harris, T.A.; Kotzalas, M.N. Advanced Concepts of Bearing Technology, 5th ed.; CRC Press: Boca Raton, FL, USA, 2006. [Google Scholar]
- Flom, D.G.; Bueche, A.M. Theory of rolling friction for spheres. J. Appl. Phys. 1959, 30, 1725–1730. [Google Scholar] [CrossRef]
- Shen, C. Rarefied Gas Dynamics; Spring: Berlin, Germany, 2005. [Google Scholar]
- Broecker, V.E. Theorie und Experiment zum Reibungswiderstand der glatten rotierenden Scheibe bei tubolenter Strömung. Z. Angew. Math. Mech. 1959, 39, 68–76. [Google Scholar] [CrossRef]
- Tong, W. Mechanical Design of Electric Motors; CRC Press: Boca Raton, FL, USA, 2014. [Google Scholar]
- Least-Squares Fitting. Available online: http://www.mathworks.com/help/curvefit/least-squares-fitting.html (accessed on 6 November 2020).
- Traxler, A. Losses in Magnetic Bearings. In Magnetic Bearings; Maslen, E.H., Schweitzer, G., Eds.; Spring: Berlin, Germany, 2009; pp. 135–150. [Google Scholar]
- Amiryar, M.E.; Pullen, K.R. A review of flywheel energy storage system technologies and their applications. Appl. Sci. 2017, 7, 286. [Google Scholar] [CrossRef] [Green Version]


| Component 1 | Inner Radius | Density |
|---|---|---|
| Outer CFRP rim | 0.170 m | 1569 kg/m3 |
| Inner AFRP rim | 0.110 m | 1380 kg/m3 |
| Aluminum hub rim | 0.100 m | 2700 kg/m3 |
| Test Case | Motor Position | Vacuum Level (Pa (torr)) | Vacuum Level and Flow Regime |
|---|---|---|---|
| 1 | Uncoupled | 27 (0.2) | Medium vacuum, Knudsen |
| 2 | 67 (0.5) | Medium vacuum, Knudsen | |
| 3 | 133 (1) | Rough vacuum, continuum | |
| 4 | 1333 (10) | Rough vacuum, continuum | |
| 5 | Coupled | 27 (0.2) | Medium vacuum, Knudsen |
| 6 | 67 (0.5) | Medium vacuum, Knudsen | |
| 7 | 133 (1) | Rough vacuum, continuum |
| Test Case | Vacuum Level (Pa (torr)) | Half-Life Time (min) | Total Discharge Time (min) |
|---|---|---|---|
| 1 | 27 (0.2) | 37 | 276 |
| 2 | 67 (0.5) | 49 | 450 |
| 3 | 133 (1) | 55 | 357 |
| 4 | 1333 (10) | 20 | 250 |
| Parameter | Baseline Case (133 Pa) | High-Pressure (1330 P) |
|---|---|---|
| α1 ≡ TMB | 0.0074 Ws | 0.0078 Ws |
| α2 ≡ CAD | 5.536 × 10⁻⁸ Ws3 | 2.238 × 10⁻⁷ Ws3 |
| SSE | 1.006 | 1.809 |
| Adj-R2 | 0.9995 | 0.9997 |
| RMSE | 0.0529 | 0.0852 |
| Parameter | Baseline Case (133 Pa) |
|---|---|
| α1 | 0.0864 Ws |
| α2 | 2.004 × 10⁻⁷ Ws3 |
| SSE | 4.058 |
| Adj-R2 | 0.9999 |
| RMSE | 0.2443 |
Publisher’s Note: MDPI stays neutral with regard to jurisdictional claims in published maps and institutional affiliations. |
© 2021 by the authors. Licensee MDPI, Basel, Switzerland. This article is an open access article distributed under the terms and conditions of the Creative Commons Attribution (CC BY) license (http://creativecommons.org/licenses/by/4.0/).
Share and Cite
Skinner, M.; Mertiny, P. Experimental Characterization of Low-Speed Passive Discharge Losses of a Flywheel Energy Storage System. Appl. Mech. 2021, 2, 1-15. https://doi.org/10.3390/applmech2010001
Skinner M, Mertiny P. Experimental Characterization of Low-Speed Passive Discharge Losses of a Flywheel Energy Storage System. Applied Mechanics. 2021; 2(1):1-15. https://doi.org/10.3390/applmech2010001
Chicago/Turabian StyleSkinner, Miles, and Pierre Mertiny. 2021. "Experimental Characterization of Low-Speed Passive Discharge Losses of a Flywheel Energy Storage System" Applied Mechanics 2, no. 1: 1-15. https://doi.org/10.3390/applmech2010001
APA StyleSkinner, M., & Mertiny, P. (2021). Experimental Characterization of Low-Speed Passive Discharge Losses of a Flywheel Energy Storage System. Applied Mechanics, 2(1), 1-15. https://doi.org/10.3390/applmech2010001