Abstract
Fatigue lifetime of offshore pipelines with semi-elliptical circumferential surface cracks is often underestimated. An accurate prediction of the pipeline structural integrity is nevertheless important in order to prevent unnecessary and expensive downtime, failures leading to leakage or spillage of pipeline contents to the surrounding environment, and ultimately improve the reliability of the pipeline. The estimation of crack growth in pipelines under varying loads is highly dependent on the calculation of crack driving parameters, such as the stress intensity factor and the crack tip opening displacement (CTOD) using the 3D J-integral or its equivalent. This paper presents a numerical study to predict the fatigue lifetime of cracks in pipes, determining the J-integral that includes first and second derivatives of the displacement field for pipes containing a range of circumferential surface cracks. A pipe segment is structurally loaded and stress intensity factors (SIF) evaluated using the finite element method (FEM). Based on the results, a number-of-cycles to failure curve shows a longer lifetime than previously predicted by about 5% for a pipe with semi-elliptical external surface cracks. In addition, they indicate that the external short cracks are more dangerous than the internal long surface crack hereby requiring earlier assessment.
1. Introduction
Although some pipelines exhibit certain levels of defect tolerance, it is fundamental to accurately detect, examine and monitor the growth of these defects at an early stage to aid the prediction of the residual operating life of the structure and subsequently minimise the risk of unexpected failures through risk-based management that determine proper inspection intervals and maintenance procedures [1]. The defect detection and examination stage of a pipeline’s lifecycle typically involves obtaining defect information through acceptable inspection, monitoring, testing and analysis techniques. These techniques include hydrostatic testing [2], non-destructive evaluation (NDE) and in-line inspection (ILI) [1].
Fatigue assessment where stable micro-crack growth occurs can be obtained based on the stress-life (S-N) curves-based approaches or the fracture mechanics approach. The S-N curve data are obtained from experiments and are typically used to assess non-planar flaws, e.g., corrosion, while the fracture mechanics approach can be applied to describe the fatigue behaviour of planar flaws such as cracks, and lack of fusion or penetration using an engineering critical assessment (ECA) [3]. This procedure can be used to assess the criticality of flaws found in service pipelines and to make informed decisions whether the flaws are to be accepted or rejected, and if repair or replacement of the pipeline component is necessary. The application of ECA acceptance criteria in the assessment of pipeline girth welds can significantly reduce the costs for pipeline integrity management by minimizing unnecessary repairs.
Previous researchers have also revealed that the factors significantly influencing the initiation and/or propagation of crack-like defects in pipes and pipeline welds include installation and operating conditions (i.e., high pressure and high temperature) [4,5], material properties of the pipe and pipeline weld, weld geometry, and crack size, location and orientation [6,7]. Advancements in pipeline materials and fracture mechanisms are, therefore, of great importance leading to an increased trend in the application of computer software to solve crack problems for defect assessment and growth in pipelines to predict residual lifetime [8,9,10,11,12,13], with the possibility of reducing the need for repairs and delays imposed. Today, the basic criteria for fracture mechanics have been formulated and with the help of analytical and numerical models, solutions to various problems can be obtained.
The stress intensity factor (SIF) is used in crack growth prediction to assess whether a specific crack causes a structural component to fracture [6,8,11,14,15,16,17,18]. Most of the numerical studies on surface cracked offshore metallic pipes readily available in open literature focus on the growth of shallower surface cracks (a/c < 1.0) due to cracks detected at inspection having small aspect ratios [19]. For example, in [8] the SIFs of surface cracks up to aspect ratios of a/c < 1.0 were presented based on contour integral evaluation on each mesh element node along the crack front. However, cracks with high aspect ratio (a/c > 1.0) may exist in offshore metallic pipes owing to corrosion or a coalescence of multiple cracks. One of the objectives of this paper is to, therefore, study the circumferential crack growth of surface cracks in an offshore metallic pipe up to an aspect ratio of a/c = 1.6. Furthermore, most of the previous work, for example, [6,9,10,11,12,13,14,15,16,17,18,19], address either the effects of longitudinal cracks or external circumferential cracks under different loading (e.g., internal pressure, bending, and/or torsion) on SIF estimations. Analytical solutions to calculate the SIFs for circumferential surface cracks in pipes subjected to tension and bending loads were developed by [20] for a/c ratios up to 1.0 and later adopted in flaw assessment guides e.g., [3]. In addition to a crack aspect ratio limit of 1.0, the study by [20] only considered a range of external surface cracks to estimate geometry correction factors presented in tabular form. This can prove infeasible especially when the need for a continuous evaluation of SIFs during crack propagation arises. To address this, the current work in this paper through FEM proposes a modified version of Raju–Newman method by introducing a weighted function to estimate the geometry correction factor for internal and external surface cracks in metallic pipes subjected to tension.
Difficulties arise in the direct evaluation of the SIF from the local state at a crack tip due to the high stress singularity in that region or substantial plasticity. To account for this, more indirect energy-based methods are employed instead. A fracture parameter used to calculate crack driving force is the crack tip opening displacement (CTOD) [13,21]. This is a measure of the distance between crack faces before unstable crack propagation occurs and it is the preferred method of determining crack driving forces experimentally. Nonetheless, there are several ways to define CTOD [22], which may lead to different values for the same specimen with respect to the adopted definition in fitness for service assessments. Therefore, unlike the J-integral approach, which is theoretically sound and robust, a CTOD definition needs to be established. Another example of such methods is the J-integral. The J-integral, a path independent integral [23], due to its robustness and simplicity is used to evaluate stress intensity factors (SIFs) and characterise stable crack growth [24]. Originally developed for 2D cases, the J-integral is computed along a line integral path which encloses a crack tip. A distinct advantage of using the J-integral to define crack tip severity in computational fracture mechanics is its ability to be accurately estimated far away from the crack tip region of high stress and strain gradients. The J-integral is also known to represent the energy release rate per unit crack extension in elastic-plastic materials. The J-integral and SIF are the most widely used in investigating the fracture response of structures. However, most structural components are of complex geometries and under realistic loading, therefore, a general analytical solution does not exist.
Engineering critical assessment of a 3D crack loading provide a means of associating the severity of cracks or crack-like defects with the operating conditions of the pipeline by assuming that fracture occurs when the fracture mechanics parameter reaches a critical value. For simplicity, we assume half of the pipe thickness as the final crack depth in this paper. According to a research on fatigue crack shape evolution by [25], cracks generally exhibit irregular crack fronts on initiation. However, these cracks develop rapidly into approximate semi-elliptical shapes in response to cyclic loading due to fatigue. Therefore, this study assumes cracks of semi-elliptical shape. A method for the evaluation of 3D J-integral, by applying the second derivative of displacement field to calculate a surface integral term which constitutes the total 3D J-integral is investigated in [26]. In comparison to the method applied in [8], this method uses an arbitrary 2D domain surrounding and perpendicular to the 3D crack front to evaluate the J-integral at any point on the crack front. Another objective of this paper is to apply the method presented in [26] to develop accurate 3D SIF solutions for a range of circumferential semi-elliptical cracks in pipes using COMSOL Multiphysics software [27]. To our knowledge, the capability of the software to evaluate 3D J-integral and SIFs to include the effect of an additional surface integral term has not been clearly established. This paper therefore demonstrates the application of the software to evaluate the 3D J-integral and SIFs for circumferential semi-elliptical cracks based on the output results of stress, strain and displacement. The SIF solutions are subsequently used for the fatigue crack growth assessments of pipes in fitness-for-service assessment based on the BS 7910 standard. To validate the COMSOL Multiphysics model in the estimation of J-integral and SIF values, a study was performed on a cylindrical model containing an internal and external through-wall circular crack. Results from the analyses were compared with results obtained from previous works [26,28] and showed good agreement. Furthermore, due to the lack of study on circumferential internal surface crack in metallic pipe under tension which is also suggested in [19], analyses on a typical offshore pipeline containing internal and external surface cracks, respectively, are presented herein.
2. 3-D J-Integral and Stress Intensity Factor Model
By assuming a planar crack surface, at any point of a 3D crack front, the J-integral can be defined locally varying along the crack front. The local value of the J-integral at any point of the crack front is given by Equation (1) [29], which is the sum of a line integral along a path and a surface integral in the domain:
where s is a point along the crack front, W is the elastic strain energy density, is the unit normal vector to the integration path in the outward direction, is Cauchy stress tensor, is the displacement vector u of node i, is the derivative of against the Kth element, s is the isoparametric coordinate, is the Kronecker delta, is the stress tensor, is the line integration path surrounding the crack tip, and A is the domain bounded by for surface integration. Equation (1) formulates the 3D J-integral as the sum of a line and surface integral term, respectively. Displacements and stresses are obtained by direct results in finite element software therefore, the line integral term of the equation is easily evaluated. However, the surface integral term requires the second derivatives of the displacement field which is not readily available in the software implemented in this paper. The surface integral term of the equation can be insignificant if the J-integral is constant with respect to the crack front coordinate. However, strong stress and strain gradients, for example, at the specimen surface, can largely increase the magnitude of the surface integral [26].
Chiarelli [29] proposed a formula for calculating the line and surface integral terms, and respectively, with respect to a local reference system (x, y, z) (see Figure 1) as:
where:
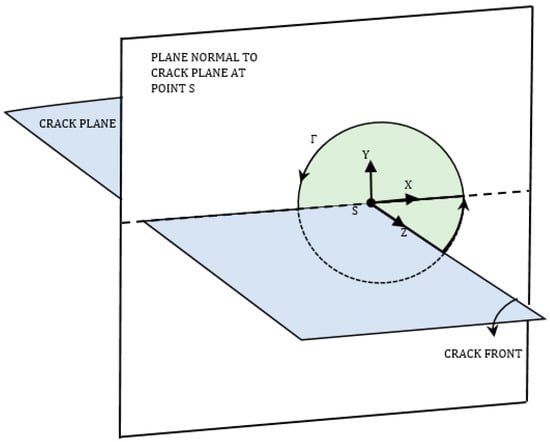
Figure 1.
Contour path Γ and enclosed domain for J-integral evaluation.
Equations (2) and (3) show that the line integral term of the J-integral depends on stresses and displacements while the surface integral term in the domain bounded by the line integral path depends on the derivatives of stresses and displacements. The first term of Equation (2) is the equation for calculating the total strain energy for a generalized stress state. This factor is a variable readily available in [27].
By assuming plain strain conditions and a linear elastic material, the J-integral can be related to the stress intensity factor using the follow expression:
where J is the J-integral value at the deepest point or surface of the crack and E and are the material’s Young’s modulus and Poisson’s ratio, respectively.
3. Stress Intensity Factors of Surface Cracks in Cylindrical Pipes
The J-integral values are calculated from integral paths, otherwise known as contours, set around the crack tip. A sensitivity analysis was carried out on the contours to determine the optimum contour that demonstrates a stable result for the J-integral and corresponding stress intensity factor. The following cases present the application and validation of the J-integral method used in this study. These example problems were selected to aid comparisons with previous study.
3.1. Cylindrical Pipe with Internal and External Circumferential Through-Wall Crack
These problems represent pipes with circumferential through-wall crack on the internal and external surfaces respectively as shown in Figure 2. The inner and outer radii for both cases are and , respectively. The pipe’s thickness is assumed as with a circumferential surface-through crack depth of . Both pipes are subjected to an axial stress of 10 MPa.
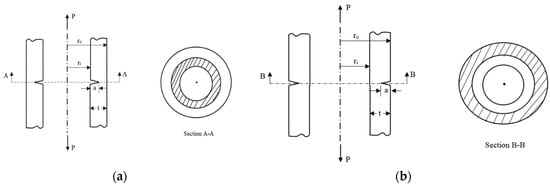
Figure 2.
Schematic representation of (a) internal and (b) external circumferential through-wall cracks.
Using symmetry, the geometry is simplified by modelling on 1/4th of the pipe in the circumferential direction and half of the geometry in the longitudinal direction with the crack located at its centre. A symmetry condition was applied from the crack tip to the inner or outer boundary of the pipe depending on the crack location to demonstrate a crack-like effect when a load is applied. The total length of the pipe was chosen to be 10 times the wall thickness to avoid any significant end-effects. Symmetric boundary conditions were applied such that the crack is set free and an internal or external crack is defined depending on what boundary is selected (as shown in Figure 3).
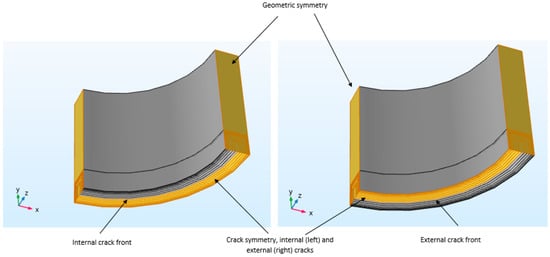
Figure 3.
Boundary conditions applied for internal and external cracks.
The Young’s modulus and Poisson’s ratio for the pipe material are chosen to be and , respectively. A 3D finite element mesh consisting of a total of 18,990 elements (16,650 prisms and 2340 hexahedra) was applied. A high level of mesh refinement is required around the crack region to enable accurate results from the deformed geometry (Figure 4). Based on the size of the first contour which is also used as a mesh partition, the minimum element size in this region was set to 0.25 mm.
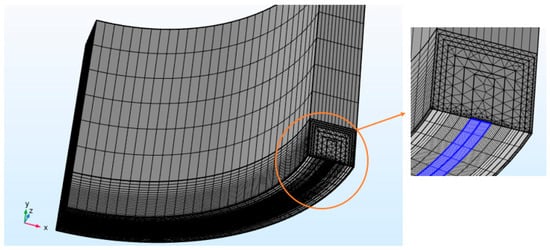
Figure 4.
Finite element mesh for 1/8 cracked pipe showing mesh refinement in the crack region.
To demonstrate the path independency of the J-integral, the SIF values have been evaluated for seven different rectangular contour paths as shown in Figure 5. The dimensions for the paths used for the sensitivity analysis of the SIF are specified in Table 1 where the last contour path (contour 7) coincides with the thickness of the pipe.
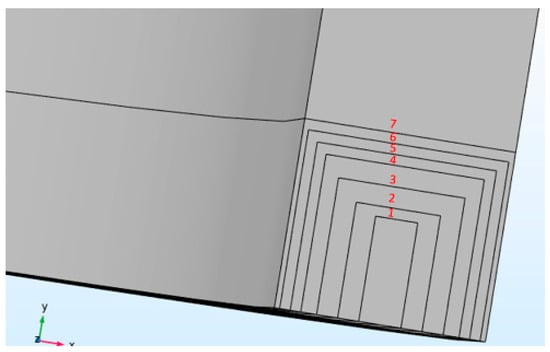
Figure 5.
Line and surface integration paths for J-integral independence study.

Table 1.
Computational SIF values obtained for seven integration paths on the internal crack.
It is clear from these results that the J-integral is independent of the integration path with small discrepancies in the values due to the approximate nature of finite element solutions. From the SIF values obtained in Table 1, it is safe to make a conservative assumption by taking the mean value of the SIF as 60.443 N/mm3/2. Similarly, the same approach was applied on the external crack, Table 2, with the mean SIF values estimated as 67.622 N/mm3/2.

Table 2.
Computational SIF values obtained for seven integration paths on the external crack.
The average ratios of for the internal and external cracks case study are 0.016 and 0.02, respectively. The stress state in the pipe wall is nearly close to a flat plate with plane strain condition. Therefore, reducing the internal radius of the pipe would increase the effect of the surface integral term, , on the total J-integral value as shown in Table 3 with a constant contour path size of . The surface integral term, if neglected, can lead to significant errors in the corresponding SIF value.

Table 3.
Computed J-integral values using the current method and showing the effect of the surface integral term.
The stress intensity factors obtained from the numerical analyses were compared with analytical results from [28] and numerical results from [26] which are shown in Table 4. Analytical equations for circumferential surface cracks yielded values of 61.075 N/mm3/2 and 67.971 N/mm3/2 for internal and external cracks, respectively. Average numerical results obtained for the stress intensity factors were 60.443 N/mm3/2 for the internal crack and 67.622 N/mm3/2 for the external crack, leading to errors of 1.1% and 0.5%, respectively. These results show good agreement and increase the confidence level for the application of the present methodology.

Table 4.
Comparison of SIF values using present method with [26,28].
A sensitivity analysis on the pipe with the internal crack was executed to examine the sufficiency and justify the chosen pipe length of 10 times the wall thickness in avoidance of significant end-effects on the SIFs. The result of this is presented in Figure 6 and shows that the SIF converges at a pipe length of 50 mm, which corresponds to 10 times the wall thickness considering symmetry.
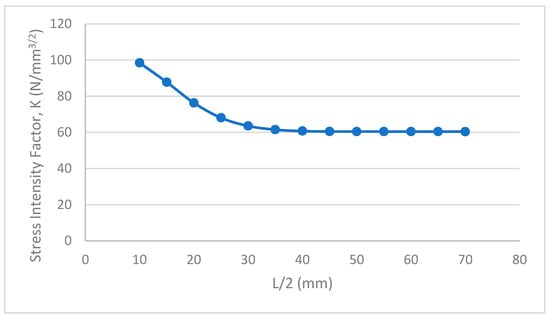
Figure 6.
Convergence study to evaluate the optimum pipe length for the avoidance of load end-effects.
3.2. Plain Pipe with External Semi-Elliptical Surface Crack
Further analysis was carried out on a pipe geometry that is a typical representation of the pipe used in offshore pipeline [8]. The pipe geometry considered is described by its internal radius, and wall thickness, while the crack is defined by its depth, a and width, c. The length of the pipeline segment is assumed as 10 times the thickness, and the crack is located on the outer surface at the mid-section as shown in Figure 7.
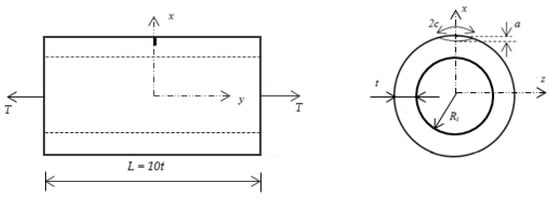
Figure 7.
Geometry of a plain pipe with a circumferential surface crack indicating the geometry of the pipe and circumferential surface crack.
Figure 8 shows the circumferentially cracked pipe and crack dimensions subjected to a tensile load, with material properties Young’s modulus, and Poisson’s ratio, . The pipe material is made from API 5L Grade X65 steel, a material widely used for offshore oil and gas pipelines [30] with a yield strength, ultimate tensile strength and fracture toughness (KIc) of 450 MPa, 535 MPa and 280 MPa , respectively. The model is further simplified to effectively save computational time and memory. By applying symmetry, a quarter-pipe geometry is modelled through the sectioning of the pipe along its circumferential and longitudinal axes. The loading and boundary conditions were executed by applying symmetry on the boundary of the pipe containing the crack i.e., y = L/2, and the two cross-sectional faces normal to the z-axis. The length of the pipe in the present analysis is chosen as L = 5 × t, which is sufficient to capture the response discontinuity caused by the crack. A tensile load, T is applied at the free end of the pipe and a prescribed displacement constraint, is applied on a point at the bottom surface of the pipe to suppress rigid body motion.
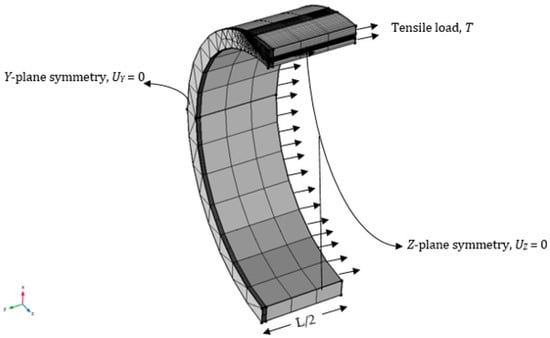
Figure 8.
Applied boundary conditions and external tensile load.
The J-integral is evaluated using the derivatives of the displacement field obtained from an arbitrary 2D domain bordering and perpendicular to the crack front as shown in Figure 9. The analysis by [8] used ABAQUS software [31], applying the domain integral method based on the formulation described by [32] to evaluate the J-integral, and defining the integration domain with rings of elements surrounding the nodes along the crack front from one crack face to the opposite crack face. This means that the J-integral can only be derived at the element nodes along the crack front. However, the method used in this work makes it possible to derive the J-integral on any point along the crack front. Eighteen different models with different crack sizes were studied to compare the current work with results presented in [8]. Three different crack aspect ratios, a/c equals 1, 0.5 and 0.25, and six different crack depth-to-thickness ratios (a/t) of 0.05, 0.1, 0.2, 0.3, 0.4 and 0.5 were evaluated. The model mesh is optimized to ensure efficiency in the computational analysis and correctly estimate the high stress/strain gradients in the critical parts of the model. Discretized with quadratic shape functions to give a better representation of the curved crack geometry, the completed mesh for the largest crack size consists of 17,862 elements including 9022 prisms and 8840 hexahedra. The application of a coarse mesh in the regions of less interest reduces the computational requirements of the model without significantly influencing the accuracy of the results as demonstrated in Figure 10 and Figure 11. However, high level of mesh refinement (Figure 12) is applied in the crack region of the pipe to obtain accurate J-integral and corresponding stress intensity factor values from the deformed crack shape.
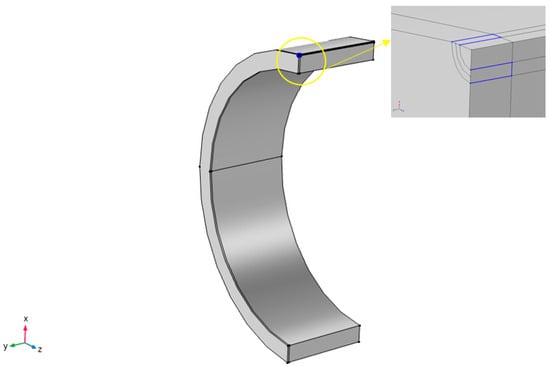
Figure 9.
Model of pipe indicating the integration contours for J-integral evaluation.

Figure 10.
Mesh refinement moving from an extremely coarse mesh with 5291 elements (left), normal mesh with 6030 elements (middle), to an extremely fine mesh with 15,158 elements (right).
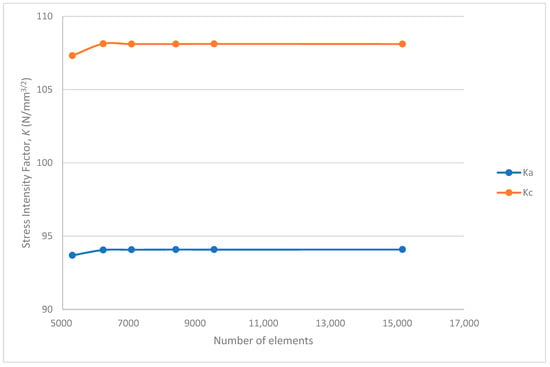
Figure 11.
Mesh convergence study showing that the mesh element size in the region of less interest, such as the thickness direction of the pipe, does not significantly affect the SIF results.
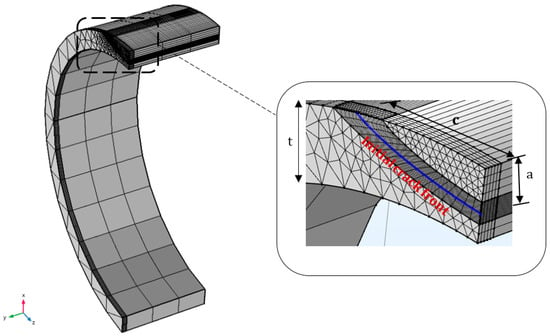
Figure 12.
Pipe mesh with a detailed view of the mesh refinement in the crack region.
For line integration, the J-integral contour path is needed to cross the nodal points of the mesh elements. However, the elements that are not completely in the domain for surface integration must be adjusted such that the outer boundary coincides with the integration contour path and this leads to the creation of new elements. This means that different meshes need to be created for the computation of line and surface integrals. The method developed by [26] defines the contour path as a rectangle. By mapping a computational grid to the area of the rectangle, surface integration is carried out at the central points of the mesh’s rectangles and line integration is evaluated at the midpoints of the edges of the rectangular grid. This simplification makes it easy to generate a smooth mesh in the contour boundary and creates vertical and horizontal line integration paths.
Each nodal degree of freedom in the mesh represents displacement components and their first space derivatives result in stress and strain fields. These are primary unknowns in the stress analysis of components using finite element method and they are directly obtained from post-processing results. This means that the line integral quantity of the total J-integral equation can be easily computed from structural analysis. It should be noted that the boundaries along the crack are not included in the definition of the integration contour because they do not contribute to the J-integral value. This is because the displacements along the crack faces of an ideal crack, dy equals zero, and all traction components ti equal zero since the crack faces are not loaded.
Using the parametric sweep function, it was straightforward to solve for all the combination of crack depth-to-thickness and crack aspect ratios. This combination solves for the J-integral values in all the cases.
The corresponding stress intensity factors at the deepest point and surface of the crack were compared to previous work by [8,33]. For crack aspect ratio, a/c = 1, a maximum percentage error of 3.2% at the deepest point, and 3.9% at the surface point was observed when compared to the work of Bergman. In contrast, maximum discrepancies of 3.1% and 4.8% were observed at the deepest and surface points, respectively, when compared to the work of Hoh et al. For a/c = 0.5, differences of up to 2.4% and 12.3% were observed for deepest and surface points respectively when compared to Bergman’s work. However, when compared to the work of Hoh et al., discrepancies of up to 1.6% and 13% were observed in the deepest and surface points, respectively. Finally, for a/c = 0.25, errors up to 3.1% and 7% were observed in the deepest and surface points, respectively, when compared to Bergman’s work. In contrast, maximum discrepancies of 4.2% and 7.3% were observed in the deepest and surface points, respectively, when compared to the work of Hoh et al. It is clear from the analyses that the effects of stress and strain gradients become more significant in the surface integral calculation when the crack becomes steep and narrow, therefore, leading to a divergence in the stress intensity factor values at the surface point of the crack. The trend in the changes of stress intensity factor at the deepest point and surface point of the crack with respect to changing sizes is shown in Figure 13, Figure 14 and Figure 15.
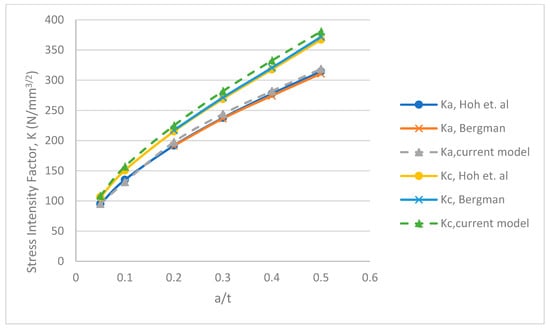
Figure 13.
Comparison of SIFs at the deepest point (Ka) and surface point (Kc) for semi-elliptical surface cracks in plain pipe under tension for a/c = 1.
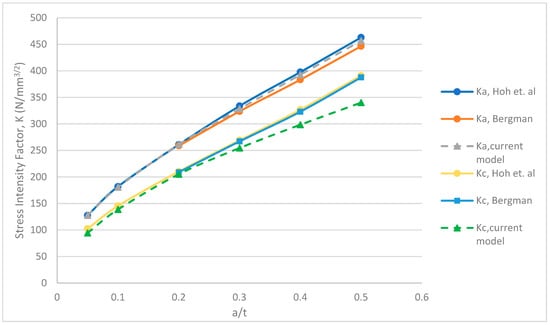
Figure 14.
Comparison of SIFs at the deepest point (Ka) and surface point (Kc) for semi-elliptical surface cracks in plain pipe under tension for a/c = 0.5.
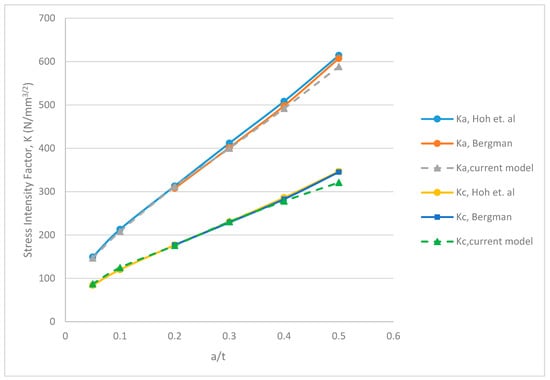
Figure 15.
Comparison of SIFs at the deepest point (Ka) and surface point (Kc) for semi-elliptical surface cracks in plain pipe under tension for a/c = 0.25.
4. Fatigue Crack Propagation Analysis for Semi-Elliptical Surface Cracks in Plain Pipe
Fatigue cracks in offshore structures are undesirable and if not properly monitored can grow leading to failure of the structure due to cyclic loading. The prediction of fatigue crack growth and the evolution of the crack shape is, therefore, of great importance in the offshore industry. However, investigating the fatigue lives of offshore structural components experimentally is costly and requires time. Therefore, it is can be particularly useful to estimate the remaining lives of structures by applying principles such as fracture mechanics.
This section presents the fatigue assessment of an offshore pipe containing semi-elliptical cracks which are dependent on the stress intensity factor (SIF). The SIF values used are the maximum local values evaluated on the extreme points of the crack front i.e., the maximum crack depth and crack length along the pipe surface. A study of the change in crack aspect ratio is also presented. It is assumed that the pipe is subjected to constant amplitude loading where the stress ratio, R, which is the ratio of applied minimum stress to applied maximum stress in the fatigue cycle is zero:
The most widely used model for predicting stable fatigue growth is the Paris model developed by Paris and Erdogan [34]. It states that the rate of crack growth is proportional to the SIF range through the power law as shown in Equation (6):
Considering the effect of stress ratio, Equation (6) can be rewritten as:
where da is the change in crack depth, dc is the change in crack surface length, dN is the change in the number of cycles, C and m are material properties given as and , respectively [3], and is the change in stress intensity factor defined by Equation (8):
Substituting for in Equation (6) and integrating yields:
By integrating using the upper and lower limits of a, Equation (9) becomes:
where is the number of load cycles required to grow a crack from an initial crack depth, (ai) to a larger crack size ai > ai+1. Unstable crack growth and fracture eventually occurs when the crack depth reaches a critical value (ac) and Kmax = KIc; Y is the dimensionless shape factor related to the crack size; is the cyclic stress range. The integral in Equation (9) is solved numerically because Y is also dependent on the crack size. It should be noted that a maximum crack depth of was chosen in this paper to enable direct comparison of stable crack growth with other researchers.
Previous researchers, such as [35,36], employ a more rigorous approach to account for the crack shape evolution during fatigue crack growth. This scheme propagates the crack on all the nodes along the crack front by evaluating the local stress intensity factor at each node. A new crack shape and size is then determined after each fatigue load cycle. Although this procedure is likely to provide more practical results, it is generally not employed due to high computational costs. A much simpler scheme which accounts for the local stress intensity factors at only the deepest and surface points of the crack is used in the current work for the fatigue crack growth evaluation. A new crack shape is developed after each loading cycle. However, because the SIFs are only evaluated at these points, the subsequently developed cracks will maintain a semi-elliptical shape. The crack is schematically presented in Figure 16.
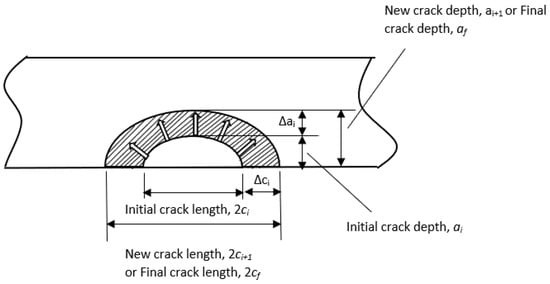
Figure 16.
Schematic representation of crack shape evolution.
The crack propagation is simulated using the following procedures:
- The stress intensity factors, K, for a surface crack are estimated using Equations (2)–(4) at the deepest point Ka and at the crack surface Kc. The validation of the current method uses the pipe geometry in Figure 9.
- By assuming a small linear increment in ai, Δai, and substituting for da in addition to substituting the values of Ka and Kc in Equation (6), the value of dc or Δci for the present cycle is evaluated. Note that the stress ratio, R, is assumed to be zero. Therefore, and .
- The crack geometry and shape are updated for the next propagation step by adding Δai and Δci to ai and 2ci, respectively.
The procedures above are repeated until the crack depth reaches a prescribed size, in this case the mid-thickness of the pipe. Figure 17 shows the procedure for predicting fatigue crack growth using the Paris law, until the ratio of the crack depth to thickness ratio (ai+1/t) reaches .
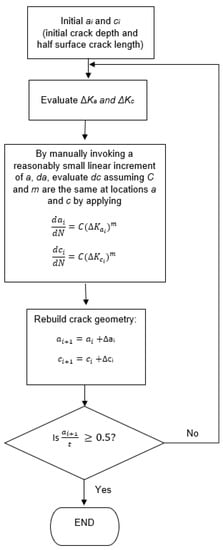
Figure 17.
Procedure for evaluating change crack aspect ratio and crack growth.
Using the model developer tool in COMSOL Multiphysics [27], a method was created in the form of written code to automate the looped process of evaluating the SIFs, updating the crack geometry and calculating the fatigue life.
Since the stress intensity factors at the crack deepest point, and surface, differ, the Paris law governing their values can be rewritten as shown in Equation (11):
Assuming and using the initial crack size, the relationship between the change in crack depth and crack half-length can be derived from Equation (11) to yield:
Equation (12) is employed in COMSOL Multiphysics by dividing the final crack extension ( into a large number of equal increments , to accurately capture the growth trend and assuming each increment is created at a constant crack growth rate. The post-processing stage was automated by developing a script that handles the global evaluations of J-integral, SIFs, and corresponding fatigue life in the previous incremental study and updates the geometry for the next study. For each increment of crack depth, a new crack half-length is evaluated and the crack geometry was updated until the crack depth reached half of the pipe thickness.
Figure 18 shows the predicted fatigue crack growth pattern for a set of surface cracks subjected to tension. The curves demonstrate the change in aspect ratio as the crack grows from an initial size to a final size, in this case the mid-thickness of the pipe. The initial geometries of the cracks are defined by and with the values of swept from 0.05 to 0.5, while the values are chosen as .
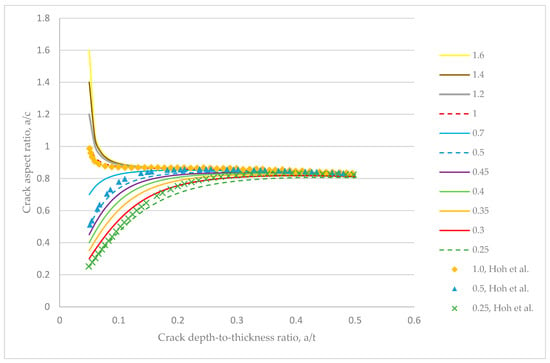
Figure 18.
Change in aspect ratio with relative crack depths for external surface cracks in a pipe under tension showing the final aspect ratio convergence. The legend indicates the initial crack aspect ratio values.
For all the initial crack shapes considered, the final a/c ratios were predicted to tend towards 0.8 when the crack depth became equal to half of the pipe thickness, showing good agreement with previous studies [8,37].
According to Annex M.7.3.4 of BS 7910 [3], it is recommended that the flat plate solution for stress intensity factors may be applied to external circumferential surface flaws in pipe. As such, the theoretical stress intensity factor for tension load may be determined using Equation (13) given by:
for and .
Where is the complete elliptic integral of the second kind given by:
A new set of equations for estimating the stress intensity factors for a semi-elliptical crack in a pipe are proposed considering that the crack aspect ratio converges to . This study only evaluates the maximum values of SIF at the extreme points of the crack front where the SIF at the crack depth, and the SIF at the surface length, , considering the symmetry boundary condition in Figure 8.
The thickness and internal radius in this study were kept constant at mm and 160.5 mm, respectively, therefore, the boundary correction factor, , was normalized using the equation below:
where:
and can be written in matrix form as:
Assuming the matrix operation above is represented as , where the elements of are coefficients (presented in Table 5) obtained from curve-fitting (see Appendix A). Therefore:
where:
while , and are given by:

Table 5.
Table of coefficients for normalized M-factor, external surface crack.
Note that these equations are valid for and at the deepest and surface point of the crack are radians and , respectively.
Figure 19, Figure 20, Figure 21 and Figure 22 show the stress intensity factor results obtained for initial values of a/t, and a/c, when compared with the literature [3,8] to gain confidence in the methodology applied in this study. The stress intensity factors obtained from 3-D finite element computation were compared with analytical results obtained from [3]. For the initial crack aspect ratio, , maximum absolute percentage errors of 2% and 4% in the stress intensity factor solutions at the deepest point and surface point of the crack were achieved, respectively. For the initial crack aspect ratio, , maximum absolute errors of 2% and 1% at the deepest and surface point of the crack were achieved, respectively. Additionally, for the initial crack aspect ratio, , maximum absolute errors of 2% and 2% at the deepest and surface point of the crack were achieved, respectively.
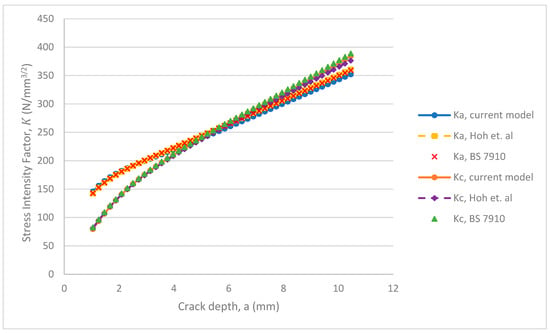
Figure 19.
SIFs at the deepest point (Ka) and surface point (Kc) for an external semi-elliptical crack in a pipe under cyclic tension (initial a/c = 0.25).
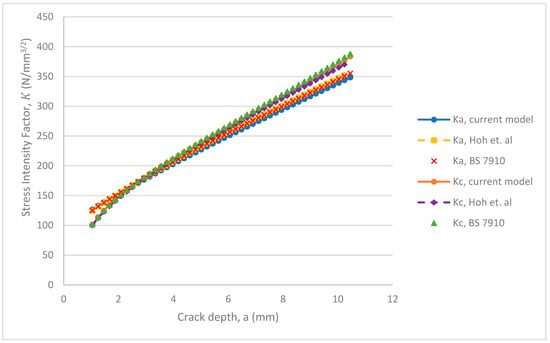
Figure 20.
SIFs at the deepest point (Ka) and surface point (Kc) for an external semi-elliptical crack in a pipe under cyclic tension (initial a/c = 0.5).
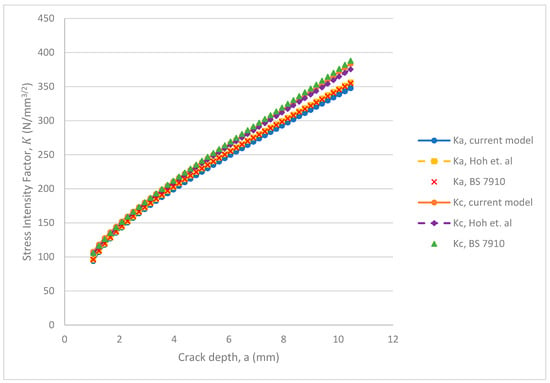
Figure 21.
SIFs at the deepest point (Ka) and surface point (Kc) for an external semi-elliptical crack in a pipe under cyclic tension (initial a/c = 1.0).
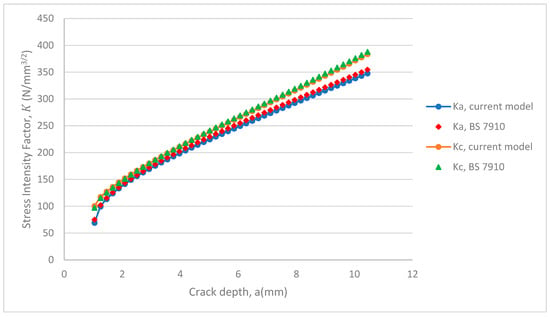
Figure 22.
SIFs at the deepest point (Ka) and surface point (Kc) for an external semi-elliptical crack in a pipe under cyclic tension (initial a/c = 1.6).
The stress intensity factors were also compared with numerical results from [8]. For a crack with an initial aspect ratio of , the maximum absolute errors at the deepest and surface points are 2% and 2%, respectively. For an initial crack aspect ratio of , the absolute errors at the deepest and surface points are 2% and 2%, respectively, while the absolute errors for an initial crack aspect ratio of are 2% and 3% at the deepest and surface points, respectively. These results compare well with published literature, therefore, demonstrating the applicability of the current methodology in the determination of stress intensity factor solutions for cracks in pipes.
The SIFs obtained are used to predict the fatigue lives of external surface breaking semi-elliptical cracks under tensile cyclic load and assuming a stress ratio of . The cracks are propagated from an initial crack depth of 1.045 mm ( to a final crack depth of 10.45 mm ( considering different aspect ratios.
The predicted fatigue life of an external surface crack in a plain pipe growing from an initial size of 1.045 mm () to a final size of 10.45 mm () is shown in Figure 23. It is clear that the predicted fatigue life increases with the initial crack aspect ratio. For example, the fatigue life increases from about 6.1 million cycles for a crack aspect ratio of to about 17.2 million cycles when . This behaviour demonstrates that “short” cracks tend to propagate faster than long cracks, subjected to the same nominal driving force. The fatigue life results were also compared with the work in [8]. In their work, when the initial crack aspect ratio is , the number of cycles results in about 5.8 million cycles. Likewise, when and , the number of cycles equal 7.5 million cycles and 16.3 million cycles, respectively. After a comparison of the number of cycles predicted using the current method and computational studies by [8], the errors came up to be 3%, 4%, and 5% for respectively. Thus, the current model estimates a longer fatigue life by up to 5%.
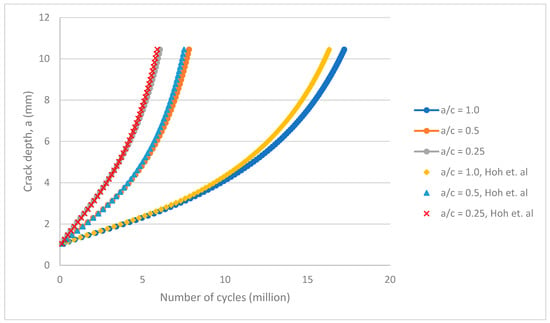
Figure 23.
Fatigue crack growth of an external surface crack in a plain pipe.
Similarly, the stress intensity factors, and crack growth of internal surface cracks (Figure 24) were studied.
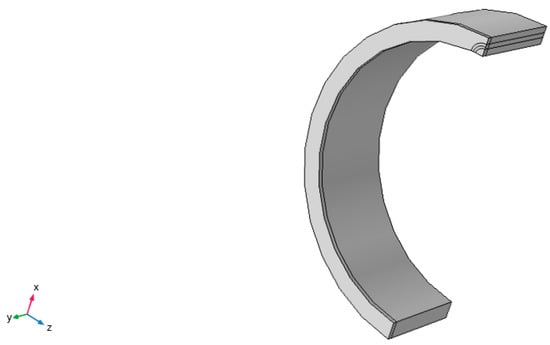
Figure 24.
Internal surface crack (a/c = 1) on a pipe and contours for J-integral evaluation.
The boundary correction factor, , was normalized using Equation (23):
where:
and can be written in matrix form as:
Similarly, the matrix operation above can be represented by , with the elements of obtained through curve-fitting and presented in Table 6. Therefore:
where:
while , and are given by:
.

Table 6.
Table of coefficients for normalized M-factor, internal surface crack.
The equations presented here are valid for a/c values of and at the deepest and surface points of the crack where is radians and 0, respectively.
The 3-D stress intensity factors were computationally evaluated and compared with results obtained from BS 7910. The stress intensity magnification factors provided in Annex M of [3] were linearly interpolated to enable comparison.
The stress intensity factors obtained from 3-D finite element computation were compared with the values obtained from [3] in Figure 25, Figure 26 and Figure 27. For the initial crack aspect ratio, , average absolute errors of 10% and 11% in the stress intensity factor solutions at the deepest point and surface point of the crack were achieved, respectively. For the initial crack aspect ratio of , average absolute errors of 5% and 2% in the stress intensity factor solutions at the deepest point and surface point of the crack were achieved, respectively. The reason for the large error is not quite certain but it may be due to the presence of significant curvature in the geometry for the inner surface crack as compared to the external crack or maybe a lack of consideration of crack growth. However, there is a similar trend in the stress intensity factors for internal and external surface cracks evaluated using the current method. This supports the conclusion made by Bergman [33] that the influence functions are of the same order for both internal and external surface cracks, indicating the absence of basic errors between the solutions and no significant difference.
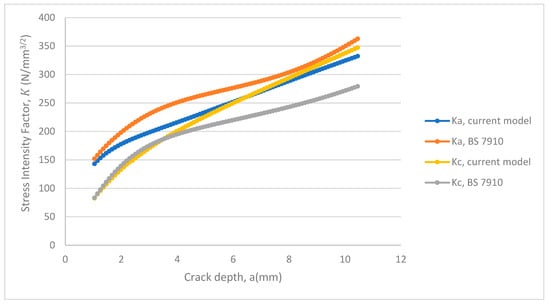
Figure 25.
SIFs at the deepest point (Ka) and surface point (Kc) for an internal semi-elliptical crack in a pipe under cyclic tension (initial a/c = 0.25).
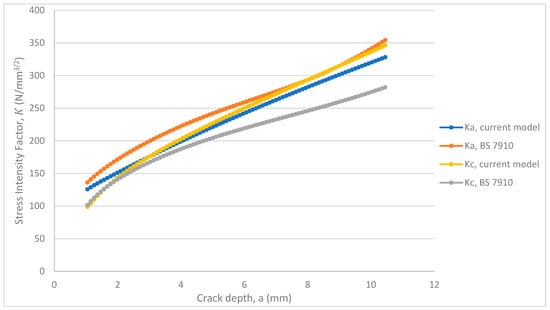
Figure 26.
SIFs at the deepest point (Ka) and surface point (Kc) for an internal semi-elliptical crack in a pipe under cyclic tension (initial a/c = 0.5).
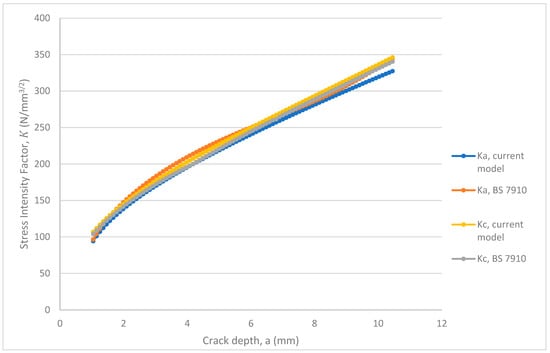
Figure 27.
SIFs at the deepest point (Ka) and surface point (Kc) for an internal semi-elliptical crack in a pipe under cyclic tension (initial a/c = 1.0).
The predicted fatigue crack growth of an internal surface crack growing from an initial depth of 1.045 mm to a final depth of 10.45 mm is shown in Figure 28.
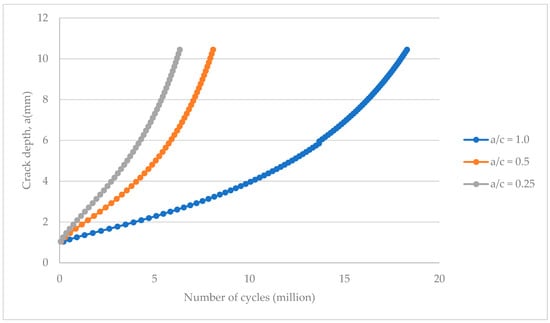
Figure 28.
Fatigue crack growth for an internal surface crack in a plain pipe.
For the initial aspect ratio, , the number of cycles required to propagate an internal crack with an initial depth of 1.045 mm to a final depth of 10.45 mm is about 6.3 million cycles, while for , the number of cycles required is about 18.3 million. The relative difference between the fatigue crack growth rate for initial internal cracks of and when compared to external cracks are about 4% and 6% more, respectively. This may indicate that the external cracks grow faster than the internal surface cracks hereby requiring earlier assessment. Additionally, the fatigue crack growth pattern for the internal cracks is presented in Figure 29.
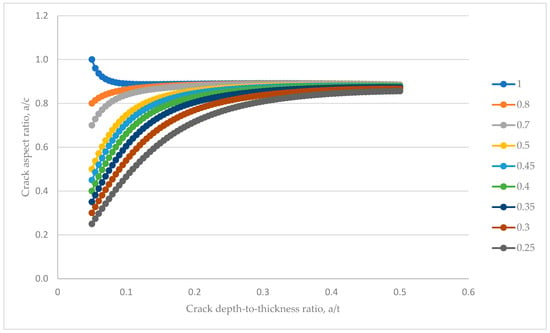
Figure 29.
Change in aspect ratio with relative crack depths for internal surface cracks in a pipe under tension showing the final aspect ratio convergence. The legend indicates the initial crack aspect ratio values.
The curves demonstrate the change in aspect ratio as the crack grows from an initial size to a final size, in this case the mid-thickness of the pipe. The initial geometries of the cracks are defined by and with the values of swept from 0.05 to 0.5 while the values chosen as . For all the initial crack shapes considered, the final a/c ratios were predicted to tend towards are maximum value of 0.88 when the crack depth became equal to half of the pipe thickness. A conservative assumption can therefore be made demonstrating that the internal and external cracks maintain similar aspect ratios or shape under the same fatigue loading and initial geometry.
5. Conclusions
A method for the evaluation of 3D J-integral and the corresponding stress intensity factors using the first and second derivatives of the displacement field is investigated on an external and internal surface cracked pipe under tension. On the path independency of the J-integral method, it is reflected here that the path independency of the integration contours is well preserved. The results presented consider small to large external and internal semi-elliptical surface cracks of depth-to-thickness ratios, a/t ranging from 0.05 to 0.5, and for crack aspect ratio values, a/c of 0.25–1.6. The results obtained compare well with analytical calculations, published literature and standards. Furthermore, a clear set of empirical equations were developed for three-dimensional stress intensity factors in pipes containing external and internal surface cracks. The applied method is computationally efficient and reliable, and it eliminates the need for regular mesh along the crack front. Compared to the domain integral method in ABAQUS software, which requires the generation of a ring of elements surrounding every node along the crack front to obtain path-independent J-integral values, the present method can be used to evaluate the J-integral and corresponding stress intensity factors on any point along the crack front by explicitly calculating the first and second derivatives of displacements on a 2D integral domain defined by a plane perpendicular to the crack front. The fatigue analysis provided demonstrate the effect of crack location (internal or external) and shape (short or long) on the fatigue life and failure of steel pipes. It also predicts an increase in the number of cycles to failure compared to similar previous studies by [8]. Based on the results on a pipe with external crack, a number-of-cycles to failure curve for a semi-elliptical crack with initial crack aspect ratio of (a/c = 0.25) gives a longer lifetime of 3% corresponding to 167,471 cycles and an initial crack aspect ratio of (a/c = 0.5) yields a longer lifetime by 4% corresponding to 308,160 cycles. A number-of-cycles to failure curve for a semi-circular crack of initial crack aspect ratio of (a/c = 1) shows a longer lifetime than previously predicted by about 5% which corresponds 887,444 cycles. These variations may be because of inconsistency in the selection of increment in crack extension. A modified analytical solution to estimate the stress intensity factors during crack propagation of circumferential internal and external cracks is also proposed.
Author Contributions
Conceptualization: A.O. and A.B.; methodology: A.O.; software: A.O. and A.B.; validation: A.O., A.B. and S.K.; formal analysis: A.O. and A.B; investigation: A.O.; resources: S.K.; data curation: A.O.; writing—original draft preparation: A.O.; writing—review and editing: A.B.; visualization: A.O.; supervision: A.B.; project administration: S.K.; funding acquisition: A.O. All authors have read and agreed to the published version of the manuscript.
Funding
This research received no external funding.
Conflicts of Interest
The authors declare no conflict of interest.
Appendix A
The SIF equations presented in this paper were obtained through curve-fitting of 495 parametric solutions, i.e., varied from 0.05 to 0.5 in steps of 0.01 for each value of . The coefficients included in Table 4 are shown in Figure A2.
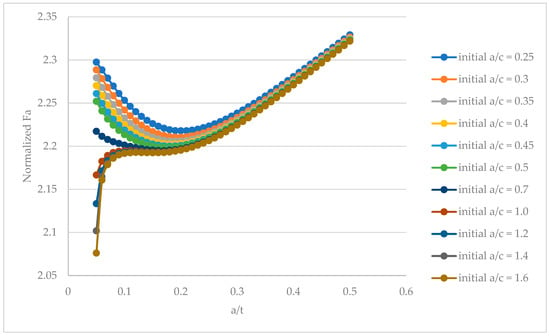
Figure A1.
Polynomial fitting curves of the normalized F functions of Equation (16) for different initial external circumferential crack aspect ratios. The goodness of fit indicates more than 99%.
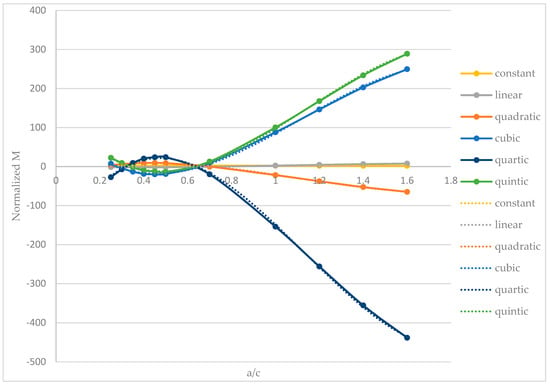
Figure A2.
Polynomial fitting curves of the normalized M functions of Equation (18) for different initial external circumferential crack aspect ratios. The dotted lines indicate the fitting curves and the goodness of fit indicate more than 99%.
References
- Xie, M.; Tian, Z. A review on pipeline integrity management utilizing in-line inspection data. Eng. Fail. Anal. 2018, 92, 222–239. [Google Scholar] [CrossRef]
- Kishawy, H.A.; Gabbar, H.A. Review of pipeline integrity management practices. Int. J. Press. Vessel. Pip. 2010, 87, 373–380. [Google Scholar] [CrossRef]
- The British Standards Institution. Guide to Methods for Assessing the Acceptability of Flaws in Metallic Structures, 3rd ed.; BS 7910; BSI Standards Limited: London, UK, 2013. [Google Scholar]
- Chong, T.-V.S.; Kumar, S.B.; Lai, M.O.; Loh, W.L. Fracture capacity of modern pipeline girth welds with 3D surface cracks under extreme operating conditions. Eng. Fract. Mech. 2015, 146, 139–160. [Google Scholar] [CrossRef]
- Netto, T.A.; Botto, A.; Lourenço, M.I. Fatigue performance of pre-strained pipes with girth weld defects: Full-scale experiments and analyses. Int. J. Fatigue 2008, 30, 767–778. [Google Scholar] [CrossRef]
- Benhamena, A.; Aminallah, L.; Bouiadjra, B.B.; Benguediab, M.; Amrouche, A.; Benseddiq, N. J integral solution for semi-elliptical surface crack in high density poly-ethylene pipe under bending. Mater. Des. 2011, 32, 2561–2569. [Google Scholar] [CrossRef]
- Holtam, C.M.; Baxter, D.P.; Ashcroft, I.A.; Thomson, R.C. Effect of crack depth on fatigue crack growth rates for a C-Mn pipeline steel in a sour environment. Int. J. Fatigue 2010, 32, 288–296. [Google Scholar] [CrossRef]
- Hoh, H.J.; Pang, J.H.L.; Tsang, K.S. Stress intensity factors for fatigue analysis of weld toe cracks in a girth-welded pipe. Int. J. Fatigue 2016, 87, 279–287. [Google Scholar] [CrossRef]
- Hutař, P.; Ševčík, M.; Náhlík, L.; Pinter, G.; Frank, A.; Mitev, I. A numerical methodology for lifetime estimation of HDPE pressure pipes. Eng. Fract. Mech. 2011, 78, 3049–3058. [Google Scholar] [CrossRef]
- Zhang, Y.M.; Fan, M.; Xiao, Z.M.; Zhang, W.G. Fatigue analysis on offshore pipelines with embedded cracks. Ocean Eng. 2016, 117, 45–56. [Google Scholar] [CrossRef]
- Pang, J.H.L.; Hoh, H.J.; Tsang, K.S.; Low, J.; Kong, S.C.; Yuan, W.G. Fatigue crack propagation analysis for multiple weld toe cracks in cut-out fatigue test specimens from a girth welded pipe. Int. J. Fatigue 2017, 94, 158–165. [Google Scholar] [CrossRef]
- Hertelé, S.; De Waele, W.; Denys, R.; Verstraete, M.; Van Wittenberghe, J. Parametric finite element model for large scale tension tests on flawed pipeline girth welds. Adv. Eng. Softw. 2012, 47, 24–34. [Google Scholar] [CrossRef]
- Yi, D.; Xiao, Z.M.; Idapalapati, S.; Kumar, S.B. Fracture analysis of girth welded pipelines with 3D embedded cracks subjected to biaxial loading conditions. Eng. Fract. Mech. 2012, 96, 570–587. [Google Scholar] [CrossRef]
- Arora, P.; Singh, P.K.; Bhasin, V.; Vaze, K.K.; Ghosh, A.K.; Pukazhendhi, D.M.; Gandhi, P.; Raghava, G. Predictions for fatigue crack growth life of cracked pipes and pipe welds using RMS SIF approach and experimental validation. Int. J. Press. Vessel. Pip. 2011, 88, 384–394. [Google Scholar] [CrossRef]
- Benhamena, A.; Bachir Bouiadjra, B.; Amrouche, A.; Mesmacque, G.; Benseddiq, N.; Benguediab, M. Three finite element analysis of semi-elliptical crack in high density poly-ethylene pipe subjected to internal pressure. Mater. Des. 2010, 31, 3038–3043. [Google Scholar] [CrossRef]
- Kou, K.P.; Burdekin, F.M. Stress intensity factors for a wide range of long-deep semi-elliptical surface cracks, partly through-wall cracks and fully through-wall cracks in tubular members. Eng. Fract. Mech. 2006, 73, 1693–1710. [Google Scholar] [CrossRef]
- Li, Z.; Jiang, X.; Hopman, H.; Zhu, L.; Liu, Z. An investigation on the circumferential surface crack growth in steel pipes subjected to fatigue bending. Theor. Appl. Fract. Mech. 2020, 105. [Google Scholar] [CrossRef]
- Baik, B.; Yamada, K.; Ishikawa, T. Fatigue crack propagation analysis for welded joint subjected to bending. Int. J. Fatigue 2011, 33, 746–758. [Google Scholar] [CrossRef]
- Li, Z.; Jiang, X.; Hopman, H. Surface crack growth in offshore metallic pipes under cyclic loads: A literature review. J. Mar. Sci. Eng. 2020, 8, 339. [Google Scholar] [CrossRef]
- Raju, I.S.; Newman, J.C. Stress-Intensity Factors for Circumferential Surface Cracks in Pipes and Rods Under Tension and Bending Loads. ASTM Spec. Tech. Publ. 1986, 789–805. [Google Scholar] [CrossRef]
- Paredes, M.; Ruggieri, C. Further results in J and CTOD estimation procedures for SE(T) fracture specimens—Part II: Weld centerline cracks. Eng. Fract. Mech. 2012, 89, 24–39. [Google Scholar] [CrossRef]
- Moore, P.; Pisarski, H. CTOD and Pipelines—The Past, Present and Future. In Proceedings of the 6th International Pipeline Technology Conference, Ostend, Belgium, 6–9 October 2013; TWI Ltd.: Cambridge, UK, 2013. [Google Scholar]
- Rice, J.R. A Path Independent Integral and the Approximate Analysis of Strain Concentration by Notches and Cracks. J. Appl. Mech. 1968, 35, 379–386. [Google Scholar] [CrossRef]
- Courtin, S.; Gardin, C.; Bézine, G.; Hamouda, H.B.H. Advantages of the J-integral approach for calculating stress intensity factors when using the commercial finite element software ABAQUS. Eng. Fract. Mech. 2005. [Google Scholar] [CrossRef]
- Lin, X.B.; Smith, R.A. Fatigue growth prediction of internal surface cracks in pressure vessels. J. Press. Vessel Technol. Trans. ASME 1998, 120, 17–23. [Google Scholar] [CrossRef]
- Hakimelahi, B.; Soltani, N. 3D J-integral evaluation using the computation of line and surface integrals. Fatigue Fract. Eng. Mater. Struct. 2010, 33, 661–672. [Google Scholar] [CrossRef]
- COMSOL Multiphysics® v. 5.5; COMSOL AB: Stockholm, Sweden; Available online: www.comsol.com (accessed on 10 September 2020).
- Tada, H.; Paris, P.; Irwin, G. The Stress Analysis of Cracks Handbook, 3rd ed.; ASME Press: New York, NY, USA, 2000; ISBN 9780511806865. [Google Scholar]
- Chiarelli, M.; Frediani, A. A computation of the three-dimensional J-integral for elastic materials with a view to applications in fracture mechanics. Eng. Fract. Mech. 1993, 44, 763–788. [Google Scholar] [CrossRef]
- Heidersbach, R. Metallurgy and Corrosion Control in Oil and Gas Production; Wiley Series in Corrosion; Wiley: New York, NY, USA, 2018; ISBN 9781119252375. [Google Scholar]
- ABAQUS. Version 6.14 User’s Manual; Dassault Systèmes Simulia Corp.: Providence, RI, USA, 2014. [Google Scholar]
- Shih, C.F.; Moran, B.; Nakamura, T. Energy release rate along a three-dimensional crack front in a thermally stressed body. Int. J. Fract. 1986, 30, 79–102. [Google Scholar] [CrossRef]
- Bergman, M. Stress Intensity Factors for Circumferential Surface Cracks in Pipes. Fatigue Fract. Eng. Mater. Struct. 1995, 18, 1155–1172. [Google Scholar] [CrossRef]
- Paris, P.; Erdogan, F. A Critical Analysis of Crack Propagation Laws. J. Basic Eng. 1963, 85, 528–533. [Google Scholar] [CrossRef]
- Tanaka, S.; Kawahara, T.; Okada, H. Study on crack propagation simulation of surface crack in welded joint structure. Mar. Struct. 2014, 39, 315–334. [Google Scholar] [CrossRef]
- Fulland, M.; Richard, H.A. Numerical determination of crack paths in three-dimensional structures with the program system ADAPCRACK3D. In Proceedings of the Conference of fatigue Crack Path FCP, Parma, Italy, 18–21 September 2003; Volume 49. [Google Scholar]
- Newman, J.C.; Raju, I.S. An empirical stress-intensity factor equation for the surface crack. Eng. Fract. Mech. 1981, 15, 185–192. [Google Scholar] [CrossRef]
Publisher’s Note: MDPI stays neutral with regard to jurisdictional claims in published maps and institutional affiliations. |
© 2020 by the authors. Licensee MDPI, Basel, Switzerland. This article is an open access article distributed under the terms and conditions of the Creative Commons Attribution (CC BY) license (http://creativecommons.org/licenses/by/4.0/).